catalytic activity of carbon-supported pt nanoelectrocatalysts. why reducing the size of pt...
TRANSCRIPT
Published: March 04, 2011
r 2011 American Chemical Society 5429 dx.doi.org/10.1021/jp1109477 | J. Phys. Chem. C 2011, 115, 5429–5434
ARTICLE
pubs.acs.org/JPCC
Catalytic Activity of Carbon-Supported Pt Nanoelectrocatalysts.Why Reducing the Size of Pt Nanoparticles is Not Always BeneficialI. N. Leontyev,*,†,‡ S. V. Belenov,§ V. E. Guterman,§ P. Haghi-Ashtiani,^ A. P. Shaganov,z and B. Dkhil†
†Laboratoire Structures, Propri�et�es et Mod�elisation des Solides, CNRS UMR 8580 �Ecole Centrale Paris, 92295 Chatenay-MalabryCedex, France‡Faculty of Physics, Southern Federal University, 5 Zorge Street, Rostov-on-Don 344090, Russia§Faculty of Chemistry, Southern Federal University, 7 Zorge st, Rostov-on-Don 344090, Russia^Laboratoire de M�ecanique des Sols, Structures et Mat�eriaux �Ecole Centrale Paris, 92295 Chatenay-Malabry Cedex, FrancezPolytechnical University, Radiophysical Science and Engineering Faculty, 29 Polytechnicheskaya st, St.Petersburg, 195251, Russia
Properties of the nanoparticles have been studied extensivelyboth in catalysis and electrocatalysis.1 In the latter case, these
studies have been carried out with two main objectives: (i)understanding of fundamental aspects of the surface electroche-mical activity and (ii) the development of new materials for prac-tical applications, for example, in fuel cells. Despite the high cost,Pt and its alloys are among the most promising candidates bothfor cathode and anode catalysts in the fuel cell applications.
The average Pt particle size in a catalyst falls typically in the rangeof 2-10 nm, and it is well-known that the activity of a Pt/C catalystfor the oxygen reduction reaction (ORR) depends greatly on theparticle size (so-called size effect). The particle size effect of Pt/C inthe ORR has been well documented.2-6 However, contradictoryresults have been obtained. More frequently, the catalytic activityenhances with reduction in the average particle size (direct, orpositive size effect).2 Meanwhile, manifestations of the inverse(negative) size effect are also observed where the activity reducesas the particles become smaller.3 Moreover, there has been anexample where the activity was found to be independent of theparticle size.4 There have beenmany attempts to elucidate the factorsaffecting the ORR catalytic activity of the Pt-based catalysts (such asthe Pt-Pt distance, the coordination number of Pt, and electrondensity of states in the Pt 5d band), but some debate has stillremained on the detailed mechanisms involved. In this work, theelectrocatalytic activity of the carbon-supported Pt catalysts wasinvestigated as a function of both the particle size and shape. Wedemonstrate that the observed discrepancies could be due to changesin the particle shape accompanying changes in the particle size.
The catalysts were prepared by a classic chemical reductionmethod, inwhich awater-organic solventwas employed instead ofwater.7 By varying the solvent composition, we obtained catalystswith different structural and microstructural characteristics. Inparticular, both the nature of the components and their concentra-tion affect (i) the surface wettability of the carbon support, (ii)adsorption of the precursors, and (iii) the structure of solvatecomplexes of metals and their redox potentials. These factors alsodetermine the solution viscosity andmass transfer of the reagents tothe carbon support particles.6 All these effects, in turn, influence onnucleation and growth of the nanoparticles and hence on thecharacteristics of the finished samples. Therefore, we examaine theinfluence of the water-DMSO solvent composition on the microstructural parameters of the Pt/C materials.
’EXPERIMENTAL SECTION
Sample Preparation. Pt/C catalysts were prepared by theimpregnation method using H2PtCl6 3 6H2O (Aurat, Russia) as aprecursor, 0.5MNaBH4 as a reducing agent, andH2O-DMSO asa solvent (a more detailed description of the preparation procedurecan be found in ref 8). Five Pt/C samples synthesized usingDMSOconcentrations of 0%, 17%, 50%, 65%, 83% by volume in thesolvent were denoted as PT00, PT17, PT50, PT65, PT83,
Received: November 16, 2010Revised: January 16, 2011
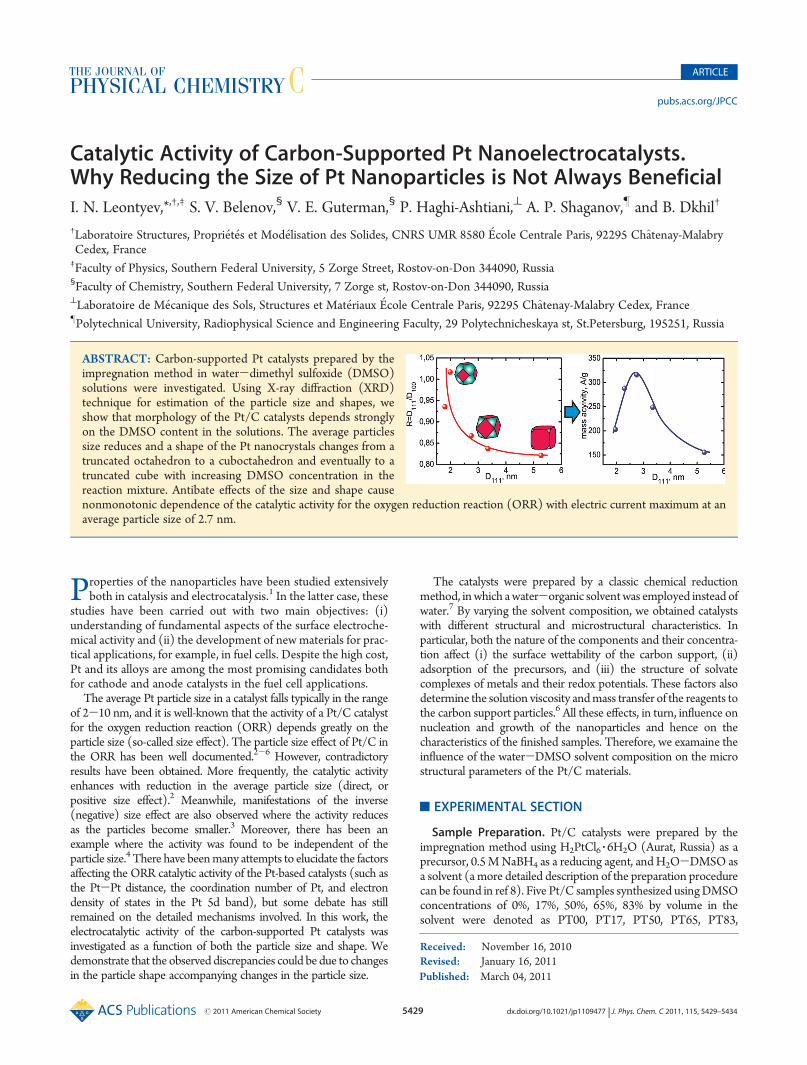
ABSTRACT: Carbon-supported Pt catalysts prepared by theimpregnation method in water-dimethyl sulfoxide (DMSO)solutions were investigated. Using X-ray diffraction (XRD)technique for estimation of the particle size and shapes, weshow that morphology of the Pt/C catalysts depends stronglyon the DMSO content in the solutions. The average particlessize reduces and a shape of the Pt nanocrystals changes from atruncated octahedron to a cuboctahedron and eventually to atruncated cube with increasing DMSO concentration in thereaction mixture. Antibate effects of the size and shape causenonmonotonic dependence of the catalytic activity for the oxygen reduction reaction (ORR) with electric current maximum at anaverage particle size of 2.7 nm.
5430 dx.doi.org/10.1021/jp1109477 |J. Phys. Chem. C 2011, 115, 5429–5434
The Journal of Physical Chemistry C ARTICLE
respectively. A carbon black powder (VULCAN XC72, CabotCorp. 240 m2/g) was used as a support. pH of the H2O-DMSOsolution was raised to 10 by adding ammonium saturated watersolution. During the synthesis, the suspension was mixed byultrasonic blending. Finally, the suspension was filtered, washed,anddried in air (100-120 �C, 2-3 h.). At the endof the treatment,each catalyst had a metal loading of approximately 20 wt %.X-ray Diffraction (XRD). Powder diffraction patterns were
recorded at the Swiss-Norwegian Beamlines (SNBL) at theEuropean Synchrotron Radiation Facilities (ESRF) at λ = 0.77Å using a MAR345 image-plate detector. The wavelength, sam-ple-to-detector distance (95 mm), and resolution of the setupwere calibrated with LaB6 (NIST) powder.
9 Samples were placedinto glass capillaries (Hilgenberg GmbH) having a diameter of0.3mm and a wall thickness of 0.01mm. The data were processedwith the Fit2D software.10 The peak shapes were described usingthe pseudo-Voigt function.11 The X-ray reflections were fittedusing the Winplotr from the FullProf software.12 Fittings of thereflections from the synthesized samples were made with allow-ance for the reflections from the carbon support.13 Correctionsfor the instrumental line broadening were made according to aconventional procedure described in ref 14.The average particle size was determined as usually by the well-
known Scherrer equation:15 D = Kλ/(fwhm cos θ), where λ isthe wavelength,D is the volume averaged particle size,K = 0.89 isthe Scherrer constant, fwhm is the full width at half-maximum ofthe peak, and θ, the Bragg angle of the [hkl] reflection. However,this equation neglects the strain, which can contribute to thebroadening of the Bragg peak. Therefore, a second method,developed byWilliamson and Hall,16 now known as theWilliam-son-Hall plot (WH), was also used. In this more completeapproach, fwhm is plotted as a function of (2 sin θ/λ) for all theBragg reflections for each sample, expressed in terms of recipro-cal units, (fwhm cos θ/λ). Using a linear extrapolation of themeasured points, the intersection with the vertical axis gives theparticle size (K/D), whereas the slope gives the strain. One mayremark that, for strain-free grains, the WH method becomesequivalent to the Scherrer approach.In addition, the so-called FW1/5/
4/5M method was also usedto determine parameters of the grain size distribution (GSD),that is the grain size dispersion around its average value. Adetailed description and justification of this method can be foundin ref 17. The second method is based on the assumption that thegrain size distribution GSD obeys a Gamma function
GSDðD: D0,mÞ ¼ D-m - 10
Γðmþ 1ÞDm exp ðD=D0Þ
where D0 = σ2/D, m = (D/σ)2 - 1, which is very close to theconventional log-normal distribution. The average particle sizeDand its dispersion σ were derived from the expressions
D ¼ 2BC=FW45M, σ ¼ 2B
ffiffiffiC
p=FW
45M
The coefficients B and C were found from the expressions
A ¼ arcctg 277 069- 105 723FW15M=FW
45M
� �
B ¼ 0:001555þ 0:00884 � ctgð0:002237- 2101� AÞ
C ¼ - 0:6515- 463 695� A
where FW1/5M and FW4/5M are the full widths at 1/5 and 4/5of the peak maximum, respectively. For determination of theGSD parameters by this method, we used the available LTGSDprogram.18
Finally, the fitting results for the Æ111æ and Æ200æ peaks wereused for determination of the average particle size and the GSDparameters using the Scherrer equation and the method. Theresults for the Æ111æ and Æ222æ peaks were used in the William-son-Hall method. Finally, all reflections of the powder diffrac-tion pattern were used for calculation of the unit cell parameterby means of the UNITCELL software.19
Electrochemical Characterization. All electrochemical mea-surements were performed using a standard three-electrode elec-trochemical cell with a IPC-Pro potentiostat (Volta Ltd.).Electrochemical properties of the Pt/C catalysts were determinedusing a rotating disk electrode (RDE) that consisted of a glassycarbon (GC) disk sealed in a polytetrafluoroethylene holder. Thegeometric surface area of the disk electrode was 0.28 cm2
(diameter:, 6 mm). The RDE was polished to a mirror finish witha 0.05 mm alumina suspension and then cleaned ultrasonically inhighly pure water. On top of this layer, the electrocatalyst wasapplied in form of a homogeneous dispersion (catalyst ink).Catalyst inks were prepared with 7 mg of a catalyst, 80 μL ofwater, 140 μL of 10% polyvinilidenfluoride emulsion in N-methyl-2-pyrrolidone and 800 μL of isopropanol. After ultrasonic disper-gation, an ink volume of 3.5 μL was dropped onto a GC electrodeand dried initially at room temperature and subsequently at100 �C.20 The potentials cited in this work are referred to that ofthe RHE. To identify the ORR activities of the carbon-supportedelectrocatalysts, cyclic voltammetry (CV) was conducted in thepotential range 0.05-1.2 V at a scan rate of 20 mV*s-1 with arotation speed of 1000 rpm. The electrolyte was a 1 M H2SO4
(Merck) solution saturated with oxygen (p = 1 atm). Sulfuric acidwas chosen because, even after taking into account complicationscaused by the specific adsorption of SO4
2- anions in this electro-lyte, it was easier to compare the results with the literature data. Allmeasurements were carried out at room temperature. A commer-cial Pt/C catalyst from E-TEK (20% metal loading on VulcanXC72, D111 = 2.3 nm) was measured for comparison.
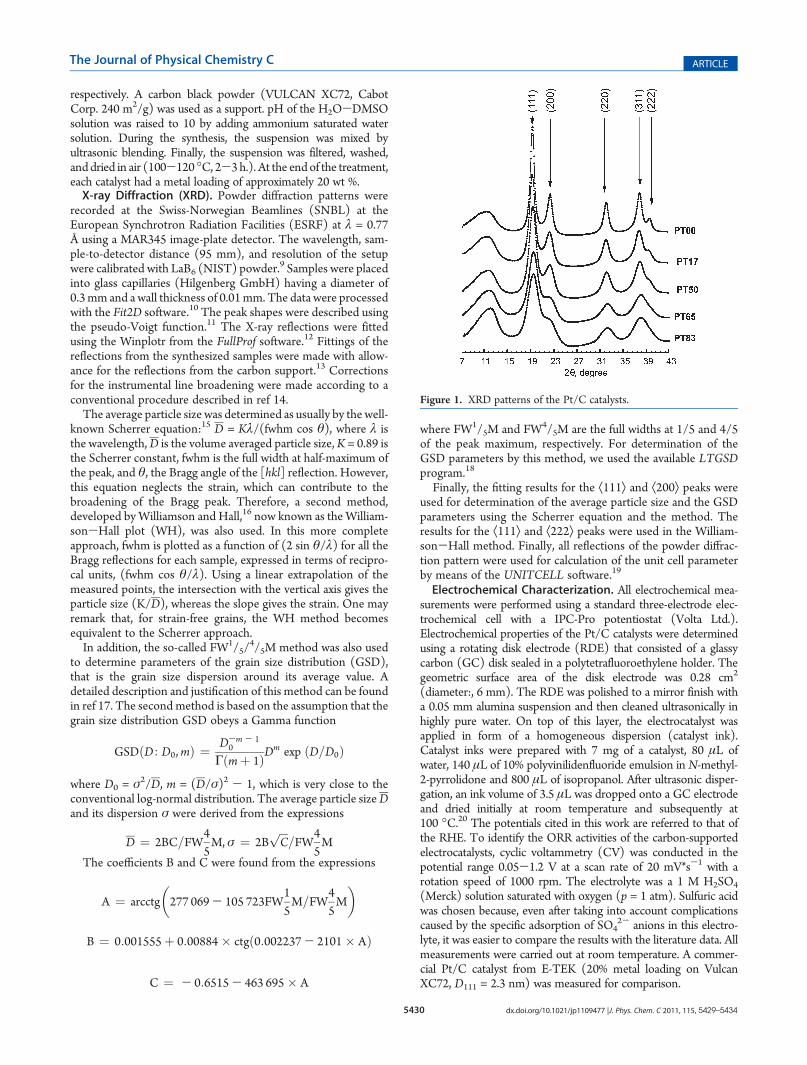
Figure 1. XRD patterns of the Pt/C catalysts.
5431 dx.doi.org/10.1021/jp1109477 |J. Phys. Chem. C 2011, 115, 5429–5434
The Journal of Physical Chemistry C ARTICLE
’RESULTS AND DISCUSSION
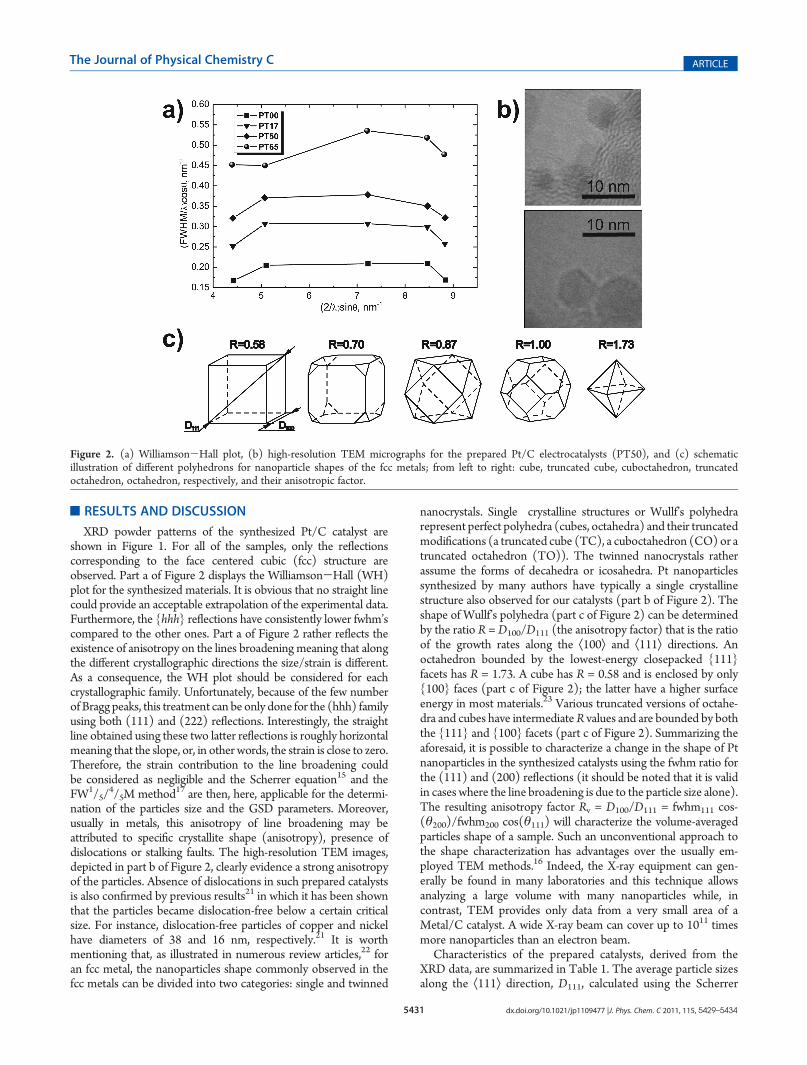
XRD powder patterns of the synthesized Pt/C catalyst areshown in Figure 1. For all of the samples, only the reflectionscorresponding to the face centered cubic (fcc) structure areobserved. Part a of Figure 2 displays the Williamson-Hall (WH)plot for the synthesized materials. It is obvious that no straight linecould provide an acceptable extrapolation of the experimental data.Furthermore, the {hhh} reflections have consistently lower fwhm’scompared to the other ones. Part a of Figure 2 rather reflects theexistence of anisotropy on the lines broadening meaning that alongthe different crystallographic directions the size/strain is different.As a consequence, the WH plot should be considered for eachcrystallographic family. Unfortunately, because of the few numberof Bragg peaks, this treatment can be only done for the (hhh) familyusing both (111) and (222) reflections. Interestingly, the straightline obtained using these two latter reflections is roughly horizontalmeaning that the slope, or, in other words, the strain is close to zero.Therefore, the strain contribution to the line broadening couldbe considered as negligible and the Scherrer equation15 and theFW1/5/
4/5M method17 are then, here, applicable for the determi-nation of the particles size and the GSD parameters. Moreover,usually in metals, this anisotropy of line broadening may beattributed to specific crystallite shape (anisotropy), presence ofdislocations or stalking faults. The high-resolution TEM images,depicted in part b of Figure 2, clearly evidence a strong anisotropyof the particles. Absence of dislocations in such prepared catalystsis also confirmed by previous results21 in which it has been shownthat the particles became dislocation-free below a certain criticalsize. For instance, dislocation-free particles of copper and nickelhave diameters of 38 and 16 nm, respectively.21 It is worthmentioning that, as illustrated in numerous review articles,22 foran fcc metal, the nanoparticles shape commonly observed in thefcc metals can be divided into two categories: single and twinned
nanocrystals. Single crystalline structures or Wullf’s polyhedrarepresent perfect polyhedra (cubes, octahedra) and their truncatedmodifications (a truncated cube (TC), a cuboctahedron (CO) or atruncated octahedron (TO)). The twinned nanocrystals ratherassume the forms of decahedra or icosahedra. Pt nanoparticlessynthesized by many authors have typically a single crystallinestructure also observed for our catalysts (part b of Figure 2). Theshape of Wullf’s polyhedra (part c of Figure 2) can be determinedby the ratio R =D100/D111 (the anisotropy factor) that is the ratioof the growth rates along the Æ100æ and Æ111æ directions. Anoctahedron bounded by the lowest-energy closepacked {111}facets has R = 1.73. A cube has R = 0.58 and is enclosed by only{100} faces (part c of Figure 2); the latter have a higher surfaceenergy in most materials.23 Various truncated versions of octahe-dra and cubes have intermediateR values and are bounded by boththe {111} and {100} facets (part c of Figure 2). Summarizing theaforesaid, it is possible to characterize a change in the shape of Ptnanoparticles in the synthesized catalysts using the fwhm ratio forthe (111) and (200) reflections (it should be noted that it is validin cases where the line broadening is due to the particle size alone).The resulting anisotropy factor Rv = D100/D111 = fwhm111 cos-(θ200)/fwhm200 cos(θ111) will characterize the volume-averagedparticles shape of a sample. Such an unconventional approach tothe shape characterization has advantages over the usually em-ployed TEM methods.16 Indeed, the X-ray equipment can gen-erally be found in many laboratories and this technique allowsanalyzing a large volume with many nanoparticles while, incontrast, TEM provides only data from a very small area of aMetal/C catalyst. A wide X-ray beam can cover up to 1011 timesmore nanoparticles than an electron beam.
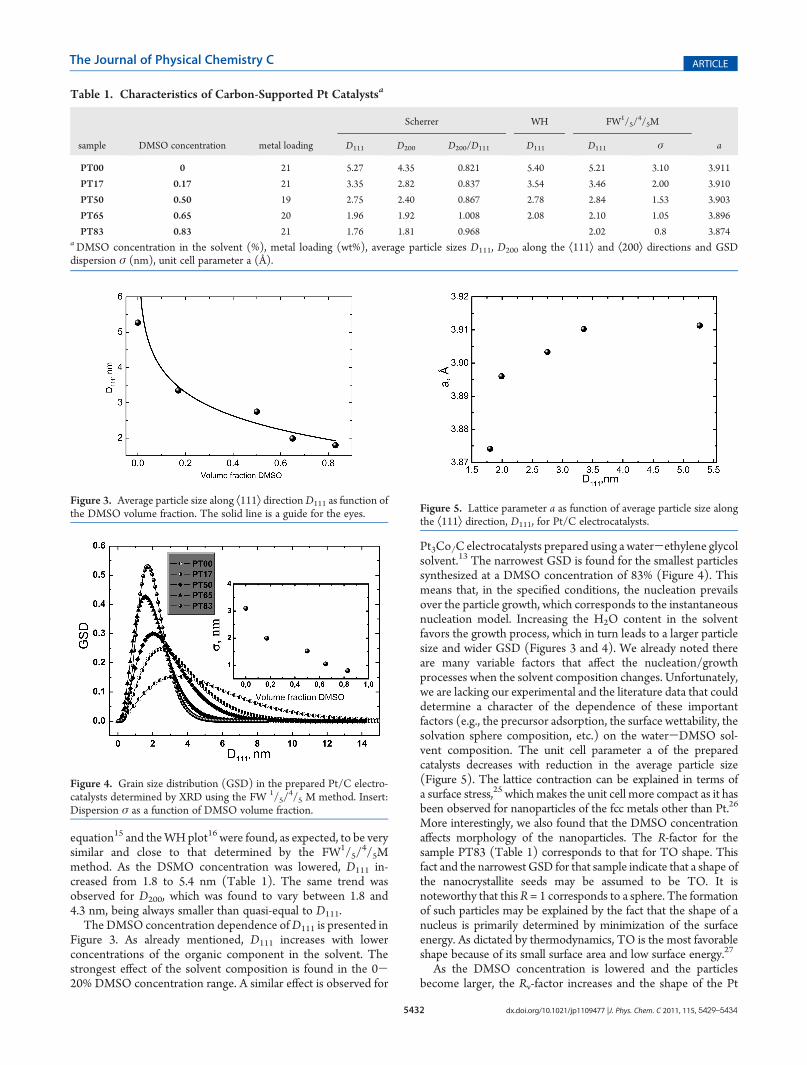
Characteristics of the prepared catalysts, derived from theXRD data, are summarized in Table 1. The average particle sizesalong the Æ111æ direction, D111, calculated using the Scherrer
Figure 2. (a) Williamson-Hall plot, (b) high-resolution TEM micrographs for the prepared Pt/C electrocatalysts (PT50), and (c) schematicillustration of different polyhedrons for nanoparticle shapes of the fcc metals; from left to right: cube, truncated cube, cuboctahedron, truncatedoctahedron, octahedron, respectively, and their anisotropic factor.
5432 dx.doi.org/10.1021/jp1109477 |J. Phys. Chem. C 2011, 115, 5429–5434
The Journal of Physical Chemistry C ARTICLE
equation15 and theWHplot16 were found, as expected, to be verysimilar and close to that determined by the FW1/5/
4/5Mmethod. As the DSMO concentration was lowered, D111 in-creased from 1.8 to 5.4 nm (Table 1). The same trend wasobserved for D200, which was found to vary between 1.8 and4.3 nm, being always smaller than quasi-equal to D111.
The DMSO concentration dependence ofD111 is presented inFigure 3. As already mentioned, D111 increases with lowerconcentrations of the organic component in the solvent. Thestrongest effect of the solvent composition is found in the 0-20% DMSO concentration range. A similar effect is observed for
Pt3Co/C electrocatalysts prepared using a water-ethylene glycolsolvent.13 The narrowest GSD is found for the smallest particlessynthesized at a DMSO concentration of 83% (Figure 4). Thismeans that, in the specified conditions, the nucleation prevailsover the particle growth, which corresponds to the instantaneousnucleation model. Increasing the H2O content in the solventfavors the growth process, which in turn leads to a larger particlesize and wider GSD (Figures 3 and 4). We already noted thereare many variable factors that affect the nucleation/growthprocesses when the solvent composition changes. Unfortunately,we are lacking our experimental and the literature data that coulddetermine a character of the dependence of these importantfactors (e.g., the precursor adsorption, the surface wettability, thesolvation sphere composition, etc.) on the water-DMSO sol-vent composition. The unit cell parameter a of the preparedcatalysts decreases with reduction in the average particle size(Figure 5). The lattice contraction can be explained in terms ofa surface stress,25 whichmakes the unit cell more compact as it hasbeen observed for nanoparticles of the fcc metals other than Pt.26
More interestingly, we also found that the DMSO concentrationaffects morphology of the nanoparticles. The R-factor for thesample PT83 (Table 1) corresponds to that for TO shape. Thisfact and the narrowest GSD for that sample indicate that a shape ofthe nanocrystallite seeds may be assumed to be TO. It isnoteworthy that thisR = 1 corresponds to a sphere. The formationof such particles may be explained by the fact that the shape of anucleus is primarily determined by minimization of the surfaceenergy. As dictated by thermodynamics, TO is the most favorableshape because of its small surface area and low surface energy.27
As the DMSO concentration is lowered and the particlesbecome larger, the Rv-factor increases and the shape of the Pt
Table 1. Characteristics of Carbon-Supported Pt Catalystsa
Scherrer WH FW1/5/4/5M
sample DMSO concentration metal loading D111 D200 D200/D111 D111 D111 σ a
PT00 0 21 5.27 4.35 0.821 5.40 5.21 3.10 3.911
PT17 0.17 21 3.35 2.82 0.837 3.54 3.46 2.00 3.910
PT50 0.50 19 2.75 2.40 0.867 2.78 2.84 1.53 3.903
PT65 0.65 20 1.96 1.92 1.008 2.08 2.10 1.05 3.896
PT83 0.83 21 1.76 1.81 0.968 2.02 0.8 3.874aDMSO concentration in the solvent (%), metal loading (wt%), average particle sizes D111, D200 along the Æ111æ and Æ200æ directions and GSDdispersion σ (nm), unit cell parameter a (Å).
Figure 3. Average particle size along Æ111æ directionD111 as function ofthe DMSO volume fraction. The solid line is a guide for the eyes.
Figure 4. Grain size distribution (GSD) in the prepared Pt/C electro-catalysts determined by XRD using the FW 1/5/
4/5 M method. Insert:Dispersion σ as a function of DMSO volume fraction.
Figure 5. Lattice parameter a as function of average particle size alongthe Æ111æ direction, D111, for Pt/C electrocatalysts.
5433 dx.doi.org/10.1021/jp1109477 |J. Phys. Chem. C 2011, 115, 5429–5434
The Journal of Physical Chemistry C ARTICLE
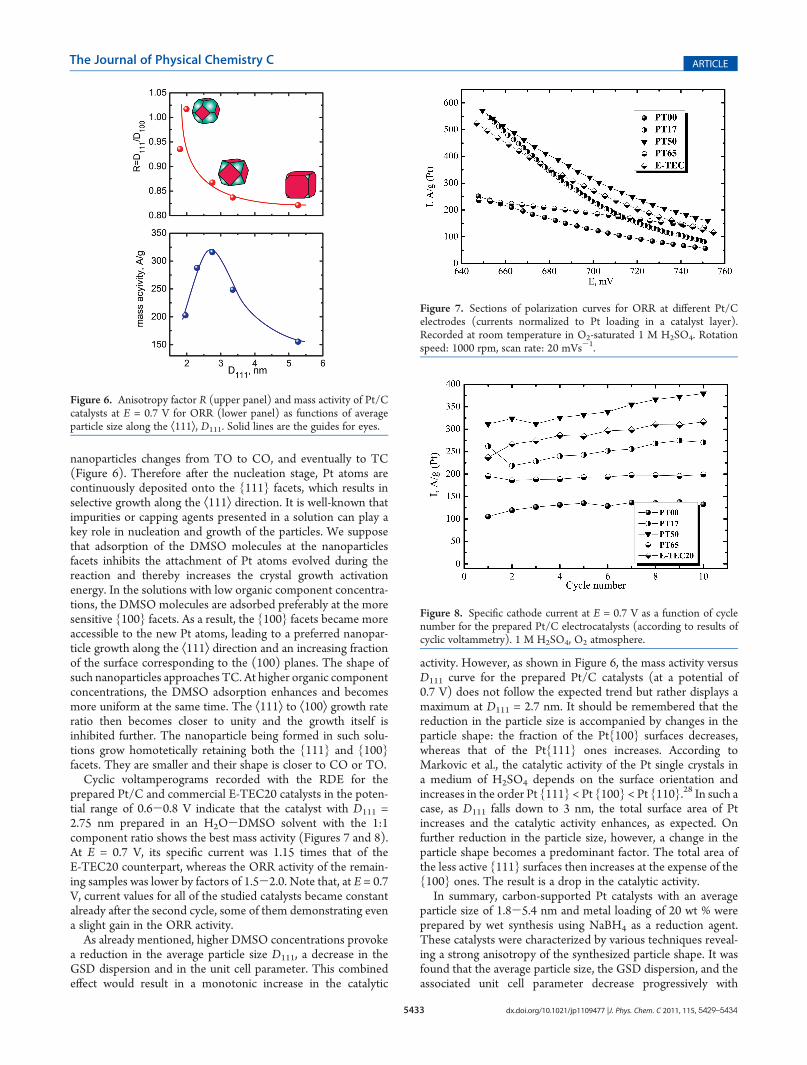
nanoparticles changes from TO to CO, and eventually to TC(Figure 6). Therefore after the nucleation stage, Pt atoms arecontinuously deposited onto the {111} facets, which results inselective growth along the Æ111æ direction. It is well-known thatimpurities or capping agents presented in a solution can play akey role in nucleation and growth of the particles. We supposethat adsorption of the DMSO molecules at the nanoparticlesfacets inhibits the attachment of Pt atoms evolved during thereaction and thereby increases the crystal growth activationenergy. In the solutions with low organic component concentra-tions, the DMSO molecules are adsorbed preferably at the moresensitive {100} facets. As a result, the {100} facets became moreaccessible to the new Pt atoms, leading to a preferred nanopar-ticle growth along the Æ111æ direction and an increasing fractionof the surface corresponding to the (100) planes. The shape ofsuch nanoparticles approaches TC. At higher organic componentconcentrations, the DMSO adsorption enhances and becomesmore uniform at the same time. The Æ111æ to Æ100æ growth rateratio then becomes closer to unity and the growth itself isinhibited further. The nanoparticle being formed in such solu-tions grow homotetically retaining both the {111} and {100}facets. They are smaller and their shape is closer to CO or TO.
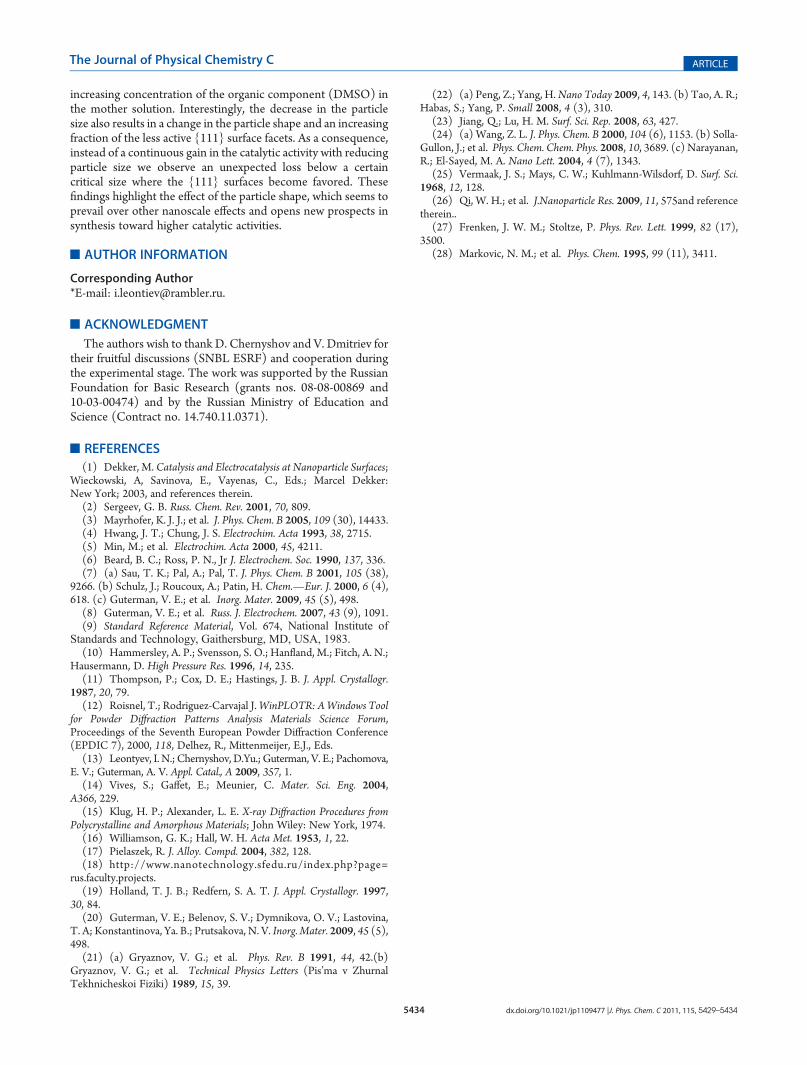
Cyclic voltamperograms recorded with the RDE for theprepared Pt/C and commercial E-TEC20 catalysts in the poten-tial range of 0.6-0.8 V indicate that the catalyst with D111 =2.75 nm prepared in an H2O-DMSO solvent with the 1:1component ratio shows the best mass activity (Figures 7 and 8).At E = 0.7 V, its specific current was 1.15 times that of theE-TEC20 counterpart, whereas the ORR activity of the remain-ing samples was lower by factors of 1.5-2.0. Note that, at E = 0.7V, current values for all of the studied catalysts became constantalready after the second cycle, some of them demonstrating evena slight gain in the ORR activity.
As already mentioned, higher DMSO concentrations provokea reduction in the average particle size D111, a decrease in theGSD dispersion and in the unit cell parameter. This combinedeffect would result in a monotonic increase in the catalytic
activity. However, as shown in Figure 6, the mass activity versusD111 curve for the prepared Pt/C catalysts (at a potential of0.7 V) does not follow the expected trend but rather displays amaximum at D111 = 2.7 nm. It should be remembered that thereduction in the particle size is accompanied by changes in theparticle shape: the fraction of the Pt{100} surfaces decreases,whereas that of the Pt{111} ones increases. According toMarkovic et al., the catalytic activity of the Pt single crystals ina medium of H2SO4 depends on the surface orientation andincreases in the order Pt {111} < Pt {100} < Pt {110}.28 In such acase, as D111 falls down to 3 nm, the total surface area of Ptincreases and the catalytic activity enhances, as expected. Onfurther reduction in the particle size, however, a change in theparticle shape becomes a predominant factor. The total area ofthe less active {111} surfaces then increases at the expense of the{100} ones. The result is a drop in the catalytic activity.
In summary, carbon-supported Pt catalysts with an averageparticle size of 1.8-5.4 nm and metal loading of 20 wt % wereprepared by wet synthesis using NaBH4 as a reduction agent.These catalysts were characterized by various techniques reveal-ing a strong anisotropy of the synthesized particle shape. It wasfound that the average particle size, the GSD dispersion, and theassociated unit cell parameter decrease progressively with
Figure 6. Anisotropy factor R (upper panel) and mass activity of Pt/Ccatalysts at E = 0.7 V for ORR (lower panel) as functions of averageparticle size along the Æ111æ, D111. Solid lines are the guides for eyes.
Figure 7. Sections of polarization curves for ORR at different Pt/Celectrodes (currents normalized to Pt loading in a catalyst layer).Recorded at room temperature in O2-saturated 1 M H2SO4. Rotationspeed: 1000 rpm, scan rate: 20 mVs-1.
Figure 8. Specific cathode current at E = 0.7 V as a function of cyclenumber for the prepared Pt/C electrocatalysts (according to results ofcyclic voltammetry). 1 M H2SO4, O2 atmosphere.
5434 dx.doi.org/10.1021/jp1109477 |J. Phys. Chem. C 2011, 115, 5429–5434
The Journal of Physical Chemistry C ARTICLE
increasing concentration of the organic component (DMSO) inthe mother solution. Interestingly, the decrease in the particlesize also results in a change in the particle shape and an increasingfraction of the less active {111} surface facets. As a consequence,instead of a continuous gain in the catalytic activity with reducingparticle size we observe an unexpected loss below a certaincritical size where the {111} surfaces become favored. Thesefindings highlight the effect of the particle shape, which seems toprevail over other nanoscale effects and opens new prospects insynthesis toward higher catalytic activities.
’AUTHOR INFORMATION
Corresponding Author*E-mail: [email protected].
’ACKNOWLEDGMENT
The authors wish to thank D. Chernyshov and V. Dmitriev fortheir fruitful discussions (SNBL ESRF) and cooperation duringthe experimental stage. The work was supported by the RussianFoundation for Basic Research (grants nos. 08-08-00869 and10-03-00474) and by the Russian Ministry of Education andScience (Contract no. 14.740.11.0371).
’REFERENCES
(1) Dekker, M. Catalysis and Electrocatalysis at Nanoparticle Surfaces;Wieckowski, A, Savinova, E., Vayenas, C., Eds.; Marcel Dekker:New York; 2003, and references therein.(2) Sergeev, G. B. Russ. Chem. Rev. 2001, 70, 809.(3) Mayrhofer, K. J. J.; et al. J. Phys. Chem. B 2005, 109 (30), 14433.(4) Hwang, J. T.; Chung, J. S. Electrochim. Acta 1993, 38, 2715.(5) Min, M.; et al. Electrochim. Acta 2000, 45, 4211.(6) Beard, B. C.; Ross, P. N., Jr J. Electrochem. Soc. 1990, 137, 336.(7) (a) Sau, T. K.; Pal, A.; Pal, T. J. Phys. Chem. B 2001, 105 (38),
9266. (b) Schulz, J.; Roucoux, A.; Patin, H. Chem.—Eur. J. 2000, 6 (4),618. (c) Guterman, V. E.; et al. Inorg. Mater. 2009, 45 (5), 498.(8) Guterman, V. E.; et al. Russ. J. Electrochem. 2007, 43 (9), 1091.(9) Standard Reference Material, Vol. 674, National Institute of
Standards and Technology, Gaithersburg, MD, USA, 1983.(10) Hammersley, A. P.; Svensson, S. O.; Hanfland, M.; Fitch, A. N.;
Hausermann, D. High Pressure Res. 1996, 14, 235.(11) Thompson, P.; Cox, D. E.; Hastings, J. B. J. Appl. Crystallogr.
1987, 20, 79.(12) Roisnel, T.; Rodriguez-Carvajal J.WinPLOTR: AWindows Tool
for Powder Diffraction Patterns Analysis Materials Science Forum,Proceedings of the Seventh European Powder Diffraction Conference(EPDIC 7), 2000, 118, Delhez, R., Mittenmeijer, E.J., Eds.(13) Leontyev, I. N.; Chernyshov, D.Yu.; Guterman, V. E.; Pachomova,
E. V.; Guterman, A. V. Appl. Catal., A 2009, 357, 1.(14) Vives, S.; Gaffet, E.; Meunier, C. Mater. Sci. Eng. 2004,
A366, 229.(15) Klug, H. P.; Alexander, L. E. X-ray Diffraction Procedures from
Polycrystalline and Amorphous Materials; John Wiley: New York, 1974.(16) Williamson, G. K.; Hall, W. H. Acta Met. 1953, 1, 22.(17) Pielaszek, R. J. Alloy. Compd. 2004, 382, 128.(18) http://www.nanotechnology.sfedu.ru/index.php?page=
rus.faculty.projects.(19) Holland, T. J. B.; Redfern, S. A. T. J. Appl. Crystallogr. 1997,
30, 84.(20) Guterman, V. E.; Belenov, S. V.; Dymnikova, O. V.; Lastovina,
T. A; Konstantinova, Ya. B.; Prutsakova, N. V. Inorg. Mater. 2009, 45 (5),498.(21) (a) Gryaznov, V. G.; et al. Phys. Rev. B 1991, 44, 42.(b)
Gryaznov, V. G.; et al. Technical Physics Letters (Pis’ma v ZhurnalTekhnicheskoi Fiziki) 1989, 15, 39.
(22) (a) Peng, Z.; Yang, H.Nano Today 2009, 4, 143. (b) Tao, A. R.;Habas, S.; Yang, P. Small 2008, 4 (3), 310.
(23) Jiang, Q.; Lu, H. M. Surf. Sci. Rep. 2008, 63, 427.(24) (a) Wang, Z. L. J. Phys. Chem. B 2000, 104 (6), 1153. (b) Solla-
Gullon, J.; et al. Phys. Chem. Chem. Phys. 2008, 10, 3689. (c) Narayanan,R.; El-Sayed, M. A. Nano Lett. 2004, 4 (7), 1343.
(25) Vermaak, J. S.; Mays, C. W.; Kuhlmann-Wilsdorf, D. Surf. Sci.1968, 12, 128.
(26) Qi, W. H.; et al. J.Nanoparticle Res. 2009, 11, 575and referencetherein..
(27) Frenken, J. W. M.; Stoltze, P. Phys. Rev. Lett. 1999, 82 (17),3500.
(28) Markovic, N. M.; et al. Phys. Chem. 1995, 99 (11), 3411.