catalysing low cost green technologies for sustainable
TRANSCRIPT

1 | P a g e
Catalysing low cost green technologies for sustainable water service delivery in Kenya Feasibility Study Report
[Pick the date] DTU Natacha Coni Chater

2 | P a g e
Acknowledgements
This report was prepared for the Climate Technology Centre Network (CTCN) and UNEP DTU Partnership
(UDP) by Wangai Ndirangu, from Batiment Engineering and Associates (BEA) Kenya, with support from
Caroline Schaer from UDP Denmark and assistance from Esther Ng’ang’a from BEA. The study was made
possible with guidance from Water Services Trust Fund (WSTF) and Kenya Industrial Research and
Development Institute (KIRDI), the Designated National Entity for CTCN in Kenya.
The author appreciates oversight support provided by Arthur Onyuka from KIRDI, Jason Spensley and
Sandra Bry from CTCN and Sara Trærup from UDP. Special mention to Ann Nabangala who has
spearheaded this study from the beginning and the entire WSTF team especially Ismail Shaiye, Willis
Ombai, Ruth Nganga, Priscilla Kinyari, Stella Warue, Peter Koech, Rodger White and Sally Asiyo.
Appreciation to Green technology Centre team Hyung Kim, Kirsty Taylor and Jiehee Son for taking the
time to comment and contribute to the development of this report. My gratitude also goes to
individuals and institutions that supported the data collection process for their invaluable time and
ideas. Finally, I owe special thanks to John Munene, Peter Kibe, Jesse Toyianka, Patrick Masitsa and
WSTF County Coordinators Hassan Tari, Anita Ngugi Kiara, Grishon Ngige, Martin Shikuku for their
immense support during the field data collection exercise and to Natacha Chater Cure from UDP for
patiently reviewing the report.

3 | P a g e
Terms and Abbreviations
Term/Abbreviation Meaning
ACTS African Centre for Technology Studies
ASALs Arid and semi-arid areas
CBOs Community Based Organization
CoK Constitution of Kenya
COP Conference of the Parties to the UN Framework Convention on Climate Change (UNFCCC)
CTCN Climate Technology Centre and Network
DANIDA Danish International Development Agency
EU European union
GESIP Green Economy Strategy and Implementation Plan
GHG Green Houses Gases
GoK Government of Kenya
HH Household
INDCs Intended National Determined Contributions
Ksh Kenyan Shilling
KNBS Kenya National Bureau of Statistics
kw Kilo Watt
kWh Kilo Watt Hour
LPD Litres per day
LHD Litre per household per day
MoENR Ministry of Environment and Natural resources
MoWI Ministry of Water and Irrigation
MTP Medium Term Plan of Vision 2030
MW Mega Watt
NCCAP National Climate Change Action Plan
NCCRS National Climate Change Response Strategy
NEMA National Environmental Management Authority
NGOs, Non-Governmental Organization
NWMP National Water Master Plan
O&M Operation and Maintenance
PPP Public Private Partnership

4 | P a g e
PV Photovoltaic
RE Renewable Energy
RETs Renewable Energy Technologies
SDGs Sustainable Development Goals
SWTs Small Wind Turbines
TNA Technology Need Assessment
UDP UNEP DTU Partnership
WASH Water sanitation and Hygiene
WASREB Water Services Regulatory Board
WEPS Wind Electric Pumping Systems
WRUAs Water resource users associations
WSPs Water services providers
WSTF Water Services Trust Fund

5 | P a g e
TABLE OF CONTENTS Acknowledgements ....................................................................................................................................... 2 Terms and Abbreviations .............................................................................................................................. 3 TABLE OF CONTENTS .................................................................................................................................... 5 List of Figures ................................................................................................................................................ 8 List of Tables ............................................................................................................................................... 10 Executive Summary .................................................................................................................................... 11
E.1 Background ....................................................................................................................................... 11
E.2 Water and Climate Risk ..................................................................................................................... 12
E.3 Capacity and Prevalence of Technology ........................................................................................... 12
E.4 Preference and Equity ....................................................................................................................... 14
E.5 Capital, Operation and maintenance cost ........................................................................................ 14
E.6 Market Risk and PPP Potential .......................................................................................................... 15
E.7 Summary and Recommendations ..................................................................................................... 16
PART I .......................................................................................................................................................... 18 1. Introduction ........................................................................................................................................ 19
1.1. Study Objectives ......................................................................................................................... 20
2. Conceptual Framework and Methodology ........................................................................................ 22
2.1. Selection of technologies – Technical, social, economic and environmental parameters ........ 22
2.2. Research Questions .................................................................................................................... 25
2.3. Description of sampling, data collection and assessment Methods .......................................... 26
2.4. Exploratory Description of Field Data ......................................................................................... 29
3. Study Areas ......................................................................................................................................... 30 4. Water and Green Growth .................................................................................................................. 33
4.1. Situational and historical context ............................................................................................... 33
4.2. Water and Climate Risk ............................................................................................................... 35
4.3. Policy, Legal and institutional structure...................................................................................... 37
4.3.1. Constitution of Kenya.......................................................................................................... 37
4.3.2. Vision 2030 .......................................................................................................................... 37
4.3.3. Water Policy and Water Act 2016 ....................................................................................... 38
4.3.4. Green Economy Strategy and Implementation Plan .......................................................... 39
4.3.5. Climate Change Act, 2016 ................................................................................................... 40
4.3.6. Institutional framework ...................................................................................................... 40
4.4.1. Small Water storage ............................................................................................................ 41
4.4.2. Electricity coverage and off-grid potential in Kenya ........................................................... 41
5. Overview of the Selected Green Low Cost Technologies ................................................................. 43
5.1. Background ................................................................................................................................. 43
5.1. Solar energy ..................................................................................................................................... 44

6 | P a g e
5.2. Wind Energy .................................................................................................................................... 45
5.3. Surface Water Storage Pans ............................................................................................................ 48
PART II ......................................................................................................................................................... 51 6. Capacity, Prevalence and Functioning of Technologies .................................................................... 52
6.1. Prevalence of Wind, Solar and Water Pans ................................................................................ 52
6.1.1. Water-Energy Interface ....................................................................................................... 57
6.2. Capacity to reliably meet demand .............................................................................................. 57
6.2.1. Technology Capacity and demand coverage ..................................................................... 63
6.2.2. Land availability for technology Installation ....................................................................... 72
6.3. Durability and Serviceability ....................................................................................................... 73
6.4. Technical skills for up scaling ...................................................................................................... 75
6.5. Summary ..................................................................................................................................... 77
7. Economic Analysis of Low Cost Green Water Technologies ............................................................. 79
7.1. Capital Expenditure and Affordability ......................................................................................... 79
7.2. Cost effectiveness and benefits .................................................................................................. 82
7.3. Cost Benefit Analysis ................................................................................................................... 85
7.4. Cost Recovery .............................................................................................................................. 91
8. Analysing Technology Access and impacts ........................................................................................ 95
8.1. Preference of water supply technology ...................................................................................... 96
8.2. Technology uptake ...................................................................................................................... 98
8.3. Social marketing and equitability................................................................................................ 99
8.4. Summary - Acceptability and potential for transformation and Inclusiveness ........................ 101
9. Technology Risk and Sustainability Analysis ................................................................................... 103
9.1. Sustainability context of selected green technologies ............................................................. 103
9.2.1. Poor quality and substandard products ............................................................................ 105
9.2.2. Poor service condition ...................................................................................................... 105
9.2.3. Low financial capability ..................................................................................................... 107
9.2.4. Capital budget linked to community contributions .......................................................... 108
9.2.5. Demand and preference of technology ............................................................................ 108
9.3. Summary – technology risks and sustainability ........................................................................ 109
10. Developing Green Solutions for water supply ................................................................................ 111
10.1. Technology Funding and Financing Mechanism ................................................................... 111
10.2. Low cost green technology project design ........................................................................... 111
10.3. Business Management model ............................................................................................... 113
10.4. Capacity development and raising awareness ...................................................................... 114
10.5. Policy, legal and regulatory framework ................................................................................ 114

7 | P a g e
10.6. Summary ............................................................................................................................... 115
11. Conclusion and Key Messages ......................................................................................................... 116
11.1. Key findings ........................................................................................................................... 117
11.2. Recommendations ................................................................................................................ 119
Bibliography .................................................................................................................................. 122 Annexes......................................................................................................................................... 124
Annex 1: List All Key Partners And Stakeholders .................................................................................. 125
Annex 2: Pictorial Description ............................................................................................................... 127
Annex 3: Key Informant synthesis report ............................................................................................. 131
Annex 4: Stakeholders synthesis report ............................................................................................... 134
Annex 5: survey tools ............................................................................................................................ 136
i. Technology point manager/caretaker survey questionnaire ................................................... 136
Iii. User Interview Questionnaire ............................................................................................... 140
ii. Questions guide for semi-structured interview ........................................................................ 145

8 | P a g e
List of Figures
Figure E-1: How PPP can help infrastructure delivery (source, Private Sector Provision of WSS in rural areas WSP-World bank, 2016) .................................................................................................................... 16
Figure 2: Arid and Semi-arid areas in Kenya ............................................................................................... 19
Figure 3: Key result areas and research questions ..................................................................................... 25
Figure 4: Study Areas .................................................................................................................................. 31
Figure 5: Trend in Water and Sewerage coverage, (Water Services Regulatory Board (WSRB), 2016) ..... 33
Figure 6: Mean Annual Rainfall Vs population density in Kenya ................................................................ 35
Figure 8: Installed electricity generation capacity as of April 2015 (GIZ, 2015) ......................................... 39
Figure 8: National Electricity transmission Grid, (Kenya Power & Lighting Company Limited, 2013) ........ 41
Figure 9: Wind Speed Map of Kenya at 80m height ................................................................................... 45
Figure 10: The wind pumping niche versus other pumping technologies .................................................. 47
Figure 11: Comparative Analysis of Wind speed at 60m, 80m and 100m, (GoK Ministry of Energy and WinDForce, 2013) ....................................................................................................................................... 47
Figure 12: Typical plan and section drawing of a water pan, (Government of Kenya, 2015)..................... 48
Figure 13: Distribution of water abstraction methods in rural and peri-urban areas ................................ 55
Figure 14: Distribution of Kijito Mechanial wind pumps in Kenya ............................................................. 56
Figure 15: Multiple uses of water per county ............................................................................................. 58
Figure 16: Volume of water collected from technology sources per day ................................................... 58
Figure 17: Distance to source and daily consumption by ecological zones ................................................ 60
Figure 18: Comparison the water collected and required by users ............................................................ 64
Figure 19: Water collected versus technology is use .................................................................................. 64
Figure 20: Distribution of safe borehole yield ........................................................................................... 65
Figure 21: Theoretical depletion curves without irrigation ........................................................................ 67
Figure 22: Water pan depletion under combined domestic, livestock and irrigation water demand ....... 68
Figure 23: Distribution of installed solar PV by size ................................................................................... 69
Figure 24: Growth of solar water pumping technology .............................................................................. 69
Figure 25: Main technology Challenges ...................................................................................................... 73
Figure 26: Construction Cost versus size of water pan ............................................................................... 81
Figure 27: Criteria for Improved water supply services in Kenya (WASREB) ............................................... 82
Figure 28: Rainfall pattens in the target study areas .................................................................................. 84
Figure 29: Typical Performance of 30,000 m3 Water Pan in Embu............................................................. 85
Figure 30: Typical Performance of 30,000 m3 Water Pan in Baringo (top) and Homabay (bottom) ......... 85
Figure 31: Amortisation of Ksh 3.5 Million investment debt at 5% (top) and 14% (bottom) interest rate 93
Figure 32: solar radiation in season by hour of day .................................................................................... 97
Figure 33: Gender Representation............................................................................................................ 100
Figure 34: Social-economic potential of green technologies.................................................................... 102
Figure 35: Most important water supply issues ....................................................................................... 103
Figure 36: Problem Tree on constrained ability to improve water supplies ............................................ 104

9 | P a g e
Figure 37: Nature of water supplies improvement proposed by users .................................................... 109
Figure 38: Problem analysis of Low technology base .............................................................................. 110
Figure 39: Designing a holistic PPP Model ................................................................................................ 116

10 | P a g e
List of Tables
Table 1: Relative technology score for the identified ranking factors ........................................................ 23
Table 2: Weighted Score and Prioritised Technology ................................................................................. 24
Table 3: Technology adaptation indicators from the perspectives of different actors (adapted from Hostettler & Hazboun 2015) ....................................................................................................................... 26
Table 4: Classification of Agro-climatic zones, (Country Pasture/Forage Resource Profiles (Kenya) n.d.) 27
Table 5: Summary of study design .............................................................................................................. 28
Table 6: Distribution of Survey respondents per county ............................................................................ 29
Table 7: Distribution of technology survey point by ecological zones per county ..................................... 29
Table 8: Selected Counties for the field Survey .......................................................................................... 30
Table 9: Droughts in Kenya since 1960's, (Masih, Maskey, Mussá, & Trambauer, 2014) .......................... 36
Table 10: Strengths and weaknesses of PV energy systems, (UNIDO, 2010) ............................................. 45
Table 11: Dominant small wind market players in Kenya , (Rencon Associates and JICA, 2013) ............... 46
Table 12: Strengths and weaknesses of wind energy systems, (UNIDO, 2010) ......................................... 48
Table 13: strengths and weakness of water pans ....................................................................................... 50
Table 14: Distribution of water sources type by Ecological Zone per County ............................................ 53
Table 15: Distribution of the target technologies by year of installation per county ................................ 54
Table 16: Distribution of water abstraction methods by ecological zones by water users ....................... 55
Table 17: Distribution of water abstraction methods by ecological zones by water managers ................ 56
Table 18: Water abstraction versus water sources .................................................................................... 57
Table 19: Categories and Proportion of water uses ................................................................................... 57
Table 20: Number of Months Water is Available at Technology Points ..................................................... 61
Table 21: Common water sources during dry and wet seasons ................................................................. 62
Table 22: Estimated Household Domestic water demand ......................................................................... 63
Table 23: Current and future multipurpose water demand ....................................................................... 65
Table 24: Required Capacity of solar PV (kW) ............................................................................................ 71
Table 25: Level of training ........................................................................................................................... 76
Table 26:Distribution Capital Cost Per Technology .................................................................................... 80
Table 27: Typical commercial quote for 200mm deep borehole fitted with 5kW solar pumping ............. 80
Table 28: Population density in target counties ......................................................................................... 83
Table 29: Cost of technology by component .............................................................................................. 88
Table 30: Benefit-Cost and Incremental B/C Analysis for Low-cost technology in Baringo ....................... 90
Table 31: Benefit-Cost and Incremental B/C Analysis for Low-cost technology in Embu .......................... 90
Table 32: Sources (instances) of O&M Finance .......................................................................................... 91
Table 33: Synopsis of Revenue and Costs (Ksh) .......................................................................................... 91
Table 34: Monthly revenue, Operation and Maintenance (Ksh ) ............................................................... 92
Table 35: Technology Operators ................................................................................................................. 95

11 | P a g e
Executive Summary
E.1 Background
Since 1974, the government of Kenya has recognised water supplies as critical for poverty reduction and
development. Kenya’s economic and social development Vision 2030 emphasises the need for adequate
and sustainable provision of water supply and sanitation services, with a target to achieve universal
access by 2030. However, thus far most water development targets have not been achieved.
Improvement has been much slower in rural and low income urban areas, and the current funding level is
inadequate to achieve universal access by 2030.
Over the years, official effort have been complemented through non-programmatic community and self-
help action, but many projects quickly deteriorate after implementation and are rarely functioning 5 years
after implementation. Consequently, water services available for the poor in Kenya are often inadequate,
unsafe and unsustainable. Weak attention to planning, standards and operations and maintenance,
including source and cost of energy in rural and peri-urban water supplies is a key challenge to
functionality and sustainability.
In addition, climate change and variability add to a multitude of immediate and long-term impacts on
water resources and on sustainable economic growth. Arid and Semi-Arid areas in the Northern part of
Kenya and poor peri-urban areas are particularly vulnerable, characterized by low level of water service
provision and acute water scarcity, where water demand considerably surpasses availability.
Coincidentally, the areas that are affected by poor water services are the same ones that suffer high rate
of unemployment and poverty, low economic output and poor provision of basic services such as
sanitation, education and health. All these issues together highlight the need for improved water access in
underserved areas and a more sustainable and strategic management of water resources.
The Water Services Trust Fund´s (WSTF) mandate is focused on financing investments for underserved
rural and low income urban areas. The Water Act of 2016 has transformed WSTF’s mandate from just
financing water supplies and sanitation to a wider Water Sector Fund role. WSTF through Kenya Industrial
Research and Development Institute (KIRDI), the national designated entity (NDE) requested support from
the Climate Technology Center Network (CTCN) to “Catalyse low cost technologies for sustainable water
service delivery in Northern Kenya”. The objective of the technical assistance was to analyse the technical,
economic and social potential of three selected green technologies (water pans, solar and wind) for water
supply in rural and peri-urban areas.
The present study examines the performance and barriers associated with the technologies and suggest
necessary measures to enhance their performance. Assessing the applicability and viability of
technologies is critical towards improving water supply especially in the underserved areas. The key
findings emanating from this study will inform the water sector in Kenya and especially WSTF on the
potential of the selected technologies and their deployment to guarantee sustainability of the water
supply.
12 | P a g e
E.2 Water and Climate Risk
Water scarcity in Kenya has for long been a major issue. The annual per capita freshwater endowment is
estimated at 427m3 in 2016, which means that water is chronically scarce. The current population of 47.3
million people (2016) is roughly distributed according to rainfall endowment, which underscores the
importance of reliable water supplies for economic development and livelihoods. Climate change places
extra stress on water resources and additional consideration in planning of infrastructure.
Several policies and strategies have been developed with the aim to entrench green growth in sustainable
development. The technology need assessment (TNA) for climate change and adaptation in Kenya
prioritised agriculture and water sectors, emphasizing that water is an important natural resource critical
for sustainable development. The prioritised water sector interventions for water resources include:
i. Increasing capture and retention of rain water through the construction of water ways, strategic
bore holes recharge and other water harvesting methods
ii. Rehabilitating rivers and dams to improve carrying capacity, storage and water quality
iii. Developing structures and technologies to ensure availability of water during the dry season
The National Water Master Plan (NWMP) sets out to develop 17,860 small dams and water pans adding
an additional 893 Mm3 water storage by 2030. Kenya’s rural electrification rate is about 7% and 50% in
urban areas. The government´s ambitious plan to increase electrification rates targets to achieve 40%
rural electricity access by 2024. This implies that off-grid electricity and small water storage structures will
have an important role in medium and long-term water development, especially in rural and low income
areas.
E.3 Capacity and Prevalence of Technology
Water pans are found in all parts of the country, with high prevalence in semi-arid to arid areas. Though
water-pans were initially intended to addresses livestock water demand, currently they are also used for
domestic purposes due to lack of alternative sources and erratic rains. In the humid and semi-humid
areas, other types of small storage structures, although not many, are common.
Most water pans were observed to completely dry immediately after the rain, while others had water for
2-3 months after. The high non-functionality rate of water pans is due to poor sizing, siting and site
investigation. To maximize the benefits and meet water demand, it is necessary to develop well-designed
water pans with a minimum size of 30,000 m3. This will entail enhancing skills and information that are
needed for planning, design, deployment and management of selected technologies.
At least 347 mechanical wind systems have been deployed for rural water supplies pumping in Kenya
since 1980’s. However, the uptake has steadily declined with the arrival of solar technology. Most of the
mechanical wind installations are no longer functioning and have been replaced by solar systems.
Whereas 25 mechanical wind systems have been deployed in the survey counties, only five were

13 | P a g e
observed during the field study and of those only one was operational. The main cause of failure in
mechanical wind pumping is often the deficient basic maintenance. This underlines the need for suitable
post-construction support. Small wind electric turbines (SWTs) are rarely used for water supply in Kenya.
Information on SWTs and wind data is often inadequate to guide investment decisions. Implementers and
suppliers blamed the high cost of the mounting frame for their low acceptability.
Use of modern sources of energy (solar, wind technology, diesel and grid electricity) in water supplies is
commonly linked to abstraction of groundwater. Grid electricity was dominant source of abstraction
energy in peri-urban areas, and probably for ease of access.
Solar PV was in use across all the ecological zones and predominantly in arid and semi –arid zones,
accounting for 80% of the solar installations observed. Mostly, the surveyed solar systems were small-
sized (up to 81% had less than 1.5 kW). This limited its application to very small communities, ideally with
small head lift requirement. Added to the limited installation skills, varying solar irradiation because of
cloudiness and orientation of modules, it contributes to lower power output and intermittent supply in
Embu and Baringo. On average 46% of boreholes had a safe yield of 4-6 m3/hr or 32-48 m3/day. This is
sufficient for domestic and livestock demand for roughly up to 104 households. In practice, the size of a
community that can be supported by the specific technology setup will depend on the specific water uses
and technology attributes.
There were different uses of water with domestic water at 96%, livestock 74 and 28% for small scale
irrigation. The mean consumption among the surveyed users was 125 litres per HH per day with an
average of 141 and 162 households using one borehole and water pans respectively. Water uses across
the ecological zone with small scale irrigation uptake is 74% in Embu, 15.4% in Baringo, 6.7% in Isiolo and
2.9% in Homabay.
There is general view that solar, wind pumping systems and water pans are inferior technologies suited
only for smaller applications. There is need to demonstrate that solar, wind systems and water pans are
durable and suitable for small and large engineered applications alike.
The following is observed in relation to maintenance and durability of technology deployed for water
supplies:
i. Technology implementers are concentrating on development with minimal or no focus on post-
construction follow up. The poor maintenance that results undermines the credibility of the
technology and the well-being of served populations.
ii. The management capacity of community water committees drops dramatically over time as
trained people lose interest, lack access to skill upgrading or simply move away. More
technologically complex or larger number of users will further increase the management
challenges beyond what communities can handle on their own.
iii. Spare parts, equipment and trained skills for maintenance are difficult to find. Private sector
approaches based on “private operator’ and ‘pay-per use’ are showing potential for delivering

14 | P a g e
technology maintenance in poorer and dispersed communities, but the tested cases are too few
and too young for inference.
E.4 Preference and Equity
Community managed water supplies is predominant in rural and peri-urban areas in all the four counties.
The majority of users expressed satisfaction with the performance of solar technology, while less
contented with the performance of water pan mainly because of the low water quality. User perception
of technology effectiveness was mainly influenced more by its capability to guarantee uninterrupted flow
of water (reliability) than to supply water of acceptable quality. Few complaints were raised in the humid
areas over the limited duration that solar pumping functioned (about 8 hours daily) and low output on
cloudy days.
The utilisation of solar energy has enabled the creation of mini-networks that connected water kiosks and
individuals around the water source. This demonstrates the potential of solar PV systems to increase
convenience and reduce the effort required to collect water.
Selected technologies triggered inclusion, participation and spread of benefits to both men and women.
Nonetheless, the youth were disproportionately disadvantaged, as they are rarely involved in the planning
and management of water supply systems.
Water investments especially in the rural and peri-urban areas are routinely guided by available finances
and resources. This tends to compromise on size and capacity of technology developed. Precondition of
10-30% capital co-contribution by communities further limits the potential of large scale application of
selected technologies and subsequently the impact of these investments.
E.5 Capital, Operation and maintenance cost
Water supply projects in rural and peri-urban areas experienced most serious challenge in operation,
maintenance and cost recovery aspect. More than often, the user community collected and managed
tariffs but often inadequate for O&M operations.
Capital cost for rural and low-income water supplies technologies are small with 87% of all technologies
surveyed costing less than Ksh 10 million, and 53% costing less than Kshs 1 million. The average cost of a
borehole surveyed is Ksh 3.45 million, while water pans had an average capacity of 17,800 m3 and cost
Ksh 5.4 million.
Most projects in rural and peri-urban areas are funded by donors and government. Donors and NGOs
contributed to capital investment in 48% of the technologies at an average 80.5% of the capital cost. The
government on the other hand was involved in financing 46% of these technologies, contributing 76% of

15 | P a g e
the reported CapEx. Overall, the beneficiary communities contributed on average 19.5% of the total cost
but up to 30% in some instances.
Post-construction maintenance (equipment breakdown, lack of spare parts, burst and leakages, siltation,
embankment failure, and unreliable source of pumping energy) was considered by managers to represent
53% of the challenges experienced with the technologies´ application. The O&M coverage is 52%. Energy
cost is significantly high representing up to 50% of the O&M cost and up to 96.5% of the revenue
collected. This would leave the water management committees with little or nothing to maintain or
expand the water supply system.
E.6 Market Risk and PPP Potential
Inferior quality and substandard products, poor service condition, limited financial capabilities, low
demand and local preferences are the main risks contributing to low technological base in rural and peri-
urban water supply. These risks constrain the value adding potential linked to the development of low
cost green technologies. Inadequate project planning, construction quality control, and poor catchment
condition has contributed to neglect of O&M has contributed to lowering the functioning and
sustainability of the technologies, and eventually in loss of the entire investment.
Increase in substandard product and wide variety of technology brand becomes problematic for
professional maintenance. Maintenance providers are confronted with high unit costs associated with
serving sparse populations in regions with poorly maintained roads. Nonetheless, with technological
advancement adequate management and monitoring mechanisms are possible taking advantage of
improved mobile telephony and IT backbone.
The high density of unregulated alternative water supply sources often kinked to the grant character of
rural and low-income water investments has negatively impact of payment behaviour and contributed to
a weak or inexistent financing mechanism. Inadequate revenue owing to insufficient capacity to collect
and account for revenue was recurrent in all the four counties. This limits creditors’ confidence in the
likelihood of water supply business to generate steady future revenue.
Full recovery of capital costs through user fees is rare. Widespread capital investment by private
enterprises and entrepreneurs remains unlikely without external subsidies. The few people served by the
technology and low water consumption do not create requisite ingredients for generating sufficient
revenues. Rural and peri-urban communities lack economic diversity owing to the nature of their
livelihoods, which in return limits their capacity for loan re-payment. This challenge may be overcome by
clustered management of technology and stimulating activities that simultaneously improve livelihoods
and water demand.
Figure E-1 describes how PPPs could assist in addressing the problem of low coverage, low quantity and
low reliability in rural and peri-urban water supplies. PPPs can play a greater role in injecting sufficient
fund for water development and support in maintenance thus ensuring effective service delivery in these
areas.

16 | P a g e
E.7 Summary and Recommendations
Rural water supply present diverse problems ranging from; low coverage, poor management, neglect in
O&M component, lack of technical skills, poor designs and constructions and poor attention to renewal of
existing infrastructure. These challenges more than often have resulted to these systems being non-
operational and to greater extent dysfunctional. Low cost green technologies if well planned and designed
provide innovative solution to these problems and therefore provide an impetus for improved service
delivery in rural and peri-urban areas. These green technologies compared to conventional technologies
have low recurrent costs and their deployment is therefore likely to free more resources towards
maintenance and management, thus guaranteeing their sustainability.
The following recommendations support successful deployment of the selected technologies:
i. Social groups and long-term sustainability of markets need to be taken into account in design of
financial instruments to support storage structures and solar pumping systems.
ii. Consideration of climate change impacts should be made explicit requirement in planning for
rural water supplies.
Figure E-1: How PPP can help infrastructure delivery (source, Private Sector Provision of WSS in rural areas WSP-World bank, 2016)

17 | P a g e
iii. Operation and maintenance is central to ensuring technology sustainability. High recognition of
this need may entail developing a management model to deploy requisite skills and/or post
implementation support units at the county level
iv. Urgent measures are needed to bring rural water supplies under regulation, and to support viable
commercial operations in complement with community roles for water supply management. This
may include clustering measures to create water demand
v. Explicit effort is required to develop capacity and ensure that qualified professionals assume
responsibilities for rural and peri-urban water services.
vi. Continuous monitoring of technology performance to providing lessons and planning baseline.
vii. Project designs should address the needs of all social groups within the community and especially
prioritise opportunities for youth employment.

18 | P a g e
PART I

19 | P a g e
1. Introduction
This chapter introduces the background for the feasibility study, its key objectives and presents the structure of the report.
Water supply and sanitation in Kenya are characterized by low levels of access and poor service
provision. Despite the technological leaps and enhanced financial investment in the water sector in the
last decade, progress towards improved access to water and sanitation services is at a staggering low. It
is estimated that 22.2 million or 47%1 of the Kenyan population still lack access to improved water
services, (WSRB, 2016). Water scarcity and climate change exacerbates the difficulty to water access
especially in the Arid and Semi-Arid Lands (ASAL) regions in Kenya. These phenomena are expected to
have significant effects on water safety and security, altering patterns of availability and distribution,
and increasing water contamination.
Furthermore, Kenya sustainable economic growth is threatened by vulnerability to climate change. It is
estimated that 42% of the country´s
GDP and 70% of total employment is
derived from natural resource sectors
namely: water supply, energy,
forestry, agriculture, fishing and
tourism. While climate change will
lead to adverse impacts across all of
these sectors, the water sector stands
apart as particularly vulnerable due
to its supporting role to the other
sectors.
Figure 2 shows the ASALs regions
which forms 83% of the country´s
land surface. These areas together
with peri-urban areas are largely
characterized by low water service
levels. In addition to these areas
having low level of water supply, they
also have poor provision of structures
and limited management skills to
support water services2. The
functionality as well as the
sustainability of rural and peri-urban
1 Other sources indicate standard 59% the difference is the criteria for improved water supply
2 Example, the average access to improved water supplies in five ASAL counties of Garrisa, Isiolo, Marsabit, Wajir and Turkana
is 37% compared to national average of 59% (Global, Aps, Person, & Callejas, 2015)
Figure 2: Arid and Semi-arid areas in Kenya

20 | P a g e
water supplies are key challenges because of high cost of operation and maintenance. The cost of
energy has a direct implication on the quality and price of water services. Many experts have suggested
that technologies such as solar, wind, and small-scale hydropower are not only economically viable
sources of energy for water supply but also ideal for supply in disadvantaged areas (Kamp & Vanheule,
2015).
With the foregoing in mind, Water Services Trust Fund (WSTF) requested for technical assistance from
the Climate Technology Centre and Network (CTCN) to catalyse low cost green technologies3 for
sustainable water service delivery in Northern Kenya and peri-urban areas. UNEP-DTU Partnership (UDP)
was contracted by CTCN for technical assistance to:
(a) analyse the feasibility and sustainability of the deployment of three low-cost green technologies
for improving water services for household consumption, irrigation, in underserviced ASALs in
Northern Kenya and in peri-urban areas;
(b) Analyse private sector engagement potential in their deployment.
Hence, the specific objectives of the technical assistance are to:
i. Determine the technical, economic and social feasibility of three water technologies for the
targeted areas, through a feasibility study entailing in-depth primary and secondary data
collection and analysis.
ii. Identify potential private sector actors and Public Private Partnerships (PPP) within the water
sector for the deployment of green water technologies.
iii. Develop a PPP business model in collaboration with relevant stakeholders and build their
capacity to engage in PPP.
iv. Develop a concept note to trigger future funding i.e. to enable piloting of technologies,
supporting implementation of PPP.
1.1. Study Objectives
The present feasibility study identifies the contextual features that allow use or limit the viability of selected technologies in areas (counties) with less developed infrastructure, in the wider view of sustainable water supply. The objective of the feasibility study is thus to assess the technical, economic and social feasibility of three water technologies for the targeted areas, through in-depth primary and secondary data collection and analysis.
Specifically, the feasibility includes an analysis of the: i. Technical feasibility (types of technologies, durability, viability and materials required, skills
and knowledge, potential providers). ii. Economic Feasibility (cost effectiveness, price of materials, operation and maintenance
costs, current demand and supply, cost recovery, financing) iii. Social feasibility of the chosen technologies (potential to create employment, social
acceptability, awareness attitude and perception of the technology, land use patterns, gender and governance issues)
iv. Risks, sustainability and reliability potential of these green technologies.
3 Green technology encompasses a continuously evolving group of methods, materials and systems for generating services while
conserving the natural environment and resources and/or mitigate or reverses the effects of human activity on the environment:

21 | P a g e
The feasibility study and subsequent implementation of the CTCN technical assistance contributes to WSTF’s strategic objective of “financing sustainable water and sanitation services in underserved rural and urban areas” (WSTF, 2014) and contributes to national priorities and planned development programs in the water and environment sectors in Kenya.
The feasibility report will follow the following structure;
PART I
Chapter 1: Introduction; this chapter introduces the water supply situation in Kenya with main focus on the rural and peri-urban setup. The study background and objectives are outlined in this chapter.
Chapter 2: Conceptual Framework; the chapter outlines the study framework which includes; description of sampling, data collection and assessment methods adopted for this study. The chapter outlines a brief exploratory description of Field Data.
Chapter 3: Study Areas; this chapter explains the choice of study areas as a representative of different agro-climatic zones in Kenya. Chapter 4: Water and Green Growth; this chapter outlines water challenges in Kenya in the wake of climate change. It delineates the historical behaviour of the selected technologies
Chapter 5: Overview of the selected Green Low Cost Technologies; this chapter describes the application of the selected green technologies in Kenya.
PART II
Chapter 6: Capacity, Prevalence and Functioning of Technologies; this chapter describes the technical analysis based on technology reliability, capacity and durability.
Chapter 7: Effectiveness and sustainability of low cost Green Water Technologies; this chapter describe the economic analysis using the cost benefit analysis of the selected green technologies. This analysis is based on the capital, operation and maintenance cost of the different technologies. It provides a comparative analysis on the cost of different technologies observed.
Chapter 8: Analysing Technology Preference and Access; this chapter describe the social analysis of the selected technologies. The analysis here is based on the level of technology acceptance and its ability to promote transformation and inclusiveness across all social groups.
Chapter 9: Technology risks and sustainability Analysis; this chapter describes the possible technology risks that may impact on the deployment of the selected technologies.
Chapter 10: Developing Green solutions for water supply; the chapter highlights various mechanisms that will promote the scaling up of green technology for sustainable water supply.
Chapter 11: Key Messages/recommendations; this chapter filters key lessons through the field study lens and provides a framework for improving quality and coverage of water supply.

22 | P a g e
2. Conceptual Framework and Methodology This chapter presents the stepwise process followed in selecting the target low cost green technologies. It introduces the main research questions, the conceptual framework and methodology applied in the feasibility study.
The feasibility study is based on the hypothesis that low cost green technologies have the potential to sustainably improve access to safe drinking water and sanitation services in Kenya. The study followed a stepwise process assessing the applicability, scalability and sustainability of each selected technology in order to provide lasting services in a specific context. The analysis also addressed the readiness for its introduction. The process entailed the application of quantitative and qualitative methods elaborated in section 2.3 to assess:
- the technical feasibility (types of technologies and materials required, skills and knowledge required and potential technology providers),
- the economic feasibility (cost effectiveness, price of materials, operation and maintenance costs, current demand and supply) and
- the social feasibility (potential to create employment, attitude and perception, land use patterns, gender and governance issues) of the selected low cost technologies.
2.1. Selection of technologies – Technical, social, economic and environmental parameters
The green water technologies were selected from a list of five (5) technologies identified by WSTF when submitting request for assistance.
a) Solar water pumping system
b) Wind powered pumping systems,
c) Sand dams (sub surface rainwater water storage technology),
d) Djabias (Semi-underground tanks with water catchment systems),
e) Water pans (small surface rainwater storage)
The technologies are all low-cost simple technologies involving either renewable energy or enhancing water storage and are appropriate for underserved communities. The five technologies were evaluated and prioritised through a multi-criteria analysis using a combination of weighted criteria based on the following criteria and which will be subject to an in-depth analysis:
i. Priority areas for available funding ii. Cost of technology (initial investment, operations and maintenance) iii. Potential to improve livelihood and grow local economy iv. Availability of requisite skills for installation, operations and maintenance v. Capacity to enhance water quality and quantity vi. PPP potential for the selected technologies vii. Potential deployment across the country, and viii. Potential to reduce emission and increased resilience to climate change and variability
Table 1 and Table 2 indicate the relative technology score for the identified ranking factor and the Weighted Score and Prioritised Technology respectively.

23 | P a g e
Table 1: Relative technology score for the identified ranking factors
Costs Benefits
O&M costs Capital
costs
PPP
Potential
Livelihood
improvement,
employment
and economic
empowerment
Availability
skills to
supply
installation,
running and
maintenance
Potential
deployment
across
country
Capacity
to
enhance
water
quality
Capacity
to
enhance
water
quantity
Potential
to reduce
GHG
emissions
Potential
to
increase
resilience
to climate
change
Technology 1: Solar
water pumping system 8 6 9 9 4 8.5 8 9 10 7
Technology 2: Wind
powered pumping
systems or wind mill 8 5 8 8.5 2 8 8 9 10 7
Technology 3: Sand
dams (run off water
harvesting technology) 9.5 8 4 7 8 5 8 5 5 8.5
Technology 4: Djabias
(Semi-underground
tanks with water
catchment systems) 8.5 8 2 4.5 8 9 3 3 5 6
Technology 5: Water
pans (run off water
harvesting technology) 6 4 6 8 7 7 2 5 5 7

24 | P a g e
Table 2: Weighted Score and Prioritised Technology
Costs Benefits
Tota
l Sco
re
O& M
costs
Capital
costs
PPP
Potential
Livelihood
improvement,
employment,
economic
empowerment
Availability skills
to supply
installation,
running and
maintenance
Potential
deployment
across
country
Capacity to
enhance
water
quality
Capacity
to
enhance
water
quantity
Potential
to reduce
GHG
emissions
Potential to
increase
resilience
to climate
change
Technology 1: Solar
water pumping
system 64 48 72 117 52 34 32 117 130 91 60
2
Technology 2: Wind
powered pumping
systems or wind mill 64 40 64 110.5 26 32 32 117 130 91 55
1.5
Technology 3: Sand
dams (run off water
harvesting
technology) 76 64 32 91 104 20 32 65 65 110.5 47
3
Technology 4: Djabias
(Semi-underground
tanks with water
catchment systems) 68 64 16 58.5 104 36 12 39 65 78 39
4.5
Technology 5: Water
pans (run off water
harvesting
technology) 48 32 48 104 91 28 8 65 65 91 44
1
Criterion weight 13 8 8 13 13 4 4 13 13 13

25 | P a g e
2.2. Research Questions
For a clear understanding of the feasibility study and its objectives, three main research questions were developed in line with the key areas of
analysis (technical, economic and social feasibility):
- Do the identified green technologies provide a functional mechanism for climate proofed water supply?
- Do the identified green technologies provide good value and continuous benefits?
- What are the community attitudes and perceptions towards the three technologies for water supply?
Figure 3: Key result areas and research questions

26 | P a g e
Based on the research questions outlined above sustainability indicators were identified in order to provide a basis for the in-depth analysis. These indicators focus on the functional conditions of the selected technologies which include financial, social, institutional, legal, environmental, technical, and capacity-related aspects, from the perspectives of three key actor groups: (i) users/buyers, (ii) producers/providers, and (iii) regulators/investors/facilitators. For each match of dimension and perspective an indicator was selected and questions developed. Table 3 provides a summary of the sustainability dimensions which are relevant from the perspective of different key actors.
Table 3: Technology adaptation indicators from the perspectives of different actors (adapted from Hostettler & Hazboun 2015)
2.3. Description of sampling, data collection and assessment Methods
In designing this study, the four selected counties were drawn upon the nationally representative
sample within the seven ecological zones in Kenya ranging from humid to very arid shown in Table 4.
Additionally, the study entailed understanding the water supply systems in peri-urban setting in the
selected counties.
The seven agro-climatic zones in Table 4 are categorised using a moisture index (Sombroek, Braun, &
van der Pouw, 1982) based on annual rainfall, which is expressed as a percentage of the potential
evaporation. Areas that are categorized as zones I, II and III have an index greater than 50% and are
considered zones good for cropping; they account for 12% of the country land. Zones V, VI and VII are
considered to be ASALs regions which have an average rainfall of < 900 mm, accounting for 83% of the
land.
Perspectives of Key Actors
User/buyer Producer/Provider Regulator investor facilitator
Sust
ain
abili
ty D
imen
sio
ns Social 1) Demand and
preference of the technology
2) Technology uptake 3) social marketing and equitability
Economics 4) Affordability / Price 5) Cost recovery/ Profitability
6) Public Benefit (priorities)
Environmental 7) Water quality 8) Resilience of water supply
9) Reduce vulnerability, impact on health
Legal and Institutions
10) Responsive to needs and users friendly
11) Model of delivery, access level
12) Alignment laws/policy/strategies
Skill and Knowledge
13) Ease to use and manage
14) Skills for operation and maintenance
15) Capacity for monitoring, evaluation and technology validation
Technological 16) Capacity, reliability to meet demand
17) durability , serviceability
18) Deployment/ up-scaling technology

27 | P a g e
Table 4: Classification of Agro-climatic zones, (Country Pasture/Forage Resource Profiles (Kenya) n.d.)
Agro - Climatic Zone
Classification Moisture Index (%)
Annual Rainfall (mm) Land Area (%)
I Humid >80 1100-2700 12
II Sub-humid 65 - 80 1000-1600
III Semi-humid 50 - 65 800-1400
IV Semi-humid to semi-arid 40 - 50 600-1100 5
V Semi-arid 25 - 40 450-900 15
VI Arid 15 - 25 300-550 22
VII Very arid <15 150-350 46
Further, study areas within these counties were identified through cluster sampling through the use of administrative and electoral boundaries. The electoral wards within each county were listed and used as the basic clusters. The study clusters were then randomly selected from the list of electoral wards. Once the study clusters were identified snowball sampling technique was used to identify particular technologies. Technology operators in the identified points responded to the water manager survey questionnaire whereas randomly selected users at the water point responded to the water user survey questionnaire.
The data and information needed was collected through secondary data collection (e.g. extensive desk studies including scientific articles, reports etc.) and primary data collection through structured and semi-structured interviews, key informants interviews and focus group discussions (see. Annex 5). The use of mobile application in the collection of data ensured few data error as well as reducing time lag between data collection and data entry. Use of varied survey tools (Water Managers survey questionnaire, Water user survey questionnaire, Key informant interviews and focus group discussions) allowed for triangulation of data enhancing the quality of data collected.
Summary of the research design
The Table 5 summarises the study research design. It highlights various sources of data, data collection
and analysis method

28 | P a g e
Table 5: Summary of study design
Research question Specific Result Area Source of Data Data collection
techniques/tools
Data Analysis Interviewees
Do the identified
technologies provide
functional mechanism for
climate proofed water
supply?
Assessing Technology
Durability
- Water sector stakeholders (MoWI, county
Governments, WSPs)/partners(NGOs, CBOs,
donors)/ beneficiaries
- WSTF and other Water sector institutions
- Documents
Literature review, Survey
questionnaire, Key Informant
Interviews (KIIs), SSI, Focus
Group Discussions (FGDs),
observation
- Frequencies for quantitative data
Selected stakeholders
(County Government,
WSPS, MoWI, MENR, NGOS,
CBOs, WRMA, WASREB,
WRUAs)
Assessing Technology
reliability
- Water sector stakeholders/partners/
beneficiaries
- WSTF and other Water sector institutions
country programs document
- thematically for qualitative data
Assessing Technology
capacity
- Water sector stakeholders/partners/
beneficiaries
- WSTF and other Water sector institutions
country programs document
- graphical and contingency table for
Categorical, ordinal and interval
data
Do the identified green
technologies provide good
value and continuous
benefits?
Assessing Technology cost
effectiveness
- Water sector stakeholders (technology
supplies for water pans, wind and solar
pumps/partners/ beneficiaries
- Capital cost O&M plans (if available) services
Literature review, survey
questionnaire, KIIs, SSI, FGDs
- SPSS for quantitative data
- graphical and contingency table for
Categorical, ordinal and interval
data
Water Committee and
technology caretakers,
technology suppliers,
technology financiers
Assessing Technology
sustainability
- Water sector stakeholders/partners/
beneficiaries
Literature review, survey
questionnaire, KIIs, SSI, FGDs
- graphical and contingency table for
Categorical, ordinal and interval
data
What are the community
attitudes and perceptions
of specific technology for
water supply?
Assessing Technology
acceptability
- Community water committees, beneficiary
community
User survey questionnaire, KIIs,
FGDs, observation,
KIIs, FGDs, observation
- Graphical and contingency table for
Categorical, ordinal and interval
data
- thematically for qualitative data
Technology beneficiaries,
technology user
Assessing Technology
outcomes and emerging
impact (transformative)
- Community water committees, beneficiary
community
- graphical and contingency table for
Categorical, ordinal and interval data
Assessing the technology
ability to influence
community inclusiveness
- Community water committees, beneficiary
community
- thematically for qualitative data

29 | P a g e
2.4. Exploratory Description of Field Data
Field data was collected from the four selected counties to represent different ecological zones in Kenya. In total, 87 technological points were part of the survey using the Water manager tool and an additional 27 points were collected from the case study tool4, totalling 105 technology points. Interviews were conducted with 87 technology managers, 133 users and 20 key informant interviews and focus group discussions were conducted in the field. Table 6 shows the distribution of respondents across the study areas. The users were selected randomly from people found at the technology points and of the 133 interviewed, 51% of the users were male and 49 % were female.
Table 6: Distribution of Survey respondents per county
Co
un
ty
Tech
no
logy
po
ints
Wat
er
Man
ager
s
Use
rs
KII
Cas
es
stu
die
s
No
. of
surv
eyed
War
ds
Human Population(2009
census)
County Total Population
Density
Embu 30 27 42 4 5 3 538,355 183.2
Baringo 24 20 26 7 3 4 555,561 50.4
Isiolo 27 21 30 5 8 3 143,294 5.7
Homabay 24 19 35 4 11 4 1,038,858 302.8
Total 105 87 133 20 27 14 2,276,068
48% of the technology points visited were located in semi-humid to semi-arid areas, while 29% were located in arid areas. 82% of the technologies surveyed were installed after the year 2000. The most prevalent water source from the visited technology points was boreholes.
Table 7 shows the distribution of survey point by ecological zones in each county.
Table 7: Distribution of technology survey point by ecological zones per county
County
Total % Embu Baringo Isiolo Homabay
Humid 3
3 3.5%
Sub humid 1 2
3 3.5%
Semi Humid 2 1
5 8 9.2%
Semi Humid to Semi-Arid 21 1 6 14 42 48.2%
Arid
16 15
31 35.6%
Total 27 20 21 19 87 100%
31% 23% 24% 22%
4 Case study tool was a template developed to capture any intriguing features of water supply system in the study
areas during the data collection process. The tool assists in systematic capture of information which cannot be fully answered by the questionnaires

30 | P a g e
3. Study Areas This chapter explains the rationale behind the choice of the counties of Baringo, Isiolo, Embu and Homabay - representing different agro-climatic zones in Kenya - and provides a brief introduction to all four counties.
Kenya has climatic and ecological extremes with altitude varying from sea level to over 5000 m in the
highlands. The mean annual rainfall ranges from < 250 mm in semi-arid and arid areas to > 2000 mm in
high potential areas. Agriculture is the most important economic activity in Kenya and represents more
than 26% of gross domestic product, with 75% of the country's population depending on agriculture for
food and income generation. Approximately 1/3 of the country’s land area is agriculturally productive
which includes the lake, coastal and highland regions. The other 2/3 of the land area is semi-arid to arid
which are largely characterized by low, unreliable and poorly distributed rainfall. The ASALs areas are
normally used for livestock production with livestock production contributing to 26% of Kenya’s
agricultural production5.
Four counties were selected to represent the different agro-ecological zones in Kenya, with priority
given to counties identified for WSTF investment programmes funded by the EU and Danida, as these
are likely to benefit directly from the results of this study. Table 8 below represents the target counties
based on the various ecological zones, the technologies available and WSTF interventions.
Table 8: Selected Counties for the field Survey
Select
County
Zones covered
Available technologies WSTF Interventions Humid
Semi-
humid
Semi -
Arid Arid
Baringo
3 Technologies (Solar, Wind& Water
pans) European Union
Isiolo
3 Technologies (Solar, Wind& Water
pans) Green growth
Embu
3 Technologies (Solar, Wind& Water
pans)
Peri urban
experience
Homabay 2 Technologies( Water pans & Solar)
Peri urban & PPP
experience
5 http://www.fao.org/ag/AGP/AGPC/doc/Counprof/Kenya.htm

31 | P a g e
Baringo County Baringo County covers an area of 11,015 km2 with a population of 555,561 as per the 2009 census. The climate in the county varies from humid in the highland areas to arid in the lowlands. 24% of Baringo county residents use improved water sources but of these 6% are within the services of licenced areas of utilities (Water Services Regulatory Board (WSRB), 2016) . Most of the land is under community trust holding. 30% of the land has been demarcated and ownership deeds issued. Climate change is generally characterised by increased warming and recurrent droughts. Extreme effects of climate continue to impact on the county´s ability to provide sustainable water supply to its urban and rural populations. Embu County Embu County covers an area of 2,818 Km2 with a population of 516,212, according to the 2009 population census. Embu County depicts the typical agro-ecological profile of the windward side of Mt. Kenya of cold and wet to hot and dry lower zones in the Tana River Basin. The average rainfall in the upper areas is 2000 mm and 600 mm in the lower areas. The county plays a major role in the national energy sectors as it hosts the seven-folk project that contributes 45% of the country’s electricity. 68% of Embu County residents use improved sources of water although 84% of the county population are within services areas of licenced water utilities (Water Services Regulatory Board (WSRB), 2016). 59.6% of land parcels in the county have title deeds. It’s generally perceived that the county has experienced its share of climate change through increased drought periods, erratic weather patterns and increased temperature, especially on the lower areas of the county.
Homabay County
Homabay County covers 3,183 km2 with a population of 963,794 persons according to the 2009 population census. The county is divided into two ecological zones namely the upper and lower midland with an equatorial type of climate. The county average annual rainfall ranges from 700 to 800 mm. 28%
Figure 4: Study Areas

32 | P a g e
of residents use improved sources of water, with the rest relying on unimproved sources. The population within service areas of utilities is at 14% (Water Services Regulatory Board (WSRB), 2016). 48% of the land owners in Homabay have been issued with title deeds. Climate change in Homabay County is generally characterised by declined stock of fish, drying up of water sources and erratic rainfalls. Further, environmental degradation across the county has resulted in loss of productivity of land affecting crop production, income levels and food insecurity within the county.
Isiolo County
Isiolo County has an area of 25,700 Km2 with a population 143, 294 according to the 2009 census. There are three main ecological zones in the county: semi-arid, arid and the very arid. The semiarid zone maKsh 5% of the county and is characterised by an annual rainfall of between 400 – 650 mm. The arid zone is 30% of the county area with an annual rainfall of 300 to 350 mm. The very arid zone covers the largest county area (65%) and is characterised by annual rainfall of 150 to 250 mm, hot and dry weather and barren soils throughout the year. 59% of residents have access to improved sources of water of these 21% are within the service areas of registered utilities (Water Services Regulatory Board (WSRB), 2016). Isiolo is one of the counties considered to be most vulnerable to climate change in Kenya. Some of the vulnerabilities resulting from climate change are unpredictable rainfalls, floods, droughts, loss of forest and wetland ecosystems and scarcity of potable water.

33 | P a g e
4. Water and Green Growth
This chapter presents the key challenges related to water resources management in Kenya and introduces the climate risks affecting the water sector, as well as the historical, policy and legal context relevant for this sector
4.1. Situational and historical context Water scarcity is a serious issue in Kenya influenced by political dynamics, natural availability of water,
population and poor governance. In
addition there is insufficient capacity,
neglect of the water resource base and
lack of accountability. Water scarcity is
further exacerbated by the profound
impacts of climate change on water
resources threatening water access,
availability and quality. Figure 5 shows
that water service coverage has
generally remained very low (53% in
2015), (Water Services Regulatory Board
(WSRB), 2016), especially in rural areas
and peri-urban areas ( 49%) (WASREB,
2014).
The First National Water Master Plan in
1974 stimulated development of many
schemes under the provincial (regional)
water and sanitation programmes with the goal of “Water for all by 2000”. The official effort was
complemented by non-programmatic community and self-help action6 championed soon after
independence to deliver social services in education, water supply and health. Water services coverage
grew rapidly mostly in what was considered as high potential areas7, in the central and eastern highland,
rift valley and the Lake Victoria basin. By 1998, over 1800 water supply systems under the management
of various providers were reported, in addition to privately run sources supplying to the public schemes
(MWI, 2015). However, the system turned out to have several weaknesses, particularly with regards to
6 An estimated 2500 water, health and education facilities were developed in the first two decades of the independence, which
accounted for approximately 30 % of the rural development investment. Though harambee was a popular tactic to hasten the rural development after independence, many of the harambee projects were expected to be taken over by the government after completion, and sustainable plans for operation and maintenance were not made. Besides Harambee projects were gradually inclined to political patronage and means of gaining influence. Moreover and owing to the unstructured nature of the harambee investment, weak control and lack of accountability made them vulnerable for corruption and mismanagement. 7 High and medium potential areas in Kenya refer to region with a combination of moderate temperatures, rainfall between
1200 and 2000 mm per annum and productive soils. Generally, these areas correspond to agro-ecological zones I, II and III. They are considered as best suited for intensive agriculture and livestock husbandry, hence the notion of high potential.
Figure 5: Trend in Water and Sewerage coverage, (Water Services Regulatory Board (WSRB), 2016)

34 | P a g e
sustainability. In most cases, projects quickly deteriorated after the handover to the communities. In
some regions the actual number of people with access to water services decreased(Danida, 2010).
Coupled with the rapidly growing population, the number of people without water services remained
high.
The first attempt to address this challenge in the 4th Development Plan (1979-83) diversified roles and
responsibilities to beneficiaries, introduced costs sharing in public services, privatized some government
functions and removed government subsidies in addition to financial cuts from social programmes. The
“District Focus for Rural Development”, promulgated in 1983, decentralised the planning and
administration to lower levels of government and in 1986, water service provision was decentralised to
local authorities and communities. The after period witnessed very low levels of investment and
efficiency in water management. The local authority and community that managed water supplies
suffered from neglect of operation, inadequate revenue collection, corruption, over extension of water
supply systems and lack of renewal construction. This situation led to an almost total collapse of
monitoring systems. The 1992 delineation study on the Water sector in Kenya (Water and Sanitation
Program-Africa, 2007) concluded that the government was unable to operate water supplies efficiently
and to maintain adequate service level due to financial constraints.
In 1999, Kenya embarked on a radical water sector reform aimed at improving the state of water
services and water resource management. Distinct water sector institutions were created separating the
water resources management and water services roles on the one hand, and policy, regulatory and
implementing roles on the other. The Water Services Trust Fund was established with the aim to finance
and operationalize a system that enhances attention to pro-poor water services.
With the implementation of the water reforms, a positive trend has been noted in the critical service
provision factors, namely financial investments, improved performance by water utilities and the
orientation towards demand. This also included a marked orientation towards the underserved and low
income areas. However, by the time the water sector reforms started water development had been
broken up into numerous programmes and segments including rural, minor urban water supplies,
livestock water supplies, national and community irrigation schemes, self-help supplies. With so many
actors involved in the provision of water, there has been great need to coordinate activities by the
various players for integrated water development.
Today, the main challenge is to provide water services to more 22 million underserved communities
mostly living in rural and densely populated low-income urban areas. With an urbanization rate of 4.28
%, there is an influx of nearly half a million people in towns every year (Water Services Regulatory
Board (WSRB), 2016).
Water coverage illustrated in Figure 5 has remained stagnant in the face of pressure exerted by growing
population, implying the need for more investment. The state of water coverage implies the target of
80% coverage by 2015 set by the National Water Services Strategy (NWSS) was not reached. On average
14,000 new connections were developed annually in the last 4 years compared to 200,000 connection
yearly that are required to achieve the 2030 water supply targets. The latter is fifteen-fold over the
present achievement, (Water Services Regulatory Board (WSRB), 2016).

35 | P a g e
4.2. Water and Climate Risk
Kenya is a generally water scarce country with about 83% of the country being arid and semi-arid. The
average annual rainfall in Kenya is 630 mm with a wide variation from less than 200 mm in Northern
Kenya to over 2000 mm in the central highlands and Lake Victoria region. Kenya's population in 2016,
extrapolated from the 2009 census is estimated to be 47.3 million people in 2016, roughly distributed
according to rainfall endowment. This reality underscores the importance of reliable of water supplies
for economic development and livelihoods.
It is estimated that 42% of Kenya´s GDP and 70% of overall employment is derived from natural resource
related sectors including agriculture, energy, mining, water supply, forestry and tourism, (GESIP, 2015).
While climate change will lead to adverse impacts across all of these sectors, the water sector stands
apart as particularly vulnerable due to its supporting role to the other sectors. These include flooding,
drought, drying up of rivers, poor water quality in surface and groundwater systems, precipitation and
water vapour pattern distortions. These effects when compounded together have devastating impacts
on ecosystems and communities, ranging from economic and social impacts to health and food
insecurity, all of which threaten the continued existence of many regions in Kenya.
Figure 6: Mean Annual Rainfall Vs population density in Kenya

36 | P a g e
Water supplies in Kenya are hugely dependent on the five water towers of Kenya8. Extreme climate
change events in combination with population growth and environmental degradation are already
changing the water cycle that in turn affects water availability and runoff, and may thus affect the
recharge of rivers across Kenya. Kenya’s renewable water resources are estimated at 20.2 km3 per year
which correspond to 647 m3 per capita9 in 2000, which is considered very low and likely to decrease with
climate change. Access to water is most difficult in arid and semiarid regions of Kenya where livelihoods
are derived from livestock keeping. Any reductions in surface run-off are likely to impact negatively on
pastoral livelihoods through the drying of water sources. On the other hand, rural-urban migration,
mostly to peri-urban areas, has accelerated pressure on water resources. An increased incidence of
droughts under climate change is likely to increase rural-urban migration and confound urban
vulnerability. It is estimated that 32.3% of Kenyans were living in urban centres in 2015, which is
projected to increase to up to 50% by 2025 (Kenya National Bureau of Statistics (KNBS), 2012).
Kenya’s National Climate Change Response Strategy highlights that observed temperature trends
between 1960 and 2006 indicate warming over land in all locations except for the coastal zone. The
minimum temperature has risen by 0.7 – 2.0 o C and the maximum by 0.2 – 1.3 o C. (Government of
Kenya, 2013; Trócaire, 2014). Observational evidence shows that the frequency of dry years is increasing
while rainfall has declined significantly since the mid-1960 (Table 9). In addition drought cycles have
become shorter, reducing over the years, from every 5-7 years to every 2-3 years.
Table 9: Droughts in Kenya since 1960's, (Masih, Maskey, Mussá, &
Trambauer, 2014)
Year Number of people affected
1965 16000
1971 20000
1979-80 40000
1983-84 200000
1991-92 1.5m
1995-96 1.4m
1999-2000 2.23m
2003-04 2.23m
2006 2.97
2009 3.79m
2011 3.75m
2014-16 1.6m
8 Kenya main water towers - the Aberdare Mountains, Mau forest complex, Mount Kenya, Mount Elgon, and the Cherangani
Hills are high-elevation forests that are the source for most of the water. Though they cover less than 2% of the country surface area, they are vital national assets in terms of climate regulation, water storage, recharge of ground water, river flow regulation flood mitigation, reduced sediment flow to water bodies and carbon sequestration. The 5 water towers are significant to Kenya’s key economic sectors including tourism, energy, agriculture and water supply to rural and urban. 9 Per capita water endowment is the average annual renewable freshwater availability. Kenya’s per capita of 647 m
3 which is
frequently cited in several documents refers to year 2000 estimates based in a population of 31,065,820. The estimated population at the end of 2016 was 47,251,449 which translate to 427 m
3 per capita. The term water scarce and chronic scarcity
are used when annual renewable freshwater availability fall below 1000 m3 and 500 m
3 per capita

37 | P a g e
Climate change and variability is affecting Kenya like many other countries, through disrupting national
economies and livelihoods. Table 9 further shows the increasing burden of drought hazard in Kenya.
Sustainable development goal 13 calls on countries to “take urgent action to combat climate change and
its impacts”. Attaining this goal requires adoption of affordable, scalable solutions that will enhance
resilience of their economies. The pace of change is accelerating therefore providing an opportunity to
embrace a low-carbon economy, and implement a range of measures that will reduce emissions and
increase adaptation efforts.
4.3. Policy, Legal and institutional structure
The Government of Kenya has responded to various national and international climate challenges
through the enactment of various policy, legislation and strategies to address them and meet
international obligations. Kenya has completed its National Climate Change Response Strategy (NCCRS)
and National Climate Change Action Plan (NCCAP). There is on-going effort to embed climate change to
governance in different sectors dealing with management of climate sensitive natural resources.
4.3.1. Constitution of Kenya
Chapter 11 of the Constitution of Kenya (CoK) 2010 provides for a devolved system of governance aimed
at promoting a democratic and accountable exercise of power, the equitable sharing of resources and
responsive and effective delivery of services, while empowering citizen’s participation through the
process. The system created a two-tier level of government leading to creation of 47 counties led by
elected county governments. Each level has its own set of functions which though distinct, require co-
operative inter-relationships in the exercise of their functions. The Constitution under the Bill of Rights,
Article 43 recognizes that access to safe and sufficient water in adequate quantities simultaneously with
clean and health environment a basic entitlement. The provision of water and sanitation services and
the implementation of national polices on natural environment are two such key roles and
responsibilities bestowed on the County Government under CoK 2010. This includes addressing the
challenges of water governance including the problems of water shortage, flooding, drought, and water
related epidemics that are experienced across the country. In guaranteeing these rights the constitution
provides a platform for the development of adaptation and mitigation policies, strategies and
legislations by itself, and in furtherance to water and sanitation service objectives.
4.3.2. Vision 2030
Sessional Paper Number 10 of 2012 entrenches Kenya Vision 2030 as the long term development
strategy for Kenya. The Kenya Vision 2030 aims to transform Kenya into a modern, globally competitive,
middle income country providing a high quality of life to all its citizens. The broad key priority areas of
the Second Medium Term Plan (MTP II) of Vision 2030 include:
- employment creation,
- development of human resource through expansion and improvement in quality education,

38 | P a g e
health and other social services,
- reducing the dependence of the economy on rain fed agriculture through expansion of
irrigation;
- higher investment in alternative and green sources of energy;
- improving the economy’s competitiveness through increased investment and modernization
of infrastructure;
- Increasing the ratio of saving, investment and exports to GDP.
The Vision 2030 has therefore incorporated and entrenched measures for climate change adaptation
and mitigation.
4.3.3. Water Policy and Water Act 2016
The Sessional Paper No. 1 of 1999 on the national policy on water resources management and
development took cognizance of multiple use of water as a way of providing opportunities for poverty
alleviation. Towards effective implementation of these strategies it created the need for an effective
institutional framework to achieve systematic development, and general management of the water
sector. The water resource management authority10 was established to support judicious use of
resources through effective management of river basins and contribute to soil and water conservation
innovations. Furthermore, the policy recognized the role of rural communities living in critical
catchments and gives them an essential part in decision-making. The policy was operationalized in most
parts by the Water Act of 2002. The succeeding legislation Water Act 2016 aligns with the Constitution
of Kenya 2010 in regard to water rights, and consolidates the gains over the past 15 years of the Water
Sector reforms which include;
• Subsidiarity and decentralization – In line with the government’s overall decentralization policy,
decisions in the water sector are made at the lowest appropriate level, making sector
institutions more autonomous. For example, water utilities have been transformed into
autonomous, registered and regulated shareholder companies, owned by the counties.
• Separation of service delivery, policy formulation and regulation to achieve higher efficiency and
transparency.
• Increased equity achieved by aligning the sector with the human right to water and sanitation
and by adopting a pro-poor approach in sector policies and strategies.
• Transparency and accountability measures include efforts by sector institutions reporting
regularly to the public and by stronger enforcement of regulations and complaint mechanisms.
• The participation and empowerment of water users and consumers through Water Resources
Users Association (WRUAs) and Water Action Groups (WAGs) and mechanisms such as public
hearings at community level.
10
Renamed Water Resources Authority in the Water Act 2016
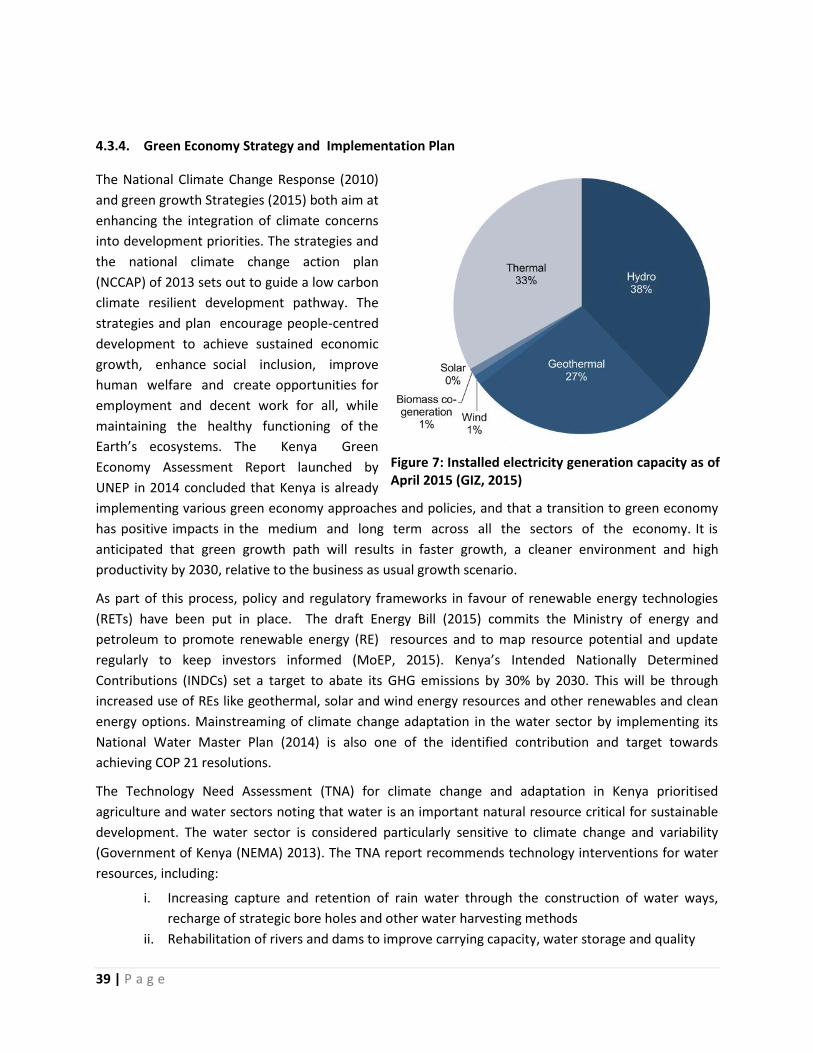
39 | P a g e
4.3.4. Green Economy Strategy and Implementation Plan
The National Climate Change Response (2010)
and green growth Strategies (2015) both aim at
enhancing the integration of climate concerns
into development priorities. The strategies and
the national climate change action plan
(NCCAP) of 2013 sets out to guide a low carbon
climate resilient development pathway. The
strategies and plan encourage people-centred
development to achieve sustained economic
growth, enhance social inclusion, improve
human welfare and create opportunities for
employment and decent work for all, while
maintaining the healthy functioning of the
Earth’s ecosystems. The Kenya Green
Economy Assessment Report launched by
UNEP in 2014 concluded that Kenya is already
implementing various green economy approaches and policies, and that a transition to green economy
has positive impacts in the medium and long term across all the sectors of the economy. It is
anticipated that green growth path will results in faster growth, a cleaner environment and high
productivity by 2030, relative to the business as usual growth scenario.
As part of this process, policy and regulatory frameworks in favour of renewable energy technologies
(RETs) have been put in place. The draft Energy Bill (2015) commits the Ministry of energy and
petroleum to promote renewable energy (RE) resources and to map resource potential and update
regularly to keep investors informed (MoEP, 2015). Kenya’s Intended Nationally Determined
Contributions (INDCs) set a target to abate its GHG emissions by 30% by 2030. This will be through
increased use of REs like geothermal, solar and wind energy resources and other renewables and clean
energy options. Mainstreaming of climate change adaptation in the water sector by implementing its
National Water Master Plan (2014) is also one of the identified contribution and target towards
achieving COP 21 resolutions.
The Technology Need Assessment (TNA) for climate change and adaptation in Kenya prioritised
agriculture and water sectors noting that water is an important natural resource critical for sustainable
development. The water sector is considered particularly sensitive to climate change and variability
(Government of Kenya (NEMA) 2013). The TNA report recommends technology interventions for water
resources, including:
i. Increasing capture and retention of rain water through the construction of water ways,
recharge of strategic bore holes and other water harvesting methods
ii. Rehabilitation of rivers and dams to improve carrying capacity, water storage and quality
Figure 7: Installed electricity generation capacity as of April 2015 (GIZ, 2015)

40 | P a g e
iii. Structures and technologies to ensure availability of water during the dry season, and
iv. Protection of water towers
The importance of functional and sustainable water storage structures is thus clearly emphasised.
Kenya’s (Draft) National Water Harvesting and Storage Management Policy (MW&I, 2010) proposes to
raise the water storage capacity from the current 124 Mm3 to 4.5 Bm3, which is equivalent to a per
capita storage of 5.3 m3 to 16 m3 by 202511. This will require the development of additional 340 Mm3 of
water storage per year, (Government of Kenya 2013).
4.3.5. Climate Change Act, 2016
This Act provides a framework for action that promotes low carbon, climate resilient development in
Kenya, and is an important milestone on the country’s path towards developing its economy while
simultaneously reducing greenhouse gas emissions. Specifically, the outcomes will include among
others:
mainstreaming climate change responses into development planning, decision making and
implementation
promoting low carbon technologies to improve efficiency and reduce emissions intensity
providing incentives and obligations for private sector contributions to achieving low carbon
climate resilient development
Existing policies and legislation are not explicit in mainstreaming climate change in water services and
water management issues. In addition, there is need for a comprehensive implementation framework
and funding structure to ensure that investments achieve both water services improvement while at the
same time addressing climate vulnerability across different agro-ecological regions.
4.3.6. Institutional framework
The Ministry of Environment and Natural Resources (MENR) is responsible for the management of
climate change response in the country through the National Climate Change Secretariat (NCCS). The
NCCS leads the development and implementation of climate change policies, strategies and action plans.
These include the National Climate Change Action Plan (2013-2017) which implements the National
Climate Change Response Strategy (2010). The Ministry of Water and Irrigation facilitates sustainable
management and development of water resources for national development for climate change
mitigation and adaptation in consistence with the water sector strategies.
The Ministry of Planning and National Development is leading in the process of mainstreaming climate
change into national plans including the mid-term plans under the vision 2030. Environment and Climate
Change Units have been established in all sectors that are highly vulnerable to climate change. The
Environment and climate change unit is expected to tackle the issue of climate change at national and
county level in light of concurrent jurisdiction for environmental conservation across both levels.
11
Assuming population of 55 million by 2025 4.5 Bm3 translates to 88m
3 per capita storage

41 | P a g e
Water Services Trust Fund (WSTF) is a state agency with a mandate to mobilise finance for the provision
of water services to the underserved areas in Kenya. WSTF’s strategic objective of “financing sustainable
water and sanitation services in underserved rural and urban areas” (WSTF, 2014) contributes to
national climate change priorities and planned development programs in the water and environment
sector in Kenya.
4.4. Development of low cost-technology
4.4.1. Small Water storage
The National Water Master Plan (NWMP) 2030 addresses the water resource management challenges in
Kenya, and sets out plans to support the realisation of Vision 2030. The NWMP anticipates the
development of a total of 17,860 small dams and water pans adding an additional 893 Mm3. The
preliminary target of the Technology Action Plan (TAP) for adaptation is to increase water storage
capacity to 4.5 Bm3 and to construct 100,00012 community surface rainwater harvesting systems, each
with a capacity of about 30,000 m3 in ASAL areas between 2015-25 (Government of Kenya 2013).
In 2015, a total of 647 water pans and 54 small dams with a potential capacity of 16 Mm3 and valued at
Ksh 3.5 billion, , were constructed in the arid and semi-arid and rural areas by the Ministry of Water and
its agencies (Ministry of Environment and Natural Resources, Kenya n.d.). This excluding investment by
other governmental and non-governmental entities. This underlines the importance of water pans and
small dams in Kenya’s water development. Water harvesting offers under-exploited opportunities for
enhancing water security in dry lands. It works best in precisely those areas where rural poverty is most
prevalent. When planned well, water harvesting has the potential to simultaneously reduce water
scarcity and poverty, as well as to improve the resilience of the environment (Rima & Hanspeter, 2013).
4.4.2. Electricity coverage and off-grid potential in Kenya Kenya’s electrification rate was about 23% in 2011, with
rural energy access to the grid about 7% and urban
access at 50%, and the electricity demand is growing by
5-8% per annum, (Hille & Franz, 2011). Kenyan
Government is working to rapidly increase electrification
rates in both urban and rural areas as part of its national
Vision 2030 and aim to raise rural electricity access to an
ambitious 40% by 2024.
However, the overwhelming priority right now is to
expand large-scale capacity in pace with economic
growth, maintaining an adequate reserve margin. Figure
8 shows the current (red colour) and proposed (purple,
deep and light blue) network expansion which shows
that eastern and northern parts of Kenya will not be
covered adequately, not even by 2030. Therefore small-
12
15,000 water pans of 30,000m3 each are required to achieve 4.5Bm
3 water storage by 2025 which compares to
the 2030 waster master plan of 17, 860 by 2030. 100, 000 in 15 years seems unrealistically high
Figure 8: National Electricity transmission Grid, (Kenya Power & Lighting Company Limited, 2013)

42 | P a g e
scale renewables also have a role and potential in achieving off-grid access and modern pumping energy
for water supplies.
Summary
a. The annual per capita freshwater endowment estimated at 427 m3 in 2016 meaning water
is chronically scarce.
b. The current population of 47.3 million people is roughly distributed according to rainfall
endowment, which underscores the importance of reliable water supplies for economic
development and livelihoods.
c. Climate change and variability contribute to a multitude of immediate and long-term
impacts on water resources in Kenya and on sustainable economic growth.
d. An increased incidence of droughts under climate change is likely to increase rural-urban
migration and confound urban vulnerability, and addition drought cycles have become
shorter, reducing over the years, from every 5-7 years to every 2-3 years.
e. Yet, despite the paramount risks of climate change, the water sector in Kenya has not
explicitly addressed climate change issues. It is therefore important and urgent to explicitly
operationalize a framework of climate impacts mitigation and adaptation including
coordination and financing structures.
f. It is important to note that the Kenya´s water policy (1999) is outdated and therefore they
do not critically address the issue of public private partnership. The current policies view
water as service as opposed to an investment.
g. To increase the storage capacity it is necessary to harness surface rainwater through the
development of storage infrastructure such as small dams and water pans.
h. Further, to enhance water coverage and especially in rural and peri-urban areas, it is
important to integrate the use of off grid systems for sustainable water supply. Off-grid
electricity and small water storage structures have an important role in medium and long-
term water development.

43 | P a g e
5. Overview of the Selected Green Low Cost Technologies
This chapter describes the application of the selected green water technologies in Kenya: Solar and wind pumping system and water pans, and further outlines the key strengths and weaknesses of each technology.
5.1. Background
A broad range of low carbon energy technologies have been disseminated in Kenya and generally in
Africa, with varying levels of success. For a long time, the use of solar and wind energy resource has
been hindered by low levels of awareness of the benefits, lack of reliable data and information for
planning, high technology cost and proliferation of sub-standard technological equipment. The use of
solar PV and wind systems have been perceived to be inferior technologies compared to conventional
technologies due to high installation costs and lack of technical skills. (Tracy, Jacobson, & Mills, 2010),
(GoK Ministry of Energy and WinDForce, 2013), (AHK, 2013). Based on experience from Eastern Africa
with the Kijito wind pumps (Harries, 1997) (Kamp & Vanheule, 2015), the following factors affecting
dissemination of wind pumps have been identified:
Remoteness of areas of installation making access and communication difficult
Security challenges
Conflicts of different groups served by one water source
Little or no experience of communities in handling technology
Laxity in maintenance
Lack of confidence in the technology
A report by GIZ (2015) identifies similar concerns and emphasized the need to address them in order to
promote wind energy in Kenya. In addition supply of auxiliary equipment and related services, technical
knowhow, land acquisition and long term policy stability were also found to be key parameters. Studies
found that that government subsidies, tax exemptions and financing both for suppliers /manufacturers
and consumers are some of the initiatives that may speed up the uptake of wind mills for water supply
in remote underserved areas (Harries, 1997). Both solar and wind systems have considerable growth
potential for water supply in the following reasons:
• many areas especially in the ASAL are not served by grid and therefore an off grid system
application offer immediate access to electricity;
• diesel pumping system is an expensive technology to operate and maintain and contributor of
GHGs and noise pollution;
• many underserved areas have good potential for ground water but require energy to extract
from below ground;
• there is adequate irradiation throughout Kenya;
• wind speeds are sufficient in most places good for small turbine wind energy generation;
• Low maintenance cost
• Low cost green technology are environmental friendly and largely improves climate resilience of

44 | P a g e
water investments
• Low operations cost, example no fuel cost
5.1. Solar energy
It is estimated that 70% of the land in Kenya has an annual solar energy potential of about
5kWh/m2/day. 32.4% of the land has a mean yearly solar potential ranging between 5.0-5.5
kWh/m2/day, while 26.5% of the country’s land area has an average yearly solar energy potential in the
range of 5.5-6.0 kWh/m2/day. Furthermore, above 10.8% of the land surface area in Kenya has the
potential of receiving more than 6kWh/m2/day of solar energy. There is monthly variation in the
distribution of yearly solar energy potential between March and September characterised by high value
of about 5kWh/m2/day. The months of October, November, and December recorded the lower values of
radiation of 4.72, 4.76 and 4.14kWh/m2/day respectively, while in January, February and March the
mean estimate is of 5.4kWh/m2/day.
The total installed solar power capacity is estimated at 16 MW as of 2012, the vast majority is
contributed by solar home systems installed at individual homes. Figures from the Energy Regularity
commission (ERC) of Kenya show that the total installed capacity is likely to be over 20 MW as of January
2015. This is projected to grow at 15% annually. PV systems commercially distributed in rural areas in
Kenya typically consist of 14 to 20 W, wiring, rechargeable battery, sometimes a charge controller
system, lighting systems, and connections to small appliances (such as a radio, television, or mobile
phone charging units). Most solar accessories are imported mainly from China, the United Kingdom and
the US. The exception is storage batteries, which are locally manufactured (ACTS, 2015).
Estimated over 320,000 rural households (4.4% of rural people in Kenya) have solar home systems as of
2010. Annually, it is estimated that 25,000-30,000 PV systems are sold in the market. The “Over-the-
counter” nature of Kenya’s off-grid PV market has remained the same as it was since the 1990’s, except
for a few important changes, namely:
i. Consumers have more choices and lower prices;
ii. Technology improvements have made lower cost inverters, solar modules and pico-systems13
available on the market; There are more players operating in more niches, including pumping,
designed systems, portable systems and micro-grids, and this is resulting in a trend towards
better systems in terms of ease in operation and maintenance (AHK, 2013).
Despite the annual solar energy potential in Kenya, installed solar PV capacity especially for water
pumping is still low in the country. It was initially speculated that the low uptake of solar technology
was associated with unaffordability, low levels of awareness and limitations in terms of technical
capacity. The limited diffusion of solar technology can be attributed to a wide range of factors
associated with players on every level of the value chain, from the end user to the investors (Silva n.d.).
Hence, various factors affect the choice and penetration rate of PV lighting systems in rural Africa,
13
A Pico PV system is defined as a small PV-system with a power output of 1 to 10W, mainly used for lighting and thus able to replace unhealthy and inefficient sources such as kerosene lamps and candles

45 | P a g e
including access to finance, distribution challenges, consumer education, and market spoilage due to
substandard products, government policies and after sale support. Strengths and weaknesses described
in Table 10 below.
5.2. Wind Energy
The potential for wind generation in Kenya
is one of the highest in Africa with a total
of 346W/m2. The mean wind speed in
most part of Kenya reaches over 6 m/s,
with the areas surrounding Lake Turkana
(over 9 m/s) and the coast (5-7 m/s) being
attractive for wind power generation.
There are between 10-20 locations with
wind speeds greater than 7 m/s. With
middle to large wind turbines, a total of
over 1 GW could be achieved.
For close to a century, mechanical wind
energy has been used in Kenya for water
lifting. Electric wind power generation was
introduced in the country in 1984 with a
grant from the Government of Belgium for two turbines: a 400 kW turbine (effective 350 kW) installed
at Ngong Hills and connected to the grid and a 200 kW turbine in hybrid with a diesel engine in Marsabit
Table 10: Strengths and weaknesses of PV energy systems, (UNIDO, 2010)
Figure 9: Wind Speed Map of Kenya at 80m height

46 | P a g e
town (AHK, 2013). Starting in March 2007 a wind rural electrification project with the installation of a 1-
kW wind turbine for battery charging has been implemented for schools in off-grid areas, as part of
national effort to light-up all public schools.
The small wind energy systems market in Kenya is dominated by 12 companies listed in Table 11, six
local manufacturer and 6 dealers who import their products (Rencon Associates and JICA, 2013). The
turbines in the market have varying capacity ranging from 200W to 12 kW and cut in wind speed of 2-4
m/s.
Since the late 1970s mechanical wind pumps
going by the name kijito14 had been installed in
the Kenya, largely in ranches and remote
communities with one local integrator (Bobs
Harries Engineering Ltd) dominating the market.
The technology had been introduced in 1975 by
Intermediate Technology Development Group
from England with the goal to develop a
commercial, modern and reliable windmill (“The
WOT-field,” 2002). Kijito wind pumps were
produced in 5 rotor sizes ranging 3.65m - 7.9m to
offer wide range of technical solutions both for
deep water sources and high water needs. The multi-bladed rotor generates high torque for improved
performance even in low wind regimes. For example, a 20ft (6m) rotor can provide 113 m3/day in 4-5
m/s wind speed at a 20m head provided no serious obstacle to the wind flow is located within 100m of
the installation, (“Wind Pumping,” n.d.)
Continued use of wind energy declined with the arrival of oil fired internal combustion engines, which
are flexible and more convenient to use. However, the rising cost of oil is making exploitation of wind
energy attractive again, because it is cheaper in the long run and more convenient particularly in areas
remote to grid and oil supply outlets. Engine driven pumps are uneconomical at very low requirements,
also due to the fact that diesel pumps are not made for power ratings below 2 kW.
The niche for wind pumps in water supply range from 20 m4 to 2000 m4/day.15 The corresponding rotor
diameters range from 1 to 7.5 meters. The merits of a wind pump can be viewed as serving a multitude
of users against low energy inputs. For instance a 3 m diameter wind pump can supply 30m3 water per
day (average per year) at a pumping head of 10 m with a very moderate average wind speed of 3.5 m/s.
This will serve a village with 750 people (assuming 40 l/d per capita) despite the average power
delivered being only 34 Watts16.
14
Kijito is Swahili name for small river 15
m4/day is a measure of power required to pump a certain amount of water over height -it’s a product of flow (m
3) and head
(m)
16 Power produced by wind turbine is calculated using the equation PM = ½CpρAV
3, where, PM is power (in watts) available from
the machine, Cp is the coefficient of performance of the wind machine, ρ is the air density in kilograms per cubic metre (kg/m3),
Table 11: Dominant small wind market players in Kenya , (Rencon Associates and JICA, 2013)

47 | P a g e
Figure 11: Comparative Analysis of Wind speed at 60m, 80m and 100m, (GoK Ministry of Energy and WinDForce, 2013)
Examining the niches for the various pumping options in Figure 10 one sees clearly that hand pumps are the obvious solution at the lower end of the and are used up to 100m4/day, but there known cases where wind pumps are used for energy requirements down to 20 m4/day.
The range of mechanical wind pumps is limited by rotor size, from about 1 to 7.5 m diameter. At larger power demands it is more convenient and economical to generate electricity which can be used to drive a motor/pump combination. These are indicated as Wind Electric Pumping Systems
(WEPS). Especially at sites with high wind speeds ( 5 m/s), they are attractive from diameters of 3 m and up.
Despite the remarkable potential for wind energy expansion in Kenya, several challenges still remain. Lead to slow adaptation of small wind turbine in rural and peri-urban areas. These include the cost of technology, site selection, lack of a wind resource data base, aesthetic, noise and vibrations, low awareness and lack of local capacities to operate and maintain these systems. Strengths and weaknesses of wind energy systems described in table 10 below.
A is sweep area in m
2 and V is the mean annual windspeed in m/s. Considering that a wind turbine will only operate at
maximum efficiency for part of the time due to variations in wind speed. A rough estimate of the average annual power output
(PA ) from a windpump is given PA = 0.1 A V3 .
Figure 10: The wind pumping niche versus other pumping technologies

48 | P a g e
5.3. Surface Water Storage Pans
Water storage pans are excavated surface water storage facilities of limited capacity which are mainly
constructed in locations where the topography does not allow the construction of a small dam and
instead favours excavation. Excavation of larger pans (up to 150,000 m3) is possible and can be done,
especially near populated centres,
but the construction cost is
generally high due to the 1 to 1
excavation to storage ratio.
Pans are excavated below the
natural ground level, and with the
exception of pans constructed on
inclined locations, the volume of
earth excavated will be equal to
the storage capacity of the pan
and therefore when compared to
a small dam, the water to earth
ratio (water storage volume /
earth excavated volume is low.
However, when a suitable inclined
location can be identified for the
construction of the pan a
somewhat more favourable ratio Figure 12: Typical plan and section drawing of a water pan, (Government of Kenya, 2015)
Table 12: Strengths and weaknesses of wind energy systems, (UNIDO, 2010)

49 | P a g e
can be obtained. Storage pans tend to be relatively expensive constructions when compared to small
earth dams; where possible natural depressions can be enlarged to produce water pans with a slightly
better storage to earthworks ratio. (Government of Kenya, 2015)
Pans for the purpose of surface water storage can be constructed wherever a sufficient quantity of
water can be intercepted to create a small reservoir. Pans are basically used in such locations where no
topographically suitable site can be found for the construction of a small dam, or where no suitable
construction materials for the construction of a dam can be found.
Water storage pans are subject to the same limitations regarding sedimentation and evaporation as
small dams. Due to their shallow depths (usually 2.50 m to 5.00 m) water storage pans are usually not
suitable as permanent water sources because of high evaporation areas. In catchment areas subject to
erosion, silt traps will have to be included in the design (Government of Kenya, 2015).
Apart from the two factors mentioned above (topography and availability of construction materials), the
basic principles for selection of appropriate locations include:
- The water-tightness of the reservoir in sandy areas but since pan dimensions are limited,
lining of the reservoir with an impervious clay blanket can often present a solution for pans,
- The natural drainage and flow pattern of the intercepted water and an overflow structure
for any excess water towards the natural drainage
- Silt trap which is often combined with the overflow structure.
- Sedimentation, evaporation and ecological impact
- Specific alignment of the pan to minimize earthworks
- Storage sizes considering the expected inflows, length of the dry period, reliability level to
be maintained during a given dry period and the expected water use and relative
importance of the evaporation losses17.
Water harvesting through the development of water storage pans offers under-exploited opportunities
for enhancing water security in drylands and works well in the areas where rural poverty is relatively
high. When practiced well, water harvesting has the potential to simultaneously reduce water scarcity
and poverty, as well as to improve the resilience of communities to climate change (Rima & Hanspeter,
2013). Table 13 shows the various strengths and weaknesses attributed to water pan as a storage
technology.
Table 13: strengths and weakness of water pans
Strengths Weaknesses
Easy to construct and maintain Low, erratic rainfall and droughts may result to water pans drying
17
Generally pans in arid areas should be sized with emphasis on availability of grazing (i.e. the pan should dry out just as the available grazing is finished). Large pans may result in overgrazing in the area around the pan.

50 | P a g e
No energy is required to draw water Elevation often restricts conveyance by gravity
Less susceptible to damage when overtopping and weak structural foundation
Seepage losses from the reservoir
Reduces impact of floods by storing initial floodwaters, controlling erosion.
Poor water quality owing to high turbidity and contamination of water in open reservoirs
Can be constructed on any soil type High rate siltation by sediment during severe storms, and especially at the end of dry season
It has potential of raising water table downstream and in nearby wells.
The risk of people and livestock drowning in the pool
High evaporation losses
Expensive to construct relative to water volume stored
Summary
i. Water pans, wind and solar pumping have been disseminated in Kenya with varying levels of
success, but all the three technologies have considerable potential for growth and applications
in water supply. Key supporting factors include:
• Water scarcity and low borehole yield in some areas
• High incidences of ground of water salinity which renders water not suitable for
livestock and irrigation
• Land availability and social cohesion in rural areas
• Rural areas especially in the ASALs are not served by grid and therefore an off grid
system application offer immediate access to electricity;
• Diesel pumping system is an expensive technology to operate and maintain and
contributor of GHGs and noise pollution;
• Many underserved areas have good potential for ground water but require energy to
extract from below ground
• There is adequate irradiation throughout Kenya;
• Wind speeds are sufficient in most places good for small turbine wind energy
generation;
• Low cost green technology are environmental friendly and largely improves climate
resilience of water investments
ii. Despite the remarkable potential for low-carbon in Kenya, several challenges are cited for their
slow adaptation in rural and peri-urban areas. These include the low levels of awareness of the
benefits, site selection, and lack of reliable data and information for planning, aesthetic, noise
and vibrations, as well as high technology cost and sub-standard technology and lack of local
capacities to operate and maintain these systems.

51 | P a g e
PART II

52 | P a g e
6. Capacity, Prevalence and Functioning of Technologies
Based on analysis of the data collected in the targeted sites, this chapter presents the findings pertaining to (i) the reliability of the selected technologies to perform required functions steadily under different ecological zones; (ii) the capacity to meet water demand for households and other intended uses, and (iii) the durability of these technologies to meet water demand.
6.1. Prevalence of Wind, Solar and Water Pans
Communities in most technology sites surveyed had a previous experience with different water supply
technologies namely diesel systems, grid electricity, solar systems, wind systems, earth dams, sand dams
and water pans. The technologies varied in materials used, size and implementers. 70% of technology
installations surveyed were less than 10 years old and in half of the cases; elevated storage tanks were
utilized alongside as a form of water back-up scheme.
It is evident from the spread of technologies that (Table 14) humid, sub-humid and semi-humid regions
rely more on surface streams. Small gravity flow network have been developed to serve urban areas in
particular. In the humid and sub-humid areas the use of surface streams and shallow wells make up are
dominant source of in the semi-humid to semi-arid areas. Boreholes are prevalent in the semi-arid and
arid areas as a result of the lack of reliable surface flow. In Baringo County for example the use of
boreholes is at 82.4% all of water sources in arid areas compared to 16.7% in the semi-humid areas.
There are many water-pans and small water storage structures in all the four counties. Water pans are
common in semi humid to arid areas, accounting for 25% of water sources in Embu, 40% in Baringo, 75%
in Homabay and 60% in Isiolo but, few water pans actually work throughout the year. Water pans were
preferred over boreholes due to ground water salinity. Water-pans were initially intended to address
livestock water demand but presently they are also utilised for domestic uses, due to a lack of
alternative sources. In humid and semi-humid areas of Baringo, Embu and Homabay small storage dams
are found, although not many are used for small water storage.

53 | P a g e
Table 14: Distribution of water sources type by Ecological Zone per County
Ecological zone County Frequency Percent of Total Embu Baringo Homabay Isiolo
Humid Shallow wells 1 1 1.4%
River 2 2 2.7%
Sub-Humid Small dam 2 2 2.7% River 1 1 1.4%
Semi-Humid Borehole 1 1 4 6 8.2% Water Pan 1 1 1.4%
River 1 1 1.4%
Semi Humid to Semi-Arid
Borehole 10 1 8 2 21 28.8% Shallow wells 1 2 3 4.1%
Water Pan 1 3 4 5.5%
Small dam 4 4 5.5% River 2 1 3 4.1%
Others 3 3 4.1%
Arid Borehole 14 3 17 23.3% Water Pan 2 2 2.7%
River 2 2 2.7% Grand Total 25 22 20 6 73 100%
The static level of boreholes is relatively deep ranging from 60 to 200m meters deep creating a need for abstraction energy. There is great dependency on fuel and electricity subsidies from the county government, and partly for this reason, many borehole are non –operational for significant periods in the year. Since solar is often matched with boreholes, uptake of solar technology is limited in humid and semi-humid areas. Conclusively, the high cost of maintaining diesel pumps and generators is a strong motivation in favour of solar PV. The data collected in the field show that solar PV is used across all the ecological zones, but predominant in arid and semi –arid which account for 80% of all solar installation observed. In comparison, solar energy for water pumping accounts for 10% in humid areas, 7% in sub humid and 3% in semi-humid areas.
Table 15 shows an accelerated uptake of solar energy for water pumping after year 2000 onwards. The prevalence of solar installations is generally lower in Embu because most water supplies especially in the highlands depend on gravity flow from perennial rivers. The few solar installation observed during the survey were located in the semiarid areas of Mwea and Mavuria.

54 | P a g e
Table 15: Distribution of the target technologies by year of installation per county
County
Abstraction Method
Water pans & small dams Total
Solar Wind Diesel Hand pump
Grid electricity Gravity Bucket
Embu 1970-1979
1980-1989 1 2 1 1 5
1990-1999 1 1 1 1 4
2000-2009 1 1 1 1 3 3 1 11
>=2010 1 2 2 2 1 1 2 11
Total 2 3 3 4 5 5 5 4 31
Baringo 1970-1979 1 1 1
1980-1989
1990-1999 2 2
2000-2009 2 5 1 1 1 9
>=2010 5 1 1 2 1 6 15
Total 7 1 7 5 2 1 7 27
Isiolo 1970-1979 1 1
1980-1989
1990-1999 1 2 0 3
2000-2009 1 0 3 3 7
>=2010 9 1 1 5 16
Total 11 3 5 8 27
Homa Bay 1970-1979 1
1980-1989 1 1
1990-1999 1 1
2000-2009 1 1 1 1 1 1 5
>=2010 7 1 2 3 2 15
Total 7 1 2 2 3 5 4 23
Total Installations by year in all the counties
1970-1979 1 1 1 1 4 3.36%
1980-1989 1 2 1 2 0 6 5.04%
1990-1999 1 1 3 3 1 1 10 8.40%
2000-2009 4 2 7 1 6 3 5 6 34 28.57%
>=2010 22 1 4 3 7 2 4 15 58 48.74%
Total 27 5 15 6 18 7 11 30 119 100.00%
%age abstraction energy source
30.3% 5.6% 16.9% 6.7% 20.2% 7.9% 12.4%

55 | P a g e
Figure 13 shows the distribution of water abstraction methods across rural and peri-urban areas. In peri-urban areas the use of green technologies has not been widely adopted; for example only 70% of solar pimping installations were found in peri-urban areas. The use of grid electricity is predominant source of abstraction energy probably because peri-urban areas in the four counties are well connected to grid electricity hence ease access.
Table 16 and Table 17 compare water abstractions methods by ecological zones based on responses given by water users and managers respectively. Solar is the predominant water abstraction method evidenced by 29% of the water users and 30.8% of water managers. The use of electricity for water abstraction water is proportionate to the use of solar systems, with 21.7% of the users and 20.9% of water managers indicating to use it for water pumping. In contrast, 10.1% of the users indicated to use diesel against 16.9% installation indicated by the water managers. This contrast can be linked to the widespread complaints expressed by users about diesel engines' downtime because of lack of fuel and constant equipment breakdowns. 32.6% of the users indicated to use hand pumps and buckets respectively to abstract water. 18.3% of the technology points were using buckets and hand. This implied that users reverted to manual methods whenever modern methods of abstraction failed.
Table 16: Distribution of water abstraction methods by ecological zones by water users18
Water Abstraction Technology
Humid Semi-humid to semi-Arid
Semi-humid Arid Frequency Percent of Total
Solar pumping 13 6 21 40 29.0% Diesel pump 8 2 4 14 10.1% Wind pumping 1 1 0.7% Grid electricity 14 1 1 16 21.7% Hand Pump 16 16 11.6% Gravity 1 1 6 8 5.8% Bucket 1 20 1 7 29 21.0%
18
The same question on the primary method of water abstraction was asked to both the technology points managers and users and the responses compared
93%
100%
100%
83%
47%
71%
82%
7%
17%
53%
29%
18%
0% 20% 40% 60% 80% 100% 120%
Solar powered
Wind powered
Diesel
Hand pump
Grid electricity
Gravity
Bucket
Peri Urban Rural
Figure 13: Distribution of water abstraction methods in rural and peri-urban areas

56 | P a g e
Table 17: Distribution of water abstraction methods by ecological zones by water managers19
Technology type humid sub humid
Semi Humid
Semi Humid to Semi-Arid
Arid Frequency Percent of Total
Solar powered 3 8 17 28 30.8%
Wind powered 4 1 5 5.5%
Diesel 1 5 9 15 16.5%
Hand pump 6 6 6.6%
Grid electricity 2 2 2 9 4 19 20.9%
Gravity 1 1 1 2 2 7 7.7%
Bucket 1 9 1 11 12.1%
Only five wind energy installations were observed in all the four counties; three in Embu, one in Baringo and one in Homabay. Four of the five were mechanical wind system installed prior to 2009, while the fifth is a wind electric system installed in 2012 in Baringo. Only one out of the five wind systems was functional at the time of the field visit, although users indicated it could not pump water to long distances and therefore grid electricity was used to supplement water abstraction.
The observed wind mechanical systems were installed by Bob Harris Ltd. Interview with the supplier confirmed that the company had installed 347 systems in Kenya since late 1970’s on sites shown in Figure 14. 70% of these were financed by the Catholic Church in Kenya and the rest mostly by individuals and ranches. From records provided by Bob Harris Ltd, it was found that 9 mechanical wind pumps were installed evenly across Homabay County, 6 in east Baringo, 5 around Isiolo town and Garbatulla, and 6 in lower Embu County. Most of these installations have been replaced since then with solar PV. During the field study one such replacement was on-going in Lambwe, Homabay.
In the analysis, wind pump site map was superimposed over wind speed map at 50m to give an idea of prevailing wind speed on site. The wind energy installations in the four study counties - with exception of those near Isiolo town - are located in areas with poor to marginal wind potential areas, generally less than a
wind velocity 4m/s at 50m height. Considering the average height of the tower is 14.25 meters, it is probable that the wind speed is lower at the installed height due to ground obstruction.
19
Question of abstraction method by water managers
Figure 14: Distribution of Kijito Mechanial wind pumps in Kenya

57 | P a g e
According Bob Harris management, the greatest challenges they faced was limited data on wind speed and therefore inability to synchronise suitable site for wind pump installation. As a result of these challenges, uptake of mechanical wind systems has sharply declined in the recent past. These sentiments were shared by two other local companies, GoSolar and Centre for Alternative Technology, and no longer supply wind systems. There is in general limited experience with electric wind pumping in the country. Davis and Shirtliff, a leading supplier of pumping solution, tried small electric wind turbines with a capacity of less than 1 kW, but the installation was found to be relatively expensive due to the cost of mounting the frame.
6.1.1. Water-Energy Interface Examining the interaction between water and energy all modern sources of energy, solar and wind
technology had been installed to abstract water from boreholes and shallow wells. A significant 14%
used buckets to abstract water from rivers, shallow wells, water pans and small dams. Considering that
groundwater is the dominant water resource type in ASALs and the integration of renewable energy in
water supply systems has obvious advantages for raising efficiency and commence in the ASALs.
Table 18: Water abstraction versus water sources
Borehole Shallow wells
Water Pan
Small dam
River Others Totals
ENER
GY
SO
UR
CES
Solar powered 27 27
Wind powered 5 1 6
Diesel 10 2 1 1 14
Hand pump 4 1 5
Grid electricity 10 1 2 4 17
Gravity 1 1 1 3 1 7
Bucket 1 6 2 1 2 12
Total 57 4 9 6 9 3 88
6.2. Capacity to reliably meet demand
The type of water uses and related demand is a critical guide to investment decisions. The demand for
water and preference of sources and technology is considered both by entitlements based on guidelines
and the users’ own perception of
the ideal supply required for their
multiple uses of water.
The technologies primarily
supplied water for domestic uses
at 96%, 74% of the users who
used the sources for water for
livestock and 28% for small scale
irrigation. While water for
domestic use and livestock is
important in all the 4 counties, demand for irrigation water among water users is significant in Embu
County (71.4%) and to a lesser extent in Baringo (15.4%) but marginal in the Isiolo and Homabay
counties. 75 % of all users needed water for more than one use, as shown in Figure 15. The dominant
Table 19: Categories and Proportion of water uses
Uses of water Frequency Percent Percent of Users
Domestic 127 45.70% 95.5%
Livestock 98 35.30% 73.7%
Poultry and fishing rearing 9 3.20% 6.8%
Farming 37 13.30% 27.8%
Commercial 6 2.20% 4.5%
Others 1 0.40% 0.8%

58 | P a g e
uses were livestock and domestic use in Isiolo (90%) and Homabay (83%), while 83% of multiple users in
Embu utilised water for farming, livestock and domestic uses. In Baringo water supplies are used
significantly for domestic livestock, poultry and fishing.
The daily domestic water consumption mean in the surveyed counties is 125 litres per household per day. There is considerable regional variation in water consumption for instance Homabay and Baringo the domestic water consumption stood at 187 lpd with 80 lpd in Isiolo. 57% of all households collect between 20 and 100 litres from the nearest water point. There is unexplained sharp rise in the number of users who reported daily collection of 200 lpd Figure 16 and most of them were in Homabay County.
39% of water technology points were located within less than 1 km from the user households, while cumulative 62% were less than 1.5 km from where the users resided. 14% of the users’ travelled for more than 5km to collect water. The water sources were closer to users in Embu and Homabay but significantly distant in Baringo, where 88% cover more than 1 km to collect water. There is no distinction in the distance covered by user to the water point in the different ecological zones, nor is there discernible correlation between the volume collected at the technology point and the distance to
0%
20%
40%
60%
80%
100%
Baringo Embu Homabay Isiolo
56%
3%
83% 90%
39%
6% 0% 0% 0%
83%
4% 5%
Multiple uses of water
domestic livestock domestic farming
domestic livestock poultry & fishing rearing domestic, livestock, farming
domestic commercial
Figure 15: Multiple uses of water per county
2%
14%
16%
10%
16%
8% 7% 7%
1%
18%
1%
0%
2%
4%
6%
8%
10%
12%
14%
16%
18%
20%
20 40 60 80 100 120 150 160 180 200 240
Daily domestic water consumption
Figure 16: Volume of water collected from technology sources per day

59 | P a g e
source. However, the mean daily consumption varies from 85 lpd in arid zones to 117 lpd in semi humid and highest in semi-arid areas at 179 lpd.
Theoretically, water demand ought to be dynamically related with water availability. Higher water
availability should automatically elicit higher use (including new uses) creating a high demand. The
reverse is also true: in areas where water is scarce, uses are more prioritised and demand focuses on
primary needs first, which in general will lead to lower demand. Conspicuously, this is not exactly
verified in the chart as shown in the Figure 17. One possible explanation is the subjective nature of the
survey question as to what constitute “all uses”. It is likely that users in more water endowed humid and
semi humid zones utilise improved water points for domestic uses and different sources for other
purposes. This should however be confirmed by a more targeted study.
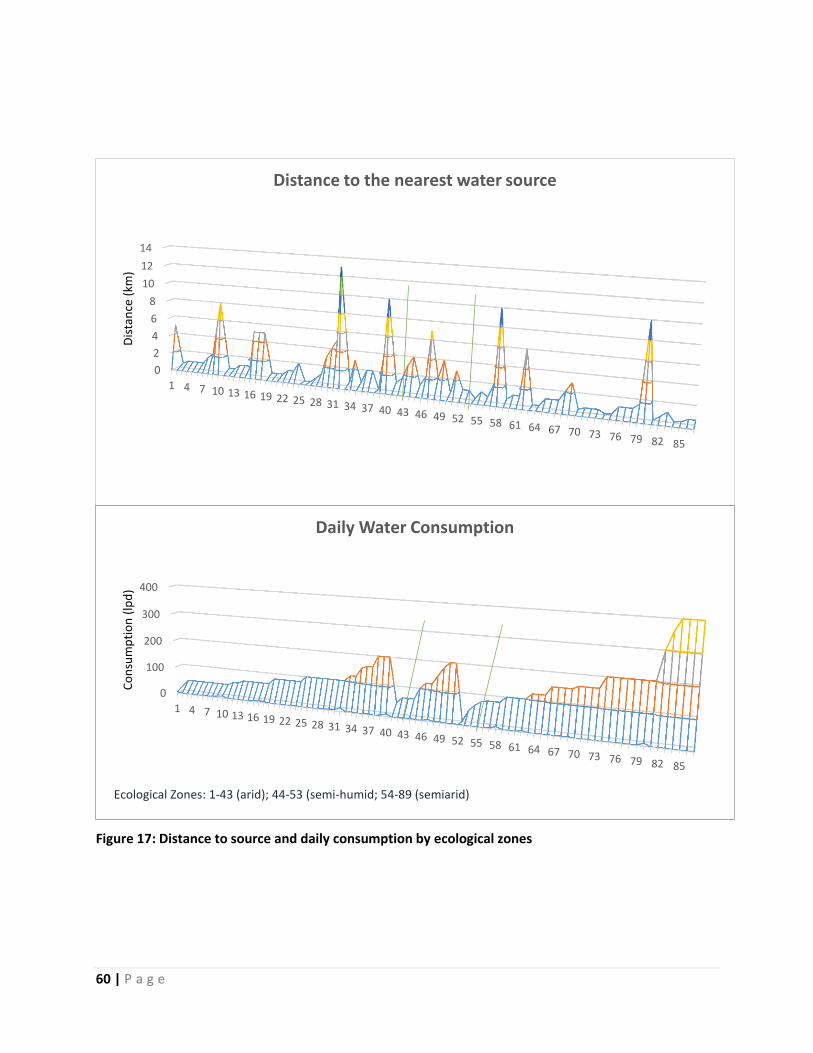
60 | P a g e
0
2
4
6
8
10
12
14
1 4 7 10 13 16 19 22 25 28 31 34 37 40 43 46 49 52 55 58 61 64 67 70 73 76 79 82 85
Dis
tan
ce (
km)
Distance to the nearest water source
0
100
200
300
400
1 4 7 10 13 16 19 22 25 28 31 34 37 40 43 46 49 52 55 58 61 64 67 70 73 76 79 82 85
Co
nsu
mp
tio
n (
lpd
)
Daily Water Consumption
Ecological Zones: 1-43 (arid); 44-53 (semi-humid; 54-89 (semiarid)
Figure 17: Distance to source and daily consumption by ecological zones

61 | P a g e
The study found that there is relationship between the demand responsiveness and sustainability of
technology points and it is strongest where water caters for other needs besides water for domestic
uses. Furthermore, the study found that gaps often exist between the perceptions of users and
technology intermediaries20. These gaps pertain reliability of the technology based on co-opted project
benefits, location of water point relative to users or either placing water point on their own property21,
In other cases, it was found that community representatives failed to consider the demand of certain
segments of the population, such as youth or the poor, leading to a design that did not reflect the
preferences of the community as a whole. In such cases, community members often expressed
dissatisfaction with the service provided, they possessed a low sense of ownership, and had little
willingness to pay for the maintenance of the service22.
Table 20: Number of Months Water is Available at Technology Points
Frequency Percent
Man
ager
s d
ata
1 month 1 1.2
2 month 1 1.2
3-6 months 4 4.8
6-9 months 3 3.6
9-12 months 45 54.2
Always 26 31.3
None 3 3.6
Total 83 100
Use
rs d
ata
1 month 2 1.5
2 month 5 3.8
3 month 3 2.3
3-6 months 16 12.0
6-9 months 28 21.1
9-12 months 39 29.3
Throughout 40 30.1
Total 133 100
Generally, a reliable water source should provide water for a minimum of 350 days in a year, with less
than 14 days of breakdown. Very few technology points were able to meet this standard. Users and
technology point managers agreed that approximately 30% of the technology points provided water
throughout the year, (Table 20). 85.5% of the technology point managers reported that water was in
Embu were supplied with water for at least 9 months a year, compared to 92% in Baringo, 60 % in Isiolo
and 57% in Homabay. Therefore, while Embu is better endowed with water resources, the county is
more vulnerable to seasonal variation compared to the other three counties. Water supplies in the
upper zones of Embu sourced water from surface stream flows which are more prone to volume
variation between dry and wet season. This is in contrast to the semi-arid and arid areas which depend
20
The term intermediaries is used to mean organization initiating, facilitating or undertaking implementation of water supply technologies on behalf of beneficiaries. 21
In Runjenyes common water collection points (kiosks) have been disused for a longtime because users preferred individual connection on these water kiosk has since been demolish. 22
6 of 10 public water kiosks in Uriri, Migori that were developed around 2014 are non-functional because on unreliability and cost of water instead users obtain water from privately operated kiosks sourcing water from shallow wells.

62 | P a g e
on ground water sources that are nearly constant across different annual seasons. An additional
dimension to this rests on the fact that Embu County has the highest demand for irrigation (71.4% of
users). Irrigation is a dry weather activity and its impacts of water shortage are quite pronounced.
71 % of all the users interviewed used ground water supplies (boreholes and shallow wells) during the
dry season. In comparison 74% of users utilised the same source in the wet season. 26% of the users
reported utilising solar energy to abstract water from boreholes. The common complaint in all the
counties is that solar technology performs poorly in cloudy weather and that the duration is limited
when conditions are right for its functioning (8-9 hours daily). This nature of complain was especially
articulated in Embu.
Table 21: Common water sources during dry and wet seasons
Water Source Dry Season Source of water Wet season source of water
Boreholes 67.0% 69.1%
water pans 16.0% 4.4%
River 10.6% 16.2%
Shallow well 4.3% 4.4%
Piped network 2.1% 5.9%
100.0% 100.0%
The overall proportion
of users obtaining
water from water
pans increased from
4.4% in the wet
season to 16%.
Seemingly, the
number of borehole
users remain constant
around the year, while
water pans are the dry
season alternative for
users who mostly
depended on surface
stream abstraction in
the wet season. In this
sense, boreholes give
the impression of
meeting users
demand in different
seasons of the year
while water pans,
possibly because of
Ol Donyiro pans in Isiolo were implemented by Caritas in 2015. There are two pans adjacent to each other. One of the pans has not been able to store water due to poor siting and one of its walls is breached. This water pan has a capacity of 50m x 50m by 4m, while the embankments on three sides go up 6m high. The volume of water in this water pan is limited by wall height on the in-let side. The water pan was dry during the time of study although it is reported to store water during the wet season.
The second pan measures 65m × 50m by 9m slanting but the water storage covers 48m x 33m. The Lower edge of the pan has breached causing loss of storage volume. Protection to embankment is well done but silt traps not installed.
Poor designs of water pans continue to impact on their storage ability. High cases of siltation on most of the dams were observed during the field study. Most of the water pans have not been de-silted for the last ten years. As compared to boreholes, most of the water pans lacked proper management structures and more than often maintenance issues are overlooked. Communities lack clarity on who is responsible for the system maintenance.
Box 1: Design and Managment of Water Pans

63 | P a g e
low water quality, are the users’ safeguard in period of water scarcity or for lack of a better choice.
Considering that 27% of users currently employ solar energy to abstract borehole water, there is
potential to deploy solar PV to enhance water supplies to the remaining 44% of users who are using
groundwater.
All users complained that quality of water obtained from water pans was poor. Moreover, observed
water pans dried up during the dry season except two in Baringo, which have water available
throughout the year. The water pans in Baringo were superior in many ways to those found in the other
counties. These water pans included protection features, they had a well maintained fence to protect
from stray animal and direct abstraction, gravel filtration, and silt traps. This evidence demonstrates
that the challenges experienced with water pans (see 6.3 for details) has more to do with poor planning
and construction other than an inherent nature of the technology.
6.2.1. Technology Capacity and demand coverage23
The total demand for water is analysed against information on different water uses, which includes
water for domestic use, water for institutional and small business use. For rural areas this also includes
water for livestock, water for crop agriculture, in particular through small-scale irrigation and water for
seasonal population with their livestock. Demand coverage is then defined at the ratio of water supplied
compared to total demand. The overall average household size in all the four counties is 7.1 with small
variation between the counties, the highest being 8.5 in Homabay followed by 7.15 in Isiolo, 6.6 in
Baringo and 6.2 in Embu.
Table 22: Estimated Household Domestic water demand
County Average HH size Average. Lower limit
Average. Upper
limit
Baringo 6.58 66 132
Embu 6.26 63 125
Isiolo 7.15 72 143
Homabay 8.48 85 170
7.12 71 142
According to Kenya´s water supply design manual,(GOK (ministry of Water and Irrigation), 2005), daily
per capita demand for rural household is between 10-20 litres for people without connection to water
source and 40-60 for those with an individual connection. 2.1% and 5.9% of the surveyed users indicated
to use individual connection during dry and wet season respectively. Therefore, the overwhelming
majority fall under 10-20 litres daily category. The estimated demand Table shows a majority of the
users’ are expected to range between 60 and 140 lpd. Comparing with consumption data Figure 16, it’s
noted that 50% of the users fall within these margins with 16% and 34% on the lower and higher
extremes respectively. Figure 18 is a line graph that compares the volume of water collected by users
and what they required for their domestic uses. There is a direct correlation between water collected
23
Water demand coverage refers to the ratio of available water resources relative to demand for given use(s)

64 | P a g e
daily and water needed for everyday use at 0.01 level of significance or degree of error. This therefore
implies that users collected water in relation to the intended use for the water collected.
It would be expected that easier, more efficient methods of abstraction raises the amount of water consumed. Figure 19 show the compares the amount of water that users collected from different technology points. Clearly there is no evidence that water consumption patterns varies depending on the technology in use. Meaning per capita consumption is unlikely to change with technology deployed. This has implication for the PPP financial analysis.
Figure 19: Water collected versus technology in use
0%
5%
10%
15%
20%
25%
30%
35%
40%
45%
50%
0-50 50-100 100-150 150-200 >200
Solar powered Grid electricity Hand pump Diesel Gravity Bucket
4
13
16
7 8
3
0
10
2
20 18
4
13 14
10
15
7
0
12
1
16
9
<=20 21-40 41-60 61-80 81-100 101-120 121-140 141-160 161-180 181-200 >=201
Use
r (%
)
Volume (litres)
Water Required Water Collected
Figure 18: Comparison the water collected and required by users
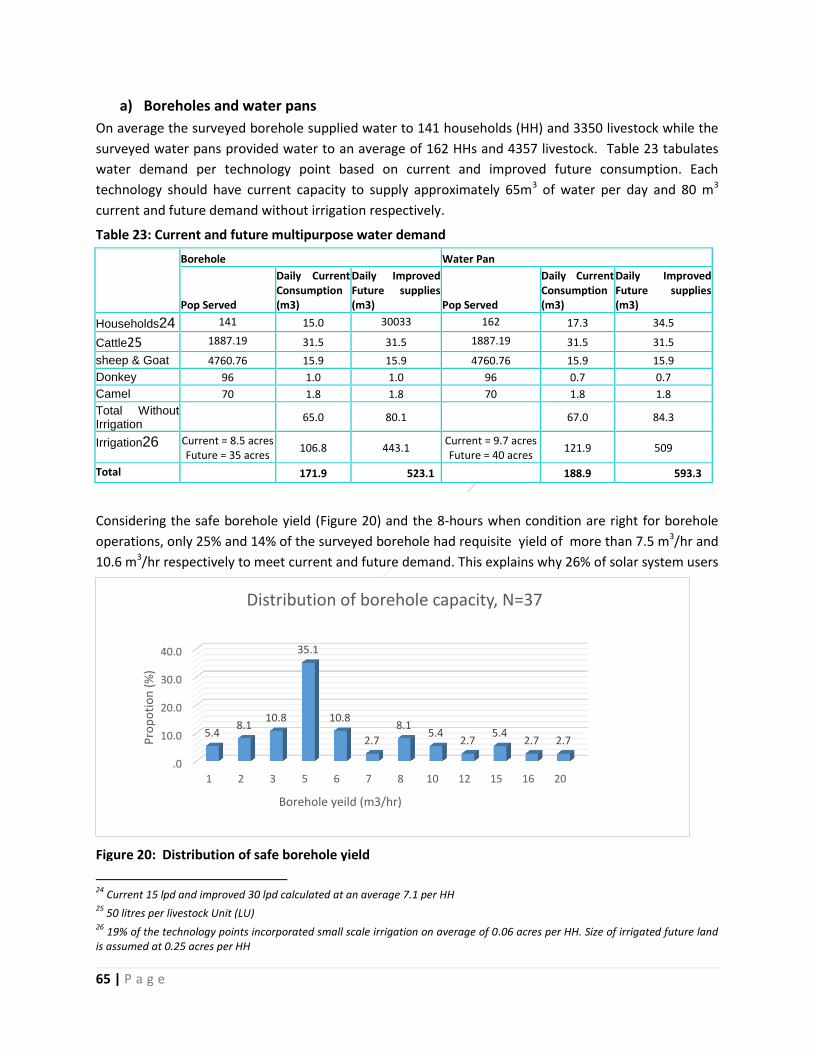
65 | P a g e
a) Boreholes and water pans
On average the surveyed borehole supplied water to 141 households (HH) and 3350 livestock while the
surveyed water pans provided water to an average of 162 HHs and 4357 livestock. Table 23 tabulates
water demand per technology point based on current and improved future consumption. Each
technology should have current capacity to supply approximately 65m3 of water per day and 80 m3
current and future demand without irrigation respectively.
Table 23: Current and future multipurpose water demand
Borehole Water Pan
Pop Served
Daily Current Consumption (m3)
Daily Improved Future supplies (m3) Pop Served
Daily Current Consumption (m3)
Daily Improved Future supplies (m3)
Households24 141 15.0 30033 162 17.3 34.5
Cattle25 1887.19 31.5 31.5 1887.19 31.5 31.5
sheep & Goat 4760.76 15.9 15.9 4760.76 15.9 15.9
Donkey 96 1.0 1.0 96 0.7 0.7
Camel 70 1.8 1.8 70 1.8 1.8
Total Without Irrigation
65.0 80.1
67.0 84.3
Irrigation26 Current = 8.5 acres
Future = 35 acres 106.8 443.1
Current = 9.7 acres Future = 40 acres
121.9 509
Total 171.9 523.1 188.9 593.3
Considering the safe borehole yield (Figure 20) and the 8-hours when condition are right for borehole
operations, only 25% and 14% of the surveyed borehole had requisite yield of more than 7.5 m3/hr and
10.6 m3/hr respectively to meet current and future demand. This explains why 26% of solar system users
24
Current 15 lpd and improved 30 lpd calculated at an average 7.1 per HH 25
50 litres per livestock Unit (LU) 26
19% of the technology points incorporated small scale irrigation on average of 0.06 acres per HH. Size of irrigated future land is assumed at 0.25 acres per HH
.0
10.0
20.0
30.0
40.0
1 2 3 5 6 7 8 10 12 15 16 20
5.4 8.1
10.8
35.1
10.8
2.7
8.1 5.4
2.7 5.4
2.7 2.7 Pro
po
tio
n (
%)
Borehole yeild (m3/hr)
Distribution of borehole capacity, N=37
Figure 20: Distribution of safe borehole yield

66 | P a g e
reported the system to be unreliable. To guarantee reliability the option is to limit the number of
households served by a particular water technology indicatively, 46% of Borehole have safe yield of 4-6
m3/hr or 32-48 m3/day. This is sufficient for domestic and livestock demand of 78 to 104 HHs. This is a
good guide for planning but in practice, the size of community served will depend on the specific water
uses in the community and water sources attributes.
The size of water pans and small dams ranged between 5,000 m3 and 60,000 m3 though 85% of the
surveyed water pans were between 10,000m3 and 30,000m3. In an ideal situation, this volume is
sufficient to supply the 162 HH, (see Table 23). However, the annual potential open water evaporation is
2274 mm/annum in Marigat, Baringo and 2082 mm/annum in Mwea, Embu, (Woodhead, 1968).
Typically, a water pan will lose 0.18 m3/m2 per month through evaporation. This implies that 3m deep
water pan will lose 5% of the stored volume every month by evaporation, while 4 m and 5m deep will
lose 4% and 3% respectively. Soil Infiltration (movement of rainwater through unsaturated soils) and
percolation (conductivity of water through saturated soils) are other important factors in the assessing
the potential of water pan. Surface infiltration is an important factor to evaluate the retention capacity
of storm or surface runoff from off season rainfall episodes. Percolation rate estimates water subsurface
conductivity under steady moisture saturation. Infiltration rates of soils in Kenya range from 20-100
mm/hr, while subsurface conductivity will vary from slow (0.005 m/day) in clayey soils to moderately
high (0.084m/day) in medium textured soils and very rapid 1 to 6m/day) in course textured soils
(“Kenya Soil,” n.d.).
This translates to daily infiltration loses in 7500m3 unlined water pans at a rate of 0.19%, 0.14%, 0.11%
and 0.09% of the stored volume in 3m, 4m, 5m and 6m water pans respectively under low percolation
conditions or 420m3 per month, and 2.4% 1.8%, 1.44% and 1.2% or 5400 m3 for 3m, 4m, 5m and 6m
deep pans in medium textured soils. Soil conductivity rates over 1m/day will result to losses in excess of
24m3/m2/day, which will drain water a pan of any size almost immediately. Error! Reference source not
found. shows theoretical depletion curves combing households’ consumption (65m3/day) evaporation
and infiltration losses in low infiltration conditions (continuous lines) and high infiltration (broken lines).
For a water pan with capacity of 7500 m3 and a depth of 3-m in clayey soils will hold water for
approximately 2 months but when the same water pan is located in medium textured soils, it will
deplete in 1- month. On the other hand on an unlined water pan with a capacity of 30,000 m3 and depth
of 6m will be deplete in approximately 4 months when the site has medium textured soils but holds
water for 8.5 months in heavy soil. It becomes clear that infiltration more than any other factors is
critical in determining the services condition of the water pans. The size of the water pan and the
surface to depth ratio are also very important. This situation correlates with field observations. Some
pans were completely dry immediately after the rains while others had water for 2-3 months after the
rains, especially in Isiolo. In other three counties water pans kept water for 4-6 months after the rains
and few others especially in Baringo and Homabay retaining water for 9-12 months. It emerges that well
designed water pans have excellent capacity to meet demand but water pans less than 30,000m3 should
be discouraged under any condition.

67 | P a g e
The current irrigation water demand is approximately 106.8 m3/day and 121.9 m3/day for boreholes and
water pans respectively, based on 0.06 acre (approx. 15m x 15m) piece of land per household. The
future irrigation water demand based on 0.25 acre of irrigated land per household is 443.1 m3/day for
borehole and 509 m3/day for each water pan. Boreholes have limited capacity to support both current
and future irrigation water demand. Moreover, 32% of the boreholes have salinity problems which
render water unsuitable for irrigation. Another limitation to the use of borehole and solar PV technology
for irrigation is the limited storage provided at the water point. In all solar technology points visited,
(10,000.00)
-
10,000.00
20,000.00
30,000.00
40,000.00
0 4 8 12 16 20 24 28 32 36 40 44 48 52 56
Vo
lum
e (
m3
)
Time (weeks)
(b) Theoretical Depletion Curve (Surface Area - 5625m2)
d=3m d=4m d=5m d=6m
d=3m d=4m d=5m d=6m
0
2000
4000
6000
8000
10000
12000
14000
16000
0 2 4 6 8 10 12 14 16 18 20
Vo
lum
e (
m3
)
Time (weeks)
Theoretical Depletion Curve (Surface Atea - 2500m2)
d=3m d=4m d=5m d=6m
d=3m d=4m d=5m d=6m
Figure 21: Theoretical depletion curves without irrigation

68 | P a g e
default 5m3 plastic water storage tanks27 were provided on elevated steel platform or on top of water
kiosk. This size of storage is just enough to build localised head pressure for draw-off but not adequate
for peak demand modulation.
Figure 22 shows depletion scenarios for a water pan with a capacity of 15,000-30,000m3 in Figure (b)
when utilised to irrigate 15m x 15m farm. The duration of water availability range from 6 weeks for
15,000m3 capacity pan in high percolation condition, to 22 weeks for 30,000m3 in a pan of a depth of
6m. 22 weeks storage is sufficient to irrigate short growing crops (90-150 days). If the area under
irrigation is increased to 0.25 acres, the duration of water availability is reduced to between 3-7 weeks,
which may not be sufficient for most crops.
The duration of water availability is dependent on crop growth stages and the requirement of irrigation
water application. The duration could also be extended by increasing the storage volume, if the
catchment allows. Importantly, water pans show capacity to support irrigation demand alongside
domestic and livestock uses, provided measures to control infiltration are incorporated in water pans
designs. However water obtained from water pans has very poor quality for domestic uses.
27
Leaching from plastic water storage tanks is a source of Polycyclic aromatic hydrocarbons (PAHs) pollutants which has been identified to increase the risk of reproductive difficulties and cancer (https://www.epa.gov/ground-water-and-drinking-water/table-regulated-drinking-water-contaminants)
-
5,000.00
10,000.00
15,000.00
20,000.00
25,000.00
30,000.00
35,000.00
0 4 8 12 16 20
Vo
lum
e (
m3
)
Time (weeks)
Theoretical Depletion Curve with 0.06 acre per HH irrigated (Surface Area - 5625m2)
d=3m d=4m d=5m d=6m d=3m d=4m d=5m d=6m
(5,000.00)
-
5,000.00
10,000.00
15,000.00
20,000.00
25,000.00
30,000.00
35,000.00
40,000.00
0 4 8 12 16 20 24
Vo
lum
e (
m3
)
Time (weeks)
Theoretical Depletion Curve with 0.06 acre per HH irrigated (Surface Area - 5625 m2)
d=3m d=4m d=5m d=6m d=3m d=4m d=5m d=6m
Figure 22: Water pan depletion under combined domestic, livestock and irrigation water demand

69 | P a g e
Lastly, it is evident that water pans stored water for limited period after the rains and therefore water
pans are economical and reliable sources of water where dry weather is relatively short but less
dependable in prolonged dry weather/drought conditions. The comparative advantages of the two
technologies can be combined in a hybrid system of borehole surrounded by water-pans (for livestock
and agricultural uses). In the events of drought the boreholes can still be used for livestock and domestic
uses.
b) Solar pumping technologies
Out of the 27 solar powered
technology points across the
various ecological zones 61%
are in arid and semi-arid
ecological zones with 36% of
this being observed in Isiolo
County. 11% of the data
collected on solar energy was
collected in the humid to semi
humid zones. The uptake of
solar technology in the arid
areas is considerably high as
compared to the humid to sub-
humid areas. From Figure 24,
there is an indication that
there has been an uptake of
0
2
4
6
8
10
12 11 11
1 2 2
Nu
mb
er
of
Inst
alla
tio
ns
Max Power Output
Figure 23: Distribution of installed solar PV by size
0
5
10
15
20
25
1970-1979 1980-1989 1990-1999 2000-2009 >=2010
Nu
mb
er
inst
alle
d
Year of installation
Figure 24: Growth of solar water pumping technology
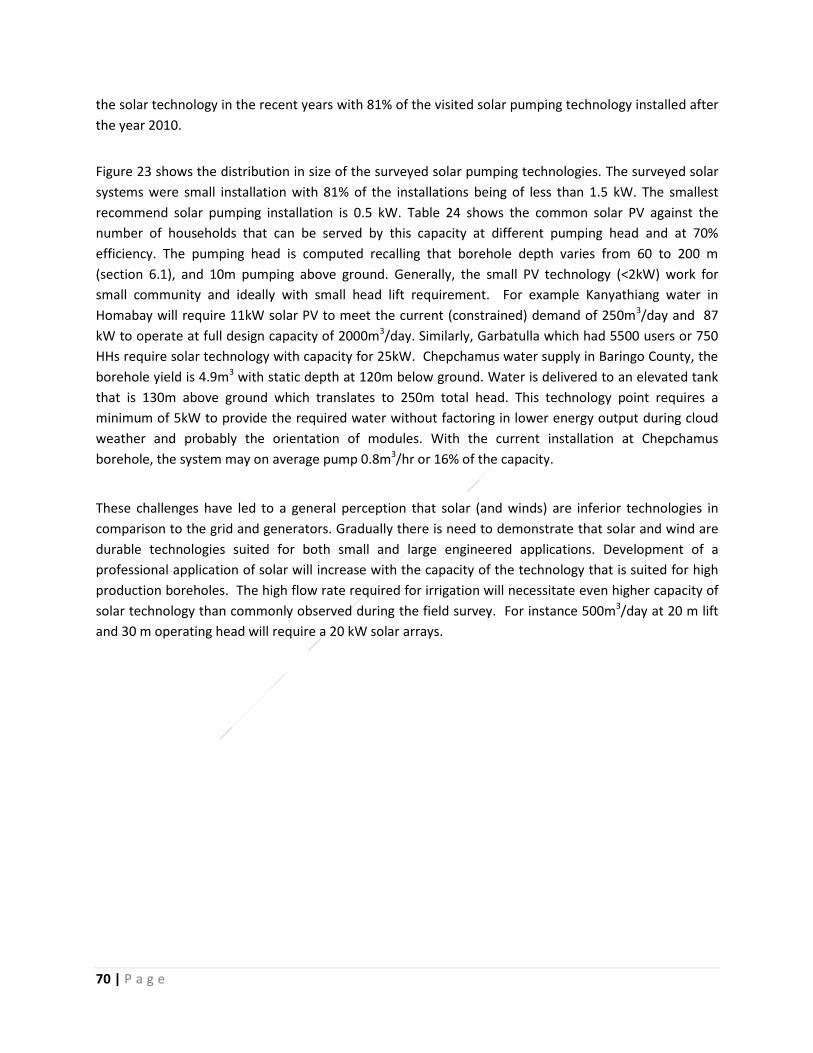
70 | P a g e
the solar technology in the recent years with 81% of the visited solar pumping technology installed after
the year 2010.
Figure 23 shows the distribution in size of the surveyed solar pumping technologies. The surveyed solar
systems were small installation with 81% of the installations being of less than 1.5 kW. The smallest
recommend solar pumping installation is 0.5 kW. Table 24 shows the common solar PV against the
number of households that can be served by this capacity at different pumping head and at 70%
efficiency. The pumping head is computed recalling that borehole depth varies from 60 to 200 m
(section 6.1), and 10m pumping above ground. Generally, the small PV technology (<2kW) work for
small community and ideally with small head lift requirement. For example Kanyathiang water in
Homabay will require 11kW solar PV to meet the current (constrained) demand of 250m3/day and 87
kW to operate at full design capacity of 2000m3/day. Similarly, Garbatulla which had 5500 users or 750
HHs require solar technology with capacity for 25kW. Chepchamus water supply in Baringo County, the
borehole yield is 4.9m3 with static depth at 120m below ground. Water is delivered to an elevated tank
that is 130m above ground which translates to 250m total head. This technology point requires a
minimum of 5kW to provide the required water without factoring in lower energy output during cloud
weather and probably the orientation of modules. With the current installation at Chepchamus
borehole, the system may on average pump 0.8m3/hr or 16% of the capacity.
These challenges have led to a general perception that solar (and winds) are inferior technologies in
comparison to the grid and generators. Gradually there is need to demonstrate that solar and wind are
durable technologies suited for both small and large engineered applications. Development of a
professional application of solar will increase with the capacity of the technology that is suited for high
production boreholes. The high flow rate required for irrigation will necessitate even higher capacity of
solar technology than commonly observed during the field survey. For instance 500m3/day at 20 m lift
and 30 m operating head will require a 20 kW solar arrays.

71 | P a g e
Table 24: Required Capacity of solar PV (kW)
Pumping head (m) HHs Served 70 80 90 100 110 120 130 150 175 200 250
15 0.2 0.3 0.3 0.3 0.4 0.4 0.4 0.5 0.6 0.7 0.8 30 0.5 0.5 0.6 0.7 0.7 0.8 0.9 1.0 1.2 1.3 1.7 45 0.7 0.8 0.9 1.0 1.1 1.2 1.3 1.5 1.8 2.0 2.5 60 0.9 1.1 1.2 1.3 1.5 1.6 1.7 2.0 2.4 2.7 3.4 75 1.2 1.3 1.5 1.7 1.8 2.0 2.2 2.5 2.9 3.4 4.2 90 1.4 1.6 1.8 2.0 2.2 2.4 2.6 3.0 3.5 4.0 5.0
105 1.6 1.9 2.1 2.4 2.6 2.8 3.1 3.5 4.1 4.7 5.9 120 1.9 2.1 2.4 2.7 3.0 3.2 3.5 4.0 4.7 5.4 6.7 135 2.1 2.4 2.7 3.0 3.3 3.6 3.9 4.5 5.3 6.0 7.6 150 2.4 2.7 3.0 3.4 3.7 4.0 4.4 5.0 5.9 6.7 8.4 165 2.6 3.0 3.3 3.7 4.1 4.4 4.8 5.5 6.5 7.4 9.2 180 2.8 3.2 3.6 4.0 4.4 4.8 5.2 6.0 7.1 8.1 10.1 195 3.1 3.5 3.9 4.4 4.8 5.2 5.7 6.5 7.6 8.7 10.9 210 3.3 3.8 4.2 4.7 5.2 5.6 6.1 7.1 8.2 9.4 11.8 225 3.5 4.0 4.5 5.0 5.5 6.0 6.5 7.6 8.8 10.1 12.6 240 3.8 4.3 4.8 5.4 5.9 6.4 7.0 8.1 9.4 10.7 13.4 255 4.0 4.6 5.1 5.7 6.3 6.8 7.4 8.6 10.0 11.4 14.3 270 4.2 4.8 5.4 6.0 6.6 7.3 7.9 9.1 10.6 12.1 15.1 285 4.5 5.1 5.7 6.4 7.0 7.7 8.3 9.6 11.2 12.8 15.9 300 4.7 5.4 6.0 6.7 7.4 8.1 8.7 10.1 11.8 13.4 16.8 315 4.9 5.6 6.3 7.1 7.8 8.5 9.2 10.6 12.3 14.1 17.6 330 5.2 5.9 6.6 7.4 8.1 8.9 9.6 11.1 12.9 14.8 18.5 345 5.4 6.2 7.0 7.7 8.5 9.3 10.0 11.6 13.5 15.4 19.3 360 5.6 6.4 7.3 8.1 8.9 9.7 10.5 12.1 14.1 16.1 20.1 375 5.9 6.7 7.6 8.4 9.2 10.1 10.9 12.6 14.7 16.8 21.0 390 6.1 7.0 7.9 8.7 9.6 10.5 11.3 13.1 15.3 17.5 21.8 405 6.3 7.3 8.2 9.1 10.0 10.9 11.8 13.6 15.9 18.1 22.7 420 6.6 7.5 8.5 9.4 10.3 11.3 12.2 14.1 16.5 18.8 23.5 435 6.8 7.8 8.8 9.7 10.7 11.7 12.7 14.6 17.0 19.5 24.3 450 7.1 8.1 9.1 10.1 11.1 12.1 13.1 15.1 17.6 20.1 25.2 500 7.8 9.0 10.1 11.2 12.3 13.4 14.5 16.8 19.6 22.4 28.0 750 11.8 13.4 15.1 16.8 18.5 20.1 21.8 25.2 29.4 33.6 42.0
1000 15.7 17.9 20.1 22.4 24.6 26.9 29.1 33.6 39.2 44.8 56.0 1250 19.6 22.4 25.2 28.0 30.8 33.6 36.4 42.0 49.0 56.0 69.9 1500 23.5 26.9 30.2 33.6 36.9 40.3 43.6 50.4 58.8 67.2 83.9 4348 68.1 77.9 87.6 97.3 107.1 116.8 126.5 146.0 170.3 194.6 243.3
c) Small Wind Turbines
Four out of the five wind systems observed during the field study were not functional. It was difficult to
follow up on data on these systems and therefore had a challenge in determining the capacity of these
systems. Furthermore, the number of dealers and manufacturers visited did not provide adequate data
to quantify the capacity of the systems. From secondary data obtained, small wind turbines are available
in varying sizes ranging from 50W to 10 KW. The small wind turbines can be designed for 12V direct

72 | P a g e
current and 240V for alternating current. Proper siting is paramount in enhancing wind flows. Large
structures are known to inhibit wind flows and therefore SWT are not suitable in a built environment.
6.2.2. Land availability for technology Installation
Production of solar energy and wind for large community water supply projects requires significant
areas of land. This is equally important when developing green water storage infrastructure such as
water pans, which require large size of land for retaining water especially during the dry season. The
land requirement per each
of the selected technology
varies depending on size
of technology, type of
soils required and the
designs. For larger solar
and water pan application,
land availability
considerations is
fundamental.
In small solar water
pumping system, the
modules are closely
placed together and
therefore the size of land
for such arrangement is
small. In Chepchamus the
borehole was equipped
with 26 solar modules,
each module having an
area size of 1.2m2, with a
total of 32m2 on elevated
platform. For bigger
community project, the
land required for
harvesting huge solar
energy is bigger. Davis and
Shirtliff company in Wajir
county has a total power
of 24KW, with a borehole
yield of 14m3/hr at a total
head of 227m. This array
Mongotio ward is within the semi-arid ecological zone faced by cases of water
scarcity. Water scarcity in this areas resulted in;
Lack of water for domestic use as well as water for their livestock
therefore affecting their livelihoods
Increased cases of water borne diseases
Long distances in search of water for their domestic use and for their
livestock
Limited social economic activities
National Youth Service develop three water pan; one with a capacity of
60,000m3
alongside two 30,000m3 each. The water pan improved accessibility
of water especially for livestock. Nonetheless, the pans have been developed in
a private land and therefore limiting accessibility. The land owner has not been
compensated for the land. The community reported that they were not involved
in the initial stages of project design. These investments have huge capacity of
water storage with a series of water pan within the same area but the impacts
are not widely felt.
Lessons
i. Community participation is very important towards ensuring demand
and sustainability of project.
ii. Land tenure is a serious issue that needs to be addressed and agreed
upon before commencement of the project.
Box 2: Mogotio Water Pan: Land availability for water infrastructure

73 | P a g e
requires 192 modules and 15m x 15m piece of land. Limited availability of this size of land has potential
to restrict application of the selected technologies in peri-urban and densely populated rural areas.
Appropriate mechanisms or partnerships are needed to ensure availability of land at the lowest possible
cost. 56.2% of the surveyed technology stands on community land, 16.9% on public land and 14.6% on
privately owned land.
6.3. Durability and Serviceability
Durability is important in understanding the potential of the selected low cost green technologies to
meet water demand over a long period of time under normal condition of use, expenditure and
maintenance. Experience in Kenya is that many newly built infrastructures deteriorate after the project’s
termination. Less than 15% of technologies more than 10 years since installation was found to be
operational. Therefore, it is imperative to plan for effective operation and maintenance as it is an
essential precondition to successful deployment of low cost technologies for water supplies.
While water coverage in rural areas is reported to have improved from 40% in 2007 reaching 48%
in 2015,(Water Services Regulatory Board (WSRB), 2016) many of these infrastructures are no
longer functioning as initially designed. Although operation and maintenance (O&M) activities are
often used as one term, it is important to distinguish between the two. Operation denotes the
direct access to the system by the users – the regulations that govern who may access the system,
when, and under what conditions, and routine procedures supporting access. By contrast,
maintenance28 is about the technical activities which are needed to keep the system working and
durable including skills, tools and spare parts.
28
Preventive maintenance is planned and carried out on a regular basis to maintain the infrastructure in wholesome condition and includes minor repairs at scheduled assessment, cleaning and greasing of mechanical parts and replacement of parts with a limited lifespan. Corrective maintenance has to do with replacement or repair faulty component, while reactive maintenance is a consequence to a crisis or complaints. It’s maintenance at failure, malfunctioning or breakdown of equipment.
20%
16%
12%
11%
9%
6%
5%
4%
4%
4%
4%
0% 5% 10% 15% 20% 25%
Equipment breakdown
Low revenues collection
Poor water quality
Lack of spare parts
Burst and leakages
Siltation
Source drying up
Embankment failure
Reduced yield
High cost of electricty and fuel
unreliable source of pumping energy
Main Technology Challenges
Figure 25: Main technology Challenges

74 | P a g e
In all, 53% of technology challenges enumerated by managers relate to post-construction maintenance
(equipment breakdown, lack of spare parts, burst and leakages, siltation, embankment failure,
unreliable source of pumping energy) Breakdown of equipment and lack of spare parts was mentioned
as the key challenge affecting technology accounting for 31%. Operational issues (low revenues
collection, high cost of electricity and fuel) comprised 20% of challenges by managers, of which
collection of revenues to meet O&M accounted for 16%, while quality and reliability of water sources
(poor water quality, source drying up and reduced water yield) represented 20% of challenges
identified.
In 62% of the technology points, maintenance take place once a year or at random irrespective of the
technology type in use. Prominently, all the 6 technology points in humid and sub-humid zones are
maintained daily, monthly or quarterly. In 31% of the cases it took two months or more to repair
technology break down. On average, it took 33 days before the repairs are undertaken. This finding
supports the perception that even when communities embrace ownership they may lack the capacity to
operate and maintain the system on their own. However, instances where technology addressed
multiple uses of water, the users largely identified with the technology and their willingness to maintain
the system sustainably was high. This was evidenced in Embu County.
Drawings lesson from hand pumps, the technology has been promoted as a sturdy technology, suited
for village level operation and maintenance. The access to the wearing parts was considered relatively
unproblematic. These characteristics made hand pump an inexpensive and attractive option for rural
water supply. The evidence coming out of the study points is contrary to this view; 58% of the hand
pumps visited was nonfunctional and many others were reported to have been abandoned and later
replaced with solar installation. The faulty components are often small and inexpensive parts. The
experience is very similar for mechanical wind pumps where the largest cause of malfunctioning was
broken rubber seal inside the casing wall. The technology provider, Bob Harries Engineering Limited, had
only one service center in Thika, 40 km north east of Nairobi. Users interviewed reported difficult in
sourcing maintenance support or spare parts in the urban centers nearest to them or otherwise
difficulties in contacting the technology supplier. In several cases they turned to the implementer for
assistance, but many eventually abandoned the use of technology when no assistance was provided.
Surprisingly, all of diesel generators observed during the survey were in functional state compared to
85% of the solar installations. 15% non-functional rate of solar installations is significantly high
considering that the majority of the installations are hardly 5-years old. A possible explanation is that
diesel generators are well known technologies among communities. The technology and spare parts
market chain is well established and in addition local skills for repair are available.
Rural Focus a local NGO with support of DFID and several partners implementing field trails of Smart
Hand pumps project in rural Kenya in 2012-13 found that most abstraction methods fitted on
community owned boreholes/ shallow wells cease to function after the second year. The project fitted
hand pumps with an accelerometer calibrated to send a signal on usage and non -usage as well as the
quantity of water being extracted. Mobile networks allow for improved management of multiple hand
pumps, thereby reducing operational and financial costs. The system allowed the immediate detection

75 | P a g e
of hand pump failure and ensured quick repairs are made quickly. It further improved accountability by
providing monthly statements of revenue and expenditure to communities. The scale of the project
made use of trained technicians to do the repairs using high quality spare parts available within the
community.
Davis and Shirtliff and Grundfos had deployed an IT supported system that allowed diagnosis of
operational faults from the head office and service centres. This ensured timely and pointed response.
The users of Grundfos operated solar technology in Embu reported that repairs were undertaken within
hours of report being made. Therefore maintenance comprises not only technical skills, but also
managerial, financial and institutional outreach.
In summary the following is observed in relation to maintenance and durability of technology deployed
for water supplies;
i. Technology intermediaries concentrated on development, and post-construction follow up
is minimal or non-existent;
ii. Neglect or delay in applying proper maintenance adversely affect the credibility of the
technology, its further development of future projects, as well as the well-being of served
populations
iii. The management capacity of local water committees, despite initial training, drops
dramatically over time as trained people lose interest, lack access to skills upgrading, or
simply move away;
iv. Community may have succeeded ensuring operation of the technology but maintenance is
limited.
v. As rural water supply systems become more technologically complex or as the number of
users increases, technology and customer-management becomes an increasing challenge
vi. Spare parts for routine maintenance, trained mechanics and equipment for handling major
repairs may be difficult to find, which result in the infrastructure being non-operational for
long periods of time.
vii. some private sector models have been developed which have showed good potential to
cover maintenance in poorer, dispersed communities
6.4. Technical skills for up scaling
Big strides have been achieved in the management of urban water supply sources, many of which are
maintained by formal water service providers operating under a performance licence from one of the
seven (7) water services boards. Similar progress has not been observed with water supply sources in
rural areas. Private or commercial arrangements are less prominent in the management of dispersed
rural water technology points. Other than for social consideration, self-supply has been embraced as
low-cost way to co-finance and expand water supplies. The absence of formal institution presents
challenges with respect to how best to harness the skills needed for deployment and sustaining low cost
green technologies for water supplies technology. Privately operated water kiosks have increased over
the last decade though the concept is young and developing, serving a small segment of the rural water

76 | P a g e
market. Few formal initiatives have been scaled up beyond the pilot stage and few individual technicians
and artisans are active in supporting the selected technologies. All these approaches increase rather
than replace community based management which results in inconsistencies in operation and
maintenance of the selected technologies.
At the national level, Water Services Trust Fund is actively focused on providing limited financing needs
for rural and peri-urban areas but it is not engaged in follow up actions especially on the technology
operation and maintenance. While devolution of water services has been reinforced by the 2010
constitution of Kenya, gaps exist at the county and sub-county level with project intermediaries focusing
more on development of these technologies and less on maintenance. In most cases the water
committee manages and oversees the system’s operation, which includes conducting preventive
maintenance, collecting tariffs or payments for repairs, keeping records of financial transactions,
manuals and blueprints, sanctioning people for non-payment, and ensuring that repairs are made.
Caretakers responsible for technology points are typically local people with basic or no formal training
for the job. 75.3% of all the care takers interviewed have learned theirs duties ‘on the job’, while 9%
have only certificate training. 58% of the caretakers have never received any training specific to the
installed technology. 12% of caretakers have received short training on the operation of the system
from government and 9% from the technology suppliers. This reflects a serious neglect of this crucial
component of technology management by the key players.
Table 25: Level of training
Training Provider to caretakers Percent
Government 12%
Water Service Providers 4%
Technology suppliers 9%
NGOs 3%
None 58%
Others 14%
Total 100%
Without external assistance, the opportunities to harness market forces to up-scale technologies and
expand coverage in rural areas appear to be restricted. Contract-based operator arrangements have
been introduced as possible alternatives for water point management by among others SNV and Kenya
Market Trust. A few Contract-based operator arrangements have been tested in the western Kenya and
the result have shown great potential in improving efficiency and sustainability of water supply systems.
Drawing lessons from Davis & Shirtliff, Rural Focus and Grundfos in deployment of rural water
technologies, for improved efficiency and sustainability rural water supply should not only adopt
curative approach that only address technology repairs but also preventive approaches that regularly
diagnoses water systems. Preventive approach ensures water managers are advised before an
equipment breakdown. Service contracts should cover equipment repairs and maintenance issues

77 | P a g e
where technology supplier commits to visit the technology two or three times a year to make a
diagnosis and prevent breakdowns.
Construction quality has major impact on sustainability. Qualitative assessments especially for water
pans exposed that poor design and construction quality lowered the chances that the system would be
sustained. In Isiolo, several cases of dry water pans were encountered where the water pan could not
collect any water due to poor sitting, poor soil conditions and embankment failure because safe
overflow paths had not been provided. This shows that exhaustive investigation had not been done or
the designer lacked competence to undertake the work. This problem affected systems built by private
contractors, by community members and by state agencies.
The findings show that low cost technologies in rural areas do not receive the same attention in term of
availability of spare parts and O&M skills as compared to the development of convectional
infrastructure. Poor construction quality was more likely to occur when supervision was limited due to
distance from the offices of intermediaries and difficulty in site access. World Vision (Kenya) narrated
several instances where weak professional inputs such as hydrogeological survey, hydrological analysis,
inappropriate sizing of components and water pan protection were the main cause of technology
failure. Consequently, World Vision has established internal technical planning unit properly equipped
with the necessary field survey equipment and maintenance skills.
Generally, there are few professionals knowledgeable in engineering of rural water technologies and/or
the financial budget may not be sufficient to support for a detailed site investigation. Provision of
capacity to professional staff involved in community systems is closely linked to the quality of
construction. The capacity may include some kind of certification training, access to planning data and if
necessary collective access to equipment and tools otherwise are not readily available.
6.5. Summary
i. The spread of the selected technologies across the four counties is evident with solar being the
predominant water abstraction method especially in semiarid to arid areas. The observed water
supply systems were small scale intended to serve few number of household and therefore had
low impacts. The water pans observed were between 10,000 m3 and 30,000 m3 and therefore
they retained water 4 to 6 months in a year.
ii. Water pans are primarily developed to support water for farming and livestock use with minimal
use for domestic uses due to poor quality of water. Water pans stored water for limited periods
after the rains and therefore water pans are economical and reliable water storage structure in
regular water conditions, fairly better in zones with short dry weather but less dependable in
prolonged dry weather conditions. Well-designed water pans have excellent capacity to meet
demand and to maximise benefits and therefore bigger investments for water pan above 30,000
m3 should be developed.
iii. There has been steady uptake of solar water pumping systems from the year 2000 onwards.
iv. The use of water pans as small storage structures have been adopted alongside other structures
such as earth dams, sand dams and small dams all distributed across all ecological zones.

78 | P a g e
v. Water uses varies across different counties and ecological zones. Water for domestic use is
dominant in all counties with most being supported by varied water abstraction methods
namely; solar, diesel generators, gravity and grid electricity.
vi. Boreholes observed had limited capacity to support irrigation. The limited storage (mostly 5-10
m3) provided at the water point further limits the use of borehole and solar PV for irrigation.
vii. The use of unskilled people in managing the O&M component continues to impact on
functionality rate and sustainability of the low cost supply systems. Government, donors and
NGOs have widely been involved in providing capital cost for the development of water
investments with little consideration to supporting the O&M component. The communities lack
the capacity to perform their day to day maintenance of the water supply. There is need to
develop a strong post implementation at the community level and a need for the implementers
to operationalize and monitor operation and maintenance of water supply structures.

79 | P a g e
7. Economic Analysis of Low Cost Green Water Technologies
The analysis presented in this section considers the cost effectiveness of the selected technologies against the benefits. The analysis is oriented to support decision on the most efficient means of deploying the selected technologies.
The economic analysis of low cost green technologies seek to determine the value of these technologies
to the community on and where possible compared to options such as electricity, hand pumping, diesel
or no-technology options. The economic analysis assesses the capital and operational costs, cost
effectiveness and cost recovery of the selected technologies. The analysis compares the relative costs to
outcome of these technologies in enhancing sustainable water supply.
7.1. Capital Expenditure and Affordability
The actual capital, operation and maintenance expenditures of surveyed technology sites were rarely
reported accurately and documentation related to cost was rarely available. This was especially the case
with respect to capital expenditure as well as operation and maintenance cost. This lack of clarity often
means that it is challenging to determine precisely the intended outputs, what was actually delivered or
how much it cost.
Table 26 shows the construction cost of abstraction technologies reported by the managers of surveyed
points. It is important to draw attention to the fact that the reported costs do not always cover the
entire value of the water supply system. For instance, the capital cost of a borehole in Homabay was
reported as Ksh 1.3 million, which compared to the market rates in Kenya, may not be realistic. It is
likely that this cost relates to the latest technology upgrade in the installation of a solar pumping
system. In other cases, the cost reported goes beyond the specific technology as the example of Nalepo
women group in Baringo shows. Here, the cost reported includes borehole drilling, solar installation and
pipe network to distribute water from borehole source. Table 26 shows that 53% of the observed
investments cost less than Kshs 1 million, while 87% of all capital investment was less than Kshs 10
million. The field survey findings shows that the average cost of developing a borehole equipped with
solar pumping is Kshs 3.45 Million, Kshs 1.86 million for borehole equipped with diesel engine and Kshs
10.5 million for systems that are powered by grid electricity. The latter most likely includes the cost of
distribution network. Table 27 is a typical commercial quote for drilling and equipping 200-m with 5kW
solar pumping near Nairobi. It validates the reported cost of solar water pumping system. The higher
cost reported during the survey may be as result of transport cost and other logistics associated with
implementation in the ASALs.

80 | P a g e
Table 26:Distribution Capital Cost Per Technology
Capital Costs Solar powered
Wind powered
Grid electricity
Gravity Bucket Total Total (%)
<=1000000 18 2 7 2 4 46 53%
1000001-10000000 9 3 7 1 7 30 34%
10000001-20000000 1 1 3 3%
20000001-30000000 1 1 1%
40000001-50000000 1 1 1%
>=50000001 4 2 6 7%
Total 28 5 19 7 11 87 100%
Table 27: Typical commercial quote for 200mm deep borehole fitted with 5kW solar pumping
Description
QTY RATE TOTAL (Ksh )
Drilling Borehole 200m 200 700 140,000
Storage Tank 650,000
Pump C/W 5kw Motor 1 300,000 300,000
6mm² 4-Core Flat Submersible Cable 180 480 86,400
Charge Controller 1 450,000 450,000
260w Crystalline Solar Modules 20 23,500 470,000
Pv Disconnect Switch 1000v-40a 1 55,000 55,000
Lockable Controller Box 1 8,000 8,000
Electrode Cable 260 20 5,200
Lorentz Well Probe Sensor 1 6,000 6,000
Galvanized Iron Pipes Class B 11/2" 30 3,200 96,000
Crane Sockets 11/2" 31 640 19,840
11/2"X6" Borehole Cover C/W Sundries 1 27,000 27,000
6mm² 4-Core Underground Cable 25 500 12,500
1.5mm² 2-Core Underground Cable - Electrodes 25 120 3,000
6mm2 Twin Flat Cable 40 230 9,200
Earth Rod C/W Clamp 1 1,000 1,000
6mm2 Earth Cable 10 230 2,300
Cooling Sleeve 1 9,000 9,000
Water Meter 11/2" 1 34,000 34,000
Solar Module Support Structure 1 195,000 195,000
25mm Pvc Airline Pipes 30 220 6,600
Installation Sundries 1 10,000 10,000
Installation, Labour And Transport 1 120,000 120,000
SUB TOTAL 2,716,040
ADD 16%VAT 277,606
TOTAL 2,993,646
The average cost rate of constructing water pans is Kshs 302/m3 of water stored though the rate is not
consistent and varies widely from Kshs 88 to 1200/m3. The average size of a water pan is 17,800m3
costing Kshs 5.4 million. Figure 26 shows the cost curves of water pan construction based on rough
construction costs estimates in Kenya. The unit rates ranges from Kshs 318 to 553 per m3 depending on

81 | P a g e
the depth, volume and economy associated with size and include the cost of excavation, protection,
equipping with solar pump and professional inputs. This means that 10000 m3 water pan costs about
Kshs 5.0 million, 30,000m3 costs Kshs 9.5 million, 70,000m3 costs Kshs 22 million, while 100,000m3 pan
will cost approximately Kshs 59 million.
The financial budget tabulated in Table 26 was 53% of the cases be sufficient to cover the cost of a
borehole with solar pumping or a water pan bigger than 10,000m3. This probably explains why the
majority of water pans observed are between 10,000-30,000m3. It seems that the emphasis is on
supplying as many people as possible with improved water within the available budget, leading to cost
ceiling. This approach tends to emphasize on the number of water pans rather than on optimizing cost
effectiveness. With all its worthy intentions, the risk of this approach is that it ends up being
counterproductive if the drive to reduce costs and increase the number of technology points is at the
expense of quality, where cheaper product are prone to early failure.
For instance, a water pan with capacity of 10,000m3 will cost Ksh 5 million, and as illustrated in Figure
26 it will at best supply water for 13 weeks and in poor unlined soils for only 5 weeks. On the other
-
5,000,000.00
10,000,000.00
15,000,000.00
20,000,000.00
25,000,000.00
30,000,000.00
35,000,000.00
40,000,000.00
45,000,000.00
50,000,000.00
55,000,000.00
60,000,000.00
65,000,000.00
70,000,000.00
75,000,000.00
3 3.5 4 4.5 5 5.5 6
Cap
ital
Co
st (
Ksh
s)
Waterpan Deoth (m)
Construction Cost versus Waterpan size
2500 3750 5625 10000 10000
Figure 26: Construction Cost versus size of water pan

82 | P a g e
hand, 30,000 m3 water pan whose capital cost is estimated at Ksh 9.5 million will supply water for 32
weeks with good underlying soil conditions or bed lining otherwise for about 14 weeks. The risk
associated with limited capital budget is that choice is often made to go with smaller size or important
components for example infiltration or silt control are omitted. As stated earlier on average cost of a
borehole fitted with solar is approximately Ksh 3.45 million, and if faced with limited budget
components such as size of water storage, optimum depth of borehole, and quality of solar installation
might be compromised or abandoned for an alternative with lower initial cost. Whichever the case, the
usefulness of the technology is compromised if the available budget is constrained or shared thinly
between points for the purpose of meeting short-term outputs - to increase coverage defined as
number of technology in a given area - as opposed to focusing on the outcome – adequate water to
meet water demand.
In most cases the capital cost has been provided by donor and government. 48% and 46% of the
technologies have been financed directly by donor/NGOs and government, with an average contribution
at 80.5% and 76% of the capital cost respectively. The beneficiaries contributed to capital finances in
17.5% of the surveyed technologies points at an average of 19.5% of
the total cost of the water supply system. Based on the on the trends
that communities contribute 20% of the initial cost, each household
would be required to contribute an average of Ksh 11,800 and Ksh
4,30029 for development of 30,000m3 water pan and borehole fitted
with solar pumping respectively. Considering significant number of
Kenya’s rural population earns less than Ksh 200 per day, this
represent at least 2 month worth of income in co-contribution (in
cash or in kind). Larger investments which are better suited for
multiple water use, would require the beneficiaries to contribute an
even higher amount. This is increasingly more expensive for the
beneficiaries to afford. Where this criteria is applied strictly, and the
beneficiaries can’t meet the requisite co-contribution the options is
to downsize the technology size and ambition or all together forego
the investment. Whichever way the potential to unlock livelihood and
productivity opportunities is compromised. Capital cost is serious
impediment to deployment and optimizes value of low-cost green technology
7.2. Cost effectiveness and benefits The major benchmark of public investment is the cost effectiveness– the ratio of the total cost of an
investment per unit of measure. For water supply, the measures of effectiveness is the change in
improved water consumed per household, the change in average water usage as a result of the
intervention, time savings or health costs and diseases averted by water interventions.
29
Cost of borehole and solar pumping depends on depth and yield
Figure 27: Criteria for Improved water supply services in Kenya (WASREB)

83 | P a g e
Implementers continuously seek ‘appropriate’ standards as ways to deliver water supplies at lower
capital costs. Common cost saving measures include reducing the capacity of the technology, change in
specifications for example compacting of embankment soils, elimination or minimization of diameter or
length of distribution pipelines, and lower cost of design and supervision inputs.
While it sounds reasonable to adjust standard criteria to suit specific circumstances in rural and peri-
urban areas, in effect a reduction in the capital costs reduces the capacity of the scheme resulting in
operation and maintenance problems. These problems often result in increased operation and
maintenance costs.
Cost per capita is often the key criteria used to determine the feasibility of water scheme and
technology. Consequently, due to lower population densities, rural and peri-urban supplies generally
cost more per capita than it is the case for formal urban communities, and thus much more in the most
sparsely populated rural areas.
To demonstrate the requirement for effectiveness of technology deployment, consider a water supply
system based on an area measuring 16 km2 (4km by 4km), and theoretically place the technology point
at the middle such that the furthest user is within 2km from the collection point. Assume this system
delivers water need for domestic, livestock and irrigation uses. Table 28 shows the population density
and average households that are possible within this area. This means that for a nearly equal investment
size, and all things constant the technology would be more effective in Homabay in terms of cost and
benefits per capita compared to Isiolo.
Table 28: Population density in target counties
County Pop Density (inh/Km2) HH size HHs/km2 HHs in 16 km2
Baringo 50.4 6.6 7.6 122
Homabay 302.08 8.5 35.5 569
Embu 183.2 6.25 29.3 469
Isiolo 5.7 7.1 0.8 13
Another important factor in analysing the effectiveness of investment of low cost technology is the
availability and reliability of water source on which solar or wind pumping technology are installed. In
Table 18, it was explained that all solar and wind pumping systems observed during the survey were
installed on boreholes. Therefore the safe yield and quality of boreholes is an important factor in
evaluating and optimising cost effectiveness of low cost renewable energy technology. The distribution
of safe borehole yields is shown in Figure 20 and how it limits effectiveness of solar and wind technology
is discussed in section 6.2.1.

84 | P a g e
Figure 28: Rainfall pattens in the target study areas
Reliability of water pan is particularly determined by rainfall endowment. Figure 28 shows the annual
rainfall dpatterns in the survey counties. Marigat and Eldama Ravine in Baringo have three rainfall
peaks in April, May and November, while areas in Embu and Isiolo counties (for example in Runyenjes
and Merti) have two sharp peaks in May and November. This is important because it defines the
duration of the dry season and intervals of water pan replenishment. If investment is made to construct
30,000m 3 water pan in Baringo (Marigat and Eldama Ravine), Embu (Mwea and Runyenjes) and
Homabay (Rongo and Ndiwa) and subject to pattern of uses describe in 6.2.1. The size of water pan in
Embu (Figure 29) results in nearly 50,000m3 water storage deficits, equivalent to 3-months demand. A
water pan of the same size will provide water through the year in Eldama Ravine (sub-humid zone) and
almost for the whole year in Marigat (Arid), Rongo (Sub-humid) and Ndiwa (Semi-Humid). Consequently,
although Marigat has only 652 mm annually compared to 854 mm in Mwea and 1376 mm in Runyenjes,
50, 000 M3 water pan it is more effective in ensuring reliable source of water supply and time savings in
Baringo than in Embu. However, the improvement in average water usage arising from the construction
of the water pan is higher in Homabay than in Baringo.
Generally, the physical and financial size of technology investment, combined effect of population
density, hence demand, and the length of dry season results are important determinant of technology
effectiveness. In this case the optimum size of water pan to ensure supply throughout the year in Embu
is 70,000m3, while 15,000m3 in Eldama Ravine is sufficient to guarantee year round supply of water. In
Homabay good rainfalls all year sustain water availability round the year but high population density
means a high draw down of water and a low ability to withstand climatic shocks.
0
50
100
150
200
250
300
350
400
0 2 4 6 8 10 12
Rainfall Pattern Target Counties
Eldama Ravine Marigat Ndhiwa Rongo
Mwea Runyenjes Isiolo Merti

85 | P a g e
7.3. Cost Benefit Analysis
-
50,000
100,000
150,000
200,000
250,000
300,000
1 2 3 4 5 6 7 8 9 10 11 12
Effectiveness of 30,000m3 storage Waterpan in Homabay
Cumm. Inflow Ndhiwa Cumm. Inflow Rongo Cumm. Consumption
-
50,000
100,000
150,000
1 2 3 4 5 6 7 8 9 10 11 12Acc
um
ula
ted
Vo
lum
e
Months
Effectiveness of 30,000m3 storage pan in Baringo
Cumm. Inflow E/Ravine Cumm. Inflow Marigat Cumm. Consumption
Figure 30: Typical Performance of 30,000 m3 Water Pan in Baringo (top) and Homabay (bottom)
-
50,000
100,000
150,000
200,000
250,000
1 2 3 4 5 6 7 8 9 10 11 12
Acc
um
alat
ed
Flo
w
Months
Effectiveness of 30,000m3 storage Waterpan in Embu
Cumm. Inflow Mwea Cumm. Inflow Runyenjes Cumm. Consumption
Figure 29: Typical Performance of 30,000 m3 Water Pan in Embu

86 | P a g e
The convectional way of analysing public investment is by means of cost-benefit analysis. The benefits
(to water user) are the estimated reduction in travel time, health cost and improved livelihoods while
the cost is the annual cost is the annualised investment and O&M charges. In the analysis Embu with
population density of 183.2 person/km2 and Baringo (50.4 person/km2) the cost benefit analysis is based
on four types of uses/functions; domestic, livestock, small scale irrigation/function and disaster
resilience.
Building on the preceding discussion there are 6 main likely scenarios, construction of either water pan
or borehole equipped with grid electricity, solar PV or diesel generator. Improved scenario will entail the
construction of distribution network, especially for transferring irrigation water.
In evaluating the benefits to domestic water supplies arising from low cost technologies, consideration is
given to that fact that some people already have improved supplies, 45% for Baringo and 58% for Embu,
(Water Services Regulatory Board (WSRB), 2016) and employment level 32% in Baringo and 91% in
Embu. Daily wage of Ksh 400/per day is allocated on prorate basis to employed proportion of users who
are employed. Average time for collecting water is taken as 4 hours daily and income benefit is allocated
on a prorate basis. Distribution network is assumed to reduce the time taken to collect domestic water
by 65% and 50% for borehole and water pan respectively. Potential of borehole water for domestic uses
is reduced by 32% equivalent to salinity incidences in groundwater and water pan because poor physical
quality is likely to restrain use. Whenever modern energy is supplied at source improved access a factor
of 56% and 20% was applied for borehole and water pan respectively.
The average livestock holding in Baringo among the served users is 6 cows and 20 sheep/goat, while in
Embu it is 0.83 cows and 1.5 sheep/goat. Based on these figures, the consumption is computed with
priority allocation to domestic and livestock uses. Operating time is 8 hours for solar PV and 18 hours
per day for grid electricity and diesel generator, which allows 4 hours daily for borehole recovery.
Considering borehole yield of 5m3/hr gives daily maximum of 40m3 for solar PV and 90m3 for 18-hour
pumping operations for diesel and grid electricity. Combined daily demand for domestic and livestock
water uses in Baringo and Embu is computed at 54.5m3/day and 19.44m3/day30. The balance of water is
available for irrigation but evidently, borehole sources have limited capacity to supply irrigation water
and much more when fitted with solar PV, because of 8-9 hours operation time. Irrigation benefits are
calculated using the price of maize, which is a common crop in Kenya, but it is possible that use of high
value crop will give more favourable figures.
The capacity of the technology to mitigate drought disaster take into account the probability of drought
occurrence, average of 3-7 years (see section 4.2), which is 5 years for Baringo and 7 years for Embu. The
second consideration is the economic cost of drought in terms of death of livestock. This risk31 is taken
as 50% in Baringo and 10% in Embu
30
Though Embu has higher human population, improved water service level is significantly high, especially in the humid, sub-humid and semi-humid areas and therefore limited scope for domestic water demand 31
Risk is a probability factor of frequency and size of the hazard. Both the frequency and intensity of drought is less in Embu and Baringo

87 | P a g e
The costs are derived from field synthesis data described in the preceding sections
Planning factors for Baringo – Service area=16 km2
– Average borehole yield = 5m3/hour
– Average Households in the areas = 122 HH
– Required water pan = 15,000m3
– Capacity Solar PV installation and diesel generator = 10kVA
– Length of distribution network 16km
– Solar PV operating time = 8 hours daily
– maximum daily borehole pumping = 18 hours
– Average consumption per HHs = 125 lpd
– Employment rate = 32%
– Improved water supply = 40%
– Livestock = 6 cows and 20 shegoats per HH
– Consumption per livestock unit32 – 50 litres/day
– Irrigated farm areas per household = 0.06 acre
– Average number of users doing irrigation = 15%
– Interests on capital =14%
– Assumed service life of infrastructure – 15 years
Planning data for Embu – Service area=16 km2
– Average borehole yield = 5m3/hour
– Average Households in the areas = 469 HH
– Required water pan = 70,000m3
– Capacity Solar PV installation and diesel generator = 10kVA
– Length of distribution network 16km
– Solar PV operating time = 8 hours daily
– Maximum daily borehole pumping = 18 hours
– Average consumption per HHs = 125 lpd
– Employment rate = 91%
– Improved water supply = 80%
– Livestock = 0.83 cows and 1.5 shegoats per HH
– Consumption per livestock unit33 – 50 litres/day
32
livestock Unit (LU) is equivalent of 3 traditional cows or 15 sheep and goats 33
livestock Unit (LU) is equivalent of 3 traditional cows or 15 sheep and goats
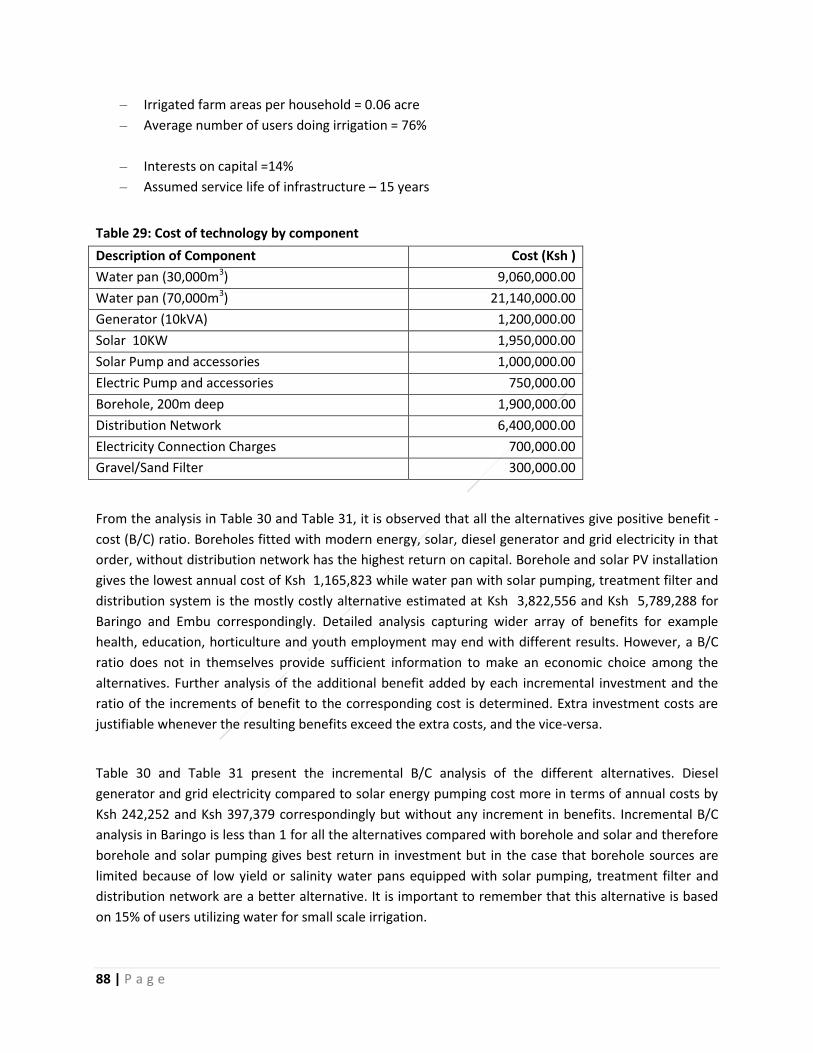
88 | P a g e
– Irrigated farm areas per household = 0.06 acre
– Average number of users doing irrigation = 76%
– Interests on capital =14%
– Assumed service life of infrastructure – 15 years
Table 29: Cost of technology by component
Description of Component Cost (Ksh )
Water pan (30,000m3) 9,060,000.00
Water pan (70,000m3) 21,140,000.00
Generator (10kVA) 1,200,000.00
Solar 10KW 1,950,000.00
Solar Pump and accessories 1,000,000.00
Electric Pump and accessories 750,000.00
Borehole, 200m deep 1,900,000.00
Distribution Network 6,400,000.00
Electricity Connection Charges 700,000.00
Gravel/Sand Filter 300,000.00
From the analysis in Table 30 and Table 31, it is observed that all the alternatives give positive benefit -
cost (B/C) ratio. Boreholes fitted with modern energy, solar, diesel generator and grid electricity in that
order, without distribution network has the highest return on capital. Borehole and solar PV installation
gives the lowest annual cost of Ksh 1,165,823 while water pan with solar pumping, treatment filter and
distribution system is the mostly costly alternative estimated at Ksh 3,822,556 and Ksh 5,789,288 for
Baringo and Embu correspondingly. Detailed analysis capturing wider array of benefits for example
health, education, horticulture and youth employment may end with different results. However, a B/C
ratio does not in themselves provide sufficient information to make an economic choice among the
alternatives. Further analysis of the additional benefit added by each incremental investment and the
ratio of the increments of benefit to the corresponding cost is determined. Extra investment costs are
justifiable whenever the resulting benefits exceed the extra costs, and the vice-versa.
Table 30 and Table 31 present the incremental B/C analysis of the different alternatives. Diesel
generator and grid electricity compared to solar energy pumping cost more in terms of annual costs by
Ksh 242,252 and Ksh 397,379 correspondingly but without any increment in benefits. Incremental B/C
analysis in Baringo is less than 1 for all the alternatives compared with borehole and solar and therefore
borehole and solar pumping gives best return in investment but in the case that borehole sources are
limited because of low yield or salinity water pans equipped with solar pumping, treatment filter and
distribution network are a better alternative. It is important to remember that this alternative is based
on 15% of users utilizing water for small scale irrigation.

89 | P a g e
In the case of Embu, a combination of water pan, solar pumping, and treatment filter and distribution
network is the best economic alternative, followed by a borehole fitted with solar PV and distribution
system. The third best alternative is a borehole fitted with solar pumping without a distribution
network. The better evaluations of distributed water supply systems in Embu come about because of
the large number of users who utilize water for irrigation. The alternative of distributed supply from
borehole sources is less efficient because of restrictions in the permissible abstraction.
The principle of ranking projects on the basis of economic analysis is important to ensure maximum
return on investment. However, such rankings have to be reconciled with political pressures that
encourage fair distribution of projects rather than maximisation of returns. Intangible factors such as
the need to stimulate the economy within a region also indicate a departure from strict capital-
budgeting rules.

90 | P a g e
Table 30: Benefit-Cost and Incremental B/C Analysis for Low-cost technology in Baringo
Project Alternatives Investment
Cost Opportunity
cost
Annual investment charges
Annual O&M
Total annual project costs
Annual Cost
Annual Benefit
B/C Incremental
Cost Incremental
Benefit
incremental Benefit-Cost Ratio
1 No Project 0 8,500,356 -
8,500,356 - -
1 Borehole + Solar 4,850,000 2,090,104 789,623 376,200 3,255,927 1,165,823 6,410,252 5.5 0 0 0
2 Borehole + Diesel Generator 3,850,000 2,090,104 626,815 781,260 3,498,178 1,408,075 6,410,252 4.55 242,252 0 0
3 Borehole + Grid Electricity 3,350,000 2,090,104 545,410 1,017,792 3,653,306 1,563,202 6,410,252 4.1 397,379 0 0
4 Water Pan alone 9,060,000 3,992,163 1,475,049 240,000 5,707,213 1,715,049 4,508,193 2.63 549,226 -1,902,059 (3.46)
5 Borehole + Solar + Dist. Network 11,250,000 1,671,491 1,831,601 536,400 4,039,491 2,368,001 6,828,866 2.88 1,202,178 418,614 0.35
6 Water pan + solar 12,010,000 3,295,971 1,955,336 616,200 5,867,507 2,571,536 5,204,385 2.02 1,405,713 -1,205,867 (0.86)
7 Water Pan + Diesel Generator 11,010,000 3,296,471 1,792,527 1,021,260 6,110,257 2,813,787 5,203,886 1.85 1,647,964 -1,206,366 (0.73)
8 water pan + Grid Electricity 10,510,000 3,296,471 1,711,122 1,257,792 6,264,886 2,968,914 5,204,385 1.75 1,803,091 -1,205,867 (0.67)
9 Water pan + solar Pump + Distribution
18,410,000 2,318,976 2,997,313 776,400 6,092,689 3,773,713 6,181,380 1.64 2,607,890 -228,872 (0.09)
10 Water pan + solar Pump + Distribution + treatment filter
18,710,000 231,898 3,046,156 776,400 4,054,453 3,822,556 8,268,459 2.16 2,656,733 1,858,207 0.70
Table 31: Benefit-Cost and Incremental B/C Analysis for Low-cost technology in Embu
Project Alternatives Investment
Cost Opportunit
y cost
Annual investment
charges
Annual O&M
Total annual project costs
Annual Cost
Annual Benefit
B/C Incremental
Cost Incremental
Benefit
Incremental Benefit-Cost Ratio
1 No Project 0 39,885,622 - 39,885,622 - -
1 Borehole + Solar 4,850,000 17,998,383 789,623 376,200 19,164,206 1,165,823 21,887,239 18.77 0 0
2 Borehole + Diesel Generator 3,850,000 17,998,383 626,814 781,260 19,406,457 1,408,075 21,887,239 15.54 242,252 0 -
3 Borehole + Grid Electricity 3,350,000 17,998,383 545,410 1,017,792 19,561,585 1,563,202 21,887,239 14 397,379 0 -
4 Borehole + Solar + Distribution 11,250,000 14,490,400 1,831,600 536,400 16,858,400 2,368,001 25,395,222 10.72 1,202,178 3,507,983 2.92
5 Water Pan alone 21,140,000 33,882,642 3,441,781 240,000 37,564,424 3,681,781 6,002,980 1.63 2,515,958 -15,884,259 (6.31)
6 Water pan + solar 24,090,000 28,074,884 3,922,067 616,200 32,613,152 4,538,268 11,810,738 2.6 3,372,445 -10,076,501 (2.99)
7 Water Pan + Diesel Generator 23,090,000 28,074,884 3,759,258 1,021,260 32,855,403 4,780,519 11,810,738 2.47 3,614,696 -10,076,501 (2.79)
8 Water pan + Grid Electricity 22,590,000 28,074,884 3,677,854 1,257,792 33,010,531 4,935,646 11,810,738 2.39 3,769,823 -10,076,501 (2.67)
9 Water pan + solar Pump + Distribution
30,490,000 19,359,194 4,964,045 776,400 25,099,640 5,740,445 20,526,428 3.58 4,574,622 -1,360,811 (0.30)
10 Water pan + solar Pump + Distribution + treatment filter
30,790,000 1,935,919 5,012,888 776,400 7,725,207 5,789,288 37,949,702 6.56 4,623,465 16,062,463 3.47

91 | P a g e
7.4. Cost Recovery
Operation & Maintenance (O&M) cost are recurrent costs which include spare parts and maintenance,
replacement of equipment, electricity and fuel charges (if applicable), abstraction charges and labour.
Table 32 shows the source of operation and maintenance finances. In 58% of the cases, the user
communities cover O&M costs through monthly contributions or through the revenue collected. The
role of donor, NGOs and private actors in post construction support is negligible.
Table 32: Sources (instances) of O&M Finance
Source of Funds Frequency Percentage
Donor 2 2%
Government 18 19%
Community /Revenue 36 58%
Private 4 4%
Others 17 17%
Total 97 100%
Table 33 shows the synopsis of total and average revenue and cost for water supply system. It is a
summation of total costs and revenue from all the points surveyed. The O&M coverage is 52%, which
means that technology points are operating in deficit. Provision for maintenance is low at 22% of the
O&M cost. The cost of energy is considerable, representing up to 50% of the O&M costs and up to 96.5%
of the revenue collected in some schemes. This situation leaves the water management committees
with nothing to maintain or use to expand the system. Solar and wind have low recurrent costs and
potentially their deployment will free more resources towards maintenance. It was found that O&M
cost recovery is uneven, either too much is raised (sometimes attracting dishonest caretakers) or too
little is raised, which is insufficient for maintenance. Either way this tends to compromise
the sustainability of technology and water supplies. The manner in which revenue is collected and
managed is thus critical to the success and sustainability of the technology deployed.
Table 33: Synopsis of Revenue and Costs (Ksh)
Item Fuel (1)
Salaries (2)
Electricity (3)
Transport (4)
Misc (5)
Maintenance (6)
Revenue (7)
Total cost for all technology points 802,000 488,000 447,200 131,450 66,000 548,350 1,294,700
Average cost per Technology Point 9,547 5,810 5,324 1,565 786 6,527 15,413
Average Operating Cost (1+2+3+4+5) 23,032
All values in Ksh
Average Maintenance cost (6) 6,527
Average O&M Cost 29,559
Average Revenue 15,413
O&M Coverage (cost/ revenue) 52%
Energy Cost to O&M /Revenue 50%/ 96.5%
Ratio of Fuel Cost to O&M / Revenue 32% / 62%
Ratio of Electricity cost to O&M/Revenue
18%/ 35%

92 | P a g e
Table 34 tabulates the instances of various recurrent costs and revenues in the surveyed technology
points, taking into account only those points where the particular costs were incurred. This provides a
more realistic average cost per point for purpose of cost-benefit analysis. What stands out is the
proportion of fuel and electricity cost compared to revenue.
Table 34: Monthly revenue, Operation and Maintenance (Ksh )
Cost Frequency Percent Average Cost
(Ksh)
Lowest (Ksh) Highest
(Ksh)
Fuel 17 20.2% 45,575 6,000 240,000
Salaries 40 47.6% 13,350 1,500 46,000
Electricity 15 16.7% 32,643 1,000 15,000
Maintenance 54 64.3% 6,180 50 70,000
Revenue 42 50% 38,075 1,000 35,000
Tariff setting is an important area of focus to ensure cost recovery and is ought to be established
considering the water source and cost of sustaining service. However in a community managed system
tariff rate is based more on common practice than on a precise calculation of a tariff that generate
revenue for a full life cycle recovery. It was found that water tariffing varies from scheme to scheme but
the majority applied ‘pay per use’ on the basis of 20 litres jerrycans. User charges were between Ksh 2
and 5 per 20 litres and Ksh 100 to 250 per M3 , which is considerably higher compared to average tariff
charged by formal water services providers (isiolo - Ksh 81, Embu - Ksh 64 and Baringo – Ksh 47). Few
operated on flat use charges ranging from Ksh 50-400 per month.
In most cases it was found that the tariff doesn’t include the depreciation cost of the water system, the
replacement of devices with relatively short life-spans (e.g. motorised pumps, electricity panels, smaller
tanks) or the energy and replacement of capital infrastructure. Such components as improvement of
water sources or use the savings to extend the network or the entire notion of care management is
neglected leading to total collapse of the system after sometime. This may explain why most
infrastructures were found to be less than 10-years old. Considering that capital components have a life-
time of 30-50 years, it might not make sense that a community save for replacements in 50 years’ time.
As a result, a demarcation between what is possible with community finance and where there is a need
for public investment should be drawn.
One case example is found in Embu, where Grundfos rehabilitated 42 predrilled boreholes in 2012. The
installation was linked to a 10- year service contract and included pumps, solar PV, 10 m3 plastic storage
tanks and a prepaid system. The cost of installation was approximately Ksh 3.5 million while the average
revenue is Ksh 20,000 per month charges at Ksh 100/m3. Grundfos levies Ksh 216,000 annually as O&M
fees. The users reported very quick attention to operational faults, normally within hours of occurrence.
All maintenance is done by Grundfos but a local technician does the operations with no pay. Despite the
technology assisting the community to obtain water easily, the users were dissatisfied with the
performance of the system in the cold season, owing to poor irradiation affecting solar energy

93 | P a g e
generation. Users had also expected the scheme to provide them with water for irrigation which not
been factored in the design of the system. Moreover, community members were dissatisfied that
Grundfos retained the revenue collected as opposed to the past whereby they collected and managed
the point.
The second challenge was the absence of local representation of Grundfos. This presented challenges
for example in the replacement of lost prepaid cards, without which users would not conveniently
collect water. The other challenge was that benefitting communities were restricted to develop the
system during the contract life with Grundfos. Many users considered for example adding small pipe
networks to the existing system necessary to reduce the water collection distance, as well as to limit
congestion at source.Most users also expected the system to provide water for irrigation but this had
not been factored into the design of the system, as the installation of individual metered connections
was deemed too expensive.
This Grundfos experience provides evidence that communities can afford annual maintenance charge.
Nonetheless the model is found to work best where population density and consumption are high
though to meet cost recovery.
Grundfos has recently started another 9 pilots of long-term equipment lease (8 in Meru County and one
in isiolo). One of the evidence coming out from the experiment with these pilots is that sales revenue
can finance professional
service and maintenance
of water projects. The
critical maintenance
challenge was the
escalating cost of valves
and the cost of
maintaining GSM
communication.
Grundfos pilot initiatives
illustrate the willingness
of communities to
engage with skilled
service providers for
capital and maintenance
improvement. One of
the challenges which
need to be addressed is
the strong sense of
ownership by the
community, and the
resulting unwillingness
to accommodate private
Figure 31: Amortisation of Ksh 3.5 Million investment debt at 5% (top) and 14% (bottom) interest rate

94 | P a g e
operators. Another challenge experienced with this model is the community perception that the
technology supplier is making huge profits from revenues. This is not necessary the always case. Poor
GSM network coverage in some locations causes delayed response to failure report by the maintenance
technicians based in Nairobi.
To rate the fairness of the
maintenance fee being charged by
Grundfos it’s evaluated against the
cost commercial debt. Figure 31
displays amortisation of commercial
investment loan of Ksh 3.5 million
(equivalent to Grundfos capital cost
in Embu). At the prevailing interest
rate in Kenya of 14%, the
community would make monthly
repayments of Ksh 54,343 over 10
years. At a lower interest rate of
5%, repayment goes down to Ksh
37,122 per month. With a 125 lpd
domestic consumption per
household at 14% and 5% interest
rate, this means that the scheme
need to supply a minimum of 145
and 99 households respectively (at
Ksh 100/m3) in order to afford
capital repayment. If the salary
cost of Ksh 13,350 is included, the
minimum number of households
required to break-even is 180 at a
14% interest rate and 135 at an
interest rate of 5 %.
Consequently, rising consumption
will increase viability of small water
supply network. Small supply
network connected to individual
consumer homes may not be viable
unless located in high-density population areas or otherwise the cost of connection is subsidized or paid
by the users themselves. Finally, suitable financing mechanisms are needed to lower repayment burden
and encourage uptake.
Box 3: Garbatulla Town Water Supply
Garbatulla town Isiolo County is a small urban centre with a population of about 5,500. The water supply is obtained from 4 connected boreholes. 2 boreholes are powered by combination of grid electivity and a stand by diesel generator, one by diesel generator and the forth using solar PV. The infrastructure was financed by the government. Grid electricity experiences frequent power outages which cause damage to electric pump motor. The diesel generator installed in 2015 is expensive to maintain and most of the time it is not operational due to lack of fuel. During the field study, the diesel generator was not operational due to equipment breakdown.
Although each household pay 400 Ksh /month for the water use, the revenues are not sufficient to cater for operation and maintenance. Often times when the water supply is limited to water obtained from the solar PV system. Frequent downtime translates to low sales, which together with high cost of electricity and fuel implies that the utility relies heavily on the county government support for operation and maintenance.
Challenges
High electricity cost
High Fuel cost
Low O&M skills to handle diesel generators
Dilapidate distribution system (1972) Low water storage capacity (storage tanks)

95 | P a g e
8. Analysing Technology Access and impacts
This section explores the diversity of the beneficiary communities and the social acceptance of the technologies, and how the communities interact with different technologies to ensure the sustainability of water supply.
Understanding the scale and reach of the management model of the technologies plays an important
role in comprehending community assimilation with the technology. Community-based management
remains the principal service model of rural water supplies delivery. This is true across all the four
counties surveyed in this study. It was found that the role of the private sector in rural and peri-urban
water provision remains limited and despite its shortcomings, community-based management remains
the dominant approach for water supplies in the target counties.
In two-third of the cases where the technology was owned by government, the system was either driven
by gravity or grid electricity. In 72.4 % of the cases surveyed, the technology was managed by a
community committee compared to 5.7% for private and licensed water service operators.
Table 35: Technology Operators
Technology Operators Total
Embu Baringo Isiolo Homa Bay Frequency Percent
Op
erat
or
WSP 1 2 1 1 5 5.7%
Management Committee
15 18 17 13 63 72.4%
Individual 5 0 0 2 7 8.0%
Private 3 0 0 2 5 5.7%
CBO 3 0 3 1 7 8.0%
Total 27 20 21 19 87
Beneficiaries’ communities contributed to 19.5% of capital and 58% of the operation and maintenance
cost. Consequently, it is evident that the communities had the greatest responsibility in post-
implementation of the technologies and provided significant contributions to investment decisions. In
situations where they do not have the skills or the experience required this constitutes a key challenge.
Therefore, management of the selected technologies cannot be neglected when addressing the social
viability. For technologies to be feasible it is important that take into consideration community
preferences, equity considerations, perceived ease of application, and reliability at different times of the
day/year and in different climatic conditions.

96 | P a g e
8.1. Preference of water supply technology
Understanding community preferences plays a key role in defining the social viability of green technologies. It was found that technology preferences are based on a number of factors such as the potential to reduce distance to water source, the easiness to use the technology, the acceptance of the selected technologies by different actors, water users’ perception of technology reliability and the ability of the technology to meet the needs of the users. These factors may have a positive effect on the individual opinion on preferred water source and technology.
Few cases of small supply systems supported by solar energy were observed during the study.34These demonstrate the potential to increase convenience and reduce the effort required to collect water through the use of solar water pumping systems.
It was found that due to the high
cost of operation and maintenance
for diesel and grid electricity
systems, communities are opting
for green technologies that are
considered easy to manage,
operate and maintain such as solar
system. For instance in the case of
the Muiya borehole water supply
project in Baringo County, the
management committee reported
to collect revenue of Ksh 160,000
both from the individual
connections and from those who
collected water from the source. On
average the committee used Ksh
100,000 for electric bills, Ksh S 20,000 Ksh for maintenance and KshS30, 000 for salaries per month. The
revenue collected and the operation and maintenance costs are considerable in the dry season. In the
dry season the revenue collected is Ksh 200,000 (150,000 Ksh used for electricity bills and Ksh 50,000 for
maintenance). The variation in revenue and operation and maintenance cost across season is due to
reliance of a roof catchment system. The committee reported that it was becoming difficult to maintain
the system and had approached the county government with a proposal of upgrading the system with
solar power. This example shows that the high cost of maintaining diesel pumps and electricity systems
is a strong parameter for community preference in favour of solar PV.
34
Chepchamus borehole in Baringo connecting 25 households, Garbatulla water supply in Isiolo County connecting serving Garbatulla North
town and part of Garbatulla south, Radat in Baringo powered by diesel engine to supply water to 9 kiosks scattered in various area and solar
powered boreholes in Kipsing, Isiolo serving 5 water kiosks scattered in various areas.
Box 4: Case of Rural Water Supply Network
The Atuota Group in Kipsing in Isiolo County was initiated in 2014 as a self-help group comprising the Samburu and Turkana cultural-ethnic groups. The project aimed at improving water supplies for domestic and irrigation uses. In 2015, Water Services Trust Fund (WSTF) upgraded the borehole from a diesel to solar water pumping system. Until then, the borehole was powered through the use of Diesel pumping systems. The community reported high running costs inhibited their ability to obtain water not only for irrigation but also for domestic use. Further, WSTF assisted in developing of water kiosks and distribution of pipelines from the water source to the kiosks. The solar water pumping system formed a mini- network providing water to;
i. 5 Water Kiosks ii. 1 Health centre iii. 1 Catholic mission iv. 1 Boarding school with 400 students v. 1 Secondary school with 200 students vi. 1 General service unit vii. 7 Individuals connected (paying Ksh 7000 for connections)
The revenue collected at this point is Kes 3000 and Kshs 6000 during wet and dry season respectively. Every household was expected to pay Kes 50 per month for their domestic water use and Kes 100 for their animals. Towards the end of 2015, violence broke out forcing the Turkana community out of the area and the water supply was destroyed. Destruction of the water supply limited the community ability to obtain vegetables at ease and at a cheaper rate.
Lessons i. Solar water pumping system can be used to distribute water to
areas far a part through a mini-network ii. Solar system can support multi-uses of water
iii. Community-based management continue to impact on the sustainability of rural water supplies

97 | P a g e
It was found that there is application of wind energy in all four counties. Knowledge gaps with regards to
the potential of wind technology were reported to impact on application of wind energy. Compared to
solar, wind pumping systems are labour intensive to maintain. Moreover, it was found that the systems
are abandoned by the communities because of limited accessibility to spare parts. Most of the wind
mechanical systems visited have been replaced by solar, electricity and diesel systems. In Isiolo County,
the Manyatta Zebra water supply project was initially powered using mechanical wind water pumping
system. But due to constant breakdown and the time it took to address breakdowns, community
approached the county government for funds to rehabilitate the borehole and equip it with solar
pumping systems instead. This is not unique to Isiolo County only, as observations and interviews in all
the four counties showed that wind energy were gradually being replaced by solar systems.
Hand pumps are often considered to be the most simple and economical system, high physical exertion
for pumping water, limited access to spare parts, limited borehole depth (max 90 m) and yields affect
the preference of the community towards this system. As a result, it was found that most of the hand
pumps across the four counties are being replaced by solar pumping systems. Solar technology is
considered to be free of effort in terms of operation, maintenance, and management, which make solar
technology the preferred solution for water pumping in the surveyed counties, compared to other
discussed technologies.
Reliability of technology from a user perceptive
is depicted by the effectiveness of the
technology over extended period of times in a
day and across different climatic conditions. On
average, all the technologies surveyed work
during 8 hours in a day. During a cloudy day,
which specially occurs in the wet season, there
is less available energy from the sun to convert
into electricity than in the dry season when the
sun intensity is higher (Figure 328). In all the
counties, solar systems had been coupled with a
storage tank, which enables constant water
supply throughout the day. The storage tank
thus complements water supply in cloudy days,
but is small in size and not based on actual demand. In contrast, diesel and electricity are not subject to
seasonal fluctuations.
The community preferences for water pans were greatly affected by the poor quality of water stored by
this technology. Water pans are largely preferred for other productive uses as compared to domestic
use. As discussed in section 6.2.1, many water pans retain water for a limited period and are therefore
not reliable for constant water supply throughout the year. Consequently, community preferences and
choice of green technologies are also affected by the number of working hours of the technologies and
seasons, as well as by the quality of water obtained.
Figure 32: solar radiation in season by hour of day

98 | P a g e
8.2. Technology uptake
In all the four counties the uptake of solar technology for water pumping is considerably high compared
to others methods. It was found that the uptake of solar technology has been influenced by a decline in
the cost of PV systems in recent years. Furthermore, various stakeholders such as the county
government and NGOs are championing for solar water pumping system due to its ease in management
and maintenance. 22 out of the 27 solar pumping systems visited were installed in the year 2010
onwards, with only one being installed between 1990 and 1999. In contrast, there has been a decline in
installation of diesel pump in recent years. Between the year 2000 and 2009 a total of 7 diesel pumps
were installed, as compared to 4 from 2010 and onwards. For grid electricity, the number of installed
electric pumps have increased between 1990 and 2010 (3 visited points were installed between 1990-
1999, 6 between 2000and 2009, 7 between 2010 and onward). The increase in the number of electric
pumps in recent years can be attributed to increased grid connection by the government's rural
electrification programme.
The decline in the cost of solar systems and limited need for maintenance has contributed to significant
uptake of these systems as reported by the local integrators of solar systems. The average current cost
of solar module/watt is Ksh 100 in Kenya. Cumulative solar sales in Kenya (since the mid-1980s)
represent more than 200,000 systems, and annual sales growth has regularly exceeded 15% over the
past decade (Jacobson, 2006). The growing availability of solar water pumps at a reduced cost therefore
offers a viable alternative to water supply systems which depend on grid electricity and diesel.
Various technology intermediaries such as the county government and NGOs have in recent years
increasingly adopted the use of green technology, as compared to conventional methods. For example,
the county government of Baringo reported that the county has been upgrading the diesel powered
pumps and hand pumps with solar system since 2013. 50% of boreholes in Baringo County are currently
running on solar energy. As reported across the four counties, long lifespan (20 years) of solar
technology and minimal running costs have enabled communities to operate and manage the systems
more easily. The county governments and NGOs reported that they have stopped giving fuel subsidies to
the communities. Without fuel subsidy, many of the diesel generators are no longer in operation. In
recent years, World Vision has reported that the organization is no longer installing diesel powered
technologies for water supply due to high cost of operation and maintenance and the heavy reliance of
fuel subsidies by the communities. Table 14 show that of the sampled water sources 34% lacked
modern energy for pumping (21.2% using buckets and 11.7% hand pumps), which reflects a potential
demand for solar systems.
Water pans have been taken up well in semi-arid and arid area firstly, water pans were intended to be
for livestock but due to erratic rainfalls, groundwater salinity and lack of alternative sources,
communities in the arid and semi-arid regions have also adopted them for small scale farming and
domestic use. Nonetheless, water pans are not well-managed, as they are mainly viewed as alternative
sources during the dry season. This has greatly affected their service life as most of the observed pans in
all the four counties are drying up due to high siltation. Despite being considered suitable storage
technologies for the dry season, their performance is limited when the water demand overcomes their

99 | P a g e
capacity. Moreover, due to high evaporation rates in arid and semi-arid areas, water pans are unable to
retain water in the dry season.
8.3. Social marketing and equitability
Socially viable technologies must be able to promote equitability and social marketing for sustainable
water supply. Equitability in water supply implies that benefits are realised by all social groups and that
the cost of water is favourable and equitable for all. 'Favourable' implies that the cost of water should
cover the essential cost of the system and 'equitable' implies that each customer should pay their
proportionate share of the cost. It was found that water pricing in rural areas does not provide an
equitable and fair platform for the various groups within the community. Poor people who cannot afford
having an individual piped connection pay more than users who are connected, despite an equal
contribution to capital costs. For instance in Baringo County (Chepchamus Community Water Supply),
households with connection were charged Ksh 300 per month for the water consumed with an
unlimited access to the type of water use, whereas individuals without individual piped connection were
charged Ksh 250 per m3 with access limited to domestic and livestock uses. This can also be compared to
the Ksh 94 per m3 charged by Nairobi City Water & Sewerage Company Limited (NCWSC) for the city
consumers. This is an indication that not only do the poor pay more for water but they also pay a higher
price in the form of time lost due to long distances to water points, and the resulting negative effects on
productivity and health.
Looking at gender equity, solar water pumping systems have provided a platform for men and women
to interact with the system on an equitable basis. Figure 33 shows 15 out of 22 surveyed solar systems
were being mostly managed by men. The participation of men and women in the operation and
management of solar technology in an equitable manner enables them to become drivers, as well as
beneficiaries of the benefits associated with these systems. Equitable interaction of both genders allows
for women and men's concerns and capabilities to be integrated in operating and managing these
systems. This creates an equal platform for sharing the benefits accrued. World Vision reported that the
benefits of the solar systems to men include reduced distances to water points. This means that men in
arid and semi-arid areas are able to spend more time with their family, as opposed to when they were
forced to walk long distances in search of water and pastures. Moreover, their participation in effective
water management enhanced development of social networks and in some cases pooling of social
capital. The pooling of social capital has developed cohesion and a platform based on investment
initiatives. Similarly, the use of this technology has empowered women economically, as they are able to
engage in small scale farming. It has also enabled them to have more time to engage in productive
activities and improved hygienic practices, which has resulted in a significant improvement of the health
of the family.

100 | P a g e
Figure 33: Gender Representation
Interestingly, it was found that youth have not been directly involved in the operation and management
of rural and peri-urban water supplies, in spite of the fact that young people are often considered
dynamic, forward looking and in the best position to benefit from innovative solutions. In fact,
interviews with youth indicated that the use of solar pumping systems has limited their productive
gains. For instance, interviewed youth in Kipsing (Isiolo County) reported that the ability of solar systems
to enhance water supply had in recent years limited the benefits they earlier accrued. Initially, they
were involved in transporting water to the community at a cost of Ksh 20 per 20 litre jerrycan. In areas
where roads were inaccessible, youth were involved in ferrying diesel to be used for water pumping by
motorbike. However, the various actors interviewed in the counties could not quantify the impacts of
solar water pumping system on youth. The main benefits of improved water supply to youth cited
include employment opportunities (operating water kiosks) and training in artisan courses. It is critical to
the sustainability of water supplies that water benefits are realised by all social groups within a
community.
Another finding is that solar water pumping systems have been adopted in schools and health centres.
Adequate water supply has supported the creation of child friendly environments in learning
institutions. These sentiments were shared by World Vision Kenya indicating that improved water supply
in learning institutions has generated considerable benefits in terms of improved child health, increased
school attendance and performance. Moreover, it was found that the use of solar energy for water
pumping and institutional lighting in the health sector has been adopted in the counties. Davis and
Shirtliff indicated that they are working with Population Services International (PSI) to supply solar
systems for lighting in 250 health centres in Kenya, where PSI acts as a loan guarantor on behalf of the
health centres and the amount obtained from the loan is paid directly to Davis and Shirtliff. PSI then
15
1
5
7
4
2
8
10
7
0
1
2
0
0
1
2
0 2 4 6 8 10 12 14 16
Solar water pumping system
wind pumping system
Diesel pump
Grid electricity
Hand Pump
Gravity
None
Others
Frequency
Tech
no
logy
Mostly Females Mostly Males

101 | P a g e
enters into agreement with the health sector on loan repayment mechanism. Similarly, Windrock
international has the same arrangement with Davis and Shirtliff to provide solar for irrigation. The ability
of solar water pumping systems to support other services such as education and health provides an
impetus for deployment of low cost technology for sustainable water supply.
8.4. Summary - Acceptability and potential for transformation and Inclusiveness i. Social acceptance of technologies is recognised as an important issue in shaping the widespread
implementation of green infrastructure for sustainable water supply, especially in underserved
areas.
ii. Solar water pumping systems have been widely accepted by communities in all the four counties.
Their acceptability is evidenced by the low effort required for their operation and maintenance and
their easiness of use. Furthermore, these technologies provide an equitable and fair platform in
terms of the benefits shared by all social groups. In recent years, solar water pumping systems
continue to be the preferred technologies among community members and other stakeholders.
iii. Water pans are largely considered to be alternative water sources, particularly during dry seasons.
The poor quality of water pans impacts on their acceptability among the community members.
Water Pans can play an important role in supporting other productive uses supplementing water
obtained from boreholes that largely support water for domestic use. It is important that larger
investments in water pans are considered to allow maximum realization of benefits.
iv. The use of green technologies for water supply shows that economic and social objectives in water
supply are not only compatible but they are also complementary. While green technology drives
poverty reduction it may simultaneously improve anticipated social outcomes. The use of green
technologies reduces the burden for women and children, who are mainly responsible for fetching
water, which gives them more time to spend on school and other income generating activities.
Furthermore, poor and marginalised groups in the four counties share the benefits of solar systems
through improved human welfare, enhanced efficiency, increased resilience to climate shocks and
continued job and business creation through enhanced water supply.
v. Green technology systems continue to offer vital opportunities to leverage stakeholders’ linkages
through working collaboratively with other players in the water sector. These linkages play an
important role in developing a human capital base of skills, knowledge and entrepreneurial
enthusiasm that will promote sustained water supply. Involvement of various actors in water pans
and solar system investments ensure that water supply interventions are holistic, effective and
sustainable.
vi. Figure 34 summarises the potential of solar systems in promoting transformation and inclusiveness
through enhanced water supply.

102 | P a g e
Figure 34: Social-economic potential of green technologies
Green systems enhancing
transformation and inclusiveness
Sufficient quantity and
quality of water assist in
combating diseases
Platform of implementation of partnership for sustainable water supply
Enhanced availability of
water and improved sanitation
Climate proofing mechanism in
ensuring sustainable
water supply
Increased access to water leads to improved food
security and incomes
Better systems of water provision improves school
attendance
Improved water supplies
enhances equity among men and
women

103 | P a g e
9. Technology Risk and Sustainability Analysis Sustainability pertains to multiple aspects of water supply, including institutional, social, technical, environmental and financial dimensions. This section examines the link between low technology base and poor functioning of water supplies and the potential obstacles to the deployment of selected technologies.
9.1. Sustainability context of selected green technologies
The challenges of managing low cost technology in areas of increasing competition for scarce water
resources are daunting. Maintaining the integrity and sustainability of water systems through the use of
methods that influence poverty levels and take explicit account of the uncertainties and risks of climate
change is an even bigger challenge. The overall water service development goal is to acheve universal
coverage by 2030 to ensure population wellbeing including health, resilience, direct employment and
other means of livelihood. Currently, the constrained ability to develop and sustainably manage water
supplies in rural and peri-urban areas is a key challenge. As a consequence water quality has remained
poor and water sources are drying up, limiting efforts to increase spatial coverage. Figure 35 shows the
key challenges users experience with water supply in the target countries, including long travel distances
to water points, which is linked to low coverage (accounting for 29% of the issues mentioned), poor
water quality (21%), water borne diseases (8%), unreliable water sources (18%), technology failures (8%)
and poor management (6%). The combined impacts of these challenges in rural and peri-urban areas
are persistent cases of poor health, vulnerability to seasonal climate variability and communities that
are trapped in cycles of poverty. Figure 35 illustrates the contextual technology risks and underlying
causes for unsustainable water supply management and the limited ability to expand water use
benefits. These include poor governance and support services, coupled with the socio-economic
situation of communities, climatic and environmental conditions and a low technology base.
29%
21%
18%
8%
8%
6%
11%
0% 5% 10% 15% 20% 25% 30% 35%
Long distances
Poor water quality
Unreliable water source
Water borne Diseases
Technology failure
Poor Management
Others
Priority water supply issues
Figure 35: Most important water supply issues

104 | P a g e
Use
r O
rie
nte
d
Mar
ket
Ori
en
ted
- Lack of program focus - Lack of accountability - Fewer resources given to
urban periphery, poor & rural communities
- Lack of livelihood & income generation in rural areas
- Rapid growth of unstructured urban areas
- Nomadic lifestyle
- Erratic rainfalls and extremes
- High and rising temperatures
- Poor water quality - Unreliable and diminishing
water sources
Low Impact on health and community Vulnerability
Low water quality Low resilience and availability of water resources
Spatial coverage Low water productivity
Constrained ability to improve and sustainably manage water supplies services and benefits
Poor governance and support services
Socio- Economic Situation Climate and Environmental risks
Sect
or
Ori
en
ted
Contextual Risks Technological Risks
Low technology base and value adding activities
- Poor quality and substandard product
- Poor service condition - Low financial capabilities
(high investment &running costs)
- Low demand & preference of the selected technology
Figure 36: Problem Tree on constrained ability to improve water supplies

105 | P a g e
9.2. Technology Risks
9.2.1. Poor quality and substandard products
Poor quality and substandard products continue to inhibit progressive uptake of green technology in
Kenya. Proliferation of sub-standard solar energy technologies and equipment continue to affect the
technology base, particularly in the water sector. Rapid expansion in the use of green technologies can
significantly lead to market penetration by sub-standard products that may fail to deliver the required
results. More than often, because of product failure - due to substandard and poor quality products -
convectional pumping system gain popularity. Consequently, the presence of substandard products
with short service life, limits communities' ability to embed low cost technologies for sustainable water
supply. The substandard systems act as market spoilers competing with high quality solar systems.
When these substandard systems fail, the reputation of the standard solar system is affected among the
community.
9.2.2. Poor service condition
Poor service condition remains one of the key contributors to low technological base in rural and peri-
urban water supply, constraining value adding activities in the provision of water services. Poor designs
and the neglect of operation and maintenance components are factors have affected the continued
functioning and sustainability of these water systems. Due to siltation of water pans and untimely
repairs to equipment breakdown in solar and wind systems a key risk is the loss of the entire
investment.
Lack of access to up-to date data and inadequate skills contribute to poor designs and constructions.
Discussion with Bob Harries Ltd for example indicated that the wind mechanical systems were installed
at a time when wind data was unavailable. The company had therefore to rely on their own experience.
Neglect of attention to catchment conditions also reduces the life of water sources and infrastructure,
particularly in the case of water pans. Only 4 out of the 25 water pans observed had a fence to restrict
uncontrolled entry of livestock. Over grazing due to large number of animals on a unit of land results in
the destruction of natural vegetation and reduces soil compaction around the water pan. This can result
in erosion and hence sedimentation reducing the lifespan of the technology.

106 | P a g e
Weak regulation and oversight of design
and implementers continues to impact
on the level of service delivery and thus
on the sustainability of rural and peri-
urban water supply. It was found that
most of the boreholes are drilled
without hydrological authentication,
which constitutes a major risk to the
investment. In 2012, the Silango
borehole in Baringo was developed by
the Africa Inland Church (AIC) and was
installed with both solar and wind
pumping systems. After two month of
operation, the submersible pump
stopped functioning due to corrosion of
the wetted surfaces because of high
levels of salinity. With close proximity to
an alternative source of water, the
community abandoned the technology.
The community reported that the water
point was neglected due to the high
maintenance cost linked to corrosion of
the moving parts of the pump and the
high salinity of the water. Furthermore,
weak enforcement on borehole drilling
has resulted in many low yielding
borehole overseen by unqualified
practitioners. Out of this kind of
experiences World Vision Kenya was
forced to develop an in-house team to
design and conduct investigations for
their supply system especially in the
drilling of boreholes. The in-house process is very expensive for implementers although it has been
successful in supporting planning, design, operation and maintenance of supply systems.
Traditionally, beneficiaries in rural and peri-urban areas become responsible for operating, maintaining
and managing the water supply systems after a short period of training. The government and donors are
installing systems ignoring the need to support the O&M component35. When unskilled people manage
the O&M component low cost technologies face the risk of becoming dysfunctional and unsustainable.
This gives a technology a bad reputation, convincing users that it cannot perform or that it has a short
lifespan, as seen in the case of the Kijito mechanical wind pumps. There is a growing attitude that rural
35
58% of the O&M cost is supported by the communities, while 2% is supported by donors and 19% by the government.
Box 5: Ngaremara Water Pan: Poor planning and design
Ngaremara ward in Isiolo faced acute water scarcity causing the communities to walk long distance in search of water, especially for their livestock. High cases of water borne diseases and children missing school in search of water were reported. To mitigate these challenges, Action Aid developed the Ngaremara water pan with a capacity of 30,000m
3(for Assets programme).
The water pan was intended to increase water supply in the area, especially to address water for livestock. However, the water pan has never stored water since it was developed. The following are some of observed challenges;
i. Poor design ii. Poor siting for the water pan iii. Soil Infiltration and percolation
Lessons
Site consideration is critical in enhancing sustainability of water pans
Poor designs affect the ability of the technology to store water
Soil erosion plays a major role in the siltation around the water pans. Therefore communities need to be trained on catchment conservation
Neglect of catchment conditions reduces the life of water
Early failure gives the technology a bad reputation

107 | P a g e
water supplies are low cost and therefore require low skills, which causes a lack of interest by high
profile professionals. This stands in contrast to what is observed in the case of urban water supplies.
Dispersed water points and wide variety of technology brands appear to be more problematic in
managing and supporting O&M services. Maintenance providers are confronted with the high unit costs
associated with serving sparse populations, a low availability of spare parts, high risks associated with
many discrete assets of unknown condition and poorly maintained roads. Establishment of adequate
management mechanisms, monitoring and regulation is therefore essential. Improved mobile telephony
and IT, performance-based operator contracts and ‘pay-per use’ approaches may prove to be effective
ways to align commercial incentives with water point sustainability objectives.
9.2.3. Low financial capability
Rural and peri-urban water supplies face huge challenges in accessing the capital needed for the
development and improvement of supply systems. The challenge of constrained ability to develop and
sustainably manage water supplies is more than often constrained by low financial capabilities, which
are normally linked to the high investment and running cost of the technologies. Low financial
capabilities in the rural and peri-urban water supplies are normally a result of inadequate revenue,
fewer resources allocated to peri-urban and rural areas and weak or inexistent financial mechanisms to
support the operation and maintenance of these systems.
The increase reliance on public funds either from the government or donors identified in rural and peri-
urban water supplies limits the choice and capacity of technology significantly. The grant character of
most water investments and the non-necessity of repayment have greatly contributed to weak or
inexistent financing mechanism. Discussion with Bob Harris and Davis and Shirtliff indicate that water
supply projects lack financial mechanism to take advantage of financing from Banks, since they do not
meet the requirements conditions demanded by commercial lenders. The creditor confidence in the
viability of water supply system as a viable business venture, capable of generating steady future
revenue flows is found to be limited. The reason for this includes the insufficient capacity to collect, a
lack of transparency and insufficient willingness and capability to pay.
Most of the technologies observed across the four counties were intended for less than 500 households.
The limited number of people served by the technology does not create a platform to attract
considerable revenues. This is also influenced by the lack of economic diversity due to the nature of
community livelihoods that are largely not considered as income generating activities, which therefore
limits the re-payment reliability of the systems. A small community base per technology limits the ability
of the technology to attract financing, thus reducing its level of credit worthiness. Furthermore,
community ownership may inhibit the possibility for public private partnerships (PPP) as community
members believe that water management should be their responsibility. This is evidenced by responses
from water users at the Wakalia Borehole in Embu managed by Grundfos, who indicated that they think
that the company collects a lot of money from the point and that they feel exploited.

108 | P a g e
It was also found that the density of water supply points at a given location can negatively impact
payment behaviour. This was the case in for example Kipsing market in Isiolo, where WSTF and Catholic
Relief Services (CRS) had both installed water points. Here the water point installed by CRS was closed
due to a disagreement on applicable charges. Finally, full recovery of capital costs through user fees was
found to be rare, which means that widespread capital investment by private enterprises and
entrepreneurs remains unlikely without external subsidies.
9.2.4. Capital budget linked to community contributions
In all the counties and ecological areas there is an expressed demand for project designs that focus on
poverty alleviation, reduce efforts and deliver benefits to beneficiaries, such as schools and clinics. A
resource based approach is common for rural and peri-urban water supplies, especially in guiding the
types of investments made. Water investments are dependent on the amount of resources available,
therefore influencing the size and choice of investment. Rural and peri-urban communities are expected
to contribute 20% of the total investments cost, which is not required in conventional urban water
supplies. Limitation to meet their part of the contribution thus limits the size and choice of technology.
When capital cost is higher compared to that of conventional water supply systems it represents an
obstacle to embedding low cost technologies for sustainable water supply. Consequently, a demand
responsive approach, which is an expression of demand and not an expression of investment value,
should be adopted. Projects may differ in their specific objectives but they have several key features in
common.
9.2.5. Demand and preference of technology
There is an increasing recognition of the failure of supply driven water supply service provision. Water
supply planners and implementers frequently focus on supplying minimum drinking water, with basic
systems with consideration to ease of operations and maintenance. Moreover, the technology
arrangement is assumed to work generally in rural areas and little attention is given to the structure or
system that delivers water services. Typically, water projections do not anticipate water use and other
variables that affect demand. This may result in a ‘"gap" between anticipated and deployed levels of
service. As a result, to achieve long-term sustainability, there is a need to focus on water supply
arrangements and infrastructures which are responsive to the needs and preferences of the
beneficiaries. These need to support users' livelihoods, by giving communities control and enable them
to make informed decisions about technology and system service delivery. This enables ownership
creation and strengthens the capacity of the communities to undertake other development activities
The analysis of suggestions by water user in Figure 37 compares improvements that would bring about
higher consumer satisfaction. The development of the distribution network is a priority in all the four
counties, followed by improved sources and storage of water and pumping energy. The extent to which
the selected technologies achieve the improvements demanded by the users is critical to the value
attached to the particular technologies and hence to their sustainability.

109 | P a g e
0
10
20
30
40Increase storage
Improve sources
Distributionnetwork
Pumping energy
Treating water
Governmentsupport
Price reduction
Improvemanagement
Number of usees suggesting improvement by Ecological zone
Humid
Semi-humid
0
10
20
30Increase storage
Improve sources
Distribution network
Pumping energy
Treating water
Government support
Price reduction
Improvemanagement
Number of users suggesting improvement type by County
Embu
Baringo
Isiolo
Homabay
Figure 37: Nature of water supplies improvement proposed by users
9.3. Summary – technology risks and sustainability
I. In realizing the importance of supplying water in rural and peri-urban areas, governments, local
and international NGOs invest substantial capital to tackle the problem of low coverage and
implement water projects.
II. The construction of water supply systems by itself does not guarantee the elimination of all
problems in rural and peri-urban areas. Functionality, utilization of technologies by the users
and the resilience of these technologies are important aspects to be considered to achieve
maximum benefits.
III. For rural and peri-urban water supplies to be sustainable, it is necessary to understand the
various risks and how these risks can be mitigated to ensure successful deployment. The
sustainability of supply systems is affected by poor service, low financial mechanisms and low
demand and specific preferences related to the selected technologies.

110 | P a g e
Poor service condition
Poor design and
constructionNeglect of O& M
Inadequate planning information
& skil ls
Inadequate enforcement
for compliance
Poor technology extension support
Lack of kno wledge
and skil ls
Low technology base and value adding activities
Low financial capabilities (high investment
and running cost
Inadequate revenueLess resource allocated to
peri-urban and rural services
Weak or inexistent financing
mechanism
Insufficient networking, products and market
awareness
Decrease funding commitment
from Donors
Competing public
expenditure
Insufficient wil lingness/
ability to pay
No transparency in financial
institutions
Insufficient capacity to
collect
Low demand and preference for technology
Inadequate response to
water demand
Ease of use &
Management
Inadequate
water sources
Unsuitable operating
environment
Frequent complex demanding operation
Underdeveloped private and public operators
Figure 38: Problem analysis of Low technology base
111 | P a g e
10. Developing Green Solutions for water supply
Beyond the fundamental benefits of lowering carbon emissions and increasing the climate resilience of communities, scaling up green technologies in the water sector has the potential to bring about significant economic, social and environmental benefits. This section highlights necessary actions and effort aimed to improve the quality and coverage of water supply services by implementing and developing the management of low cost green technology of water schemes by private operators, community and local government institutions.
10.1. Technology Funding and Financing Mechanism
Continuing at the same level and pace of investments in water supply will not deliver the requisite
volume and capital cost needed to develop sustainable water supplies. To address the issues of low
financial capabilities due to the high investment and running costs of green technologies, it is necessary
that the financial viability of rural and peri-urban water supplies is developed. The water sector will be
required to pursue innovative transformations and reforms to enhance access to external capital
sources. Efficient revenue collection and full recovery of operation and maintenance costs are
necessary for enhancing financial serviceability of the rural and peri-urban water supply systems.
Ensuring that water investments are meeting standards and are increasing service levels in term of
quality/quantity and reliability/accessibility will influence water users’ satisfaction levels and thus their
willingness to pay. Box 6 depicts a model of how to enhance efficiency in revenue collection and cost
recovery of operation and maintenance.
Additionally, to increase the bankability of water supply project, it is important that multiple uses of
waters are taken into consideration. Taking a livelihood perspective and developing supply systems that
provide explicitly for actual demands for both productive and domestic uses may have positive impacts
on the financial viability of the system. Providing safe water for drinking and water for livestock and
farming will lead to increase productivity and users will thus be able to sell their livestock and farm
produce to cover outstanding debts for water investments.
10.2. Low Cost Green Technology Project Design

112 | P a g e
Designing an appropriate project model and technology solution based on local contexts and needs, is
critical to ensuring the sustainability of water supplies. Water investments should be developed in a
manner that support national development goals of enhancing food security, creating job opportunities
and reducing disaster risks,
as described in the Vision
2030. The sizes of storage
tanks in solar water
pumping system should
reflect the water demand
for the community to
support domestic and other
productive uses. The water
sector actors should not
only consider water pans
but also small storage
structures that are
applicable to wider
ecological regions.
Development of small
storage structures will
ensure moderate flows for
upstream and downstream
users, promote production
upstream and contribute to
groundwater recharge. To
widen the benefits, the
project design should be
modelled to address the
needs of the youths and
support employment
creation, as this group was
found to be
disproportionately affected
by poor water supplies in rural and peri-urban. Access to job opportunities by youth should be made a
priority to strengthen and ensure the sustainability of water investments. Finally, it is important to
understand that water users’ aspiration goes beyond walking long distances to water point and lining up
at water sources. It is therefore essential for project designs to be made attractive for the users and to
ensure that water services support all water uses.
Box 6: Delivery Model
In 2015 Wakalia Borehole in Embu County was upgraded from a hand pump to a solar water pumping system by Grundfos through the Lifelink Projects in Kenya. The projects were developed as a means of enhancing long term sustainability of rural water supplies. Grundfos professional service team are handling the operation and maintenance of these technologies. 42 similar projects have been implemented in Kenya providing reliable access to water every day with an average of 364 operational days in a year. Grundfos signed a contract with the community management committee that would see the company run and manage the borehole for 10 years. During this period, Grundfos collects revenue from this point as a cost recovery measure for their injected capital cost.
Using the Wakalia borehole, the community are reprieved from the continuous struggle of operating, managing and maintaining water services. Since the installation of the solar water pumping system, the community around the Wakalia borehole reports to have experienced significant improvement in their living condition due to reliable water supply. “The system makes it easy for us to obtain water and cases of water borne diseases have gone down”- committee member. Some dissatisfaction with this delivery model was also expressed by community members, as they don't feel they benefit sufficiently from water service revenues. This may thus affect community ownership negatively.
In addition to the solar pumping system, Grundfos developed an automatic water dispenser with an integrated system for revenue collection and an online water management platform for full transparency and remote management. End-users can easily load credit onto water cards either through local water credit vendors or via mobile credit platforms, enabling fair and transparent transactions. Community members reported waiting long for card replacement, which limits their accessibility to the water point.
Despite some challenges this case serves as a model of service delivery where the high costs of investment are provided by a private operator, who in turn recovers costs from the revenue collected.

113 | P a g e
10.3. Business Management model
A least cost logic which focuses on investment only and leaves communities to operate and manage
technologies does not offer lasting business benefits. Rethinking current community based management
models is important to ensure the successful deployment of low cost technology for water supply. The
main risk with the current management model is that it undermines a sustainable business case for rural
water supply investments. Developing a business case for rural water supplies requires that the
disperse nature of these system is taking into account. Clustering technology by type, size, geography or
communities' social characteristics may provide an attractive approach. Effective clustering of disperse
water supplies can provide economies of scale and pool risks in the operation and financial delivery of
operation and maintenance services. As opposed to community based management that exposes the
communities to unpredictable and volatile maintenance cost, the pooling of financial risks through
cluster management may contribute to effective service delivery and increase the reliability of the
technology. As mentioned, Davis and Shirtliff indicated that they are working with PSI to supply solar
system for lighting in 250 health centres. With this, Davis and Shirtliff are able to secure a broad range of
private services for managing operation and maintenance of technologies. This reduces the burden of
technology management for the community, while at the same time providing expertise for increasing
the efficiency and sustainability of the water supplies. Hence, clustering management creates an
attractive platform for the establishment of a competitive environment for private operators.
The Grundfos Lifelink projects in Kenya have demonstrated that professional services are possible with
current user charges. In this particular case, financial and technical sustainability is built on cluster
operations of 42 water projects. By thinking in clusters, risks are mitigated by spreading services
between rural and peri-urban areas, between low and high capacity sources and across different social
set-ups. Consequently, the communities avoid the burden of managing and maintaining their water
supply, while the operator is able to sustain a viable operational model. Ultimately, communities obtain
reliable supply of water and are able to liberate their time to other engagements.
Kanyathiang water supply36 in HomaBay County is an example of a delegated management model, which
is an alternative to the community-based management model promoted since the 1970. This model has
proven that contractual relationship between government authority and a private operator can
guarantee a flow of services to the community and in the long run ensure the sustainability of the supply
system. Kanyathiang was initiated in 2012 and operationalized in 2013 with help of lake Victoria south
water services board and 8 other water supplies are under consideration for contracting to private
operators. The procurement of operators is done on a competitive basis, with Kenyan firms and part of
the staff employed must be from the host county. The scheme is running 11 kiosks and 8 schools with
19000 users. The county as the contracting authority is responsible for performance and owns the
assets. The operator provides services as per the contract conditions. This separation of functions and
responsibilities is at the core of a sustainable service.
36
It is reported that soon after this study, Kanyathiang Water Supply has ceased operation due to high production cost involved and lack of salaries for its workers

114 | P a g e
Box 7: Financial Instruments and water demand creation for rural water supplies
The ENA Irrigation multi-purpose Co-op Society project
in Kyeni South of Embu was initiated in 1989 to
improve water supplies for domestic and irrigation
uses. The project aimed at providing water for
irrigation for 278 farmers with acres ranging from 0.5
to 1 acre. With assistance from the District Water
office, the community developed a multiple use project
costing Ksh 46 Million. The project was financed by mix
of Ksh 18 million grant from by African Development
Bank and the Ksh 36 million loan facilitated through
KFW to be repaid by the project beneficiaries in 25
years.
Food production in the area has increased drastically
and surpluses are sold with clear impacts on
community members’ livelihood. The loan amount was
fully repaid by the start of 2017 from revenue
generated by agricultural activities
Success factors
Ring fencing of the water revenue, combining water for
domestic use and other productive uses, professional
and local government support, adaptable financing
mechanisms
Challenge
Defaulting by some member forcing other to take up
higher debt burden.
10.4. Capacity Development and Raising Awareness
A key component to develop the market for rural and poor water supplies is awareness raising and the
provision of professional support to demonstrate the viability and reliability of the technologies.
Rethinking the assumption that beneficiary
communities will after a short period of training
be able to operate, maintain and manage the
supply system on their own, is critical for
reliable rural water supply business models.
Capacity development should be undertaken in
such a manner that it targets various
stakeholders along the whole value chain,
including technology suppliers, financial
institutions and actors involved in the design
and installation of solar water pumping
systems, the operation and maintenance of the
systems, as well actors responsible for policy
and programme formulation.
Findings from the field study show that the key
capacity development components needed to
ensure continued functionality and
sustainability of water supply schemes are the
following:
i. Development of support structure that
addresses preventive and repair
maintenance as for example the creation of
professional associations (e.g. artisan
associations)
ii. Develop strong post implementation support
at the community and private sector level to
operationalize and monitor operation and
maintenance.
iii. Develop pilot programmes on green technologies to act as a bridge between basic knowledge
generation and technological discovery on one hand and commercial and industrial adaptation on the
other.
10.5. Policy, Legal and Regulatory Framework
The creation of steady and reliable regulation is key to unlocking investment potential and accelerates
the deployment of green technology for water supply. Without the creation of a favourable regulatory
and legal framework the adoption of green technologies for sustainable water supply will remain a small
niche market. A key precondition for their development and deployment is to ensure that operators are

115 | P a g e
brought under regulation at the onset of the development of the system. Proper governance and
regulation processes will facilitate the identification of problems at an early stage and assist in keeping
water supply developments in check throughout the project cycle. A level playing field for green
technologies vis-à-vis conventional options needs to be developed in order to build-the market
capacities of these technologies and ensure that they are cost competitive.
Furthermore, adequate standard and quality control need to be put in place to avoid the dumping of
cheap and sub-optimum technologies in the market. To this end, policy makers should establish a solid,
reliable and predictable environment which:
- Provides a level playing field between green and conventional technologies for water supply,
addressing key issues such as unfavourable administrative requirements and systematic biases
in financial regulation.
- Assures equality and transparency for all stakeholders in the market, while at the same time
maintaining private partners' and investors' confidence.
- Builds community acceptance through constant communication on the benefit of green
technology for sustainable water supply.
- Develops stable markets and operational frameworks to harness the full potential of green
technology for effective and sustainable water supply
10.6. Summary The Figure 39 below summarises the important consideration in designing a water supplies PPP
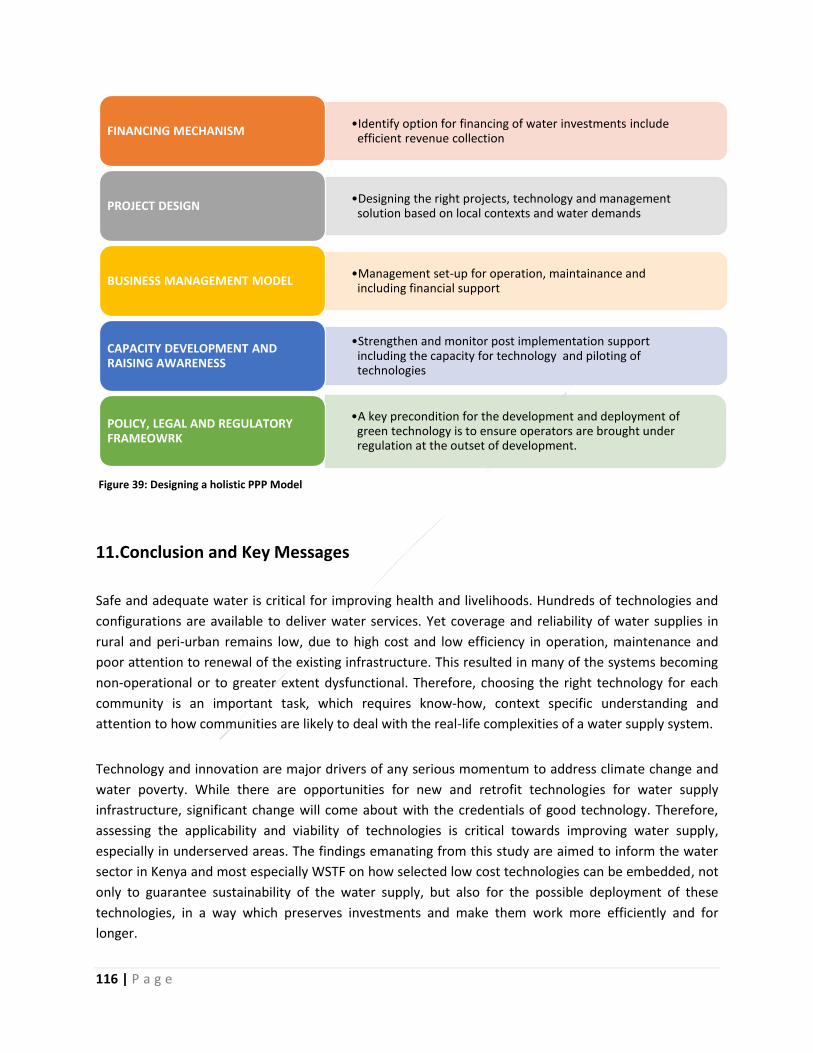
116 | P a g e
11. Conclusion and Key Messages
Safe and adequate water is critical for improving health and livelihoods. Hundreds of technologies and
configurations are available to deliver water services. Yet coverage and reliability of water supplies in
rural and peri-urban remains low, due to high cost and low efficiency in operation, maintenance and
poor attention to renewal of the existing infrastructure. This resulted in many of the systems becoming
non-operational or to greater extent dysfunctional. Therefore, choosing the right technology for each
community is an important task, which requires know-how, context specific understanding and
attention to how communities are likely to deal with the real-life complexities of a water supply system.
Technology and innovation are major drivers of any serious momentum to address climate change and
water poverty. While there are opportunities for new and retrofit technologies for water supply
infrastructure, significant change will come about with the credentials of good technology. Therefore,
assessing the applicability and viability of technologies is critical towards improving water supply,
especially in underserved areas. The findings emanating from this study are aimed to inform the water
sector in Kenya and most especially WSTF on how selected low cost technologies can be embedded, not
only to guarantee sustainability of the water supply, but also for the possible deployment of these
technologies, in a way which preserves investments and make them work more efficiently and for
longer.
•Identify option for financing of water investments include efficient revenue collection
FINANCING MECHANISM
•Designing the right projects, technology and management solution based on local contexts and water demands
PROJECT DESIGN
•Management set-up for operation, maintainance and including financial support
BUSINESS MANAGEMENT MODEL
•Strengthen and monitor post implementation support including the capacity for technology and piloting of technologies
CAPACITY DEVELOPMENT AND RAISING AWARENESS
•A key precondition for the development and deployment of green technology is to ensure operators are brought under regulation at the outset of development.
POLICY, LEGAL AND REGULATORY FRAMEOWRK
Figure 39: Designing a holistic PPP Model

117 | P a g e
11.1. Key findings
The following outlines some of the key summaries emanating from the feasibility study:
i. The majority of the technologies observed have a small capacity, with solar having a capacity of less
than 5 kW, wind power less than 1 kW, and most water pans range between 10,000 and 30,000m3
in volume 141 households share one borehole on average , while one water pan is shared by 162
households. Solar and water pans are widely in use but the functionality rate, especially for water
pans, is very low. Both technologies show great potential for creating positive impacts for the target
communities. The use of small wind turbines for water supply on the other hand is almost non-
existent in the surveyed counties. There is limited information on small electric wind turbines and
inadequate wind data to guide investment decisions. The poor performance of Kijito mechanical
wind pumps diminished users’ confidence in wind systems. Generally, the initial investment is high
for wind systems because of the installation tower. Pilot and demonstration programs are necessary
to enhance capacity building in order to bridge the gap between basic knowledge and technology
discovery.
ii. The uptake of the various types of energy sources for water pumping, including green energy, is
higher in the semi-arid and arid areas, compared to humid to sub-humid zones. However there is an
underlying perception that solar and wind are inferior technologies in comparison to grid electricity
and generators, and only suited for small applications. There is a need to demonstrate that solar and
wind technologies for water supply are durable and suited also for large engineered applications.
Solar water pumping in particular has become very common in all the counties, yet this technology
is relatively new to the market and therefore its full impact and sustainability is yet to be fully
understood.
iii. The majority of technologies primarily supplied water for domestic uses. The type and level of
additional uses for water was found to vary across the counties and ecological zones; livestock and
domestic use are dominant in Baringo, Homabay and Isiolo, whereas domestic and irrigation is
prevalent in Embu. While the configuration and specific objectives of technology application differed
in the four counties and ecological zones, they have several key features in common. These include
the demand for projects that focus on poverty reduction and job creation, and of technologies
which are be easy to use, operate and maintain. They should also deliver benefits to individuals,
communities and other beneficiary groups such as schools and health centres. Focus on the
development of multiple uses of water supply, which take into account a livelihood perspective,
increases the scope of benefits and the prospects for long term sustainability of the technologies.
iv. Water pans store water for limited periods after the rains and are therefore less dependable in
prolonged dry weather conditions. Siltation and embankment failures are the major challenges
affecting the functionality rate of the pans. However, if they are well designed, sited and properly
managed, they show great potential for improving water supply in normal and extreme climate

118 | P a g e
conditions.
v. In a few cases, utilisation of solar energy has enabled the creation of mini-grids serving water kiosks
and individuals around the water source, as the examples of Kipsing in Isiolo County and
Chepchamus in Baringo County have shown. This demonstrates the potential of solar PV systems to
increase convenience and reduce the efforts required to collect water.
vi. A high non-functionality rate of the selected technologies is influenced by poor sizing, siting and site
investigation. Better skills and access to information are needed for improved planning, design,
deployment and management of selected technologies.
vii. Community based management remains the predominant management approach in all the four
counties. Across all the counties, there is an underlying assumption that technology beneficiaries
will operate, maintain and manage the system by themselves, after only a short period of training.
For long term sustainability, the role of the community should be extended to identifying water
demand and ensuring performance and should be less focused on the day to day management of
supply systems.
viii. The selected technologies promote inclusion, participation and spread of benefits to both women
and men in all the counties. However, it was found that youth are rarely involved in water
management, with the exception of two cases (Kipsing in Isiolo & Ruma in Homabay). This
demonstrates the importance and potential of selected technology to engage and generate
employment for youth.
ix. A resource base approach has been used to guide water investment decisions, where communities
are required to contribute to the capital cost. Community contribution may have unintended
negative effects where communities (and especially project champions) take full ownership of the
project. Furthermore, for large scale investments, the ability of community to afford the mandatory
proportion (10-30%) is limited which may reduce the potential for scaling up the selected
technologies. Moreover, the amount of financial support provided by WSTF (approx. Ksh 1-10
million) tends to limit technology viability and the impact of the investment.
x. The survey observed that infrastructure deteriorates after project termination which underlines the
imperative need to plan for operation and maintenance. Entrepreneurs figure less prominently in
the management of dispersed water points. Dispersed water points and wide variation of brands
appear to be problematic, restricting the opportunities to harness market forces to expand coverage
in rural areas.
xi. The ease of O&M and the high cost of maintaining diesel pumps and electricity systems are strong
motivations in favour of solar PV. However, the seasonal fluctuations due occasional cloud cover
reducing solar irradiation, as reported in all the four counties, affect the preference and choice of
solar systems, as compared to conventional systems.

119 | P a g e
xii. Post-construction maintenance (for equipment breakdown, spare parts, burst and leakages)
undertaken by the local government was identified in all the counties. However, local level
government support and market systems for spare parts and maintenance were found to very weak.
Often community water supply managers do not know where to turn to for help when required.
xiii. Individual pump mechanics are numerous and active in all the counties, although their maintenance
service approach involves a number of weaknesses. Many contract-based arrangements have been
introduced as possible alternatives for water point management. However few of these have been
tested in the field, and for those that have, the results have been mixed. There is also a need for a
greater recognition that intermediaries have an essential role, not only in the design and
construction, but also in post-construction activities.
xiv. The ease of operation and maintenance is central to the sustainability of technologies and must
therefore be given careful consideration in their design. While it is generally known that operation
and maintenance issues are location-specific, it should be emphasized that peri-urban and rural
projects differ fundamentally in their complexity. Community managed projects are based on a basic
and undemanding system, which tends to restrict technology choices to those that can be operated
and maintained within the community without or with minimal external intervention. In peri-urban
areas, users are often migrants and therefore less bound to the same locality, which also means that
there is little social cohesion, compared to for example in rural areas. This presents a key challenge
to long-term operation and maintenance arrangements.
xv. Users in rural and peri-urban areas are disproportionately disadvantaged. In contrast to their
counterparts in urban areas, beneficiaries in rural and peri-urban areas are required to contribute to
capital investments and manage supply system on a voluntary basis. In addition, they have to pay
for water services at rates which are in many cases much higher than for their urban counterparts. It
is rare that rural areas receive subsidy for O&M, which is common for several urban water supplies.
xvi. Climate risk in water supplies is addressed by default but not exclusively. There is no evidence of
provision or guidelines that account for increasing severity and erratic patterns of weather, nor are
there dedicated units and funding set-up to spearhead climate change adaptation and mitigation for
the water sector.
xvii. There are many programmes spreading awareness and products, which potentially will create
demand for extended use of technology and critical market segments for maintenance and
management services
11.2. Recommendations
To successfully support the uptake of the selected technologies the following needs to be considered;

120 | P a g e
a. Social groups and long-term sustainability of markets need to be taken into account when
considering financial instruments The choice of financial support for low cost technology should
be comprehensive to ensure long term sustainability of the market. A combination of incentives
such as long term credit, grants and tax exemptions are indispensable in making these solutions
more affordable, while at the same time leaving room for market development. The youth
should be considered in the investment benefits, as they are considered to be dynamic, forward
looking and in the best position to spearhead and benefit from innovative solutions.
b. Consideration of climate change impacts for the water sector should be made explicit. Explicit
inclusion of climate change issues in the water sector should be in a manner that set out the
mandate of spearheading efforts in climate change adaptation and mitigation. In addition, a
comprehensive implementation framework and funding structure to ensure that investments
achieve both water services improvement, while at the same time addressing climate
vulnerability and risks across different agro-ecological regions.
c. Ease of operation and technology maintenance is central to its sustainability and high
recognition must be accorded to this fact from the planning and design stages. External
assistance to operation and maintenance in rural and low-income urban areas creates
opportunities to harness market forces for the selected technologies and subsequently expand
coverage.
d. Support commercialisation of rural and peri-urban water services. Managing clustered
technology by geography, technology type or size in order to establish a viable business scale is
essential. Output based maintenance and performance based assistance should be considered
when embedding low cost technologies for sustainable water supply. In some cases, subsidies,
guarantees and suitable financing structures for both suppliers/manufacturers and consumers
are needed for productive uses of water and to speed up technology uptake in underserved
areas. Commercialization of rural and peri-urban water supplies can be enhanced through
developing methods that promote efficiency in revenue collection.
e. Water demand creation: Current domestic water consumption of 60-120 liters per HH per day is
low and may thus not be possible for operators to break even. At the same time, basic access to
water is protected and there only so much that can be charged for water use. Therefore, there is
a need for holistic planning, which includes other water uses to create demand for water.
Planners and implementers have a role to influence productive uses of water which
simultaneously improves livelihoods, create youth employment and raise water sale revenue
necessary for water service provision viability
f. Focus on post implementation support is necessary to ensure that private operators have
access to after-sales and extension support for routine operation and maintenance. Professional
support both in term of ensuring sufficient human and financial capacity should be an integral
part of programme design for rural and peri-urban water supplies.
g. Capacity development for both artisans and professionals involved in the design is essential to
create a critical mass of skills specialised in rural and peri-urban engineering. Pilot and
demonstration programs, especially with respect to small wind turbine, are necessary to
enhance capacity building in order to bridge the gap between basic knowledge and technology
discovery.

121 | P a g e
h. Monitor technology performance and gather data. The evidence base on low cost technologies
for sustainable water supply is limited. Availability of data is therefore important for establishing
a business case for intervention and development of delivery models for different scales of
water supply. Players involved in piloting these technologies need to put in place sufficient data
gathering mechanisms to build upon the knowledge base of post-deployment impacts of low
cost green technologies solutions. This is particularly the case for wind pumping systems.
i. Rethink community management approaches in water supply services. The community based
system of water services management is not working adequately. Community cluster
management of technology is suggested as an alternative by which communities play a key role
in defining priority water uses and the application of technology, while also being involved in
monitoring the performance of operators. At the same time, community cluster management of
technology provides economies of scale and contributes to pool risks in the operation and
financial delivery of maintenance services. For small population centres, community cluster will
create a customer base that supports private sector management of mini-grid operations.
j. Small piped schemes and cluster technology are viable entry points for private sector
involvement in the management of dispersed water technology points in rural areas. It is
therefore crucial to create a facilitative environment, which is conducive to the application of
small-scale decentralized solar, small wind turbines and water pans for water supply. This may
require standardisation or a limited range of technology options, parts, designs and construction
methods. In the long-term, this will entail lower skill levels and repetitive action, which will help
to improve quality. This is seen as way to encourage local manufacture and stockist because the
limited range reduces start-up costs, increases sales and reduces the risk of dead stock.

122 | P a g e
Bibliography
1. n.d. Country Pasture/Forage Resource Profiles (Kenya). Accessed January 17, 2017. http://www.fao.org/ag/AGP/AGPC/doc/Counprof/Kenya.htm.
2. Ministry of Environment and Natural Resources, Kenya . n.d. World Water celebrations Day 2015. Accessed November 09, 2016. http://www.environment.go.ke/?p=869.
3. Silva, Izael P. Da. n.d. The four barriers for the diffusion of solar energy technologies in Africa: Trends in Kenya. Accessed January 04, 2017. http://africapolicyreview.com/analysis/four-barriers-diffusion-solar-energy-technologies-africa-trends-kenya/
4. ACTS. (2015). Innovation and Renewable Electrification in Kenya (IREK) (Vol. X). 5. AHK. (2013). Target Market Study Kenya Solar PV & Wind Power, (July), 1–77. 6. Danida. (2010). Lessons Learned and Good Practices from Support to the Kenyan Water sector.
Water, 1–95. Retrieved from http://kenya.um.dk/~/media/Kenya/Documents/Lessons learned Water in Kenya 2010.pdf
7. GESIP. (2015). Kenya Green Economy Strategy and Implementation Plan (GESIP). Maanzoni -1 Draft, (May).
8. Global, R., Aps, G. D. A., Person, C., & Callejas, R. (2015). Kenya Resilient Arid Lands Partnership for Integrated Development ( KENYA RAPID ), (202).
9. GOK (ministry of Water and Irrigation). (2005). Water Supply Design Manual. The Encyclopedia of Chicago. https://doi.org/10.1016/B978-012335185-2/50052-8
10. GoK Ministry of Energy and WinDForce. (2013). Wind Sector Prospectus Kenya. Retrieved from https://www.dropbox.com/s/zixc75hw43ud33n/wind sector prospectus kenya.pdf?dl=0
11. Goverment of Kenya. (2013). Technology Action Plan for Climate Change Technologies, Adaptation, (March).
12. Goverment of Kenya (NEMA). (2013). Technology Needs Assessment and Technology Action Plans for Climate Change Adaptation, (March), 58. Retrieved from www.tech-action.org
13. Government of Kenya. (2013). National Climate Change Action Plan 2013 -2017. 14. Government of Kenya, M. of W. and I. (2015). Practice Manual for Small Dams , Pans and Other
Water Conservation Structures, 371. Retrieved from http://smalldamsguidelines.water.go.ke/useful_downloads/pdf/PRACTICE_MANUAL_FOR_SMALL_DAMS_PANS_AND_OTHER_WATER_CONSERVATION_STRUCTURES_IN_KENYA.pdf
15. Harries, M. (1997). Disseminating Windpumps in Rural Kenya - Meeting Rural Water Needs using Locally Manufactured Windpumps. Energy Policy, 1–18. Retrieved from http://gamos.org/publications/Disseminating Windpumps in Rural Kenya - Meeting Rural Water Needs Using Locally Manufactured_Energy Policy.pdf
16. Hille, G., & Franz, M. (2011). Grid Connection of Solar PV Technical and Economical Assessment of Net-Metering in Kenya, 1–50.
17. Kamp, L. M., & Vanheule, L. F. I. (2015). Review of the small wind turbine sector in Kenya: Status and bottlenecks for growth. Renewable and Sustainable Energy Reviews, 49, 470–480. https://doi.org/10.1016/j.rser.2015.04.082
18. Kenya National Bureau of Statistics (KNBS). (2012). Kenya 2009 Population and Housing Census. Analytical Report on Population Dynamics.Ministry of Planning. Nairobi, XV(March).
19. Kenya Power & Lighting Company Limited. (2013). Kenya Distribution Master Plan, 168(4). https://doi.org/10.1111/bjd.12299
20. Kenya Soil. (n.d.).

123 | P a g e
21. Masih, I., Maskey, S., Mussá, F. E. F., & Trambauer, P. (2014). A review of droughts on the African continent: A geospatial and long-term perspective. Hydrology and Earth System Sciences, 18(9), 3635–3649. https://doi.org/10.5194/hess-18-3635-2014
22. MWI. (2015). REPUBLIC OF KENYA Ministry of Water and Irrigation The National Water Services Strategy ( NWSS ), (September 2007), 1–38.
23. Rencon Associates and JICA. (2013). Capacity Development for Promoting Renewable Energy ( Bright Project ), (November).
24. Rima, M., & Hanspeter, L. (2013). Water Harvesting: Guidelines to Good Practice. Retrieved from http://www.fao.org/docrep/u3160e/u3160e00.htm#Contents
25. Sombroek, W. G., Braun, H. M. H., & van der Pouw, B. J. a. (1982). Exploratory soil map and agro-climatic zone map of Kenya, 1980.
26. The WOT-field. (2002). English. 27. Tracy, J., Jacobson, A., & Mills, E. (2010). Assessing the Performance of LED-Based Flashlights
Available in the Kenyan Off-Grid Lighting Market, 1–20. 28. Trócaire. (2014). How climate change is driving extreme weather in the developing world -
Kenya Case Study. In How climate change is driving extreme weather in the developing world (pp. 17–22). Retrieved from https://www.trocaire.org/sites/trocaire/files/resources/policy/kenya-climate-change-case-study.pdf
29. UNIDO. (2010). Module 7: Renewable Energy Technologies. Sustainable Energy Regulation and Policymaking for Africa, 473.
30. WASREB. (2014). IMPACT: A Performance Review of Kenya’s Water Services Sector 2011 - 2012, (7), 92. Retrieved from http://wasreb.go.ke/impact-reports
31. Water and Sanitation Program-Africa. (2007). Will SWAps Fix the Water Sector?, (4). 32. Water Services Regulatory Board (WSRB). (2016). A Performance Review of Kenya’s Water
Services Sector 2014 - 2015, (9). 33. Wind Pumping. (n.d.). Retrieved November 7, 2016, from
http://kijitowindpowerkenya.com/wind-pumping.html 34. Woodhead, T. (1968). Studies of Potential Evaporation in Kenya, 1–78. 35. WSTF. (2014). WATER SECTOR TRUST FUND STRATEGIC PLAN, 2014-2019, (June).

124 | P a g e
Annexes

125 | P a g e
Annex 1: List All Key Partners And Stakeholders
LIST ALL KEY PARTNERS AND STAKEHOLDERS
NAME ORGANIZATION DESIGNATION EMAIL CONTACTS
Anne N. Angwenyi DANIDA - [email protected] 0710607385 020 425-3000
Bevly Yegon Kenya Red cross Coordinator Baringo County [email protected] 0725506154
Brian Wanderi Go solar Sales Engineer [email protected] 0707012007
Dennis Molowa Epicenter Africa Sales Engineer [email protected] 0712702095
Dennis Molowa Epicenter Africa Sales Engineer [email protected] 0712702095
Dr Pacifica F. Achieng Ogola Ministry of Environment and Natural Resources
Director Climate Change Programmes
[email protected] +254 722 296396
Dr. Arthur S. Onyuka
KIRDI CTCN Focal Person [email protected] (25471) 930-0962 (25420) 600-3884
Emmanuel Olela Kenya Rapid Isiolo County lead [email protected]; [email protected]
0780224481
Eng. Robert Gakubia WASREB CEO [email protected] 0733703638
Eng. Lawrence N. Simitu Ministry of Water and Irrigation (MoWI)
Water Secretary [email protected]
(25472) 274-4816
Eng. Peter Koome Upper Tana Natural Resources Management Project
Project manager- Water 0720804169
Francis Huhu World Vision Kenya Drilling Manager [email protected] 0726643145
Guyo Wako Isiolo Water and Sewerage Company
Managing director [email protected] 0729074256
Ismail Fahmy M. Shaiye
Water Services Trust Fund Chief Executive Officer [email protected]
(25420) 272-0696 (25472) 265-8914
Jane Wanjiku Caritas Communication, mobilization and WASH focal person
wanjiku.jane1@gmail 0724843618
Job Tomno Baringo County CECM [email protected], [email protected]
0722734511
John Nyachieo Swiss Agency for Development Cooperation
Programme Officer WASH
[email protected] 0730 694 000 0730 694 025 M:0723137486

126 | P a g e
Kinyanjui WRMA Middle Ewaso Ngiro Sub region offices in Isiolo
Sub-regional Manager 0722100667
Livingstone Odundo Homabay County Department of Water
Deputy Director of water services [email protected] 0725249910
Luigi Luminari National Drought Management Authority
technical advisor [email protected] 0733664628
Martin Mutisya World Vision Kenya Programme Coordinator-WASH & constructions
[email protected] 0721821811
Maryline Akinyi Agwa Homabay County Department of Water
Chief Officer- Water Services and Environment
[email protected] 0721835156
Mike Harries Bob Harries Ltd Chief Executive Officer [email protected] 0733/721723401
Mike Mwangi Go solar Sales Engineer 0715136564
Nathan chebii Eldama Ravine Water and Sewerage Company
Managing director [email protected] 0792915113
Norman Chege Davis & Shirtliff Solar manager [email protected] 0722781081
Patrick Thaddayos Balla World Bank Energy Specialist [email protected] 0721738994
Roman omitu Isiolo County Department of Water
[email protected] 0724568049
Stephen Kinyua Embu County C.O [email protected] 0723129905
Steve Njeru Ministry of water and irrigation- upper Tana
District Water Officer 0716409045
Steve njuki Embu County Department of Water
Chief officer water, land and environment
[email protected] 072563545
Swaleh Hassan Centre for Alternative Technologies Ltd
Solar solutions Integrator [email protected] 0736116007

127 | P a g e
Annex 2: Pictorial Description
Photo 3: water abstraction using bucket in Homabay. Animal and
humans access indiscriminately raising risk of water contamination. Common scenario is evidenced in the other three counties
Photo 3: Siltation remain the key challenge
affecting the functionality and durability of water pans
Photo 3: Poor design and siting of water pans
limits the technology ability to retain water throughout the dry season observed in Isiolo county

128 | P a g e
Photo 5: Hybrid system solar and small wind turbine in Baringo
County. The system is not functional since the submersible pump has corroded due to high water salinity
Photo 4: Mechanical wind pumps. Most
of the systems have been replaced by solar systems

129 | P a g e
Photo SEQ photo \* ARAan. Notice the ween on motorcycle fetching water for sales. This is prevalent in Homabay and Baringo
Photo 10: Woman collecting water from surface water eds growing on the water surface
Photo 9: PV array installed to replaced mechanical wind system in Lambwe, Homabay
Photo 8: Chepchomus borehole supply
water to 14 individuals’ connections & one water kiosk
Photo 7: Losambumbur borehole in Baringo supporting small scale farming and livestock use

130 | P a g e
Photo 12: Small irrigated garden near solar powered water point in Homabay
Photo 11: Greenhouses in Lambwe supported by solar PV systems

131 | P a g e
Annex 3: Key Informant synthesis report
Key informants interviews
Introduction This report presents the summaries of the various key messages emanating from discussions
with key informants. The key informants were drawn from varied institutions namely; the
county government of Baringo, Embu, Isiolo and Homabay, Upper Tana Catchment Natural
Resources Management Project –IFAD, World Vision Kenya, Red Cross society of Kenya, Caritas,
Water Resources Authority, Ministry of Water and Irrigation representing National Government,
Kenya Rapid, Water services providers; Eldamaravine Water and Sewerage Company, Isiolo
Water and Sewerage Company and Homabay Water and Sewerage Company and other
community water committees namely; Garbatulla North Water supply Committee in Isiolo
County and Muiya water supply water committee in Baringo.
Technologies used for Water
Pumping and storage of Water
- There is use of divergent pumping systems namely; electricity, diesel, solar and wind is
evident across the four counties with small dams, earth dams, water pan and sand dams
being used for storage. The use of small dams was reported in the humid areas of Baringo
and Embu County with water pans, earth dams and sand dams being reported to be
developed in the semiarid to arid areas. The use of wind water systems is not common in all
the counties, with the few existing wind mechanical systems not being functional.
- The use of solar PV for pumping water is adopted in all the four counties with new
installations being established and rehabilitation of other convectional systems namely;
diesel and hand pumps. The costs of solar investments are dependent with the capacity of
solar required against water demand. The ease and low cost in operation and maintenance
of solar systems is considered to be the main factor for rehabilitating diesels and hand
pumps with solar PV. The cost of installing solar systems is very high but its running costs
are low compared other conventional systems. Electricity and fuel subsidies are issued by
the county governments to the communities.
- Water Pans have been developed in all the counties especially in the semiarid and arid
ecological zones. Water pans are primarily used for livestock and farming and high cases of
salinity but in instances of lack of alternative sources they are used for domestic purposes.
Common technologies Vs.
Water Demand
- Common technologies used in all the four counties do not adequately meet water demand.
Water has primarily addressed domestic uses although not fully but demand for water for
livestock and irrigation is not adequately met.
- Water Pan sustain water throughout the dry season with high cases of siltation being
reported. The water quality of water pans is poor.
- Solar systems are well addressing water for domestic uses. Solar system work for eight
hours due to changes of solar irradiation in different time in a day.
Performance of common
technologies in different
season and climate extremes
- Surface water in Baringo and Isiolo counties is not reliable throughout the year with the use
of borehole observed both in dry and wet seasons.
- Water Pan are considered to be good small storage structures for addressing livestock
demand especially during climate extremes periods High evaporation during dry season
affects the ability of water pans to retain water throughout the dry season. Performance of

132 | P a g e
water pans is normally limited if water demand exceed technology capacity.
- The performance of solar water pumping system is affected in different seasons. During the
dry season due to high sunlight intensity the system output is high compared to rainy
season when the sunlight intensity is low.
Potential of selected green
technologies in addressing
water supply issues
- The green technology displays great potential for addressing the prevailing water supply
challenges. The challenges of poor construction, poor siting and limited hydrological
authentication limit the potential of the systems.
- The high running costs for conventional systems increases solar PV system potential in
enhancing accessibility of water. The use of solar system have contributed to reduction of
water borne diseases
- Post implementing support cannot be overlooked in enhancing the potential of the selected
green technologies.
challenges of ensuring
Adequate, Reliable and
Affordable water supply
- Water scarcity and erratic rainfalls
- High cost of water supply emanating from high cost of operating and maintaining
technologies especially for conventional systems.
- Heavy reliance on fuel and electricity subsidies by communities
- Poor technical support by technology intermediaries affecting system functionality rate
- Long distances to water sources; low water coverage
- High water salinity
- Limited funds for water investments
- Dilapidated water networks
source finance for
construction, operation and
maintenance
- The source of construction is pooled from varied sources namely, national and county
government, NGOs and the community
- The community contribute 10% of the capital cost either in case or in-kind (labour and
construction materials)
- The O&M cost is mainly derived from revenue collected
Management model and
capacity that will support
adoption and deployment of
selected technologies
- Constant monitor of technology performance
- Post implementation support
- Training of community on management
- Institutionalise on rural water supply systems
- Enhanced Community participation in the entire project cycle
PPP for improved water supply - Management of water resources is not income generating entity and therefore pulling in
the private sectors in the management is not possible.
- Developing of entrepreneurial processes towards the management of water is currently
being adopted through 'livelihood component in management of water resources
- concrete plan to engage the private sector is important to ensure that communities are not
over exploited by private sector interested in profit making
Do beneficiaries match up
initial pan?
- Usually beneficiaries do not match up initial plan. Nonetheless,
o water quality has been improved
o reduced distances to water points
o availability of water for productive gains

133 | P a g e
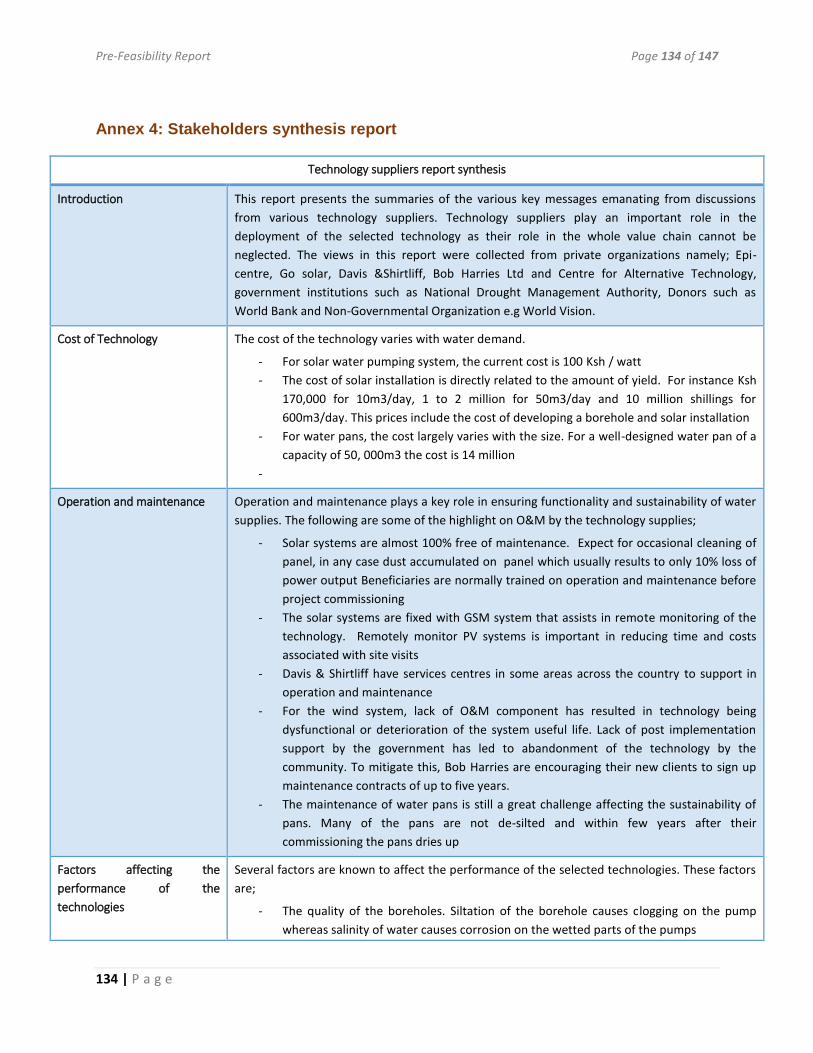
Pre-Feasibility Report Page 134 of 147
134 | P a g e
Annex 4: Stakeholders synthesis report
Technology suppliers report synthesis
Introduction This report presents the summaries of the various key messages emanating from discussions
from various technology suppliers. Technology suppliers play an important role in the
deployment of the selected technology as their role in the whole value chain cannot be
neglected. The views in this report were collected from private organizations namely; Epi-
centre, Go solar, Davis &Shirtliff, Bob Harries Ltd and Centre for Alternative Technology,
government institutions such as National Drought Management Authority, Donors such as
World Bank and Non-Governmental Organization e.g World Vision.
Cost of Technology The cost of the technology varies with water demand.
- For solar water pumping system, the current cost is 100 Ksh / watt
- The cost of solar installation is directly related to the amount of yield. For instance Ksh
170,000 for 10m3/day, 1 to 2 million for 50m3/day and 10 million shillings for
600m3/day. This prices include the cost of developing a borehole and solar installation
- For water pans, the cost largely varies with the size. For a well-designed water pan of a
capacity of 50, 000m3 the cost is 14 million
-
Operation and maintenance Operation and maintenance plays a key role in ensuring functionality and sustainability of water
supplies. The following are some of the highlight on O&M by the technology supplies;
- Solar systems are almost 100% free of maintenance. Expect for occasional cleaning of
panel, in any case dust accumulated on panel which usually results to only 10% loss of
power output Beneficiaries are normally trained on operation and maintenance before
project commissioning
- The solar systems are fixed with GSM system that assists in remote monitoring of the
technology. Remotely monitor PV systems is important in reducing time and costs
associated with site visits
- Davis & Shirtliff have services centres in some areas across the country to support in
operation and maintenance
- For the wind system, lack of O&M component has resulted in technology being
dysfunctional or deterioration of the system useful life. Lack of post implementation
support by the government has led to abandonment of the technology by the
community. To mitigate this, Bob Harries are encouraging their new clients to sign up
maintenance contracts of up to five years.
- The maintenance of water pans is still a great challenge affecting the sustainability of
pans. Many of the pans are not de-silted and within few years after their
commissioning the pans dries up
Factors affecting the
performance of the
technologies
Several factors are known to affect the performance of the selected technologies. These factors
are;
- The quality of the boreholes. Siltation of the borehole causes clogging on the pump
whereas salinity of water causes corrosion on the wetted parts of the pumps

Pre-Feasibility Report Page 135 of 147
135 | P a g e
- Poor design have resulted to drying up and silting of the water pans
Key challenges Wind systems
- Most of the technology suppliers have not be involved in development of wind systems
due to the challenges of maintenance
- Lack of skills on wind pump maintenance resulting to abandonment of the system over
time
- For bigger communities the wind system output is low not sufficient to meet the
required demand
- Implementer’s considered wind to lack a more sustainable solution to community
projects
- High cost of installation
- With the cost of solar reducing, windmill uptake has been reducing over years
- wind water pumping system trend is not foreseeable due to high cost and lack of
technical skills and solar system are taking over the market
Solar Systems
- The output of solar affected by seasonal fluctuation a case which is not experienced in
the use of grid electricity and diesel generators therefore affecting the preference and
choice of technology
- Vandalism of solar system and therefore security checks are incorporated as part of
installation cost
Water Pans
- Heavy burden of maintaining the pans is left for communities that lack this capacity therefore sustainability not guaranteed.
- Erratic rainfalls is a challenge in collection of runoff water - poor management of the systems
- Poor water quality ( high faecal components, contamination by fertilizers)
- Siltation and increased environmental degradation around the pan due to human
activities
- High rates of evaporation, infiltration and percolation
Commufnity based management of rural water supplies are not sustainable. It is important that
water supplies are institutionalised.
PPP Model comments - Water is a public good. Engaging the private sector in the management of water supply may
result to overcharging of water with an aim of making money
- High cases of unwillingness to pay for water is evident in rural water supplies therefore may
impact on the private operator mandate of making profit ability to generate profits
- WVI has engaged private operators in managing their water supply systems. The
community signs service contract with the operator. It is important that mechanisms are
put in place to ensure community benefits are realised vis-a-vis the operator is making
profits

Pre-Feasibility Report Page 136 of 147
136 | P a g e
Annex 5: survey tools
i. Technology point manager/caretaker survey questionnaire
Section 1: General Information
1. Collect GPS coordinates (automatic using mobile application) 2. Name of the interviewer 3. County: 4. Sub-county: 5. Administrative Location, Ecological Zone: 6. Photograph of the technology: 7. Year of installation /construction: 8. Weather conditions during survey 9. Period since last rainfall
Section 2: Administrative Information
10. Specific technology point a. Water Point (go to 11) b. Others (specify) (go to 13)
11. Type of water sources of water? (select all which applies)
a. Borehole, depth (if known) b. Shallow wells, depth (if known) c. Water Pan d. Small dam e. River f. Others………
12. How many months in the year is water available
a. Never b. 1 month c. 2 months d. 3 months e. 3-6 months f. 6-9 months g. 9-12 months h. Throughout
If not available throughout the year, why
13. Please specify energy source and application: c. Solar powered (go to 14) d. Wind powered (go to 15) e. Diesel f. Hand pump (go to 1817) g. Grid electricity (go to 1817) h. Gravity (go to 1817)
14. How many cells are used for the solar system?
15. Specify the wind energy?
a. Wind-electrical b. Wind- mechanical

Pre-Feasibility Report Page 137 of 147
137 | P a g e
16. What is the height of the installed windmill? (metres)
17. Is water placed in a storage tank before distribution?
a. Yes b. No c. If yes, what is the size of storage, (m
3)
18. Who owns the technology?
a. Community b. Government c. CSO d. Private Company e. Individual f. Others……………..
19. Who owns the land on which the technology stands?
i. Community ii. Individual iii. Private Institution…………. iv. Public institution………….. v. Others………….
20. Type of uses (Select all that applies)
a. Domestic (go to 21) b. Institutional (go to 21 [ii] ) c. Livestock ( go to 22 23) d. Farming (go to 24) e. Industries f. Others………..
21.
i. How many households are served by this technology point? a. 0-50 b. 50-100 c. 100-150 d. 150-200 e. > 200; specify
ii. How many users are there in the institution?
22. What is the average number of individuals in a household? …….
23. How many animal are served by this technology point?
a. Cattle……….. b. Sheep & Goat……….. c. Donkey……… d. Camel……….
24. How many farmers are serviced by this technology point? a. 0-50 b. 50-100 c. 100-150

Pre-Feasibility Report Page 138 of 147
138 | P a g e
d. 150-200 e. > 200; specify
25. What is the average size of irrigated land for each farmer?
Section 2: Financial Analysis
26. What is the source of construction finance? (Select all that applies and percentage Contributed) a. Donor b. Government c. Community d. Private e. Others………
27. What is the approximate construction cost?
28. What is the source of operating and maintenance finance? (Select all that applies and percentage
Contributed) a. Donor b. Government c. Community d. Private e. Revenue f. Others………
29. What are the main challenges experienced while using this technology? (Select all that applies)
a. Equipment breakdown b. Complex/difficult to operate c. Lack of spare parts d. Low revenues collection e. others (specify)
30. Who operates the technology?
31. Is the caretaker/ operator skilled?
a. Yes b. No c. If Yes, What is his qualification?
32. Is there anyone who provides training to caretaker/ operator?
a. Government b. technology supplier c. NGO d. Others (specify)
33. What are the normal operation costs of the technology? a. Fuel cost……. b. Operator salary….. c. Others (specify)….
34. How often is does the system undergo maintenance?
i. Bi yearly ii. Quarterly iii. Yearly

Pre-Feasibility Report Page 139 of 147
139 | P a g e
iv. > Year (specify)…………
35. How long does it take for repairs to be addressed? i. 1-3 days ii. 4-6 days iii. 1 week iv. 2 Month v. > 2 month specify………..
36. Which components of the technology fail most often?
37. What is the approximate cost of maintenance per month………
38. is any improvement that’s needed to improve performance of technology
39. Who does the maintenance?
a. County government b. Local technician c. External technician d. Technology supplier e. Others……..
40. Does the technology have
a. Operation plan (Y/N) b. Maintenance plan (Y/N)
41. How much is charged for the water?
e. Domestic (per m3)…………
f. Cattle……….. g. Sheep & Goat……….. h. Donkey……… i. Camel……….
42. What is average amount collected in a month……….
Section 3: Technical Analysis
43. Does the technology have the capacity to handle the water needs in the community? a. Yes b. No If no, what is the problem?
44. What is the capacity / size of the technology a. If water storage…….m
3
b. if borehole, yield …….m3/hour
c. If powered ………. □ watts □ kVA
45. On average, how many hours does it work in a day?.....
46. Does it work differently during different times of the day ? a. Yes b. No

Pre-Feasibility Report Page 140 of 147
140 | P a g e
If yes, explain………
47. Does it work differently during different times/seasons of the year? c. Yes d. No
If yes, explain………
48. Do you think the technology is reliable? a. Yes b. No
If no, why………….
49. Consumer distance to this water technology point? a. What is the distance covered by the furthest consumer of this water Technology? (km) b. How much time does it take the furthest user to reach this technology point (Minutes)
50. Average distance to alternative water sources?
c. How far is the alternative water sources from the nearest source (km) d. How much time does it take to reach the alternative water source (minutes)
Section 4: Social Analysis
51. Which technology do you think is best to enhance water supply in the area? (max three)
52. Are the users satisfied with the technology? a) Very satisfied b) Satisfied c) Not satisfied d) Very Dissatisfied (if not, why?)
53. What are some of the benefits accrued by the users of this technology
54. In your perception, what are the most important water related issues in this area?
55. Are you aware if there are water uses constrained by the amount of water available from this technology?
Section 5: Water Quality
56. Is the water good for purposes (drinking, livestock, irrigation) 57. Related to 56, what is the impact of the water quality on users?
iii. USER INTERVIEW QUESTIONNAIRE
Instructions to participants:
The Water Services Trust Fund is undertaking field survey on the potential of water pan, solar and wind energy to improve water service level in the underserved urban and rural areas across the country.
The survey will determine among others;
i. Prevalence of selected technology in different parts of the country, ii. If technologies currently in use provide adequate water supply in different climate zones and seasons,
otherwise the potential of the selected technology to overcome critical challenges facing water supply iii. Arrangement that’s best placed to make selected technology easily available and minimise operation
failures.
Feedback from this study will greatly contribute to the social aspect of this assessment. Your participation will be appreciated and confidentiality will be observed with respect to your feedback.

Pre-Feasibility Report Page 141 of 147
141 | P a g e
Part I Personal and General Data
1. Date and time interview (automatic)
2. GPS coordinate (Automatic) 3. County, Ward and administrative location, Ecological zone 4. Name of the interviewer 5. What is your name? (Optional)______________ 6. What is your telephone number and email address (if available)? ……………………………. 7. What is your gender? M F 8. What is your occupation? 9. How many members are there in your household?
Part II Existence of water sources and functionality
10. Which is the common source(s) of your water supply: i. Wet season
ii. Dry season (Provide selection list - tick more than one source where necessary)
a) Piped network b) Borehole c) Water Pan d) Sand Dams e) Shallow well f) Rivers g) Private rainwater tank , specfy construction material h) Others (Specify)……………………………….)
11. From the answer above, what method is used for abstracting water in your nearest source of water supply? a. Solar water pumping system b. wind pumping system c. Diesel pump d. Hand Pump e. Grid electricity f. Gravity g. None h. Others…………….(specify)
12. How is water obtained from this technology used? (Select all that applies)
g. Domestic h. Livestock i. Poultry and fishing rearing j. Farming k. Commercial (specify) l. Others………..
13. What is the current status of your main water sources in terms of functionality? a.) Functional (go to 19) b.) Non functional

Pre-Feasibility Report Page 142 of 147
142 | P a g e
c.) Temporarily down d.) Don’t know
If not functional or temporarily down, explain
14. How many months in the year is water available at the nearest water technology point a. Never b. 1 month c. 2 months d. 3 months e. 3-6 months f. 6-9 months g. 9-12 months h. Throughout
15. On average, how many hours in a day is technology at your nearest water source working?
16. Does the technology at your nearest point work differently in different time of day?
e. Yes f. No
If yes, explain………
17. Does the technology work differently in different times/seasons of the year? g. Yes h. No
If yes, explain………
18. Do you think the technology is use at your nearest water source is reliable?
Yes
No
If no, why………….
19. In your own opinion, what are the main challenges observed in provision of water using this technology……………………..
Part III Technology Point Operation and Management
20. Who is responsible for managing this technology? a) County Government b) NGOs/CBOs c) Individual d) private e) None f) Others………… (Specify)
21. If yes, how many times in a week are they present at the water sources?
a) Once a week b) Twice a week c) Three times and above
d) Never present e) Do not know
22. Is there water manager/caretaker resident in this community?
a) Yes

Pre-Feasibility Report Page 143 of 147
143 | P a g e
b) No
23. Usually, what is the gender of the water manager/caretaker?
a) Mostly males
b) Mostly females
24. Have conflicts over water arisen within the community since the technology was implemented? If yes which ones and how was it resolved?
25. From the above mentioned technologies, in your opinion what improvement should be introduced to ensure water supply?
Part IV Level Community Contribution towards O&M
26. How much do you pay for the water fetched?
27. Do people in your community contribute towards the following water services?
You may tick more than one where necessary
a) Initial investment cost Yes No
b) Operation and maintenance Yes No
c) Do not contribute at all
d) Do not know
28. Are you satisfied with how the caretakers respond to water and technology problems?
Please indicate by ticking, whether you are; 1 = extremely satisfied, 2 = satisfied, 3 = dissatisfied or 4 = extremely dissatisfied, using a scale given between 1-4, with 4 being the highest score
1 □ 2 □ 3 □ 4 □
If not satisfied, why
Part V Level of support by government/NGO agencies
29. Is there any kind of support offered to your community or water management committee by the following agencies? a) National Goverement agencies Yes No b) County government Yes No c) CDF Yes No d) NGO Yes No e) Private contractors Yes No f) Others (Specify)……………
30. Do you know what kind of support is provided by the above organizations?
31. If yes, how satisfied are you with the level of support to ensure provision and sustainability of water supply by these agencies?
Please indicate by ticking, whether you are; 1 = extremely satisfied, 2 = satisfied, 3 = dissatisfied or 4 = extremely dissatisfied, using a scale given between 1-4, with 4 being the highest score
a). County government 1 □ 2 □ 3 □ 4 □
b). Sub County Local government 1 □ 2 □ 3 □ 4 □
c). NGOs 1 □ 2 □ 3 □ 4 □
d). Private contractors 1 □ 2 □ 3 □ 4 □
e). Others (Specify)…………………………... 1 □ 2 □ 3 □ 4 □

Pre-Feasibility Report Page 144 of 147
144 | P a g e
Part Vi Impact of Technology To the user
32. Are you satisfied with the technology being used Yes No
33. If no, why?.............................................................. 34. How can you rate the water technology easiness in use?
Please indicate by ticking, whether you are; 1 = extremely satisfied, 2 = satisfied, 3 = dissatisfied or 4 = extremely dissatisfied, using a scale given between 1-4, with 4 being the highest score 1 □ 2 □ 3 □ 4 □
35. Average distance/time to the nearest water point? e. How far is nearest water source from your home (km) f. How much time does it take to reach the nearest water source (minutes)
36. Average distance/time to the alternative water sources?
g. How far is the nearest alternative water sources (km) h. How much time does it take to reach the nearest alternative water source (minutes)
37. How much time do you spend daily to fetch water?
38. Who in your household is typically responsible for fetching water? 39. Has the technology assisted you to obtain water easily?
Yes No If no, how so?....................................................
40. In your opinion, what could be done to improve water supply in this area? a)………………………………………………………………………………… b)………………………………………………………………………………… c)…………………………………………………………………………………
41. Is the water good for consumption? a. Yes b. No
42. Is the water obtained from this technology enough for your needs? a. Yes b. No
43. a. How much water do you collect everyday? b. How much water do you require for all your daily needs?
Part VI: Interviewer Observation Remarks
1. The technology point e.g. the state of water pan. solar and wind installation (please allow for space to type
in) 2. The physical environment of the site e.g. the environmental hygiene and sanitation (please allow for space to
type in)
3. The protection systems e.g. the fencing among others (please allow for space to type in)
4. Any other thing that will be of interest to the team (please allow for space to type in)

Pre-Feasibility Report Page 145 of 147
145 | P a g e
ii. Questions guide for semi-structured interview
(Key Informants & Focus Group Discussions)
Name of interviewee or group:
Organization:
Level of responsibility: Place of interview
Date:
A. Policy and Top Management (Line ministries, County Executives, National Agencies)
1. Which technologies are commonly used for storage and pumping water supplies and which factors mostly influence technology choice?
(Guide to interviewer: How important are these factors, are water pan, solar and wind energy ranked among the most prevalent technologies? How many have been constructed in the last 1-year and by who?)
2. Do the common technologies adequately address water demand and development priorities
(Guide to interviewer: Which are the priority water needs, are benefits equitably distributed, what quality is required for priority water uses, what is the pattern of water demand)
3. What is the performance of common water technologies (and water pans, solar and small wind turbines, if
any) in different seasons and climate extremes (Guide to interviewer: do the current technologies [and selected low-cost technologies, if available] adequately meet water demand, throughout the year, is the quality adequate for priority water uses, what is the pattern of water demand vis-à-vis the technology capacity)
4. What is the potential contribution of green technologies, specifically water pans, solar and wind energy in
addressing water supply challenges (Guide to interviewer: Is there a systematic effort to incorporate green technologies in water supplies or it happens at random, who are the key actors; suppliers, standard and regulation, capacity building, O&M)
5. How do you engage private sector in the improvement of water supply?
(Guide to interviewer: Is there a strategy to engage private sector participation in development and management of water supplies?)
B. Implementation and Middle Level Management
(Project and Water Service Managers, Technology suppliers, civil society)
1. Which are the main challenges towards ensuring water supply is adequate, reliable and affordable across the year in the county/country?
(Guide to interviewer: Are efficiency gap known and articulated in the management plans? is there potential for water pans, solar and wind energy to address these challenges?)

Pre-Feasibility Report Page 146 of 147
146 | P a g e
2. What is the main source finances for construction, operation and maintenance of water supply?
(Guide to interviewer: How is the cost infrastructure development met? Is cost recovery mechanism in place? Is revenue collected sufficient to maintain water supplies? Is the cost affordable to the users?
3. What is the potential contribution of water pans, solar and wind energy in addressing cost and technical
challenges
(Guide to interviewer: Is there a strategy for greening water supply? if green technology has been implemented what is the experience, are water pan, solar and wind energy sources among the preferred technologies)
4. Which management model and capacity will support adoption and deployment of water pans, solar and small
wind energy technologies for sustainable water supplies?
(Guide to interviewer: What knowledge, technology management and capacity gaps require attention for deployment of water pans, wind and solar energy?)
5. Do the current beneficiaries match up the initial plan? (Guide to interviewer: in cases where water pan, solar and wind technology is implemented, what were the envisaged ben3fits at the beginning, were the target benefits achieved, if exceed or less than expected, why?)
Focus Group Discussion Guide
1. Has this technology improved the amount and quality of water available round the year?
(Guide to interviewer: How is water availability situation before the technology and now?)
2. What are the impacts brought about by the implementation of this technology? Who has benefited the most?
(Guide to interviewer: What difference has the technology made in the way people relate, derive income, spend time and money and educate, is there change in priorities activities, are there any businesses that have emerged since the technology was installed?, does the project benefits men and women in different ways? if yes how, are benefits the same for different income and age group if yes how and why? )
3. Is the technology easy to manage and do you think the benefits will continue for long time? If no, why not?
(Guide to interviewer: Who operates the technology, has any modification been made to ease operations, what happens when technology breakdown? Do the beneficiaries consider this is best technology for the situation?)
4. Have conflicts arisen in the community over water since the technology was implemented? If yes which one and how are they being resolved?
(Guide to interviewer: is there section of community dissatisfied with the technology? could this be as result siting, cost of water, exclusion of important water needs, inadequate water supplied by the technology or management model?)

Pre-Feasibility Report Page 147 of 147
147 | P a g e
The Climate Technology Centre and Network (CTCN) fosters technology transfer and deployment at the request of developing countries through three core services: technical assistance, capacity building and scaling up international collaboration. The Centre is the operational arm of the UNFCCC Technology Mechanism, it is hosted and managed by the United Nations Environment and the United Nations Industrial Development Organization (UNIDO), and supported by more than 260 network partners around the world.
For more information, visit http://www.ctc-n.org.
Climate Technology Centre and Network UN City, Marmorvej 51 DK-2100 Copenhagen, Denmark +45 4533 5372 [email protected]