casting a wider tax net: experimental evidence from costa rica · · 2017-03-28casting a wider...
TRANSCRIPT

Casting a Wider Tax Net:Experimental Evidence from Costa Rica
Anne Brockmeyer, Marco Hernandez, Stewart Kettle, SpencerSmith
World Bank, BIT, Oxford University
IEN Meeting
March 24, 2017

Tax Compliance and Development
I Developing countries have lower tax/GDP than highincome countries
I Largely explained by low tax compliance
I Compliance gaps generate horizontal inequityI Factor misallocation - lower productivityI Loss of tax morale
I Non-filing of taxes is significant part of compliance gaps
I Informality, but also non-filing among tax-registered firmsI Pervasive, especially in low/middle income countries

Costa Rica: Share of Non-Filers
Figure 1: Share of Income Tax Non-Filers, 2014
25.2
18.8
11.8 11.7
05
1015
2025
Perc
ent
Full Sample Firms with TPI
CorporationsSelf-Employed

Tax Compliance and Development
I Developing countries have lower tax/GDP than highincome countries
I Largely explained by low tax compliance
I Compliance gaps generate horizontal inequityI Factor misallocatoin - lower productivityI Loss of tax morale
I Non-filing of taxes is significant part of compliance gaps
I Informality, but also non-filing among tax-registered firmsI Pervasive, especially in low/middle income countries
V By how much and how cost-effectively can we increasetax filing?

An Experiment to Increase Tax Filing
I Target registered firms that don’t file (regularly)
I Higher benefit from complianceI Address and (sometimes) third-party information available
I Email communication: instant, free
I Deterrence + behavioral insights + third-partyinformation
I Deterrence: audits, shop closure, publication of nameI Behavioral insights: simplified, personalized, social normI Third-party information: supplier/client/financial reports
I Works on intensive margin (at least for VAT - Pomeranz 2015,Naritomi 2015)
I Does it work on extensive margin?

Preview of Results
I Emails triple filing rate and double payment rate:
I Listing specific examples of third-party reports has anadditional effect
I Return on email USD 19, cost-effectiveness ≈ 1:5
I Positive effects on other compliance margins:
I Third-party reporting (firm-to-firm), past tax returnsI No negative effects on sales tax compliance
I Effect persists until next fiscal year
→ High cost-effectiveness, persistence & dynamic effects→ Potentially improvements in horizontal equity, tax morale

Outline
1. Introduction
2. Context & Data
3. Experiment Design
4. Results
4.1 Income Tax Compliacce4.2 Other Compliance Outcomes4.3 Persistence
5. Cost-Benefit Analysis

Context & Data

Context & Data
Income tax filing deadline: December 15 for self-employed andcorporations
I Firms file income tax and third-party reports about suppliers/client
I Sales tax filed monthly
Data set:
I Tax register and income tax returns
I 350,000 firms, including 80,000 non-filers for 2014
I Payment receipts
I Third-party reports
I Firms report transactions w/ other firms (83% of experimentsample)
I Credit/debit card companies report card sales (12%)I State institutions report purchases from firms (7%)

Experiment Design

Experiment Design
I Target population: ∼50,000 firms
I Registered but did not file income tax for 2014I Have an email address on file (either firm or tax accountant)I 25% covered by third-party information (TPI)
I Treatments:
I Control: no emailI T1: baseline emailI T2: baseline email + emphasis on third-party information

Baseline Email
3""
SUBJECT:!Urgent:!Please!submit!your!tax!return!now!!Attention:!NAME,!!PLEASE*FILE*YOUR*INCOME*TAX*RETURN*IN*THE*NEXT*10*DAYS*!Declare*now*by*visiting:*https://www.haciendadigital.go.cr/tribunet/loginDeclaraciones.jsp*!According! to! our! records,! you! have! not! filed! your! tax! return! (Form!D101).! 8! out! of! 10!Costa!Ricans! have! already! filed! their! 2014! income! tax! return.! You! are! part! of! a! small! minority! of!citizens!who!have!not.!!It!is!a!serious!offense!to!not!file!your!taxes.!!!We!have! thirdUparty! information!confirming! that!you!or!your!client!performed!activities! in!2014!which!require!you!to!pay!taxes.!!If!you!do!not!file,!you!could!be!audited!and!your!business!may!be!closed.!Furthermore,!your!name!may!be!published!on!our!website!as!someone!who!did!not!contribute.!!If!you!have!any!questions,!you!can!contact!me!by!PHONE!or!EUMAIL.!I’ll!be!checking!whether!you!respond!to!this!message.!!Sincerely,!!NAME!OF!OFFICIAL!POSITION!!""" "

Third-Party Information Email
Standard email:
11""
"
!Firms*w/*TPI!!We!have!thirdUparty!information!confirming!that!you!or!your!client!performed!activities!in!2014!which!require!you!to!pay!taxes.!!
Firms*w/o*TPI!!"""We!have!thirdUparty!information!confirming!that!you!or!your!client!performed!activities!in!2014!which!require!you!to!pay!taxes.!From!thirdUparty! returns! (D150,!D151!and!D153),!we!know!about!your!operations,!for!example:!
•! Revenues*of*at*least*XXX*reported*by*COMPANY,*•! Revenues* from* credit/debit* cards* of* at* least* ZZZ*repoted*by*BANK,*
•! Sales*or*contracts*with*state*entities*of*at*least*WWW.*"""The!DGT!uses! information! from! thirdUparty! returns! (D150,!D151!and!D153)!to!identify!economic!activity!and!sources!of!income.!"
Third-party information email:
11""
"
!Firms*w/*TPI!!We!have!thirdUparty!information!confirming!that!you!or!your!client!performed!activities!in!2014!which!require!you!to!pay!taxes.!!
Firms*w/o*TPI!!"""We!have!thirdUparty!information!confirming!that!you!or!your!client!performed!activities!in!2014!which!require!you!to!pay!taxes.!From!thirdUparty! returns! (D150,!D151!and!D153),!we!know!about!your!operations,!for!example:!
•! Revenues*of*at*least*XXX*reported*by*COMPANY,*•! Revenues* from* credit/debit* cards* of* at* least* ZZZ*repoted*by*BANK,*
•! Sales*or*contracts*with*state*entities*of*at*least*WWW.*"""The!DGT!uses! information! from! thirdUparty! returns! (D150,!D151!and!D153)!to!identify!economic!activity!and!sources!of!income.!"

Emails to Firms without Third-Party Information
Standard email:
Third-party information email:
11""
"
!Firms*w/*TPI!!We!have!thirdUparty!information!confirming!that!you!or!your!client!performed!activities!in!2014!which!require!you!to!pay!taxes.!!
Firms*w/o*TPI!!"""We!have!thirdUparty!information!confirming!that!you!or!your!client!performed!activities!in!2014!which!require!you!to!pay!taxes.!From!thirdUparty! returns! (D150,!D151!and!D153),!we!know!about!your!operations,!for!example:!
•! Revenues*of*at*least*XXX*reported*by*COMPANY,*•! Revenues* from* credit/debit* cards* of* at* least* ZZZ*repoted*by*BANK,*
•! Sales*or*contracts*with*state*entities*of*at*least*WWW.*"""The!DGT!uses! information! from! thirdUparty! returns! (D150,!D151!and!D153)!to!identify!economic!activity!and!sources!of!income.!"

Covariate Balance: Firms with Third-Party Information
Corporation
Has legal representative
Has second email
Located in San José
Was contacted early
TPI > 2.5 million CRC
TPI > 6 million CRC
Made advance payment in 2014
Filed in 2013
Reported net liability > 0 in 2013
Made payment in 2013
Was third-party informant in 2013
-.06 -.04 -.02 0 .02 .04
T1: Baseline Email T2: TPI Email

Covariate Balance: Firms without Third-Party Information
Corporation
Has legal representative
Has second email
Located in San José
Was contacted early
Made advance payment in 2014
Filed in 2013
Reported net liability > 0 in 2013
Made payment in 2013
Was third-party informant in 2013
-.02 -.01 0 .01 .02 .03
T1: Baseline Email T2: TPI Email
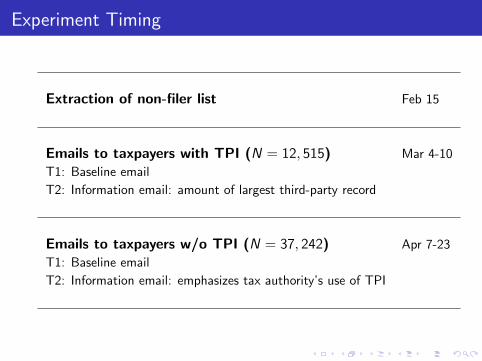
Experiment Timing
Extraction of non-filer list Feb 15
Emails to taxpayers with TPI (N = 12, 515) Mar 4-10
T1: Baseline email
T2: Information email: amount of largest third-party record
Emails to taxpayers w/o TPI (N = 37, 242) Apr 7-23
T1: Baseline email
T2: Information email: emphasizes tax authority’s use of TPI

Results: Income Tax Compliance

Filing Rate
11.5
32.5*** 34.2***†
0
10
20
30
40
Perc
ent
-5 5 10 15Start date: 4 MarWeeks
Control Baseline Email Information Email
Percent Declared: Firms with TPI

Payment
1.7
4.7*** 5.3***
0
2
4
6
Perc
ent
-5 5 10 15Start date: 4 MarWeeks
Control Baseline Email Information Email
Percent Positive declaration payment: Firms with TPI

Payment Amount
13,37115,137
5,016
***
***
05,
000
10,0
0015
,000
20,0
00Av
erag
e
Control Baseline Email Information EmailPayment amounts winsorized at the top 0.1% to reduce the influence of outliers.Error bars indicate 95% confidence intervals. Stars indicate a significant difference from the control group (at the .10, .05, and .01 levels) and daggers (†) indicate a significant difference between the two treatments.
Average Payment (Winsorized): Firms with TPI

Filing Rate (Firms without TPI)
3.9
18.8*** 18.7***
0
5
10
15
20
Perc
ent
-10 -5 5 10 15Start date: 7 AprWeeks
Control Baseline Email Information Email
Percent Declared: Firms without TPI

Payment Rate (Firms without TPI)
0.13
0.60*** 0.55***
0
.2
.4
.6
Perc
ent
-10 -5 5 10 15Start date: 7 AprWeeks
Control Baseline Email Information Email
Percent Positive declaration payment: Firms without TPI

Filing Rate (SMS Experiment)
3.6
6.6***†† 6.0***
0
2
4
6
8
Perc
ent
-10 -5 5 10 15Start date: 16 MarWeeks
Control Public Shaming SMS Information SMS
Percent Declared: SMS Experiment

Other compliance determinants
I + Amount of third-party information, potentiallynon-linear
I + Past tax filing and/or payment, advance payments
I + Third-party informant
I + Firm type (corporation) and location in San Jose, butonly for payment (amount)
I Irrelevant: legal representative

Results: Other Compliance Outcomes
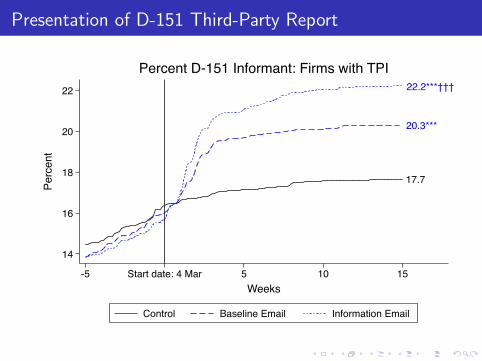
Presentation of D-151 Third-Party Report
17.7
20.3***
22.2***†††
14
16
18
20
22
Perc
ent
-5 5 10 15Start date: 4 MarWeeks
Control Baseline Email Information Email
Percent D-151 Informant: Firms with TPI

Other Effects of Email
Table 1: Other Effects of Email
Probit OLS PPML Probit
(1) (2) (3) (4) (5) (6) (7) (8) (9) (10) (11)Presented
informativedeclaration
Reportedsupplier
Reportedclient
No. monthsdecl. sales
tax
No. monthspaid sales
tax
Sales taxpayment
DeregisteredDeregistered(sales tax)
Switched tosimplified
regime
Filed incometax for 2013
Paid incometax for 2013
T1: Baseline email 0.029*** 0.004 0.028*** -0.038 -0.023 -9,902.181 0.011*** 0.000 0.000 0.031***† 0.002(0.008) (0.006) (0.007) (0.050) (0.021) (7,588.325) (0.003) (0.001) (0.000) (0.004) (0.001)
T2: Information email 0.055***††† 0.010* 0.048***†† -0.040 -0.022 -4,894.750 0.011*** -0.000 0.000 0.023*** 0.003*(0.008) (0.006) (0.008) (0.049) (0.020) (8,276.246) (0.003) (0.001) (0.000) (0.004) (0.002)
TPI > 2.5 million CRC 0.087*** 0.024*** 0.080*** -0.060 -0.021 4,616.031 0.003 -0.000 0.000 0.017*** -0.000(0.010) (0.007) (0.009) (0.052) (0.019) (14,514.704) (0.003) (0.001) (0.000) (0.005) (0.002)
TPI > 6 million CRC 0.067*** 0.061*** 0.072*** 0.551*** 0.166*** 25,176.254*** -0.012*** -0.002 -0.001** 0.007 0.006*(0.012) (0.009) (0.011) (0.088) (0.035) (9,631.292) (0.003) (0.001) (0.000) (0.006) (0.003)
Other controls Yes Yes Yes Yes Yes Yes Yes Yes Yes Yes Yes
Control group avg. 0.177 0.0928 0.128 0.637 0.133 29095.0 0.00921 0.00218 0.000242 0.350 0.0572T1=T2 p-value (Wald test) 0.003 0.274 0.013 0.969 0.989 0.461 0.830 0.563 0.975 0.061 0.690Observations 12,515 12,515 12,515 12,515 12,515 12,515 12,515 12,515 12,515 12,515 12,515
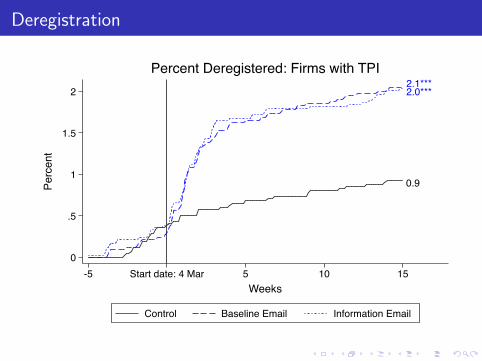
Deregistration
0.9
2.1*** 2.0***
0
.5
1
1.5
2
Perc
ent
-5 5 10 15Start date: 4 MarWeeks
Control Baseline Email Information Email
Percent Deregistered: Firms with TPI

Results: Persistence

Persistence of Effect One Year Later
Table 2: Medium-Term Impact on Compliance Outcomes in 2015
(1) (2) (3) (4) (5) (6)
Filed incometax
Paid incometax
Reportedclient orsupplier
Reported bystate
institution
Reported byprivate
client orsuppier
Reported bycard
company
T: Any email 0.0649*** 0.00963** 0.0225***(0.00893) (0.00417) (0.00716)
T1: Baseline email -0.00290 -0.00927 0.00615(0.00419) (0.0101) (0.00640)
T2: Information email -0.00265 -0.00435 0.000659(0.00423) (0.0103) (0.00634)
Other controls Yes Yes Yes Yes Yes Yes
Control group avg. 0.351 0.0523 0.203 0.0407 0.691 0.0916T1=T2 p-value (Wald test) 0.952 0.631 0.393Observations 12,515 12,515 12,515 12,515 12,515 12,515

Results: Heterogeneity & Mechanisms
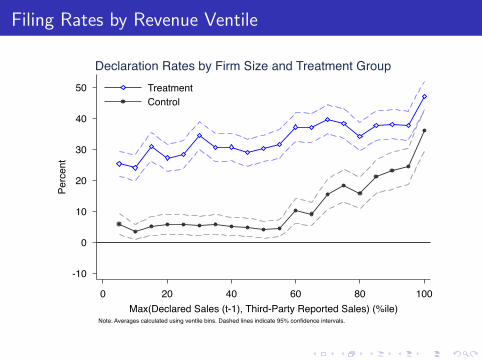
Filing Rates by Revenue Ventile
-10
0
10
20
30
40
50
Perc
ent
0 20 40 60 80 100Max(Declared Sales (t-1), Third-Party Reported Sales) (%ile)
TreatmentControl
Note: Averages calculated using ventile bins. Dashed lines indicate 95% confidence intervals.
Declaration Rates by Firm Size and Treatment Group
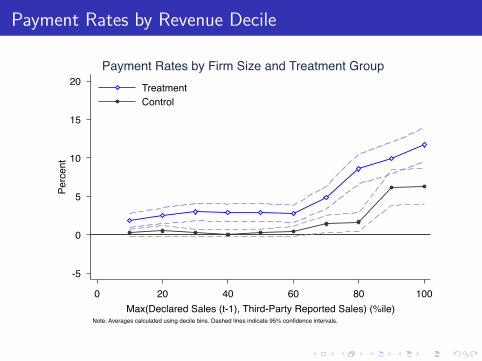
Payment Rates by Revenue Decile
-5
0
5
10
15
20
Perc
ent
0 20 40 60 80 100Max(Declared Sales (t-1), Third-Party Reported Sales) (%ile)
TreatmentControl
Note: Averages calculated using decile bins. Dashed lines indicate 95% confidence intervals.
Payment Rates by Firm Size and Treatment Group

Cost-Benefit Analysis and Conclusion
I Emails increase filing, payment, third-party reporting
I In short and medium term
I Cost effectiveness ≈ 1:5I Dynamic implication for tax capacity
I What to make of this?
I Enforcement works to sustain/increase voluntary complianceI Automate but stop tweaking messages?I Or consider policy changes (rate/base/remittance)?

Thank you!

Impact of Tax Withholding: Brockmeyer & Hernandez2016
DD=.326 (.022)
.71
1.5
22.
2C
hang
e
2010m1 2011m1 2012m1 2013m1Month
Treatment Group (Rate Increase) Control Group
Total Sales Tax Payment

Bunching and Information Reporting
Excess mass b=4.5(.28) Missing mass m=-.14(.07)
0.0
02.0
04.0
06.0
08D
ensi
ty
50 100 150Taxable Income/Kink (%)
Observed distribution Counterfactual
Self-Employed Not Subject to Information Reporting/Withholding

Bunching and Information Reporting
Excess mass b=2.08(.18) Missing mass m=.75(.09)
0.0
02.0
04.0
06.0
08D
ensi
ty
50 100 150Taxable Income/Kink (%)
Observed distribution Counterfactual
Self-Employed Subject to Information Reporting

Bunching and Information Reporting
Excess mass b=2.17(.32) Missing mass m=.7(.17)
0.0
02.0
04.0
06.0
08D
ensi
ty
50 100 150Taxable Income/Kink (%)
Observed distribution Counterfactual
Self-Employed Subject to State Withholding

Bunching and Information Reporting
Excess mass b=.52(.23) Missing mass m=.07(.08)
0.0
02.0
04.0
06.0
08D
ensi
ty
50 100 150Taxable Income/Kink (%)
Observed distribution Counterfactual
Self-Employed Subject to Credit/Debit Card Withholding

Event Study
.91
1.1
1.2
1.3
1.4
1.5
1.6
1.7
Cha
nge
in T
axab
le In
com
e
-4 -3 -2 -1 0 1 2 3Event Time
Control Group Event Group
Reporting by Suppliers

Event Study
.91
1.1
1.2
1.3
1.4
1.5
1.6
1.7
Cha
nge
in T
axab
le In
com
e
-4 -3 -2 -1 0 1 2 3Event Time
Control Group Event Group
Reporting by Suppliers

Event Study
DiD=.49 (.04)
.91
1.1
1.2
1.3
1.4
1.5
1.6
1.7
Cha
nge
in T
axab
le In
com
e
-4 -3 -2 -1 0 1 2 3Event Time
Control Group Event Group
Reporting by Suppliers

Event Study
DiD=.26 (.02)
.91
1.1
1.2
1.3
1.4
Cha
nge
in T
ax L
iabi
lity
-5 -4 -3 -2 -1 0 1 2 3 4 5Event Time
Control Group Event Group
Reporting by Credit/Debit Card Company

Appendix

Experiment Timing
Extraction of omisos list (N = 80, 599) Feb 15
Emails to taxpayers with TPI (N = 12, 515) March 4-10
- Standard reminder
- TPI reminder: amount of largest third-party record
Emails to taxpayers without TPI (N = 37, 242) April 7-23
- Standard reminder
- TPI reminder: emphasizes tax authority’s use of TPI
SMS to taxpayers w/o email, with+w/o TPI (N = 30, 842) March 16-26
- Behavioral reminder: public shaming + call to action
- TPI reminder: emphasizes tax authority’s use of TPI

Sample Size
Table 3: Sample Size by Experiment and Treatment Group
Treatment Group
Control Treatment 1 Treatment 2 TotalExperiment (%)
Email 1 4,128 4,260 4,127 12,515(33.0) (34.0) (33.0) (100.0)
Email 2 12,350 12,523 12,386 37,259(33.1) (33.6) (33.2) (100.0)
SMS 10,227 10,195 10,420 30,842(33.2) (33.1) (33.8) (100.0)
Total 80,616
Row percentage in parentheses.

SMS Experiment
Public shaming SMS:
You have not filed your 2014 income tax return. If
you do not file, your name may be published on our
website. Questions XXXX-XXXX extXXX
Third-party information SMS:
You have not filed your 2014 income tax return. The
DGT uses third-party information to identify taxable
income. Questions XXXX-XXXX extXXX

Summary: Covariates
Table 4: Covariate Summary Statistics
Obs. Mean Std. Dev. Min. Max.
Persona juridica 80,616 0.267 0.442 0 1Tax representative 49,757 0.648 0.477 0 1Second email address 49,757 0.055 0.229 0 1Second phone 30,842 0.176 0.381 0 1San Jose 80,609 0.454 0.498 0 1Early contact 80,616 0.024 0.153 0 1TPI reportee1 80,616 0.212 0.409 0 1Positive partial/advance payment 80,616 0.009 0.092 0 1Declared 2013 80,616 0.193 0.395 0 1Positive net liability 2013 80,616 0.033 0.178 0 1Positive payment 2013 80,616 0.020 0.139 0 1Third-party informant 2013 80,616 0.072 0.258 0 1
Note: Measured prior to the experiments.1TPI reportee refers to whether the firm is covered by D-150, D-151 sales, or
D-153 informative declarations.

Summary: Outcomes
Table 5: Outcomes at 15 Weeks: Summary Statistics
Obs. Mean Std. Dev. Min. Max.
Declared at 15 weeks 80,616 0.125 0.331 0 1Positive net liability at 15 weeks 80,616 0.016 0.127 0 1Positive declaration payment at 15 weeks 80,616 0.010 0.099 0 1Log declaration payment at 15 weeks 80,616 0.109 1.096 0 14.89Total declaration payment at 15 weeks 80,616 2,014 52,419 0 2.93e+06D-151 Informant at 15 weeks 80,616 0.049 0.217 0 1Deregistered at 15 weeks 80,616 0.020 0.139 0 1
Log payment and payment are unconditional (i.e., include zeros).

Summary: Deregistration
Table 6: Mean Characteristics of Deregistrants: Email Experiments
Deregistered?
No Yes Total
Filed 0.216 0.610 0.226(0.002) (0.014) (0.002)
Positive gross liability 0.034 0.022 0.034(0.001) (0.004) (0.001)
Gross liability (CRC) if filed 826,620 5,100 770,810(493,467) (2,386) (459,946)
TPI reportee 0.254 0.197 0.253(0.002) (0.011) (0.002)
Filed 2013 0.268 0.524 0.275(0.002) (0.014) (0.002)
Positive gross liability 2013 0.042 0.047 0.042(0.001) (0.006) (0.001)
Gross liability 2013 (CRC) if filed 656,409 40,101 626,818(381,633) (18,571) (363,312)
Note: Standard errors in parentheses.

Summary: Payment Compliance (Email 1)
Table 7: Payment Compliance at 15 weeks: Email Experiment 1
Group
Control Treatment Total
Positive net liability 0.300 0.244 0.252(0.021) (0.008) (0.008)
Paid in full 0.486 0.600 0.581(0.042) (0.019) (0.017)
Paid in part 0.007 0.018 0.016(0.007) (0.005) (0.004)
Zero payment 0.507 0.382 0.404(0.042) (0.019) (0.017)
Total non-compliant 0.154 0.097 0.106(0.017) (0.006) (0.005)
Note: Indentation indicates conditioning on previous row.
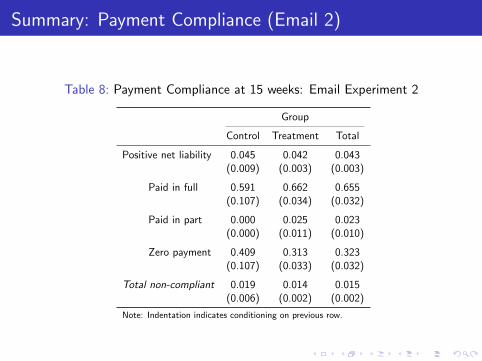
Summary: Payment Compliance (Email 2)
Table 8: Payment Compliance at 15 weeks: Email Experiment 2
Group
Control Treatment Total
Positive net liability 0.045 0.042 0.043(0.009) (0.003) (0.003)
Paid in full 0.591 0.662 0.655(0.107) (0.034) (0.032)
Paid in part 0.000 0.025 0.023(0.000) (0.011) (0.010)
Zero payment 0.409 0.313 0.323(0.107) (0.033) (0.032)
Total non-compliant 0.019 0.014 0.015(0.006) (0.002) (0.002)
Note: Indentation indicates conditioning on previous row.

Covariate Balance: Firms with TPI
Corporation
Has legal representative
Has second email
Located in San José
Was contacted early
TPI > 2.5 million CRC
TPI > 6 million CRC
Made advance payment in 2014
Filed in 2013
Reported net liability > 0 in 2013
Made payment in 2013
Was third-party informant in 2013
-.06 -.04 -.02 0 .02 .04
T1: Baseline Email T2: TPI Email

Covariate Balance: Firms without TPI
Corporation
Has legal representative
Has second email
Located in San José
Was contacted early
Made advance payment in 2014
Filed in 2013
Reported net liability > 0 in 2013
Made payment in 2013
Was third-party informant in 2013
-.02 -.01 0 .01 .02 .03
T1: Baseline Email T2: TPI Email

Covariate Balance: SMS Experiment
Corporation
Has second phone
Located in San José
Was contacted early
TPI reportee
TPI > 2.5 million CRC
TPI > 6 million CRC
Made advance payment in 2014
Filed in 2013
Reported net liability > 0 in 2013
Made payment in 2013
Was third-party informant in 2013
-.04 -.02 0 .02 .04
T1: Public Shaming SMS T2: TPI SMS

Covariate Balance: Email Experiments
Table 9: Covariate Balance (Email Experiments)
Firms with Third-Party Information (Experiment 1) Firms without Third-Party Information (Experiment 2)
(1) (2) (3) (4) (5) (6) (7) (8)
ControlT1:
Baselineemail
T2:Information
T1=T2=0p-value
ControlT1:
Baselineemail
T2:Information
T1=T2=0p-value
Corporation 0.142 -0.003 -0.004 0.893 0.262 0.011 -0.002 0.238(0.006) (0.008) (0.008) (0.004) (0.008) (0.007)
Has legal representative 0.607 -0.002 0.004 0.882 0.659 0.009 -0.001 0.289(0.008) (0.011) (0.012) (0.005) (0.007) (0.007)
Has second email 0.056 0.001 0.003 0.851 0.054 -0.001 0.002 0.547(0.004) (0.005) (0.005) (0.002) (0.003) (0.003)
Located in San Jose 0.490 -0.002 0.000 0.975 0.488 0.004 0.004 0.821(0.008) (0.011) (0.011) (0.005) (0.008) (0.007)
Was contacted early 0.117 0.006 -0.002 0.543 0.002 0.000 0.001 0.489(0.005) (0.007) (0.007) (0.000) (0.001) (0.001)
TPI > 2.5 million CRC 0.351 -0.003 -0.021* 0.109(0.008) (0.011) (0.011)
TPI > 6 million CRC 0.185 0.008 -0.009 0.193(0.007) (0.010) (0.009)
Made advance payment in 2014 0.023 0.001 0.000 0.892 0.005 0.001 -0.001 0.188(0.002) (0.003) (0.003) (0.001) (0.001) (0.001)
Filed in 2013 0.329 0.007 -0.005 0.517 0.174 -0.010* -0.007 0.131(0.007) (0.010) (0.011) (0.004) (0.005) (0.005)
Reported net liability > 0 in 2013 0.085 0.000 0.006 0.561 0.016 0.001 0.000 0.873(0.004) (0.006) (0.006) (0.001) (0.002) (0.002)
Made payment in 2013 0.053 -0.002 0.000 0.927 0.011 0.000 -0.000 0.941(0.004) (0.005) (0.005) (0.001) (0.001) (0.001)
Was third-party informant in 2013 0.190 -0.007 -0.012 0.417 0.046 -0.000 -0.002 0.834(0.006) (0.009) (0.009) (0.002) (0.003) (0.003)
Observations 4,128 4,260 4,127 12,350 12,516 12,376

Baseline Balance: Email Experiments
Table 10: Baseline Balance (Email Experiments)
Firms with Third-Party Information (Experiment 1) Firms without Third-Party Information (Experiment 2)
(1) (2) (3) (4) (5) (6) (7) (8)
ControlT1:
Baselineemail
T2:Information
T1=T2=0p-value
ControlT1:
Baselineemail
T2:Information
T1=T2=0p-value
Filed 0.057 0.004 0.002 0.742 0.013 0.001 0.000 0.934(0.004) (0.005) (0.005) (0.001) (0.001) (0.002)
Had positive net liability 0.017 0.003 0.002 0.513 0.001 0.001** 0.000 0.089(0.002) (0.003) (0.003) (0.000) (0.000) (0.000)
Made payment 0.008 0.003 0.002 0.373 0.000 0.000 0.000 0.377(0.001) (0.002) (0.002) (0.000) (0.000) (0.000)
Log payment 0.086 0.034 0.018 0.348(0.015) (0.024) (0.023)
Was third-party informant 0.164 -0.003 -0.007 0.710 0.012 0.000 0.001 0.761(0.006) (0.008) (0.008) (0.001) (0.001) (0.001)
No. months decl. sales tax 0.619 -0.040 -0.061 0.501 0.243 -0.025 0.004 0.239(0.038) (0.052) (0.052) (0.013) (0.018) (0.019)
No. months paid sales tax 0.126 -0.023 -0.026 0.390 0.015 0.006 0.004 0.260(0.015) (0.020) (0.020) (0.002) (0.004) (0.004)
Sales tax payment 108900.860 -75006.413 -64056.208 0.489 736.743 1416.450 245.104 0.641(62816.239) (64536.416) (65884.055) (207.981) (1728.289) (483.252)
Deregistered 0.004 -0.001 0.000 0.615 0.004 -0.001 -0.001* 0.182(0.001) (0.001) (0.001) (0.001) (0.001) (0.001)
Deregistered (sales tax) 0.001 -0.000 -0.000 0.876 0.001 -0.000 -0.000 0.258(0.000) (0.001) (0.001) (0.000) (0.000) (0.000)
Switched to simplified tax regime 0.000 -0.000 -0.000 0.317(0.000) (0.000) (0.000)
Observations 4,128 4,260 4,127 12,350 12,516 12,376

Covariate Balance: SMS Experiment
Table 11: Covariate Balance (SMS Experiment)
(1) (2) (3) (4)
ControlT1:
Public shamingSMS
T2:Information
SMS
T1=T2=0p-value
Corporation 0.312 0.011 0.011 0.356(0.006) (0.008) (0.009)
Has second phone 0.174 0.003 0.003 0.819(0.004) (0.006) (0.006)
Located in San Jose 0.395 -0.004 0.003 0.618(0.006) (0.008) (0.009)
Was contacted early 0.011 -0.001 0.005 0.509(0.001) (0.001) (0.006)
TPI reportee 0.154 -0.001 0.003 0.697(0.004) (0.005) (0.005)
TPI > 2.5 million CRC 0.071 -0.000 0.002 0.743(0.003) (0.004) (0.004)
TPI > 6 million CRC 0.038 0.005* 0.004 0.157(0.002) (0.003) (0.003)
Made advance payment in 2014 0.007 -0.000 0.001 0.656(0.001) (0.001) (0.001)
Filed in 2013 0.161 0.011** 0.005 0.116(0.004) (0.005) (0.005)
Reported net liability > 0 in 2013 0.032 -0.003 -0.000 0.486(0.002) (0.002) (0.002)
Made payment 2013 0.018 -0.002 0.001 0.476(0.001) (0.002) (0.002)
Was third-party informant 2013 0.056 0.003 0.003 0.586(0.002) (0.003) (0.003)
Observations 10,227 10,195 10,420

Baseline Balance: SMS Experiment
Table 12: Baseline Balance (SMS Experiment)
(1) (2) (3) (4)
ControlT1:
Public shamingSMS
T2:Information
SMS
T1=T2=0p-value
Filed 0.013 -0.000 0.001 0.554(0.001) (0.002) (0.002)
Had positive net liability 0.004 -0.000 0.000 0.650(0.001) (0.001) (0.001)
Made payment 0.001 -0.000 -0.000 0.702(0.000) (0.001) (0.000)
Log payment 0.014 -0.002 -0.004 0.691(0.004) (0.005) (0.005)
Was third-party informant 0.027 -0.001 0.002 0.414(0.002) (0.002) (0.002)
No. months decl. sales tax 0.269 0.037 0.004 0.224(0.016) (0.023) (0.023)
No. months paid sales tax 0.039 0.004 0.005 0.781(0.006) (0.008) (0.008)
Sales tax payment 1113.920 1126.130* 1048.929 0.065(259.200) (579.110) (645.096)
Deregistered 0.003 -0.001 -0.001 0.498(0.001) (0.001) (0.001)
Deregistered (sales tax) 0.001 -0.001 -0.001*** 0.008(0.000) (0.000) (0.000)
Observations 10,227 10,195 10,420

Payment Amount
13,37115,137
5,016
***
***
05,
000
10,0
0015
,000
20,0
00Av
erag
e
Control Baseline Email Information EmailPayment amounts winsorized at the top 0.1% to reduce the influence of outliers.Error bars indicate 95% confidence intervals. Stars indicate a significant difference from the control group (at the .10, .05, and .01 levels) and daggers (†) indicate a significant difference between the two treatments.
Average Payment (Winsorized): Firms with TPI

Estimating Treatment Effects
Table 13: Effect of Email on Compliance (Firms with TPI)
Probit OLS PPML
(1) (2) (3) (4) (5)
FiledPositive net
liabilityPositivepayment
Logpayment
Payment
T1: Baseline email 0.213*** 0.046*** 0.031*** 0.340*** 8,167.736***(0.009) (0.005) (0.004) (0.043) (2,394.801)
T2: Information email 0.232***† 0.054*** 0.038*** 0.411*** 10,191.998***(0.009) (0.005) (0.004) (0.044) (2,712.887)
TPI > 2.5 million CRC 0.065*** 0.052*** 0.032*** 0.294*** 6,911.006***(0.011) (0.006) (0.005) (0.056) (2,639.431)
TPI > 6 million CRC 0.013 0.042*** 0.016*** 0.365*** 14,807.488***(0.014) (0.008) (0.006) (0.093) (3,628.608)
Other controls Yes Yes Yes Yes Yes
Control group avg. 0.115 0.0339 0.0172 0.194 5015.8T1=T2 p-value (Wald test) 0.062 0.135 0.145 0.177 0.510Observations 12,515 12,515 12,515 12,515 12,515

Estimating Treatment Effects (Firms without TPI)
Table 14: Effect of Email on Compliance (Firms without TPI)
Probit OLS PPML
(1) (2) (3) (4) (5)
FiledPositive net
liabilityPositivepayment
Logpayment
Payment
T1: Baseline email 0.150*** 0.006*** 0.005*** 0.050*** 262.430***(0.004) (0.001) (0.001) (0.008) (59.096)
T2: Information email 0.149*** 0.006*** 0.004*** 0.041*** 166.064***(0.004) (0.001) (0.001) (0.008) (52.392)
Other controls Yes Yes Yes Yes Yes
Control group avg. 0.0393 0.00178 0.00130 0.0142 96.15T1=T2 p-value (Wald test) 0.807 0.617 0.613 0.397 0.160Observations 37,242 37,242 37,242 37,242 37,242

Effect of SMS is Smaller
Table 15: Effect of Any SMS on Compliance
Probit OLS PPML
(1) (2) (3) (4) (5)
FiledPositive net
liabilityPositivepayment
Logpayment
Payment
T: Any SMS 0.027*** 0.002* 0.001 0.010 116.980(0.002) (0.001) (0.001) (0.008) (89.854)
TPI reportee 0.029*** 0.008*** 0.005*** 0.045** 474.049***(0.005) (0.002) (0.002) (0.019) (159.523)
TPI > 2.5 million CRC 0.029*** 0.010*** 0.004** 0.123** 423.823**(0.009) (0.003) (0.002) (0.054) (204.073)
TPI > 6 million CRC 0.006 0.006*** 0.001 0.173** 239.766(0.007) (0.002) (0.002) (0.081) (154.496)
Other controls Yes Yes Yes Yes Yes
Control group avg. 0.0363 0.00743 0.00411 0.0435 339.8Observations 30,842 30,842 30,842 30,842 30,842

Filing Rate: SMS Experiment
3.6
6.6***†† 6.0***
0
2
4
6
8
Perc
ent
-10 -5 5 10 15Start date: 16 MarWeeks
Control Public Shaming SMS Information SMS
Percent Declared: SMS Experiment

Treatment Effect by Revenue Ventile
-10
0
10
20
30
40
Estim
ated
Tre
atm
ent E
ffect
(p.p
.)
0 20 40 60 80 100Max(Declared Sales (t-1), Third-Party Reported Sales) (%ile)
Note: Estimates calculated using ventile bins. Dashed lines indicate 90% and 95% confidence intervals.
Effect of Email on Declaration by Firm Size

Treatment Effect (Payment) by Revenue Decile
-5
0
5
10
15
Estim
ated
Tre
atm
ent E
ffect
(p.p
.)
0 20 40 60 80 100Max(Declared Sales (t-1), Third-Party Reported Sales) (%ile)
Note: Estimates calculated using decile bins. Dashed lines indicate 90% and 95% confidence intervals.
Effect of Email on Payment by Firm Size

Interaction with Paper Trail
I Did firms covered and not covered by third-party reportsrespond differently to the email messages?
1. Pool the two samples with and without TPI2. Limit to comparable treatments
I Standard email for TPI-covered firms:
11""
"
!Firms*w/*TPI!!We!have!thirdUparty!information!confirming!that!you!or!your!client!performed!activities!in!2014!which!require!you!to!pay!taxes.!!
Firms*w/o*TPI!!"""We!have!thirdUparty!information!confirming!that!you!or!your!client!performed!activities!in!2014!which!require!you!to!pay!taxes.!From!thirdUparty! returns! (D150,!D151!and!D153),!we!know!about!your!operations,!for!example:!
•! Revenues*of*at*least*XXX*reported*by*COMPANY,*•! Revenues* from* credit/debit* cards* of* at* least* ZZZ*repoted*by*BANK,*
•! Sales*or*contracts*with*state*entities*of*at*least*WWW.*"""The!DGT!uses! information! from! thirdUparty! returns! (D150,!D151!and!D153)!to!identify!economic!activity!and!sources!of!income.!"
I TPI email for firms not covered by TPI:
11""
"
!Firms*w/*TPI!!We!have!thirdUparty!information!confirming!that!you!or!your!client!performed!activities!in!2014!which!require!you!to!pay!taxes.!!
Firms*w/o*TPI!!"""We!have!thirdUparty!information!confirming!that!you!or!your!client!performed!activities!in!2014!which!require!you!to!pay!taxes.!From!thirdUparty! returns! (D150,!D151!and!D153),!we!know!about!your!operations,!for!example:!
•! Revenues*of*at*least*XXX*reported*by*COMPANY,*•! Revenues* from* credit/debit* cards* of* at* least* ZZZ*repoted*by*BANK,*
•! Sales*or*contracts*with*state*entities*of*at*least*WWW.*"""The!DGT!uses! information! from! thirdUparty! returns! (D150,!D151!and!D153)!to!identify!economic!activity!and!sources!of!income.!"

Filing Rate by Firm Group
2.0
5.4
1.7
8.8
0.0
2.0
4.0
6.0
8.0
Fact
or
-5 0 5 10 15Weeks
Firms with TPI:ControlT1 Email
Firms without TPI:ControlT2 Email
Factor Change in Percent Declared

Payment Rate by Firm Group
2.3
4.6
2.7
5.8
0.0
2.0
4.0
6.0
Fact
or
-5 0 5 10 15Weeks
Firms with TPI:ControlT1 Email
Firms without TPI:ControlT2 Email
Factor Change in Percent Positive declaration payment

Informative Declaration Rate by Firm Group
1.1
1.3
1.1
1.2
0.9
1.0
1.1
1.2
1.3
Fact
or
-5 0 5 10 15Weeks
Firms with TPI:ControlT1 Email
Firms without TPI:ControlT2 Email
Factor Change in Percent D-151 Informant

Spillovers?
1. Use third-party reports to uncover trading network before theexperiment began
2. Limit sample to firms with at least one trading partner thatwas part of the experiment
I Then, conditional on number of experiment trading partners,treatment status of experiment trading partners should beexogeous
3. Estimate the indirect effect of communication on complianceby these firms

Preliminary Spillover Estimates
Table 16: Spillover Effects in 2015
Compliance Outcome: Filed Paid
1 RCTpartner
2 RCTpartners
1 or moreRCT
partners
1 RCTpartner
2 RCTpartners
1 or moreRCT
partners
Treated partner -0.003 -0.010 -0.012∗ 0.015(0.005) (0.014) (0.007) (0.023)
Share of RCT partners treated -0.002 -0.010(0.004) (0.007)
Compliance last year 0.649∗∗∗ 0.766∗∗∗ 0.720∗∗∗ 0.465∗∗∗ 0.480∗∗∗ 0.480∗∗∗
(0.015) (0.025) (0.010) (0.007) (0.014) (0.005)
Constant 0.277∗∗∗ 0.168∗∗∗ 0.198∗∗∗ 0.176∗∗∗ 0.169∗∗∗ 0.173∗∗∗
(0.015) (0.029) (0.010) (0.006) (0.022) (0.006)
Control group avg. 0.893 0.888 0.893 0.404 0.420 0.405Observations 17,039 3,746 25,099 17,039 3,746 25,099
Note: Number of RCT partners determined using 2014–the year of the RCT.∗ p < .10, ∗∗ p < .05, ∗∗∗ p < .01

Effect of Email on Compliance: Email 1 (No Controls)
Table 17: Effect of Email on Compliance (No Controls) (Experiment 1)
OLS
(1) (2) (3) (4) (5)
FiledPositive net
liabilityPositivepayment
Logpayment
Payment
T1: Baseline email 0.211*** 0.045*** 0.031*** 0.341*** 8,354.757***(0.009) (0.005) (0.004) (0.044) (2,521.544)
T2: Information 0.227*** 0.051*** 0.037*** 0.401*** 10,121.575***email (0.009) (0.005) (0.004) (0.046) (2,873.266)
Constant 0.115*** 0.034*** 0.017*** 0.194*** 5,015.796***(0.005) (0.003) (0.002) (0.023) (1,354.277)
Control group avg. 0.115 0.0339 0.0172 0.194 5015.8T1=T2 p-value (Wald test) 0.136 0.292 0.223 0.273 0.593Observations 12,515 12,515 12,515 12,515 12,515

Other Effects of Email: Email 1 (No Controls)
Table 18: Other Effects of Email (No Controls) (Experiment 1)
OLS
(1) (2) (3) (4) (5) (6) (7) (8) (9) (10) (11)Presented
informativedeclaration
Reportedsupplier
Reportedclient
No. monthsdecl. sales
tax
No. monthspaid sales
tax
Sales taxpayment
DeregisteredDeregistered(sales tax)
Switched tosimplified
regime
Filed incometax for 2013
Paid incometax for 2013
T1: Baseline email 0.026*** 0.003 0.026*** -0.030 -0.022 -9,319.000 0.011*** 0.000 0.000 0.038*** 0.000(0.009) (0.006) (0.008) (0.053) (0.021) (8,142.571) (0.003) (0.001) (0.000) (0.011) (0.005)
T2: Information 0.046*** 0.007 0.040*** -0.052 -0.027 -6,488.644 0.011*** -0.000 0.000 0.018* 0.002email (0.009) (0.007) (0.008) (0.053) (0.021) (8,551.043) (0.003) (0.001) (0.000) (0.011) (0.005)
Constant 0.177*** 0.093*** 0.128*** 0.637*** 0.133*** 29,094.972*** 0.009*** 0.002*** 0.000 0.350*** 0.057***(0.006) (0.005) (0.005) (0.039) (0.016) (6,600.265) (0.002) (0.001) (0.000) (0.008) (0.004)
Control group avg. 0.177 0.0928 0.128 0.637 0.133 29095.0 0.00921 0.00218 0.000242 0.350 0.0572T1=T2 p-value (Wald test) 0.040 0.586 0.103 0.670 0.787 0.696 0.922 0.506 0.969 0.059 0.685Observations 12,515 12,515 12,515 12,515 12,515 12,515 12,515 12,515 12,515 12,515 12,515

Effect of Email on Compliance
Table 19: Effect of Email on Compliance (Experiment 1)
OLS
(1) (2) (3) (4) (5)
FiledPositive net
liabilityPositivepayment
Logpayment
Payment
T1: Baseline email 0.211*** 0.044*** 0.031*** 0.341*** 8,360.725***(0.009) (0.005) (0.004) (0.043) (2,449.781)
T2: Information email 0.230*** 0.052*** 0.037*** 0.409*** 10,447.670***(0.009) (0.005) (0.004) (0.044) (2,824.278)
TPI > 2.5 million CRC 0.061*** 0.038*** 0.029*** 0.295*** -1,042.971(0.011) (0.006) (0.005) (0.057) (1,841.710)
TPI > 6 million CRC 0.006 0.071*** 0.023*** 0.334*** 28,315.536***(0.015) (0.010) (0.008) (0.093) (5,287.007)
Other controls Yes Yes Yes Yes Yes
Control group avg. 0.115 0.0339 0.0172 0.194 5015.8T1=T2 p-value (Wald test) 0.074 0.188 0.158 0.193 0.514Observations 12,515 12,515 12,515 12,515 12,515

Effect of Email on Compliance (Probit & PPML)
Table 20: Effect of Email on Compliance (Probit & PPML) (Experiment1)
Probit OLS PPML
(1) (2) (3) (4) (5)
FiledPositive net
liabilityPositivepayment
Logpayment
Payment
T1: Baseline email 0.213*** 0.046*** 0.031*** 0.340*** 8,167.736***(0.009) (0.005) (0.004) (0.043) (2,394.801)
T2: Information email 0.232***† 0.054*** 0.038*** 0.411*** 10,191.998***(0.009) (0.005) (0.004) (0.044) (2,712.887)
TPI > 2.5 million CRC 0.065*** 0.052*** 0.032*** 0.294*** 6,911.006***(0.011) (0.006) (0.005) (0.056) (2,639.431)
TPI > 6 million CRC 0.013 0.042*** 0.016*** 0.365*** 14,807.488***(0.014) (0.008) (0.006) (0.093) (3,628.608)
Other controls Yes Yes Yes Yes Yes
Control group avg. 0.115 0.0339 0.0172 0.194 5015.8T1=T2 p-value (Wald test) 0.062 0.135 0.145 0.177 0.510Observations 12,515 12,515 12,515 12,515 12,515

Other Effects of Email
Table 21: Other Effects of Email (Experiment 1)
OLS
(1) (2) (3) (4) (5) (6) (7) (8) (9) (10) (11)Presented
informativedeclaration
Reportedsupplier
Reportedclient
No. monthsdecl. sales
tax
No. monthspaid sales
tax
Sales taxpayment
DeregisteredDeregistered(sales tax)
Switched tosimplified
regime
Filed incometax for 2013
Paid incometax for 2013
T1: Baseline email 0.028*** 0.004 0.026*** -0.039 -0.023 -9,724.458 0.012*** 0.000 0.000 0.032*** 0.002(0.008) (0.006) (0.007) (0.050) (0.021) (7,963.407) (0.003) (0.001) (0.000) (0.004) (0.002)
T2: Information email 0.051*** 0.010 0.044*** -0.042 -0.023 -5,556.893 0.011*** -0.001 0.000 0.023*** 0.002(0.008) (0.006) (0.008) (0.049) (0.020) (8,331.565) (0.003) (0.001) (0.000) (0.004) (0.002)
TPI > 2.5 million CRC 0.082*** 0.010 0.075*** -0.107** -0.039** -20,663.410*** 0.005 0.000 0.000 0.021*** -0.001(0.010) (0.007) (0.009) (0.051) (0.019) (4,186.548) (0.004) (0.001) (0.001) (0.005) (0.002)
TPI > 6 million CRC 0.083*** 0.089*** 0.097*** 0.642*** 0.192*** 62,030.785*** -0.014*** -0.002 -0.001 0.005 0.006**(0.014) (0.011) (0.014) (0.088) (0.034) (11,773.503) (0.004) (0.002) (0.001) (0.007) (0.003)
Other controls Yes Yes Yes Yes Yes Yes Yes Yes Yes Yes Yes
Control group avg. 0.177 0.0928 0.128 0.637 0.133 29095.0 0.00921 0.00218 0.000242 0.350 0.0572T1=T2 p-value (Wald test) 0.005 0.305 0.024 0.958 1.000 0.565 0.886 0.481 0.981 0.048 0.837Observations 12,515 12,515 12,515 12,515 12,515 12,515 12,515 12,515 12,515 12,515 12,515
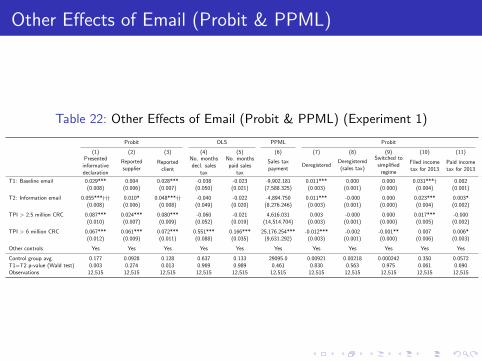
Other Effects of Email (Probit & PPML)
Table 22: Other Effects of Email (Probit & PPML) (Experiment 1)
Probit OLS PPML Probit
(1) (2) (3) (4) (5) (6) (7) (8) (9) (10) (11)Presented
informativedeclaration
Reportedsupplier
Reportedclient
No. monthsdecl. sales
tax
No. monthspaid sales
tax
Sales taxpayment
DeregisteredDeregistered(sales tax)
Switched tosimplified
regime
Filed incometax for 2013
Paid incometax for 2013
T1: Baseline email 0.029*** 0.004 0.028*** -0.038 -0.023 -9,902.181 0.011*** 0.000 0.000 0.031***† 0.002(0.008) (0.006) (0.007) (0.050) (0.021) (7,588.325) (0.003) (0.001) (0.000) (0.004) (0.001)
T2: Information email 0.055***††† 0.010* 0.048***†† -0.040 -0.022 -4,894.750 0.011*** -0.000 0.000 0.023*** 0.003*(0.008) (0.006) (0.008) (0.049) (0.020) (8,276.246) (0.003) (0.001) (0.000) (0.004) (0.002)
TPI > 2.5 million CRC 0.087*** 0.024*** 0.080*** -0.060 -0.021 4,616.031 0.003 -0.000 0.000 0.017*** -0.000(0.010) (0.007) (0.009) (0.052) (0.019) (14,514.704) (0.003) (0.001) (0.000) (0.005) (0.002)
TPI > 6 million CRC 0.067*** 0.061*** 0.072*** 0.551*** 0.166*** 25,176.254*** -0.012*** -0.002 -0.001** 0.007 0.006*(0.012) (0.009) (0.011) (0.088) (0.035) (9,631.292) (0.003) (0.001) (0.000) (0.006) (0.003)
Other controls Yes Yes Yes Yes Yes Yes Yes Yes Yes Yes Yes
Control group avg. 0.177 0.0928 0.128 0.637 0.133 29095.0 0.00921 0.00218 0.000242 0.350 0.0572T1=T2 p-value (Wald test) 0.003 0.274 0.013 0.969 0.989 0.461 0.830 0.563 0.975 0.061 0.690Observations 12,515 12,515 12,515 12,515 12,515 12,515 12,515 12,515 12,515 12,515 12,515

Effect of Email on Compliance (All Controls)
Table 23: Effect of Email on Compliance (All Controls) (Experiment 1)
OLS
(1) (2) (3) (4) (5)
FiledPositive net
liabilityPositivepayment
Logpayment
Payment
T1: Baseline email 0.211*** 0.044*** 0.031*** 0.341*** 8,360.725***(0.009) (0.005) (0.004) (0.043) (2,449.781)
T2: Information email 0.230*** 0.052*** 0.037*** 0.409*** 10,447.670***(0.009) (0.005) (0.004) (0.044) (2,824.278)
Corporation -0.004 0.045*** 0.007 0.117 11,624.253(0.016) (0.012) (0.008) (0.100) (7,275.177)
Has legal representative -0.001 -0.001 0.003 0.041 2,812.486(0.008) (0.004) (0.003) (0.038) (2,083.220)
Has second email 0.050** -0.005 0.013 0.169 13,808.804(0.022) (0.017) (0.012) (0.151) (13,278.496)
Located in San Jose 0.008 -0.002 0.004 0.056 8,157.846***(0.008) (0.004) (0.003) (0.038) (2,331.148)
TPI > 2.5 million CRC 0.061*** 0.038*** 0.029*** 0.295*** -1,042.971(0.011) (0.006) (0.005) (0.057) (1,841.710)
TPI > 6 million CRC 0.006 0.071*** 0.023*** 0.334*** 28,315.536***(0.015) (0.010) (0.008) (0.093) (5,287.007)
Made advance payment for 2014 0.143*** 0.126*** 0.114*** 1.303*** 67,220.477**(0.031) (0.029) (0.026) (0.305) (27,609.421)
Filed in 2013 0.104*** -0.000 0.003 0.001 -7,206.147***(0.010) (0.006) (0.005) (0.051) (2,385.074)
Reported net liability > 0 in 2013 -0.068*** 0.117*** -0.016 -0.213* -17,869.923***(0.025) (0.021) (0.011) (0.126) (4,715.919)
Made payment in 2013 0.107*** 0.045* 0.137*** 1.679*** 96,507.450***(0.031) (0.027) (0.019) (0.220) (16,721.697)
Was third-party informant in 2013 0.050*** 0.007 -0.009 -0.074 8,694.066**(0.013) (0.008) (0.007) (0.075) (4,034.401)
Constant 0.039*** -0.013*** -0.010*** -0.136*** -12,380.348***(0.008) (0.004) (0.004) (0.040) (2,780.425)
Control group avg. 0.115 0.0339 0.0172 0.194 5015.8T1=T2 p-value (Wald test) 0.074 0.188 0.158 0.193 0.514Observations 12,515 12,515 12,515 12,515 12,515

Effect of Email on Compliance (Probit & PPML) (AllControls)
Table 24: Effect of Email on Compliance (Probit & PPML) (All Controls)(Experiment 1)
Probit OLS PPML
(1) (2) (3) (4) (5)
FiledPositive net
liabilityPositivepayment
Logpayment
Payment
T1: Baseline email 0.213*** 0.046*** 0.031*** 0.340*** 8,167.736***(0.009) (0.005) (0.004) (0.043) (2,394.801)
T2: Information email 0.232***† 0.054*** 0.038*** 0.411*** 10,191.998***(0.009) (0.005) (0.004) (0.044) (2,712.887)
Corporation -0.005 0.033*** 0.007 0.104 6,334.570*(0.015) (0.008) (0.006) (0.099) (3,392.022)
Has legal representative -0.000 -0.002 0.002 0.042 3,364.378(0.008) (0.004) (0.004) (0.038) (2,530.740)
Has second email 0.045** -0.000 0.007 0.169 2,259.939(0.021) (0.008) (0.008) (0.151) (3,425.219)
Located in San Jose 0.009 -0.003 0.003 0.059 7,366.114***(0.008) (0.004) (0.003) (0.039) (2,202.358)
TPI > 2.5 million CRC 0.065*** 0.052*** 0.032*** 0.294*** 6,911.006***(0.011) (0.006) (0.005) (0.056) (2,639.431)
TPI > 6 million CRC 0.013 0.042*** 0.016*** 0.365*** 14,807.488***(0.014) (0.008) (0.006) (0.093) (3,628.608)
Made advance payment for 2014 0.122*** 0.051*** 0.049*** 1.292*** 6,384.847*(0.030) (0.016) (0.014) (0.304) (3,732.480)
Filed in 2013 0.105*** 0.004 0.005 0.003 -6,565.205(0.010) (0.006) (0.005) (0.051) (5,190.648)
Reported net liability > 0 in 2013 -0.057*** 0.072*** -0.008 -0.216* -9,026.498(0.019) (0.015) (0.008) (0.126) (7,612.882)
Made payment in 2013 0.095*** 0.023* 0.106*** 1.681*** 76,309.211**(0.029) (0.012) (0.026) (0.219) (31,830.381)
Was third-party informant in 2013 0.046*** 0.004 -0.007 -0.075 4,738.215*(0.012) (0.006) (0.005) (0.075) (2,804.348)
Constant -0.143***(0.040)
Control group avg. 0.115 0.0339 0.0172 0.194 5015.8T1=T2 p-value (Wald test) 0.062 0.135 0.145 0.177 0.510Observations 12,515 12,515 12,515 12,515 12,515

Other Effects of Email (All Controls)
Table 25: Other Effects of Email (All Controls) (Experiment 1)
OLS
(1) (2) (3) (4) (5) (6) (7) (8) (9) (10) (11)Presented
informativedeclaration
Reportedsupplier
Reportedclient
No. monthsdecl. sales
tax
No. monthspaid sales
tax
Sales taxpayment
DeregisteredDeregistered(sales tax)
Switched tosimplified
regime
Filed incometax for 2013
Paid incometax for 2013
T1: Baseline email 0.028*** 0.004 0.026*** -0.039 -0.023 -9,724.458 0.012*** 0.000 0.000 0.032*** 0.002(0.008) (0.006) (0.007) (0.050) (0.021) (7,963.407) (0.003) (0.001) (0.000) (0.004) (0.002)
T2: Information email 0.051*** 0.010 0.044*** -0.042 -0.023 -5,556.893 0.011*** -0.001 0.000 0.023*** 0.002(0.008) (0.006) (0.008) (0.049) (0.020) (8,331.565) (0.003) (0.001) (0.000) (0.004) (0.002)
Corporation 0.035** 0.116*** -0.009 1.299*** 0.286*** 102,271.195*** -0.007** 0.003 -0.000 -0.009 0.005(0.014) (0.013) (0.013) (0.124) (0.052) (23,475.102) (0.003) (0.002) (0.000) (0.007) (0.004)
Has legal representative 0.008 0.004 0.007 0.078** 0.010 1,799.025 0.001 0.001 0.001 0.013*** 0.000(0.007) (0.005) (0.007) (0.038) (0.015) (4,552.205) (0.002) (0.001) (0.000) (0.004) (0.001)
Has second email 0.071*** 0.079*** 0.013 -0.104 -0.037 24,270.952 -0.003 -0.002 0.001 0.001 -0.012***(0.021) (0.020) (0.019) (0.187) (0.083) (44,241.854) (0.004) (0.003) (0.001) (0.009) (0.004)
Located in San Jose -0.004 0.000 -0.002 -0.078* -0.056*** -17,248.996*** -0.005** -0.001* -0.001* 0.003 0.002(0.007) (0.005) (0.006) (0.040) (0.016) (6,271.839) (0.002) (0.001) (0.000) (0.003) (0.001)
TPI > 2.5 million CRC 0.082*** 0.010 0.075*** -0.107** -0.039** -20,663.410*** 0.005 0.000 0.000 0.021*** -0.001(0.010) (0.007) (0.009) (0.051) (0.019) (4,186.548) (0.004) (0.001) (0.001) (0.005) (0.002)
TPI > 6 million CRC 0.083*** 0.089*** 0.097*** 0.642*** 0.192*** 62,030.785*** -0.014*** -0.002 -0.001 0.005 0.006**(0.014) (0.011) (0.014) (0.088) (0.034) (11,773.503) (0.004) (0.002) (0.001) (0.007) (0.003)
Made advance payment for 2014 0.239*** 0.168*** 0.229*** 0.744*** 0.599*** 243,492.512*** 0.000 -0.002* -0.000 0.004 0.012(0.028) (0.028) (0.030) (0.272) (0.170) (83,802.287) (0.006) (0.001) (0.000) (0.013) (0.008)
Filed in 2013 0.048*** 0.017** 0.034*** 0.825*** 0.098*** 10,555.902* -0.000 0.001 -0.000 0.918*** -0.007***(0.009) (0.007) (0.008) (0.066) (0.024) (5,966.002) (0.003) (0.001) (0.001) (0.004) (0.002)
Reported net liability > 0 in 2013 -0.077*** -0.007 -0.045** 0.459** -0.155** -12,170.244 0.003 0.005 -0.001 0.034*** 0.036***(0.024) (0.022) (0.023) (0.220) (0.062) (37,968.300) (0.006) (0.004) (0.000) (0.011) (0.009)
Made payment in 2013 0.069** 0.005 0.070** -1.071*** 0.239** 20,517.364 -0.004 -0.004 0.000 -0.022* 0.957***(0.030) (0.027) (0.028) (0.254) (0.097) (53,142.122) (0.007) (0.004) (0.000) (0.011) (0.009)
Was third-party informant in 2013 0.271*** 0.156*** 0.192*** 0.236** 0.091** 43,391.822*** -0.001 -0.002 0.000 0.025*** 0.003(0.014) (0.011) (0.012) (0.092) (0.036) (10,954.528) (0.003) (0.001) (0.001) (0.006) (0.002)
Constant 0.051*** 0.011* 0.029*** 0.053 0.032* -1,050.231 0.013*** 0.002** 0.000 0.025*** 0.002*(0.008) (0.006) (0.007) (0.046) (0.018) (5,403.163) (0.003) (0.001) (0.001) (0.004) (0.001)
Control group avg. 0.177 0.0928 0.128 0.637 0.133 29095.0 0.00921 0.00218 0.000242 0.350 0.0572T1=T2 p-value (Wald test) 0.005 0.305 0.024 0.958 1.000 0.565 0.886 0.481 0.981 0.048 0.837Observations 12,515 12,515 12,515 12,515 12,515 12,515 12,515 12,515 12,515 12,515 12,515

Other Effects of Email (Probit & PPML) (All Controls)
Table 26: Other Effects of Email (Probit & PPML) (All Controls)(Experiment 1)
Probit OLS PPML Probit
(1) (2) (3) (4) (5) (6) (7) (8) (9) (10) (11)Presented
informativedeclaration
Reportedsupplier
Reportedclient
No. monthsdecl. sales
tax
No. monthspaid sales
tax
Sales taxpayment
DeregisteredDeregistered(sales tax)
Switched tosimplified
regime
Filed incometax for 2013
Paid incometax for 2013
T1: Baseline email 0.029*** 0.004 0.028*** -0.038 -0.023 -9,902.181 0.011*** 0.000 0.000 0.031*** 0.002(0.008) (0.006) (0.007) (0.050) (0.021) (7,588.325) (0.003) (0.001) (0.000) (0.004) (0.001)
T2: Information email 0.055*** 0.010* 0.048*** -0.040 -0.022 -4,894.750 0.011*** -0.000 0.000 0.023*** 0.003*(0.008) (0.006) (0.008) (0.049) (0.020) (8,276.246) (0.003) (0.001) (0.000) (0.004) (0.002)
Corporation 0.025** 0.084*** -0.011 1.309*** 0.287*** 49,928.871*** -0.008** 0.004 -0.000 -0.002 0.003(0.012) (0.010) (0.010) (0.124) (0.052) (9,071.818) (0.003) (0.002) (0.000) (0.007) (0.003)
Has legal representative 0.008 0.004 0.007 0.078** 0.009 6,081.778 0.001 0.001* 0.001 0.009*** -0.000(0.007) (0.005) (0.007) (0.038) (0.015) (7,651.940) (0.002) (0.001) (0.000) (0.003) (0.001)
Has second email 0.055*** 0.039*** 0.010 -0.101 -0.036 5,092.135 -0.005 -0.001 0.003 -0.003 -0.005***(0.017) (0.012) (0.014) (0.187) (0.083) (7,249.698) (0.006) (0.001) (0.002) (0.009) (0.001)
Located in San Jose -0.005 -0.002 -0.004 -0.079** -0.056*** -18,843.304*** -0.005** -0.001* -0.001* 0.004 0.002(0.007) (0.005) (0.006) (0.040) (0.016) (6,200.833) (0.002) (0.001) (0.000) (0.003) (0.001)
TPI > 2.5 million CRC 0.087*** 0.024*** 0.080*** -0.060 -0.021 4,616.031 0.003 -0.000 0.000 0.017*** -0.000(0.010) (0.007) (0.009) (0.052) (0.019) (14,514.704) (0.003) (0.001) (0.000) (0.005) (0.002)
TPI > 6 million CRC 0.067*** 0.061*** 0.072*** 0.551*** 0.166*** 25,176.254*** -0.012*** -0.002 -0.001** 0.007 0.006*(0.012) (0.009) (0.011) (0.088) (0.035) (9,631.292) (0.003) (0.001) (0.000) (0.006) (0.003)
Made advance payment for 2014 0.195*** 0.079*** 0.156*** 0.740*** 0.597*** 33,348.791** -0.001 -0.002*** -0.001*** 0.081 0.028(0.031) (0.019) (0.027) (0.272) (0.170) (14,399.345) (0.009) (0.000) (0.000) (0.070) (0.019)
Filed in 2013 0.055*** 0.027*** 0.041*** 0.826*** 0.098*** 25,071.474*** 0.000 0.001 -0.000 0.851*** -0.009***(0.009) (0.007) (0.008) (0.066) (0.024) (4,737.304) (0.003) (0.001) (0.000) (0.003) (0.002)
Reported net liability > 0 in 2013 -0.058*** -0.015 -0.037*** 0.475** -0.152** -13,857.169 0.006 0.004 -0.001*** 0.634*** 0.059***(0.013) (0.009) (0.012) (0.221) (0.062) (11,740.575) (0.009) (0.004) (0.000) (0.002) (0.019)
Made payment in 2013 0.055** 0.006 0.051** -1.073*** 0.239** 11,987.317 -0.006 -0.002* -0.001*** -0.036*** 0.991***(0.024) (0.013) (0.021) (0.255) (0.097) (13,001.494) (0.006) (0.001) (0.000) (0.007) (0.002)
Was third-party informant in 2013 0.242*** 0.121*** 0.165*** 0.242*** 0.092** 19,946.668*** -0.001 -0.001 0.000 0.047*** 0.004(0.014) (0.010) (0.012) (0.092) (0.036) (5,458.204) (0.004) (0.001) (0.001) (0.013) (0.003)
Constant 0.049 0.029(0.046) (0.019)
Control group avg. 0.177 0.0928 0.128 0.637 0.133 29095.0 0.00921 0.00218 0.000242 0.350 0.0572T1=T2 p-value (Wald test) 0.003 0.274 0.013 0.969 0.989 0.461 0.830 0.563 0.975 0.061 0.690Observations 12,515 12,515 12,515 12,515 12,515 12,515 12,515 12,515 12,515 12,515 12,515

Effect of Email on Compliance: Exp. 2 (No Controls)
Table 27: Effect of Email on Compliance (No Controls) (Experiment 2)
OLS
(1) (2) (3) (4) (5)
FiledPositive net
liabilityPositivepayment
Logpayment
Payment
T1: Baseline email 0.149*** 0.007*** 0.005*** 0.050*** 270.452***(0.004) (0.001) (0.001) (0.008) (60.333)
T2: Information 0.148*** 0.006*** 0.004*** 0.041*** 166.552***email (0.004) (0.001) (0.001) (0.008) (52.084)
Constant 0.039*** 0.002*** 0.001*** 0.014*** 96.154***(0.002) (0.000) (0.000) (0.004) (27.294)
Control group avg. 0.0393 0.00178 0.00130 0.0142 96.15T1=T2 p-value (Wald test) 0.872 0.487 0.611 0.365 0.136Observations 37,242 37,242 37,242 37,242 37,242
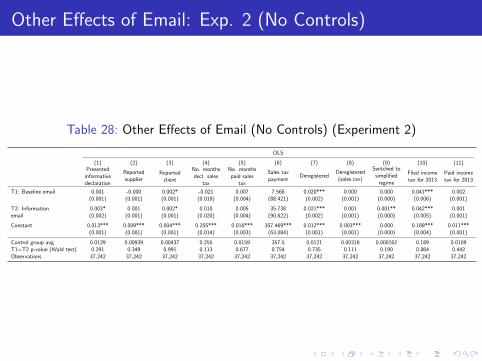
Other Effects of Email: Exp. 2 (No Controls)
Table 28: Other Effects of Email (No Controls) (Experiment 2)
OLS
(1) (2) (3) (4) (5) (6) (7) (8) (9) (10) (11)Presented
informativedeclaration
Reportedsupplier
Reportedclient
No. monthsdecl. sales
tax
No. monthspaid sales
tax
Sales taxpayment
DeregisteredDeregistered(sales tax)
Switched tosimplified
regime
Filed incometax for 2013
Paid incometax for 2013
T1: Baseline email 0.001 -0.000 0.002* -0.021 0.007 7.568 0.020*** 0.000 0.000 0.041*** 0.002(0.001) (0.001) (0.001) (0.019) (0.004) (88.421) (0.002) (0.001) (0.000) (0.006) (0.001)
T2: Information 0.003* 0.001 0.002* 0.010 0.005 35.738 0.021*** 0.001 0.001** 0.042*** 0.001email (0.002) (0.001) (0.001) (0.020) (0.004) (90.622) (0.002) (0.001) (0.000) (0.005) (0.001)
Constant 0.013*** 0.009*** 0.004*** 0.255*** 0.016*** 357.469*** 0.012*** 0.003*** 0.000 0.189*** 0.011***(0.001) (0.001) (0.001) (0.014) (0.003) (63.084) (0.001) (0.001) (0.000) (0.004) (0.001)
Control group avg. 0.0129 0.00939 0.00437 0.255 0.0159 357.5 0.0121 0.00316 0.000162 0.189 0.0109T1=T2 p-value (Wald test) 0.291 0.349 0.991 0.113 0.677 0.754 0.735 0.111 0.190 0.864 0.442Observations 37,242 37,242 37,242 37,242 37,242 37,242 37,242 37,242 37,242 37,242 37,242

Effect of Email on Compliance: Exp. 2
Table 29: Effect of Email on Compliance (Experiment 2)
OLS
(1) (2) (3) (4) (5)
FiledPositive net
liabilityPositivepayment
Logpayment
Payment
T1: Baseline email 0.151*** 0.007*** 0.005*** 0.050*** 265.125***(0.004) (0.001) (0.001) (0.008) (59.378)
T2: Information email 0.149*** 0.006*** 0.004*** 0.041*** 168.906***(0.004) (0.001) (0.001) (0.008) (51.542)
Other controls Yes Yes Yes Yes Yes
Control group avg. 0.0393 0.00178 0.00130 0.0142 96.15T1=T2 p-value (Wald test) 0.809 0.565 0.649 0.397 0.161Observations 37,242 37,242 37,242 37,242 37,242
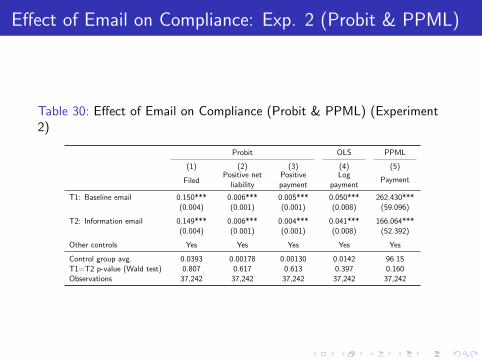
Effect of Email on Compliance: Exp. 2 (Probit & PPML)
Table 30: Effect of Email on Compliance (Probit & PPML) (Experiment2)
Probit OLS PPML
(1) (2) (3) (4) (5)
FiledPositive net
liabilityPositivepayment
Logpayment
Payment
T1: Baseline email 0.150*** 0.006*** 0.005*** 0.050*** 262.430***(0.004) (0.001) (0.001) (0.008) (59.096)
T2: Information email 0.149*** 0.006*** 0.004*** 0.041*** 166.064***(0.004) (0.001) (0.001) (0.008) (52.392)
Other controls Yes Yes Yes Yes Yes
Control group avg. 0.0393 0.00178 0.00130 0.0142 96.15T1=T2 p-value (Wald test) 0.807 0.617 0.613 0.397 0.160Observations 37,242 37,242 37,242 37,242 37,242

Other Effects of Email: Exp. 2
Table 31: Other Effects of Email (Experiment 2)
OLS
(1) (2) (3) (4) (5) (6) (7) (8) (9) (10) (11)Presented
informativedeclaration
Reportedsupplier
Reportedclient
No. monthsdecl. sales
tax
No. monthspaid sales
tax
Sales taxpayment
DeregisteredDeregistered(sales tax)
Switched tosimplified
regime
Filed incometax for 2013
Paid incometax for 2013
T1: Baseline email 0.001 -0.001 0.002** -0.016 0.007 8.135 0.020*** 0.000 0.000 0.050*** 0.001***(0.001) (0.001) (0.001) (0.018) (0.004) (87.939) (0.002) (0.001) (0.000) (0.003) (0.000)
T2: Information email 0.003* 0.001 0.002** 0.017 0.005 45.882 0.021*** 0.001* 0.001** 0.049*** 0.001**(0.002) (0.001) (0.001) (0.019) (0.004) (90.152) (0.002) (0.001) (0.000) (0.003) (0.000)
Other controls Yes Yes Yes Yes Yes Yes Yes Yes Yes Yes Yes
Control group avg. 0.0129 0.00939 0.00437 0.255 0.0159 357.5 0.0121 0.00316 0.000162 0.189 0.0109T1=T2 p-value (Wald test) 0.200 0.228 0.980 0.086 0.731 0.674 0.745 0.100 0.194 0.703 0.156Observations 37,242 37,242 37,242 37,242 37,242 37,242 37,242 37,242 37,242 37,242 37,242

Other Effects of Email: Exp. 2 (Probit & PPML)
Table 32: Other Effects of Email (Probit & PPML) (Experiment 2)
Probit OLS PPML Probit
(1) (2) (3) (4) (5) (6) (7) (8) (9) (10) (11)Presented
informativedeclaration
Reportedsupplier
Reportedclient
No. monthsdecl. sales
tax
No. monthspaid sales
tax
Sales taxpayment
DeregisteredDeregistered(sales tax)
Switched tosimplified
regime
Filed incometax for 2013
Paid incometax for 2013
T1: Baseline email 0.001 -0.000 0.002* -0.016 0.007 6.777 0.020*** 0.000 0.000 0.050*** 0.001***†(0.001) (0.001) (0.001) (0.018) (0.004) (87.473) (0.002) (0.001) (0.000) (0.003) (0.000)
T2: Information email 0.003* 0.001 0.002** 0.017† 0.005 43.482 0.021*** 0.001*† 0.001** 0.049*** 0.001**(0.002) (0.001) (0.001) (0.019) (0.004) (90.697) (0.002) (0.001) (0.000) (0.003) (0.000)
Other controls Yes Yes Yes Yes Yes Yes Yes Yes Yes Yes Yes
Control group avg. 0.0129 0.00939 0.00437 0.255 0.0159 357.5 0.0121 0.00316 0.000162 0.189 0.0109T1=T2 p-value (Wald test) 0.174 0.369 0.716 0.086 0.731 0.683 0.755 0.098 0.213 0.685 0.088Observations 37,242 37,242 37,242 37,242 37,242 37,242 37,242 37,242 37,242 37,242 37,242

Effect of Email on Compliance: Exp. 2 (All Controls)
Table 33: Effect of Email on Compliance (All Controls) (Experiment 2)
OLS
(1) (2) (3) (4) (5)
FiledPositive net
liabilityPositivepayment
Logpayment
Payment
T1: Baseline email 0.151*** 0.007*** 0.005*** 0.050*** 265.125***(0.004) (0.001) (0.001) (0.008) (59.378)
T2: Information email 0.149*** 0.006*** 0.004*** 0.041*** 168.906***(0.004) (0.001) (0.001) (0.008) (51.542)
Corporation -0.013*** 0.002 0.001 0.017 195.899**(0.005) (0.001) (0.001) (0.010) (81.093)
Has legal representative -0.001 0.001 -0.000 0.003 87.048**(0.004) (0.001) (0.001) (0.007) (42.996)
Has second email 0.028*** 0.002 0.003 0.033 196.916(0.009) (0.003) (0.002) (0.025) (191.855)
Located in San Jose -0.001 -0.001 -0.001 -0.011 -68.240(0.004) (0.001) (0.001) (0.007) (50.738)
Made advance payment for 2014 0.098*** 0.048** 0.013 0.153 1,627.113(0.034) (0.020) (0.014) (0.156) (1,335.720)
Filed in 2013 0.132*** 0.001 0.001 0.006 -22.339(0.007) (0.001) (0.001) (0.013) (86.755)
Reported net liability > 0 in 2013 -0.009 0.053*** -0.004 -0.048 -564.058(0.030) (0.017) (0.007) (0.078) (648.287)
Made payment in 2013 0.043 0.044* 0.075*** 0.801*** 5,627.506***(0.037) (0.023) (0.016) (0.176) (1,459.899)
Was third-party informant in 2013 0.016 0.003 0.001 0.016 148.780(0.012) (0.004) (0.003) (0.036) (288.932)
Constant 0.018*** -0.001 0.000 0.001 -51.258(0.004) (0.001) (0.001) (0.006) (45.241)
Control group avg. 0.0393 0.00178 0.00130 0.0142 96.15T1=T2 p-value (Wald test) 0.809 0.565 0.649 0.397 0.161Observations 37,242 37,242 37,242 37,242 37,242

Effect of Email on Compliance: Exp. 2 (Probit & PPML)(All Controls)
Table 34: Effect of Email on Compliance (Probit & PPML) (All Controls)(Experiment 2)
Probit OLS PPML
(1) (2) (3) (4) (5)
FiledPositive net
liabilityPositivepayment
Logpayment
Payment
T1: Baseline email 0.150*** 0.006*** 0.005*** 0.050*** 262.430***(0.004) (0.001) (0.001) (0.008) (59.096)
T2: Information email 0.149*** 0.006*** 0.004*** 0.041*** 166.064***(0.004) (0.001) (0.001) (0.008) (52.392)
Corporation -0.013*** 0.002* 0.002 0.017 177.133**(0.005) (0.001) (0.001) (0.010) (73.143)
Has legal representative -0.000 0.001 -0.000 0.003 103.848**(0.004) (0.001) (0.001) (0.007) (49.538)
Has second email 0.027*** 0.001 0.002 0.033 98.140(0.009) (0.002) (0.002) (0.025) (105.699)
Located in San Jose -0.002 -0.001 -0.001 -0.011 -60.903(0.004) (0.001) (0.001) (0.007) (50.039)
Made advance payment for 2014 0.075*** 0.014* 0.003 0.153 151.766(0.028) (0.007) (0.004) (0.156) (171.565)
Filed in 2013 0.132*** 0.002* 0.001 0.006 -3.763(0.006) (0.001) (0.001) (0.013) (92.633)
Reported net liability > 0 in 2013 -0.009 0.032*** -0.003 -0.048 -315.752(0.020) (0.012) (0.004) (0.078) (426.717)
Made payment in 2013 0.031 0.006 0.086 0.801*** 13,505.357(0.028) (0.005) (0.082) (0.176) (21,428.248)
Was third-party informant in 2013 0.015* 0.002 0.001 0.016 75.884(0.009) (0.002) (0.002) (0.036) (143.009)
Constant 0.001(0.006)
Control group avg. 0.0393 0.00178 0.00130 0.0142 96.15T1=T2 p-value (Wald test) 0.807 0.617 0.613 0.397 0.160Observations 37,242 37,242 37,242 37,242 37,242

Other Effects of Email: Exp. 2 (All Controls)
Table 35: Other Effects of Email (All Controls) (Experiment 2)
OLS
(1) (2) (3) (4) (5) (6) (7) (8) (9) (10) (11)Presented
informativedeclaration
Reportedsupplier
Reportedclient
No. monthsdecl. sales
tax
No. monthspaid sales
tax
Sales taxpayment
DeregisteredDeregistered(sales tax)
Switched tosimplified
regime
Filed incometax for 2013
Paid incometax for 2013
T1: Baseline email 0.001 -0.001 0.002** -0.016 0.007 8.135 0.020*** 0.000 0.000 0.050*** 0.001***(0.001) (0.001) (0.001) (0.018) (0.004) (87.939) (0.002) (0.001) (0.000) (0.003) (0.000)
T2: Information email 0.003* 0.001 0.002** 0.017 0.005 45.882 0.021*** 0.001* 0.001** 0.049*** 0.001**(0.002) (0.001) (0.001) (0.019) (0.004) (90.152) (0.002) (0.001) (0.000) (0.003) (0.000)
Corporation 0.007*** 0.013*** -0.005*** 0.232*** -0.006 60.120 -0.005*** 0.002** -0.000** -0.007** 0.001*(0.002) (0.002) (0.001) (0.024) (0.004) (103.200) (0.002) (0.001) (0.000) (0.003) (0.000)
Has legal representative -0.001 -0.001 0.000 0.043*** 0.008** 199.903*** 0.004** 0.001** -0.000 0.007*** -0.000(0.001) (0.001) (0.001) (0.015) (0.004) (72.540) (0.002) (0.001) (0.000) (0.002) (0.000)
Has second email 0.008* 0.006* 0.001 0.077 -0.001 0.021 -0.000 0.002 -0.000 0.017*** 0.002*(0.004) (0.004) (0.002) (0.053) (0.008) (210.357) (0.004) (0.002) (0.000) (0.006) (0.001)
Located in San Jose -0.003*** -0.004*** 0.000 -0.046*** -0.015*** -226.720*** -0.009*** -0.002*** -0.000 -0.001 -0.001**(0.001) (0.001) (0.001) (0.015) (0.004) (70.060) (0.002) (0.001) (0.000) (0.002) (0.000)
Made advance payment for 2014 0.059** 0.053** 0.031* 0.181 0.182 2,756.414 -0.008 0.009 -0.001 0.012 -0.001***(0.024) (0.021) (0.017) (0.227) (0.117) (2,137.135) (0.012) (0.009) (0.001) (0.015) (0.000)
Filed in 2013 0.003 0.002 0.003 0.856*** 0.034*** 550.304*** 0.001 -0.000 -0.001*** 0.936*** -0.001***(0.002) (0.002) (0.002) (0.042) (0.008) (148.955) (0.002) (0.001) (0.000) (0.002) (0.000)
Reported net liability > 0 in 2013 -0.040*** -0.030** -0.012 0.851*** 0.143 2,607.719 0.011 -0.004*** -0.001 0.010 0.019*(0.016) (0.013) (0.009) (0.281) (0.094) (1,720.499) (0.014) (0.001) (0.001) (0.008) (0.010)
Made payment in 2013 0.079*** 0.043** 0.041*** -1.375*** -0.057 -341.234 0.001 0.002 0.003 -0.001 0.981***(0.022) (0.018) (0.015) (0.297) (0.107) (2,098.519) (0.017) (0.003) (0.003) (0.011) (0.010)
Was third-party informant in 2013 0.123*** 0.092*** 0.038*** 0.123 0.062*** 1,803.489*** 0.007 -0.000 0.002 0.015*** 0.002*(0.009) (0.008) (0.006) (0.080) (0.023) (502.992) (0.005) (0.001) (0.001) (0.005) (0.001)
Constant 0.006*** 0.003*** 0.003*** 0.029* 0.008** 92.494 0.015*** 0.003*** 0.000* 0.022*** 0.001(0.001) (0.001) (0.001) (0.017) (0.004) (70.911) (0.002) (0.001) (0.000) (0.002) (0.000)
Control group avg. 0.0129 0.00939 0.00437 0.255 0.0159 357.5 0.0121 0.00316 0.000162 0.189 0.0109T1=T2 p-value (Wald test) 0.200 0.228 0.980 0.086 0.731 0.674 0.745 0.100 0.194 0.703 0.156Observations 37,242 37,242 37,242 37,242 37,242 37,242 37,242 37,242 37,242 37,242 37,242

Other Effects of Email: Exp. 2 (Probit & PPML) (AllControls)
Table 36: Other Effects of Email (Probit & PPML) (All Controls)(Experiment 2)
Probit OLS PPML Probit
(1) (2) (3) (4) (5) (6) (7) (8) (9) (10) (11)Presented
informativedeclaration
Reportedsupplier
Reportedclient
No. monthsdecl. sales
tax
No. monthspaid sales
tax
Sales taxpayment
DeregisteredDeregistered(sales tax)
Switched tosimplified
regime
Filed incometax for 2013
Paid incometax for 2013
T1: Baseline email 0.001 -0.000 0.002* -0.016 0.007 6.777 0.020*** 0.000 0.000 0.050*** 0.001***(0.001) (0.001) (0.001) (0.018) (0.004) (87.473) (0.002) (0.001) (0.000) (0.003) (0.000)
T2: Information email 0.003* 0.001 0.002** 0.017 0.005 43.482 0.021*** 0.001* 0.001** 0.049*** 0.001**(0.002) (0.001) (0.001) (0.019) (0.004) (90.697) (0.002) (0.001) (0.000) (0.003) (0.000)
Corporation 0.006*** 0.012*** -0.005*** 0.232*** -0.006 57.841 -0.005*** 0.002** -0.000*** -0.007** 0.001*(0.002) (0.002) (0.001) (0.024) (0.004) (94.716) (0.002) (0.001) (0.000) (0.003) (0.000)
Has legal representative -0.002 -0.001 -0.000 0.043*** 0.008** 207.133*** 0.004** 0.001** -0.000 0.007*** -0.000(0.002) (0.001) (0.001) (0.015) (0.004) (72.239) (0.002) (0.001) (0.000) (0.002) (0.000)
Has second email 0.005* 0.003 0.002 0.077 -0.001 -22.140 -0.000 0.002 -0.000*** 0.019*** 0.002(0.003) (0.002) (0.003) (0.053) (0.008) (132.634) (0.004) (0.002) (0.000) (0.006) (0.001)
Located in San Jose -0.003*** -0.004*** 0.000 -0.046*** -0.015*** -225.495*** -0.009*** -0.002*** -0.000 -0.001 -0.001**(0.001) (0.001) (0.001) (0.015) (0.004) (70.283) (0.002) (0.001) (0.000) (0.002) (0.000)
Made advance payment for 2014 0.019** 0.015** 0.012* 0.181 0.182 532.146 -0.006 0.010 -0.000*** 0.044 -0.001***(0.009) (0.007) (0.007) (0.227) (0.117) (471.394) (0.011) (0.010) (0.000) (0.035) (0.000)
Filed in 2013 0.006*** 0.004** 0.004*** 0.856*** 0.034*** 652.797*** 0.001 -0.000 -0.001*** 0.924*** -0.001***(0.002) (0.002) (0.001) (0.042) (0.008) (141.117) (0.002) (0.001) (0.000) (0.002) (0.000)
Reported net liability > 0 in 2013 -0.008*** -0.006*** -0.002 0.851*** 0.143 379.173 0.009 -0.004*** -0.000*** 0.783*** 0.034(0.003) (0.002) (0.002) (0.281) (0.094) (298.637) (0.012) (0.000) (0.000) (0.001) (0.029)
Made payment in 2013 0.032* 0.013 0.017 -1.375*** -0.057 -31.696 0.002 0.012 0.012 -0.029*** 0.999***(0.017) (0.010) (0.013) (0.297) (0.107) (180.099) (0.012) (0.010) (0.008) (0.011) (0.000)
Was third-party informant in 2013 0.095*** 0.070*** 0.027*** 0.123 0.062*** 677.025*** 0.006 -0.000 0.005 0.049*** 0.003**(0.011) (0.009) (0.006) (0.080) (0.023) (226.262) (0.005) (0.001) (0.003) (0.018) (0.001)
Constant 0.029* 0.008**(0.017) (0.004)
Control group avg. 0.0129 0.00939 0.00437 0.255 0.0159 357.5 0.0121 0.00316 0.000162 0.189 0.0109T1=T2 p-value (Wald test) 0.174 0.369 0.716 0.086 0.731 0.683 0.755 0.098 0.213 0.685 0.088Observations 37,242 37,242 37,242 37,242 37,242 37,242 37,242 37,242 37,242 37,242 37,242

Effect of SMS on Compliance (No Controls)
Table 37: Effect of SMS on Compliance (No Controls)
OLS
(1) (2) (3) (4) (5)
FiledPositive net
liabilityPositivepayment
Logpayment
Payment
T1: Public shaming 0.030*** 0.002 0.001 0.015 133.305SMS (0.003) (0.001) (0.001) (0.010) (108.847)
T2: Information SMS 0.024*** 0.002* 0.000 0.007 129.089(0.003) (0.001) (0.001) (0.010) (110.032)
Constant 0.036*** 0.007*** 0.004*** 0.043*** 339.837***(0.002) (0.001) (0.001) (0.007) (70.980)
Control group avg. 0.0363 0.00743 0.00411 0.0435 339.8T1=T2 p-value (Wald test) 0.062 0.729 0.365 0.422 0.971Observations 30,842 30,842 30,842 30,842 30,842

Other Effects of SMS (No Controls)
Table 38: Other Effects of SMS (No Controls)
OLS
(1) (2) (3) (4) (5) (6) (7) (8) (9) (10) (11)Presented
informativedeclaration
Reportedsupplier
Reportedclient
No. monthsdecl. sales
tax
No. monthspaid sales
tax
Sales taxpayment
DeregisteredDeregistered(sales tax)
Switched tosimplified
regime
Filed incometax for 2013
Paid incometax for 2013
T1: Public shaming 0.002 0.001 0.002 0.042* 0.004 493.933* 0.007*** 0.000 -0.000 0.021*** -0.001SMS (0.002) (0.002) (0.002) (0.024) (0.008) (282.723) (0.002) (0.001) (0.000) (0.006) (0.002)
T2: Information SMS 0.004 0.003 0.002 0.004 0.004 275.571 0.003** -0.001 -0.001** 0.012** 0.001(0.002) (0.002) (0.002) (0.023) (0.008) (265.867) (0.002) (0.001) (0.000) (0.006) (0.002)
Constant 0.029*** 0.016*** 0.018*** 0.276*** 0.042*** 935.910*** 0.010*** 0.003*** 0.001** 0.175*** 0.018***(0.002) (0.001) (0.001) (0.016) (0.006) (166.243) (0.001) (0.001) (0.000) (0.004) (0.001)
Control group avg. 0.0286 0.0155 0.0182 0.276 0.0416 935.9 0.0104 0.00284 0.000587 0.175 0.0184T1=T2 p-value (Wald test) 0.457 0.340 0.825 0.105 0.979 0.479 0.042 0.227 0.083 0.142 0.335Observations 30,842 30,842 30,842 30,842 30,842 30,842 30,842 30,842 30,842 30,842 30,842

Effect of SMS on Compliance
Table 39: Effect of SMS on Compliance
OLS
(1) (2) (3) (4) (5)
FiledPositive net
liabilityPositivepayment
Logpayment
Payment
T1: Public shaming SMS 0.029*** 0.002 0.001 0.016 133.383(0.003) (0.001) (0.001) (0.010) (105.867)
T2: Information SMS 0.023*** 0.002 0.000 0.004 103.779(0.003) (0.001) (0.001) (0.010) (105.960)
TPI reportee 0.026*** 0.005** 0.004** 0.043** 142.163(0.006) (0.002) (0.002) (0.019) (136.826)
TPI > 2.5 million CRC 0.049*** 0.022*** 0.012** 0.128** 1,066.327*(0.013) (0.006) (0.005) (0.054) (544.590)
TPI > 6 million CRC 0.018 0.050*** 0.013* 0.168** 2,598.967***(0.016) (0.010) (0.007) (0.081) (934.073)
Other controls Yes Yes Yes Yes Yes
Control group avg. 0.0363 0.00743 0.00411 0.0435 339.8T1=T2 p-value (Wald test) 0.059 0.912 0.227 0.273 0.795Observations 30,842 30,842 30,842 30,842 30,842

Effect of SMS on Compliance (Probit & PPML)
Table 40: Effect of SMS on Compliance (Probit & PPML)
Probit OLS PPML
(1) (2) (3) (4) (5)
FiledPositive net
liabilityPositivepayment
Logpayment
Payment
T1: Public shaming SMS 0.031*** 0.002* 0.002* 0.016 136.070(0.003) (0.001) (0.001) (0.010) (108.186)
T2: Information SMS 0.024*** 0.002 0.000 0.004 99.784(0.003) (0.001) (0.001) (0.010) (103.860)
TPI reportee 0.029*** 0.008*** 0.005*** 0.045** 472.924***(0.005) (0.002) (0.002) (0.019) (158.965)
TPI > 2.5 million CRC 0.030*** 0.010*** 0.004** 0.123** 425.925**(0.009) (0.003) (0.002) (0.054) (204.018)
TPI > 6 million CRC 0.006 0.006*** 0.001 0.172** 238.749(0.007) (0.002) (0.001) (0.081) (154.156)
Other controls Yes Yes Yes Yes Yes
Control group avg. 0.0363 0.00743 0.00411 0.0435 339.8T1=T2 p-value (Wald test) 0.036 0.745 0.155 0.277 0.747Observations 30,842 30,842 30,842 30,842 30,842

Other Effects of SMS
Table 41: Other Effects of SMS
OLS
(1) (2) (3) (4) (5) (6) (7) (8) (9) (10) (11)Presented
informativedeclaration
Reportedsupplier
Reportedclient
No. monthsdecl. sales
tax
No. monthspaid sales
tax
Sales taxpayment
DeregisteredDeregistered(sales tax)
Switched tosimplified
regime
Filed incometax for 2013
Paid incometax for 2013
T1: Public shaming SMS 0.001 0.000 0.001 0.026 0.003 447.247 0.007*** -0.000 -0.000 0.010*** 0.001*(0.002) (0.002) (0.002) (0.023) (0.008) (274.377) (0.002) (0.001) (0.000) (0.002) (0.000)
T2: Information SMS 0.002 0.002 0.001 -0.006 0.002 200.232 0.003** -0.001 -0.001** 0.008*** 0.000(0.002) (0.002) (0.002) (0.022) (0.008) (261.036) (0.002) (0.001) (0.000) (0.002) (0.000)
TPI reportee 0.044*** 0.019*** 0.023*** -0.029 0.015 343.643 -0.003 -0.002*** 0.000 0.008*** 0.001(0.005) (0.004) (0.004) (0.037) (0.016) (466.052) (0.002) (0.001) (0.000) (0.003) (0.001)
TPI > 2.5 million CRC 0.052*** -0.009 0.070*** 0.136 0.080* 1,671.098 -0.005 0.002 0.001 0.022*** 0.001(0.012) (0.007) (0.011) (0.088) (0.044) (1,210.793) (0.004) (0.002) (0.001) (0.007) (0.002)
TPI > 6 million CRC 0.098*** 0.080*** 0.092*** 0.193 -0.038 4,886.835** -0.002 -0.002 -0.001 0.003 0.005(0.016) (0.011) (0.015) (0.120) (0.057) (2,184.422) (0.004) (0.002) (0.001) (0.009) (0.003)
Other controls Yes Yes Yes Yes Yes Yes Yes Yes Yes Yes Yes
Control group avg. 0.0286 0.0155 0.0182 0.276 0.0416 935.9 0.0104 0.00284 0.000587 0.175 0.0184T1=T2 p-value (Wald test) 0.541 0.349 0.584 0.155 0.893 0.414 0.051 0.248 0.081 0.291 0.520Observations 30,842 30,842 30,842 30,842 30,842 30,842 30,842 30,842 30,842 30,842 30,842

Other Effects of SMS (Probit & PPML)
Table 42: Other Effects of SMS (Probit & PPML)
Probit OLS PPML Probit
(1) (2) (3) (4) (5) (6) (7) (8) (9) (10) (11)Presented
informativedeclaration
Reportedsupplier
Reportedclient
No. monthsdecl. sales
tax
No. monthspaid sales
tax
Sales taxpayment
DeregisteredDeregistered(sales tax)
Switched tosimplified
regime
Filed incometax for 2013
Paid incometax for 2013
T1: Public shaming SMS 0.001 0.000 0.001 0.027 0.003 426.698 0.007***†† -0.000 -0.000 0.010*** 0.001**(0.002) (0.002) (0.002) (0.023) (0.008) (280.415) (0.002) (0.001) (0.000) (0.002) (0.000)
T2: Information SMS 0.002 0.002 0.000 -0.006 0.002 176.151 0.003** -0.001 -0.001**† 0.007*** 0.000(0.002) (0.002) (0.002) (0.022) (0.008) (258.053) (0.002) (0.001) (0.000) (0.002) (0.000)
TPI reportee 0.049*** 0.022*** 0.031*** -0.005 0.031* 1,370.309*** -0.002 -0.003*** 0.000 0.007** 0.001(0.004) (0.003) (0.003) (0.038) (0.017) (457.876) (0.002) (0.001) (0.000) (0.003) (0.001)
TPI > 2.5 million CRC 0.014*** -0.003 0.018*** 0.168* 0.072* 400.869 -0.005 0.012 0.001 0.021*** 0.001(0.004) (0.003) (0.003) (0.090) (0.044) (431.705) (0.004) (0.012) (0.001) (0.008) (0.001)
TPI > 6 million CRC 0.015*** 0.016*** 0.011*** 0.129 -0.046 183.805 -0.002 -0.002*** -0.000*** 0.000 0.002(0.004) (0.005) (0.003) (0.121) (0.057) (372.037) (0.005) (0.001) (0.000) (0.005) (0.002)
Other controls Yes Yes Yes Yes Yes Yes Yes Yes Yes Yes Yes
Control group avg. 0.0286 0.0155 0.0182 0.276 0.0416 935.9 0.0104 0.00284 0.000587 0.175 0.0184T1=T2 p-value (Wald test) 0.575 0.382 0.684 0.153 0.892 0.399 0.040 0.271 0.076 0.124 0.238Observations 30,842 30,842 30,842 30,842 30,842 30,842 30,842 30,842 30,842 30,842 30,842

Effect of SMS on Compliance (All Controls)
Table 43: Effect of SMS on Compliance (All Controls)
OLS
(1) (2) (3) (4) (5)
FiledPositive net
liabilityPositivepayment
Logpayment
Payment
T1: Public Shaming SMS 0.029*** 0.002 0.001 0.016 133.383(0.003) (0.001) (0.001) (0.010) (105.867)
T2: Information SMS 0.023*** 0.002 0.000 0.004 103.779(0.003) (0.001) (0.001) (0.010) (105.960)
Corporated -0.018*** 0.001 -0.001 -0.004 116.002(0.003) (0.001) (0.001) (0.010) (110.502)
Has second phone 0.003 -0.000 -0.000 -0.004 -55.020(0.004) (0.002) (0.001) (0.012) (147.738)
Located in San Jose -0.011*** -0.002* -0.001 -0.010 -207.772**(0.003) (0.001) (0.001) (0.008) (86.382)
TPI reportee 0.026*** 0.005** 0.004** 0.043** 142.163(0.006) (0.002) (0.002) (0.019) (136.826)
TPI > 2.5 million CRC 0.049*** 0.022*** 0.012** 0.128** 1,066.327*(0.013) (0.006) (0.005) (0.054) (544.590)
TPI > 6 million CRC 0.018 0.050*** 0.013* 0.168** 2,598.967***(0.016) (0.010) (0.007) (0.081) (934.073)
Made advance payment for 2014 0.125*** 0.084*** 0.074*** 0.829*** 8,792.594***(0.032) (0.026) (0.022) (0.245) (3,085.321)
Filed in 2013 0.087*** 0.002 0.003 0.027 53.722(0.006) (0.002) (0.002) (0.018) (168.662)
Reported net liability > 0 in 2013 0.012 0.084*** 0.009 0.085 274.011(0.020) (0.016) (0.008) (0.086) (881.277)
Made payment in 2013 0.047* 0.011 0.064*** 0.709*** 7,497.493***(0.027) (0.022) (0.015) (0.161) (1,912.740)
Was third-party informant in 2013 0.010 0.005 -0.002 -0.021 51.239(0.010) (0.006) (0.004) (0.044) (433.953)
Constant 0.021*** -0.000 0.000 0.003 -16.004(0.002) (0.001) (0.001) (0.007) (81.933)
Control group avg. 0.0363 0.00743 0.00411 0.0435 339.8T1=T2 p-value (Wald test) 0.059 0.912 0.227 0.273 0.795Observations 30,842 30,842 30,842 30,842 30,842

Effect of SMS on Compliance (Probit & PPML) (AllControls)
Table 44: Effect of SMS on Compliance (Probit & PPML) (All Controls)
Probit OLS PPML
(1) (2) (3) (4) (5)
FiledPositive net
liabilityPositivepayment
Logpayment
Payment
T1: Public Shaming SMS 0.031***†† 0.002* 0.002* 0.016 136.070(0.003) (0.001) (0.001) (0.010) (108.186)
T2: Information SMS 0.024*** 0.002 0.000 0.004 99.784(0.003) (0.001) (0.001) (0.010) (103.860)
Corporated -0.018*** 0.001 -0.001 -0.003 100.539(0.003) (0.001) (0.001) (0.010) (114.204)
Has second phone 0.004 0.000 -0.000 -0.004 -45.322(0.004) (0.001) (0.001) (0.012) (111.178)
Located in San Jose -0.011*** -0.002* -0.000 -0.010 -203.961**(0.003) (0.001) (0.001) (0.009) (84.752)
TPI reportee 0.029*** 0.008*** 0.005*** 0.045** 472.924***(0.005) (0.002) (0.002) (0.019) (158.965)
TPI > 2.5 million CRC 0.030*** 0.010*** 0.004** 0.123** 425.925**(0.009) (0.003) (0.002) (0.054) (204.018)
TPI > 6 million CRC 0.006 0.006*** 0.001 0.172** 238.749(0.007) (0.002) (0.001) (0.081) (154.156)
Made advance payment for 2014 0.061*** 0.012** 0.011** 0.831*** 533.082**(0.019) (0.005) (0.005) (0.245) (271.232)
Filed in 2013 0.084*** 0.005*** 0.004*** 0.027 251.788(0.006) (0.002) (0.001) (0.018) (157.196)
Reported net liability > 0 in 2013 0.004 0.021*** 0.003 0.083 211.891(0.009) (0.006) (0.003) (0.086) (243.252)
Made payment in 2013 0.018 0.002 0.013** 0.711*** 932.340**(0.013) (0.003) (0.006) (0.161) (452.038)
Was third-party informant in 2013 0.003 0.000 -0.001 -0.021 -74.626(0.005) (0.002) (0.001) (0.044) (123.444)
Constant 0.003(0.007)
Control group avg. 0.0363 0.00743 0.00411 0.0435 339.8T1=T2 p-value (Wald test) 0.036 0.745 0.155 0.277 0.747Observations 30,842 30,842 30,842 30,842 30,842

Other Effects of SMS (All Controls)
Table 45: Other Effects of SMS (All Controls)
OLS
(1) (2) (3) (4) (5) (6) (7) (8) (9) (10) (11)Presented
informativedeclaration
Reportedsupplier
Reportedclient
No. monthsdecl. sales
tax
No. monthspaid sales
tax
Sales taxpayment
DeregisteredDeregistered(sales tax)
Switched tosimplified
regime
Filed incometax for 2013
Paid incometax for 2013
T1: Public Shaming SMS 0.001 0.000 0.001 0.026 0.003 447.247 0.007*** -0.000 -0.000 0.010*** 0.001*(0.002) (0.002) (0.002) (0.023) (0.008) (274.377) (0.002) (0.001) (0.000) (0.002) (0.000)
T2: Information SMS 0.002 0.002 0.001 -0.006 0.002 200.232 0.003** -0.001 -0.001** 0.008*** 0.000(0.002) (0.002) (0.002) (0.022) (0.008) (261.036) (0.002) (0.001) (0.000) (0.002) (0.000)
Corporated 0.008*** 0.013*** -0.003 0.154*** -0.000 1,100.602*** 0.001 0.002** -0.000*** -0.005*** 0.000(0.002) (0.002) (0.002) (0.024) (0.007) (327.172) (0.002) (0.001) (0.000) (0.002) (0.000)
Has second phone -0.003 -0.003 -0.001 0.050 -0.007 -193.605 -0.002 -0.001 -0.000*** 0.004 -0.000(0.003) (0.002) (0.002) (0.031) (0.009) (454.912) (0.002) (0.001) (0.000) (0.002) (0.001)
Located in San Jose -0.005*** -0.005*** -0.001 -0.021 -0.020*** -112.957 -0.007*** -0.002*** -0.000 -0.006*** -0.001*(0.002) (0.001) (0.001) (0.019) (0.006) (247.656) (0.001) (0.001) (0.000) (0.002) (0.000)
TPI reportee 0.044*** 0.019*** 0.023*** -0.029 0.015 343.643 -0.003 -0.002*** 0.000 0.008*** 0.001(0.005) (0.004) (0.004) (0.037) (0.016) (466.052) (0.002) (0.001) (0.000) (0.003) (0.001)
TPI > 2.5 million CRC 0.052*** -0.009 0.070*** 0.136 0.080* 1,671.098 -0.005 0.002 0.001 0.022*** 0.001(0.012) (0.007) (0.011) (0.088) (0.044) (1,210.793) (0.004) (0.002) (0.001) (0.007) (0.002)
TPI > 6 million CRC 0.098*** 0.080*** 0.092*** 0.193 -0.038 4,886.835** -0.002 -0.002 -0.001 0.003 0.005(0.016) (0.011) (0.015) (0.120) (0.057) (2,184.422) (0.004) (0.002) (0.001) (0.009) (0.003)
Made advance payment for 2014 0.240*** 0.154*** 0.182*** 0.838*** 0.863*** 25,174.083*** -0.002 0.003 -0.000 -0.003 0.003(0.030) (0.028) (0.029) (0.291) (0.213) (7,998.440) (0.008) (0.005) (0.000) (0.012) (0.005)
Filed in 2013 -0.003 -0.007** 0.001 0.909*** 0.074*** 1,228.223** 0.009*** 0.002* -0.000 0.960*** -0.001(0.004) (0.003) (0.003) (0.052) (0.017) (487.057) (0.002) (0.001) (0.000) (0.002) (0.001)
Reported net liability > 0 in 2013 -0.000 0.003 0.015 0.524** 0.163* 6,521.143* 0.000 0.004 -0.000 0.032*** 0.026***(0.020) (0.018) (0.018) (0.215) (0.093) (3,597.098) (0.007) (0.005) (0.000) (0.011) (0.008)
Made payment in 2013 0.020 0.016 0.033 -1.213*** -0.115 -3,706.024 -0.004 -0.010** 0.000 -0.016 0.973***(0.026) (0.023) (0.023) (0.244) (0.119) (5,058.608) (0.009) (0.005) (0.000) (0.012) (0.008)
Was third-party informant in 2013 0.228*** 0.165*** 0.110*** 0.752*** 0.162*** 6,049.383*** 0.005 0.003 -0.000 0.021*** -0.003**(0.012) (0.010) (0.009) (0.106) (0.043) (1,398.306) (0.004) (0.002) (0.000) (0.005) (0.001)
Constant 0.000 -0.001 -0.001 0.024 0.014** -547.405*** 0.012*** 0.003*** 0.001*** 0.019*** 0.001(0.002) (0.001) (0.001) (0.018) (0.006) (203.395) (0.001) (0.001) (0.000) (0.002) (0.000)
Control group avg. 0.0286 0.0155 0.0182 0.276 0.0416 935.9 0.0104 0.00284 0.000587 0.175 0.0184T1=T2 p-value (Wald test) 0.541 0.349 0.584 0.155 0.893 0.414 0.051 0.248 0.081 0.291 0.520Observations 30,842 30,842 30,842 30,842 30,842 30,842 30,842 30,842 30,842 30,842 30,842

Other Effects of SMS (Probit & PPML) (All Controls)
Table 46: Other Effects of SMS (Probit & PPML) (All Controls)
Probit OLS PPML Probit
(1) (2) (3) (4) (5) (6) (7) (8) (9) (10) (11)Presented
informativedeclaration
Reportedsupplier
Reportedclient
No. monthsdecl. sales
tax
No. monthspaid sales
tax
Sales taxpayment
DeregisteredDeregistered(sales tax)
Switched tosimplified
regime
Filed incometax for 2013
Paid incometax for 2013
T1: Public Shaming SMS 0.001 0.000 0.001 0.027 0.003 426.698 0.007*** -0.000 -0.000 0.010*** 0.001**(0.002) (0.002) (0.002) (0.023) (0.008) (280.415) (0.002) (0.001) (0.000) (0.002) (0.000)
T2: Information SMS 0.002 0.002 0.000 -0.006 0.002 176.151 0.003** -0.001 -0.001** 0.007*** 0.000(0.002) (0.002) (0.002) (0.022) (0.008) (258.053) (0.002) (0.001) (0.000) (0.002) (0.000)
Corporated 0.006*** 0.012*** -0.004*** 0.157*** 0.001 1,152.048*** 0.001 0.002** -0.000*** -0.004* 0.000(0.002) (0.002) (0.002) (0.024) (0.007) (323.730) (0.002) (0.001) (0.000) (0.002) (0.001)
Has second phone -0.003 -0.002 -0.000 0.050 -0.007 -149.977 -0.001 -0.001 -0.000*** 0.003 -0.000(0.002) (0.002) (0.002) (0.031) (0.009) (286.010) (0.002) (0.001) (0.000) (0.003) (0.001)
Located in San Jose -0.005*** -0.005*** -0.001 -0.022 -0.020*** -108.219 -0.007*** -0.002*** -0.000 -0.006*** -0.001**(0.002) (0.001) (0.001) (0.019) (0.006) (244.474) (0.001) (0.001) (0.000) (0.002) (0.000)
TPI reportee 0.049*** 0.022*** 0.031*** -0.005 0.031* 1,370.309*** -0.002 -0.003*** 0.000 0.007** 0.001(0.004) (0.003) (0.003) (0.038) (0.017) (457.876) (0.002) (0.001) (0.000) (0.003) (0.001)
TPI > 2.5 million CRC 0.014*** -0.003 0.018*** 0.168* 0.072* 400.869 -0.005 0.012 0.001 0.021*** 0.001(0.004) (0.003) (0.003) (0.090) (0.044) (431.705) (0.004) (0.012) (0.001) (0.008) (0.001)
TPI > 6 million CRC 0.015*** 0.016*** 0.011*** 0.129 -0.046 183.805 -0.002 -0.002*** -0.000*** 0.000 0.002(0.004) (0.005) (0.003) (0.121) (0.057) (372.037) (0.005) (0.001) (0.000) (0.005) (0.002)
Made advance payment for 2014 0.068*** 0.027*** 0.034*** 0.839*** 0.862*** 2,805.716* -0.003 0.005 -0.000*** 0.003 0.003(0.015) (0.008) (0.009) (0.292) (0.213) (1,529.611) (0.007) (0.007) (0.000) (0.015) (0.005)
Filed in 2013 0.007** 0.001 0.008*** 0.907*** 0.073*** 1,729.406*** 0.009*** 0.002* -0.000 0.943*** -0.001(0.003) (0.002) (0.002) (0.052) (0.017) (415.484) (0.002) (0.001) (0.000) (0.001) (0.001)
Reported net liability > 0 in 2013 -0.006* -0.003 -0.002 0.523** 0.162* 372.557 0.001 0.002 -0.000*** 0.815*** 0.041(0.003) (0.003) (0.003) (0.214) (0.093) (400.753) (0.006) (0.003) (0.000) (0.001) (0.027)
Made payment in 2013 0.006 0.003 0.007* -1.211*** -0.114 -474.473 -0.003 -0.003*** 0.000 -0.021*** 0.998***(0.006) (0.004) (0.005) (0.244) (0.119) (450.797) (0.006) (0.000) (0.000) (0.004) (0.000)
Was third-party informant in 2013 0.129*** 0.105*** 0.040*** 0.749*** 0.161*** 1,497.391*** 0.005 0.003 -0.000*** 0.067*** -0.001***(0.011) (0.012) (0.005) (0.106) (0.043) (509.277) (0.004) (0.002) (0.000) (0.016) (0.000)
Constant 0.021 0.012*(0.018) (0.006)
Control group avg. 0.0286 0.0155 0.0182 0.276 0.0416 935.9 0.0104 0.00284 0.000587 0.175 0.0184T1=T2 p-value (Wald test) 0.575 0.382 0.684 0.153 0.892 0.399 0.040 0.271 0.076 0.124 0.238Observations 30,842 30,842 30,842 30,842 30,842 30,842 30,842 30,842 30,842 30,842 30,842

Figures: Email Experiment 1
11.5
32.5*** 34.2***†
0
10
20
30
40
Perc
ent
-5 5 10 15Start date: 4 MarWeeks
Control Baseline Email Information Email
Percent Declared: Firms with TPI

Figures: Email Experiment 1
1.7
4.7*** 5.3***
0
2
4
6
Perc
ent
-5 5 10 15Start date: 4 MarWeeks
Control Baseline Email Information Email
Percent Positive declaration payment: Firms with TPI

Figures: Email Experiment 1
17.7
20.3***
22.2***†††
14
16
18
20
22
Perc
ent
-5 5 10 15Start date: 4 MarWeeks
Control Baseline Email Information Email
Percent D-151 Informant: Firms with TPI

Figures: Email Experiment 1
8
10
12
14
16
Perc
ent
-5 5 10 15Start date: 4 MarWeeks
Control Baseline Email Information Email
Percent D-151 Sales Informant: Firms with TPI
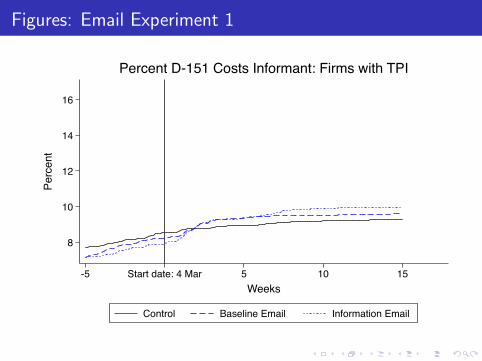
Figures: Email Experiment 1
8
10
12
14
16
Perc
ent
-5 5 10 15Start date: 4 MarWeeks
Control Baseline Email Information Email
Percent D-151 Costs Informant: Firms with TPI
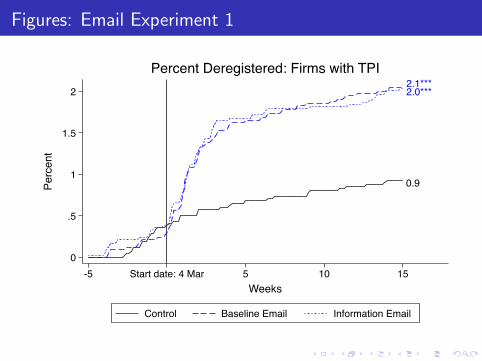
Figures: Email Experiment 1
0.9
2.1*** 2.0***
0
.5
1
1.5
2
Perc
ent
-5 5 10 15Start date: 4 MarWeeks
Control Baseline Email Information Email
Percent Deregistered: Firms with TPI

Figures: Email Experiment 1
11.5
32.634.2
******
010
2030
40Pe
rcen
t
Control Baseline Email Information EmailError bars indicate 95% confidence intervals. Stars indicate a significant difference from the control group (at the .10, .05, and .01 levels) and daggers (†) indicate a significant difference between the two treatments.
Percent Filed: Firms with TPI
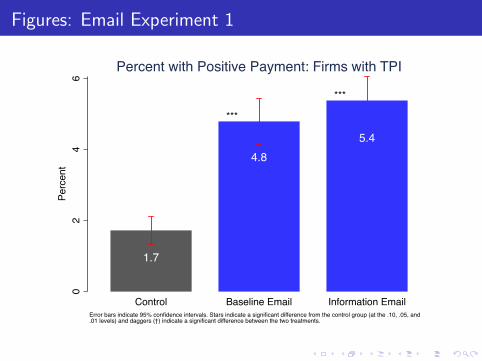
Figures: Email Experiment 1
1.7
4.85.4
***
***
02
46
Perc
ent
Control Baseline Email Information EmailError bars indicate 95% confidence intervals. Stars indicate a significant difference from the control group (at the .10, .05, and .01 levels) and daggers (†) indicate a significant difference between the two treatments.
Percent with Positive Payment: Firms with TPI

Figures: Email Experiment 1
0.19
0.540.59
******
0.0
0.2
0.4
0.6
0.8
Aver
age
Control Baseline Email Information EmailPayment amounts winsorized at the top 0.1% to reduce the influence of outliers.Error bars indicate 95% confidence intervals. Stars indicate a significant difference from the control group (at the .10, .05, and .01 levels) and daggers (†) indicate a significant difference between the two treatments.
Average Log Payment (Winsorized): Firms with TPI

Figures: Email Experiment 1
14,51929,935
5,340
***
*** †
010
,000
20,0
0030
,000
40,0
0050
,000
Aver
age
Control Baseline Email Information EmailError bars indicate 95% confidence intervals. Stars indicate a significant difference from the control group (at the .10, .05, and .01 levels) and daggers (†) indicate a significant difference between the two treatments.
Average Payment: Firms with TPI

Figures: Email Experiment 1
13,37115,137
5,016
***
***
05,
000
10,0
0015
,000
20,0
00Av
erag
e
Control Baseline Email Information EmailPayment amounts winsorized at the top 0.1% to reduce the influence of outliers.Error bars indicate 95% confidence intervals. Stars indicate a significant difference from the control group (at the .10, .05, and .01 levels) and daggers (†) indicate a significant difference between the two treatments.
Average Payment (Winsorized): Firms with TPI

Figures: Email Experiment 1
17.7
20.322.2
****** †
05
1015
2025
Perc
ent
Control Baseline Email Information EmailError bars indicate 95% confidence intervals. Stars indicate a significant difference from the control group (at the .10, .05, and .01 levels) and daggers (†) indicate a significant difference between the two treatments.
Percent Third-Party Informant: Firms with TPI

Figures: Email Experiment 1
0.9
2.1 2.0
*** ***
0.0
0.5
1.0
1.5
2.0
2.5
Perc
ent
Control Baseline Email Information EmailError bars indicate 95% confidence intervals. Stars indicate a significant difference from the control group (at the .10, .05, and .01 levels) and daggers (†) indicate a significant difference between the two treatments.
Percent Deregistered: Firms with TPI

Figures: Email Experiment 1
84.9
72.269.5
6.510.8
15.0
8.6
17.0 15.5
*** ***
****** *** ***
†††
†††
020
4060
80Pe
rcen
t
Self-Report < TPI Self-Report ≈ TPI Self-Report > TPI
Control Baseline Email TPI Email
Error bars indicate 95% confidence intervals. Stars indicate a significant difference from the control group (at the .10, .05, and .01 levels) and daggers (†) indicate a significant difference between the two treatments.
Sales Reporting (Declaration vs. TPI)

Figures: Email Experiment 1
35.031.6 31.5
1.6 1.8 1.9
63.466.6 66.6
*** ***
*** ***
*** ***
020
4060
80Pe
rcen
t
Self-Report < TPI Self-Report ≈ TPI Self-Report > TPI
Control Baseline Email TPI Email
Error bars indicate 95% confidence intervals. Stars indicate a significant difference from the control group (at the .10, .05, and .01 levels) and daggers (†) indicate a significant difference between the two treatments.
Costs Reporting (Declaration vs. TPI)

Figures: Email Experiment 1
43.0
37.4
32.4
22.723.3
32.134.3
39.2
35.5*** ***††† †††
†
010
2030
4050
Perc
ent
Self-Report < TPI Self-Report ≈ TPI Self-Report > TPI
Control Baseline Email TPI Email
Error bars indicate 95% confidence intervals. Stars indicate a significant difference from the control group (at the .10, .05, and .01 levels) and daggers (†) indicate a significant difference between the two treatments.
Sales Reporting (If Filed)

Figures: Email Experiment 1
20.022.5 22.0
1.1 0.7 0.8
78.9 76.8 77.3
*
*** ***
*** ***0
2040
6080
Perc
ent
Self-Report < TPI Self-Report ≈ TPI Self-Report > TPI
Control Baseline Email TPI Email
Error bars indicate 95% confidence intervals. Stars indicate a significant difference from the control group (at the .10, .05, and .01 levels) and daggers (†) indicate a significant difference between the two treatments.
Costs Reporting (If Filed)

Figures: Email Experiment 1
9.0 8.5 8.4
18.014.4
11.9
73.0
77.179.8
****
****
†††
††0
2040
6080
Perc
ent
Profit < 0 Profit ≈ 0 Profit > 0
Control Baseline Email TPI Email
Error bars indicate 95% confidence intervals. Stars indicate a significant difference from the control group (at the .10, .05, and .01 levels) and daggers (†) indicate a significant difference between the two treatments.
Profit (Sales - Costs) (If Filed)

Figures: Email Experiment 2
3.9
18.8*** 18.7***
0
5
10
15
20
Perc
ent
-10 -5 5 10 15Start date: 7 AprWeeks
Control Baseline Email Information Email
Percent Declared: Firms without TPI
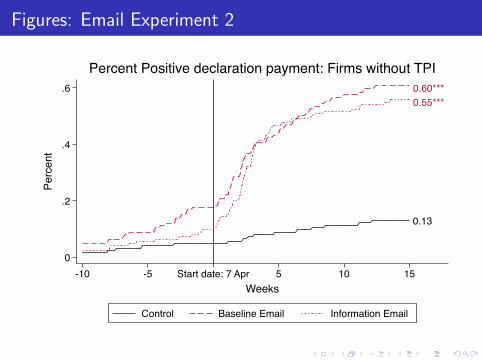
Figures: Email Experiment 2
0.13
0.60*** 0.55***
0
.2
.4
.6
Perc
ent
-10 -5 5 10 15Start date: 7 AprWeeks
Control Baseline Email Information Email
Percent Positive declaration payment: Firms without TPI

Figures: Email Experiment 2
1.29
1.39
1.56*
1
1.2
1.4
1.6
Perc
ent
-10 -5 5 10 15Start date: 7 AprWeeks
Control Baseline Email Information Email
Percent D-151 Informant: Firms without TPI

Figures: Email Experiment 2
.4
.6
.8
1
Perc
ent
-10 -5 5 10 15Start date: 7 AprWeeks
Control Baseline Email Information Email
Percent D-151 Sales Informant: Firms without TPI

Figures: Email Experiment 2
.4
.6
.8
1
Perc
ent
-10 -5 5 10 15Start date: 7 AprWeeks
Control Baseline Email Information Email
Percent D-151 Costs Informant: Firms without TPI

Figures: Email Experiment 2
1.2
3.2*** 3.3***
0
1
2
3
4
Perc
ent
-10 -5 5 10 15Start date: 7 AprWeeks
Control Baseline Email Information Email
Percent Deregistered: Firms without TPI

Figures: Email Experiment 2
3.9
18.8 18.7
*** ***0
510
1520
Perc
ent
Control Baseline Email Information EmailError bars indicate 95% confidence intervals. Stars indicate a significant difference from the control group (at the .10, .05, and .01 levels) and daggers (†) indicate a significant difference between the two treatments.
Percent Filed: Firms without TPI

Figures: Email Experiment 2
0.610.56
0.13
******
0.0
0.2
0.4
0.6
0.8
Perc
ent
Control Baseline Email Information EmailError bars indicate 95% confidence intervals. Stars indicate a significant difference from the control group (at the .10, .05, and .01 levels) and daggers (†) indicate a significant difference between the two treatments.
Percent with Positive Payment: Firms without TPI

Figures: Email Experiment 2
0.060.06
0.01
***
***
0.00
0.02
0.04
0.06
0.08
Aver
age
Control Baseline Email Information EmailPayment amounts winsorized at the top 0.1% to reduce the influence of outliers.Error bars indicate 95% confidence intervals. Stars indicate a significant difference from the control group (at the .10, .05, and .01 levels) and daggers (†) indicate a significant difference between the two treatments.
Average Log Payment (Winsorized): Firms without TPI

Figures: Email Experiment 2
2,4061,977
188
**
01,
000
2,00
03,
000
4,00
0Av
erag
e
Control Baseline Email Information EmailError bars indicate 95% confidence intervals. Stars indicate a significant difference from the control group (at the .10, .05, and .01 levels) and daggers (†) indicate a significant difference between the two treatments.
Average Payment: Firms without TPI

Figures: Email Experiment 2
366
262
96
***
***
010
020
030
040
050
0Av
erag
e
Control Baseline Email Information EmailPayment amounts winsorized at the top 0.1% to reduce the influence of outliers.Error bars indicate 95% confidence intervals. Stars indicate a significant difference from the control group (at the .10, .05, and .01 levels) and daggers (†) indicate a significant difference between the two treatments.
Average Payment (Winsorized): Firms without TPI
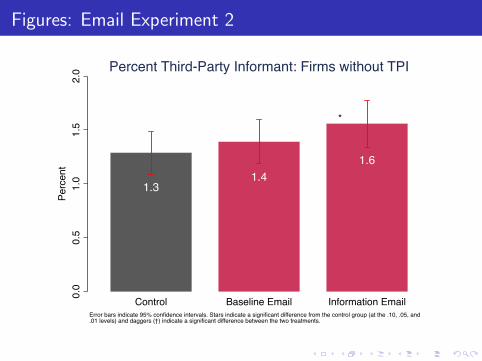
Figures: Email Experiment 2
1.31.4
1.6
*
0.0
0.5
1.0
1.5
2.0
Perc
ent
Control Baseline Email Information EmailError bars indicate 95% confidence intervals. Stars indicate a significant difference from the control group (at the .10, .05, and .01 levels) and daggers (†) indicate a significant difference between the two treatments.
Percent Third-Party Informant: Firms without TPI

Figures: Email Experiment 2
1.2
3.2 3.3
*** ***
01
23
4Pe
rcen
t
Control Baseline Email Information EmailError bars indicate 95% confidence intervals. Stars indicate a significant difference from the control group (at the .10, .05, and .01 levels) and daggers (†) indicate a significant difference between the two treatments.
Percent Deregistered: Firms without TPI

Figures: Pooled Email Experiments
2.0
5.4
1.7
8.8
0.0
2.0
4.0
6.0
8.0
Fact
or
-5 0 5 10 15Weeks
Firms with TPI:ControlT1 Email
Firms without TPI:ControlT2 Email
Factor Change in Percent Declared

Figures: Pooled Email Experiments
2.3
4.6
2.7
5.8
0.0
2.0
4.0
6.0
Fact
or
-5 0 5 10 15Weeks
Firms with TPI:ControlT1 Email
Firms without TPI:ControlT2 Email
Factor Change in Percent Positive declaration payment

Figures: Pooled Email Experiments
1.1
1.3
1.1
1.2
0.9
1.0
1.1
1.2
1.3
Fact
or
-5 0 5 10 15Weeks
Firms with TPI:ControlT1 Email
Firms without TPI:ControlT2 Email
Factor Change in Percent D-151 Informant
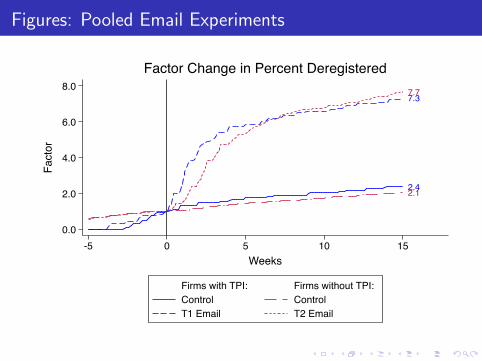
Figures: Pooled Email Experiments
2.4
7.3
2.1
7.7
0.0
2.0
4.0
6.0
8.0
Fact
or
-5 0 5 10 15Weeks
Firms with TPI:ControlT1 Email
Firms without TPI:ControlT2 Email
Factor Change in Percent Deregistered

Figures: SMS Experiment
3.6
6.6***†† 6.0***
0
2
4
6
8
Perc
ent
-10 -5 5 10 15Start date: 16 MarWeeks
Control Public Shaming SMS Information SMS
Percent Declared: SMS Experiment

Figures: SMS Experiment
0.41
0.54
0.44
0
.2
.4
.6
Perc
ent
-10 -5 5 10 15Start date: 16 MarWeeks
Control Public Shaming SMS Information SMS
Percent Positive declaration payment: SMS Experiment

Figures: SMS Experiment
2.9
3.1
3.3
2.4
2.6
2.8
3
3.2
Perc
ent
-10 -5 5 10 15Start date: 16 MarWeeks
Control Public Shaming SMS Information SMS
Percent D-151 Informant: SMS Experiment

Figures: SMS Experiment
1.0
1.7***††
1.4**
0
.5
1
1.5
2
Perc
ent
-10 -5 5 10 15Start date: 16 MarWeeks
Control Public Shaming SMS Information SMS
Percent Deregistered: SMS Experiment

Figures: SMS Experiment
3.6
6.66.0
******
†
02
46
8Pe
rcen
t
Control Public Shaming SMS Information SMSError bars indicate 95% confidence intervals. Stars indicate a significant difference from the control group (at the .10, .05, and .01 levels) and daggers (†) indicate a significant difference between the two treatments.
Percent Filed: SMS Experiment
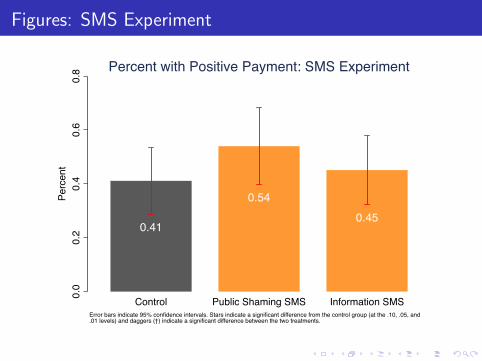
Figures: SMS Experiment
0.41
0.540.45
0.0
0.2
0.4
0.6
0.8
Perc
ent
Control Public Shaming SMS Information SMSError bars indicate 95% confidence intervals. Stars indicate a significant difference from the control group (at the .10, .05, and .01 levels) and daggers (†) indicate a significant difference between the two treatments.
Percent with Positive Payment: SMS Experiment

Figures: SMS Experiment
0.04
0.060.05
0.00
0.02
0.04
0.06
0.08
Aver
age
Control Public Shaming SMS Information SMSPayment amounts winsorized at the top 0.1% to reduce the influence of outliers.Error bars indicate 95% confidence intervals. Stars indicate a significant difference from the control group (at the .10, .05, and .01 levels) and daggers (†) indicate a significant difference between the two treatments.
Average Log Payment (Winsorized): SMS Experiment

Figures: SMS Experiment
1,057 1,044 688
050
01,
000
1,50
02,
000
Aver
age
Control Public Shaming SMS Information SMSError bars indicate 95% confidence intervals. Stars indicate a significant difference from the control group (at the .10, .05, and .01 levels) and daggers (†) indicate a significant difference between the two treatments.
Average Payment: SMS Experiment

Figures: SMS Experiment
340
473 469
020
040
060
0Av
erag
e
Control Public Shaming SMS Information SMSPayment amounts winsorized at the top 0.1% to reduce the influence of outliers.Error bars indicate 95% confidence intervals. Stars indicate a significant difference from the control group (at the .10, .05, and .01 levels) and daggers (†) indicate a significant difference between the two treatments.
Average Payment (Winsorized): SMS Experiment

Figures: SMS Experiment
1.0
1.7
1.4
***
**
††
0.0
0.5
1.0
1.5
2.0
Perc
ent
Control Public Shaming SMS Information SMSError bars indicate 95% confidence intervals. Stars indicate a significant difference from the control group (at the .10, .05, and .01 levels) and daggers (†) indicate a significant difference between the two treatments.
Percent Deregistered: SMS Experiment

Persistence of Effect One Year Later: Firms with TPI
35.1
41.4
***
5.2 6.1
**
20.322.1
**
010
2030
40Pe
rcen
t
Filed Positive Payment D-151 Informant
ControlEmail
Error bars indicate 95% confidence intervals. Stars indicate a significant difference from the control group (at the .10, .05, and .01 levels).
2015 Compliance: Firms with TPI

Persistence of Effect One Year Later: Firms without TPI
15.9
23.0
***
1.1 1.3* 4.0 4.6
***
05
1015
2025
Perc
ent
Filed Positive Payment D-151 Informant
ControlEmail
Error bars indicate 95% confidence intervals. Stars indicate a significant difference from the control group (at the .10, .05, and .01 levels).
2015 Compliance: Firms without TPI

Self-Reported vs Third-Party Reported Sales
010
020
030
040
050
0D
ecla
red
Sale
s (m
illion
CR
C)
0 100 200 300 400 500Third-Party Reported Sales (million CRC)
45º line Treatment Control

Self-Reported Costs vs Self-Reported Sales
010
020
030
040
050
0D
ecla
red
Cos
ts (m
illion
CR
C)
0 100 200 300 400 500Declared Sales (million CRC)
45º line Treatment Control

Profits (Conditional)
9.0 8.5 8.4
18.014.4
11.9
73.0
77.179.8
****
****
†††
††0
2040
6080
Perc
ent
Profit < 0 Profit ≈ 0 Profit > 0
Control Baseline Email TPI Email
Error bars indicate 95% confidence intervals. Stars indicate a significant difference from the control group (at the .10, .05, and .01 levels) and daggers (†) indicate a significant difference between the two treatments.
Profit (Sales - Costs) (If Filed)