cash flows and operating loss in a parastatal a …
TRANSCRIPT

CASH FLOWS AND OPERATING LOSS IN A PARASTATAL
– A STUDY OF AIR NAMIBIA FOR THE PERIOD
FROM 01 APRIL 2006 TO 31 MARCH 2011
A THESIS SUBMITTED IN PARTIAL FULFILMENT
OF THE REQUIREMENTS FOR THE DEGREE OF
MASTER OF SCIENCE IN ACCOUNTING AND FINANCE
OF
THE UNIVERSITY OF NAMIBIA
BY
JEREMIA TILENI HISHITONGO
STUDENT NUMBER 200106635
NOVEMBER 2013
SUPERVISOR: PROF. K. R. SHARMA

i
ABSTRACT
The purpose of this study was to study the cash flows and operating loss in a parastatal –
Air Namibia (Pty) Ltd for the period 01 April 2006 to 31 March 2011. This problem was
chosen by the researcher to investigate the root causes of operational loss and cash flow
problem faced by the parastatal.
The study revealed that the Air Namibia (Pty) Ltd had been incurring losses for all
financial years starting from 01 April 2006 to 31 March 2011. The airline’s direct
operating expenses exceeded the sales revenues prohibiting the airline to breakeven. The
airline needed funds to finance its operations and to be able to remain afloat. If it was
not the government bailout, the national airline would have been closed and liquidated.
The airline experienced going concern problem, because its liabilities exceeded the
assets.
Air Namibia (Pty) Ltd was the worst performing airline and was the only airline that
made operational losses throughout the study period. Air Namibia (Pty) Ltd is 100 per
cent owned by the government, contrasting Kenya Airways, for example, which is
privately owned. The operational decisions taken by Kenya Airways are more of profit
oriented, while the ones for Air Namibia (Pty) Ltd are more of social oriented and

ii
politically influenced. Kenya Airways only flies to routes which are profitable and
eliminated those routes which were not profitable, while Air Namibia (Pty) Ltd would
fly routes depending on the social needs irrespective whether it is profitable or not.
The researcher concluded that if the management and the shareholder, which is the
government, do not come up with a strategic plan that will turn around the airline
operations in order to move from loss making to profitable one, the airline might
continue to struggle and incur huge losses and require government bailouts in
foreseeable future.

iii
TABLE OF CONTENTS
HEADINGS PAGE
Abstract………………………………………..................................................... i-ii
Table of contents………...……………………………….................................... iii-viii
List of Tables......................................................................................................... ix-xi
List of figures........................................................................................................ xii
Acknowledgements………………………………………… ............................... xiii
Dedication ……………………………………………….................................... xiv
Declaration..……………………………………………….................................. xv
CHAPTER ONE…………………………………………................................. 1-21
1.1 Background……………........................................................................... 1-16
1.2 Statement of the Problem…………………………................................... 16-18
1.3 Objectives of the Study……………………………................................. 18
1.4 Hypotheses of the study……………………………................................ 18
1.5 Significance of the study...……………………….................................... 18-20
1.6 Limitations of the study……………………………................................. 20
1.7 Conclusion................................................................................................. 21
CHAPTER TWO ...................................………............................................ 22-64
2.1 Introduction...…………………………………........................................ 22
2.2 Literature Review...................................................................................... 22-61

iv
a) Role and functions of parastatals............................................................... 24-29
b) Parastatals in aviation................................................................................ 30-32
c) Air Namibia (Pty) Ltd an aviation parastatal............................................ 32-36
d) Corporate governance in parastatals.......................................................... 36-38
e) Performance of parastatals......................................................................... 38-39
f) Privatisation of parastatals......................................................................... 39-43
g) Factors impacting performance of airlines................................................. 43-55
h) Factors impacting performance of Air Namibia (Pty) Ltd........................ 55-56
i) Airlines bailout.......................................................................................... 56-57
j) Profitability of airlines............................................................................... 57-60
k) Cash flows of airlines................................................................................. 60-61
2.3 Gap in existing research............................................................................. 61
2.4 Conclusion................................................................................................. 62-64
CHAPTER THREE RESEARCH METHODOLOGY.................................. 65-78
3.1 Introduction.................…………………………..................................... 65-67
3.2 Research Design……………………………………............................... 67-70
3.3 Population .......................……………………......................................... 70-71
3.4 Sample...................................................................................................... 71-73
3.5 Research instruments………………………………................................ 73
3.6 Procedure.................................................................................................. 74
3.7 Data analysis and Interpretation............................................................... 74-75
v
3.8 Validity and Reliability............................................................................. 75-76
3.9 Research Ethics......................................................................................... 76-77
3.10 Conclusion................................................................................................ 78
CHAPTER FOUR ANALYSIS AND DISCUSSION......................... 79-181
4.1 Introduction............................................................................................... 79-82
4.2 Data Analysis.............………………………............................................ 82-83
4.3 Ratio Analysis............................................................................................. 83-84
4.4 Profitability Analysis………………………….......................................... 84-119
4.4.1 Earnings before Interest, Tax, Depreciation and Amortization...... 85-87
4.4.2 Earnings before Interest and Tax.................................................... 87-89
4.4.3 Earnings before Tax..........................……...................................... 89-90
4.4.4 Earnings after Tax........................................................................... 91-92
4.4.5 Other Comprehensive Income......................................................... 92-94
4.4.6 Gross Profit (Loss) Margin.............................................................. 95-96
4.4.7 Operating Profit Margin.................................................................. 97-98
4.4.8 Return to Total Assets.................................................................... 98-100
4.4.9 Other Comprehensive Income to Earnings before Interest & Tax 100-101
4.4.10 Income from Investments to Investments...................................... 101-103
4.4.11 Net Profit (Loss) Margin................................................................ 103-105
4.4.12 DuPont Model.......................................................................... ..... 106-112

vi
4.4.13 Internal Benchmark Analysis of Income Statement Items of
Air Namibia (Pty) Ltd................................................................ 113-116
4.4.14 External Benchmark Analysis..................................................... 116-119
4.5 Relating Profitability with Efficiency.................................................... 119-135
4.5.1 Total Assets Turnover................................................................. 119-121
4.5.2 Inventory Turnover..................................................................... 121-122
4.5.3 Receivables Turnover.................................................................. 123-125
4.5.4 Payables Turnover...................................................................... 125-127
4.5.5 Earnings per Passenger Travelled.............................................. 128-129
4.5.6 Earnings per Kilometer Travelled............................................... 129-130
4.5.7 Earnings per Passenger per Kilometer Travelled........................ 131
4.5.8 Average Passengers Travelled to Capacity................................. 132-135
4.6 Relating Cost Factors with Profitability.................................................. 135-148
4.6.1 Operating Ratio........................................................................... 135-136
4.6.2 Interest to Earnings Ratio............................................................ 136-138
4.6.3 Tax to Earnings Ratio................................................................. 138-139
4.6.4 Ground Staff Costs to Operating Cost Ratio............................... 139-140
4.6.5 Flight Staff Costs to Operating Cost Ratio................................. 140-141
4.6.6 Petroleum Costs to Operating Cost Ratio................................... 141-142
4.6.7 Maintenance Costs to Operating Cost Ratio.............................. 142-143
4.6.8 Fleet Costs/ Lease Rent to Operating Cost Ratio..................... 144-145
4.6.9 Fleet Costs to Total Assets Ratio............................................... 145-148

vii
4.7 Decomposition Analysis of Revenues, Costs and Profitability............. 148-150
4.8 Trend Analysis....................................................................................... 150
4.9 Trend Analysis of Revenues, Costs and Profitability........................... 151-152
4.10 Forecasting Air Namibia (Pty) Ltd Financial Performance by 2015
and 2020................................................................................................. 152-154
4.11 Root Cause Analysis of Profitability...................................................... 155-156
4.12 Overall Discussion and Findings on Profitability.................................. 157
4.13 Cash Flows Analysis............................................................................... 157-169
4.13.1 Liquidity Analysis....................................................................... 165
4.13.2 Current Ratio.............................................................................. 165-167
4.13.3 Acid Test Ratio........................................................................... 167-168
4.13.4 Cash on Non Cash Current Assets Ratio...................................... 168-169
4.14 Analysis of Capital Structure................................................................. 169-181
4.14.1 Debt-to-Equity Ratio................................................................ 170-171
4.14.2 Owners Funds to Total Debt Ratio.......................................... 171-172
4.14.3 Owners Funds to Total Assets................................................. 173-174
4.14.4 Total Debts to Total Assets Ratio............................................. 174-175
4.14.5 Long Term Debt to Short Term Debt...................................... 175-176
4.14.6 External Benchmark Analysis of Liquidity and Capital
Structure.................................................................................... 176-179
4.14.7 Root Cause Analysis of Cash Flows and Liquidity................... 179-180
4.18.8 Overall Discussion and Findings on Cash Flows...................... 180-181

viii
4.15 Conclusion................................................................................................ 181
CHAPTER FIVE FINDINGS, RECOMMENDATIONS
AND CONCLUSION……………............................... 182-195
5.1 Introduction…………………………………….…............................... 182
5.2 Findings…………………………………………….............................. 182-187
a) Profitability............................................................................................. 182-184
b) Efficiency.............................................................................................. 184-186
c) Liquidity and Cash Flows..................................................................... 186-187
d) Capital Structure................................................................................... 187
5.3 Recommendations…………………………………............................. 187-194
a) Operations............................................................................................. 188-189
b) Costs...................................................................................................... 189-191
c) Marketing and Promotion..................................................................... 191-192
d) Human Resources.................................................................................. 192-193
e) Strategic Planning.................................................................................. 193-194
5.4 Conclusion………………………………………….............................. 194-195
REFERENCES…………………………………………................................ 196-205
Annexure I: Abridged Financial Statements of Airlines................................... 206-213
Annexure II: Cash flow Statements of Airlines................................................. 214-221

ix
LIST OF TABLES PAGE
4.1 Earnings before Interest, Tax, Depreciation and Amortization of
selected Airlines………………………………………………….…. 86
4.2 Earnings before Interest and Tax of selected Airlines......................... 88
4.3 Earnings before Tax of selected Airlines............................................ 90
4.4 Earnings after Tax of selected Airlines................................................ 91
4.5 Other Comprehensive Income of selected Airlines........................... 92-94
4.6 Gross Profit Margin of selected Airlines............................................. 95-96
4.7 Operating Profit Margin of selected Airlines..................................... 97-98
4.8 Returns to Total Assets of selected Airlines........................................ 99
4.9 Other Comprehensive Income to Earnings before Interest and
Tax of selected Airline........................................................................ 101
4.10 Income from Investments to Investments of selected Airlines............ 102
4.11 Net Profit (Loss) Margin of selected Airlines...................................... 104-105
4.12 DuPont Ratios of selected Airlines...................................................... 107-109
4.13 Internal Benchmark Analysis of Air Namibia (Pty) Ltd ...................... 113
4.14 External Benchmarking of Analysis of Profitability of Namibia (Pty) Ltd. 117
4.15 Total Assets Turnover of selected Airlines........................................... 120
4.16 Inventory Turnover of selected Airlines............................................... 121-122
4.17 Receivables Turnover of selected Airlines........................................... 124
4.18 Payables Turnover of selected Airlines................................................ 126-127
4.19 Earnings per Passenger Travelled of selected Airlines......................... 128

x
4.20 Earnings per Kilometer Travelled of selected Airlines....................... 130
4.21 Earnings per Passenger per Kilometer Travelled of selected Airlines. 131
4.22 Average Passenger Travelled to Capacity of selected Airlines.......... 132
4.23 External Benchmark Analysis of Efficiency of Air Namibia (Pty) Ltd.. 133
4.24 Operating Ratios of selected Airlines................................................... 136
4.25 Interest to Earnings Ratio of selected Airlines..................................... 137
4.26 Tax to Earnings Ratios of selected Airlines........................................... 138
4.27 Ground Staff Costs to Operating Cost Ratios of selected Airlines......... 139
4.28 Flight Staff Costs to Operating Cost Ratios of selected Airlines........... 140
4.29 Petroleum Costs to Operating Cost Rations of selected Airlines............ 141
4.30 Maintenance Costs to Operating Cost Ratios of selected Airlines.......... 143
4.31 Fleet Costs to Operating Cost Ratios of selected Airlines....................... 144
4.32 Fleet Costs to Total Assets Ratios of selected Airlines............................ 145
4.33 Analysis of Operating Costs of Air Namibia (Pty) Ltd.......................... 146
4.34 External Benchmark Analysis of Operating Costs of selected Airlines... 147
4.35 Decomposition Analysis of Revenues, Costs and Profitability of
Air Namibia (Pty) Ltd............................................................................ 149
4.36 Trend Analysis of Revenues, Costs and Profitability of
Air Namibia (Pty) Ltd............................................................................. 151
4.37 Forecasting of Air Namibia (Pty) Ltd Performance by 2015 and 2020... 153
4.38 Cash Flows Analysis of Air Namibia (Pty) Ltd...................................... 160
4.39 Cash Flows Analysis of Kenya Airways.................................................. 161

xi
4.40 Cash Flows Analysis of British Airways................................................. 162
4.41 Cash Flows Analysis of Fly Emirates...................................................... 163
4.42 Cash Flows Analysis US Airways.......................................................... 164
4.43 Current Ratios of selected Airlines......................................................... 166
4.44 Quick Rations of selected Airlines.......................................................... 168
4.45 Cash to Non Cash Current Ratios of selected Airlines............................ 169
4.46 Debt to Equity Ratios of selected Airlines............................................... 171
4.47 Owners Funds to Total Debt Ratios of selected Airlines.......................... 172
4.48 Owners Funds to Total Assets of selected Airlines................................... 173
4.49 Total Debt to Total Assets Ratios of selected Airlines.............................. 174
4.50 Long Term Debt to Short Term Debt Ratios of selected Airlines............. 171
4.51 External Benchmark Analysis of Liquidity and Capital Structure of
Air Namibia (Pty) Ltd……………………………………………............ 177

xii
LIST OF FIGURES PAGE
Figure 1 DuPont/ Components of Returns on Equity of
Air Namibia (Pty) Ltd............................................................. 112
Figure 2 Internal Benchmark Analysis of Air Namibia (Pty) Ltd........... 115
Figure 3 External Benchmark Analysis of Profitability of
Air Namibia (Pty) Ltd............................................................... 118
Figure 4 External Benchmark Analysis of Air Namibia (Pty) Ltd
Efficiency................................................................................ 134
Figure 5 Analysis of Operating Costs of Air Namibia (Pty) Ltd........... 146
Figure 6 External Benchmark Analysis of Operating Costs of
Air Namibia (Pty) Ltd............................................................... 147
Figure 7 Root Cause Analysis of Profitability of
Air Namibia (Pty) Ltd.............................................................. 156
Figure 8 External Benchmark Analysis of Liquidity and Capital
Structure of Air Namibia (Pty) Ltd......................................... 178
Figure 9 Root Cause Analysis of Cash Flows and Liquidity of
Air Namibia (Pty) Ltd............................................................. 180

xiii
ACKNOWLEDGEMENTS
I praise God the almighty for always being there for me, when I need him and for his
mercy and grace throughout the year. I am indebted and owe my gratitude and
appreciation for those that have been encouraging me to work hard especially on this
thesis. I am thankful to all the people who told me to be patient, hard working, honest
and trustworthy in life. All those efforts have made me what I am today.
My sincere admiration and appreciation goes to the management of Air Namibia (Pty)
Ltd, Kenya Airways, British Airways, Fly Emirates and US Airways for making their
annual financial statements available to me and making this research possible.
I would like to express my sincere gratitude to my supervisor Prof. K. R. Sharma for the
continuous support during my thesis study and research, for his patience, motivation,
enthusiasm, and immense knowledge. His guidance helped me at all time in research and
writing of this thesis.
The useful assistance and support of Mrs. Marilyn Nel and Mr. Erich !Gaoseb in writing
this thesis is deeply appreciated.

xiv
DEDICATION
I dedicate this entire thesis wholeheartedly to my parents, Mr. Ndeshimwene Hishitongo
and my late mother Mrs Veronica Hishitongo, for their continued support throughout my
studies. They have been supporting me from the onset. This thesis is also dedicated to
my wife Mrs. Letta Hishitongo and my son Mr. Ian Shetu Hishitongo for their
unwavered support in the course of my study for Master of Science in Accounting and
Finance.
Above all, I am deeply indebted to the Almighty God.

xv
DECLARATION
I, Jeremia Tileni Hishitongo, declare hereby that this study is a true reflection of my own
research, and that this work, or part thereof has not been submitted for a degree in any
other institution of higher education.
No part of this thesis may be reproduced, stored in any retrieval system, or transmitted in
any form, or by means (e.g. electronic, mechanical, photocopying, recording or
otherwise) without the prior permission of the author, or The University of Namibia in
that behalf.
I, Jeremia Tileni Hishitongo, grant The University of Namibia the right to reproduce this
thesis in whole or in part, in any manner or format, which the University of Namibia
may deem fit, for any person or institution requiring it for study and research; providing
that The University of Namibia waive this right if the whole thesis has been or is being
published in a manner satisfactory to the University.
....................................................... ........................................
Jeremia Tileni Hishitongo

1
CHAPTER 1
1. Introduction
1.1 Background
A parastatal, a state-owned enterprise, is a legal entity created by a government to
undertake commercial activities on behalf of government (Kowalski, Max, Monika and
Matias, 2003). Air Namibia (Pty) Ltd is one of the state-owned enterprises established
by the Government of the Republic of Namibia. All the shares of Air Namibia (Pty) Ltd
are owned by Government of Namibia. Air Namibia is a company incorporated in terms
of the Companies Act of Namibia as a Proprietary (Pty) Limited Company with
Government of the Republic of Namibia as sole shareholder. The shareholding Ministry
is the Minister of Works and Transport. Its business operations primarily involve
provision of air transport services to passengers and cargo.
Air Namibia (Pty) Ltd has a history of growth through mergers and acquisitions. The
South West Air Transport was formed in 1946 and after a year it became South West
Airways. In 1959 through amalgamation between ‘‘South West Air Transport’’ and
‘‘Oryx Aviation’’ it became ‘‘Suidwes Lugdiens’’. In 1966 ‘‘Namib Air’’ of Walvis
Bay became subsidiary of ‘‘Suidwes Lugdiens’’ and in 1978 ‘‘Suidwes Lugdiens’’
became “Namib Air”. In 1982 South West Africa/ Namibia acquired the majority
shareholding in Namib Air. In October 1991 following Namibia’s independence, Namib

2
Air was renamed Air Namibia. A twice weekly schedule between Frankfurt and
Windhoek was launched and initially a Boeing B747SP was used on the route.
Through its subsidiary, Ground Handling (Pty) Ltd, Air Namibia (Pty) Ltd provides
ground handling services for passengers and aircraft at Windhoek’s Hosea Kutako
International Airport. Air Namibia handles all business operations at Hosea Kutako
International Airport through Ground Handling (Pty) Ltd as a subsidiary of Air Namibia.
The operations of Ground Handling (Pty) Ltd such as the revenue and administration
expenses are consolidated on the financial statements of Air Namibia (Pty) Ltd every
financial year.
The mandate of Air Namibia (Pty) Ltd’s was determined by its shareholder, the
Government of the Republic of Namibia, previously represented by the Ministry of
Finance and now by the Ministry of Works and Transport. The national airline is
member of International Air Transport Association (IATA) and accredited to safely
carry passengers and cargo internationally. The company operates air services between
Namibia and destinations in Europe (Frankfurt), Africa (Accra, Johannesburg, Cape
Town, Lusaka, Victoria Falls and Luanda), as well as major towns within Namibia.
3
The airline mandate is to be a major contributor towards the attraction and promotion of
tourism, as well as promotion and facilitation of trade to Namibia by providing air
transport, cargo, Charter and freight services between Namibia and other countries, as
well as by operating flights within the boundaries of Namibia. Air Namibia made a
positive net economic (value) contribution to the national economy, in line with its
mandate. The value added is measured in terms of contribution to GDP and
employment, and comes in the form of visitor expenditure as well as jobs created in
resorts and facilities frequented by these visitors. The airline aimed to be a safe, reliable
and profitable airline by providing excellent air transport services, helping tourism to
thrive, and encouraging business investments in Namibia. The Travel and Satellite
Account (TSA) prepared for the World Travel and Tourism Council (WTTC) shows that
in 2005, the Namibian Tourism sector, in which Air Namibia is one of the major players,
contributed an estimated N$9 billion to the national economy. According to the same
report, the value added to the Namibian National economy directly from traffic carried
by Air Namibia during the same period was N$ 903 million (2005). With a 15% increase
per year, the amount is estimated to be around N$ 1.2 billion (2007), while the amount
of money allocated to the airline through budgetary allocations of the Government was
only N$150 million in 2005 financial year (Turner, 2006).
All the airports in Namibia are under the supervision of the Namibia Airports Company
(NAC), a State Owned Enterprise (SOE) that was established in line with the Airports

4
Company Act, Act 25 of 1998. It commenced operations in February 1999. The main
objectives are to ensure that the following operations run efficiently: The arrival, surface
movement, parking or departure of aircraft; the servicing of aircraft, including the
supply of fuel and lubricants; ground handling of aircraft, passengers, baggage and
cargo; providing passengers safety while in the airport’s facilities (Kangueehi, 2007).
Namibia Airports Company is a separate entity from Air Namibia (Pty) Ltd. The
company charges airports tax, which is levied to Air Namibia (Pty) Ltd and the national
airline, passes on the tax burden to consumer through tickets sales. Namibia Airports
Company charges landing fees and parking fees on every aircraft that is landing and
parked at all the airports. Air Namibia (Pty) Ltd is paying over the passenger taxes
collected through tickets sales and for the landing and parking fees for Air Namibia
(Pty) Ltd aircraft on monthly basis.
Before independence of Namibia on 21 March 1990, Namib Air was a department in
TransNamib, which is a fellow state owned enterprise that was mandated to transport
passengers and cargo by rail and air transport. Namib Air was making operational losses,
when it was under the care of TransNamib. The continued loss making necessitated the
separation of Namib Air from TransNamib to be a separate parastatal and Namib Air
later became Air Namibia (Pty) Ltd. Since the time of TransNamib, the national airline

5
had been performing poorly and it could not sustain itself. Hence, it needed the
government to step in with cash injections in order to keep the airline operating.
Current status of the national airline as at 01 June 2013 is that, in line with its vision
statement of being a safe, reliable, efficient and caring airline, Air Namibia operates its
fleet carefully on selected routes to meet expectations of its stakeholders. These
expectations include performance dependability and comfort. All aircraft in the fleet are
all cabin pressurized, provide immense comfort offered by the generous legroom,
modern interiors and trend setting features. These aircraft are subjected to high levels of
safety ensured through the meticulous maintenance programmes, and highly trained
flight deck and cabin crews. The fleet comprises of; 2 x Airbus A340-300 aircraft, 4 x
Airbus A319-100 aircraft and 4 x Embraer ERJ 135.
The national airline employed 584 personnel as at 01 June 2013, of which 341 are the
flight staff while 243 are the ground staff. The majority of the ground staff is working at
Air Namibia (Pty) Ltd head office in Windhoek, Hosea Kutako International Airport and
Eros Airport, and the rest at different airports country wide. The flight routes operated
by Air Namibia (Pty) Ltd cover Southern Africa, Africa, and Europe besides Namibia.
6
Southern Africa: Air Namibia (Pty) Ltd coverage of Southern African cities is
comprehensive, with direct Air Namibia flights operated between Windhoek and Walvis
Bay, Lusaka, Maun, Victoria Falls, Cape Town, Johannesburg and Luanda; with a clear
sight of expanding their route network to include other Southern African destinations in
the next 12 months (Masule, 2013). Flights between Windhoek and Luanda offer
convenient connecting time and competitive fare via Windhoek and Cape Town,
Johannesburg and Frankfurt. This provides Luanda passengers optimum travel ease
connecting to Johannesburg, Cape Town, as well as to Frankfurt via Windhoek.
Africa: Air Namibia affords its clients access and travel solutions, through partner
airlines, to more African destinations from Windhoek via Johannesburg to Nairobi,
Harare, Mauritius, Lilongwe, George, Port Elizabeth and Durban. Air Namibia (Pty) Ltd
clients from Southern Africa going via Accra get convenient and seem, less connections
to Lagos and Abidjan.
Europe: The flagship route into Europe, on flights between Windhoek and Frankfurt,
enables passengers from Namibia to go further than Frankfurt into the rest of Europe.
Flights beyond Frankfurt are operated by partner airlines offering clients convenient
connecting times to key cities such as London, Paris, Rome, Milan, Lisbon, Helsinki,
Stockholm, Gothenburg, Kiev, Innsbruck Oslo, Warsaw, Moscow, Baltic, Prague, and
Budapest.

7
Europe - Added Services: Flights from Europe into Windhoek also offer a number of
magnificent connections via Windhoek to Walvis Bay, Maun, Victoria Falls, Cape
Town, Johannesburg and Luanda.
Safety is the airline’s cornerstone and at the centre of everything they do, making sure
they comply with all countries regulatory and environmental requirements and laws. Air
Namibia (Pty) Ltd is committed by providing all their stakeholders and passengers, the
highest level of safety and comfort. The entire fleet is serviced by some of the most
advanced technical teams in the industry, with a safety record second to none. Air
Namibia (Pty) Ltd was awarded the ‘‘Feather Awards’’ for Best Regional Airline by the
Airports Company of South Africa, during six years in the last 8 years, for airlines
operating into either Johannesburg and / or Cape Town.
Air Namibia (Pty) Ltd faced the challenge of attracting enough passengers to book their
flights to maximum capacity, therefore is only able to book few seats and fly half to
capacity. The airline is also challenged by the unavailability of qualified local pilots, the
increasing price of jet fuel and weakening of Namibian Dollar against foreign
currencies.

8
Current financial and operational status of Air Namibia (Pty) Ltd
Air Namibia has been making losses since its inception. But under a new government
funded five-year turnaround strategy, the carrier is slowly moving towards financial
sustainability through investment in new aircraft and improved revenue management
systems. Air Namibia has a long history of government assistance to remain operational.
A previous turnaround attempt used nearly N$2 billion in government bailout funds
between 2003 and 2009. The current plan, which was announced in 2011, is expected to
see the carrier breakeven by 2016 at an expected cost of N$1,6 billion to the taxpayer
(Masule, 2013).
The carrier also signed its one and only code share agreement with Kenya Airways in
July 2013, covering services between Lusaka and Johannesburg and Windhoek and
Nairobi. The partnership provides valuable access to the important East African hub of
Nairobi, while also extending Kenya Airways' presence in southern Africa through its
strategy of working with smaller African carriers. Air Namibia operates a network of 17
destinations including Frankfurt. It operates a network largely focused on Southern
Africa including eight domestic destinations and a similar number of regional points
from the nation's capital, Windhoek, located in the centre of the county. In addition, Air
Namibia maintains its links with former colonial ruler, Germany, through a daily service
to Frankfurt as its only intercontinental route. The carrier deploys the bulk of its capacity
by seats to South Africa, which it serves with 6 048 seats per week, split evenly between
Johannesburg and Cape Town. Those routes are also Air Namibia's largest regional

9
routes. Germany accounts for a further 1 946 seats per week, while Angola to the north
is served with 1 512 seats per week.
Windhoek Hosea Kutako International Airport handles an estimated 650 000 passengers
per year. In the three months to March 2013, the airport handled a total of 166 329
passengers, according to Namibia Airport Company (NAC) figures. South African
Airways (SAA) dominates three foreign airlines that service Windhoek. SAA is the
largest of three foreign carriers operating from Hosea Kutako with 7 034 seats per week.
Air Namibia has a monopoly on all but four of its 17 routes from Windhoek with the
exceptions being Johannesburg, Cape Town, Luanda and Lusaka-Harare. As part of its
five-year turnaround plan, Air Namibia completed a rationalisation of its schedule in
March 2013 to bring capacity into line with demand across its network. The carrier also
received a further equity injection from the government late last year in the form of two
new A319-100 aircraft, configured with 112 seats in two classes, which have been
deployed on regional routes. The aircraft replaced the older Boeing 737-500. But the
government's patience with funding Air Namibia appears to be wearing thin. In February
2013, Finance Minister Saara Kuugongelwa-Amadhila expressed concern at Air
Namibia's ongoing need for financial support from taxpayers by mentioning. “I must
emphasise that the perpetual lifeline extended to Air Namibia is a cause of national
concern’’ (Kuugongelwa-Amadhila, 2013).

10
British Airways' services are operated to Johannesburg by franchisee, privately owned
South African carrier, Comair. Air Namibia has increased capacity between Windhoek
and Luanda by 37% since October 2012 and operates the daily service offering 756 one-
way seats per week using an Airbus A319. Air Namibia has been criticised by business
passengers for increasing fares between Eros Airport and Ondangwa (Masule, 2013).
But the carrier claimed fares had been kept artificially low since 2010 in order to
stimulate demand and “develop a culture of flying in Namibia” after the Beechcraft
B1900Ds were replaced with Embraer ERJ-135 regional jets. The 37-seat ERJ 135s
almost doubled capacity on the route (Masule, 2013).
The positive qualitative factors of operating a national airline
There are good reasons that the Government of the Republic of Namibia sees it
necessary to maintain the airline operating despite continues bailout, accumulated deficit
and the public outcry to liquidate the airline or privatise it. Air Namibia (Pty) Ltd has
been making huge losses since the airline name change from Namib Air in 1990. From
that time Air Namibia (Pty) Ltd had not made any profit and was not able to generate
revenue to sustain itself but relied only on Government bailout. The Government is
aware that the financial operation of the Air Namibia (Pty) Ltd is not stable when
comparing with other parastatals. Some people wonder why the government does not
want to get rid of the airline since it is a burden to maintain it operationally. The
government’s focus is based on economic growth, increasing spendings to reduce
unemployment and maintaining other economic factors such as stable inflation rate.

11
Air Namibia (Pty) Ltd is a major indirect contributor to national economic prosperity.
The airline provides the only rapid air transportation network, which makes it essential
for global business and tourism. It plays a vital role in facilitating economic growth
particularly in a developing country like Namibia. There are benefits that are accruing to
stakeholders including the government, for the country to have its national airline, and
these benefits overweight the cost of maintaining Air Namibia (Pty) Ltd, even though it
is running into huge losses. Therefore, for Namibia to have its own national airline to
fulfil the government objective of increased economic growth is one of the reasons why
Air Namibia (Pty) Ltd is still operating and is likely to operate in future. Thus the
rationale for Air Namibia (Pty) Ltd to operate in spite of losses is:
1. The airline facilitates the delivery of emergency and humanitarian aid relief
anywhere in the country and the swift delivery of medical supplies and organs
for transplantation.
2. Air Namibia (Pty) Ltd facilitates world trade, helping local producers to
participate in the global economy by increasing access international market to
and allowing globalisation of production.
3. Air Namibia (Pty) Ltd is indispensable for tourism industry, which is a major
engine of economic growth particularly in Namibia.
4. Air Namibia (Pty) Ltd operation is vital to the economy, because it helps to
increase globalisation of economy, international investment, and connecting
people across continents.

12
5. Air Namibia (Pty) Ltd helps local business to improve productivity, by
encouraging investment and innovation; improving business operations and
efficiency; and allowing companies to attract high quality employees.
6. Air Namibia (Pty) Ltd contributes to sustainable development, by facilitating
tourism trade. It generates economic growth, provides jobs, improves living
standards, alleviates poverty, and fosters the conservation of protected areas.
7. The airline provides means of transportation to/from remote areas and promotes
social inclusion by connecting those living in such communities with the rest of
the world.
8. Air Namibia (Pty) Ltd improves quality of life by broadening people’s leisure
and cultural experiences. It provides a wider choice of holiday destinations
around the world and an affordable means to visit distant friends and relatives.
9. The airline is a major direct generator of employment and economic activity, in
airline and airport operations, aircraft maintenance, air traffic control and
management and activities directly serving air passengers, such as check-in,
baggage-handling, on-site retail and catering facilities. All these activities
contribute to reduction in unemployment and stimulate economic growth.
10. The Air Namibia (Pty) Ltd’s stakeholders also provide employment. The
activities of supplier to the air transport industry such as aviation fuel suppliers,
construction companies that build airport facilities, supplier of sub-components
used in aircraft, manufacturers of goods sold in airport retail outlets, and a wide
variety of activities in the business services sector such as call centres,

13
information technology, and accountancy. The spending on activities of supplier
in the economy supports jobs in those industries.
11. Despite, the huge losses the airline is still operating, because it brings foreign
tourist into Namibia. When foreign visitors come to Namibia, they bring foreign
currency in Namibia, which is good for the foreign exchange market. The
visitors boost the spending in local market, which increases demand for local
goods and currency. Their spending in local economy helps create demand that
leads to extra jobs and reduces unemployment. The visitors bring in foreign
currency into Namibia in exchange for local currency and the foreign currency is
used to pay for the country imports, which are in foreign currency.
12. Air Namibia (Pty) Ltd helps the country to market the country in other countries
and the country’s products especially the wildlife. By helping attract more
investors and visitors to Namibia it helps the government to achieve its objective
of economic growth.
13. The airline carries Namibian within the country for holidays and also for
business purposes and around the country in more convenient and faster way.
Besides some other advantage of air transports that encourage use of Air Namibia (Pty)
Ltd are:
a) High Speed: Air transport is the fastest mode of transport and therefore suitable
carriage of goods over a long distance requiring less time. There is no substitute
for air transport when the transport of goods is required urgently.

14
b) Quick Service: Air transport provides comfortable, efficient and quick transport
service. It is regarded as best mode of transport for transporting perishable
goods.
c) No Infrastructure Investment: Air transport does not give emphasis on
construction of tracks like railways as no capital investment in surface track is
needed; it is a less costly mode of transport.
d) Easy Access: Air transport is regarded as the only means of transport in those
areas which are not easily accessible to other modes of transport. It is therefore
accessible to all areas regardless of the obstruction of land.
e) No Physical Barrier: Air transport is free from physical barriers because it
follows the shortest and direct routes where seas, mountains and forests do not
obstruct.
f) Natural Route: Aircraft travels to any place without any natural obstacles or
barriers. Because the custom formalities are complied with very quickly, it
avoids delay in obtaining clearance.
With all these benefits the government continues to bailout the airline since the
government economic objectives cannot be achieved without the benefits accruing to the
community. Thus the airline is not monitored on financial performance but by the
combination of financial, economic and social performance.

15
Negative factors of operating a national airline
Air transport is regarded as the costlier mode of transport, as the operating cost of
aeroplanes is higher and it involves a great deal of expenditure on the construction of
aerodromes and purchase of aircrafts. As a result the fare of air transport is so high that
it becomes beyond the reach the common people. In the context of Namibia some of the
negative factors of operating a national airline are:
1. Namibians regard air transportation as high cost and expensive. The majority of
the citizens cannot fly on Air Namibia (Pty) Ltd since they are unable to afford
the ticket prices, limiting the number of passengers flying on Air Namibia (Pty)
Ltd.
2. Operating an aircraft in the air space contributes to pollution and global
warming, which has negative effect on environment. The noise pollution can also
be heard on the ground when an aircraft is flying in the air space.
3. Air transport is a risky form of transport as even a minor accident may result in
substantial loss of goods, passengers and the crew. The chances of accidents are
greater in comparison to other modes of transport.
4. The aircrafts have small carrying capacity and therefore, these are not suitable
for carrying bulky and cheaper goods. The load capacity cannot be increased as it
is possible in case of rail transport. Air transport requires huge investment for
construction and maintenance of aerodromes. It also requires trained,
experienced and skilled personnel which involves a substantial investment.

16
5. The air transport is uncertain and unreliable because this is controlled by weather
conditions. It is seriously affected by adverse weather conditions, fog, snow and
heavy rain. Weather may cause cancellation of some flights.
6. Air transport requires huge investment for construction and maintenance of
aerodromes. It requires trained, experienced and skilled personnel which
involves substantial investment.
In view of the limitations of air transportation national airlines are politically run and not
run as independent entities. Every project the airline wants to engage into needs to go
through the Ministry of Finance and the Ministry of Works and Transport for approval.
A national airline is not independent to decide incentives for opening and closing of
routes and the responsible ministry has always to be consulted.
1.2 Statement of the problem
Air Namibia (Pty) Ltd has not performed according to the expectations of the
Government and the general public. Every year the parastatal has been receiving funds
from government in order to keep it afloat. The parastatal is reported to have
continuously received Government bailout, which amounts to N$ 1,1158 Billion
(2007:153 Million, 2008:536,8 Million, 2009:150 Million, 2010:156 Million, and 2011:
120 Million). The Government may continue to pump in Millions of dollars to Air
Namibia (Pty) Ltd in order to sustain its operations. This research on the operations of

17
Air Namibia (Pty) Ltd was done to establish why the organisation is not able to generate
sufficient profits and cash flows in order to finance its operations. The organization has
been making losses for the past several years (2007:233.4 Million, 2008:154.5 Million,
2009:478.9 Million, 2010:247 Million and 2011:405.5 Million). The purpose of the
research was to determine the causes of operational expenditure exceeding operational
income, and the cash inflows falling short of cash outflows, at times creating liquidity
problems.
Stakeholders are concerned on the performance of Air Namibia (Pty) Ltd. It is worrying
that the airline is using tax payers’ money to finance its daily operating costs. In the
view of the stakeholders, the parastatal is under performing, which is resulting in
operating losses and cash flow problems. The research focuses on cash flows and
operating loss of Air Namibia (Pty) Ltd. This organisation has been in media
consistently for Government bailouts. The stakeholders want the organisation to be
privatised in order to lessen the dependency on Government bailouts and be able to
generate sufficient cash flows to sustain its operations.
The Air Namibia (Pty) Ltd stakeholders especially the tourism sector is interested to
know whether the Air Namibia (Pty) Ltd is a going concern. If Air Namibia (Pty) Ltd
stops operating all sectors will be negatively affected and the economy of Namibia shall
suffer. The privatization of the national airline will also negatively affect different sector

18
in the economy. This is a dilemma that the government and the stakeholders are faced
with.
1.3 Objectives of the study
1. To evaluate the financial performance of Air Namibia (Pty) Ltd over the years.
2. To determine the factors that causes cash flow problems and operating loss.
3. To assess the going concern of Air Namibia (Pty) Ltd over the years.
1.4 Hypotheses of the study
Air Namibia (Pty) Ltd has high operating costs in relation to revenues generated from
operations and the shortage requires Government to bailout the parastatal to meet its
operating costs’ requirement. Therefore, the airline will continue to make losses and will
continue to receive Government bailout for a foreseeable future.
1.5 Significance of the study
The study is significant to various stakeholders. It investigated the reasons for the lack of
profit making by Air Namibia (Pty) Ltd. The findings of the study provides guidance to
Air Namibia (Pty) Ltd management on specific cash flow activities such as operating
cash flows, investing cash flows and financing cash flows, which are failing the

19
parastatal and have unfavourable impact on the operations. The research recommend to
the management on efficient operations that might need to be considered and
implemented. The study provides assurance to the Government, airline customers,
suppliers, employees and the tourism industry on the continuing existence of Air
Namibia (Pty) Ltd, its operational efficiency and service quality. It also examines in
depth implications of the public and political statement that Air Namibia (Pty) Ltd
should be privatised.
The study provides information on the operations of Air Namibia (Pty) Ltd, the
challenges that the airlines is facing in providing services to passengers and cargo. It
also informs the stakeholders about the role Air Namibia is playing in the economy,
especially for transportation of passengers into and out of Namibia, on what impact it
had on the local business and local spending.
The research report provides reasons to the tax payers that the national airline is
mandated in terms of the act of the Parliament and the airline activities are partly
business and partly social by providing services to the passengers at a price even below
the cost. This is expected to create an understanding that Air Namibia (Pty) Ltd
contributes to the economic growth of Namibia, and the economic growth is likely to
descend, when Air Namibia (Pty) Ltd is out of operation; and the money that the

20
national airline had been receiving from the government as bailout is not being wasted
but put at right use to develop the country.
The research provides literature, information and guidelines to the fellow researchers on
the topic and is expected to clarify misunderstanding during and after the research.
1.6 Limitations of the study
This research mainly focuses on cash flows and operating losses in Air Namibia (Pty)
Ltd. The research examined the annual financial statements of Air Namibia (Pty) Ltd.
Errors and misstatement in the annual financial statements and non-disclosure of
important financial information in the annual financial statement may lead to biased and
misinformed conclusions of research findings. The researcher had a challenge due to
non-availability of latest annual financial statements; which contain latest information
and relate to present situation of the operations. The researcher relied largely on
evidence gathered from annual financial statements. The time allocated to the researcher
to conduct research was limited. This limited the scope of research to an extent.
1.7 Conclusion
The present study is about the profitability and cash flow problems faced by Air
Namibia (Pty) Ltd. The airline has been making loss year to year on since its

21
establishment. It faced cash flow problems in meeting its operational costs out of the
sales revenue and the government has to bail out the airline. It is a matter of concern for
its stakeholder and this research undertakes an in depth analysis of all aspects related
with this problem.

22
CHAPTER 2
Literature Review
2.1 Introduction
This chapter presents the reviews of literature on role and functions of parastatals,
parastatals in aviation, comparison of Air Namibia (Pty) Ltd with other airlines,
corporate governance, performance of parastatals, privatisation of parastatals and factors
impacting performance of airlines, factors impacting performance of Air Namibia (Pty)
Ltd, airline bailout, profitability of airlines and cash flows of airlines.
2.2 Literature review
Literature review is a written and systematic summary of the research which is
conducted on a particular topic. It summarizes the background and context of the
research. Literature review exercises to analyze the area of the research, which has been
resolved in the study. It is the outline of the research. It also shows the gap between the
researcher’s curiosity and knowledge of the subject area (Boswell & Cannon 2009). A
literature review is a text written by someone to consider the critical points of current
knowledge including substantive findings, as well as theoretical and methodological
contributions to a particular topic (Lawrence and Brick, 2008). Literature reviews are
secondary sources, and as such, do not report any new or original experimental work.
Also, a literature review can be interpreted as a review of abstract accomplishment.

23
Most literature reviews are associated with academic-oriented literature, such as a thesis.
A literature review usually precedes a research proposal and results section. Its main
goals are to situate the current study within the body of literature and to provide context
for the particular reader. A new research depends on past knowledge. A well created
literature review establishes creditability of the researcher of the study, so he can get the
entire benefit of his work (Leary 2004). Literature review discloses appropriate
theoretical structure of the study that helps to understand it easily. It verifies that it has
not been already done. It is the best way to establish the importance of the study (Houser
2007).
Literature review is important as it describes how the proposed research is related to
prior researches, shows the originality and relevance of the research problem to prior
research problems, justifies the methodology used, and demonstrates the researchers’
preparedness to complete the research (Lawrence and Brick, 2008). Literature review is
important to identify the problem of the study, which can be solved by collection of data.
It is very important to know that the work being done by researcher in a new research.
Literature review observes the work that is done is not repeating unintentionally. It also
helps to avoid the mistakes, which were earlier done by another researcher so that the
researcher can improve the research design and instrumentation, which was not done
successfully at the last time (Cottrell & McKenzie 2011). Literature review is also
important to judge research questions and to provide latest research material for the

24
readers. Literature review makes it sensible because it uses both the sides. In the
literature review, researcher uses supportive arguments as well as opposite arguments.
a) Role and functions of parastatals
There is renewed interest in the role parastatals play in promoting economic
development. This role of parastatals is vital for economic development, as it provide
essential infrastructure, public goods and related services such as electricity, airports,
seaports, water, air and rail transport etc. Parastatals have made significant contribution
to the economic development of Namibia since independence. The parastatals initiated
the provision of essential infrastructure and related services that are critical to Namibia’s
economic development and have played a key role in enhancing skills and
entrepreneurship. Some parastatals in Namibia operate in monopoly position such as
NamPower, NamWater, Road Fund Administration and TransNamib, while others
operate in competitive market such as Air Namibia (Pty) Ltd, Namibia Wildlife Resorts
and National Broadcasting Corporation.
Economic and business experience has taught that parastatals such as Air Namibia
function under competitive market conditions, which tend to be more responsive to
demand signals and make more efficient use of scarce resources than parastatals
functioning in a monopolistic situation such as NamPower, Road Fund Administration
and NamWater. Therefore, these organisations tend to achieve better economic and
financial results. This effect is generally ascribed to behavioural influence of risk of

25
failure arising from a mismatch between the organisation’s offering and prices on the
one hand and the preferences of consumers with choices on the other hand. In case of
parastatals it is generally accepted that the positive (potential) influence of risk of failure
is further accentuated by transferring ownership to private sector, as such entities are
then forced to compete for capital in open market without access to government funding
or guarantees. It is generally believed that divestment to private sector promotes
efficiency through the introduction of modern management techniques, product and
service innovation and general exposure to the dynamics associated with private
ownership. Regulation and competition go hand in hand (Boardman and Vining, 1989).
In case of both public and private monopolies, regulation often has to substitute for
competition, providing scrutiny, incentives and disincentives to promote effective and
efficient operations at entity level. To mention one example – regulation of monopolies
should encourage profitability commensurate with the cost of capital but not to the
extent of accommodating excessive customer pricing by such parastatal. In case of
market liberalisation, regulation remains necessary to ensure a level playing field
between incumbents.
The Government of the Republic of Namibia owns these enterprises that provide public
goods such as water, electricity and airline, which cannot be provided by private sector
companies or can be provided only at a higher price, which the public may not afford.
The main objective of the Government in owning Air Namibia (Pty) Ltd has been to

26
keep it afloat so that it may contribute to economic development by transporting foreign
tourists to Namibia and develop tourism that contributes to Gross Domestic Product
(GDP). This improves standard of living of people.
According to Kangueehi (2007), ‘‘State-owned enterprises in Namibia play crucial role
in the provision of important goods and services to all our people as well as in the
promotion of economic growth for the development of our country and improving the
standard of living of citizens. Article 98 of the Namibian constitution prescribes the
economic order of Namibia, which shall be based on the principles of mixed economy.
This type of economy has its main objective of securing economic growth, prosperity
and human dignity for all Namibians’’.
Kangueehi (2007) also emphasised, that public tends to focus on profits and losses as
performance indicators. When both profit and loss are used as performance indicators,
some state-owned enterprises generate profit, because they are monopoly, while those
that record losses operate in competitive market. Therefore, it is senseless to use profit
and loss as the performance indicator, but to include other benefits and contribution to
the economy of Namibia. It is further said that, many governments around the globe
have undertaken various reforms initiatives, ranging from changing the external policy
environment in which public enterprises operate from one based largely on government
commands to one in which market forces function. They include policies aimed at
rationalizing the less than optimal portfolio composition, reducing its burden on the

27
economy, and enhancing management and system capabilities so that the enterprises
may carry out their operations more efficiently.
It is also mentioned by Kangueehi (2007) that, many African parastatals particularly
those in infrastructure, have a long history of poor performance. There are so many
reasons why there has been great reliance on parastatals in most African states,
especially when it comes to their development strategies. Firstly, at independence most
African states inherited the notion that extensive government involvement in the
economy and society was the natural order of the day. Secondly, colonial governments,
especially in the period from 1945 to 1960, had created economic planning bodies and
agricultural marketing boards, instituted wage and price controls, and started industrial
parastatal enterprises. In the 1960s and 1970s a number of theoretical justifications for
public enterprises were in the air, lending intellectual support to what governments in
Africa (and Asia and Latin America) were strongly inclined to do for social and political
reasons. Thirdly, in many African countries ideology played a more silent role.
Socialism was seen as the more just, the more effective, and the more culturally relevant
approach to economic affairs. There were two compelling factors which also justified
public intervention: the very small size and limited capital, and generally non-African
nature of local private sector.
Van der walle (2009) mentioned that, the international track record of parastatals in
delivering goods and services effectiveness and efficiency are in general viewed

28
critically. The major contributing factor to this has been parastatals’ closeness to corrupt
political regimes and concomitant introduction of political considerations into their
operational management. In addition, parastatals are often perceived as being sheltered
from competitive market conditions. As a result, parastatals worldwide have become
strongly associated with operational inefficiencies, low service levels and productivity
and bureaucratic structures. This has led to large-scale adoption of policies, which are
aimed at transferring ownership of parastatals into private sector, although the latter has
not always been with significant success, especially in African countries.
As per Kangueehi (2007), in the absence of large-scale nationalization programmes in
the past, parastatals in Namibia make a relatively small contribution to the economy in
terms of percentage contribution to gross domestic products and in terms of employment
contribution. However, they play a dominant role in certain sectors, especially in
infrastructure and in the promotion of socio-economic development. The history of
parastatals establishment shows that states have opted to own and control parastatals in
specific sectors for a variety of reasons. In most cases, the key consideration for the
establishment of parastatals has been to address perceived allocated inefficiencies in the
provision of products and services to a country’s population. In the quest of maximizing
national welfare through Government intervention, state ownership was seen as the best
way to encourage development and growth while maintaining basic services to all.

29
Van der walle (2009) further said, the alleged state interference in parastatals that by
creation these are owned by the state and utilize public assets, hence the involvement of
the government in ensuring their efficiency and productivity. The state interference is
towards greater decision making, autonomy for boards and executive management in
line with South African King Reports (King Report I 1994; II 2002; and III 2009) and
the UK’s Cadbury Committee Report on good governance. Namibia has moved towards
less government interference in the operational decision making of parastatals.
Commercialisation means that parastatals should be run on business principles rather
than political principles. Van der walle (2009) continued to say that, Government input
into parastatals decision making is seen as political interference, something, which
should be actively discouraged. This is even more than the case once parastatals become
even partly privatised.
Khoza and Adam (2007) argued that there are benefits for government if it conducts
business through parastatals that are established as separate companies. The benefits
enumerated are: the opportunity for improved governance, encouraging entrepreneurial
flair and attracting appropriate skills and talent, avoiding government bureaucracy, and
attaining a more focused business direction. They further mentioned that, in recent years,
the performance of the parastatals has in many countries received considerable criticism.
The Governments around the world are increasingly dissatisfied with the performance of
their parastatals. Managements of these parastatals have not shown interest in changing
the parastatals performance by responding to market challenges.

30
b) Parastatals in aviation
As per Schmidt (2009) there are several negative influences on airlines of state
ownership:
- ‘‘There are general economic crises that hit the volatile aviation industry harder
than other industries. There is a proportional relationship between the world
Gross Domestic Products growth and the growth of the world demand for air
travel. The estimation is for every two per cent increase in world Gross Domestic
Product the aviation industry will increase by one per cent.
- Major political events can influence airlines performance. The civil war and
political instability in the country may affect the airline operator. It affects the
willingness to travel of passengers, because passengers will not travel to a
destination which is perceived as security risk. Airlines that are from countries
which are perceived as security risk experience decrease in revenue, because
travellers do not want to risk their lives. Therefore, they travel to places where
they feel secured.
- Technology influences aviation directly through its impact on operational cost,
security and productivity. Technology influences the airline operations delivery,
air ticket distribution, air navigation systems and baggage services. The airline
that is in line with the technology responds quickly to its passengers’ demand
and provide quality services; and it will result in low operational cost compared
to the airlines that are not in line with the latest technology.

31
- Legislation influences the aviation market both on national and global level. It
affects the operations, the conditions to market the airline for both national and
global users in the way the market process can take place. International airlines
are still subject to significant international legislative constraints, even in the
recent open skies agreement between European Union and the United States.
- Airlines are subject to competition from other airlines within the framework of
macro-economic, political, technological and legislative conditions. With on-
going globalization and the continuous growth of international economic
connections creating one global economic environment and a continuous
decrease of Government intervention in the course of liberalization. There is new
competition on the supply side, which influences demand patterns over time.
Changes in demand patterns may also arise from general changes in the
economic environment’’.
Schmidt (2009) furthers his argument with some other challenges on airline
business. Firstly, airlines are subject to strong fluctuations in their market that occur
in significant and unpredictable frequency as well as magnitude. Secondly, the
underlying reason is that the nature of the airline business remains both cyclical and
volatile; Airlines produce services that perish completely and instantaneously if not
used and that need to match the timing and space of the customer in need for the
service. He also highlight that airline customers basically buy the movement of
himself and his luggage. Furthermore, the passengers also take advantage of explicit

32
and implicit services connected to the mere act of transportation. Explicit services
include the use of websites and travel agents for booking, transport to and from the
airports, various kinds of paid and unpaid in-flight services, such as entertainment
and catering. Implicitly an airline needs to provide a safe, reliable and competitive
service. The safety concern is paramount as an airline posing a significant risk to its
passengers of losing life or limb should not expect to find many customers and can
be considered as a high risk airline. The major challenges for aviation industry also
originate in part from manageable areas such as innovative competitors, new
technology and from events beyond managerial control with potentially very
significant impact.
c) Air Namibia (Pty) Ltd an aviation parastatal
Menges (2006) suggests that Air Namibia (Pty) Ltd should initiate a commercialisation
programme with a new board of highly qualified business professionals, such as
chartered accountants, lawyers and aeronautical engineers, who have experience and
actually know how to manage such a business. This will end the dependency on bailout.
He further stresses that, Air Namibia (Pty) Ltd should sell off some stake in the airline,
say 60 per cent, to some international airline that can turn around the airline and offer
additional funds for its expansion. Further, Air Namibia (Pty) Ltd should stop relying
only on a few routes such as Angola, Germany, England and South Africa, but should
add other parts of Africa like Nigeria, Kenya and the rest of the world. It is also
expressed that, Air Namibia (Pty) Ltd should engage experts to develop a good

33
turnaround strategy that will help the Airline to make profit. Once Air Namibia (Pty) Ltd
is profitable its shares can be listed on the Namibia Stock Exchange to raise more capital
for expansion. This will allow Namibian people to own some shares in the national
airliner.
About South African Airways, Jefferson (2012) states that the only way to stop bailout
of South African Airways is by privatisation, because South African Airways have
requested for a bailout between R4.7 and R6 billion. He argued that, it cannot continue
using public money while so many South Africans are without clean drinking water,
basic sanitation and housing. South African national airline has become dependent on
government bailout. There has been an element of “sloppy accounting and lack of know-
how” in the airline. More stringent accounting and oversight measures would need to be
put in place and it will only be possible with privatisation.
However, Forfas (2010) warns that privatisation is not an automatic solution to
improving airline performance, unless if the quality of goods and services improve on
privatisation. If privatisation is to improve the airline performance, the quality of goods
and services delivery should be improved over the longer period. Privatisation needs to
be complemented by policies that promote competition and effective regulation of the
industry. Privatising parastatal should not be guided by high performance only. The
parastatal is required to attain, a meaningful contribution to country’s economic
development. Kenya Airlines started in 1977 as a government-owned airline and at that

34
time the airline was struggling to maintain its operations from cash it generated from
operations. It had been receiving Government bailout until in 1996 when it was
privatised. Kenya Airlines was privatised in 1996 when 25 per cent of its shares were
bought by an international airline KLM. Since then, the airline has been profitable and
Kenya government has stopped bailout of the airline.
Zhou (2012) reported that privatizing Air Zimbabwe is the only way to save that airline
from falling into debt. ‘‘The long-term solution for Air Zimbabwe is to privatise the
airline, because the airline is struggling to generate the necessary cash flows. It is under
huge debt, because of mismanagement’’. The Government of Zimbabwe had to bailout
the airline with US$ 2.8 million in order for the airline to pay operating expenditure,
because suppliers were refusing to supply needed commodities to Air Zimbabwe, due to
unsettled account balances. The Zimbabwean Government has been reluctant to
privatize the airline, which is sinking in huge debt. One of the planes of Air Zimbabwe
was impounded at Gatwick International Airport in London over unsettled debts and it
was only released after the government paid US$ 1.2 million to parts suppliers,
American General Supplier.
Doganis (2006) writes that for three decades, India heavily regulated its airline industry.
It restricted foreign and private domestic commercial airlines from operating scheduled
services within the country, while the state-owned domestic air carrier, the Indian
airlines enjoyed monopoly. This was in keeping with the country’s socialist-oriented

35
approach towards economic development, which restricted private sector participation.
For two decades, Indian Government contemplated whether or not to deregulate the
airline industry. With this consideration present, the Government faced issues such as
changing structure of the economy (transition from planned economy to liberalized
economy), role of foreign players (to what extent should foreign players be allowed to
participate in the airline industry) and ownership (who shall have ownership of the state-
owned air carriers, the airports, the private domestic carriers etc.). The issues associated
with the deregulation of the airline industry were political in nature not only because
they affect the economic growth and development of India, but also because such policy
changes create an arena where different interests, having different priorities, compete
with each other to maximize their relative gains. Unlike the case in Eastern Europe,
where countries not only transitioned from a socialist economy to free-market economy
but also transitioned from communism to democracy (Doganis, 2006). In India the
liberalization of the economy was not associated with concurrent change in the political
system. This made India a unique politico-economic case. The deregulation of the airline
represented an excellent case for expanding the role of markets, private capital,
reforming state-owned enterprises, bureaucratic reorganization, decentralization and
globalization. Part of the reasons for opening up airline industry was the increased
demand for domestic air travel. This trend has continued till the present. In recent years,
air traffic to and from India has been among the fastest growing in the world. To keep up
pace with the demand, required India to modernize and develop its civil aviation sector
through measures that included liberalization of air transport services and attracting

36
private domestic airlines. Today, it is hard to keep track of India’s domestic air transport
market with new airlines entering the field every year. These new players in the airline
industry expanded passenger choices regarding frequency of flights, routes, destinations
and fares.
d) Corporate governance in parastatals
Corporate governance in parastatals is a key issue. Government is facing a major
challenge to address the practices, which are leading to corporate governance failure in
parastatals. Parastatals are expected to hold to higher standards of accountability than
private organisations, because parastatals are owned by the taxpayers. State ownership
does not automatically guarantee state control over the performance of parastatal. Unlike
private organisations whose main goal is shareholder wealth maximisation, parastatals’
goals are typically more complex mixture of social, political and commercial objectives.
There is a widespread acceptance regarding best practices of corporate governance for
parastatals. In essence, good corporate governance of parastatal is characterised by
(Daniel, 2009):
a) Strong oversight by State – this requires the development of specific mandates to
ensure that parastatal has clear objectives and targets, which can be reported and
monitored over time.
b) Accountability of parastatal – this is the guide to state ownership in obtaining
assurances of sound management such as audit reports from external audits.

37
c) Independent boards – potential exists to ensure that boards of directors comprise
of relevant expertise and clear obligations. It requires specific qualifications such
as finance, legal and human resources.
d) High levels of transparency and disclosure – that is public reporting on the
financial and non-financial work conducted by parastatal. More structured public
reporting on the financial and non-financial information of parastatal improves
transparency and public trust in a parastatal.
Gross and Mukandala (1994), report that in the mid 1970s, Togo undertook a large and
rapid expansion of its industrial sector, in the form of parastatal enterprises. This
expansion was financed first by commodity boom and then by borrowing. By the end of
the 1970s, Togo’s economy was engulfed by mountain of debt, and the new enterprises
were placing heavy demands on the budget. Togo had no choice but to turn to the
International Monetary Fund (IMF) and World Bank for assistance. For Togo’s
industrial sector, the most immediate impact of the reforms had been the liquidation or
privatisation of many of Togo’s previous parastatals and by the end of 1987s, nine (9)
parastatals were liquidated and eleven (11) were privatised. The transfer of parastatals to
private ownership did not entail any significant restructuring of those parastatals.
Although the privatisation effort may have reduced the Togolese Government’s
immediate financial burden, these efforts did not adequately address the long-term
structural problems that limit industry’s contribution to national development.

38
Over the last few years, the issue of corporate governance in state owned enterprises has
become a major area of concern all over the world. The corporate governance in
parastatal has to deal with the complex relationship between the Government as
shareholder and the Board of Directors of the public enterprise. The challenge faced by
parastatal in Namibia is creating a balance between Government’s inclination to control
public enterprises, and the business imperative to achieve excellent performance. The
Government focus on control, rather than performance, often re-inforces these
weaknesses in a parastatal. The success of a parastatal depends on striking an
appropriate balance between control and accountability on one hand, and performance
and entrepreneurship on the other (Khoza & Adam, 2007).
e) Performance of parastatals
The authority and autonomy to parastatals is assigned by the Government. It is very
essential for economic development if parastatals operate effectively and efficiently as
intended by the Government. However, for the Government to ensure that parastatal
performance is not politically interfered, it is critical that parastatals have clear strategic
goals and that those goals are monitored over time. The primary indicator of
performance of parastatal should be focused on the financial results including
profitability and use of resources. However, the conventional, measures of parastatal
profitability and use of resources are unfair, because some parastatals fail to make profit
from their operations such as Air Namibia (Pty) Ltd and Namibia Wildlife Resorts.
Moreover, the non-financial contribution to economic development especially to the

39
tourism industry cannot be quantified in profit terms. Therefore, the performance of
parastatals should be evaluated transparently with a strong focus on trends as well as
financial and non-financial indicators that measure quality, cost of service, effect on
society and effect on the economy, which provide rationale for the establishment of
many of these parastatals (Kangueehi, 2007).
f) Privatisation of parastatals
There are different objectives to privatisation, which affect the form and pace of
economic growth. Some of the more common objectives, which governments usually
hope to achieve through privatisation, are:
a) To liberate the economy
b) To reduce the role of the state in the economy
c) To enable greater integration into the global economy
d) To gain access to international capital and markets
e) To develop a strong private sector
f) To increase competitiveness in the market
g) To comply with lender/donor conditionality
h) To decrease government spending so that taxes can be cut (to win votes and
encourage investment)
i) To redirect subsidies to other areas of service delivery
j) To externalise problems of service delivery
k) To relieve the fiscal to reduce borrowing

40
l) To increase efficiency, performance and productivity
m) To commercialise or improve the management of the parastatals
n) To undermine collective bargaining and union organisation
o) To downsize the public sector
p) To remove parastatals from political interference and sever links between
politicians and management
q) To enable higher salaries for executives and directors
r) To legitimise the parasitic use of state resources
s) To widen share ownership
t) To create job/business opportunities for politicians and their allies
u) To facilitate black economic empowerment in the case of African nations
v) To increase competition in the market (Kangueehi, 2007).
The performance of several parastatals suggests that they spend too much on personnel
costs and achieve insufficient output. This lends credence to the privatisation lobby.
Trade unions need to face the problem head on. The parastatals are inefficient in
performance and service delivery; therefore, there is urgent need of restructuring. The
parastatals need to get to the root of the problem that is causing poor performance, such
as lack of management capacity, lack of co-ordination, lack of resources etc. They
should ensure that they improve the performance either by downsizing or by
privatisation. In most nations, privatisation has improved performance and service
delivery; while in others it worsened the plight of the poor. After, privatisation

41
unemployment has increased, poverty and inequality has sky rocketed (Labour Resource
and Research Institute, 2009).
Pohl, Anderson, and Djankov (1997) compared the extent of privatisation in over 6,300
parastatals in seven Eastern European countries during 1992-95. They found that
privatisation dramatically increased the success of parastatals. Parastatals that have been
privatized for four years showed increased productivity three to five times more than
similar other parastatals. They also found that there was little difference in performance
based on method of privatization. However, ownership and financing affected the
performance of parastatals. There was also evidence that, while performance improved
for firms, especially smaller firms, in the immediate aftermath of privatisation, over a
period of time this performance declined and this was believed to be primarily due to
increased competition as time passed on.
Boardman and Vining (1989), in their recent empirical studies on public and private
ownership, also suggested that parastatals were relatively less profitable and productive
than private firms. Competition and deregulation are just as important as privatization in
improving performance of parastatals. They demonstrated how in the case of Poland,
there was no immediate resort to large scale privatization. Instead, the Polish
Government depended on deregulation of prices, introduction of foreign competition in
many industries, and tight monetary and fiscal policies to improve economic

42
performance. The studies also pointed to the role of incentive contracts for management
and workers as a way to improve performance in the parastatals.
Groves, Hong, Mcmillan and Naughton, (1994) found that there were significant
improvements in total productivity of parastatals when they were given more autonomy.
This study pointed to the fact that deregulation policies were also capable of improving
economic performance across industrial sectors. In their study of privatization they
mentioned of British Airlines which had international competitors and made significant
changes to their strategy in the aftermath of its privatization. They mentioned that it
brought significant benefits to consumers who were charged lower prices for the tickets.
The study also found that privatization led to cost reduction and necessary benefits to
consumers.
As per Bai, Li and Wang (2000), the Chinese Government relied less on privatisation
and more on deregulation of industrial sector while pursuing economic reforms.
Incentives and decentralization in economic decision making were resorted to when it
came to improving the performance of Chinese state-owned enterprises. The largest
benefits of state-owned enterprises in China were that these enterprises served as social
security net for the country. Chinese state-owned enterprises were responsible for
providing social welfare and thus privatization of these enterprises would have been
difficult. The Chinese case demonstrated that achieving the goals of increased
competition, increasing economic efficiency, increasing revenues, decreasing

43
government interference may also be possible through deregulation programs and not
just through privatization programs.
g) Factors impacting performance of airlines
Most of the parastatals have been incurring operational losses and have not generated
adequate cash flows to meet their requirement. Some of the reasons that have resulted in
poor performance of parastatals are: lack of spelt out expectations from parastatals, lack
of checks over performance, confusion created by the system in which Ministry of
Finance and Ministry of Works and Transport are equally responsible for the same
parastatal, lack of accountability among parastatals, as they continue to make losses and
the Ministry of Finance has to bail out.
In response to these failures, the Government of the Republic of Namibia, through the
cabinet, had established the State-Owned Enterprises Governance Act No. 2, 2006. This
Act created the establishment of State-Owned Governance Council, which is responsible
for the following functions:
a) To establish generally accepted common principles of corporate governance and
good practices governing state-owned enterprises;
b) To develop common policy framework for the operations of State-owned
enterprises, including policy on issues relating to human resources, assets and
finance;

44
c) To determine criteria for the performance measurement and evaluation of State-
owned enterprises, and develop appropriate means for monitoring their
performance (Government Gazette, 2006).
Exchange rates have a significant effect on companies that do business globally. When
companies exchange products or services across borders causing two or more currencies
to become involved, fluctuation in exchange rates can lead to gains or losses for the
business.
According to Forsyth (2006), international airlines are amongst the most exposed to
international trade on international routes. Airlines from one country compete directly
with airlines from other countries. As liberalisation of international aviation market has
proceeded, the competition is becoming more intense. Even on those routes which
remain regulated, it is mostly no longer the case, as it was in the past, that airlines from
one country operated jointly with airlines from other countries. Nowadays, airlines face
competition from those other airlines which are permitted to serve a route. The ability of
an airline to compete depends critically on its costs relative to those of other airlines. A
key determinant of the relative costs faced by an airline, and thus its cost
competitiveness, is the exchange rate in the home economy. If the exchange rate of the
home country appreciates, the competitive pressure on the airline will increase, since its
costs rise relative to those of its competitors. The airline experiences difficulty with
foreign currency. For instance, the airline might be profitable in foreign currency, but

45
when the currency is translated into home currency the exchange loss is so huge that the
airline will incur loss due to exchange rate. Some airlines in the world open up several
bank accounts in those countries currencies that the airline receives revenue and it uses
those currencies to settle supplies in those markets which invoice in those currencies in
order to reduce exchange rate loss. They also take advantage of exchange rate when the
rate poses gain on translating into home currency. Airlines try to reduce the impact of
foreign exchange rate by entering into derivatives markets, which provide instruments
for management of financial risk through hedging, such as options and future contracts.
Lafrance, Osakwe and St-Amant (1998) mention that airlines are affected by exchange
rates in a number of ways. Changes in exchange rates will affect the flows of passengers.
If a country’s exchange rate rises, it is likely to attract fewer inbound visitors, but
outbound travel is likely to increase. The airlines of the country might gain or lose
passengers on balance, because of exchange rate. Exchange rate changes can also have
an impact on airlines thorough their capital structure in what countries’ currencies they
have borrowed, and in which currencies they hold investments. Exchange rate changes
will affect the prices they pay for inputs relative to the prices their competitors are
paying. Airlines supply products on international markets. They supply services on
international routes, and invariably face competition from airlines based in other
countries. Thus an airline based in Australia, such as Qantas, competes against airlines
based in Singapore, the US, the UK and the UAE, amongst others. Airlines buy their
inputs on international markets and in home markets. Thus Qantas will hire staff in

46
Australia, buy fuel in Singapore and aircraft in the US. As exchange rates change, the
relative prices of these inputs will change. If the Australian dollar rises relatively to
other currencies, the input costs of Qantas will rise relative to other airlines’ costs. In
terms of other currencies, the cost of the Australian purchased inputs will increase, and
in terms of Australian currency, its costs will fall. But those of its competitors, which
purchase (nearly) all of their inputs outside Australia, will fall by more. A rise in the
exchange rate will unambiguously lessen the competitiveness of home country airlines.
It is important to be explicit about what “home priced” and ‘‘internationally priced” or
“foreign priced” inputs mean. The important distinction is where the price of the inputs
is set.
Lafrance, Osakwe and St-Amant (1998), argued further that, it is not important in which
country’s currency an input is purchased. An airline might pay for an input in US dollar
or in Euro, but these currencies are quite convertible. The Australian dollar might raise
vis a vis the US dollar but not the Euro, but this need not affect the price an Australian
airline pays for an input. If it is buying fuel, for example, a change in the US dollar/Euro
rate will lead to a change in the US and Euro prices of fuel. It is also not important
where the input is purchased. Fuel might be purchased in Australia and Singapore. Fuel
is priced internationally, and if exchange rates change, prices in all countries markets
will change.

47
Wayne (2008) found that, U.S. scheduled commercial airlines transported over 666
million passengers and made a combined net profit of nearly $2.5 billion in the year
2000. In 2001, the year in which terrorists used commercial airliners to attack the U.S.
on September 11, the total number of passengers dropped to 622 million and the year’s
net profit quickly turned into a net loss of over $8.27 billion. In 2005, the number of
passengers had rebounded to over 738 million, but the combined bottom line, a net loss
of over $5.67 billion, had not shown a similar recovery. While shocks to the passenger
airline system like the 2001 terrorist attacks and the rapid, steady increase in the price of
crude oil that began in early 2002 have negatively impacted its ability to maintain
profitability, the increase in annual passengers of more than 116 million between 2001
and 2005 has not resulted in airlines returning to profitability, which demonstrated that
additional measures need to be undertaken to help move the industry back toward
profitability.
Passengers must be persuaded to fly in sufficient numbers before airline profitability can
even be considered to be possible, the various wants and needs of those passengers, and
the technologies that deal with them, are addressed first. In general, passengers want
flights that are reasonably priced, convenient and secure. Providing prospective
passengers with the ability to use one or more of a wide variety of internet-based search
mechanisms designed to compare and select from among a variety of flight options
significantly increases the likelihood that the selected flight will be considered to be
reasonably priced by an individual passenger. Although, the technologies behind

48
currently available on-line flight search mechanisms are relatively well developed,
enhancing their ease-of-use, availability and reliability will help turn more prospective
passengers into actual passengers, thus helping keep airplanes full. In addition, inclusion
of the widest range of possible alternatives regarding airline companies, flight schedules,
seating classifications and even area airports in the relevant databases and possible
search criteria significantly increases the likelihood that passengers will believe they are
paying reasonable prices to fly.
There are two major issues that contribute to a passenger’s perception of convenience,
flight schedules and the smoothness and speed with which the passenger flows through
the actual transportation system. In the context of flight schedules, passengers generally
prefer non-stop, or at least direct, flights between their origination and destination
locations. Of course, they may be open to considering alternative itineraries that include
changing airplanes and/or airlines, and even significant airport layovers, if substantial
differences in ticket prices exist. A group of technologies collectively known as business
intelligence is particularly useful in providing the kind of detailed analysis of available
customer and competitor information that an airline needs to engage in effective yield
management – an effort to fill every seat on every flight with passengers who have
purchased their tickets at the highest price possible (McNerney, 2006).
Netessin and Shumsky (2002) write that large airlines have built hub-and-spoke systems
under which passengers are carried from smaller “spoke” airports to larger “hub”

49
airports and then on to either another spoke on the same hub or another hub. Those
airlines are faced with an additional level of complexity in their efforts to develop
effective yield management systems. By its very nature, the hub-and-spoke system
significantly limits the ability of an airline to address passengers’ desires for direct
flights, even when those passengers may be willing to pay somewhat higher price for
that convenience. Passengers who would prefer to have direct flights, but are forced to
make connections, generally expect to pay less for the inconvenience. At the same time,
it must be recognized that some passengers are more interested in low prices than
convenience. This means that to successfully compete in what is generally a more
lucrative short-to-middle distance direct flight arena; large airlines must integrate
additional direct flights into their overall schedules to create an optimum mix of direct
and hub-and-spoke flight schedules. Although creating such a schedule is a rather
complex task, the business intelligence technologies that a number of airlines employ
should be particularly well suited to such an effort. Smoothness and speed, with which
passengers flow through the actual transportation system, including checking in for
flights, moving through security checkpoints, boarding in the departure terminal,
deplaning and moving through the arrival or transfer point terminal, and claiming
baggage. The application of technology to each of these facets of a passenger’s
movement through the system, along with making associated changes to relevant
business practices, can significantly improve the passenger experience. Enabling
passengers to check in early via the internet has proven to be an excellent first step in
smoothing the check-in process by allowing the passengers to accomplish part of the

50
process prior to their arrival at the airport. The creation of self-service check-in kiosks in
the general vicinity of the ticket counters can also improve the flow of passengers in
those areas by separating those who have already purchased their tickets from those who
haven’t. Baggage check kiosks, with a relatively high self-service component, are a
logical next step in reducing congestion in the ticketing area and improving passenger
flow through the initial check in process (Netessin & Shumsky, 2002).
Wyld, Jones and Totten (2005) mention that, the security check activity is in the hands
of the government. The application of new technologies can speed the movement of both
passengers and their baggage through the necessary security checks. Enhanced scanners
that both “sniff” for explosive material and quickly evaluate x-ray images using
intelligent software can increase both the accuracy and speed of the security checking
process. Although aircraft boarding procedures vary from one airline to another,
increased use of intelligent systems that consider family groupings, special needs
passengers, carry-on bags when setting the boarding order can both reduce the total
boarding time and smoothen the process for individual passengers. While in-flight, the
integration of wireless technologies into various passenger audio/video systems can
significantly reduce the number of problems, and passenger complaints, related to those
systems, and can even help smooth the arrival/connection process by providing up-to-
date gate and baggage claim information tailored to individual passengers. While, the
use of machine readable bar codes on boarding passes and baggage tags are reasonably
effective in moving passengers and baggage through the system, they generally require

51
less human intervention to ensure that they are read correctly. Updated flight
information and even the location/status of their baggage when they are anywhere in the
terminal simply by presenting their boarding passes to a barcode reader in a kiosk. The
use of barcode baggage tags can make it possible to increase the level of automation in
moving baggage from the check-in point to the correct aircraft. Because increased
automation in the handling of baggage means reduced opportunities for human error,
baggage is much less likely to be misrouted, and any rerouting of baggage required
because of late gate changes can be accommodated much more readily. Tying baggage
tags to boarding passes can make it possible for passengers to check on the status of
their baggage at any time.
As per Jeeva (2011), volatility in oil prices and a possible over supply in capacity within
the Asia-Pacific will cap earnings growth of airlines. Some airlines have cut their
earnings forecast due to higher fuel bill. Oil price volatility could be more damaging
than actual high oil prices, since the airlines normally priced their tickets one to three
months forward, and these forward profits are easily wiped out due to oil price swings.
Some airline are fighting back with host of measures to cut costs and boost revenue and
they survive the increase by passing the cost to consumer, and by doing so have
impacted on the movement of passengers. Airlines announce cut in flights to less
profitable routes, and some have turned to the governments for financial assistance in
order to maintain the operations and keep ticket price stable. Airlines have protected
themselves from volatility of fuel price by engaging in advance fuel hedging, which

52
reduces the risk of fuel volatility. Airlines have come up with more innovative methods
to reduce cost and one option is by reducing fuel burn. This can be possible if the airline
minimizes the weight of cargo, flying at slower speed and lease aeroplane which
consume less fuel for the same output. European airlines have gained efficiency through
consolidation. Air France's merger with KLM, and Lufthansa's with Swiss International
Airlines helped the airlines maximize number of passengers per plane as well as cut
back-office costs. Airlines work together in an alliance to sell tickets aboard of each
other's flights. A traveller flies one leg of a trip with one airline and the next leg on
another. As a result, the arrangement boosts sales for airlines, without adding costs.
Walsh (2011) observed that airlines had slashed their global profit forecasts in half after
warning that high oil prices, the Japanese tsunami and the Arab spring will remove $4bn
(£2.43bn) from the industry's bottom line that year. He warned that European carriers
will bear the brunt of the impact from high fuel costs, with some operators going out of
business. He estimated that carriers will make worldwide profit of $4bn that year, down
from the previous estimate of $8.6bn. After recording a net profit of $18bn in the
previous years, the industry slipped perilously close to its loss-making years of 2008 and
2009, with a profit margin of just 0.7% expected in 2011. Asked if some carriers will go
under, as happened to dozens of airlines in the wake of the 2008 oil spike when prices
hit $147 a barrel, Walsh said: "I fully expect that to happen." Referring to the current
price for Brent crude of $115 a barrel, he added, "I think the high oil price is something
that poses a real challenge to the industry. There are many airlines that will struggle in a

53
high oil price environment." Fuel will account for nearly a third of industry costs this
year. Walsh said the world economy was in better shape than during the previous oil
spike, but Europe is in a weaker state than the Americas and the Asia-Pacific regions.
"Some will suffer more than others, such as those airlines operating in economies that
are weaker. The strength of the global economy is driven by Asia and Latin America to a
large degree that airlines operating in those areas will be less affected than airlines
operating in a European context. It is likely to have more of an impact in Europe than in
other parts of the world."
Sanderson (2012) mentioned that the outlook for the industry is also heavily linked to oil
prices, although signs show that some relief will be seen on this front, with oil prices
expected to decline in 2013. In 2013, fuel prices are expected to decline to USD
105/barrel (Brent), which will hold the industry’s fuel bill to USD 208 billion (the same
as is expected for 2012) even when factoring-in industry growth. Since airline industry
profitability peaked in 2010, oil price has raised from USD 79 to a historically-high
USD110 on average in 2012, or USD 127.7 a barrel for jet fuel. That 40% rise alone
added around USD 50 billion to un-hedged fuel costs. The global airline industry’s fuel
bill is forecast to total over USD 200 billion in 2012 (accounting for a third of operating
expenses), almost five times 2003’s fuel bill. As a result, fuel surcharges have become
commonplace, less transparent and more expensive in the past few years.

54
Sanderson (2012) continued that, despite the increases in the cost of travel related to
increased fuel and ancillary charges and passenger taxes in some countries, average
worldwide fares have declined in 2012 and are yet to return to pre-crisis levels. In
contrast, US airline yields have increased strongly since the lows of mid-2009, although
their strong rise is showing signs of stalling. Globally, passenger yield is expected to
remain stable in 2013, following growth of 2% in 2012, while cargo yield is expected to
decline 1.5% in 2013 following estimated yield declines of 2% in 2012. The signs of a
minor recovery that were evident in air freight markets early in 2012 are fading,
reflecting waning consumer confidence in major economies, weakening demand for air
freighted consumer goods. Reflecting reduced demand levels, freight capacity is also
being reduced, both through the retiring of aircraft and a reduction in aircraft utilisation
rates.
Tyler (2012) stated that, looking to trends in the industry in 2013, airlines will continue
to adapt to the challenges presented in the current operating climate. Even six years ago,
generating a profit with oil at $110/barrel (Brent) would have been unthinkable. The
industry has re-shaped itself to cope by investing in new fleets, adopting more efficient
processes, carefully managing capacity and consolidating. But despite these efforts, the
industry’s profitability still balances on a knife-edge, with profit margins that do not
cover the cost of capital. Airlines will continue to be focused on pursuing new revenue
sources and building ancillary revenue streams, while also increasing competition with
code-share and alliance partners, while at the same time reducing costs wherever

55
possible. Airlines are continuing with cost reduction and transformation plans to strip
out costs, with industrial unrest likely to continue in the coming years. Growth in 2013
will likely continue to be focused around emerging markets, with more cautious growth
in the mature aviation markets of North America and Western Europe. Some 48% of
global aircraft orders are from airlines in Asia Pacific or the Middle East, with 41% of
narrow bodies being from airlines from these regions, mainly from Asia Pacific. The
difference between developed and emerging nations becomes even starker when only
looking at the orders for wide body aircraft with 63% of wide body aircraft being
ordered by airlines from these two regions. This promises to reshape the face of aviation
in the next decade.
h) Factors impacting performance of Air Namibia (Pty) Ltd
The Namibia population is estimated at about 2.1 million (2012). The population size of
the country has positive direct impact on the performance of the airlines. It can be
assumed that population size have direct proportions to the demand of the airline ticket,
higher the population of the country higher is the possibility of demand for airline
tickets. In terms of Air Namibia (Pty) Ltd the demand for its services is limited due to
small population in comparison to other countries such as South Africa and Angola. Air
Namibia (Pty) Ltd’s most passengers are foreigners and the majority are making
Namibia as a transit point either to Europe or to South Africa and neighbouring
countries. Namibians are not using Air Namibia (Pty) Ltd for holiday travel, since the
majority of the population is living in villages and travelling by plane is regarded a

56
luxury and for the rich minority only. The majority of the population prefers to have
their holidays in their village close to their friends and family and mostly make use of
public transport rather than flying with Air Namibia (Pty) Ltd (Nashipena, 2012). This
significantly affects the performance of the airline. Namibia’s population is made up of
young people and ageing population, which do not use airline for travel.
Nashipena, (2012) said that, Namibia has more than 51 per cent people unemployed, the
level of income is low and they cannot afford holidays and buy air tickets. The low level
of income is affecting the demand for tickets of Air Namibia (Pty) Ltd.
Namibia’s geographical area is about 825,400 km2. There is too much open space which
is occupied by farms. People of Namibia prefer to travel by road or by train, because
these cost less and are simple to use. The places to which people might travel are at short
distance from each other unlike some other countries. Travelling by road and train is
convenient for passengers, because of short distance between destinations. This affects
the demand for airline tickets.
i) Airlines bailout
South African airways received an emergency loan to cover fuel costs, preventing the
grounding of its local and international flights. The South African Government signed
off a guarantee that allowed the national carrier to secure a R550 million bank facility
for fuel and other short term commitments. The grounding of the airline would have left

57
local and overseas passengers stranded after the festive season holidays. The airline had
foreseen it when previously requested R5 billion guarantees (Gigaba, 2013).
Kuugongelwa-Amadhila (2013) announced that Air Namibia (Pty) Ltd will receive over
the next two fiscal years at least more than half a billion - N$ 362.2 million in 2014-15
and N$ 304.1 million in 2015-16. It was reasoned that bailout is needed for Air Namibia
(Pty) Ltd’s business plan updates and to pay outstanding debts. It was mentioned that,
‘‘Air Namibia (Pty) Ltd cause is of national concern’’. In 2006 budget speech, the then
Minister of Finance had expressed that the airline remained a concern and that its
financial situation continued to deteriorate and turnaround strategy is in dire need. Air
Namibia (Pty) Ltd has an important role to play, especially in the tourism market. To
realise that, the company needs to transform itself to be better able to face challenges of
highly competitive industry in which it operates.
j) Profitability of airlines
According to Tyler (2012), Airline profitability prospects have improved for 2012, with
International Air Transport Association (IATA) upwardly revising its 2013 financial
forecast, predicting a USD4.1 billion profit for 2013 compared to USD3 billion forecasts
2012. However, he cautioned that “we should not get too excited” about the revision,
with profits still to be less than half the USD8.4 billion earned in 2011 and considerably
lower than the USD19.2 billion achieved in 2010. A return to those levels is not
anticipated any time in the near future. Despite the upward revision, profit margins also

58
remain anaemic, noting that the revision only increased net profit margins from 0.5% to
a still “miniscule” 0.6%. Airline industry profitability is expected to pick up modestly to
USD7.5 billion in 2013, amid slightly faster growth, lower oil prices combined and an
upwardly revised GDP forecast. But in general, airlines are continuing their ‘cautious
capacity growth’ mantra to the benefit of load factors, yields and profitability. However,
as Mr Tyler (2012) noted, this level of profitability still equates to a net margin of just
1.1%, indicating the relative unattractiveness of investment in this sector. He further
noted that with the forecast profitability, “airlines will be able to pay their bills and
service their debt, but there is very little left over for the shareholder”. The estimates
return on capital will be 3% on average in 2013, “but investors would expect to earn a
return of 7-8% in an industry with a similar risk profile to airlines”. The fact that the
airline industry persistently earns less than its cost of capital is a measure of the
intensely competitive environment. Consolidation in the US and Europe, including Joint
Ventures on many long-haul markets, is starting to make a difference. There is still a
long way to go before normal profits are earned.
Tyler (2012) expressed that ‘‘the situation for European airlines has, however, worsened
and their performance has deteriorated substantially, reflecting weak home markets due
to the Eurozone crisis, with the region also suffering under high taxes, inefficient air
traffic management infrastructure and regulatory restrictions. In June 2012, European
airlines were forecasting a USD1.1 billion loss, now revised to a USD1.2 billion loss.
Not only is the economy weak with the Eurozone crisis, Europe has some very

59
unfriendly conditions for doing business due to onerous regulations, high taxes,
insufficient capacity at many key airports and an air traffic management system badly in
need of modernisation,” The forecast for Latin America remains unchanged.
Branchard (2012) revealed that global economic recovery is continuing but has
weakened and that the economic recovery has “suffered new setbacks, and uncertainty
weighs heavily on the outlook”. He said the downside risks are now judged to be more
elevated than in its previous September 2011 and April 2012 forecasts. Relative to its
April 2012 forecasts, the October 2012 forecasts for 2013 growth have been revised
from 2.0% to 1.5% for advanced economies, and from 6.0% to 5.6% for emerging
market and developing economies. Blanchard (2012) noted that the forces pulling
growth down in advanced economies are fiscal consolidation and a still-weak financial
system, which is still not functioning efficiently. He also noted that the outlook for 2013
globally is highly dependent on whether European and U.S. policymakers deal
proactively with their major short-term economic challenges. Blanchard (2012) added
that low growth and uncertainty in advanced economies are affecting emerging markets
and developing economies. Although economic growth in the Euro area is likely to
contract overall in 2012, the US is expected to improve on 2011 performance, as is
Japan. Growth in emerging markets continues to significantly outpace western
economies, with robust expansion anticipated throughout Asia Pacific, MENA, sub-
Saharan Africa and Latin America in 2012. Western economies continue to be limited
60
by tightening fiscal policy, while the governments of Brazil, Russia, India and China
maintain a relatively looser fiscal position.
k) Cash Flows of airlines
Arpey, 2002 stated that, America’s airlines had received hefty bailout from Congress of
multibillion-dollar package. The airlines had been struggling to sustain the airline
operations with their own funds. In the wake of the September 11 terrorist attacks on the
United States, in which four airplanes were hijacked and crashed, prospects for the
industry looked bleak. With tourists and business travellers expected to shy away from
the suddenly unfriendly skies, domestic carriers have already announced almost 100,000
layoffs and reduced their schedules, while the major airlines' stock prices had
plummeted.
The airlines requested congress about $24 billion in cash and loans during meetings with
Congress. But the House and Senate both passed a $15 billion package consisting of a
$5 billion cash payment to the industry, with a potential $10 billion or so in guaranteed
loans if problems persist, and a lessening of liability costs for American Airlines and
United Airlines, whose planes were hijacked on September 11. The government's aid
included $3 billion in security costs not included in the cash grant or loans.
Although there was less than their desired figure, the plan addressed the most pressing
problem that the airlines were facing at the moment: cash flow. Compared to some other

61
industries, the major airlines do not keep a great deal of cash on hand — usually
anywhere from three weeks to three months of reserves. Even the grounding of all
flights for about two days cut into those reserves substantially.
The terrorist attack came at a time when the airlines were facing imminent retrenchment
anyway. The sputtering economy had led to a decline in revenue for several airlines,
especially due to a downturn in business travel.
As a result, the industry as a whole lost money in the second quarter of 2001 —
traditionally its strongest part of the year — for only the third time in 30 years. In that
period, American Airlines, the nation's largest carrier, lost $507 million after a profit of
$321 million in the second quarter of 2000. The second-biggest domestic carrier, United
Airlines, lost $292 million after a second-quarter profit of $336 million the year before.
2.3 Gap in existing research
It is evident from the literature review that the aspects of role and functions, corporate
governance, performance, profitability, cash flows, bailout by government of parastatals
in general and of airlines attracted attention of the researchers all over the world. All
these researches were based on economic analysis of their operations. This research
based on the accounting and financial analysis of operation of Air Namibia (Pty) Ltd and
its comparison with four (4) peer airlines from industry was undertaken to fill in this gap
existing literature.
62
2.4 Conclusion
The Government of the Republic of Namibia has created parastatals with sole aim of
providing goods and services to its people. These parastatals were created in different
sectors and within these sectors some have gained monopoly power while others
remained in the competitive market. There is a general expectancy from stakeholders
that parastatals within their jurisdiction should at least generate funds in order to finance
their operations and lessen the dependence on the Government funding while meeting
their objectives. This was not the case with some of the parastatals especially those
operating in the competitive market, because some have incurred massive losses and
some have performed very well.
The parastatals continuing incurring losses have led to public and politician to demand
to the Government to sell ownership in loss making parastatals so that they can become
profitable and saving tax payers’ money. The Government considers that the
contribution of these parastatals will be forfeited if the parastatals are sold to private
sector. It is not only in Namibia where parastatals are considered burden to the
Government, even some other Southern African countries have similar problems
especially in the airline industry where the airlines are not performing financially, but
have depended on Governments’ bailout to fulfil their mandate.

63
Aviation industry is a volatile industry, whose performance is affected by a number of
factors that either hinder the performance or enhance the performance. The previous
studies indicated that operating in the aviation industry had more hindering factors than
enhancing factors. Hindering factors are such as legislations in different countries, jet
fuel price fluctuations, and countries’ political instability. Since, the airline trades on
global economies; they are subjected by the international competition from other airlines
and these competitions affect the performance of each individual airline.
Some literature indicates that an airline can be more efficient if the airlines’ board of
directors consists of qualified professionals in their fields such as chartered accountants,
lawyers, aeronautical engineers and business professionals, and if the board of directors
complies with the corporate governance requirements. An airline with a board of
directors consisting of professionals has a greater chance of being managed prudently
than an airline whose board of directors does not have professional management
competencies.
The majority of the airlines in all the continents experience cash flow problems due to
escalating operating costs, which in some airlines exceeds the revenue generated by
airline. The majority rely on their government to bail them out in order to finance
operations and others rely on their government to provide the guarantee for business

64
loan. However, such measures are feasible only in short run. In the long run, like other
commercial enterprises they have to breakeven and raise resources from their revenue.

65
CHAPTER 3
Research Methodology
3.1 Introduction
This chapter covers the research design and methodology, including population
sampling, data analysis and ethical considerations in research. Research methodology in
common parlance refers to a method used in search for knowledge. Redman and Mory
(2004) define research methodology as “a careful investigation or inquiry especially
through search for new facts in any branch of knowledge”. They further state that
research means a “systematized effort to gain new knowledge”. Some people consider
research as a movement, a movement from the known to the unknown (Redman &
Mory, 2004). It is actually a voyage of discovery. We all possess the vital instinct of
inquisitiveness for, when the unknown confronts us, we wonder and our inquisitiveness
makes us probe and attain full and fuller understanding of the unknown. This
inquisitiveness is the mother of all knowledge and the method, which a person employs
for obtaining the knowledge of whatever the unknown, can be termed as research.
Research is an academic activity and as such the term should be used in a technical
sense.
According to Clifford and Woody (2003), research comprises defining and redefining
problems, formulating hypothesis or suggested solutions; collecting, organising and
evaluating data; making deductions and reaching conclusions; and at last carefully
testing the conclusions to determine whether they fit the formulated hypothesis.

66
Slesinger and Stephenson (2006) define research as “the manipulation of things,
concepts or symbols for the purpose of generalising to extend, correct or verify
knowledge, whether that knowledge aids in construction of theory or in the practice of
an art. Research is, thus, an original contribution to the existing stock of knowledge
making for its advancement. It is the pursuit of truth with the help of study, observation,
comparison and experiment. In short, the search for knowledge through objective and
systematic method of finding solution to a problem is research. The systematic approach
concerning generalisation and the formulation of a theory is also research. As such the
term ‘research’ refers to the systematic method consisting of enunciating the problem,
formulating a hypothesis, collecting the facts or data, analysing the facts and reaching
certain conclusions either in the form of solution(s) towards the concerned problem or in
certain generalisations for some theoretical formulation. One can also define research as
a scientific and systematic search for pertinent information on a specific topic. In fact,
research is an art of scientific investigation.
The purpose of research is to discover answers to questions through the application of
scientific procedures. The main aim of research is to find out the truth which is hidden
and which has not been discovered as yet. Though each research study has its own
specific purpose, we may think of research objectives as falling into following broad
groupings:
To gain familiarity with a phenomenon or to achieve new insights into it (studies
with this objective in view are termed as exploratory research studies);

67
To portray accurately the characteristics of a particular individual, situation or a
group (studies with this objective in view are known as descriptive research
studies);
To determine the frequency with which something occurs or with which it is
associated with something else (studies with this objective in view are known as
diagnostic research studies);
To test a hypothesis of a causal relationship between variables (such studies are
known as hypothesis-testing research studies).
3.2 Research Design
Research design can be thought of as the structure of research. It is the glue that holds all
of the elements in a research study together. Burns and Grove (2003) define a research
design as “a blueprint for conducting a study with maximum control over factors that
may interfere with the validity of the findings”. Parahoo (1997) describes a research
design as “a plan that describes how, when and where data are to be collected and
analysed”. He further defines a research design as “the researcher’s answering the
research question or testing the research hypothesis”.
Non-experimental research
According to Burns and Grove (2003), non-experimental research is used in studies
whose purpose is description and where it is unethical to manipulate the independent
variable. Non-experimental research is suitable for the study of people in nursing for

68
several reasons. First, due to ethical considerations manipulation of the human variable
is not acceptable because of the potential for physical or mental harm to the participants.
Secondly, human characteristics are inherently not subject to experimental manipulation,
such as health beliefs and opinions. Thirdly, research constraints such as time, personnel
and the type of participants, make non-experimental research more feasible. Lastly,
qualitative studies do not interfere with the natural behaviour of participants being
studied; the type of research questions would not be appropriate for an experimental
research.
Qualitative research
Burns and Grove (2003) describe a qualitative approach as “a systematic approach used
to describe life experiences and situations to give them meaning”. They further state that
qualitative research focuses on the experiences of people as well as stressing uniqueness
of the individuals. Holloway and Wheeler (2002) refer to qualitative research as “a form
of social enquiry that focuses on the way people interpret and make sense of their
experiences and the world in which they live”. Researchers use the qualitative approach
to explore the behaviour, perspectives, experiences and feelings of people and emphasise
the understanding of these elements.

69
Exploratory research
According to Holloway and Wheeler (2002), explorative studies are undertaken when a
new area is being investigated or when little is known about an area of interest. It is used
to investigate the full nature of the phenomenon and other factors related to it.
Descriptive research
According to Burns and Grove (2003), descriptive research is designed to provide a
picture of a situation as it naturally happens. It may be used to justify current practice
and make judgment and also to develop theories.
Quantitative research
Quantitative research refers to the systematic empirical investigation of social
phenomena via statistical, mathematical or numerical data or computational techniques.
The objective of quantitative research is to develop and employ mathematical models,
theories and/or hypotheses pertaining to phenomena. The process of measurement is
central to quantitative research because it provides the fundamental connection between
empirical observation and mathematical expression of quantitative relationships.
Quantitative data is any data that is in numerical form such as statistics and percentages
(Babbie, 2010).
This research is mainly a quantitative study on cash flows and operating losses of a
parastatal focused on Air Namibia (Pty) Ltd. The research study focused on five year

70
period starting from 01 April 2006 to 31 March 2011. The quantitative design used was
mainly based on ratio analysis, interpretation of those ratios and qualitative information
relevant to the operations of the airline. The ratios were calculated using Microsoft
Excel. The study was based on quantitative and qualitative information mainly to
explore the subject stated above. The research study provides a good understanding of
the state of affairs and its operations to Air Namibia (Pty) Ltd management, the
Government as sole shareholder and other stakeholders interested in research subject.
The management, shareholder and stakeholders shall get an opportunity from this
research to learn from other airlines on their financial performance. Other airlines such
as Kenya Airways, British Airways, Fly Emirates and US Airways and their financial
information was studied together with Air Namibia (Pty) Ltd and comparisons among
these airlines were drawn. The research provides information to stakeholders for
understanding Air Namibia (Pty) Ltd’s operations and reasons why Air Namibia (Pty)
Ltd continues to face cash flow problems, continues to receive government bailout and
continues making losses in comparison with other airlines.
3.3 Population
The population for a study is the total members of a defined class of people, objects,
places or events selected, because they are relevant to the research study. Population for
this study consisted of the entire airlines industry in Africa, Europe, Asia and North
America. The population was viewed from different continents with the sole purpose to
highlight the factors that might have been impacting on one airline in the continent in

71
comparison to another airline in another continent. The researcher also tried to determine
the similarities and differences in airlines performance in different continents.
3.4 Sample
A sample is a subset of the population that is used to represent the entire group as a
whole. When doing research, it is often impractical to survey every member of a
particular population because the sheer number of entities may be simply too large.
Therefore, sampling is the process of selecting units (e.g. people, organizations) from a
population of interest so that by studying the sample one may fairly generalize the
results back to the population from which they were chosen. There are several different
ways of choosing sample from population, from simple to complex. The sampling
techniques can be broadly divided into two groups, non probability sampling techniques
and probability sampling techniques (Labarre, 2013).
Non-probability Sampling Techniques
Non-probability sampling is a sampling technique where the samples are gathered in a
process that does not give all the individuals in the population equal chances of being
selected. Commonly used methods are reliance on available subjects, purposive or
judgement sampling, snow ball sampling and quota sampling (Doherty, 1994).
Reliance on Available Subjects - Relying on available subjects, such as stopping
people on a street corner as they pass by, is one method of sampling. It is an extremely
72
risky method and comes with many cautions. This method, sometimes referred to as a
convenience sample, does not allow the researcher to have any control over the
representativeness of the sample. It is only justified if the researcher wants to study the
characteristics of people passing by the street corner at a certain point in time or if other
sampling methods are not possible. The researcher must also take caution to not use
results from a convenience sample to generalize to a wider population (Crossman.
2011).
Purposive or Judgmental Sample - A purposive, or judgmental sample is one that is
selected based on the knowledge of a population and the purpose of the study. For
example, if a researcher is studying the nature of school spirit as exhibited at a school
pep rally, he or she might interview people who did not appear to be caught up in the
emotions of the crowd or students who did not attend the rally at all. In this case, the
researcher is using a purposive sample because those being included in the sample fit the
specific purpose or description (Tongco, 2007).
Purposive sampling method was applied for the selection of the airlines, and the airlines
were selected based on the knowledge of the population and the purpose of the study.
The airlines selected included besides Air Namibia (Pty) Ltd, one airline from Africa,
Kenya Airways, one from Europe British Airways, one from North America US
Airways, and one from Asia Fly Emirates. These four airlines were selected each from a
different continent and their financial information was studied and analysed for better

73
understanding of different airlines’ operations. The airlines in sample were purposively
selected by the researcher based on their performance background or known for better or
worse performance in the airline industry. They were also selected based on their
ownership, because some were government owned and some were privately owned. The
airlines selected were based on different continents, because the research was to
determine whether all the airlines were exposed to similar industry risks or these were
only relating to specific continents or airlines. These four airlines were thus selected so
that their results of operations could be compared to Air Namibia (Pty) Ltd to draw
meaningful conclusions.
3.5 Research Instruments
Quantitative information was gathered from the five (5) airlines annual financial
statements for the period 01 April 2006 to 31 March 2011. Reports of auditors,
consultants and expert groups were also consulted. Secondary data from Air Namibia
(Pty) Ltd annual financial statements for the period 01 April 2006 to 31 March 2011
were analysed first to determine the existing trends of income flows, profitability flows
and operating, financing and investing cash flows. Income statements for the same
period were also analysed to identify significant trends in income flows, cost flows and
profitability. For the same period the annual financial statements of Kenya Airways,
British Airways, Fly Emirates and US Airways were also gathered and the same analysis
was applied on these statements also. The annual financial statements of all the airlines
were reduced to financial ratios to eliminate any difference in size and difference in

74
currency, and to make them comparable to each other. The information used in reducing
the annual financial statements into comparable ratios was obtained from each respective
airlines website. The qualitative information about the operations of the airlines was also
obtained from the airlines website and financial statements. The abridged financial
statements from 1st April 2006 to 31st March 2011 are given as Annexure I containing
Income Statement and Statement of Financial Position and Annexure II containing Cash
Flow Statement respectively.
3.6 Procedure
The researcher collected secondary data from Air Namibia (Pty) Ltd’s annual financial
statements for five years starting from 01 April 2006 to 31 March 2011. Similar data
were collected from each of the airlines such as Kenya Airways, British Airways, Fly
Emirates and US Airways for the same period and similar analysis was applied to the
financial statements of all the airlines and interpreted as such.
3.7 Data analysis and Interpretation
The data analysis was done using ratio analysis on Microsoft Excel. Ratio analysis
evaluates relationships among financial statements items and identifies existing trends.
The ratios were compared between different statements for five financial years to get the
trend and relationship over the financial years. The researcher applied the same ratios to
each of the airline’s annual financial statements for the same period and the existing
trends and relationships were compared to Air Namibia (Pty) Ltd. Besides ratio analysis

75
three management models, DuPont analysis, Benchmark analysis and Root cause
analysis were used to provide greater depth to the analysis.
The researcher interpreted the financial ratios according to the meaning of the financial
ratios. The researcher tried to understand the financial ratios actual meaning and the
results of the financial ratios were interpreted as they should be and proper explanations
were provided by the researcher. This provided a firm basis for the identification of root
cause of the profitability and cash flow problems faced by Air Namibia (Pty) Ltd. This
formed the basis of suggested plan of action.
3.8 Validity and Reliability
Validity and reliability form the core requirement of financial analysis.
Validity
Validity refers to measurement of a variable. A finding is said to be valid if the method,
approach and technique used for measurement of a variable accurately measures it. To
ensure validity of measurement the standard financial analysis techniques and measures
recognised for reliable and correct indication of status and change were used. Ratios
used as indicators were supported with definitions from standard texts (Sarndal,
Swensson and Wretman, 2004).

76
Reliability
Reliability refers to consistency in collection, analysis and interpretation of data. It is a
measurement of variability of results over repeated trials. To ensure reliability data were
drawn directly from annual financial statements and other reports available on the
websites of the airline companies. Further, the data were checked for their
comparability. The information drawn from various sources has been appropriately cited
in the text (Sarndal et al, 2004).
3.9 Research Ethics
Ethics in the context of research is referred to as a set of standards that guide researcher
on how the researcher interacts with research participants. The ethics guidelines of the
University of Namibia were observed by the researcher in the process of collection of
data, data analysis and drawing conclusions.
Ethics are norms or standards of behaviour that guide moral choices about our behaviour
and our relationships with others. The goal of ethics in research is to ensure that no one
is harmed or suffers adverse consequences from research activities. This objective is
usually expected to be achieved in all research. However, unethical activities are
pervasive and include violating non-disclosure agreements, breaking respondent
confidentiality, misrepresenting results, deceiving people, invoicing irregularities, etc.

77
In the present study the ethic guidelines of the University of Namibia were observed, by
obtaining informed consent of participants and maintaining anonymity and
confidentiality of information at all levels of research.
Informed Consent
All research participants were provided with information about the research, its purpose,
how it would be carried out and their right to participate or not participate in research.
The research findings will be shared with the participants.
Anonymity:
All participants were assured that their names will not be revealed in the report, and their
identity was protected. All information relating to airlines financial statements were kept
under strict confidentiality and none other than the researcher was allowed to have
access to it. Only publicly available information is disclosed in this report.
Confidentiality:
Financial records were not shared with anyone. These were securely stored and were
destroyed after the research was completed. The information in researcher’s computer
was password protected. There was no unauthorized access to the information. A
definite assurance was given to all participants and their trust was maintained.

78
3.10 Conclusion
The sample airlines were selected from different continents and financial information
drawn from their annual financial statements for the relevant period was analysed and
compared in this research with the sole aim to study and point out the factors that might
have prevented Air Namibia (Pty) Ltd from being profitable and avoid cash flow
problems. Purposive sampling method was used for this purpose. Only secondary data
were used in this research. The relevant data drawn were analysed and interpreted to
necessary conclusions.
79
CHAPTER 4
Analysis and Discussion
4.1 Introduction
Airline industry is one of the fastest growing and highly competitive industries of the
world. In the wake of globalisation air travel has grown and expanded in domestic as
well as international sector. At the same time competition has forced airlines to adopt a
variety of strategies to cut costs and remain profitable. Smaller airlines have merged
with other airlines; a new segment ‘budget airlines’ or ‘no frills airlines’ has emerged to
provide low fare air travel; some public sector airlines have been privatised etc.
However, national airlines in Asia and Africa are trying hard to survive and grow facing
the hot winds of competition. Air Namibia is one such airline. Besides domestic sector,
it is active in international sector also. However, since inception, it has been making
losses and facing cash flow problems. Comparative analysis of profitability and cash
flows in Air Namibia (Pty) Ltd with its peers is the subject matter of this chapter.
The analysis focuses on profitability and cash flows both. Ratio analysis has been used
as a primarily technique for analysis of profitability and cash flows. Three management
models, DuPont analysis, benchmark analysis and root cause analysis/ Pareto analysis
have been used to sharpen the focus of the analysis of profitability and cash flows.
The research is based on a comparative study of Air Namibia with four other airlines
viz. Kenya Airways, British Airways, Fly Emirates and US Airways each from a

80
different continent, to identify the factors driving profitability and cash flows in airline
industry. Data for analysis have been drawn from published annual financial statements
of the companies for five years period from the financial year ending 31st March 2007 to
31st March 2011.
Data for same financial years were taken in order to ensure comparability. It was
observed that for Air Namibia (Pty) Ltd, Kenya Airways, British Airways and Fly
Emirates the financial years were 01 April - 31 March and for US Airways the financial
year was 01 January - 31 December each year. Thus, US Airways’ had financial year
end which was different from other airlines. For US Airways therefore the data of year
ending 31 December 2006 to 2010 were compared with rest of the airlines as on 31
March 2007 to 2011. The researcher did not perceive any difference in comparability
due to such an adjustment. The abridged financial statements of five airlines for five
years period are given as annexure I.
The airlines under study have different denominated currencies: Air Namibia
information was reported in Namibia Dollar, Kenya airways in Kenya Shilling, British
Airways in British Pound Sterling, Fly Emirates in Dirham, and US Airways in US
Dollar. The data analysis disregarded these differences in currencies since ratio analysis
was used for comparison, which eliminated the difference in currencies and made the
ratios comparable to each other.
81
Air Namibia’s source of funds has been the bailouts from the government and overdrafts
from local banks. Since the airline is wholly owned by the Government of Namibia it
cannot raise funds by issuing shares. The airline does not own valuable assets and as
such, is not able to borrow on long term basis, but can only borrow on short term basis
with the guarantees provided by the government. Kenya Airways raised funds by
borrowing on both long term and short term as the airline had assets, which can be given
as security for the loans. Kenya Airways also raised funds by issuing shares to public
and the shares provided most of the capital. Kenya Airways is owned by the European
airline KLM. It, therefore, does not get government bailouts. British Airways also
borrows on short term and long term basis, since it has assets to be held as security for
the loans and the airline has also issued shares to public to raise needed equity funds.
British Airways also does receive government bailouts. Fly Emirates borrows on short
term and long term basis both, but did not issue shares, neither receives government
bailouts. US Airways borrows on long term and short term basis both. But, it did not
issue shares to public. It raised additional capital from existing owners. US Airways
receives no government bailouts. The airlines that borrow on short term and long term
basis pay market related interest on borrowed money and those that issued shares pay
dividend to their shareholders, while for government bailouts and interest free loans no
payback is required
Air Namibia (Pty) Ltd leases all its aircraft, while Kenya Airways, British Airways, Fly
Emirates and US Airways have acquired through purchase the aircrafts that they are

82
using in operations. Air Namibia (Pty) Ltd pays monthly rental and maintenance on
leased aircraft, while other airlines pay only for the maintenance of the aircraft.
All airlines are required to pay taxes to their governments. Kenya Airways, British
Airways, Fly Emirates and US Airways all paid income tax to their governments in the
years they realised profit. Air Namibia is not required to pay for income tax, as the
airline does not make profit. Thus, none of the airlines is exempted from paying income
tax. Only when an airline did not make profit it is not required to pay income tax.
None of the airline received subsidy on fuel from their government. Each airline
purchased fuel at market price. The jet fuel price per litter differs from country to
country depending on the country’s jet fuel supply.
4.2 Data Analysis
Financial analysis was used for the analysis of data. In this form of analysis data from
different sources are gathered, reviewed, and then analyzed to form some sort of
findings or conclusions. There are a variety of ratios identified by their focus as
profitability ratios, activity ratios, financial ratios, solvency ratios, owners’ ratios,
creditors’ ratios; by period of analysis as long term ratios and short term ratios.
The researcher calculated financial ratios using Microsoft Excel. Air Namibia (Pty) Ltd,
British Airways, Kenya Airways, Fly Emirates and US Airways annual financial
statements were analysed using ratio analysis technique and compared. The researcher
83
also evaluated the relationship among financial statement items and identified trend and
composition of data.
4.3 Ratio Analysis
The process of evaluating data using analytical and logical reasoning to examine each
component of the data provided is known as ratio analysis (Levine, 1982). Ratio analysis
is an important tool for analyzing the company's financial performance. The following
are the reasons why the accounting ratio analysis was used in this study:
Analyzing financial statements
Ratio analysis is an important technique of financial statement analysis. Accounting
ratios are useful for understanding the financial position of the company. Different users
such as investors, management, bankers and creditors use the ratios to analyze the
financial situation of the company for their decision making purpose.
Judging Efficiency
Accounting ratios are important for judging the company's efficiency in terms of its
operations and management. They help judge how well the company has been able to
utilize its assets and earn profits.
84
Locating Weakness
Accounting ratios are also used in locating weakness of the company's operations, even
though its overall performance may be quite good. Management can then pay attention
to the weakness and take remedial measures to overcome them.
Formulating Plans
Although accounting ratios are used to analyze the company's past financial
performance, they can also be used to establish future trends of its financial
performance. As a result, they help formulate the company's future plans.
Comparing Performance
It is essential for a company to know how well it is performing over the years and as
compared to the other firms of similar nature and in the same risk class. Besides, it is
also important to know how well its different divisions are performing among
themselves in different years. Ratio analysis facilitates such comparison (Loth, 2004).
4.4 Profitability Analysis
Profitability analysis is the process of comparing income to output or income to
investment and determining how much profit was made during a specific time period
(Loth, 2004). This helps determine the effectiveness of management, identify areas that
need to be re-evaluated and decide the viability of business as a whole. When
completing profitability analysis, it is also important to analyse the costs. This includes
85
hard costs such as supplies, buildings, utility bills, advertising payments, salaries, and so
forth and also soft costs such as cost of capital etc.
Profitability has been analysed here in terms of earnings before interest, depreciation and
amortization, earnings before interest and tax, earnings before tax, earnings after tax
and, other comprehensive incomes. The profitability of the five airlines under study is
shown under comparative form in table 4.1 to table 4.5.
4.4.1 Earnings before Interest, Tax, Depreciation and Amortization
Earnings before Interest, Tax, Depreciation and Amortization (EBITDA) is an
approximate measure of company's operating cash flow based on data from company's
income statement (Crowd, 2008). This is calculated by looking at earnings before the
deduction of interest expenses, taxes, depreciation, and amortization. This earnings
measure is of particular interest in cases where companies have large amounts of fixed
assets which are subject to heavy depreciation charge such as manufacturing companies
or in cases where a company has a large amount of acquired intangible assets on its
books and is thus subject to large amortization charge such as a company that has
purchased a brand or a company that has recently made a large acquisition (Crowd,
2008). Since the distortion of accounting and financing effects on company earnings do
not factor into EBIDTA, it is a good way of comparing companies within and across
industries. This measure is also of interest to company's creditors, since EBIDTA is
essentially the income that a company has free for interest payments.

86
Table 4.1: Earnings before Interest, Tax, Depreciation and Amortization of selected
Airlines (EBITDA)
Air
Namibia
(Pty) Ltd
Mar-07 Mar-08 Mar-09 Mar-10 Mar-11 Average
000 000 000 000 000 000
Revenue (N$)
854,122 1,028,590 1,298,043 1,165,463 1,218,708 1,112,985
Expenditure
-1,097,162 -1,237,600 -1,835,102 -1,452,422 -1,613,382 -1,447,134
Depreciation
2,152 1,210 2,735 2,114 3,657 2,374
EBITDA
-240,888 -207,800 -534,324 -284,845 -391,017 -331,775
Kenya Airways Revenue
(KES)
58,792 60,471 62,947 62,838 85,836 66,177
Expenditure
-41,335 -43,924 -67,787 -68,904 -80,021 -60,394
Depreciation
594 593 3,917 4,632 3,894 2,726
EBITDA
18,051 17,140 -923 -1,434 9,709 8,509
British
Airways Revenue (£)
8,492 8,753 8,992 7,994 9,987 8,844
Expenditure
-7,936 -7,878 -9,212 -8,225 -9,469 -8,544
Depreciation
714 692 694 732 683 703
EBITDA
1,270 1,567 474 501 1,201 1,003
Fly
Emirates Revenue
(AED)
28,643 36,441 42,674 42,477 53,098 40,667
Expenditure
-25,834 -33,630 -41,122 -39,890 -48,943 -37,884
Depreciation
1,352 1,701 2,211 2,811 3,600 2,335
EBITDA
4,161 4,512 3,763 5,398 7,755 5,118
US
Airways Revenue
(US$)
279 12,118 10,458 11,908 13,294 9,611
Expenditure
-238 -13,918 -10,340 -11,127 -12,928 -9,710
Depreciation
8 215 242 248 292 201
Amortization
622
EBITDA
50 -963 360 1,029 658 102
Source: Calculations based on data collected from Air Namibia (Pty) Ltd, Kenya
Airways, British Airways, Fly Emirates and US Airways website during June 2013.

87
Air Namibia (Pty) Ltd had negative earnings before interest, tax, depreciation and
amortization of about N$ -331.7 million on average. The rest of the airlines had positive
earnings before interest, tax, depreciation and amortization. This indicated that Air
Namibia (Pty) Ltd is not generating enough earnings in order to be able to pay interest
on borrowing as it falls due. The earnings are not enough to cover non-cash items such
as depreciation. Air Namibia (Pty) Ltd’s direct expenditures are high and are exceeding
the revenue generated and resulted in negative earnings. Air Namibia (Pty) Ltd negative
earnings are as such financed by Government bailouts. With the government bailouts it
is able to pay interest it falls due. Other airliners are generating enough earnings and are
able to pay interest, and tax these falls due.
4.4.2 Earnings before Interest and Tax
Levine (1982) defines, Earnings before Interest and Taxes (EBIT), as a ‘‘measure of
company's earning power from ongoing operations, equal to earnings before deduction
of interest payments and income taxes’’. However, EBIT excludes income and
expenditure from unusual, non-recurring or discontinued activities.

88
Table 4.2: Earnings before Interest and Tax of selected Airlines
Air
Namibia
(Pty) Ltd
Mar-07 Mar-08 Mar-09 Mar-10 Mar-11 Average
000 000 000 000 000 000
Revenue (N$)
854,122 1,028,590 1,298,043 1,165,463 1,218,708 1,112,985
Expenditure
(N$)
-1,097,162 -1,237,600 -1,835,102 -1,452,422 -1,613,382 -1,447,134
EBIT (N$)
-243,040 -209,010 -537,059 -286,959 -394,674 -334,148
Kenya Airways Revenue
(KES)
58,792 60,471 62,947 62,838 85,836 66,177
Expenditure
(KES)
-41,335 -43,924 -67,787 -68,904 -80,021 -60,394
EBIT (KES)
17,457 16,547 -4,840 -6,066 5,815 5,783
British
Airways
Revenue (£)
8,492 8,753 8,992 7,994 9,987 8,844
Expenditure
(£)
-7,936 -7,878 -9,212 -8,225 -9,469 -8,544
EBIT (£)
556 875 -220 -231 518 300
Fly
Emirates Revenue
(AED)
28,643 36,441 42,674 42,477 53,098 40,667
Expenditure
(AED)
-25,834 -33,630 -41,122 -39,890 -48,943 -37,884
EBIT (AED)
2,809 2,811 1,552 2,587 4,155 2,783
US
Airways Revenue
(US$)
279 12,118 10,458 11,908 13,294 9,611
Expenditure
(US$)
-238 -13,918 -10,340 -11,127 -12,928 -9,710
EBIT (US$)
42 -1,800 118 781 366 -99
Source: Calculations based on data collected from Air Namibia (Pty) Ltd, Kenya
Airways, British Airways, Fly Emirates and US Airways website during June 2013.

89
Air Namibia (Pty) Ltd have negative earnings before interest and tax of about N$ -334.1
million on average. This indicates that Air Namibia (Pty) Ltd is not able to breakeven, as
its earnings before interest and tax are negative, its direct expenditure exceeded
generated revenues from operations and it depends on government bailouts in order to be
able to pay direct operating expenses as they fall due. Other airliners are able to generate
positive earnings from operational activities and are capable of paying direct operating
expenses as this fall due without government assistance.
4.4.3 Earnings before Tax
Earnings before taxes (EBT) can be defined as the money retained by a company before
deducting the money due to be paid as taxes (Crowd, 2008). The Earnings before Tax
quantifies the operating and non-operating profits of a company before taxes are
considered. It is similar to profits before taxes. Moreover, this performance indicator
provides a level measure to compare companies in distinctive tax jurisdictions. The EBT
holds great significance for investment analysts as it provides them with useful
information required for evaluating a business entity’s operating performance without
considering the tax implications. By removing the tax factor, Earnings before Tax are
helpful in minimizing a variable which might differ for various companies, so as to
focus the analysis on operating profitability as a remarkable quantification of
performance. This type of analysis is important, specifically, when comparing
companies across a single industry.

90
Table 4.3: Earnings before Tax of selected Airlines
Air Namibia
Mar-07 Mar-08 Mar-09 Mar-10 Mar-11 Average
000 000 000 000 000 000
EBT (N$)
-104 823 -377 063 -323 658 -95 311 -405 465 -261 264
Kenya Airways
EBT (KES)
5 975 5 513 -5 664 2 671 5 002 2 699
British
Airways
EBT (£)
611 883 -401 -531 679 248
Fly Emirates
EBT (AED)
3 326 5 104 9 602 3 665 5 543 5 448
US Airways
EBT (US$)
37 -2 210 -243 502 115 -360
Source: Calculations based on data collected from Air Namibia (Pty) Ltd, Kenya
Airways, British Airways, Fly Emirates and US Airways website during June 2013.
Air Namibia (Pty) Ltd earnings before tax is N$ -261.2 million on average. This
indicated that the airline had been making loss throughout the period before it could pay
for interest and tax. Kenya Airways had only made negative EBT in 2009 with an
amount of -5 664 Million Kenya Shillings. British Airways had negative EBIT in 2009
and 2010 and for other years it had positive EBT. Fly Emirates had positive EBT
throughout the study period and US Airways had negative EBT in 2008 and 2009.

91
4.4.4 Earnings after Tax
Earnings after tax (EAT) can be defined as the money retained by a company after
deducting tax (Loth, 2004). The Earnings after Tax may be used by an organisation to
reinvest and pay dividend to shareholders.
Table 4.4: Earnings after Tax of selected Airlines
Air Namibia
(Pty) Ltd
Mar-07 Mar-08 Mar-09 Mar-10 Mar-11 Average
000 000 000 000 000 000
Loss before Tax
(N$)
-104,823 -377,063 -323,658 -95,311 -405,465 -261,264
Tax (N$)
0 0 0 0 0 0
EAT (N$)
-104,823 -377,063 -323,658 -95,311 -405,465 -261,264
Kenya Airways Profit (loss) before
Tax (KES)
5,975 5,513 -5,664 2,671 5,002 2,699
Tax (KES)
-1,877 -1,644 1,581 -636 -1,464 -808
EAT (KES)
4,098 3,869 -4,083 2,035 3,538 1,891
British Airways Profit (loss) before
Tax (£)
611 883 -401 -536 679 247
Tax (£)
-173 -187 43 106 -7 -44
EAT (£)
438 696 -358 -430 672 204
Fly Emirates Profit before Tax
(AED)
3,326 5,104 9,602 3,665 5,543 5,448
Tax (AED)
-163 -29 -85 -50 -78 -81
EAT (AED)
3,163 5,076 9,517 3,615 5,465 5,367
US Airways Profit (loss) before
Tax (US$)
37 -2,210 -243 502 115 -360
Tax (US$)
-26 0 38 0 0 2
EAT (US$)
11 -2,210 -205 502 115 -357
Source: Calculations based on data collected from Air Namibia (Pty) Ltd, Kenya
Airways, British Airways, Fly Emirates and US Airways website during June 2013.

92
Air Namibia (Pty) Ltd had negative earnings after tax of N$ - 261.2 million. Since, the
airline was not making profit and was not expected to pay tax and its earnings remained
equal to earnings before tax. US Airways also did not generate profit for all the five
years under study. Therefore it paid tax for two years it generated profit and for three
years it got tax shield. The rest of the airlines were generating profit after tax which was
attributable to their shareholders.
4.4.5 Other Comprehensive Income
Other comprehensive income represents income from activities other than normal
business operations, such as interest on investment, foreign exchange gains, rent income,
profit from sale of non-inventory assets etc.
Table 4.5: Other Comprehensive Income of selected Airlines
Air Namibia
(Pty) Ltd
Mar-07 Mar-08 Mar-09 Mar-10 Mar-11 Average
000 000 000 000 000 000
Other
Comprehensive
Income
9,605 54,481 58,204 40,711 10,161 34,632
Sales Revenue
854,122 1,028,590 1,298,043 1,165,463 1,218,708 1,112,985
Other
Comprehensive
Income as % of
Sales Revenue 1% 5% 4% 3% 1% 3%
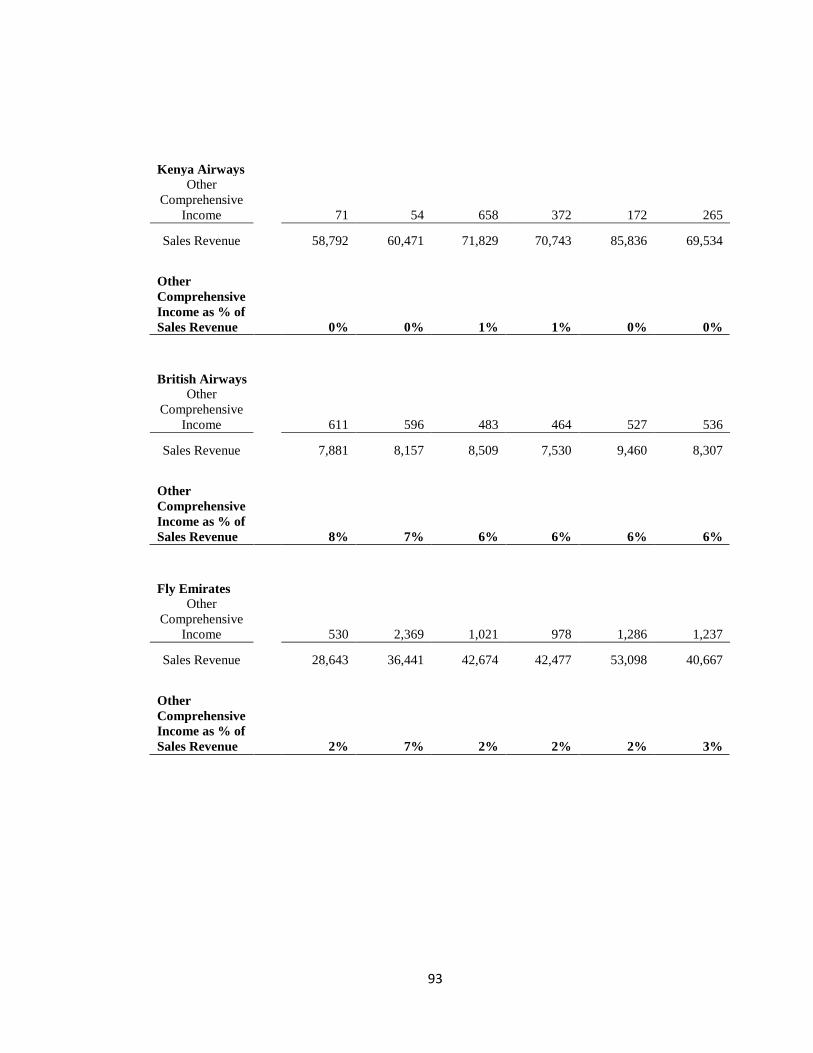
93
Kenya Airways
Other
Comprehensive
Income
71 54 658 372 172 265
Sales Revenue
58,792 60,471 71,829 70,743 85,836 69,534
Other
Comprehensive
Income as % of
Sales Revenue 0% 0% 1% 1% 0% 0%
British Airways
Other
Comprehensive
Income
611 596 483 464 527 536
Sales Revenue
7,881 8,157 8,509 7,530 9,460 8,307
Other
Comprehensive
Income as % of
Sales Revenue 8% 7% 6% 6% 6% 6%
Fly Emirates
Other
Comprehensive
Income
530 2,369 1,021 978 1,286 1,237
Sales Revenue
28,643 36,441 42,674 42,477 53,098 40,667
Other
Comprehensive
Income as % of
Sales Revenue 2% 7% 2% 2% 2% 3%

94
US Airways
Other
Comprehensive
Income
6 395 342 347 356 289
Sales Revenue
279 12,118 10,458 11,908 13,294 9,611
Other
Comprehensive
Income as % of
Sales Revenue 2% 3% 3% 3% 3% 3%
Source: Calculations based on data collected from Air Namibia (Pty) Ltd, Kenya
Airways, British Airways, Fly Emirates and US Airways website during June 2013.
Air Namibia (Pty) Ltd had an average of 3 per cent of other comprehensive income over
sales revenue, which was equivalent to Fly Emirates and US Airways. British Airways
had 6 per cent other comprehensive income, which was highest ratio among all, while,
Kenya Airways had no other comprehensive income.
Profitability Ratio Analysis
Profitability ratios are a class of financial metrics that are used to assess a business's
ability to generate earnings as compared to its expenses and other relevant costs incurred
during a specific period of time. For most of these ratios, having a higher value relative
to a competitor's ratio or the same ratio from a previous period is indicative that the
company is doing well (Loth, 2004). The basis for measuring the profitability may be
sales revenue or net investment in assets or equity. When measured on the basis of sales
revenue it is sometimes called margin or margin on sales.
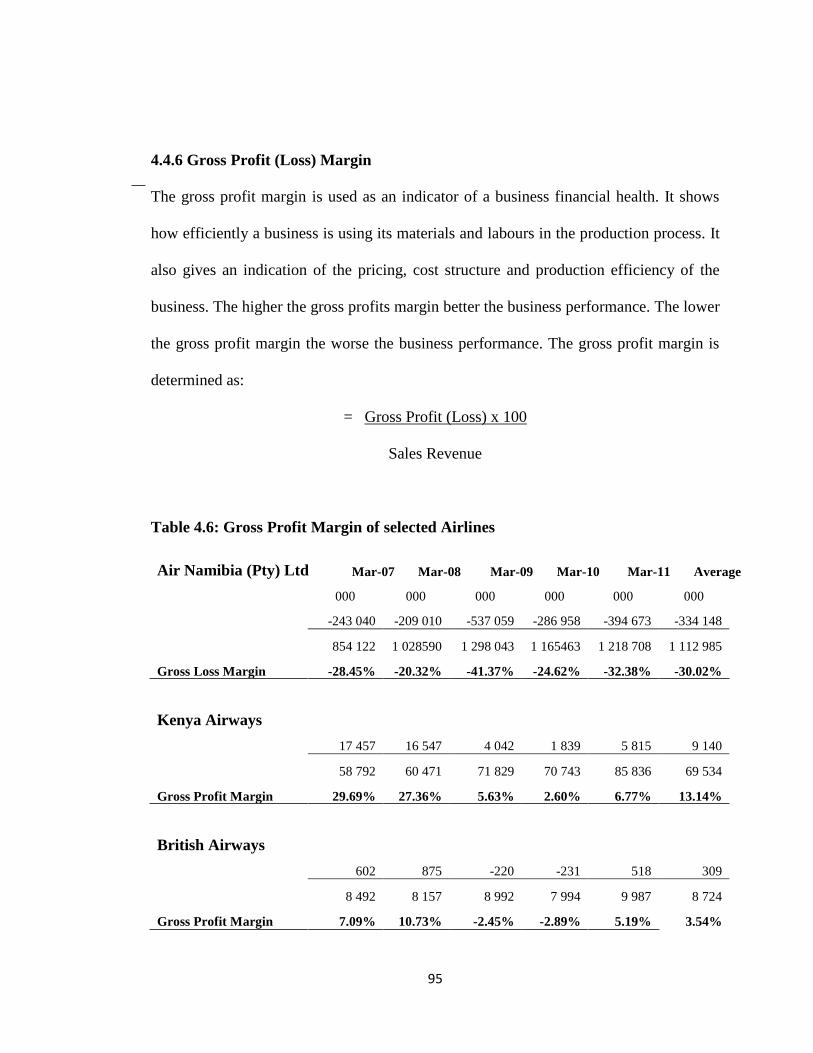
95
4.4.6 Gross Profit (Loss) Margin
The gross profit margin is used as an indicator of a business financial health. It shows
how efficiently a business is using its materials and labours in the production process. It
also gives an indication of the pricing, cost structure and production efficiency of the
business. The higher the gross profits margin better the business performance. The lower
the gross profit margin the worse the business performance. The gross profit margin is
determined as:
= Gross Profit (Loss) x 100
Sales Revenue
Table 4.6: Gross Profit Margin of selected Airlines
Air Namibia (Pty) Ltd Mar-07 Mar-08 Mar-09 Mar-10 Mar-11 Average
000 000 000 000 000 000
-243 040 -209 010 -537 059 -286 958 -394 673 -334 148
854 122 1 028590 1 298 043 1 165463 1 218 708 1 112 985
Gross Loss Margin -28.45% -20.32% -41.37% -24.62% -32.38% -30.02%
Kenya Airways
17 457 16 547 4 042 1 839 5 815 9 140
58 792 60 471 71 829 70 743 85 836 69 534
Gross Profit Margin 29.69% 27.36% 5.63% 2.60% 6.77% 13.14%
British Airways
602 875 -220 -231 518 309
8 492 8 157 8 992 7 994 9 987 8 724
Gross Profit Margin 7.09% 10.73% -2.45% -2.89% 5.19% 3.54%

96
Fly Emirates
3 338 5 180 2 573 3 565 5 441 4 019
28 643 36 441 42 674 42 477 53 098 40 667
Gross Profit Margin 11.65% 14.21% 6.03% 8.39% 10.25% 9.88%
US Airways
142 795 1 949 2 652 2 586 1 625
27 910 12 118 10 458 11 908 13 294 15 138
Gross Profit Margin 0.51% 6.56% 18.64% 22.27% 19.45% 10.73%
Source: Calculations based on data collected from Air Namibia (Pty) Ltd, Kenya
Airways, British Airways, Fly Emirates and US Airways website during June 2013.
Air Namibia (Pty) Ltd made losses throughout the period under study. The airline had
gross loss ranging from 20% to 41%. The gross loss indicated that the airline’s direct
operating cost exceeded the revenue generated by the airline. The airline had the highest
gross loss in 2009 at 41%, lowest in 2008 at 20% and average gross loss of 30%. This
gross loss is before administrative expenses are paid and for the airline to be able to pay
for its expenses government bailout was required. Kenya Airways had gross profit
margin average of 13%. The airline throughout the period realised gross profit, which
indicated that the airline revenue exceeded the operating costs. The airline had the
highest gross profit margin in 2007 at 29% and the lowest gross profit margin in 2010 at
2%. British Airways realised gross profit for 2007, 2008 and 2011, while in 2009 and
2010 the airline realised gross losses. Fly Emirates and US Airways both had gross
profit margin throughout the period.

97
4.4.7 Operating Profit Margin
The operating profit margin also known as earnings before interest and tax indicates how
much profit a company makes after paying for variable costs of production such as
wages and raw materials. It is expressed as a percentage of sales revenue and shows the
efficiency of a company in controlling the costs and expenses associated with business
operations. It is a measurement of what proportion of a company's revenue is left over,
before taxes and other indirect costs (such as rent, bonus, interest, etc.), but after paying
for variable costs of production such as wages, raw materials, etc. A wholesome
operating margin is needed for a company to be able to pay for its fixed costs, such as
interest on debt. A higher operating margin means that the company has less financial
risk (Wilkinson & Kashkari, 2013). The operating profit margin is determined as:
= Earnings before Interest and Tax x 100
Sales Revenue
Table 4.7: Operating Profit Margin of selected Airlines
Air Namibia (Pty) Ltd Mar-07 Mar-08 Mar-09 Mar-10 Mar-11 Average
000 000 000 000 000 000
-243 040 -209010
-537
059 -286958
-394
673
-334
148
854 122 1028590 1298043 1165463 1218708 1112985
Operating Loss
Margin -28.45% -20.32% -41.37% -24.62% -32.38% -30.02%

98
Kenya Airways
17 457 16 547 4 042 1 839 5 815 9 140
58 792 60 471 71 829 70 743 85 836 69 534
Operating Profit
Margin 29.69% 27.36% 5.63% 2.60% 6.77% 13.14%
British Airways
602 875 -220 -231 518 309
8 492 8 157 8 992 7 994 9 987 8 724
Operating Profit
Margin 7.09% 10.73% -2.45% -2.89% 5.19% 3.54%
Fly Emirates
3 338 5 180 2 573 3 565 5 441 4 019
28 643 36 441 42 674 42 477 53 098 40 667
Operating Profit
Margin 11.65% 14.21% 6.03% 8.39% 10.25% 9.88%
US Airways
142 795 1 949 2 652 2 586 1 625
27 910 12 118 10 458 11 908 13 294 15 138
Operating Profit
Margin 0.51% 6.56% 18.64% 22.27% 19.45% 10.73%
Source: Calculations based on data collected from Air Namibia (Pty) Ltd, Kenya
Airways, British Airways, Fly Emirates and US Airways website during June 2013.
The operating profit margin figures were the same as the gross profit margin for all the
airlines.
4.4.8 Returns to Total Assets
Returns to total assets are a measure of company's earnings after interest and tax (EAT)
against its net assets (Kenon, 2007). The ratio is considered indicator of effectiveness of

99
a company using its assets to generate earnings after contractual obligations are paid.
The greater a company's net earnings are in proportion to its assets the more effective the
company is using its assets to generate earnings. The return to total assets is determined
as:
= Earnings after Interest and Tax or Net Profit /Loss
Total Assets
Table 4.8: Returns to Total Assets of selected Airlines
Air Namibia (Pty)
Ltd
Mar-07 Mar-08 Mar-09 Mar-10 Mar-11 Average
000 000 000 000 000 000
-233 435 -154 529 -478 855 -246 248 -384 512 -299 516
187 089 336 944 386 157 347 164 358 733 323 217
Return to Total Assets -125% -46% -124% -71% -107% -93%
Kenya Airways
4 098 3 869 -4 083 2 035 3 538 1 891
73 291 77 034 76 380 74 621 76 003 75 466
Return to Total Assets 6% 5% -5% 3% 5% 3%
British Airways
304 694 -358 -425 672 177
11 724 11 254 10 806 10 583 11 023 11 078
Return to Total Assets 3% 6% -3% -4% 6% 2%
Fly Emirates
3 164 5 075 1 046 3 615 5 465 3 673
34 676 42 235 46 981 51 498 60 319 47 142
Return to Total Assets 9% 12% 2% 7% 9% 8%
US Airways
5 -2 210 -205 502 115 -359
343 3 784 7 334 7 637 7 738 5 367
Return to Total Assets 1% -58% -3% 7% 1% -7%
Source: Calculations based on data collected from Air Namibia (Pty) Ltd, Kenya
Airways, British Airways, Fly Emirates and US Airways website during June 2013.

100
The Air Namibia (Pty) Ltd realised the worst returns on its total assets, with an average
of -93 per cent. The loss was equal to 93 per cent on average dollar value of the average
assets of airline. However, on average Kenya airways, British airways, Fly emirates and
US airways realised 3, 2, 8 and -7 per cent respectively for each dollar value of their
average assets. Air Namibia (Pty) Ltd increased its assets progressively over the years
and the net loss also increased as the assets increased. As the assets increase, a company
is expected to realise better returns from the assets. Conversely, in Air Namibia (Pty)
Ltd as the assets base increased the loss increased realising diminishing returns on
assets. The airline returns were reciprocal to the assets of the airline. The rest of the
airlines were able to generate positive returns but in some years they also recorded loss.
In Fly Emirates as the assets increased the returns also increased and when the assets
reduced the returns also reduced, and as a result the returns were proportionate to its
assets.
4.4.9 Other Comprehensive Income to Earnings before Interest and Tax
The other comprehensive income to earnings before interest and tax ratio shows the
contribution of other comprehensive income towards the earnings before interest and
tax. Other comprehensive income to earnings before interest and tax ratio is calculated
as:
= Other Comprehensive Income
Earnings before Interest and Tax

101
Table 4.9: Other Comprehensive Income to Earnings before Interest and Tax of
selected Airlines
Mar-07 Mar-08 Mar-09 Mar-10 Mar-11 Average
Air Namibia (Pty)
Ltd -4% -35% -12% -17% -3% -14%
Kenya Airways 1% 1% -27% 43% 3% 4%
British Airways 100% 67% -120% -87% 78% 7%
Fly Emirates 6% 6% 46% 15% 5% 16%
US Airways 1% -9% 48% 6% 10% 11%
Source: Calculations based on data collected from Air Namibia (Pty) Ltd, Kenya
Airways, British Airways, Fly Emirates and US Airways website during June 2013.
Fly Emirates had the highest average ratio of 16 per cent of other comprehensive income
over earnings before interest and tax, followed by US Airways with the average ratio of
11 per cent, British Airways with average ratio of 7 per cent and Kenya Airways with
average ratio of 4 per cent. This indicated that Fly Emirates was holding huge
investment portfolio of assets from which it derived comprehensive income. Air
Namibia (Pty) Ltd also had high other comprehensive income to earnings before interest
and tax ratio with average of about 14 per cent, as a result its loss was reduced, and
otherwise it would have been more.
4.4.10 Income from Investments to Investments
Air Namibia (Pty) Ltd made certain investment to cover its specific requirements such as
security towards the fleet taken on lease, lease payments etc. the term of investment is as

102
per the term of lease. Other airlines though they have their own fleet make some short
term investments. The ratio of income from investments to investments is calculated as:
= Income from Investments
Investments
Table 4.10: Income from Investments to Investments of selected Airlines
Air Namibia
(Pty) Ltd
Mar-07 Mar-08 Mar-09 Mar-10 Mar-11 Average
000 000 000 000 000 000
9 605 54 481 58 204 40 711 10 161 34 632
47 350 155 487 152 141 136 755 56 676 109 682
Income to
Investments 20% 35% 38% 30% 18% 32%
Kenya Airways
71 54 658 372 172 265
2 106 1 879 2 981 2 877 2 952 2 559
Income to
Investments 3% 3% 22% 13% 6% 10%
British Airways
611 596 483 464 527 536
2 232 2 307 2 212 2 314 2 853 2 384
Income to
Investments 27% 26% 22% 20% 18% 22%
Fly Emirates
530 2 369 1 021 978 1 286 1 237
11 235 29 423 18 546 17 458 22 456 19 824
Income to
Investments 5% 8% 6% 6% 6% 6%
US Airways
6 395 342 347 356 289
152 5 965 6 036 6 012 7 152 5 063
Income to
Investments 4% 7% 6% 6% 5% 6%
Source: Calculations based on data collected from Air Namibia (Pty) Ltd, Kenya
Airways, British Airways, Fly Emirates and US Airways website during June 2013.

103
Air Namibia (Pty) Ltd had the highest average income over investments at 32 per cent,
followed by British Airways with 22 per cent while the rest of the airlines had it either
10 per cent or below. The high percentage indicated that Air Namibia (Pty) Ltd held
more investments that generated revenue for the airline. This is because the airline is
engaged in the operational lease of aircraft which are used for transporting passengers
and cargo. The airline is required to maintain security deposits for the leasing and these
investments produced income. Likewise British Airways had high income over
investments. If an airline has higher investments then its funds position is tight. The rest
of the airlines had lower comprehensive income over investments. This may be
attributed to airlines owning their own aircraft and not required to provide security
deposits on the aircraft.
From 2008 through to 2010, Air Namibia (Pty) Ltd was also engaged in fuel hedge in
order to minimize the impact of fluctuating global fuel price. These fuel hedge delivered
huge fuel gain for the period and resulted in higher returns on investments from 2008 to
2010.
4.4.11 Net Profit (Loss) Margin
Net profit margin is the percentage of revenue remaining after all operating expenses,
interest, taxes and preferred stock dividends except common stock dividends have been
deducted from a company's total revenue (Crowd, 2008). Shareholders look at net profit
margin closely because it shows how good a company is converting revenue into profits

104
available for shareholders (Crowd, 2008). In general, when a company's net profit
margin is declining over time, a myriad of problems could be to blame, ranging from
decreasing sales to poor customer experience to inadequate expense management. Net
profit margin is often used to compare companies within the same industry, in a process
known as "margin analysis" (Crowd, 2008). Net profit margin is a percentage of sales,
not an absolute number, so it can be extremely useful to compare net profit margins
among a group of companies to see which are most effective at converting sales into
profits. The net profit margin is determined as:
= Net (Loss) Profit
Sales revenue
Table 4.11: Net Profit (Loss) Margin of selected Airlines
Air Namibia (Pty)
Ltd
Mar-07 Mar-08 Mar-09 Mar-10 Mar-11 Average
000 000 000 000 000 000
-233 435 -154 529 -478 855 -246 248 -384 512 -299 516
854 122 1028 590 1 298 043 1165 463 1 218 708 1 112 985
Net Loss Margin -27.33% -15.02% -36.89% -21.13% -31.55% -26.91%
Kenya Airways
4 098 3 869 -4 083 2 035 3 538 1 891
58 792 60 471 71 829 70 743 85 836 69 534
Net Profit Margin 6.97% 6.40% -5.68% 2.88% 4.12% 2.72%

105
British Airways
304 694 -358 -425 672 177
8 492 8 157 8 992 7 994 9 987 8 724
Net Profit Margin 3.58% 8.51% -3.98% -5.32% 6.73% 2.03%
Fly Emirates
3 164 5 075 1 046 3 615 5 465 3 673
28 643 36 441 42 674 42 477 53 098 40 667
Net Profit Margin 11.05% 13.93% 2.45% 8.51% 10.29% 9.03%
US Airways
5 -2 210 -205 502 115 -359
27 910 12 118 10 458 11 908 13 294 15 138
Net Profit Margin 0.02% -18.24% -1.96% 4.22% 0.87% -2.37%
Source: Calculations based on data collected from Air Namibia (Pty) Ltd, Kenya
Airways, British Airways, Fly Emirates and US Airways website during June 2013.
Air Namibia (Pty) Ltd made constant loss for five years under review, while Fly
Emirates made profit for the five years and other airlines such as Kenya Airways, British
Airways and US Airways made profit in some years and loss in others. On average, Air
Namibia (Pty) Ltd and US Airways made loss for five years, while, rest of the airlines
made on average profit for the five years under review. Perhaps, 2009, was not a good
year for airline industry, since all the four airlines recorded loss, except for Fly Emirates
which recorded small profit.
106
4.4.12 DuPont Model
DuPont analysis examines the return on equity (ROE) analyzing profit margin, total
asset turnover, and financial leverage. It determines what is driving a company's ROE;
Profit margin shows the operating efficiency, asset turnover shows the asset use
efficiency, and leverage factor shows leverage being used. Bernhardt (2010) stated that
the method goes beyond profit margin to understand how efficiently a company's assets
generate sales or cash and how well a company uses debt to produce incremental returns.
Using these three factors, a DuPont analysis allows analysts to company performance,
efficiently determine where the company is weak and where strong and quickly know
what areas of the business to look at, such as inventory management, debt structure,
margin on sale for more answers. The model detects the reasons for high or low returns
on equity. If problems are identified, corrective action can be taken. Also if evidence of
good management is identified from the model, rewards can be given to encourage such
behaviour.
DuPont analysis is an extended analysis of a company's returns on equity. It concludes
that a company can earn a high return on equity if:
It earns a high net profit margin;
It uses its assets effectively to generate more sales; and/or
It has a high financial leverage;

107
Thus DuPont equation provides a broader picture of the returns the company is earning
on its equity, tells where a company's strength lies and where there is a room for
improvement; DuPont equation could be further extended by breaking up net profit
margin into EBIT margin, tax burden and interest burden. This five-factor analysis can
provide an even deeper insight.
The DuPont ratio is determined as:
Return on Equity = Earnings
X Sales Revenue
X Total Assets
X 100 Sales
Revenue
Average Total
Assets Total Equity
= (Returns on Sale x Assets Turnover x Equity Multiplier) x 100
Table 4.12: DuPont Ratios of selected Airlines
Air Namibia (Pty) Ltd 2007
-233 435 X
854 122 X
187 089
854 122 187 089 -486 565
-0.27 X 4.57 X -0.38 = 48%
2008
-154 529
X
1 028 590
X
336 944
1 028
590 336 944 -96 082
-0.15 X 3.05 X -3.51 = 161%
2009
-478 855
X
1 298 043
X
386 157
1 298
043 386 157 -415 711
-0.37 X 3.36 X -0.93 = 115%
2010
-246 248
X
1 165 463
X
347 164
1 165
463 347 164 -511 020
-0.21 X 3.36 X -0.68 = 48%
2011
-384 512
X
1 218 708
X
358 733
1 218
708 358 733 -821 410
-0.32 X 3.40 X -0.44 = 47%

108
Kenya Airways 2007
4 098 X
58 792 X
73 291
58 792 73 291 21 640
0.07 X 0.80 X 3.39 = 19%
2008
3 869 X
60 471 X
77 034
60 471 77 034 25 873
0.06 X 0.78 X 2.98 = 15%
2009
-4 083 X
71 829 X
76 380
71 829 76 380 17 176
-0.06 X 0.94 X 4.45 = -24%
2010
2 035 X
70 743 X
74 621
70 743 74 621 19 973
0.03 X 0.95 X 3.74 = 10%
2011
3 538 X
85 836 X
76 003
85 836 76 003 23 090
0.04 X 1.13 X 3.29 = 15%
British Airways 2007
304 X
8 492 X
11 724
8 492 11 724 2 411
0.04 X 0.72 X 4.86 = 13%
2008
694 X
8 753 X
11 254
8 753 11 254 3 233
0.09 X 0.78 X 3.48 = 23%
2009
-358 X
8 992 X
10 806
8 992 10 806 1 846
-0.04 X 0.83 X 5.85 = -19%
2010
-425 X
7 994 X
10 583
7 994 10 583 2 113
-0.05 X 0.76 X 5.01 = -20%
2011
672 X
9 987 X
11 023
9 987 11 023 2 782
0.07 X 0.91 X 3.96 = 24%
Fly Emirates 2007
3 164 X
28 643 X
34 676
28 643 34 676 13 170
0.11 X 0.83 X 2.63 = 24%
2008
5 075 X
36 441 X
42 235
36 441 42 235 16 843
0.14 X 0.86 X 2.51 = 30%

109
2009
1 046 X
42 674 X
46 981
42 674 46 981 16 568
0.02 X 0.91 X 2.84 = 6%
2010
3 615 X
42 477 X
51 498
42 477 51 498 17 475
0.09 X 0.82 X 2.95 = 21%
2011
5 465 X
53 098 X
60 319
53 098 60 319 20 902
0.10 X 0.88 X 2.89 = 26%
US Airways 2007
5 X
279 X
343
27 9 343 -776
0.00 X 0.81 X -0.44 = 0%
2008
-2 210 X
12 118 X
3 784
12 118 3 784 -765
-0.18 X 3.20 X -4.95 = 289%
2009
-205 X
10 458 X
7 334
10 458 7 334 -355
-0.02 X 1.43 X -20.66 = 58%
2010
502 X
11 908 X
7 637
11 908 7 637 84
0.04 X 1.56 X 90.92 = 598%
2011
115 X
13 294 X
7 738
13 294 7 738 199
0.01 X 1.72 X 38.88 = 58%
Source: Calculations based on data collected from Air Namibia (Pty) Ltd, Kenya
Airways, British Airways, Fly Emirates and US Airways website during June 2013.
The results of DuPont analysis for Air Namibia (Pty) Ltd are misleading. The analysis
shows that the DuPont ratio was positive throughout the five year period under study,
while the airline returns on sales revenue were negative throughout the period. Further,
the equity multiplier was also negative throughout the period. Only the airline’s assets
turnover was positive. Two negative results in the DuPont ratio created this misleading
situation. Air Namibia (Pty) Ltd’s assets turnover remained positive throughout the

110
period and it was also high as the airline’s asset base was small. The returns on sale were
negative throughout the period as the airline made loss throughout the period. The equity
multiplier was negative throughout the period as the airline’s total equity was negative
throughout the period. Negative returns resulted in negative equity. This should be a
matter of grave concern for management.
Kenya Airways returns on sales revenue had been positive throughout the period except
for in 2009 when it had negative returns on sales. The positive returns on sales revenue
indicated that the airline produced sales revenues, which were more than operational
expenditure except for in 2009 when the operational expenditure exceeded the sales
revenue. Kenya Airways’ turnover of assets was positive with a minimum ratio of 0.78:1
and maximum of 1.13:1 that is for, 1 Kenya Shilling worth of assets value the airline
yielded 0.78 Kenya Shilling worth of sales revenue to 1.13 Kenya Shilling worth of
sales revenue. The airline equity multiplier ratio ranged from a minimum of 2.98:1 to
maximum of 4.45:1, means the airline’s total assets exceeded the airlines’ equity. The
airlines’ DuPont ratio was high in 2007 at 19% and negative in 2009 at -24%. The result
for 2009 of -24% was due to negative returns on sales revenue in 2009. This resulted in
the DuPont ratio to be negative for 2009.
British Airways returns on sales revenue were positive but relatively small for the five
year period under study; except for in 2009 and 2010 when it had negative returns on
sales revenue. This means the airline sales revenues were approximately equal to
111
operational expenditure, resulting in smaller returns on sales revenue. The turnover on
assets were positive with the minimum of 0.72:1 and maximum of 0.91:1, that is for
every 1 British Pound worth of assets the airline yielded 0.72 to 0.91 British Pound
worth of sales revenue. The airline equity multiplier ratio ranged between 3.48:1 and
5.85:1 for the five years period, which means for every 1 British Pound equity, the
airline had about British Pound 3.48 to British Pound 5.85 worth of assets. DuPont ratio
was negative in 2009 and 2010 as a result of negative returns on sales revenue for 2009
and 2010.
Fly Emirates’ returns on sales revenue were positive through the period under study,
which means the airline produced sales revenue which exceeded the operational
expenditure and the airline was breaking even. The airline turnover on assets ratio
ranged between 0.82:1 and .91:1, means the airline realized sales revenue of 0.82 to 0.91
Dirham for 1 Dirham worth of assets. The airline equity multiplier ranged from 02.51:1
to 2.95:1, which means the assets exceeded the airlines’ equity. DuPont ratio was low in
2009 at 6% and high in 2008 at 30%. The low DuPont ratio for 2009 was as a result of
low returns on sales revenue in that year.
US Airways returns on sales revenue were zero in 2007, negative in 2008 and 2009 and
positive in 2010 and 2011. In 2010 and 2011, it was positive and relatively small in
relation to the sales revenue. The turnover on total assets of the airline was positive
throughout the period. The airline equity multiplier ratio was negative in 2009 at -

112
20.66% and high in 2010 at 90.92%. The equity multiplier in 2009 was negative (-
20.66%) due to negative capital and reserves. The equity multiplier was high in 2010
due to low capital and reserves in relation to total assets. DuPont ratio was zero for 2007
and 598% in 2010 due to effect of high equity multiplier.
Figure 1. DuPont/ Components of Returns on Equity of Air Namibia (Pty) Ltd
Source: Calculations based on data collected from Air Namibia (Pty) Ltd, Kenya
Airways, British Airways, Fly Emirates and US Airways website during June 2013.
Figure 1 on DuPont analysis indicated that Air Namibia (Pty) Ltd average returns on
sale revenue and average equity multiplier were negative for the period, while, the
average assets turnover was positive for the period.
(4.00)
(3.00)
(2.00)
(1.00)
-
1.00
2.00
3.00
4.00
5.00
2007 2008 2009 2010 2011
Return on Sale
Assets Turnover
Equity Multiplier

113
4.4.13 Internal Benchmark Analysis of Income Statement items of Air Namibia
(Pty) Ltd
Internal benchmark analysis is based on a comparison of performance and practices
within parts of an organisation. The benchmark analysis gives insight into the strengths
and weaknesses of the organisation; its objective; uncovers problems; indicates possible
improvements; points out norms; provides guidelines and fresh ideas to improve the
organisations’ performance (Wright, 2003). In this analyse, the researcher compared the
averaged actual income statement items of Air Namibia (Pty) Ltd for the five years
period, with averaged planned performance of income statement items for the five years
period and determined the average variance for the five years period.
Table 4.13: Internal Benchmark Analysis of Air Namibia (Pty) Ltd
Benchmark Parameter
Average
Actual Mar
07 - Mar 11
Average
Planned
Performance
Mar 07 - Mar
11
Average
Variance Mar
07 - Mar 11
000 000 000
Revenue 1 112 985 1 225 000 ( 112 015)
Expenditure (1 447 133) (1 180 000) ( 267 133)
Operating Profit/Loss ( 334 148) 45 000 ( 379 148)
Other Income 35 133 32 000 3 133
Operating Profit/Loss before financing
costs and financial assistance ( 303 707) 77 000 ( 380 707)
Government financial assistance 223 962 245 000 ( 21 038)
Net financing ( 51 266) ( 15 000) ( 36 266)
Profit Profit/Loss before taxation ( 110 439) 307 000 ( 417 439)
Taxation - - -
Profit/Loss for the period ( 110 439) 307 000 ( 417 439)
Source: Calculations based on data collected from Air Namibia (Pty) Ltd, Kenya
Airways, British Airways, Fly Emirates and US Airways website during June 2013.

114
Internal benchmark analysis of Air Namibia (Pty) Ltd showed that the airline could not
perform up to the set standards. For instance for five years period the airline planned to
realise a sales revenue of N$ 1.2 billion but managed sales revenue of N$ 1.1 billion
only, showing N$ 0.1 billion as negative variance. As the actual performance in terms of
sales revenue did not match up the planned performance, the airline performed below its
set target. The expenditure was set at N$ 1.2 billion for sales revenue of N$ 1.18 billion
but it recorded operational expenditure at sales revenue N$ 1.1 billion of N$ 1.45 billion,
the expenditure exceeding what was planned by N$ 0.26 billion. Though the airline
planned for the operational expenditure to be below the sales revenue, but the
expenditure exceeded the revenue, which resulted in the airline recording operational
loss of N$ 0.33 billion against the planned profit of N$ 0.45 billion. The airline’s other
income of course exceeded planned income by N$ 0.3 billion, indicating that it invested
well to earn higher other income. The government provided less than planned financial
assistance to the airline as cash bailout by N$ 0.21 billion. Since the airline is heavily
dependent on the government bailout this affected the cash flows negatively. Overall,
the airline planned a profit of N$ 0.3 billion but it turned out a loss of N$ 0.11 billion.
The factors that contributed negatively on the financial performance of the airline were
such as an increase in fuel price, fluctuating exchange rate, international passenger
safety and airline logistics.

115
Figure 2. Internal Benchmark Analysis of Air Namibia (Pty) Ltd
Source: Calculations based on data collected from Air Namibia (Pty) Ltd, Kenya
Airways, British Airways, Fly Emirates and US Airways website during June 2013.
Figure 2 on internal benchmark gives comparison of Air Namibia (Pty) Ltd performance
with internal set standards. The figure indicated that the sales revenue of the airline was
below the planned performance. The operating expenditure had exceeded the planned
performance of the airline. Airline planned to have a positive operating profit but ended
up with operating loss. The government bailout was also below the expected bailout
from the government. The airline planned to realise profit for the period but managed
only to record loss for the period. The overall airline performance thus was not
(2 000 000 000.00)
(1 500 000 000.00)
(1 000 000 000.00)
(500 000 000.00)
-
500 000 000.00
1 000 000 000.00
1 500 000 000.00
Revenue Expenditure OtherIncome
GRNAssistance
Profit/Lossfor theperiod
Planned
Actual
Variance

116
according to its own standards. The prime factors that contributed to poor results were
lower sales revenue, higher operating expenditure and lower government bailout.
4.4.14 External Benchmark Analysis
External benchmark analysis is a technique for measuring performance against external
standards. Generally, external benchmark analysis is used to ensure that a particular
business or a part of its operations functions at a level that measure up to external best
practices. External benchmark analysis based on external best practices, uses industry
standards or performance standards set by industry leaders as guidelines. In this research
external benchmark was based on comparison of performance of Air Namibia (Pty) Ltd
with its peers namely Kenya Airways, British Airways, Fly Emirates and US Airways.
Average for the peers was used as the benchmark due to the non availability of industry
averages. Seven profitability parameters were used for external benchmark analysis.
These were comprehensive income to investment, other comprehensive income to sales
revenue, other comprehensive income to earnings ratio, operating ratio, net profit
margin, earnings per passenger travelled and earnings per kilometer travelled.

117
Table 4.14: External Benchmark Analysis of Profitability of Air Namibia (Pty) Ltd
Profitability
Parameters Kenya
Airways
British
Airways
Fly
Emirates
US
Airways
Standar
d/Avera
ge
Air
Namibia
(Pty)
Ltd
Average Average Average Average Average Average
Comprehensive Income
to Investments 10% 22% 6% 6% 11% 32%
Other Comprehensive
Income to Sales
Revenue 0% 6% 3% 3% 3% 3%
Other Comprehensive
Income to Earnings
Ratio 4% 7% 16% 11% 10% -14%
Operating Ratio 87% 97% 93% 98% 94% 129%
Net Profit Margin 3% 2% 9% -2% 3% -27%
Earnings Per Passenger
Travelled 71 115 29 ( 8) 52 ( 115)
Earnings Per Kilometer
Travelled 5 530 639 639 45 1 713 ( 4 414)
Source: Calculations based on data collected from Air Namibia (Pty) Ltd, Kenya
Airways, British Airways, Fly Emirates and US Airways website during June 2013.
Air Namibia (Pty) Ltd average comprehensive income to investment at 32% was more
than the benchmark average at 11%, as the airline was getting higher income from
investments (Security Deposit and Fuel Hedge) than its peers. Air Namibia (Pty) Ltd
matched the industry benchmark on other comprehensive income to sales revenue at 3%.
On other comprehensive income to earnings, with benchmark at 10% the Air Namibia
(Pty) Ltd performance at -14%, indicated very poor performance. Against the operating
ratio standard at 94% Air Namibia (Pty) Ltd was at 129%. This indicated that the
operating costs exceeded the sales revenue by 29% resulting in operating loss of 29% for

118
Air Namibia (Pty) Ltd. The net profit margin for peers was at 3% while for Air Namibia
(Pty) Ltd it was -27%, indicating negative net earnings. The earnings per passenger
travelled for peers was for peers at 52, while for Air Namibia (Pty) Ltd the earnings per
passenger travelled was -115, as a result Air Namibia (Pty) Ltd was losing -115 per
passenger travelled and the airline could not breakeven per passenger travelled. The
realised earnings per kilometre travelled for peers was 1713, while for Air Namibia (Pty)
Ltd the realised earnings was at -4 414 per kilometre travelled. This indicated poor
financial performance on the part of airline.
Figure 3. External Benchmark Analysis of Profitability of Air Namibia (Pty) Ltd
Source: Calculations based on data collected from Air Namibia (Pty) Ltd, Kenya
Airways, British Airways, Fly Emirates and US Airways website during June 2013.
11%3%
10%
94%
3%
32%
3%
-14%
129%
-27%
ComprehensiveIncome to
Investments
OtherComprehensiveIncome to Sales
Revenue
OtherComprehensive
Income toEarnings Ratio
Operating Ratio Net Profit Margin
External Benchmark (Average) Air Namibia (Pty) Ltd
119
Figure 3 indicated that the Air Namibia (Pty) Ltd comprehensive income to investment
exceeded the standard. Other comprehensive income to sales revenue was equal at 3%,
while the other comprehensive income to earnings, operating ratio, net profit margin,
earnings per passenger travelled and earnings per kilometer travelled were all below the
standard.
4.5 Relating Profitability with Efficiency
Efficiency in operations contributes to profitability. To determine whether efficiency in
operations contributed to profitability of an airline eight efficiency measures were
analysed. These were, total assets turnover, inventory turnover, receivable turnover,
payables turnover, earnings per passenger travelled, earnings per kilometre travelled,
earnings per passenger per kilometre travelled, and average passengers travelled to
capacity.
4.5.1 Total Assets Turnover
The amount of sales revenue generated for every dollar's worth of assets is known as
total assets turnover. It is calculated by dividing sales revenue in dollars by assets in
dollars. Asset turnover measures a firm's efficiency at using its assets in generating sales
revenue. The higher the turnover the better it is. It also indicates pricing strategy of a
company. With lower profit margins companies tend to have higher asset turnover,
while those with higher profit margins have lower asset turnover. The total assets
turnover ratio is determined as:
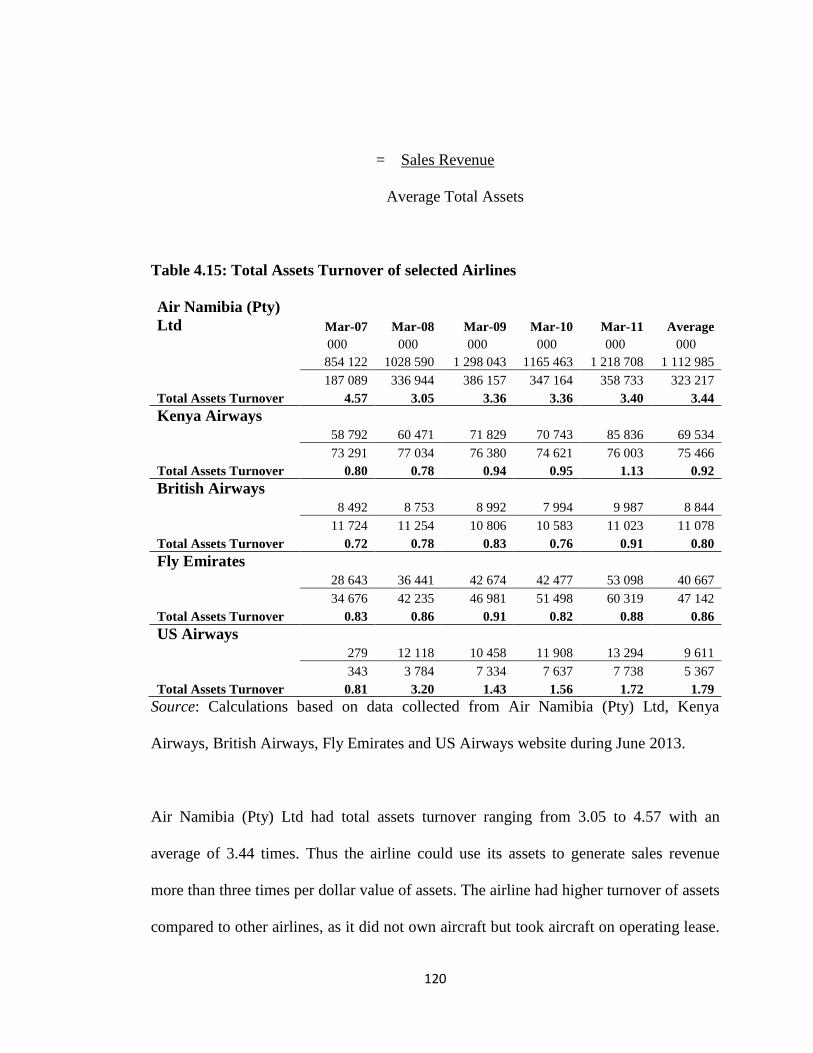
120
= Sales Revenue
Average Total Assets
Table 4.15: Total Assets Turnover of selected Airlines
Air Namibia (Pty)
Ltd Mar-07 Mar-08 Mar-09 Mar-10 Mar-11 Average
000 000 000 000 000 000
854 122 1028 590 1 298 043 1165 463 1 218 708 1 112 985
187 089 336 944 386 157 347 164 358 733 323 217
Total Assets Turnover 4.57 3.05 3.36 3.36 3.40 3.44
Kenya Airways
58 792 60 471 71 829 70 743 85 836 69 534
73 291 77 034 76 380 74 621 76 003 75 466
Total Assets Turnover 0.80 0.78 0.94 0.95 1.13 0.92
British Airways
8 492 8 753 8 992 7 994 9 987 8 844
11 724 11 254 10 806 10 583 11 023 11 078
Total Assets Turnover 0.72 0.78 0.83 0.76 0.91 0.80
Fly Emirates
28 643 36 441 42 674 42 477 53 098 40 667
34 676 42 235 46 981 51 498 60 319 47 142
Total Assets Turnover 0.83 0.86 0.91 0.82 0.88 0.86
US Airways
279 12 118 10 458 11 908 13 294 9 611
343 3 784 7 334 7 637 7 738 5 367
Total Assets Turnover 0.81 3.20 1.43 1.56 1.72 1.79
Source: Calculations based on data collected from Air Namibia (Pty) Ltd, Kenya
Airways, British Airways, Fly Emirates and US Airways website during June 2013.
Air Namibia (Pty) Ltd had total assets turnover ranging from 3.05 to 4.57 with an
average of 3.44 times. Thus the airline could use its assets to generate sales revenue
more than three times per dollar value of assets. The airline had higher turnover of assets
compared to other airlines, as it did not own aircraft but took aircraft on operating lease.

121
The rest of the airlines had sales turnover of less than one on average, except for US
airways which had average of 1.79 times. The airlines that realised sales turnover at less
than one were the airlines which own aircraft and their assets base was relatively higher
in comparison to airlines which do not own aircraft.
4.5.2 Inventory Turnover
The inventory turnover ratio shows how many times a company's inventory is sold and
replaced over a period (Irfanullah, 2009). This ratio should be compared against industry
average. A lower turnover implies poor sales and excess inventory, while a higher ratio
implies either strong sales or ineffective buying. Higher inventory levels are unhealthy
because they represent an investment with a rate of return of zero. It also opens the
company up to trouble should prices begin to fall. The airline inventory consist of
inflight catering and aircraft spare parts. The inventory turnover ratio is determined as
under.
= Cost of Goods Sold
Average Inventory
Table 4.16: Inventory Turnover of selected Airlines
Air Namibia (Pty)
Ltd Mar-07 Mar-08 Mar-09 Mar-10 Mar-11 Average
000 000 000 000 000 000
1 097 162 237 600 1 835 102 1452 422 1 613 382 1 447 134
3 766 5 149 6 722 7 470 8 512 6 324
Inventory Turnover 291.37 240.38 273.02 194.43 189.54 228.85

122
Kenya Airways
41 335 43 924 67 787 68 904 80 021 60 394
883 1 110 1 366 1 509 1 725 1 318
Inventory Turnover 46.84 39.57 49.62 45.68 46.39 45.81
British Airways
7 936 7 878 9 212 8 225 9 469 8 544
75 94 120 113 119 104
Inventory Turnover 105.81 83.81 77.09 73.11 79.91 82.23
Fly Emirates
25 834 33 630 41 122 39 890 48 943 37 884
511 646 902 1 069 1 187 863
Inventory Turnover 50.61 52.06 45.59 37.33 41.23 43.91
US Airways
238 11 323 8 509 9 256 10 708 8 007
18 273 214 229 249 197
Inventory Turnover 13.20 41.48 39.76 40.42 43.00 40.73
Source: Calculations based on data collected from Air Namibia (Pty) Ltd, Kenya
Airways, British Airways, Fly Emirates and US Airways website during June 2013.
Air Namibia (Pty) Ltd had higher inventory turnover among all airliners. The higher
inventory turnover indicated better performance in terms of utilising the inventory into
sales. Air Namibia (Pty) Ltd could realise more sales times than the rest of the airlines.
British Airways was the next airline with second higher inventory turnover, while the
lowest was US Airways. US Airways held higher stock, which limited its inventory
turnover. The lower inventory turnover ratio indicated inefficiency in controlling
inventory levels or over stocking, which may pose risk of obsolete and increased
inventory holding costs.

123
4.5.3 Receivables Turnover
Receivables turnover ratio measures company's efficiency in collecting its sale on credit
and effectiveness of collection policy. This ratio takes into consideration only the credit
sales. If the cash sales are included, the ratio will be affected and may lose its
significance. It is better to use average accounts receivable to avoid seasonality effect. If
the company uses discounts, those discounts must be taken into consideration when
calculating net accounts receivable. Accounts receivable represent the indirect interest
free loan that the company is providing to its clients. Therefore, it is very important to
know how "costly" these loans are for the company (Ward, 2010).
A high receivables turnover ratio implies either that the company operates on cash
basis or that its extension of credit and collection of accounts receivable are efficient.
Also, a high ratio reflects a shorter lapse of time between sales and collection of cash
from clients. A low receivables turnover ratio implies that the company should re-
assess its credit policy in order to ensure timely collection of credit sales that is not
earning interest for the firm. A ratio that is low by industry standards will generally
indicate that the business needs to improve its credit policy and collection procedures. If
the ratio is going up, either collection efforts may be improving, or sales may be raising
or receivables are being reduced. The receivable turnover ratio is calculated as:
= Sales Revenue
Average Accounts Receivable

124
Table 4.17: Receivables Turnover of selected Airlines
Air Namibia (Pty)
Ltd Mar-07 Mar-08 Mar-09 Mar-10 Mar-11 Average
000 000 000 000 000 000
854 122 1 028590 1 298 043 1165 463 1 218 708 1 112 985
84 312 131 193 154 703 148 358 170 839 137 881
Receivable Turnover 10.13 7.84 8.39 7.86 7.13 8.07
Kenya Airways
58 792 60 471 71 829 70 743 85 836 69 534
5 854 6 849 8 633 9 545 10 102 8 197
Receivable Turnover 10.04 8.83 8.32 7.41 8.50 8.48
British Airways
8 492 8 753 8 992 7 994 9 987 8 844
645 620 558 515 480 563
Receivable Turnover 13.18 14.12 16.11 15.54 20.83 15.70
Fly Emirates
28 643 36 441 42 674 42 477 53 098 40 667
4 787 6 300 7 145 7 059 6 745 6 407
Receivable Turnover 5.98 5.78 5.97 6.02 7.87 6.35
US Airways
279 12 118 10 458 11 908 13 294 9 611
12 154 289 298 329 216
Receivable Turnover 23.25 78.84 36.19 39.96 40.41 44.43
Source: Calculations based on data collected from Air Namibia (Pty) Ltd, Kenya
Airways, British Airways, Fly Emirates and US Airways website during June 2013.
The analysis indicated that the US Airways managed to turnover 44.43 times its
accounts receivable on average, followed by British Airways with 15.70 times, while the

125
lowest was Fly Emirates with 6.35 times. Air Namibia (Pty) Ltd had 8.07 times turnover
of account receivables on average. Thus the US Airways with the highest accounts
receivable turnover was more efficient in collecting its credit sales followed by British
Airways. Kenya Airways, Fly Emirates and, Air Namibia (Pty) Ltd, which had the
lowest accounts receivable turnover indicating inefficiency in collecting outstanding
credit sales. US Airways managed its accounts receivable very well compared to other
airlines and was able to convert outstanding credit sales into cash, and enhance its cash
inflows more quickly than other airlines. Fly Emirates was not managing its accounts
receivable well in comparison with US Airways, and it had build-up balance into
accounts receivable, Air Namibia (Pty) Ltd was fourth among its peers in turnover of
accounts receivable and as such was inefficient in converting credit sales into cash
inflows.
4.5.4 Payables Turnover
Payables turnover is a short-term liquidity measure used to quantify the rate at which a
company pays off its suppliers. Accounts payable turnover ratio is calculated by taking
the total credit purchases from suppliers and dividing it by the average accounts payable
amount during the same period. Accounts payable turnover ratio also indicates
creditworthiness of a company. A higher ratio means prompt payment to suppliers for
the goods purchased on credit and a lower ratio may be a sign of delayed payment.
Accounts payable turnover ratio depends on the credit terms allowed by suppliers.
Companies which enjoy longer credit periods allowed by suppliers usually have lower
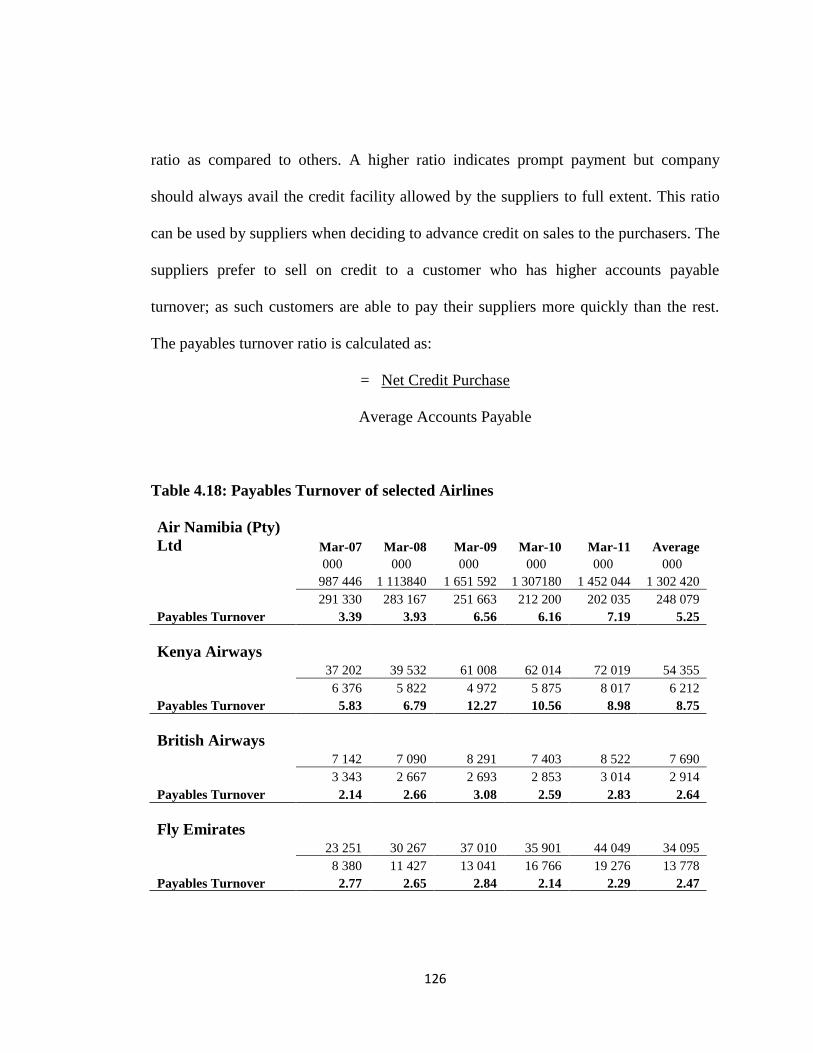
126
ratio as compared to others. A higher ratio indicates prompt payment but company
should always avail the credit facility allowed by the suppliers to full extent. This ratio
can be used by suppliers when deciding to advance credit on sales to the purchasers. The
suppliers prefer to sell on credit to a customer who has higher accounts payable
turnover; as such customers are able to pay their suppliers more quickly than the rest.
The payables turnover ratio is calculated as:
= Net Credit Purchase
Average Accounts Payable
Table 4.18: Payables Turnover of selected Airlines
Air Namibia (Pty)
Ltd Mar-07 Mar-08 Mar-09 Mar-10 Mar-11 Average
000 000 000 000 000 000
987 446 1 113840 1 651 592 1 307180 1 452 044 1 302 420
291 330 283 167 251 663 212 200 202 035 248 079
Payables Turnover 3.39 3.93 6.56 6.16 7.19 5.25
Kenya Airways
37 202 39 532 61 008 62 014 72 019 54 355
6 376 5 822 4 972 5 875 8 017 6 212
Payables Turnover 5.83 6.79 12.27 10.56 8.98 8.75
British Airways
7 142 7 090 8 291 7 403 8 522 7 690
3 343 2 667 2 693 2 853 3 014 2 914
Payables Turnover 2.14 2.66 3.08 2.59 2.83 2.64
Fly Emirates
23 251 30 267 37 010 35 901 44 049 34 095
8 380 11 427 13 041 16 766 19 276 13 778
Payables Turnover 2.77 2.65 2.84 2.14 2.29 2.47

127
US Airways
214 10 191 7 658 8 330 9 637 7 206
15 405 567 362 417 353
Payables Turnover 14.45 25.15 13.51 23.04 23.11 20.41
Source: Calculations based on data collected from Air Namibia (Pty) Ltd, Kenya
Airways, British Airways, Fly Emirates and US Airways website during June 2013.
The analysis of payables indicated that US Airways had 20.41 times accounts payable
turnover followed by Kenya Airways with 8.75 times, Air Namibia (Pty) Ltd with 5.25
times, British Airways with 2.64 times and finally by Fly Emirates with 2.47 times on
average. US Airways, with the highest accounts payable turnover, indicated that it was
able to repay its suppliers more quickly than other airlines. While, Fly Emirates with the
lowest accounts payable turnover indicated slower payments to suppliers of credit
purchases. Fly Emirates with lower accounts payable turnover indicated that it had a
higher chance of defaulting on payments or will only be able to pay on or after the due
date. Fly Emirates perhaps had adopted a management policy whereby it collected
accounts receivables as quick as possible and paid suppliers as late as possible to
enhance its cash flow. But by doing so it may be damaging the credit worthiness of the
airline when considering acquiring stock on credit from suppliers. The airline should
weigh the benefit of holding on to cash versus paying suppliers in time to have good
credit record. The position of Air Namibia (Pty) Ltd in respect of payables turnover may
be considered as satisfactory compared to its peers. The 5.25 payables turnover indicated
that on the average it enjoyed credit of 70 days from its suppliers in a year.

128
4.5.5 Earnings per Passenger Travelled
Earnings per passenger travelled indicated the average earnings for each passenger
travelled by the airline for the period. The ratio shows the earnings realised by carrying
each passenger. A higher ratio indicates that the airline was having higher earnings on
each passenger travelled, while a lower ratio indicates that the airline was realising
lower earnings from each passenger travelled. The earnings per passenger travelled are
calculated as:
= Earnings before Interest and Tax
Number of Passengers Carried
Table: 4.19: Earnings per Passenger Travelled of selected Airlines
Mar-07 Mar-08 Mar-09 Mar-10 Mar-11 Average
Air Namibia (Pty) Ltd
(N$) -95.138 -61.847
-
176.042 -96.907
-
147.207 -115.4
Kenya Airways (KES) 171.7 153.0 -141.0 65.0 108.0 71.3
British Airways (£) 112.9 118.4 114.3 110.9 117.3 114.8
Fly Emirates (AED) 27.8 29.8 32.1 26.1 28.3 28.8
US Airways (US$) 2.578 -90.129 -9.599 0.189 58.017 -7.8
Source: Calculations based on data collected from Air Namibia (Pty) Ltd, Kenya
Airways, British Airways, Fly Emirates and US Airways website during June 2013.
The earnings per passenger travelled for Air Namibia (Pty) Ltd was negative, meaning
that on average it is costing Air Namibia (Pty) Ltd to carry one passenger about N$ -
115.40 more than its revenue. Thus instead for the airline to realize positive earnings per
passenger carried the airline realized loss on each passenger carried. The airline will be

129
better off if they increase the number of passengers travelling in order to avoid the loss
incurred when carrying passengers. The rest of the airlines were realizing positive
earnings on per passenger carried. British Airways was earning on average about
£114.80, followed by Kenya Airways 71.30 Kenya Shilling, Fly Emirates on average
28.80 Dirhams and US Airways on average was losing per passenger -7.8 US Dollar.
The position of Air Namibia (Pty) Ltd was worse between 2009 and 2011 with the loss
per passenger carried at N$ -176.042 in 2009, N$-96.907 in 2010 and N$ -147.207 in
2011. US Airways’ worst years were 2008 and 2009 when it incurred loss per passenger
travelled, but it recovered thereafter. Kenya Airways also made loss on per passenger
carried in 2009 of KES -141 but later recovered. The ratios for Air Namibia (Pty) Ltd
and US Airways indicated that the airlines were not breaking even from operations and
had to cover the cost from some other source; Air Namibia (Pty) Ltd did it from
Government bailout. British Airways and Fly Emirates realized positive earnings
throughout five years.
4.5.6 Earnings per Kilometer Travelled
Earnings per kilometer travelled indicate earnings realised by an airline from each
kilometer travelled by the airline. Higher ratio indicates that the airline was realising
higher earnings per kilometer and lower ratio indicates that the airline was earning lower
earnings per kilometer travelled. The earnings per kilometer travelled are calculated as:
= Earnings before Interest and Tax
Kilometer Travelled
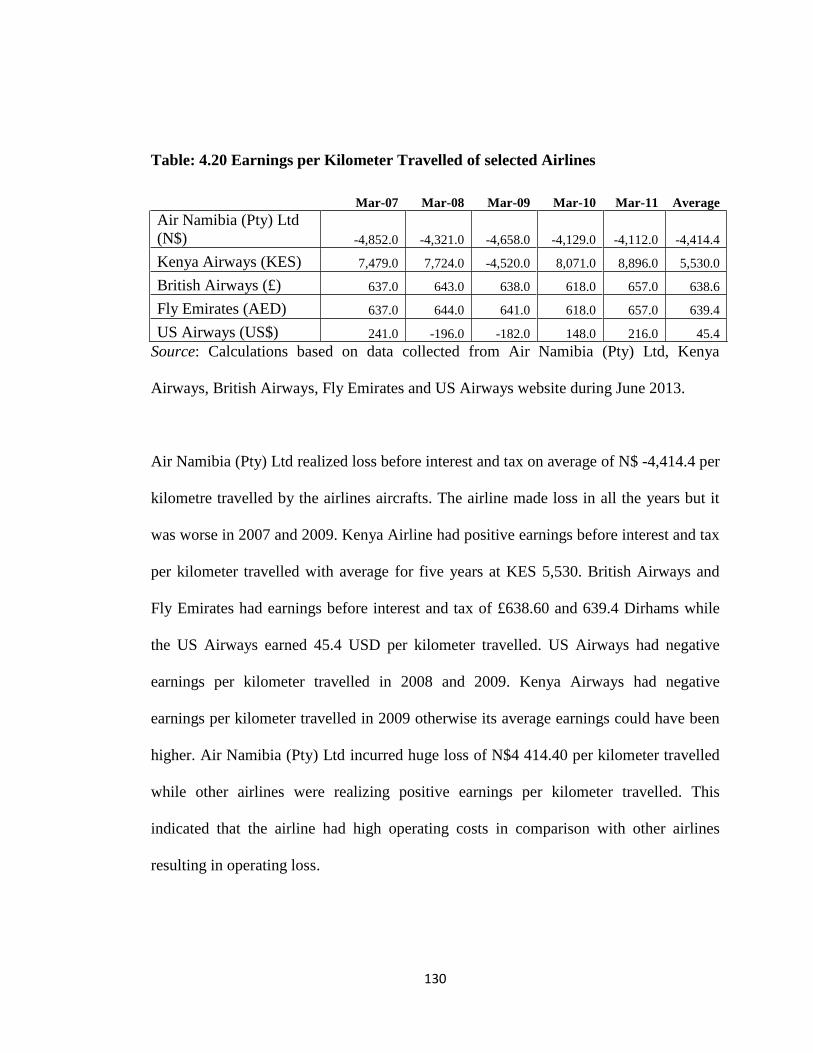
130
Table: 4.20 Earnings per Kilometer Travelled of selected Airlines
Mar-07 Mar-08 Mar-09 Mar-10 Mar-11 Average
Air Namibia (Pty) Ltd
(N$) -4,852.0 -4,321.0 -4,658.0 -4,129.0 -4,112.0 -4,414.4
Kenya Airways (KES) 7,479.0 7,724.0 -4,520.0 8,071.0 8,896.0 5,530.0
British Airways (£) 637.0 643.0 638.0 618.0 657.0 638.6
Fly Emirates (AED) 637.0 644.0 641.0 618.0 657.0 639.4
US Airways (US$) 241.0 -196.0 -182.0 148.0 216.0 45.4
Source: Calculations based on data collected from Air Namibia (Pty) Ltd, Kenya
Airways, British Airways, Fly Emirates and US Airways website during June 2013.
Air Namibia (Pty) Ltd realized loss before interest and tax on average of N$ -4,414.4 per
kilometre travelled by the airlines aircrafts. The airline made loss in all the years but it
was worse in 2007 and 2009. Kenya Airline had positive earnings before interest and tax
per kilometer travelled with average for five years at KES 5,530. British Airways and
Fly Emirates had earnings before interest and tax of £638.60 and 639.4 Dirhams while
the US Airways earned 45.4 USD per kilometer travelled. US Airways had negative
earnings per kilometer travelled in 2008 and 2009. Kenya Airways had negative
earnings per kilometer travelled in 2009 otherwise its average earnings could have been
higher. Air Namibia (Pty) Ltd incurred huge loss of N$4 414.40 per kilometer travelled
while other airlines were realizing positive earnings per kilometer travelled. This
indicated that the airline had high operating costs in comparison with other airlines
resulting in operating loss.

131
4.5.7 Earnings per Passenger Kilometer Travelled
Earnings per passenger per kilometer travelled consider two aspects at the same time,
the travel distance and the number of passengers. This is as such considered a superior
measure of earnings efficiency. The earnings per passenger per kilometer travelled are
calculated as:
= Earnings per passenger
Kilometer Travelled per Passenger
Table 4.21: Earnings per Passenger per Kilometer Travelled of selected Airlines
Mar-07 Mar-08 Mar-09 Mar-10 Mar-11 Average
Air Namibia -0.020 -0.014 -0.038 -0.023 -0.036 -0.026
Kenya Airways 0.023 0.020 -0.031 0.008 0.012 0.006
British Airways 0.177 0.184 0.179 0.179 0.179 0.180
Fly Emirates 0.044 0.046 0.050 0.042 0.043 0.045
US Airways 0.011 -0.460 -0.053 0.001 0.269 -0.046
Source: Calculations based on data collected from Air Namibia (Pty) Ltd, Kenya
Airways, British Airways, Fly Emirates and US Airways website during June 2013.
The analysis indicated that while British Airway, Kenya Airways and Fly Emirates
realized positive earnings per passenger per kilometer travelled, Kenya Airways lost on
earnings in 2009 but for the rest of the years it had positive earnings per passenger per
kilometer travelled. Air Namibia (Pty) Ltd incurred loss throughout the five years and as
such was the worst performing airline among its peers followed by US Airways.

132
4.5.8 Average Passengers Travelled to Capacity
Average passengers travelled to capacity indicates the number of passengers travelled in
relation to the available capacity to travel for passengers or the ratio of passengers
travelled to available capacity for passengers. This show whether the aircraft was filled
to capacity or the proportion of passengers to capacity. Average passengers travelled to
capacity were determined as:
= Average Daily Passengers Travelled
Total Passenger Capacity
Table 4.22: Average Passengers Travelled to Capacity of selected Airlines
Mar-07 Mar-08 Mar-09 Mar-10 Mar-11 Average
Air Namibia (Pty)
Ltd 68% 71% 72% 76% 78% 73%
Kenya Airways 97% 95% 98% 96% 98% 97%
British Airways 94% 95% 93% 92% 96% 94%
Fly Emirates 98% 97% 98% 96% 96% 97%
US Airways 74% 72% 69% 70% 73% 72%
Source: Calculations based on data collected from Air Namibia (Pty) Ltd, Kenya
Airways, British Airways, Fly Emirates and US Airways website during June 2013.
Air Namibia (Pty) Ltd managed an of average 73% passengers to capacity of its aircraft.
This indicates that the airlines did not attract enough passengers to fill its aircrafts and its
aircrafts were not flying full to capacity. The sales revenue that the airline recorded was
based on the passengers travelled, which was below the operating costs and it rendered
the airline to record negative profit margin. When the seats remain unoccupied sales

133
revenue is forgone and this may be a reason that the airline was recording losses. Kenya
Airways had most of its flights almost too full capacity, with the average of 97%, with
British Airways 94%, Fly Emirates 97% and US Airways 72%. That was the reasons
why Kenya Airways, British Airways and Fly Emirates had positive profit margins. US
Airways was equally struggling to fill its aircraft. Its 72% capacity was far below the full
capacity.
Table 4.23: External Benchmark Analysis of Efficiency of Air Namibia (Pty) Ltd
Efficiency Parameters Kenya
Airways
British
Airways
Fly
Emirates
US
Airways
Standard/
Average
Air
Namibia
(Pty)
Ltd
Average Average Average Average Average Average
Returns on Total
Assets 3% 2% 8% -7% 2% -93%
Total Assets Turnover 0 6 3 3 3 3
Inventory Turnover 46 82 44 41 53 229
Receivables Turnover 8 16 6 44 19 8
Payables Turnover 9 3 2 20 9 5
Average Passenger
Travelled to Capacity 97% 94% 97% 72% 90% 73%
Source: Calculations based on data collected from Air Namibia (Pty) Ltd, Kenya
Airways, British Airways, Fly Emirates and US Airways website during June 2013.
The analysis shows that the returns on total assets for the peer stood at 2%, while Air
Namibia (Pty) Ltd returns on total assets was at -93%, which means its 93% negative
returns on assets resulting in huge loss on its small assets. Air Namibia (Pty) Ltd
matched the peers with total assets turnover at 3 times, as the airline realised 3 times

134
sales returns on its total assets. Against the inventory turnover for peer at 53 times Air
Namibia (Pty) Ltd managed turnover of inventory 229 times, which was much better
than the peers. Air Namibia (Pty) Ltd accounts receivables turnover at 8 times was
however lower than peers 19 times, which means the airline was slower in collecting its
outstanding accounts receivables. The accounts payables turnover for peers was 9 times
while for Air Namibia (Pty) Ltd it was 5 times, which also indicated that the airline was
making payment to its supplies faster than its peers.
Figure 4. External Benchmark Analysis of Air Namibia (Pty) Ltd Efficiency
Source: Calculations based on data collected from Air Namibia (Pty) Ltd, Kenya
Airways, British Airways, Fly Emirates and US Airways website during June 2013.
3
53
19 9
3
229
8 5
Total Assets Turnover Inventory Turnover Receivable Turnover Payable Turnover
Standard Benchmark Air Namibia (Pty) Ltd

135
Figure 4 shows the external benchmark analysis of efficiency of Air Namibia (Pty) Ltd.
This indicated that Air Namibia (Pty) Ltd total assets turnover, receivables turnover and
payables turnover were all below the standards, which indicated poor performance and
control at Air Namibia (Pty) Ltd. The inventory turnover was the only benchmark where
Air Namibia (Pty) Ltd managed to exceed the standard.
4.6 Relating Cost Factors with Profitability
To determine which cost factors contributed to total cost and to what extent analysis of
cost factors was done. The cost factors considered included operating costs, interest, tax,
ground staff costs, flight staff costs, petroleum costs, maintenance costs and fleet costs.
4.6.1 Operating Ratio
Operating ratio shows the efficiency of a company's management by comparing
operating expenses to net sales. It is also used for expense control, and in measuring
profitability and financial soundness of a firm, by expressing each income statement
item as a percentage of sales revenue. The operating ratio is calculated as:
= Production costs + Administrative costs
Net Sales Revenue

136
Table 4.24: Operating Ratios of selected Airlines
Mar-07 Mar-08 Mar-09 Mar-10 Mar-11 Average
Air Namibia (Pty)
Ltd 128% 120% 141% 125% 132% 129%
Kenya Airways 87% 89% 83% 85% 93% 87%
British Airways 93% 90% 102% 103% 95% 97%
Fly Emirates 90% 92% 96% 94% 92% 93%
US Airways 85% 115% 99% 93% 97% 98%
Source: Calculations based on data collected from Air Namibia (Pty) Ltd, Kenya
Airways, British Airways, Fly Emirates and US Airways website during June 2013.
For an airline to break even it needs to have operating ratio at 100 per cent. If it is more
than 100% then its operating cost is more than revenue generated by the airline resulting
in loss. Kenya Airways, British Airways and Fly Emirates were the airlines with
operating ratio below 100 per cent throughout the five years. Air Namibia (Pty) Ltd’s
operating ratio was more than 100 per cent throughout the five years means the airlines
operating costs exceeded the revenue generated by the airline. This could be the
attributed to management’s failing to control or keep the cost at lower level or the airline
generated less revenue in comparison to its capacity. US Airways also had its operating
ratio above 100 per cent in 2008, but in other years it was below 100 per cent.
4.6.2 Interest to Earnings Ratio
The interest to earnings ratio indicated the ratio of interest expense expressed over the
earnings before interest and tax. The ratio shows the proportion of interest expense in
earnings before interest and tax or the availability of earnings for meeting interest

137
expense. If the ratio is more than 1.00 it shows that the company is highly geared and is
having interest expense more than its earnings. On other hand, if the ratio is less than
1.00 it means that the company is able to cover its interest expense as it falls due from its
earnings. The negative ratio shows that as the earnings were negative, it will not be able
to meet interest expense as it falls due. The reciprocal of interest to earnings ratio is
known as interest coverage ratio. The interest to earnings ratio is calculated as:
= Interest Expense
Earnings before Interest Tax
Table 4.25: Interest to Earnings Ratio of selected Airlines
Mar-07 Mar-08 Mar-09 Mar-10 Mar-11 Average
Air Namibia (Pty)
Ltd -0.11 -0.07 -0.06 -0.02 -0.06 -0.07
Kenya Airways 0.10 0.11 -0.12 0.28 0.14 0.10
British Airways 0.27 0.20 -0.45 -0.30 0.24 -0.01
Fly Emirates 0.03 0.03 0.03 0.03 0.03 0.03
US Airways 0.11 -0.14 2.58 0.42 0.78 0.75
Source: Calculations based on data collected from Air Namibia (Pty) Ltd, Kenya
Airways, British Airways, Fly Emirates and US Airways website during June 2013.
Air Namibia (Pty) Ltd and British Airways had average interest to earnings ratios of -
0.07 and -0.01 respectively, which indicated that the two airlines were not in a position
to cover their interest expense with their earnings before interest and tax. However, in
case of Air Namibia (Pty) Ltd, if the airline is not able to cover the interest expense, the
government assists with settling the debt and the corresponding interest. Kenya Airways

138
had a ratio of 0.10 which showed that it had low interest expense in relation to its
earnings. Fly Emirates had average ratio of 0.03, which indicated that for the interest
expense of 0.03 Dirham, the airline had 1 Dirham available to cover interest expense.
US Airways had average interest expense over earnings ratio of 0.75, which was high.
High interest expense threatens the profitability of the airline.
4.6.3 Tax to Earnings Ratio
Tax to earnings ratio indicates the proportion of tax in earnings and the availability of
earnings before interest and fax to meet the tax liability – the higher the ratio the better
the coverage. The tax to earnings ratio is calculated as under:
= Tax
Earnings before Interest and Tax
Table: 4.26: Tax to Earnings Ratios of selected Airlines
Mar-07 Mar-08 Mar-09 Mar-10 Mar-11 Average
Air Namibia (Pty)
Ltd 0.00 0.00 0.00 0.00 0.00 0.00
Kenya Airways 0.31 0.30 -0.28 0.24 0.29 0.17
British Airways 0.28 0.21 -0.11 -0.20 0.01 0.04
Fly Emirates 0.05 0.01 0.03 0.01 0.01 0.02
US Airways 0.02 0.00 -0.32 0.00 0.00 -0.06
Source: Calculations based on data collected from Air Namibia (Pty) Ltd, Kenya
Airways, British Airways, Fly Emirates and US Airways website during June 2013.

139
Air Namibia (Pty) Ltd is not expected to pay tax to the Government, due to the
consistent losses. That is the reason the tax to earnings ratio is zero. The airlines with
negative tax to earnings ratios get tax shield from their respective governments. Fly
Emirates had low tax to earnings ratios in comparison with British Airways and Kenya
Airways. The smaller tax to earnings ratio helps the airline as the cash flows remain
available to pay the suppliers.
4.6.4 Ground Staff Costs to Operating Cost Ratio
Ground staff costs to operating cost ratio indicate the proportional contribution of
ground staff costs to operating cost. Ground staff costs are mainly administrative and
supervisory services costs. The ground staff cost to operating cost ratio is calculated as:
= Ground Staff Costs
Operating Cost
Table 4.27: Ground Staff Costs to Operating Cost Ratios of selected Airlines
Mar-07 Mar-08 Mar-09 Mar-10 Mar-11 Average
Air Namibia (Pty) Ltd 0.12 0.13 0.13 0.14 0.15 0.13
Kenya Airways 0.15 0.14 0.18 0.16 0.17 0.16
British Airways 0.11 0.12 0.11 0.10 0.11 0.11
Fly Emirates 0.15 0.16 0.16 0.17 0.18 0.16
US Airways 0.09 0.10 0.11 0.11 0.12 0.11
Source: Calculations based on data collected from Air Namibia (Pty) Ltd, Kenya
Airways, British Airways, Fly Emirates and US Airways website during June 2013.
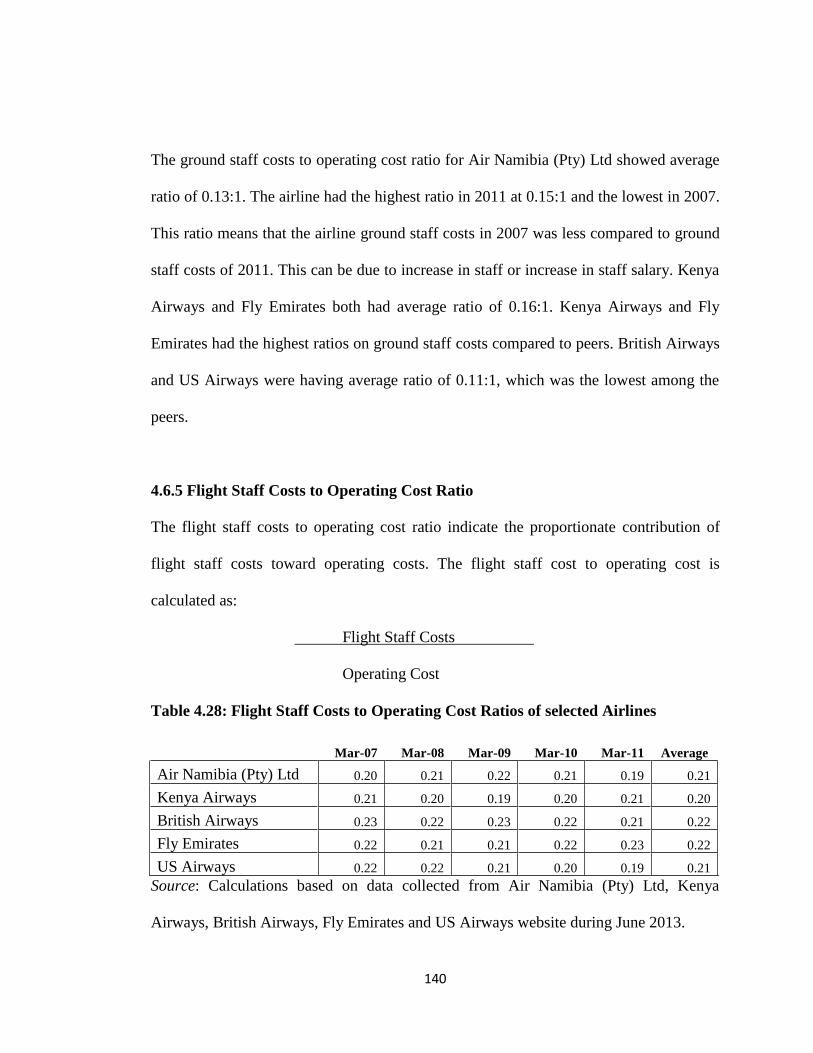
140
The ground staff costs to operating cost ratio for Air Namibia (Pty) Ltd showed average
ratio of 0.13:1. The airline had the highest ratio in 2011 at 0.15:1 and the lowest in 2007.
This ratio means that the airline ground staff costs in 2007 was less compared to ground
staff costs of 2011. This can be due to increase in staff or increase in staff salary. Kenya
Airways and Fly Emirates both had average ratio of 0.16:1. Kenya Airways and Fly
Emirates had the highest ratios on ground staff costs compared to peers. British Airways
and US Airways were having average ratio of 0.11:1, which was the lowest among the
peers.
4.6.5 Flight Staff Costs to Operating Cost Ratio
The flight staff costs to operating cost ratio indicate the proportionate contribution of
flight staff costs toward operating costs. The flight staff cost to operating cost is
calculated as:
Flight Staff Costs
Operating Cost
Table 4.28: Flight Staff Costs to Operating Cost Ratios of selected Airlines
Mar-07 Mar-08 Mar-09 Mar-10 Mar-11 Average
Air Namibia (Pty) Ltd 0.20 0.21 0.22 0.21 0.19 0.21
Kenya Airways 0.21 0.20 0.19 0.20 0.21 0.20
British Airways 0.23 0.22 0.23 0.22 0.21 0.22
Fly Emirates 0.22 0.21 0.21 0.22 0.23 0.22
US Airways 0.22 0.22 0.21 0.20 0.19 0.21
Source: Calculations based on data collected from Air Namibia (Pty) Ltd, Kenya
Airways, British Airways, Fly Emirates and US Airways website during June 2013.

141
Air Namibia (Pty) Ltd had average flight staff costs to operating cost ratio at .21:1. The
airline had the highest flight staff costs to operating cost ratio in 2009 at 0.22:1 and the
lowest in 2011 at 0.19:1. Kenya Airways had the lowest average flight staff costs to
operating cost ratio at 0.20:1, British Airways and Fly Emirates had the highest average
ratios at 0.22:1. The flight staff costs ratio indicated the proportion of flight staff costs of
the airline towards its operating cost.
4.6.6 Petroleum Costs to Operating Cost Ratio
The petroleum costs to operating cost shows the proportion of petroleum costs over
operating cost. Though the petroleum prices are the same for all airlines in international
market the costs may be different due tax, transport costs, handling costs and
consumption level. The petroleum cost to operating cost ratio is calculated as:
= Petroleum Cost
Operating Cost
Table 4.29: Petroleum Costs to Operating Cost Ratios of selected Airlines
Mar-07 Mar-08 Mar-09 Mar-10 Mar-11 Average
Air Namibia (Pty) Ltd 0.24 0.25 0.23 0.25 0.26 0.25
Kenya Airways 0.18 0.19 0.20 0.19 0.21 0.19
British Airways 0.24 0.26 0.27 0.26 0.27 0.26
Fly Emirates 0.22 0.23 0.23 0.24 0.25 0.23
US Airways 0.25 0.24 0.26 0.25 0.26 0.25
Source: Calculations based on data collected from Air Namibia (Pty) Ltd, Kenya
Airways, British Airways, Fly Emirates and US Airways website during June 2013.

142
Air Namibia (Pty) Ltd and US Airways had average petroleum costs to operating cost
ratio at 0.25:1. Kenya Airways had average petroleum costs to operating costs ratio of
0.19:1, which was the lowest among the peers. British Airways had average petroleum
costs to operating cost at 0.26:1, which was the highest ratio. These ratios indicated the
cost of petroleum items that were used by each airline and how the petroleum costs
contributed to the airline operating cost. The higher the ratio the higher the petroleum
costs contributed to airline’s operating cost and the lower the ratio of petroleum costs to
operating cost the lower the airline petroleum costs contributed to the airline operating
cost.
4.6.7 Maintenance Costs to Operating Cost Ratio
The maintenance costs to operating cost ratio indicate the proportion of maintenance
costs to operating cost. Maintenance costs to operating cost is the indication of how
much is the maintenance costs for the airline and how much maintenance costs
contributed to the airline operating cost (Taylor, 2006). The maintenance cost to
operating costs is calculated as:
= Maintenance Costs
Operating Cost

143
Table 4.30: Maintenance Costs to Operating Cost Ratios of selected Airlines
Mar-07 Mar-08 Mar-09 Mar-10 Mar-11 Average
Air Namibia (Pty) Ltd 0.09 0.10 0.11 0.10 0.12 0.10
Kenya Airways 0.14 0.13 0.15 0.16 0.15 0.15
British Airways 0.16 0.15 0.16 0.17 0.18 0.16
Fly Emirates 0.12 0.11 0.12 0.13 0.12 0.12
US Airways 0.16 0.15 0.17 0.16 0.15 0.16
Source: Calculations based on data collected from Air Namibia (Pty) Ltd, Kenya
Airways, British Airways, Fly Emirates and US Airways website during June 2013.
Air Namibia (Pty) Ltd had average maintenance costs to operating cost ratio at 0.10:1,
which was the lowest among the peers. British Airways and US Airways had the highest
average maintenance costs to operating cost ratios at 0.16:1 followed by Kenya Airways
and Fly Emirates at 0.15:1 and 0.12:1 respectively. The airlines maintenance depends on
the airlines maintenance schedule. Each maintenance schedule is fixed according to the
number of hours flown by the aircraft. This means, the more the airline uses the aircrafts
the more the aircrafts will go for service maintenance and this may have different
proportion contribution towards operating cost of each airline. Air Namibia (Pty) Ltd
had the lowest maintenance costs to operating cost ratio. This means may be the airline
was not utilising the aircraft optimally and as such required less maintenance.
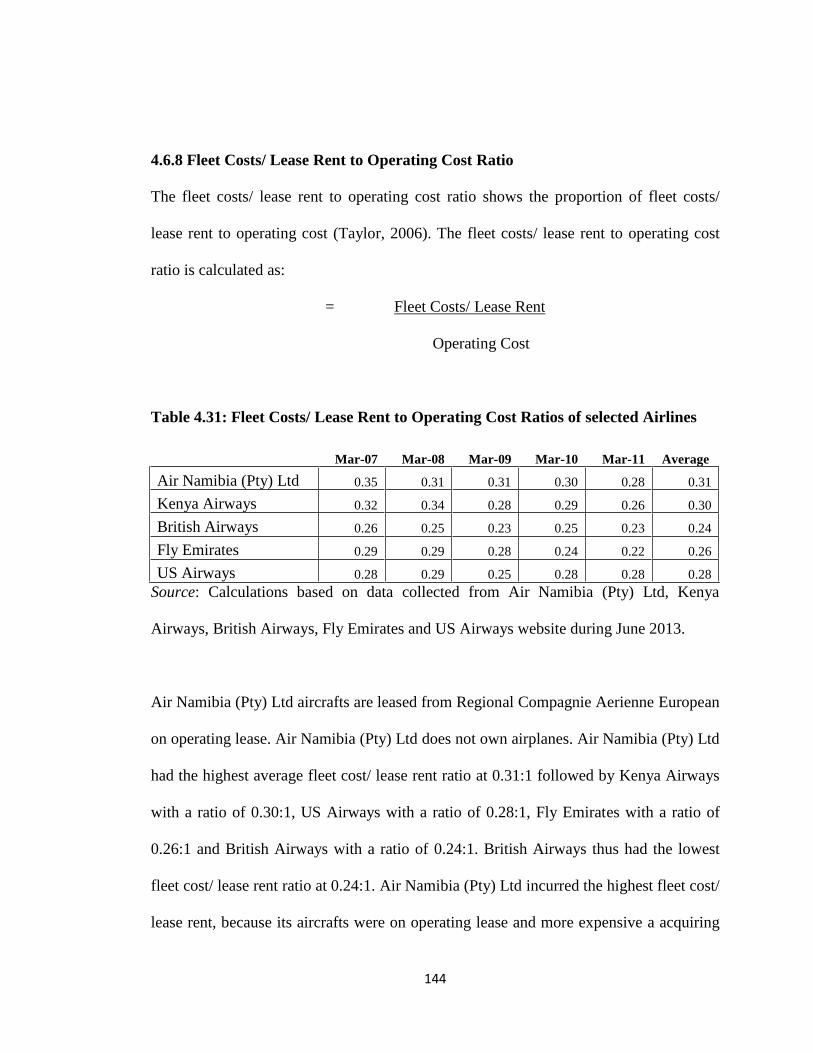
144
4.6.8 Fleet Costs/ Lease Rent to Operating Cost Ratio
The fleet costs/ lease rent to operating cost ratio shows the proportion of fleet costs/
lease rent to operating cost (Taylor, 2006). The fleet costs/ lease rent to operating cost
ratio is calculated as:
= Fleet Costs/ Lease Rent
Operating Cost
Table 4.31: Fleet Costs/ Lease Rent to Operating Cost Ratios of selected Airlines
Mar-07 Mar-08 Mar-09 Mar-10 Mar-11 Average
Air Namibia (Pty) Ltd 0.35 0.31 0.31 0.30 0.28 0.31
Kenya Airways 0.32 0.34 0.28 0.29 0.26 0.30
British Airways 0.26 0.25 0.23 0.25 0.23 0.24
Fly Emirates 0.29 0.29 0.28 0.24 0.22 0.26
US Airways 0.28 0.29 0.25 0.28 0.28 0.28
Source: Calculations based on data collected from Air Namibia (Pty) Ltd, Kenya
Airways, British Airways, Fly Emirates and US Airways website during June 2013.
Air Namibia (Pty) Ltd aircrafts are leased from Regional Compagnie Aerienne European
on operating lease. Air Namibia (Pty) Ltd does not own airplanes. Air Namibia (Pty) Ltd
had the highest average fleet cost/ lease rent ratio at 0.31:1 followed by Kenya Airways
with a ratio of 0.30:1, US Airways with a ratio of 0.28:1, Fly Emirates with a ratio of
0.26:1 and British Airways with a ratio of 0.24:1. British Airways thus had the lowest
fleet cost/ lease rent ratio at 0.24:1. Air Namibia (Pty) Ltd incurred the highest fleet cost/
lease rent, because its aircrafts were on operating lease and more expensive a acquiring

145
the aircraft. Air Namibia (Pty) Ltd fleet costs/ lease rent however was declining each
year. This could be due to the airline leasing aircraft on better contract terms.
4.6.9 Fleet Costs to Total Assets Ratio
The fleet costs to total assets ratio compares the fleet cost to total assets. It determines
the proportion of fleet costs to total assets as under:
= Fleet Costs
Total Assets
Table 4.32: Fleet Costs to Total Assets Ratios of selected Airlines
Mar-07 Mar-08 Mar-09 Mar-10 Mar-11 Average
Air Namibia (Pty)
Ltd 0.00 0.00 0.00 0.00 0.00 0.00
Kenya Airways 0.57 0.57 0.62 0.63 0.58 0.59
British Airways 0.54 0.54 0.57 0.54 0.51 0.54
Fly Emirates 0.45 0.46 0.61 0.61 0.61 0.55
US Airways 0.44 0.46 0.51 0.48 0.45 0.47
Source: Calculations based on data collected from Air Namibia (Pty) Ltd, Kenya
Airways, British Airways, Fly Emirates and US Airways website during June 2013.
Air Namibia (Pty) Ltd does not own airplanes. That is how the fleet costs to total assets
ratio was zero. The rest of the airlines owned aeroplanes. Kenya airways fleet costs
were 59 per cent of the total airline assets, Fly emirates had 55 per cent fleet costs to
total assets, British Airways had 54 per cent fleet costs of total assets and US Airways
had 47 per cent.

146
Table 4.33: Analysis of Operating Costs of Air Namibia (Pty) Ltd
2007 2008 2009 2010 2011
Ground Staff Costs 12% 13% 13% 14% 15%
Flight Staff Costs 20% 21% 22% 21% 19%
Petroleum Costs 24% 25% 23% 25% 26%
Maintenance Costs 9% 10% 11% 10% 12%
Fleet Costs/ Lease Rent 35% 31% 31% 30% 28%
Total Operating Costs 100% 100% 100% 100% 100%
Figure 5. Analysis of Operating Costs of Air Namibia (Pty) Ltd
Source: Calculations based on data collected from Air Namibia (Pty) Ltd website during
June 2013.
0%
5%
10%
15%
20%
25%
30%
35%
40%
2007 2008 2009 2010 2011
Ground Staff Cost
Flight Staff Cost
Petroleum Cost
Maintenance Cost
Fleet Cost/ Lease Rent

147
Figure 5 indicated that, fleet costs/ lease rent was the highest contributor to airline
operating cost, followed by petroleum costs, flight staff costs, ground staff costs and
maintenance costs.
Table 4.34: External Benchmark Analysis of Operating Costs of selected Airlines
Average/
Standard Air Namibia (Pty) Ltd
Ground Staff Cost 14% 13%
Flight Staff Cost 21% 21%
Petroleum Cost 24% 25%
Maintenance Cost 15% 10%
Fleet Cost/ Lease Rent 27% 31%
Total Operating Costs 100% 100%
Figure 6. External Benchmark Analysis of Operating Costs of Air Namibia (Pty) Ltd
Source: Calculations based on data collected from Air Namibia (Pty) Ltd, Kenya
Airways, British Airways, Fly Emirates and US Airways website during June 2013.
0%
5%
10%
15%
20%
25%
30%
35%
Average/ Standard
Air Namibia (Pty) Ltd

148
Figure 6 indicated that proportion of Air Namibia (Pty) Ltd ground staff costs to
operating cost was equal to the average ground staff costs of the peers. Proportions of
average flight staff costs and maintenance costs were below the average flight staff costs
and maintenance costs of the peers, while, the proportions of petroleum costs and fleet
costs/ lease rent exceeded the petroleum costs and fleet costs/ lease rent of the peers.
Higher proportions of average petroleum costs and fleet costs/ lease rent are matters of
grave concern and the management should initiate appropriate measures to bring down
these costs. This is necessary for ensuring viability of the airline.
4.7 Decomposition Analysis of Revenues, Costs and Profitability
Decomposition analysis is done using vertical or common size statement analysis (Loth,
2004). For decomposition of revenue, costs and profitability of each item is reported as a
percentage of revenue. This technique expresses quantities as a percentage of revenue as
base figure. Common size income statements are basically used for analysis purposes
where each item on the face of income statement is expressed in relation to revenue so
that users can easily understand that how different expenses and other incomes and gains
adds up to gross profit and net profit. This is widely used in ratio analysis and serves as a
vital tool for financial analysis of key areas of performance.

149
Table 4.35: Decomposition Analysis of Revenues, Costs and Profitability of Air
Namibia (Pty) Ltd (% of Revenue)
Air Namibia (Pty) Ltd Mar-07 Mar-08 Mar-09 Mar-10 Mar-11
Revenue 100.00 100.00 100.00 100.00 100.00
Expenditure -128.45 -120.32 -141.37 -124.62 -132.38
Operating Loss -28.45 -20.32 -41.37 -24.62 -32.38
Other Income 1.12 5.30 4.48 3.57 0.97
Operating loss before
financing costs and financial
assistance -27.33 -15.02 -36.89 -21.13 -33.27
Government financial
assistance 17.92 0.03 11.56 13.73 9.85
Net financing -2.86 0.00 0.40 -0.51 -18.54
Profit (Loss) before taxation -12.27 -0.03 -24.93 -8.18 -33.27
Taxation 0.00 0.00 0.00 0.00 0.00
Loss for the year -12.27 -0.03 -24.93 -8.18 -33.27
Source: Calculations based on data collected from Air Namibia (Pty) Ltd website during
June 2013.
Air Namibia (Pty) Ltd operating expenditure was more than the revenue generated by
the airline for all years resulting in operating loss. The airline had no single dollar left to
pay dividend to the shareholder or to pay tax to the government. Additionally, the airline
was not able to pay for finance costs on bank overdraft since it failed to breakeven. Air
Namibia (Pty) Ltd had to receive government financial assistance in order to pay for
apart of the direct operating expenditure and meet the finance costs. The government
assistance was also not sufficient for the airline to cover the loss and it had to carry over
the loss from year to year. This created cash flow problems. The airline management

150
failed to keep the operating expenditure at minimum or to attract enough passengers for
the airline to breakeven. This indicated that the airline management should be active on
both the fronts, on one hand increasing the revenue and on the other hand keeping the
operating expenditure down.
4.8 Trend Analysis
Trend analysis is a financial analysis technique aimed at detecting improvements or
deterioration of financial ratios over time (Rosenberg, 2009). This process compares the
firm’s performance during the most recent year with prior years. For instance, the
financial analyst may notice that a ratio is lower (or higher) than before. Considered
alone, the ratio may not give useful indication but when compared over several years, a
rising (or declining) trend may be detected and the financial analyst may conclude that
the firm is becoming healthier or weaker as the case may be.
Trend analysis (Horizontal analysis) is a financial statement analysis technique that
shows changes in the amounts of corresponding financial statement items over a period
of time (Rosenberg, 2009). It is a useful tool to evaluate the trend situation. The
statements for two or more periods are used in trend analysis. The earliest period is
usually used as the base period and the items on the statements for all later periods are
compared with items on the statement of the base period. The changes are generally
shown both in dollars or percentage.

151
4.9 Trend Analysis of Revenues, Costs and Profitability
Table 4.36: Trend Analysis of Revenues, Costs and Profitability of Air Namibia
(Pty) Ltd
Air Namibia (Pty) Ltd Mar-07 Mar-07 Mar-08 Mar-09 Mar-10 Mar-11
000
Revenue 854 122 100 120.43 151.97 136.45 142.69
Expenditure (1 097 162) 100 112.80 167.26 132.38 147.05
Operating Loss ( 243 040) 100 86.00 220.98 118.07 162.39
Other Income 9 605 100 567.21 605.98 432.85 122.87
Operating loss before
financing costs and
financial assistance ( 233 435) 100 66.20 205.13 105.49 173.70
Government financial
assistance 153 050 100 350.71 98.01 104.54 78.41
Net financing ( 24 438) 100 21.15 -21.27 24.42 924.61
Profit (Loss) before
taxation ( 104 823) 100 -359.71 -308.77 -90.93 -386.81
Taxation - - - - - -
Loss for the year ( 104 823) 100 -359.71 -308.77 -90.93 -386.81
Source: Calculations based on data collected from Air Namibia (Pty) Ltd website during
June 2013.
The trend analysis indicated that Air Namibia (Pty) Ltd revenue had been increasing
relative to 2007 base year. It increased 42.69% over five years. But the operating
expenditure had been increasing more than the increase in revenue. This resulted in
increased operating loss of 62.39% over 5 years. The operating loss had been increasing
every year. Other incomes also increased the highest being in 2009 about 605%
compared to 2007 base year. Since the airline operating expenditure exceeded the
152
revenue generated, there was a need for the government to inject cash into the airline to
help with payments for operating activities. The government injected more cash every
year. The airline managed to reduce its net financing costs with government assistance.
The loss before government assistance had been increasing. After government assistance
it increased in some years and reduced in other years. The airline solely depended on the
government assistance to carry on its operations.
4.10 Forecasting Air Namibia (Pty) Ltd Financial Performance by 2015 and 2020
The researcher forecasted Air Namibia (Pty) Ltd performance for 31 March 2015 and
2020 financial year. This indicates the position if the present trend continues.

153
Table 4.37: Forecasting of Air Namibia (Pty) Ltd Performance by 31 March 2015
and 2020
Air Namibia (Pty)
Ltd Mar-07
Mar-
11
Average
Mar
2015
Average
Mar 20 Mar-15 Mar-20
000
Revenue 854 122 142.69 137.88 157.88 1 177 701 1 348 525
Expenditure (1 097 162) 147.05 139.87 159.87 (1 534 626) (1 754 059)
Operating Loss ( 243 040) 162.39 146.86 166.86 ( 356 925) ( 405 533)
Other Income 9 605 122.87 432.23 452.23 41 516 43 437
Operating loss
before financing
costs and financial
assistance ( 233 435) 173.70 137.63 157.63 ( 321 275) ( 367 962)
Government
financial assistance 153 050 78.41 157.92 177.92 241 690 272 300
Net financing ( 24 438) 924.61 247.86 267.86 ( 60 572) ( 65 459)
Profit (Loss) before
taxation ( 104 823) 386.81 286.55 306.55 ( 300 375) ( 321 339)
Taxation - - -
- - -
Loss for the year ( 104 823) 386.81 286.55 307 ( 300 375) ( 321 339)
Source: Calculations based on data collected from Air Namibia (Pty) Ltd, Kenya
Airways, British Airways, Fly Emirates and US Airways website during June 2013.
The researcher used average figures for 2008 to 2011, to determine the performance for
31 March 2015 and used figures for 2008 to 2015, to determine the performance for 31
March 2020 by applying the average to March 2007 figures. On the assumption that the
trend continues as at present Air Namibia (Pty) Ltd performance was forecasted. Air
Namibia (Pty) Ltd revenue is expected to be over N$ 1 Billion for 31 March 2015 and
31 March 2020, while the expenditure is also expected to be over N$ 1 Billion. As per

154
the projection for March 2015 and March 2020 direct operating expenditure will
continue to exceed the revenue generated by the airline and the airline will continue to
realise operating losses from operations. The airline other incomes was not sufficient
enough to offset the losses realised from operations. The airline till by March 2015 and
2020 will continue to depend upon government bailout in order for the airline to
continue operating. The airline will continue to incur losses until 31 March 2020 unless
it manages to acquire aircraft that will change the status quo, enhance the passenger
travel, and reduce the operating costs to boost the airline operating profits. Until the
airline depends on leased aircrafts for operations and the marketing strategy continues to
attract fewer passengers, the situation will remain the same.
The airline industry is highly competitive and is exposed to many risks; among them
fuel price volatility, rigorous regulated environment and safety compliance are main.
Passengers travel preferences and buying decisions have evolved over time to such an
extent that today’s travellers have become better informed and sophisticated. These
factors have made airline to make crucial decisions to improve financial performance,
operational efficiency and compliance with safety and regulatory requirements.
However, the factors affecting Air Namibia (Pty) Ltd negatively have remained beyond
its control. The airline has to reduce the impact of all these factors. Otherwise, with
these impacting factors, Air Namibia (Pty) Ltd will continue to make losses from
operations and will continue to receive the government bailout until March 2020 and
beyond.
155
4.11 Root Cause Analysis of Profitability
Root cause analysis is a class of problem solving method aimed at identifying the root
causes of problems or events. The root cause analysis is a structured process that
uncovers the physical, human and latent causes of any undesirable event or problems
(Tronskar, 2010).
The analysis shows that Air Namibia (Pty) Ltd root causes of negative profitability are
the followings:
1. Lack of Demand: The airline does not have full demand for the air tickets and
cargo to utilise the aircraft to full capacity. Lack of filling the aircraft to capacity
resulted in realising less sales revenue.
2. Operating Costs: The airline had high direct operating costs, which exceeded the
sales revenue realised from airline operations. The high direct costs resulted in
the airline realising operating loss from operations and failing to breakeven.
Some of the costs that relate to passengers safety are statutory that the airline
cannot avoid or minimize, but the scope for cost reduction in other areas needs to
be explored and implemented.
3. Leased Aircraft: The airline does not own aircraft for the operations and
generating sales revenue. It leases the aircraft, which bear high lease rent and
interest payments and minimizes the airline profit.
4. Management Skill: The existing management lack ability to manage airline
operations successfully. This leads to airline outsourcing management to

156
professional consultants, which are costly for the airline. The burden of staff
costs is high due to skill deficit.
5. Security Deposit: The airline has made high security deposits against the aircraft
leased. This resulted in high interest costs.
6. Competition: The airline has to face competition on all international routes. It has
monopoly on domestic flights but they are not profitable as the ticket prices are
kept low to promote air travel.
CAUSES EFFECT
Aircraft Leases Low Sales Revenue
High Rental Fees High Tickets Prices High cost prices
leads to high
Huge Security Deposit High Competition from rival operating
costs, which
exceed the
High Staff Cost High Consultant Fees revenue
generated by
High Fuel Cost High Cost on In-flight the airline
Operating Costs Outsource
Figure 7. Root Cause Analysis of Profitability of Air Namibia (Pty) Ltd
Source: Data collected from Air Namibia (Pty) Ltd website during June 2013.

157
4.12 Overall Discussion and Findings on Profitability
Air Namibia (Pty) Ltd had recorded losses in all the years under study. The airline had to
depend upon government bailout in order for it to sustain the operations. The researcher
noted that the airline expenditure was high in relation to revenue generated from
operations and the airline could not pay its creditors and employees on time. The
government had to provide the needed funds to cover the deficit. In case of other airlines
the situation was better. They could raise enough revenue from airline operations to
meet the operating expenditure and show operating profit.
4.13 Cash Flows Analysis
Cash flow analysis is an examination of a company's cash inflows and outflows during a
specific period. A firm's cash flow is the movement of cash in and out of the firm in the
form of payments to suppliers and collections from customers. Cash flows typically arise
from three sources: operations, investing, and financing (Peavler, 2012). The analysis
begins with the cash balance and ends with the cash balance after accounting for all cash
receipts and cash payments during the period. The cash flow analysis is an essential
component of annual financial report of a company. Cash flow forecasts are used for
cash planning and to determine the future cash flow deficit or surplus.
The cash flows shown in a cash flow statement are classified into three parts – cash
flows from operations, cash flows from financing and cash flows from investing
activities (Peavler, 2012). Cash flows from financing activities show the cash inflows

158
and outflows related to transactions with the providers of finance i.e. the owners,
financiers and creditors of the company. Thus, cash flows from financing activities
include the following basic components:
a) Proceeds from borrowings (both short-term and long-term)
b) Cash received from owners usually on issuance of stock
c) Repayments of borrowings
d) Repayments to owners
Operating cash flows or cash from operations is a measure of cash generated by a
company's normal business operations. Operating cash flow is important because it
indicates whether a company is able to generate sufficient positive cash flow to maintain
and grow its operations, or whether it may require external financing. Operating cash
flow is calculated by adjusting net income for items such as depreciation, changes to
accounts receivable and changes in inventory (Peavler, 2012).
Cash flows from investing activities shows the details of cash flows related to
acquisition and disposal of a company's long-term investments, such as property, plant
and equipment, investment in subsidiaries and associates. Cash flows from investing
activities inform the users of the financial statements whether the company is investing
in resources that are expected to result in increased profits in future or whether it is
disposing out resources already owned. The following are cash flows that are typically
reported as cash flows from investing activities:

159
a) Cash payments to acquire or construct long-term fixed assets such as plant and
machinery, vehicles and equipment.
b) Cash receipts from sale of property, plant and equipment and intangible assets
such as buildings, and copyrights.
c) Cash payments to purchase bonds or shares of other companies (subsidiaries,
associates and joint ventures).
d) Cash receipts from sale of bonds and shares of other companies.
e) Cash payments in the form of loans and advances and receipts related to payback
of such loans and receivables.
The cash flow statements of Air Namibia (Pty) Ltd, Kenya Airways, British Airways,
Fly Emirates and US Airways for five years from April 2006 to March 2011 are given in
annexure 2.
To identify the factors driving cash flows in airline industry and determine the cash flow
problems faced by Air Namibia (Pty) Ltd analysis of cash flow statements of the airlines
for five year period from April 2006 to March 2011 was done. The cash flows were also
compared with cash flows of other airlines.
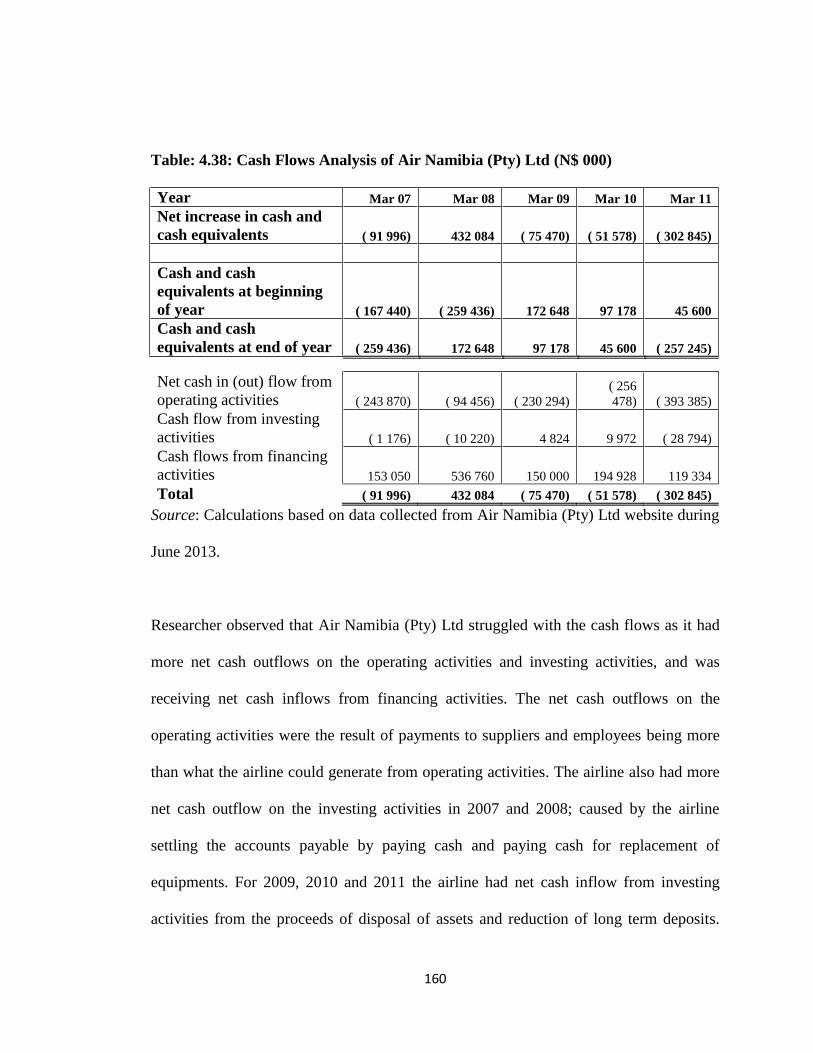
160
Table: 4.38: Cash Flows Analysis of Air Namibia (Pty) Ltd (N$ 000)
Year Mar 07 Mar 08 Mar 09 Mar 10 Mar 11
Net increase in cash and
cash equivalents ( 91 996) 432 084 ( 75 470) ( 51 578) ( 302 845)
Cash and cash
equivalents at beginning
of year ( 167 440) ( 259 436) 172 648 97 178 45 600
Cash and cash
equivalents at end of year ( 259 436) 172 648 97 178 45 600 ( 257 245)
Net cash in (out) flow from
operating activities ( 243 870) ( 94 456) ( 230 294)
( 256
478) ( 393 385)
Cash flow from investing
activities ( 1 176) ( 10 220) 4 824 9 972 ( 28 794)
Cash flows from financing
activities 153 050 536 760 150 000 194 928 119 334
Total ( 91 996) 432 084 ( 75 470) ( 51 578) ( 302 845)
Source: Calculations based on data collected from Air Namibia (Pty) Ltd website during
June 2013.
Researcher observed that Air Namibia (Pty) Ltd struggled with the cash flows as it had
more net cash outflows on the operating activities and investing activities, and was
receiving net cash inflows from financing activities. The net cash outflows on the
operating activities were the result of payments to suppliers and employees being more
than what the airline could generate from operating activities. The airline also had more
net cash outflow on the investing activities in 2007 and 2008; caused by the airline
settling the accounts payable by paying cash and paying cash for replacement of
equipments. For 2009, 2010 and 2011 the airline had net cash inflow from investing
activities from the proceeds of disposal of assets and reduction of long term deposits.

161
The airline had net cash inflow from financing activities from government bailout since
it was struggling with the availability of cash to settle debts. Overall the cash and cash
equivalents resulted in negative bank balance in 2007 and 2011 while for the rest of the
years the airline had positive cash and cash equivalents.
Table 4.39: Cash Flows Analysis of Kenya Airways (KES 000)
Year Mar 07 Mar 08 Mar 09 Mar 10 Mar 11
Net (decrease) increase in cash and
cash equivalents ( 1 367) ( 7 094) ( 4 792) ( 1 327) 1 938
Cash and cash equivalents at
beginning of year 11 144 9 777 2 683 ( 2 109) ( 3 436)
Cash and cash equivalents at end of
year 9 777 2 683 ( 2 109) ( 3 436) ( 1 498)
Net cash generated from operating
activities 7 349 6 650 4 683 7 592 9 214
Net cash used in investing activities ( 9 082) ( 2 314) ( 5 057) ( 4 850) ( 3 797)
Net cash generated from financing
activities 366
( 11
430) ( 4 418) ( 4 069) ( 3 479)
Total ( 1 367) ( 7 094) ( 4 792) ( 1 327) 1 938
Source: Calculations based on data collected from Kenya Airways website during June
2013.
Kenya airways had cash inflows from 2007 through to 2011 from operating activities,
the airline generating more cash from its operations than it paid to the suppliers and
employees. The airline used the money generated from operations to settle debts as it fell
due. The airline had cash outflows due to purchase of property plant and equipment and
providing security deposit for the aircraft. Acquired assets were used in the operations to
generate more cash inflows from operations. The airline had cash inflows in 2007 from
long term borrowings, in 2008 to 2011 the airline had cash outflow as a result of

162
repaying the long term debts, investing in short term deposits, investments held to
maturity and paying dividends to shareholders. The airline thus had been busy settling
debts and investing for future use.
Table 4.40: Cash Flows Analysis of British Airways (£ 000)
Year Mar 07 Mar 08 Mar 09 Mar 10 Mar 11
Net (decrease) increase in cash
and cash equivalents 315 ( 30) ( 281) 384 ( 216)
Cash and cash equivalents at
beginning of year 398 713 683 402 786
Cash and cash equivalents at
end of year 713 683 402 786 570
Cash generated from operations 756 303 133 331 836
Net cash flow from investing
activities 36 ( 42) ( 257) ( 337) ( 826)
Net cash flow from financing
activities ( 477) ( 291) ( 157) 390 ( 226)
Total 315 ( 30) ( 281) 384 ( 216)
Source: Calculations based on data collected from British Airways website during June
2013.
British Airways had cash inflows generated from operations in all the years, as a result
of profits realised and write back of non cash items such as depreciation. The net cash
inflow from investing activities occurred only in 2007 and in rest of the financial years
there were cash outflows due to acquisition of property, plant and equipment, intangible
assets and purchase of a subsidiary. The airline recorded also net cash outflows from

163
financing activities in all the years except for in 2010, as a result of repayment of long
term borrowings, payment for finance lease and payment of dividends to shareholders.
The airline also made payments of long term borrowings.
Table 4.41: Cash Flow Analysis of Fly Emirates (AED 000)
Year Mar 07 Mar 08 Mar 09 Mar 10 Mar 11
Net (decrease) increase in cash and
cash equivalents 818 ( 5 356) 1 833 4 775 865
Cash and cash equivalents at
beginning of year 7 252 8 070 2 714 4 547 9 322
Cash and cash equivalents at end of
year 8 070 2 714 4 547 9 322 10 187
Net cash used in operating activities 5 765 7 335 5 016 8 328 11 004
Net cash used in investing activities ( 4 749) ( 8 869) 1 897 ( 577) ( 5 092)
Net cash used in financing activities ( 198) ( 3 822) ( 5 080) ( 2 976) ( 5 047)
Total 818 ( 5 356) 1 833 4 775 865
Source: Calculations based on data collected from Air Namibia (Pty) Ltd Fly Emirates
website during June 2013.
Fly Emirates had net cash inflow from operations for all the years as a result of profit
margin, depreciation write back, and finance cost write back and increase in accounts
payable. The airline recorded net cash outflow on investing activities, in all years except
for in 2009 when it recorded net cash inflow as a result of the acquisition of intangible
assets, acquisition of property, plant and equipment and investment in associates. Fly
emirates also had net cash outflow from financing activities as a results of aircraft

164
financing costs, other finance charges, net lease liability, and dividend payment to
minority shareholders. Thus, the net movement in cash and cash equivalent was negative
only in 2008 and for the rest of the year’s cash and cash equivalents were positive.
Table 4.42: Cash Flow Analysis of US Airways (US$)
Years Mar 07 Mar 08 Mar 09 Mar 10 Mar 11
Net (decrease) increase in cash and
cash equivalents 16 ( 914) 479 579 ( 516)
- - - - -
Cash and cash equivalents at
beginning of year 22 38 ( 876) ( 397) 182
- - - - -
Cash and cash equivalents at end of
year 38 ( 876) ( 397) 182 ( 334)
Net cash used in operating activities 28 ( 980) 476 823 173
Net cash used in investing activities ( 14) ( 915) ( 495) 63 ( 350)
Net cash used in financing activities 2 981 498 ( 307) ( 339)
Total 16 ( 914) 479 579 ( 516)
Source: Calculations based on data collected from US Airways website during June
2013.
US Airways recorded net cash inflow from operations in all years except for in 2008
when it recorded net cash outflow from operations. The airline had net cash outflow
from investing activities due to capital expenditure on acquisitions, which were paid in
cash. The airline had net cash outflow in 2010 and 2011 from financing activities due to
payments for borrowings and other financing charges.

165
Thus, while all other airlines managed their cash flows and generated net surplus cash
and the surplus funds were used for asset acquisitions, repayment of debt, payment of
dividend etc. However, Air Namibia (Pty) Ltd faced cash flow deficit and had to seek
cash flow bailout from the government.
4.13.1 Liquidity Analysis
Liquidity ratios are a set of ratios or figures that measure a company’s ability to pay off
its short-term debt obligations (Peavler, 2012). Liquidity analysis is done by measuring a
company’s liquid assets including those that might easily be converted into cash against
its short-term liabilities. There are a number of different liquidity ratios, which measure
different features of liquidity. More conservative measures exclude assets that need to be
converted into cash. In general, the greater the coverage of liquid assets to short-term
liabilities, the more likely a business will be able to pay debts as they become due while
still funding ongoing operations. On the other hand, a company with a low liquidity
position might have difficulties in meeting obligations while funding vital ongoing
business operations. Current ratio, acid test ratio and cash to non-cash assets ratio have
been used for liquidity analysis here.
4.13.2 Current Ratio
Current ratio matches current assets with current liabilities and indicated whether the
current assets are enough to settle current liabilities. Current ratio below 1.00 shows
critical liquidity problems as total current liabilities exceed total current assets

166
(inventory, cash and marketable securities). A general rule is that, the higher the current
ratio the better the liquidity, but there is a limit to this. Abnormally high value of current
ratio may indicate existence of idle or underutilized resources in the airline. The year to
year and average current ratios are shown here for comparison of liquidity of airlines.
The current ratio is determined as:
= Current Assets
Current Liabilities
Table 4.43: Current Ratios of selected Airlines
Mar-07 Mar-08 Mar-09 Mar-10 Mar-11 Average
Air Namibia (Pty)
Ltd 0.27 0.85 0.43 0.43 0.26 0.45
Kenya Airways 1.39 1.38 0.91 0.85 0.97 1.10
British Airways 0.95 0.97 0.57 0.71 0.75 0.79
Fly Emirates 1.46 1.22 1.10 1.01 1.07 1.17
US Airways 0.43 0.79 0.84 1.02 0.91 0.80
Source: Calculations based on data collected from Air Namibia (Pty) Ltd, Kenya
Airways, British Airways, Fly Emirates and US Airways website during June 2013.
Air Namibia (Pty) Ltd with 0.45, British Airways with 0.79 and US Airways with 0.80
average current ratios were the airlines that experienced liquidity problems. Other two
airlines Kenya Airways with 1.10 and Fly Emirates with 1.17 had better liquidity
situation. Air Namibia (Pty) Ltd with only N$ 0.45 for every N$ 1.00 owed to supplier
faced critical liquidity crisis and was unable to settle its debts as they fell due and
needed government funds to continue operating. British Airways and US Airways also

167
faced difficulties in maintaining liquidity, with GBP 0.79 for every GBP 1.00 owed to
suppliers and US Airways with USD 0.80 for every USD 1.00 owed to suppliers.
4.13.3 Acid Test Ratio
Acid test ratio also known as quick ratio measures the liquidity of airline by matching its
cash and near cash current assets with its total current liabilities. It helps to determine
whether the airline would be able to pay off all its debts by using its liquid assets (i.e.
cash, marketable securities and accounts receivable). A quick ratio of 1.00 means liquid
assets of business are equal to its total short term debts and the airline will just manage
to repay all its debts by using its cash, marketable securities and accounts receivable. A
quick ratio of more than one indicates that the liquid assets of the airline exceed its total
short term debts. On the opposite side, a quick ratio of less than one indicates that the
airline would not be able to repay all its debts by using its most liquid assets. Thus
generally, a higher quick ratio is preferable, of course not very high as it indicated
inefficiency in proper use of liquidity. The acid test ratio is determined as:
= Current Assets - Inventory
Current Liabilities

168
Table 4.44: Quick Ratios of selected Airlines
Mar-07 Mar-08 Mar-09 Mar-10 Mar-11 Average
Air Namibia (Pty)
Ltd 0.26 0.84 0.42 0.42 0.25 0.44
Kenya Airways 1.33 1.31 0.84 0.78 0.90 1.03
British Airways 0.93 0.94 0.54 0.69 0.72 0.76
Fly Emirates 1.41 1.17 1.02 0.95 1.00 1.11
US Airways 0.40 0.73 0.75 0.94 0.82 0.73
Source: Calculations based on data collected from Air Namibia (Pty) Ltd, Kenya
Airways, British Airways, Fly Emirates and US Airways website during June 2013.
Air Namibia (Pty) Ltd with 0.44, British Airways with 0.76 and US Airways with 0.73,
average quick ratio, which was less than 1.00 indicated that the airlines would not be
able to repay all their short term debts by using their liquid assets. Kenya Airways with
1.03 and Fly Emirates with 1.11 of course were in a position to settle their current
liabilities by using liquid assets. For Air Namibia (Pty) Ltd it could be possible with
government bailing out or by government providing guarantee for borrowing from
financial institutions. Still it is a difficult situation for an entity’s management as
postponement of payments for short term liabilities is not possible always, and it creates
credibility problems.
4.13.4 Cash to Non Cash Current Assets Ratio
The cash to non cash current assets ratio indicates the proportion of cash and cash
equivalent in relation to non cash current assets. Ratio at more than 1.00 indicates that
the current assets have a large proportion of cash and cash equivalent, while, below 1.00

169
means having less cash on its current assets. The cash to non cash current ratio is
determined as:
= Cash (Cash and Bank)
Current Assets – Cash (Cash and Bank)
Table 4.45: Cash to Non-Cash Current Ratios of selected Airlines
Mar-07 Mar-08 Mar-09 Mar-10 Mar-11 Average
Air Namibia (Pty)
Ltd -1.97 0.79 0.67 0.27 -1.34 -0.32
Kenya Airways 0.93 0.07 0.61 0.52 0.44 0.51
British Airways 2.19 1.45 1.43 1.79 1.94 1.76
Fly Emirates 1.45 0.17 0.41 1.00 0.87 0.78
US Airways 0.64 0.75 1.26 1.77 1.40 1.16
Source: Calculations based on data collected from Air Namibia (Pty) Ltd, Kenya
Airways, British Airways, Fly Emirates and US Airways website during June 2013.
Air Namibia (Pty) Ltd with -0.32, Kenya Airways with 0.51 and Fly Emirates with 0.78
were the airlines with average cash to non-cash current ratios below 1.00. This means
these airlines had cash flows problems. British Airways and US Airways with average
cash to non-cash current ratio of more than 1.00 faced no such problems. Air Namibia
(Pty) Ltd had negative cash to non cash current ratio due to overdrafts.
4.14 Analysis of Capital Structure
A capital structure is a combination of a company's long-term debt, specific short-term
debt, common equity and preferred equity. The capital structure shows how the firm

170
finances its overall operations and growth by using different sources of funds. The debt
may come in the form of bond issues or long-term notes payable, while equity may be in
common stock, preferred stock or retained earnings. Short-term debt if held as
permanent working capital may be also considered part of capital structure. The capital
structure is also referred as debt-to-equity ratio, which provides insight into how risky a
company is. Usually a company more heavily financed by debt poses greater risk, as the
firm is relatively highly levered. Firms use debt or equity or both to finance their assets.
The best choice is a mix of debt and equity. To understand how the capital structure and
its constituents contributed to financial soundness, profitability, cash flows and liquidity
comparative analysis of capital structures and its constituents for Air Namibia (Pty) Ltd
and other airlines was undertaken.
4.14.1 Debt-to-Equity Ratio
The debt to equity ratio reveals the proportion of assets purchased with investors’
money, and acquired with creditors’ money. Equity acts as a buffer to creditors in the
event of liquidation. The higher the leverage (more debt), the greater the risk that rigid
interest and debt payments cannot be made by fluctuating profit returns. The debt to
equity ratio is determined as:
= Total debts
Total equity

171
Table 4.46: Debt to Equity Ratios of selected Airlines
Mar-07 Mar-08 Mar-09 Mar-10 Mar-11 Average
Air Namibia (Pty)
Ltd -1.45 -5.72 -1.77 -1.73 -1.42 -2.42
Kenya Airways 2.57 2.20 3.42 2.67 2.41 2.65
British Airways 4.06 2.60 5.25 4.48 3.33 3.94
Fly Emirates 0.81 1.78 1.88 2.20 2.14 1.76
US Airways 15.47 -15.29 -22.00 20.65 37.48 7.26
Source: Calculations based on data collected from Air Namibia (Pty) Ltd, Kenya
Airways, British Airways, Fly Emirates and US Airways website during June 2013.
Air Namibia (Pty) Ltd’s equity was negative, due to accumulated losses. More over its
debt to equity ratio was negative at more than one, which indicated that the airline’s total
debts exceeded total equity. For all other airlines the average debt to equity ratio was
more than one, which indicated that the airlines were financed from debts more than
equity. US Airways had the highest average ratio at 7.26. British Airways, Kenya
Airways and Fly Emirates had average ratios of 3.94, 2.65 and 1.76 respectively. Thus,
all airlines had higher debt in relation to equity and were required to pay interest on
borrowings creating higher risk, especially due to higher interest rates. However, since
debt is lower cost source of funds it created financial leverage and higher rate of return
on investment for shareholders.
4.14.2 Owners Funds to Total Debt Ratio
The owners’ funds to total debt ratio indicates the ratio of owners’ funds over total
debts, that is whether the funds provided by shareholders are more or less than funds
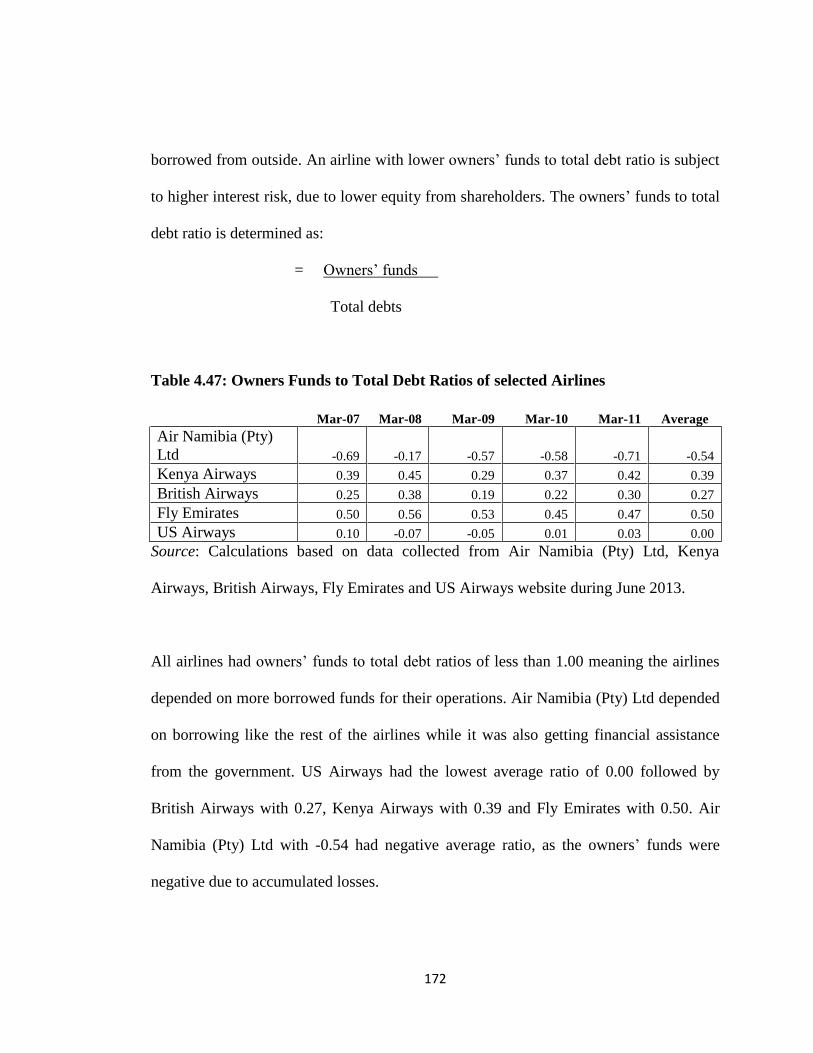
172
borrowed from outside. An airline with lower owners’ funds to total debt ratio is subject
to higher interest risk, due to lower equity from shareholders. The owners’ funds to total
debt ratio is determined as:
= Owners’ funds
Total debts
Table 4.47: Owners Funds to Total Debt Ratios of selected Airlines
Mar-07 Mar-08 Mar-09 Mar-10 Mar-11 Average
Air Namibia (Pty)
Ltd -0.69 -0.17 -0.57 -0.58 -0.71 -0.54
Kenya Airways 0.39 0.45 0.29 0.37 0.42 0.39
British Airways 0.25 0.38 0.19 0.22 0.30 0.27
Fly Emirates 0.50 0.56 0.53 0.45 0.47 0.50
US Airways 0.10 -0.07 -0.05 0.01 0.03 0.00
Source: Calculations based on data collected from Air Namibia (Pty) Ltd, Kenya
Airways, British Airways, Fly Emirates and US Airways website during June 2013.
All airlines had owners’ funds to total debt ratios of less than 1.00 meaning the airlines
depended on more borrowed funds for their operations. Air Namibia (Pty) Ltd depended
on borrowing like the rest of the airlines while it was also getting financial assistance
from the government. US Airways had the lowest average ratio of 0.00 followed by
British Airways with 0.27, Kenya Airways with 0.39 and Fly Emirates with 0.50. Air
Namibia (Pty) Ltd with -0.54 had negative average ratio, as the owners’ funds were
negative due to accumulated losses.

173
4.14.3 Owners Funds to Total Assets
The owners’ funds to total assets ratio indicates the extent of use of owners’ funds for
creating assets. In all enterprises generally the initial capital for assets is contributed by
owners. At a later stage the assets built from owners’ funds may form the basis of debt.
Proportion of owners’ funds to total assets shows the strength and stability of the
enterprise. Owners’ funds to total assets indicate the relationship of funds provided by
the shareholders to total assets employed by the airlines to generate income. If the ratio
is less 1.00 it means the airline has used fewer owners’ funds for assets. The owners’
fund to total assets is determined as:
= Owners’ funds
Total assets
Table 4.48: Owners’ Funds to Total Assets of selected Airlines
Mar-07 Mar-08 Mar-09 Mar-10 Mar-11 Average
Air Namibia (Pty)
Ltd -2.21 -0.21 -1.30 -1.36 -2.40 -1.50
Kenya Airways 0.28 0.32 0.23 0.27 0.29 0.28
British Airways 0.19 0.27 0.16 0.18 0.23 0.21
Fly Emirates 0.14 0.36 0.35 0.31 0.32 0.29
US Airways 0.06 -0.07 -0.05 0.01 0.03 -0.00
Source: Calculations based on data collected from Air Namibia (Pty) Ltd, Kenya
Airways, British Airways, Fly Emirates and US Airways website during June 2013.
US Airways had average owners’ funds to total assets ratio of 0.00, meaning, owners’
funds were insignificant relative to total assets. Fly Emirates had the highest owners’

174
funds relative to its total assets with average ratio of 0.29, followed by Kenya Airways
with average ratio of 0.28. Air Namibia (Pty) Ltd had average ratio of -1.50, due to
negative owners’ funds. This indicated that it possessed assets that have heavy charge of
borrowings.
4.14.4 Total Debts to Total Assets Ratio
Total debt to total assets ratio shows the proportion of debt in total assets. The average
ratio of more than 1.00 means the airline had more debt than total assets, while, the
average ratio of less than 1.00 mean the airline had more total assets than total debts.
The total debt to total assets ratio is determined as:
= Total debt
Total Assets
Table 4.49: Total Debt to Total Assets Ratios of selected Airlines
Mar-07 Mar-08 Mar-09 Mar-10 Mar-11 Average
Air Namibia (Pty) Ltd 3.21 1.21 2.30 2.36 3.40 2.50
Kenya Airways 0.72 0.69 0.77 0.73 0.71 0.72
British Airways 0.79 0.71 0.82 0.80 0.76 0.78
Fly Emirates 0.28 0.64 0.65 0.69 0.68 0.59
US Airways 0.88 1.07 1.05 0.99 0.97 0.99
Source: Calculations based on data collected from Air Namibia (Pty) Ltd, Kenya
Airways, British Airways, Fly Emirates and US Airways website during June 2013.

175
Air Namibia (Pty) Ltd’s average ratio of 2.50 indicated that it had 2.5 times more total
debt than total assets. If the airline was to be liquidated, Air Namibia (Pty) Ltd would
not have sufficient assets to sell off to settle the debts. The rest of the airlines with
average ratio below 1.00 had more total assets than total debts. US Airways had the
highest ratio of 0.99, which showed that the airline’s debt were almost equal to total
assets.
4.14.5 Long Term Debt to Short Term Debt
Generally, long term debt is obtained to create long term assets and short term debt is
obtained for working capital. However, sometimes a part of the working capital
(permanent working capital) is also provided from long term funds to minimize the total
cost of funds, as the cost of long term debt is lower. The proportion between the long
term debt and short term debt depends upon the nature of industry; some require more
long term debt while others require more short term debt. Airline industry requires long
term heavy investment in aircraft. The ratio of more than 1.00 means the airline had
more long term debt compared to short term debt. An airline with the ratio at less than
1.00 means the airline had more short term debt compared to long term debt. The ratio
of long term debt to short term debts is determined as:
= Long term debt
Short term debt
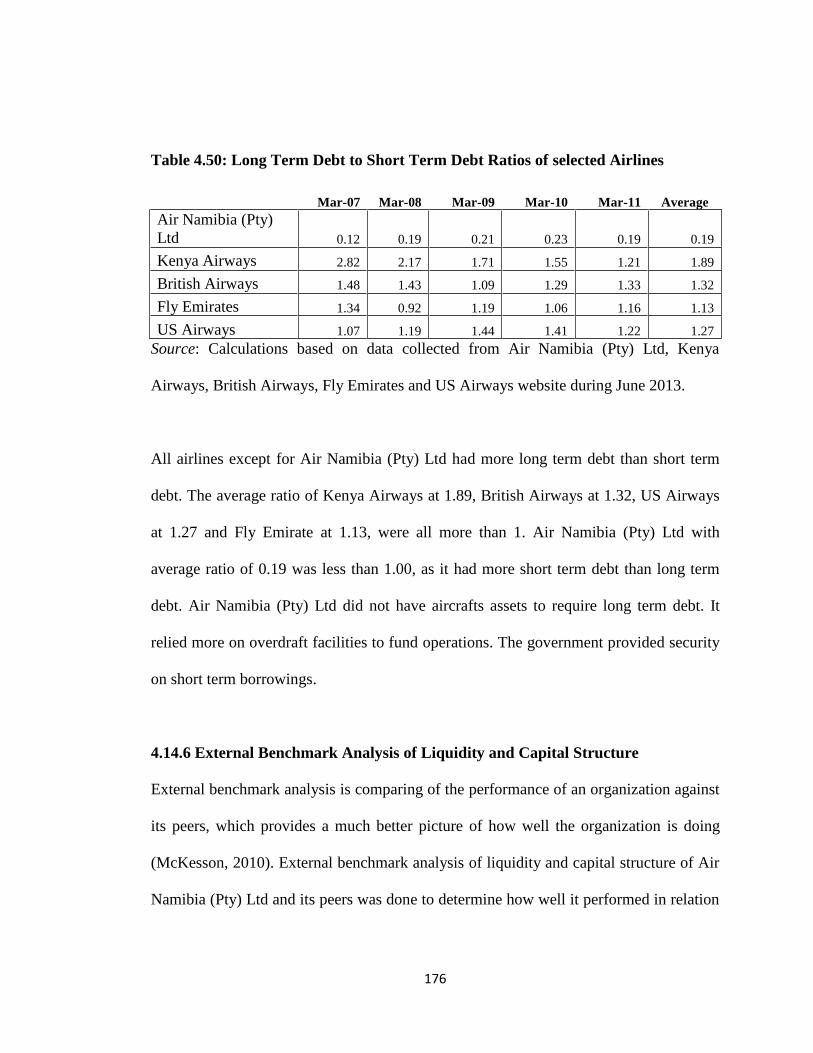
176
Table 4.50: Long Term Debt to Short Term Debt Ratios of selected Airlines
Mar-07 Mar-08 Mar-09 Mar-10 Mar-11 Average
Air Namibia (Pty)
Ltd 0.12 0.19 0.21 0.23 0.19 0.19
Kenya Airways 2.82 2.17 1.71 1.55 1.21 1.89
British Airways 1.48 1.43 1.09 1.29 1.33 1.32
Fly Emirates 1.34 0.92 1.19 1.06 1.16 1.13
US Airways 1.07 1.19 1.44 1.41 1.22 1.27
Source: Calculations based on data collected from Air Namibia (Pty) Ltd, Kenya
Airways, British Airways, Fly Emirates and US Airways website during June 2013.
All airlines except for Air Namibia (Pty) Ltd had more long term debt than short term
debt. The average ratio of Kenya Airways at 1.89, British Airways at 1.32, US Airways
at 1.27 and Fly Emirate at 1.13, were all more than 1. Air Namibia (Pty) Ltd with
average ratio of 0.19 was less than 1.00, as it had more short term debt than long term
debt. Air Namibia (Pty) Ltd did not have aircrafts assets to require long term debt. It
relied more on overdraft facilities to fund operations. The government provided security
on short term borrowings.
4.14.6 External Benchmark Analysis of Liquidity and Capital Structure
External benchmark analysis is comparing of the performance of an organization against
its peers, which provides a much better picture of how well the organization is doing
(McKesson, 2010). External benchmark analysis of liquidity and capital structure of Air
Namibia (Pty) Ltd and its peers was done to determine how well it performed in relation

177
to other airlines in relation to liquidity and capital structure. The average for the other
four airlines was taken as standard for comparison of Air Namibia (Pty) Ltd.
Table 4.51: External Benchmark Analysis of Liquidity and Capital Structure of Air
Namibia (Pty) Ltd
EXTERNAL
BENCHMAKING Kenya
Airways
British
Airways
Fly
Emirates
US
Airways
Standard/
Average
Air Namibia
(Pty) Ltd
Current Ratio
1.10
0.79
1.17
0.80 0.97 0.45
Acid Test Ratio
1.03
0.76
1.11
0.73 0.91 0.44
Cash to Non Cash
Current Assets
0.51
1.76
0.78
1.16 1.05 0.32
Debt to Equity Ratio
2.65
3.94
1.76
7.26 3.90 - 2.42
Owners Funds to Total
Debts
0.39
0.27
0.50
- 0.29 - 0.54
Owners Funds to Total
Assets
0.28
0.21
0.29
- 0.20 - 1.50
Long Term Debts to
Short Term Debts
1.89
1.32
1.13
1.27 1.40 0.19
Total Debts to Total
Assets
0.72
0.78
0.59
0.99 0.77 2.50
Source: Calculations based on data collected from Air Namibia (Pty) Ltd, Kenya
Airways, British Airways, Fly Emirates and US Airways website during June 2013.

178
Figure 8. External Benchmark Analysis of Liquidity and Capital Structure of Air
Namibia (Pty) Ltd.
Source: Calculations based on data collected from Air Namibia (Pty) Ltd, Kenya
Airways, British Airways, Fly Emirates and US Airways website during June 2013.
Air Namibia (Pty) Ltd had lower liquidity compared to its peers as the current ratio, acid
test ratio, and cash to non cash current assets were lower. This indicated that the airline
was not in a position to pay for its debts as they may fall due from its current assets.
Regarding the capital structure, Air Namibia (Pty) Ltd had negative owners’ funds to
total assets, owners’ funds to total debt and debt to equity ratio. It had more debt to total
asset creating doubt about its solvency and going concern position. However, it survives
( 3)
( 2)
( 1)
-
1
2
3
4
5
CurrentRatio
Acid TestRatio
Cash toNonCash
CurrentAssets
Debt toEquityRatio
OwnersFunds to
TotalDebts
OwnersFunds to
TotalAssets
LongTerm
Debts toShortTermDebts
TotalDebts to
TotalAssets
Standard/AverageAverage
Air NamibiaAverage

179
and operates with the funds provided by the government to meet losses and take care of
cash flow problems.
4.14.7 Root Cause Analysis of Cash Flows and Liquidity
The root cause analysis of cash flows of Air Namibia (Pty) Ltd highlighted the
following:
1. The cash flows problems of the airline were caused by the slower inflow from
receipts and faster outflows on payments.
2. The airline has to make periodic payments on aircraft leases, office rentals and
employees’ salaries, which caused mismatch between cash inflows and outflows.
3. The airline had more burden of suppliers’ payments than the customers paying it.
This caused mismatch between cash flows from operations.
4. The airline was granted overdraft facility on short term basis, which required the
airline to settle the overdrafts in twelve months. This created a burden on the
cash flows.
5. The airline could not borrow on long term or raise funds by issuing shares. It
relied on inflows from ticket sales and government bailout, which did not match
with the outflows creating cash flow deficit.
6. The management of accounts receivable and accounts payable of the airline was
poor and it struggled in the making payments to the suppliers.

180
CAUSES EFFECT
Cash Inflows Cash Outflows
Low Cash Sales Pressure of Payments to Creditors Mismatch
between
Low Debtors Collection Periodic Fixed Payments cash inflows
and
cash outflows
Lack of Cash Flow Forecast No Share Issue caused
cash flow
Higher Short Term Debt Lack of Assets for Security problems
Cash Payments Raising of Funds
Figure 9. Root Cause Analysis of Cash Flows and Liquidity of Air Namibia (Pty) Ltd
Source: Data collected from Air Namibia (Pty) Ltd, Kenya Airways, British Airways,
Fly Emirates and US Airways website during June 2013.
4.14.8 Overall Discussion and Findings on Cash flows
Air Namibia (Pty) Ltd struggled with the cash flows for the five years under study. The
cash flow problems were mainly caused by the lack of sales revenue, as the airline
struggled to generate revenue by fully booking its aircraft. The airline had a lot of fixed
operating costs that it had to pay irrespective of whether or not the airline generated
revenue. The fixed costs created cash outflows more than the airline generated cash

181
inflows. This caused deficit for the airline. For the airline to remain in business the
government had to inject cash in Air Namibia (Pty) Ltd in order to reduce the mismatch
between cash inflows and cash outflows. The main areas the airline was experiencing
cash flows problems were cash flows from operating and cash flows from investing
activities. These two areas caused cash flows problem. The cash flows from financing
activities were not sufficient to offset the cash outflows created by cash flows from
operations and investing activities.
4.15 Conclusion
The analysis of profitability and cash flows of Air Namibia (Pty) Ltd showed that the
operation of the airline is not profitable due to both the lower revenue generation from
air ticket bookings and high operating costs. The recurring history of loss from year to
year created cash flow problems. However, the airline survived from government bailout
and guarantees for borrowings.

182
CHAPTER 5
Findings, Recommendations and Conclusion
5.1 Introduction
This Chapter outlines the findings of the study, provides the recommendation to the
management of Air Namibia (Pty) Ltd, and finally gives conclusion of the study.
5.2 Findings
a) Profitability
Air Namibia (Pty) Ltd earnings before interest, tax, depreciation and
amortization were negative for the five years consecutively as the operating
expenditure exceeded the sales revenue from operations. The airline failed to
generate sales revenue more than the operational expenditure and also failed to
maintain the operating expenditure at the minimum. The other airlines however
had positive earnings before interest, tax, depreciation and amortization.
The earnings before interest and tax for Air Namibia (Pty) Ltd were negative
throughout the study period as a results of expenditure exceeding the sales
revenue, while other airlines had positive earnings before interest and tax.
Air Namibia (Pty) Ltd earnings after tax was negative throughout the five years
under study. The airline did not pay tax to the government since its earnings
after tax were negative. Other airlines paid tax and yet their earnings were
positive.
183
Air Namibia (Pty) Ltd had high other income from fuel hedge, which the airline
engaged in order reduce the impact of fuel price fluctuation.
Air Namibia (Pty) Ltd made operating losses for the period starting from 1 April
2006 to 31 March 2011, while, other airlines made profits.
Air Namibia (Pty) Ltd gross profit (loss) margin was negative throughout the
five years under study. The negative gross profit margin indicated that the airline
could not generate sales revenue in excess of the direct operating costs i.e. the
airline did not breakeven for the period from April 2007 to March 2011, as the
operating costs exceeded the sales revenue.
Air Namibia (Pty) Ltd realized high other income on investments, as the airline
invested in securities that yielded returns. Some of these airline investments
were used as security deposits for the aircraft the airline was leasing. Other
airlines had no such income from security deposits.
Air Namibia (Pty) Ltd earnings before interest were negative for the whole
period of study resulting from earnings per passenger travelled being negative.
This indicated that the airline did not have enough passengers to cover the cost
of flying the aircrafts. The airline could not attract enough passengers that would
have enabled it to breakeven and show positive earnings before interest and tax.
Air Namibia (Pty) Ltd incurred loss of more than N$ 4 000 on every kilometer
the aircraft travelled, and had to depend on bailout from government in order to
pay for the costs incurred.

184
Air Namibia (Pty) Ltd had negative earnings per passenger per kilometer
travelled throughout the period of under study.
Air Namibia (Pty) Ltd operations and administration costs were more than net
sales revenue generated by the airline, as the costs of transporting passengers
and cargo exceeded the revenue received. The airline needed to get funds from
the government in order to pay the costs to keep it operating. The rest of the
airlines had recorded operations cost and administrative cost combined less than
the revenue generated during the specific financial years.
Air Namibia (Pty) Ltd’s tax to earnings ratio was zero, as the airline did not
make positive earnings to pay tax to the government.
b) Efficiency
Air Namibia (Pty) Ltd’s returns on assets were negative due to operating losses
for the period starting 01 April 2006 to 31 March 2011, while other airlines had
positive returns on assets.
Air Namibia (Pty) Ltd had a high total assets turnover ratio as its operating
assets were small compared to other airlines. Aircrafts used in the operations of
Air Namibia (Pty) Ltd were on lease. The other airlines had their own assets and
that was the reason for total assets turnover being lower than Air Namibia (Pty)
Ltd.
Air Namibia (Pty) Ltd fleet costs to total assets was zero since the airline did not
have any fleet on its books and all the fleet used in the operations were leased.

185
All other airlines had fleets they used in the operations and their fleet costs were
made up of more than 50 per cent the airlines total assets.
The DuPont model indicated that asset turnover was efficient and was the one
that was driving Air Namibia (Pty) Ltd profit margin for five years under study,
while the operating efficiency and leverage had negative impact on the returns
for the same periods. For other airlines’ the operating efficiency, assets turnover
and leverage had positive contribution towards the returns on owners’ equity for
five years under study.
The trend analysis of income statement of Air Namibia (Pty) Ltd indicated that
the airline’s sales revenue was increasing. But as the operational expenditure
was increasing at a higher rate, it wiped out the gains of increased sales revenue.
The internal benchmark analysis of operations indicated that Air Namibia (Pty)
Ltd could not perform as per its own internal benchmarks. The airline on
average for five years planned to realise a sale of N$ 1.2 billion but only
managed average of N$ 1.1 billion, performing below its benchmark. The airline
planned on the sales revenue of N$ 1.2 billion to incur operational expenditure
of N$ 1.18 billion, but exceeded it by N$ 0.26 billion. This indicated poor
performance on sales revenue and expenditure control.
External benchmark analysis of profitability indicated that Air Namibia (Pty)
Ltd performed better than its peers only on comprehensive income to investment
and operating profit. Other comprehensive income to earnings ratio, net profit
margin, earnings per passenger travelled and earnings per kilometer travelled

186
were below the benchmark and negative. This indicated poor earnings
performance of Air Namibia (Pty) Ltd compared to its peers.
External benchmark analysis of efficiency indicated that the returns on total
assets were negative and below the standard for Air Namibia (Pty) Ltd. The
airline inventory turnover exceeded the standard clocking at 229 times compared
to the standard 53 times. Total assets turnover was more than the standard, while
receivable turnover and payable turnover were less than the standard.
c) Liquidity and Cash Flows
Air Namibia (Pty) Ltd had more short term debts and less long term debts. The
short term debts were mainly from overdraft facilities with local banks and short
term borrowings from local financial institutions.
Air Namibia (Pty) Ltd total debts exceeded total assets, while for rest of the
airlines total assets exceeded their total debts.
The Air Namibia (Pty) Ltd non-current liabilities increased and in 2011 it was
double the liabilities for 2007.
Air Namibia (Pty) Ltd had low payables turnover ratio in comparison to other
airlines. This indicated that Air Namibia (Pty) Ltd’s accounts payable
management was effective.
Air Namibia (Pty) Ltd had higher inventory turnover ratio compared to other
airlines, which indicated its ability to turn the inventory into sales and better
performance of the airline.

187
Air Namibia (Pty) Ltd had low receivables turnover ratio as compared to the rest
of the airlines, which indicated lower efficiency in receivables management.
The common size analysis of Air Namibia (Pty) Ltd indicated that the non-
current assets were a small proportion of the airlines total assets and a major part
of the airline assets were current assets. The airline’s accumulated loss was more
than equity.
d) Capital Structure
Air Namibia (Pty) Ltd is wholly owned by the Government of the Republic of
Namibia. The airline did not issue shares to public, but issued only ordinary
shares with the value of N$ 100 to the government, its shareholder. The airline
does not own assets that it can pledge as security for long term debt, but relied
only on government bailout and short term borrowing with the security provided
by the government.
The government bailout helped the airline to survive to stay afloat and operating;
otherwise Air Namibia (Pty) Ltd would have shut down long back. However,
government bailout may be acceptable in short run. In the long run, the airline is
expected to operate independently and as a viable and profit making entity.

188
5.3 Recommendations
The researcher recommends the following measures for Air Namibia (Pty) Ltd
management in order to facilitate the process of turning the airline into a profitable
airline.
a) Operations
The airline management should look at the ticket pricing strategies, as the Air
Namibia (Pty) Ltd tickets are considered more expensive even by local people,
Namibians prefer to travel using other airlines such as British Airways and South
African Airways. The ticket pricing should be made competitive. Specials
discounts may be offered on bulk buy of tickets for the same destination.
The airline should acquire its own aircrafts which they can operate, because
currently the airline is leasing all the aircraft. The operating lease payments are a
burden for the airline. Besides the security deposits required as the guarantees for
those aircraft are also affecting the airline’s cash flows.
The airline management should thoroughly scrutinize the entire contracts that it
enters, as some of the contracts contain clauses that are difficult for the airline to
comply with in case the airline would like to terminate the contract.
The airline should improve passenger’s safety. As per reports sometimes the
customer’s luggage are lost, stolen and tempered with and items are removed
from the luggage. This creates bad image of the airline and also causes financial
burden in the form of reimbursements.
189
The airline should only pursue routes that are profitable and those that will be
profitable in the near future even though it is difficult for the airline to select
specific routes to fly due to political reasons. All routes destroying airline
resources should be eliminated or avoided by all means.
The airline should minimize on contracting out and outsourcing the services if
these prove to be expensive as compared to using its own resources to provide
the required support.
Contracting out may be done for services such as providing transport to staff
members to airports, providing catering, logistics and selling tickets to local
people, instead of the airline providing the service itself. The airline should
weigh costs versus benefits before making any serious decisions.
b) Costs
The airline management should relook at the cost drivers, by re-evaluating the
profitability or benefits derived from the routes the airline is flying to in relation
to the costs to maintain those routes. The study of cost drivers will be able to
pick up the inefficient routes and by eliminating such inefficient routes this will
actually save the airline lots of costs.
The airline should engage the stakeholders such as the Namibia Airports
Company and Ministry of Works and Transport so that they reduce the
passengers’ tax and landing, parking and navigation fees. These are the airline

190
major expenses and if management attempts to reduce them it will have huge
savings for the airline.
The management should try and minimize the administration expenses especially
those that are not in line with the strategic goals attainment and avoid
unnecessary expenditure.
The airline management should adopt a control mechanism that will enable the
management to control the costs. Mechanism such as budgetary control will help
the airline to spend only on items that had been budgeted for and all unnecessary
expenditure will be avoided by all means. This will save the airline from non-
required costs.
The airline management should refrain from flying overseas on business trips
unnecessarily, and alternatively make use of telephone calls, Web 2.0 tools
(video conferencing and Skype), and social networks (Facebook) because some
of these services are provided for free. This will have significant impact on the
airline’s profitability and cash flows.
The airline is expected to comply with certain statutory regulations. However,
the airline should try to do it at the minimum cost while complying with the
required regulations.
The airline should try to avoid and minimize costs when flying over different
countries, because for every country the airline is flying over, it has to pay for
overflying navigations. The airline should rather consider flying over

191
international waters where it will not be required to pay for overflying navigation
to countries.
The airline should have a well thought out policy regarding where to fill up the
aircraft fuel tank, by considering the fuel costs whether at local fuel point or at
the destination, where the jet fuel is cheaper. This will reduce the airline fuel
costs and boost the profit margin.
c) Marketing and Promotion
The management should effectively market the airline products so that the airline
can attract potential customers to improve revenue. The airline’s marketing and
promotion policy and its implementation should be more creative and innovative.
For example it may launch holiday packages for potential customers using the
airline to fly to holiday destinations in Namibia and outside.
The airline should improve its customer services and on board catering in order
to attract more customers. This is an important value point for people flying to
and from African countries, as well as tourists.
The airline should enter into code share agreement with other airlines in order to
market its services. It has code sharing agreement with Kenya airlines. This will
boost sales revenue, because passengers will have more convenient connections
using Air Namibia (Pty) Ltd.
The airline management should market the airline beyond the Namibian borders
in order to attract passengers to fly and connect with Air Namibia (Pty) Ltd. This

192
way the airline can fill the aircraft and generate additional revenue that will boost
profit margins and cash flows.
The airline should avoid or minimize entering into barter agreements with
companies that do not assist the airline in its goal attainment. The barter
agreements do not improve cash sales revenue and cash flows, as the tickets are
paid for in kind instead of cash.
Marketing and promotion in Namibia should be more informative and
personalized in terms of airline fares, routes, departure time, arrival time and
safety, so that every Namibians may feel proud in flying with Air Namibia (Pty)
Ltd instead of flying with other airlines.
The airline should run promotions whereby passengers can win tickets to fly with
Air Namibia (Pty) Ltd. The airline current promotion of frequent flyers should be
revised and a passenger possessing five boarding passes instead of ten boarding
passes should be given the incentive to get a free ticket. By doing so the airline
sales revenue and cash flows both will be boosted.
d) Human Resources
The airline should recruit local pilots and flight crew, because foreign pilots have
to be remunerated on international salary and benefit scales, which are expensive
for the airline as compared to local pilots and flight crew. In that way the airline
can reduce its direct costs.

193
The airline should engage in training programs in order to train and retain the
local pilots instead of recruiting already qualified and experienced pilots from
foreign countries, without compromising on the airline safety standards.
The airline should slash the number of administrative staff and flying staff
especially when some of the routes are to be abandoned like the London route.
When the London route was abandoned the airline kept the staff assigned to that
route instead of slashing them to reduce the administrative and direct operating
costs. In that way the airline can boost its gross profit margin.
Air Namibia (Pty) Ltd should train and educate the airports staff on what impact
it has on passengers and airline if the flights are delayed or cancelled. The airline
should strive for minimum flight delays and cancelations, because delays and
cancellations have financial implications on the airline, inconvenience is caused
to the passengers and it creates bad image of the airline. If all staffs are made
sensitive to the impact of delays and cancellations, the airline will save lots of
unnecessary costs associated with delays and cancelations.
The airline should reduce overtime costs by not requiring staff to work beyond
allowed working hours as per the labour laws.
e) Strategic Planning and Control
Air Namibia (Pty) Ltd management should go for strategic planning, which will
contribute strategic advantages. Understanding the airlines’ current situation
identifying the airline’s strengths and weaknesses will help in strategic planning.

194
Analysis of the current financial situation will also provide management
understanding of operating problems, aid in identifying strengths and in focusing
on, areas needing improvements.
The researcher recommends that the airline management should review the
existing strategic plan and initiate continuous improvements on the strategic plan
to help the airline to achieve better performance. The airline should also realign
the organisational structure to the strategic plan, identify critical gaps in it and
restructure the organisation as per the changing requirements.
The airline’s decisions and planning should be ahead of the time and should be
clearly understood by everyone involved in order to avoid ad-hoc decision
making, which may not be favourable to the airline in terms of time and costs.
5.4 Conclusion
The study revealed that Air Namibia (Pty) Ltd is vital for the development of Namibian
economy in terms of tourism, job creation and transportation of goods. However, the
airline is struggling with cash flows and profitability problems for the past several years
and depended heavily on government bailouts. If the management of Air Namibia (Pty)
Ltd does not come up with strategic improvements that will change the fortune of the
airline, the status quo will prevail for unforeseen future and the dependence on
government will increase. The management should therefore implement strategies that
lead to improved performance of the airline, reduce the dependence on government for
funds and generate funds to finance its operations. The researcher compared the

195
performance of Air Namibia (Pty) Ltd with four other airlines operating under similar
environment among which Namibia (Pty) Ltd came out as the lowest performer. Air
Namibia (Pty) Ltd has a small market, is flying to limited destinations and did not
acquire its own aircraft for operations. Given these limitations, the management should
develop appropriate strategies to turnaround the airline and make it a profitable national
carrier.

196
References
Arpey, G. (2002). An Interview with Gerald Arpey: American airline urgent need of
cash inflow. Washington DC: US Airways.
Babbie, E. R. (2010). Characteristics of quantitative research. Califonia: Wadsworth
Cengage.
Bai, Y., Li, P. D., & Wang, F. (2000). Decentralisation of airline industry in China.
Beijing: Peking University.
Bernhardt, K. (2010). DuPont financial analysis model. Texas: University of Texas.
Blanchard, O. (2012). Global economic weakness remains a concern: Airlines typically
lose money when growth falls below 2%. Sydney: Centre for Aviation. Retrieved
July 25, 2013, from
http://centreforaviation.com/analysis/airline-profitability-prospects-improve-but-
profit-margins-remain-anaemic-85722.
Boardman, J. & Vining, P. (1989). Public and private ownership of parastatals.
Warsaw: Warsaw University of Technology.

197
Boswell, C. & Cannon, S. (2009). Introduction to nursing research: Incorporating
evidence-based practice (2nd ed.). Burlington: Jones & Bartlett Learning.
Burns, H. & Grove, K. (2003). Introduction to research design. Pretoria: University of
South Africa.
Clifford, S. & Woody. F. (2003). The definition and meaning of research and its
criteria. Kalapet: Pondicherry University Press.
Cottrell, R. R. & McKenzie, J. F. (2011). Health promotion and education research
methods. Boston: Jones and Bartlett Publishers, Inc.
Crossman, A. K. (2011). Research reliance on available subjects. Hamilton: University
of Waikato.
Crowd, F. C. (2008), Earnings analysis for investment. University of Cambridge:
Cambridge.
Daniel, F.G. (2009). Failure of corporate governance in Namibia’s parastatals. Well
known reasons for corporate governance in state owned enterprises, 3(1), 22-34.

198
Doherty, M. (1994). Probability versus Non-Probability Sampling in Sample
Surveys. Auckland: University of Auckland.
Doganis, R. (2006). Deregulation of Indian airlines industry. (Doctoral dissertation,
University of London, 2006). Retrieved May 14, 2013, from
http://library.ul.edu.uk/view/UL:158256.is23k.
Forsyth, P. (2006). The aviation trade weighted index: measuring competitiveness of
international airlines. Melbourne: Monash University.
Gigaba, M. (2013, January). South African airline in R550 million bailout. Mail &
Guardian, 8(1), P. 12-15.
Groves, T., Hong, D., Mcmillan, F. & Naughton, K. (1994). Improvements is state
owned enterprises productivity. (Master Thesis, University of Leiden, 1994).
Holloway, I. & Wheeler, S. (2002), Understanding qualitative research and its
philosophy in nursing and healthcare (3rd ed.). Derbyshire: Ilkeston Health
Centre. Vol. 103 (8), 32-33.
Houser, D. (2007). Literature review of academic research (3rd ed.). Cambridge:
University of Cambridge press.

199
Irfanullah, J. (2009). Definition of inventory turnover. Punjab: Lahore University of
Management Science.
Jeeva, A. (2011). Malaysia airlines, high oil prices and oversupply in capacity may
affect airlines growth. Retrieved March 12, 2013.
http://biz.thestar.com.my/news/story.asp?file=/2011/5/24/business/8739118.
Jefferson, L. (2012). Interview with Pieter De Villiers: South African Airways asks for
R6-Billion bailout, didn’t know airlines were re-usable. Johannesburg: Hayibo.
Kangueehi, T. (2007). The Performance of State-Owned Enterprises in Namibia.
(Master Thesis, University of Namibia, 2007).
Kenon, J. (2007). Return on assets and the importance to investors. New York: The
New York Times.
Khoza, J. K. & Adam, M. (2007). The Power of Governance: Enhancing the
Performance of State-Owned Enterprises. Johannesburg: Palgrave Macmillan.
Kowalski, P., Max, B., Monika, S. & Matias, E. (2013). State Owned Enterprises:
Trade effects and policy implications. Château de la Muette in Paris:Organisation
for Economic Co-operation and Development Publishing.

200
Kuugongelwa-Amadhila, S. (2013, February). The Minister of Finance Budget Speech
2013. Parliament. Windhoek, Namibia.
Labarre, R. (2013). Definition of research sample. California: University of Southern
California.
Labour Resource and Research Institute. (2009). Privatisation the Namibia way from
commercialisation to the sale of state assets. Windhoek: Author.
Lafrance R., Osakwe, P. & St-Amant, F. (1998). Evaluating alternative measures of the
real effective exchange rate. Bank of Canada Working Paper on impact of
exchange rate, 8(6), 26-42.
Lawrence, H. & Brick, T. I. (2008). Developing and undertaking literature review.
Reading: University of Reading.
Leary, Z. O. (2004). The essential guide to doing research. London: SAGE publication
Ltd.
Levine, J. H. (1982). Introduction to data analysis: Rules of Evidence. Butterworths:
Toronto.
201
Loth, R. (2004). Fundamental analysis of profitability. University College London:
London.
Masule, X. (July 24, 2013). Interview with Xavier Masule on the current status of Air
Namibia.Windhoek: Air Namibia.
McKesson, J. (2010). Benchmark your way to financial success. Windward Parkway:
McKesson Provider Technologies.
McNerney, W. J. (2006). Innovation in the global economy with focus on airline
performance. St. Louis: Saint Louis University.
Menges, W. (2006, September 15). Sound advice to Air Namibia (Pty) Ltd. The
Namibian. Retrieved on May 06, 2012, from
http://www.namibian.com.na/index.php?id=28&tx_ttnews%5Btt_news%5D=299
15&no_cache=1.1
Nashipena, F. (2012). The effect of population on Namibia’s economy. (Master Thesis,
University of Namibia, 2012).
Netessine, S. & Shumsky, R. (2002). Introduction to the theory and practice of yield
Management, informs transactions on education. 3(1), 34-44.
202
Parahoo, K. (1997). Principles of research design in research proposal. Basingstoke:
Palgrave Macmillan Limited.
Peavler, R. C. (2012). Cash flows analysis in organizations. Ashland: Morehead State
University.
Pilita, C. (2011). Interview with W. Walsh. Effect of high oil price on airline. Munich:
Ludwig Maximilian University of Munich.
Pohl, T.L., Anderson, Y. & Djankov, S. (1997). Comparison of parastatals in eastern
europe. Kharkiv: International Slavic University.
Porfas. Y. (2010). The role of state owned enterprises providing infrastructure and
supporting economic recovery. [Brochure]. Dublin: Republic of Ireland.
Redman, F. & Mory, A. (2004). Basic scientific on research methodology. Indonesia:
Romance of Research Press.
Republic of Namibia (2006). Government Gazette of the Republic of Namibia.
Windhoek: Government of the Republic of Namibia.
Rosenberg, S. M. (2009). Understnading trend analysis. Paris: University of Oregon.

203
Sanderson, R. F. (2012). Jet fuel price monitoring. Montreal: International Air Transport
Association. Retrieved July 05, 2013, from
http://www.iata.org/publications/economics/fuel-monitor/Pages/index.aspx.x
Sarndal, C. E., Swensson, B., & Wretman, J. (2004). Guide to validity and reliability.
Colorado: Colorado State University.
Schmidt, H. (2009). Review of literature on airline. Bremen: University of Applied
Sciences.
Slesinger, D. & Stephenson, M. (2006). Research methodology: An introduction. Ann
Arbor Michigan: University of Michigan Press.
Taylor, E. (2006). Airlines maintenance and fleet costs to earnings ratio. Westfield:
Money-zine.
Tongco, M. D. C. (2007). Purpose sampling as a tool for information selection. Hawaii:
Ethnobotany Research and Applications Press.
Tronskar, J. P. (2010). An essential element of asset integrity management and
reliability centered maintenance procedures. Columbus: Ohio State University.

204
Turner, R. (2006). Travel and tourism: Economic impact 2006. Haryana: World Travel
& Tourism Council.
Tyler, T. (2012). Airline profitability analyses for prospects improve but profit remains
anaemic. Sydney: Centre for Aviation. Retrieved July 25, 2013,
http://centreforaviation.com/analysis/airline-profitability-prospects-improve-but-
profit-margins-remain-anaemic-857222.2
Van der walle, N. (2009). African State Owned Enterprises in Africa. Cape Town:
University of Cape Town.
Ward, S. (2010). Definition and meaning of accounts receivable. Montreal: Concordia
University.
Wayne, R. H. (2008). How technology can help save the airline industry. Texas:
University of Texas.
Wilkinson, J. R. & Kashkari, N. (2013). Reading about operating profit margin.
Washington DC: Washington Book Publishers.
Wright, K. (2003). Internal benchmarking: Looking in the mirror. Hillsborough: North
Carolina State University.

205
Wyld, D. C., Jones, M. A. & Totten, J. W. (2005). Where is my suitcase? Airline
customer service. Marketing Intelligence and Planning 23(4), 382-394.
Zhou, J. (2012, March 05). Air Zimbabwe remains grounded. African news. Retrieved
May 08, 2012, from http://www.africanews.com/site/list_message/3754818

206
Annexure I
Abridged Financial Statements of Airlines
Air Namibia (Pty) Ltd (N$)
Statement of
Comprehensive Income Mar-07 Mar-08 Mar-09 Mar-10 Mar-11
000
Revenue 854 122 1 028590 1 298 043 1 165463 1 218708
Expenditure (1 097 162) (1237600) (1835102) (1452422) (1613381)
Operating Loss ( 243 040) ( 209 010) ( 537 059) ( 286 958) ( 394 674)
Other Income 9 605 54 481 58 204 41 575 11 802
Operating loss before
financing costs and financial
assistance ( 233 435) ( 154 529) ( 478 855) ( 246 248) ( 405 466)
Government financial
assistance 153 050 351 150 000 160 000 120 000
Net financing ( 24 438) 21 5 197 ( 5 967) ( 225 955)
Profit (Loss) before taxation ( 104 823) ( 360) ( 323 658) ( 95 311) ( 405 466)
Taxation - - - - -
Loss for the year ( 104 823) ( 360) ( 323 658) ( 95 311) ( 405 466)
Statement of Financial
Position Mar-07 Mar-08 Mar-09 Mar-10 Mar-11
Assets 000
Property and equipment 3 963 6 471 5 471 28 589 33 134
Other investment 2 962 4 597 3 464 - -
Long term deposit 44 388 50 890 48 677 33 728 53 772
Total non-current assets 51 313 61 958 57 612 65 344 89 811
Inventories 4 679 5 618 7 825 7 115 9 909
Trade and other receivable 89 751 172 635 136 771 159 944 181 733
Cash and cash equivalents 74 871 172 739 116 853 142 863 60 746
Total current assets 169 301 391 294 261 449 309 922 252 388
Total Assets 220 614 453 252 319 061 375 266 342 199
Equity and liabilities
Capital and reserves 000
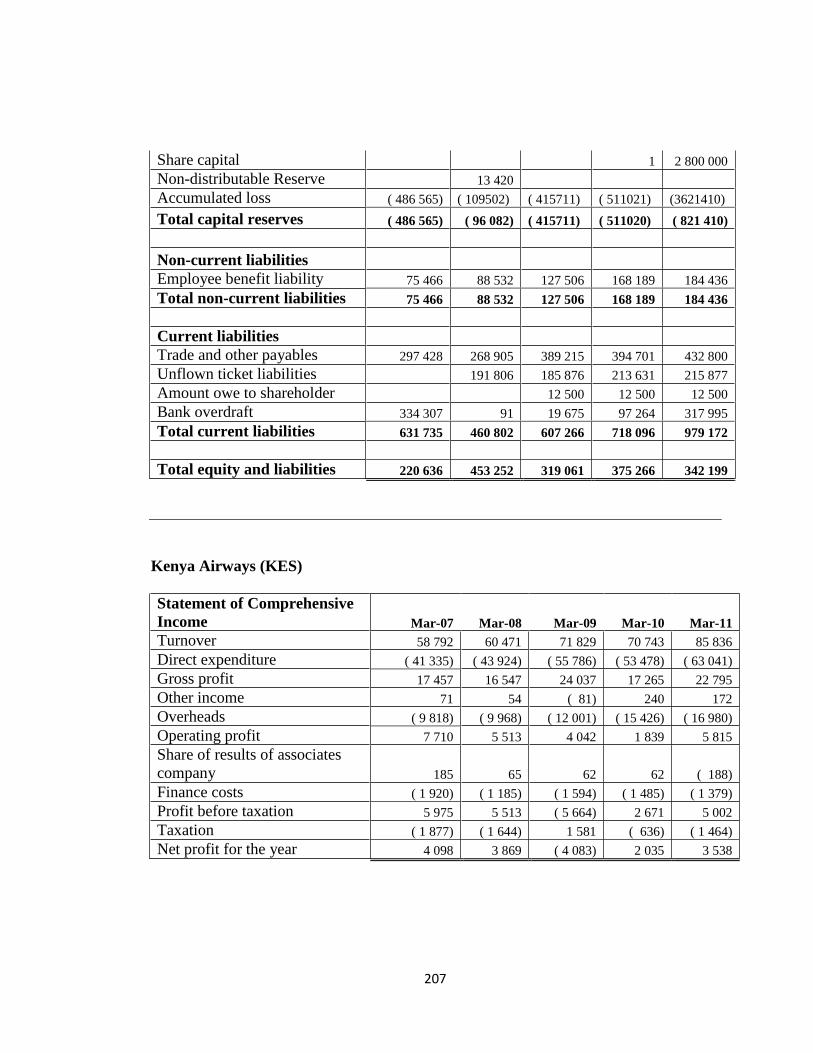
207
Share capital 1 2 800 000
Non-distributable Reserve 13 420
Accumulated loss ( 486 565) ( 109502) ( 415711) ( 511021) (3621410)
Total capital reserves ( 486 565) ( 96 082) ( 415711) ( 511020) ( 821 410)
Non-current liabilities
Employee benefit liability 75 466 88 532 127 506 168 189 184 436
Total non-current liabilities 75 466 88 532 127 506 168 189 184 436
Current liabilities
Trade and other payables 297 428 268 905 389 215 394 701 432 800
Unflown ticket liabilities 191 806 185 876 213 631 215 877
Amount owe to shareholder 12 500 12 500 12 500
Bank overdraft 334 307 91 19 675 97 264 317 995
Total current liabilities 631 735 460 802 607 266 718 096 979 172
Total equity and liabilities 220 636 453 252 319 061 375 266 342 199
Kenya Airways (KES)
Statement of Comprehensive
Income Mar-07 Mar-08 Mar-09 Mar-10 Mar-11
Turnover 58 792 60 471 71 829 70 743 85 836
Direct expenditure ( 41 335) ( 43 924) ( 55 786) ( 53 478) ( 63 041)
Gross profit 17 457 16 547 24 037 17 265 22 795
Other income 71 54 ( 81) 240 172
Overheads ( 9 818) ( 9 968) ( 12 001) ( 15 426) ( 16 980)
Operating profit 7 710 5 513 4 042 1 839 5 815
Share of results of associates
company 185 65 62 62 ( 188)
Finance costs ( 1 920) ( 1 185) ( 1 594) ( 1 485) ( 1 379)
Profit before taxation 5 975 5 513 ( 5 664) 2 671 5 002
Taxation ( 1 877) ( 1 644) 1 581 ( 636) ( 1 464)
Net profit for the year 4 098 3 869 ( 4 083) 2 035 3 538

208
Statement of Financial
Position Mar-07 Mar-08 Mar-09 Mar-10 Mar-11
Assets 000
Property, plant and equipment 54 106 52 518 51 051 49 856 50 794
Intangible assets 248 301 550 899 1 029
Prepaid operating lease rental 118 116 166 164 5
Invest in associates 322 387 449 526 338
Deferred expenditure 84 146 26 32 26
Aircraft Deposits 2 106 1 879 2 532 2 351 338
Total non-current assets 56 984 55 347 56 270 55 405 55 121
Inventories 962 1 258 1 474 1 543 1 907
Trade and other receivable 6 477 7 221 9 045 9 045 1 159
Amount due from Related party 41 - 3 6 -
Taxation recoverable 639 712 737 832 840
Short term investments 2 407 10 625 - 309 2 462
Bank and cash balances 9 777 1 617 7 450 6 123 7 254
Total current assets 20 303 21 433 19 709 17 858 23 622
Total Assets 77 287 76 780 75 979 73 263 78 743
Equity and liabilities
Capital and reserves 000
Share capital 2 308 2 308 2 308 2 308 2 308
Revenue reserve 17 190 20 251 16 069 17 641 20 089
Hedge reserve 2 142 3 314 ( 1 201) ( 26) 693
Total capital reserves 21 640 25 873 17 176 19 973 23 090
Non-current liabilities
Borrowings 31 287 25 190 28 257 23 386 21 750
Deferred tax 7 210 9 191 5 871 6 918 8 303
Deferred income 2 587 2 413 2 953 2 065 2 232
Total non-current liabilities 41 084 36 794 32 369 32 369 33 386
Current liabilities
Sales in advance of carriage 4 156 4 640 6 886 8 700 9 010
Trade and other payables 6 299 5 344 4 599 7 151 8 882
Accruals for staff leave 530 738 741 1 253 214 090
Unclaimed dividend 40 174 40 109 109
Deferred income 174 40 174 174 174
Borrowings 3 346 3 177 3 851 3 534 3 699
Taxation payable 18 - 16 - 5

209
Total current liabilities 14 563 14 113 21 722 20 921 22 214
Total equity and liabilities 77 287 76 780 75 979 73 263 78 743
British Airways (£)
Statement of Comprehensive
Income Mar-07 Mar-08 Mar-09 Mar-10 Mar-11
Turnover 8 492 8 753 8 992 7 994 9 987
Expenditure ( 7 936) ( 7 878) ( 9 212) ( 8 225) ( 9 469)
Non-recurring items 46 - - - -
Operating Profit (loss) 602 875 ( 220) ( 231) 518
Finance costs ( 168) ( 175) ( 182) ( 157) ( 161)
Finance income 129 111 95 20 32
Share of associates 5 26 4 ( 32) ( 6)
Fuel derivative 43 46 ( 98) ( 131) 296
Profit (loss) before tax 611 883 ( 401) ( 531) 679
Taxation ( 173) ( 187) 43 106 ( 7)
Profit after tax from
continuing operations 438 696 ( 358) ( 425) 672
Profit (loss) from discontinue
operations ( 134) ( 2) - - -
Profit after tax 304 694 ( 358) ( 425) 672
Statement of Financial
Position Mar-07 Mar-08 Mar-09 Mar-10 Mar-11
Assets 000
Property, plant and equipment 7 365 7 263 7 233 6 904 6 828
Intangible assets 212 221 267 269 347
Invest in associates 125 227 209 197 232
Other investments 107 80 65 103 45
Employee benefits 116 85 340 483 1 100
Other financial assets 28 99 28 47 28
Total non-current assets 7 953 7 975 8 142 7 973 8 580

210
Inventories 76 112 127 98 139
Trade and other receivable 654 586 530 499 460
Other current assets 346 586 268 289 273
Interest bearing deposits 1 642 1 181 1 019 1 002 1 259
Cash and cash equivalent 713 683 402 786 643
Total current assets 3 431 3 148 2 346 2 674 2 774
Total Assets 11 384 11 123 10 488 10 677 11 369
Equity and liabilities
Capital and reserves
Share capital 288 288 288 288 290
Share premium 933 937 937 937 937
Investment in own shares ( 10) ( 10) ( 9) ( 4) -
Other reserve 1 000 1 818 430 692 1 355
Minority Interest 200 200 200 200 200
Total capital reserves 2 411 3 233 1 846 2 113 2 782
Non-current liabilities
Interest bearing long term 2 929 2 751 3 074 3 446 3 358
Employee benefit obligations 1 142 330 191 208 232
Provisions for deferred tax 930 1 154 652 774 778
Other provisions 153 210 256 169 179
Other long term liabilities 194 201 327 232 357
Total non-current liabilities 5 348 4 646 4 500 4 824 4 904
Current liabilities
Current portion of long term 417 423 689 556 385
Trade and other payables 2 744 2 590 2 796 2 910 3 117
Current tax payable 54 170 4 2 12
Short term loans 410 4 653 272 169
Total current liabilities 3 625 3 244 4 142 3 740 3 683
Total equity and liabilities 11 384 11 123 10 488 10 677 11 369
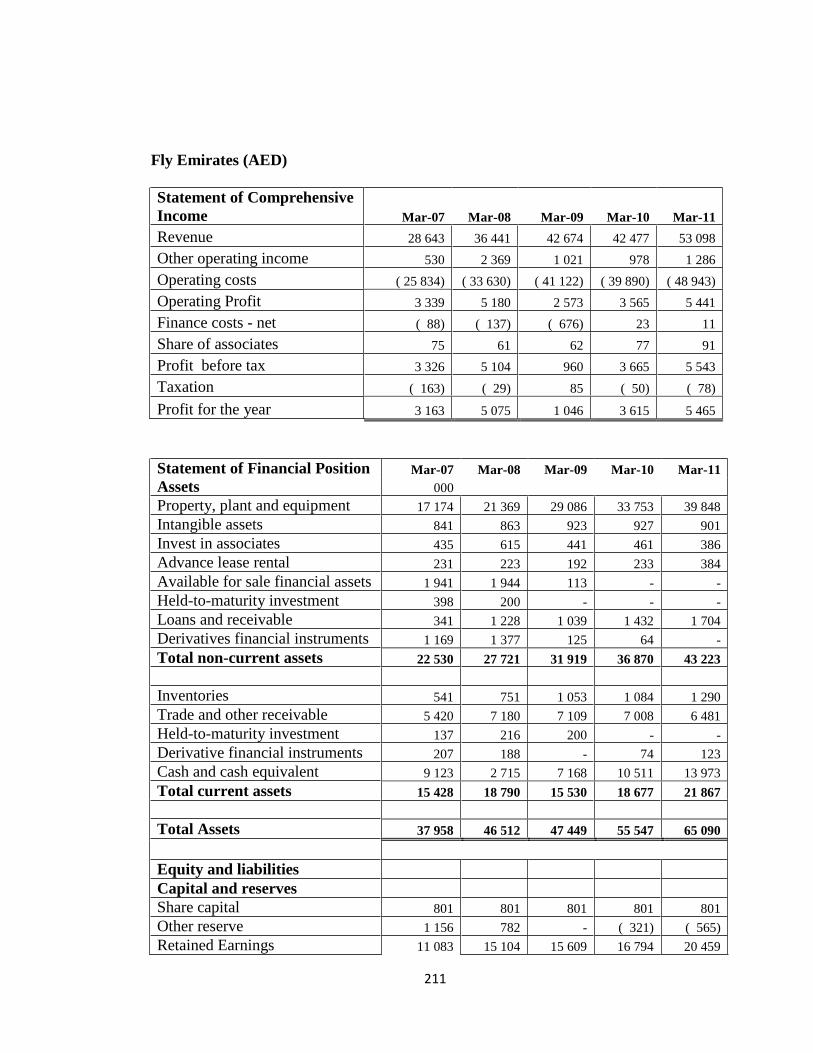
211
Fly Emirates (AED)
Statement of Comprehensive
Income Mar-07 Mar-08 Mar-09 Mar-10 Mar-11
Revenue 28 643 36 441 42 674 42 477 53 098
Other operating income 530 2 369 1 021 978 1 286
Operating costs ( 25 834) ( 33 630) ( 41 122) ( 39 890) ( 48 943)
Operating Profit 3 339 5 180 2 573 3 565 5 441
Finance costs - net ( 88) ( 137) ( 676) 23 11
Share of associates 75 61 62 77 91
Profit before tax 3 326 5 104 960 3 665 5 543
Taxation ( 163) ( 29) 85 ( 50) ( 78)
Profit for the year 3 163 5 075 1 046 3 615 5 465
Statement of Financial Position Mar-07 Mar-08 Mar-09 Mar-10 Mar-11
Assets 000
Property, plant and equipment 17 174 21 369 29 086 33 753 39 848
Intangible assets 841 863 923 927 901
Invest in associates 435 615 441 461 386
Advance lease rental 231 223 192 233 384
Available for sale financial assets 1 941 1 944 113 - -
Held-to-maturity investment 398 200 - - -
Loans and receivable 341 1 228 1 039 1 432 1 704
Derivatives financial instruments 1 169 1 377 125 64 -
Total non-current assets 22 530 27 721 31 919 36 870 43 223
Inventories 541 751 1 053 1 084 1 290
Trade and other receivable 5 420 7 180 7 109 7 008 6 481
Held-to-maturity investment 137 216 200 - -
Derivative financial instruments 207 188 - 74 123
Cash and cash equivalent 9 123 2 715 7 168 10 511 13 973
Total current assets 15 428 18 790 15 530 18 677 21 867
Total Assets 37 958 46 512 47 449 55 547 65 090
Equity and liabilities
Capital and reserves
Share capital 801 801 801 801 801
Other reserve 1 156 782 - ( 321) ( 565)
Retained Earnings 11 083 15 104 15 609 16 794 20 459
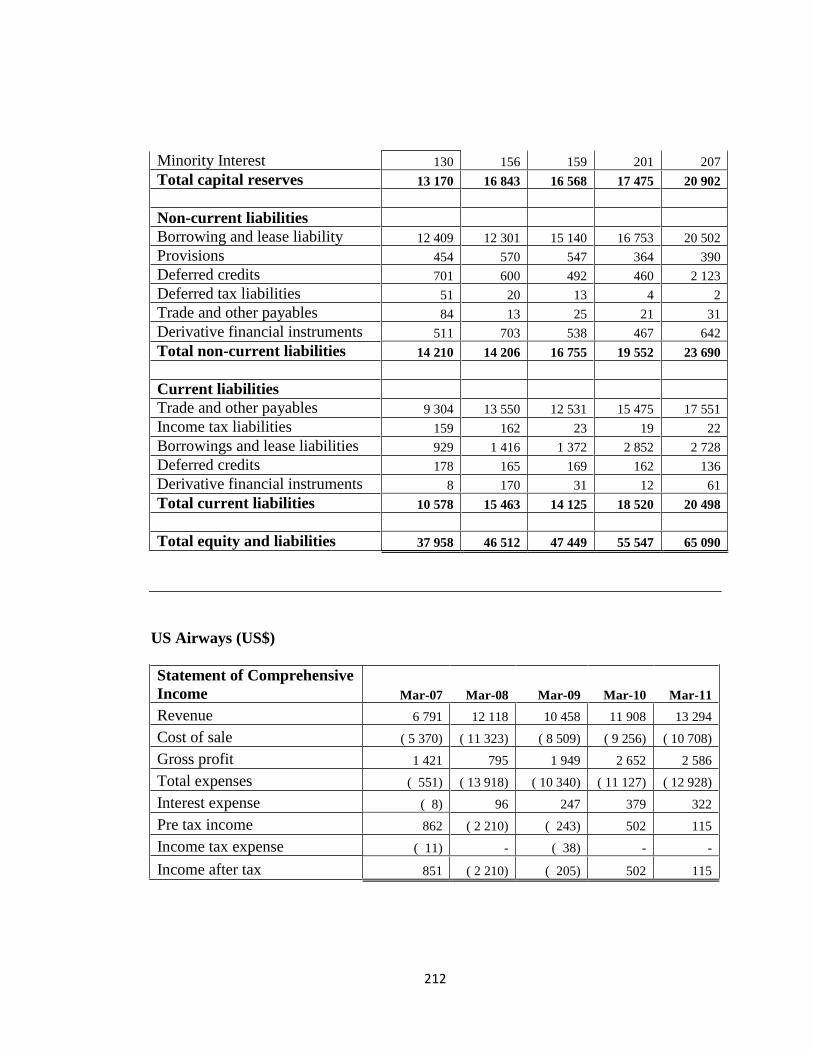
212
Minority Interest 130 156 159 201 207
Total capital reserves 13 170 16 843 16 568 17 475 20 902
Non-current liabilities
Borrowing and lease liability 12 409 12 301 15 140 16 753 20 502
Provisions 454 570 547 364 390
Deferred credits 701 600 492 460 2 123
Deferred tax liabilities 51 20 13 4 2
Trade and other payables 84 13 25 21 31
Derivative financial instruments 511 703 538 467 642
Total non-current liabilities 14 210 14 206 16 755 19 552 23 690
Current liabilities
Trade and other payables 9 304 13 550 12 531 15 475 17 551
Income tax liabilities 159 162 23 19 22
Borrowings and lease liabilities 929 1 416 1 372 2 852 2 728
Deferred credits 178 165 169 162 136
Derivative financial instruments 8 170 31 12 61
Total current liabilities 10 578 15 463 14 125 18 520 20 498
Total equity and liabilities 37 958 46 512 47 449 55 547 65 090
US Airways (US$)
Statement of Comprehensive
Income Mar-07 Mar-08 Mar-09 Mar-10 Mar-11
Revenue 6 791 12 118 10 458 11 908 13 294
Cost of sale ( 5 370) ( 11 323) ( 8 509) ( 9 256) ( 10 708)
Gross profit 1 421 795 1 949 2 652 2 586
Total expenses ( 551) ( 13 918) ( 10 340) ( 11 127) ( 12 928)
Interest expense ( 8) 96 247 379 322
Pre tax income 862 ( 2 210) ( 243) 502 115
Income tax expense ( 11) - ( 38) - -
Income after tax 851 ( 2 210) ( 205) 502 115

213
Statement of Financial
Position Mar-07 Mar-08 Mar-09 Mar-10 Mar-11
Assets 000
Property, plant and equipment 3 286 3 250 3 584 3 796 3 854
Intangible assets 545 549 503 477 477
Long term operating assets 965 865 1 036 648 637
Total non-current assets 4 796 4 680 7 454 4 921 4 968
Inventories 201 182 227 231 267
Trade and other receivable 293 302 285 311 347
Other short term assets 890 820 200 508 610
Cash and cash equivalent 1 034 952 1 299 1 859 1 567
Total current assets 2 418 2 218 2 331 2 909 2 690
Total Assets 7 214 7 012 9 632 7 819 7 409
Equity and liabilities
Capital and reserves
Share capital 1 479 1 479 2 107 2 115 2 115
Treasury stock ( 13) ( 9) ( 13) - -
Retained Earnings ( 2 307) ( 1 852) ( 2 541) ( 2 047) ( 1 932)
Other equity 65 61 90 14 54
Total capital reserves ( 776) ( 765) ( 355) 84 199
Current liabilities
Other current liabilities 1 885 2 012 1 950 460 2 123
Short term debt 362 400 502 4 2
Trade and other payables 797 810 337 21 31
Total non-current liabilities 3 044 2 852 2 789 19 552 23 690
Current liabilities
Long term debt 4 623 4 750 12 531 3 861 3 175
Long term operating liabilities 323 320 377 219 322
Total current liabilities 4 946 4 823 7 809 4 385 5 042
Total equity and liabilities 7 214 7 012 9 632 7 819 7 409
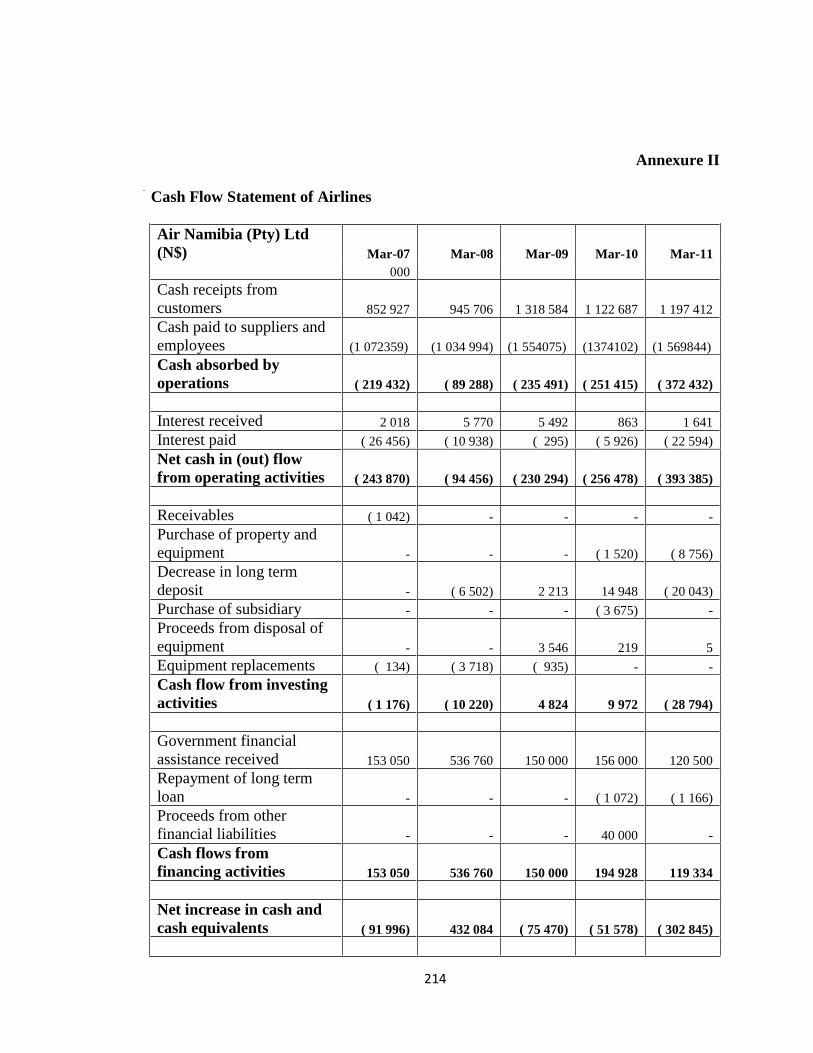
214
Annexure II
Cash Flow Statement of Airlines
Air Namibia (Pty) Ltd
(N$) Mar-07 Mar-08 Mar-09 Mar-10 Mar-11
000
Cash receipts from
customers 852 927 945 706 1 318 584 1 122 687 1 197 412
Cash paid to suppliers and
employees (1 072359) (1 034 994) (1 554075) (1374102) (1 569844)
Cash absorbed by
operations ( 219 432) ( 89 288) ( 235 491) ( 251 415) ( 372 432)
Interest received 2 018 5 770 5 492 863 1 641
Interest paid ( 26 456) ( 10 938) ( 295) ( 5 926) ( 22 594)
Net cash in (out) flow
from operating activities ( 243 870) ( 94 456) ( 230 294) ( 256 478) ( 393 385)
Receivables ( 1 042) - - - -
Purchase of property and
equipment - - - ( 1 520) ( 8 756)
Decrease in long term
deposit - ( 6 502) 2 213 14 948 ( 20 043)
Purchase of subsidiary - - - ( 3 675) -
Proceeds from disposal of
equipment - - 3 546 219 5
Equipment replacements ( 134) ( 3 718) ( 935) - -
Cash flow from investing
activities ( 1 176) ( 10 220) 4 824 9 972 ( 28 794)
Government financial
assistance received 153 050 536 760 150 000 156 000 120 500
Repayment of long term
loan - - - ( 1 072) ( 1 166)
Proceeds from other
financial liabilities - - - 40 000 -
Cash flows from
financing activities 153 050 536 760 150 000 194 928 119 334
Net increase in cash and
cash equivalents ( 91 996) 432 084 ( 75 470) ( 51 578) ( 302 845)
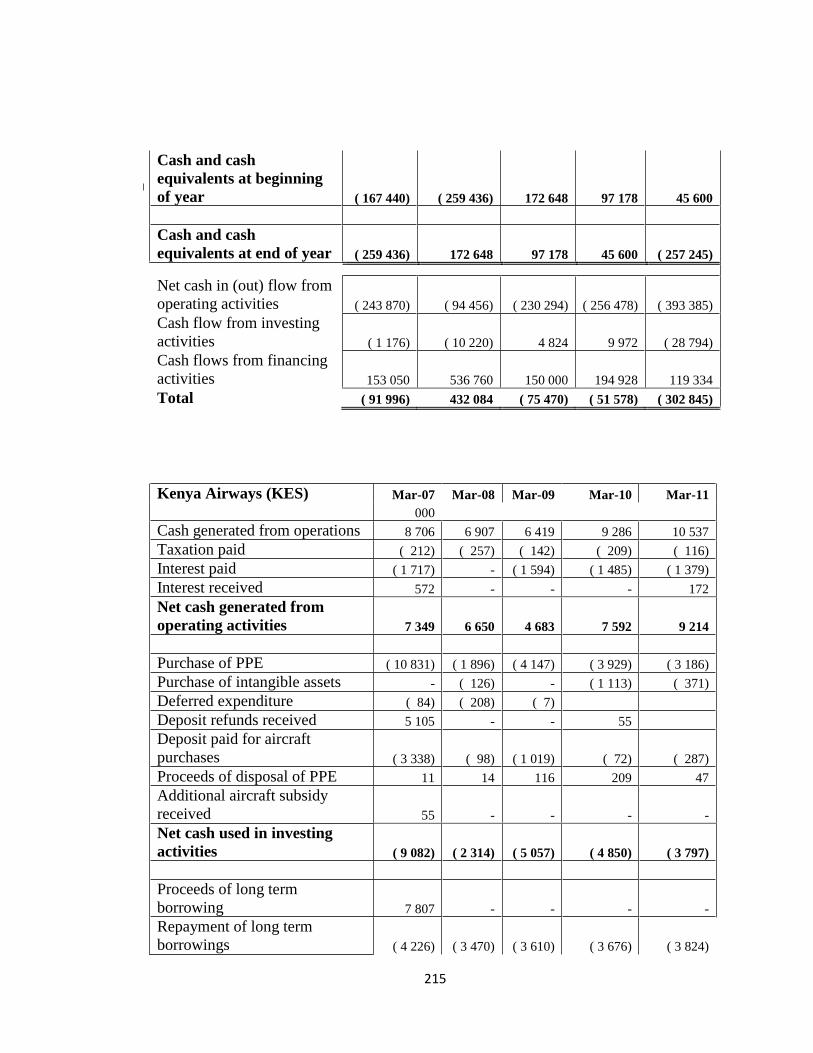
215
Cash and cash
equivalents at beginning
of year ( 167 440) ( 259 436) 172 648 97 178 45 600
Cash and cash
equivalents at end of year ( 259 436) 172 648 97 178 45 600 ( 257 245)
Net cash in (out) flow from
operating activities ( 243 870) ( 94 456) ( 230 294) ( 256 478) ( 393 385)
Cash flow from investing
activities ( 1 176) ( 10 220) 4 824 9 972 ( 28 794)
Cash flows from financing
activities 153 050 536 760 150 000 194 928 119 334
Total ( 91 996) 432 084 ( 75 470) ( 51 578) ( 302 845)
Kenya Airways (KES) Mar-07 Mar-08 Mar-09 Mar-10 Mar-11
000
Cash generated from operations 8 706 6 907 6 419 9 286 10 537
Taxation paid ( 212) ( 257) ( 142) ( 209) ( 116)
Interest paid ( 1 717) - ( 1 594) ( 1 485) ( 1 379)
Interest received 572 - - - 172
Net cash generated from
operating activities 7 349 6 650 4 683 7 592 9 214
Purchase of PPE ( 10 831) ( 1 896) ( 4 147) ( 3 929) ( 3 186)
Purchase of intangible assets - ( 126) - ( 1 113) ( 371)
Deferred expenditure ( 84) ( 208) ( 7)
Deposit refunds received 5 105 - - 55
Deposit paid for aircraft
purchases ( 3 338) ( 98) ( 1 019) ( 72) ( 287)
Proceeds of disposal of PPE 11 14 116 209 47
Additional aircraft subsidy
received 55 - - - -
Net cash used in investing
activities ( 9 082) ( 2 314) ( 5 057) ( 4 850) ( 3 797)
Proceeds of long term
borrowing 7 807 - - - -
Repayment of long term
borrowings ( 4 226) ( 3 470) ( 3 610) ( 3 676) ( 3 824)

216
Dividends paid ( 808) ( 808) ( 808) ( 393) ( 462)
Investment held to maturity - ( 5 340) 807
Investment in short term
deposits ( 2 407) ( 1 812) - - -
Net cash generated from
financing activities 366
( 11
430) ( 4 418) ( 4 069) ( 3 479)
Net (decrease) increase in cash
and cash equivalents ( 1 367) ( 7 094) ( 4 792) ( 1 327) 1 938
Cash and cash equivalents at
beginning of year 11 144 9 777 2 683 ( 2 109) ( 3 436)
Cash and cash equivalents at
end of year 9 777 2 683 ( 2 109) ( 3 436) ( 1 498)
Net cash generated from
operating activities 7 349 6 650 4 683 7 592 9 214
Net cash used in investing
activities ( 9 082) ( 2 314) ( 5 057) ( 4 850) ( 3 797)
Net cash generated from
financing activities 366
( 11
430) ( 4 418) ( 4 069) ( 3 479)
Total ( 1 367) ( 7 094) ( 4 792) ( 1 327) 1 938
British Airways (£) Mar-07 Mar-08 Mar-09 Mar-10 Mar-11
000
Operating profit 602 875 ( 220) ( 231) 518
Operating (loss)/profit from
discontinued operations ( 122) ( 2) - - -
Credit arising on changes to
pension scheme ( 396) -
Depreciation and amortization 834 692 694 732 683
Operating cash flow before
working capital changes 918 1 565 474 501 1 201
Decrease/(Increase) in
inventories 61 96 32 ( 181) ( 460)
Decrease/(Increase) in payable ( 15) ( 354) ( 136) 241 404
Cash payment to NAPS pension ( 240) ( 610) ( 81) ( 11)

217
scheme
Provision for settlement of
competition investigation 350 -
Payment to DOJ in settlement of
competition - ( 149) ( 64) ( 19) ( 147)
Other non-cash movements ( 2) 3 1 - -
Cash generated from
operations 1 072 551 307 461 987
Interest paid ( 188) ( 182) ( 177) ( 136) ( 147)
Taxation paid ( 128) ( 66) 3 6 ( 4)
Net cash flow from operating
activities 756 303 133 331 836
Purchase of PPE ( 331) ( 596) ( 547) ( 492) ( 702)
Purchase of intangible assets ( 36) ( 33) ( 24) ( 13) ( 67)
Purchase of minority interest ( 13) -
Purchase of subsidiary - - ( 34) ( 9) ( 27)
Proceeds from sale of associated
companies 3 ( 54) - 7
Proceeds from sale of other
investments 52 1 7
Cash outflow disposal of
subsidiary ( 149) - - -
Dividend received 1 3 17
Decrease/(Increase) interest
bearings 389 509 214 51 ( 86)
Proceeds of disposal of PPE 7 11 5 102 28
Interest received 113 117 105 17 28
Net cash flow from investing
activities 36 ( 42) ( 257) ( 337) ( 826)
Proceeds of long term borrowing - 172 377 1 053 236
Repayment of long term
borrowings ( 485) ( 68) ( 66) ( 160) ( 188)
Payment of finance lease - ( 356) ( 402) ( 609) ( 296)
Exercise of share options 50 4 1 - 1
Net foreign exchange ( 16) ( 29) 8 40 46
Redemption of own shares ( 12) - 84 ( 7)
Dividends paid ( 14) ( 14) ( 75) ( 18) ( 18)
Net cash flow from financing
activities ( 477) ( 291) ( 157) 390 ( 226)

218
Net (decrease) increase in cash
and cash equivalents 315 ( 30) ( 281) 384 ( 216)
Cash and cash equivalents at
beginning of year 398 713 683 402 786
Cash and cash equivalents at
end of year 713 683 402 786 570
Cash generated from operations 756 303 133 331 836
Net cash flow from investing
activities 36 ( 42) ( 257) ( 337) ( 826)
Net cash flow from financing
activities ( 477) ( 291) ( 157) 390 ( 226)
Total 315 ( 30) ( 281) 384 ( 216)
Fly Emirates (AED) Mar-07 Mar-08
Mar-
09 Mar-10 Mar-11
000,000
Operating Activities
Profit before Income Tax 3 326 5 104 960 3 665 5 543
Depreciation and amortization 1 352 1 700 2 210 2 962 3 677
Finance Costs 88 137 104 25 ( 15)
Loss (Profit) on sale of property and
equipment 1 ( 567) ( 14) ( 258) ( 454)
Profit on sale of business units ( 34) - 143 ( 195)
Share of results in associates ( 75) ( 61) ( 63) ( 77) ( 106)
Provision for Impairment 9 22 ( 79) 123 42
Provision for employee benefits 247 315 236 301 373
Net movement on derivative financial
instruments 387 ( 115) 2 027 ( 347) ( 36)
Employee benefits payment ( 192) ( 243) ( 315) ( 304) ( 347)
Income Tax ( 56) ( 56) ( 61) ( 63) ( 77)
Changes in inventory ( 62) ( 210) ( 301) ( 32) ( 204)
Changes in receivable ( 937) ( 2 263) 415 ( 316) 133
Changes in payables and deferred
credits 1 711 3 572 ( 246) 2 649 2 670
Net cash generated from operations 5 765 7 335 5 016 8 328 11 004
Investing Activities
Proceeds from sale PPE 3 3 337 117 883 3 241
Proceeds from sale of business units 41 - - - -

219
Addition to intangible assets ( 70) ( 70) ( 82) ( 72) ( 49)
Addition to PPE ( 4 183) ( 6 115)
( 5
573) ( 3 416) ( 6 504)
Investment in associates ( 11) ( 123) ( 71) ( 18) 82
Additional investment in a subsidiary ( 187) - ( 51) - -
Disposal of Minority interest - - ( 1) - -
Addition to available for sale assets ( 1 837) - 1 837 - 195
Movement in the short term bank
deposits 884 ( 6 592) 5 026 1 443 ( 2 601)
Net purchase of held to maturity
investments ( 2) 119 216 200 -
Interest income 541 531 379 308 451
Dividend from associates companies 72 44 100 95 93
Net cash used in investing activities ( 4 749) ( 8 869) 1 897 ( 577) ( 5 092)
Financing Activities
Net proceeds from issue/repayment of
bonds 1 247 - - ( 122) ( 1 837)
Net loan drawdown 250 ( 157) ( 383) - 739
Aircraft financing costs ( 326) ( 368) ( 272) ( 319) ( 412)
Other finance charges ( 359) ( 391) ( 295) ( 103) ( 59)
Net lease liabilities ( 593) ( 2 381)
( 1
161) ( 1 447) ( 1 083)
Dividend paid ( 386) ( 488)
( 2
918) ( 956) ( 2 308)
Effects of exchange rate - ( 2) 9 6 ( 1)
Dividend paid to minority shareholder ( 31) ( 35) ( 60) ( 35) ( 86)
Net cash used in financing activities ( 198) ( 3 822)
( 5
080) ( 2 976) ( 5 047)
Net (decrease) increase in cash and
cash equivalents 818 ( 5 356) 1 833 4 775 865
Cash and cash equivalents at
beginning of year 7 252 8 070 2 714 4 547 9 322
Cash and cash equivalents at end of
year 8 070 2 714 4 547 9 322 10 187
Net cash used in investing activities 5 765 7 335 5 016 8 328 11 004
Net cash used in financing activities ( 4 749) ( 8 869) 1 897 ( 577) ( 5 092)
Net cash used in financing activities ( 198) ( 3 822)
( 5
080) ( 2 976) ( 5 047)
Total 818 ( 5 356) 1 833 4 775 865

220
US Airways (US$) Mar-07 Mar-08
Mar-
09
Mar-
10 Mar-11
000
Operating Activities
Net income 6 ( 2 210) ( 205) 502 115
Depreciation and amortization 5 240 273 292 312
Impairment of goodwill ( 7) 836 104 25 ( 15)
Other non cash adjustments - - 82 ( 14) -
Deferred income - 341 143 ( 195)
Changes in receivable 12 74 8 ( 34) ( 36)
Changes in inventory ( 3) 49 ( 29) ( 10) ( 36)
Changes in prepayments 9 ( 255) ( 39) - -
Changes in payables 8 96 55 62 28
Changes other current liabilities ( 2) ( 151) 84 - -
Net cash generated from operations 28 ( 980) 476 823 173
Investing Activities
Capital expenditures ( 10) ( 929) ( 683) ( 201) ( 350)
Proceeds from sale of business units ( 1) 210 76 261 -
Addition to intangible assets ( 3) ( 196) 112 3 -
Net cash used in investing activities ( 14) ( 915) ( 495) 63 ( 350)
Financing Activities
Cash payment for borrowings ( 133) 179 - ( 297 ) -
Cash received from borrowings 145 852 512 - ( 397)
Short term debt issuance - - - - 58
Dividends paid ( 6) - - - -
Other finance charges ( 4) ( 50) ( 14) ( 10) -
Net cash used in financing activities 2 981 498 ( 307) ( 339)
- - - - -
Net (decrease) increase in cash and
cash equivalents 16 ( 914) 479 579 ( 516)
- - - - -
Cash and cash equivalents at
beginning of year 22 38 ( 876) ( 397) 182

221
- - - - -
Cash and cash equivalents at end of
year 38 ( 876) ( 397) 182 ( 334)
Net cash used in investing activities 28 ( 980) 476 823 173
Net cash used in financing activities ( 14) ( 915) ( 495) 63 ( 350)
Net cash used in financing activities 2 981 498 ( 307) ( 339)
Total 16 ( 914) 479 579 ( 516)