case study: lead - college of engineering · cee 680 lecture #50 5/2/2019 2 a short history of lead...
TRANSCRIPT

CEE 680 Lecture #50 5/2/2019
1
Lecture #50
Redox Chemistry: Lead I(Stumm & Morgan, Chapt.8 )
Benjamin; Chapter 9
David Reckhow CEE 680 #50 1
Updated: 2 May 2019 Print version
Case study: Lead Regulations
0.015 mg/L action level in drinking water
Sources
Natural: lead minerals
Industrial: paints
Plumbing: service connections, solder, brass alloy faucets
Health Effects
Kidney, nervous system damage
David Reckhow CEE 680 #50 2

CEE 680 Lecture #50 5/2/2019
2
A short history of Lead Emperor Nero & others
a predilection to lead‐tainted diets and suffered from gout and other symptoms of chronic lead poisoning Not only did the Romans drink
legendary amounts of wine, but they flavored their wines with a syrup made from simmered grape juice that was brewed in lead pots. The syrup was also used as a sweetener in many recipes favored by Roman gourmands.
''One teaspoon of such syrup would have been more than enough to cause chronic lead poisoning,'' Dr. Nriagu said.
David Reckhow 3
Peter Ustinov as NeroNY Times: March 17, 1983
Our continuing love affair with lead Used for some of the earliest pressurized water pipes
Malleable, plentiful
Plumbing and plumbers use Pb
Used with modern urban water systems
Lead service lines – esp. 1920s‐1940s
Lead solder: until 1986
Brass fittings with lead
David Reckhow 4
Persich, 2016 [JAWWA 108:10]

CEE 680 Lecture #50 5/2/2019
3
Then, Flint
Flint 31 January 2016; Boston Globe
David Reckhow CEE 680 #50 6

CEE 680 Lecture #50 5/2/2019
4
Blood Pb Children <5 yrs
Levels in 2015; after change to Flint River
David Reckhow 7
Hanna-Attisha et al., 2016AJPH 106:2:283-290
Elevated Blood Levels
Flint Michigan Crisis Timeline
April 2014: the city stopped getting its water from Detroit as a cost‐saving measure and began instead drawing water from the Flint River.
High blood lead levels noted in children
Water led levels were above standard
Oct 16, 2015: Flint switches back to Detroit Water
Sources EPA website: http://www.epa.gov/flint/flint‐drinking‐water‐documents
VPI website: http://flintwaterstudy.org/
12/22/2015 Rachel Maddow video:
David Reckhow 8

CEE 680 Lecture #50 5/2/2019
5
The Flint case A cascade of actions and effects
David Reckhow 9
Desire to Save $$
Stop buying water from Detroit
Use local Flint River
Higher Cl/SO4 ratioStopped adding PO4
Widespread corrosion in water pipes
Release of Pbinto water
Legacy of lead plumbing
Growth of microorganism (e.g., Legionella)
More hazardous chlorinated compounds
Sediment in water –some settled in water heaters
Other Metals too
Denial by public officials & Blame the innocent
Exposure
Destruction of chlorine residual
Decision to add more chlorine
Water Quality pH
Cl2
David Reckhow 10
Flint Rash Investigation Report, August, 2016
Period on Flint River

CEE 680 Lecture #50 5/2/2019
6
Other issues
Legionella
Trihalomethanes
David Reckhow 11
Period on Flint River
From Huffington Post, http://www.huffingtonpost.com.au/entry/flint-water-legionnaires-lead-crisis_us_569d09d6e4b0ce4964252c33
Flint Distribution system locations; data from WITAF, EPA and UMass
The press & public reaction
Cites elevated DBPs in water heaters
Ruffalo advises against bathing
video
David Reckhow 12
May 4, 2016
May 5, 2016
May 31, 2016

CEE 680 Lecture #50 5/2/2019
7
Public engagement
Edwards slide
Environmental justicsissues
David Reckhow IDWT 13
Protection by a CaCO3 film? Calcium carbonate will precipitate when the solubility product is exceeded
This occurs at elevated pHs where the equilibrium shifts toward more carbonate
Of course there has to be a certain amount of calcium (hardness present as well)
This film has been shown to protect pipes from corrosion
for this reason, high pHs and high alkalinities can help with corrosion control
How high should the pH be?
David Reckhow CEE 680 #50 14

CEE 680 Lecture #50 5/2/2019
8
Me‐Carbonate Equilibria From Pankow
David Reckhow CEE 680 #39 15
See lecture #39
David Reckhow CEE 680 #39 16
Stumm & Morgan, 1996, Figure 7.8, pg. 374
See also: lecture #39
Me‐carbonates
Closed System with CT = 3x10
‐3 M
100 mg/L Hardness

CEE 680 Lecture #50 5/2/2019
9
Langelier Index (LI) A measure of the degree of saturation of calcium carbonate in water When a water is exactly in equilibrium with CaCO3 such that neither dissolution nor precipitation is occurring,
LI = 0
When CaCO3 precipitation is occurring, the water is oversaturated and by definition:
LI >0
So the extent of oversaturation (ie., the LI) is defined as the number of log units of the actual, measured, water pH (pHact) above the theoretical value that gives perfect equilibrium (pHsat)
David Reckhow CEE 680 #50 17
≡
LI continuted The saturation pH can be calculated using the solubility product constant (Kso) and knowing the water’s carbonate content from knowledge of the alkalinity
David Reckhow CEE 680 #50 18

CEE 680 Lecture #50 5/2/2019
10
No assumptions on mass balance Returning to the basic solubility, but not requiring that calcium and total carbonates be equal
David Reckhow CEE 680 #50 19
1
1
1And so at
pH = 6.3 – 10.3
LI (cont) Continuing
And now combining with the LI definition
David Reckhow CEE 680 #50 20
≡

CEE 680 Lecture #50 5/2/2019
11
LI (cont) And since in the pH range below 10.3, the alkalinity is mostly due to bicarbonate, we can equate the CT to the alkalinity
And general practice has been to increase pH so that the LI is 0.2 to 1.0
While CaCO3 films have been found to inhibit iron corrosion, there is little evidence that a high LI can reduce the level of soluble Pb
David Reckhow CEE 680 #50 21
Flint Water Quality – why?
Parameter Before 4/2014
After4/2014
units
pH 7.38 7.61
Hardness 101 183 mg‐CaCO3/L
Alkalinity 78 77 mg‐CaCO3/L
Chloride 11.4 92 mg/L
Sulfate 25.2 41 mg/L
CSMR 0.45 1.6 mg/mg
Inhibitor 0.35 None mg‐P/L
Larson Ratio 0.5 2.3
David Reckhow IDWT 22
WQ data From MOR and 2014 WQRCSMR = chloride to sulfate mass ratioLarson Ratio = ([Cl-] + 2[SO4
-2])/[HCO3-]

CEE 680 Lecture #50 5/2/2019
12
Pb(II) solubility 3 mg/L DIC
No phosphate
David Reckhow
CEE 680 #50
From: Internal Corrosion and Depositional Control, by Schock & Lytle, Chapt. 20 in Water Quality
and Treatment (6th
ed.), 2011
But how does Pb(II) get into drinking water in the first place?
AL = 15 μg/L = 10-7.1 M
Control w/o Phosphate or high Redox
David Reckhow IDWT 24
Can only work for low carbonate waters
Not as good as phosphate or high Redox From: Mike Schock

CEE 680 Lecture #50 5/2/2019
13
Flint Finished Water Quality – why?
Parameter Before 4/2014
After4/2014
units
pH 7.38 7.61
Hardness 101 183 mg‐CaCO3/L
Alkalinity 78 77 mg‐CaCO3/L
Chloride 11.4 92 mg/L
Sulfate 25.2 41 mg/L
CSMR 0.45 1.6 mg/mg
Inhibitor 0.35 None mg‐P/L
Larson Ratio 0.5 2.3
David Reckhow IDWT 25
WQ data From MOR and 2014 WQRCSMR = chloride to sulfate mass ratioLarson Ratio = ([Cl-] + 2[SO4
-2])/[HCO3-]
Alkalinity was about the same; pH actually went up a bit
WQ data from Edwards website
Consider galvanic corrosion
David Reckhow CEE 680 #51 26
Micro environments near surface can have very low pHs Basic ligands like hydroxide and phosphate will be much less important
Weak base anions can become enriched
Nguyen et al., 2010; WRF Report

CEE 680 Lecture #50 5/2/2019
14
Sulfate and Chloride In bulk water neither sulfate nor chloride can compete well with hydroxide for lead
Near surface with active galvanic corrosion, pH drops and hydroxide is very low
Sulfate forms insoluble PbSO4 precipitate
Chloride forms soluble PbCl+ complex
David Reckhow CEE 680 #51 27
1.54 10
59.5Nguyen et al., 2010; WRF Report
Getting the lead out: Lead service lines (LSL) in US
David Reckhow IDWT 28
Cornwall et al., 2016JAWWA, April

CEE 680 Lecture #50 5/2/2019
15
Galvanized pipe Widely used to replace lead pipe for service connections
What is it?
Steel coated with zinc to reduce corrosion
Zinc used for this coating is generally contaminated with lead
0.5% up to 1.4% Pb by weight
David Reckhow CEE 680 #50 29
a) Galvanized pipe releases Zn and Pb
b) Pb sorption and deposition in iron scales
c) With Cu pipe, deposition corrosion accelerates release
David Reckhow CEE 680 #50 30
Pb from galvanized pipe
From: Clark, Masters and Edwards, 2015 [Env. Eng. Sci. 32:8:713]

CEE 680 Lecture #50 5/2/2019
16
Iron Scale
David Reckhow CEE 680 #50 31
Pb(II): pH vs PO4T ;low CO3T
David Reckhow CEE 680 #50 32
From: Internal Corrosion of Water Distribution System, (2nd ed) by Snoeyink, Wagner et al., 1996
6 mg/L DIC
AL = 15 μg/L = 10-1.8 mg/L

CEE 680 Lecture #50 5/2/2019
17
Pb(II); pH/PO4 contour plot
David Reckhow CEE 680 #50 33
From: Internal Corrosion of Water Distribution System, (2nd
ed) by Snoeyink, Wagner et al., 1996
AL = 15 μg/L = 10-1.8 mg/L
Washington, DCPb Increase Correlates with Chloramines
CEE 680 #51
pH Raised with CaO
NH3 added to give Chloramines
Grumbles & Welsh, WASA, House Testimony 3/5/04David Reckhow 34

CEE 680 Lecture #50 5/2/2019
18
David Reckhow CEE 680 #51 35
Washington, DCLead Service Lines
Low income households
Lead Service Lines
David Reckhow CEE 680 #51 36

CEE 680 Lecture #50 5/2/2019
19
Chloramines: a solution to the DBP problem?
Inorganic chloramines are formed by the reaction of free chlorine with ammonia.
Monochloramine is formed very quickly (in minutes)
Although it is not as powerful an oixidant or disinfectant as free chlorine, it does continue to provide some pathogen protectionl
It does not continue to produce THMs and most HAAs like free chlorine does
Therefore, many cities like DC have decided to convert their distribution system disinfectant to chloramines
NH3 + HOCl --------> NH2Cl + H2O (1)
Washington DC
David Reckhow 38
Edwards et al., 2009; Environ. Sci. Technol., 43 (5), pp 1618–1623
Free chlorine and lime addition (high pH)
Nov 2000, switch to chloramines
Drinking water
Blood
CEE 680 Lecture #50 5/2/2019
20
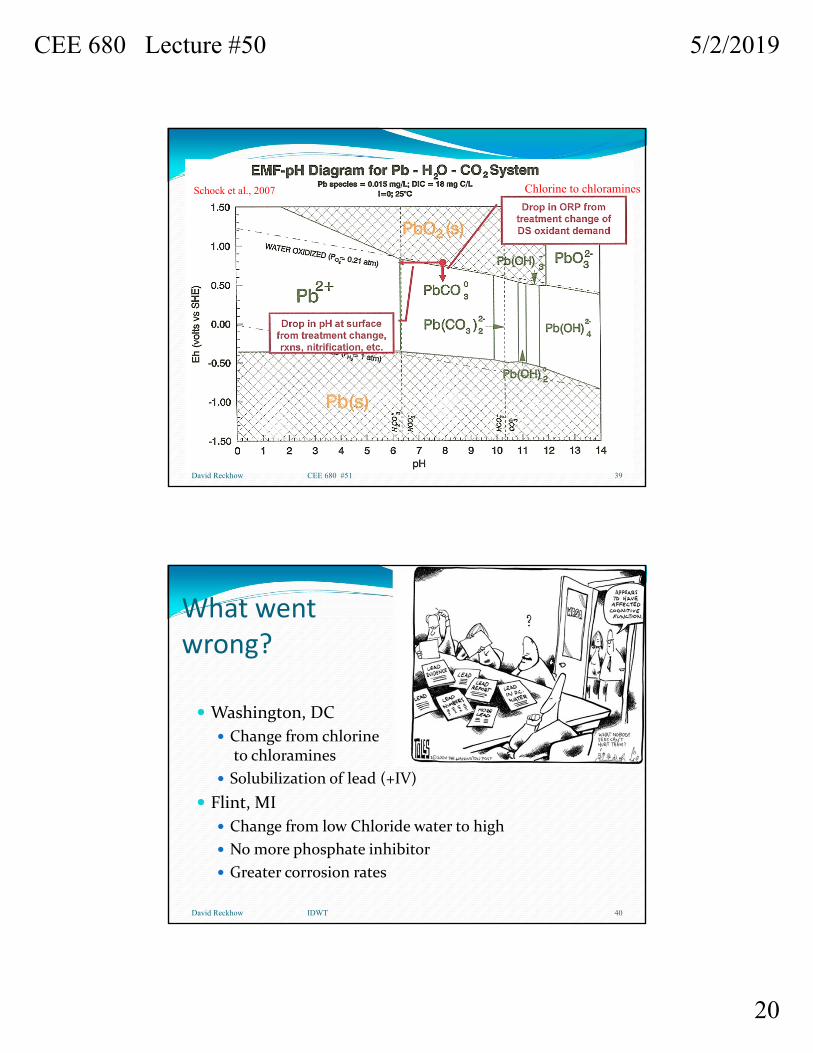
David Reckhow CEE 680 #51 39
Chlorine to chloraminesSchock et al., 2007
David Reckhow IDWT 40
What went wrong?
Washington, DC
Change from chlorineto chloramines
Solubilization of lead (+IV)
Flint, MI
Change from low Chloride water to high
No more phosphate inhibitor
Greater corrosion rates

CEE 680 Lecture #50 5/2/2019
21
How to avoid Lead problems Optimized corrosion control treatment
Control of pH and alkalinity
Addition of orthophosphate based corrosion inhibitors
Keep oxidized environment
Minimize changes in distributed water chemistry
Removal lead from system
Lead service lines
Lead in plumbing fixtures
David Reckhow IDWT 41
Daily Hampshire Gazette: 22 Jan 2016
das
David Reckhow 42

CEE 680 Lecture #50 5/2/2019
22
2003 Lead crisis in Washington, DC
David Reckhow CEE 680 #51 43
NY Times: 27 March 2016
David Reckhow 44
Lead is a neural toxin Especially serious in children
EPA: Pb & Cu Rule Published in 1991 If lead concentrations exceed an action level of 15 ppb in more than 10% of customer taps sampled (i.e., 90%ile), the system must undertake a number of additional actions to control corrosion.

CEE 680 Lecture #50 5/2/2019
23
Public Outrage 2003 in DC & elsewhere
The Great Lead Water Pipe Disaster
Werner Troesken
2006 MIT Press
David Reckhow CEE 680 #51 45
Why did the DC crisis happen? Unintended consequences of decisions made to protect public health
Need to provide clean water to cities
Disinfect with chlorine
Lead is a great piping material
Some secondary problems that need fixing ‐carcinogens
Solution: Convert chlorine to chloramines?
Oops
David Reckhow 46
First, a short history of municipal drinking water
CEE 680 Lecture #50 5/2/2019
24
How to avoid Lead problems Optimized corrosion control treatment
Elevated pH and control of alkalinity
Addition of orthophosphate based corrosion inhibitors
Other guidance
Keep oxidized environment
Keep chloride to sulfate ratio low
Minimize changes in distributed water chemistry
Removal lead from system
Lead service lines
Lead in plumbing fixtures
David Reckhow IDWT 47
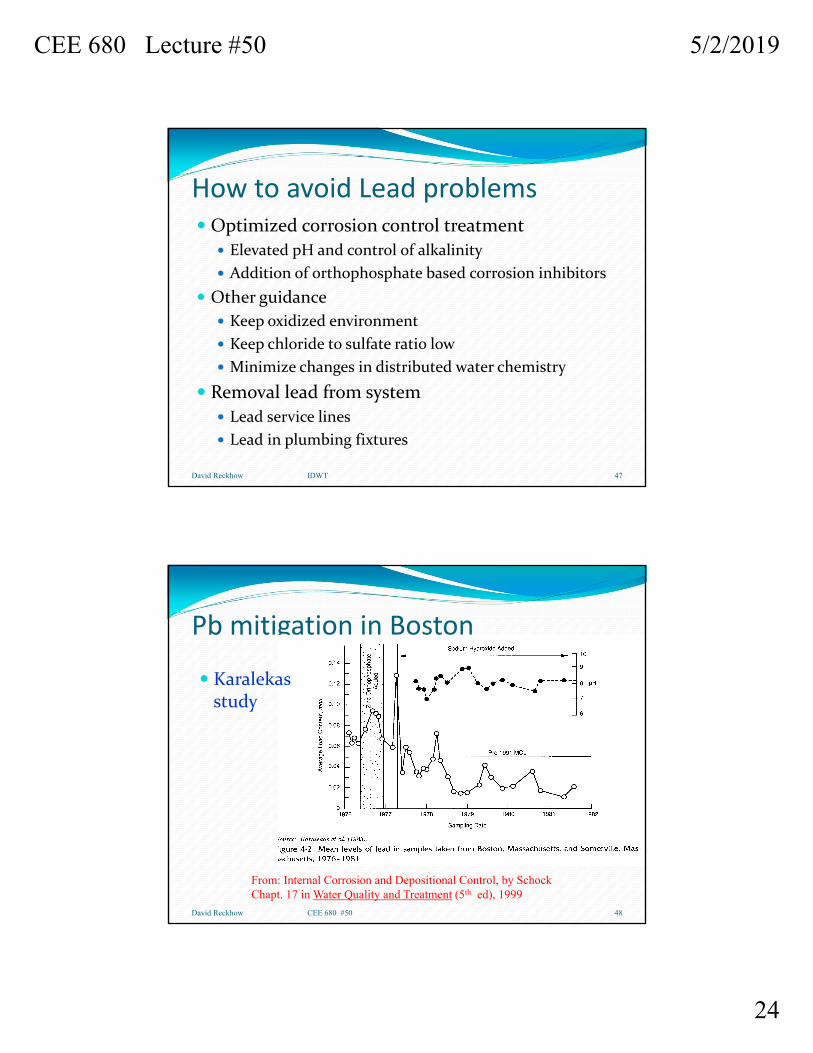
Pb mitigation in Boston
David Reckhow CEE 680 #50 48
From: Internal Corrosion and Depositional Control, by SchockChapt. 17 in Water Quality and Treatment (5th ed), 1999
Karalekasstudy

CEE 680 Lecture #50 5/2/2019
25
Pb Mitigation
Impacts on other corrosion byproducts
David Reckhow CEE 680 #50 49
From: Karalekas et al., 1983 [J.AWWA 75:2:92]
Pb: Equations Redox
Solubility
Mass Balance
David Reckhow CEE 680 #50 50
From: Aquatic Chemistry Concepts, by Pankow, 1991
33
*2
*1
*
22
*1
*1
*2
302
2
][][][1][
])([])([][][
H
KKK
H
KK
H
KPb
OHPbOHPbPbOHPbPbT
3
3*
2*
1*
22
*1
*1
*2*
][][][1][
H
KKK
H
KK
H
KHKPb soT

CEE 680 Lecture #50 5/2/2019
26
Pb (+II): Solubility Red‐ PbO(s)
David Reckhow CEE 680 #50 51
From: Aquatic Chemistry Concepts, by Pankow, 1991
Pb: Predominance Equations I
Again, in general
Which can reduce to (depending on predominance): For Pb+2
For Pb(OH)20
For Pb(OH)20
David Reckhow CEE 680 #50 52
3
3*
2*
1*
22
*1
*1
*2*
][][][1][
H
KKK
H
KK
H
KHKPb soT
27.122* ][101][ HHKPb soT
8.292
*1
**22
*1
*2* 10
][][
KKK
H
KKHKPb sosoT
][10][][
][ 4.201
**1*
2*
HHKK
H
KHKPb sosoT

CEE 680 Lecture #50 5/2/2019
27
Oxidation Chemistry of Pb Oxidation States
o, +II, +IV
Solubility
0 oxidation state: insoluble Pb(s)
+II oxidation state: relatively soluble PbO(s) (red & yellow), Pb(OH)2(s)
+IV oxidation state: essentially insoluble PbO2(s)
David Reckhow CEE 680 #50 53
Pb: Predominance Equations II
David Reckhow CEE 680 #50 54
From: Aquatic Chemistry Concepts, by Pankow, 1991
CEE 680 Lecture #50 5/2/2019
28
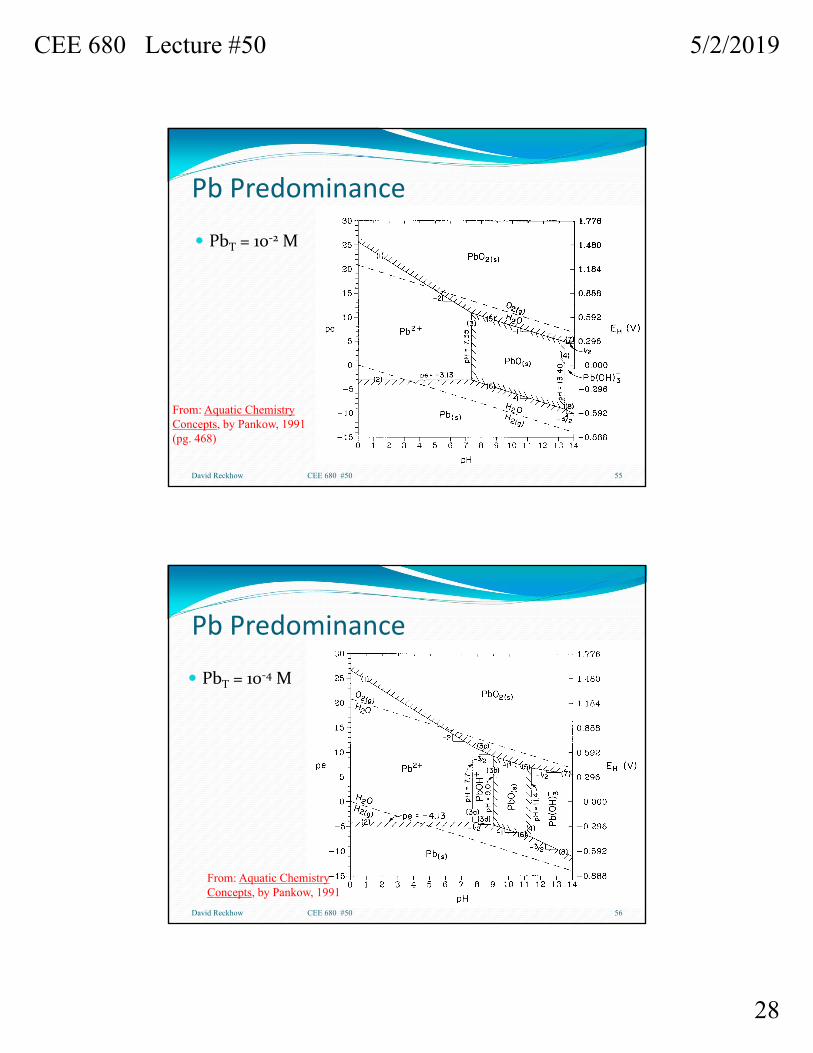
Pb Predominance
PbT = 10‐2 M
David Reckhow CEE 680 #50 55
From: Aquatic Chemistry Concepts, by Pankow, 1991 (pg. 468)
Pb Predominance
PbT = 10‐4 M
David Reckhow CEE 680 #50 56
From: Aquatic Chemistry Concepts, by Pankow, 1991

CEE 680 Lecture #50 5/2/2019
29
Combined
David Reckhow CEE 680 #50 57
From: Aquatic Chemistry Concepts, by Pankow, 1991
Pb Predominance
Pb Predominance
PbT = 10‐6 M
David Reckhow CEE 680 #50 58
From: Aquatic Chemistry Concepts, by Pankow, 1991 (pg. 467)
No simplifying assumptions

CEE 680 Lecture #50 5/2/2019
30
To next lecture
David Reckhow CEE 680 #50 59
DAR