case studies of traffic monitoring programs in large urban areas
TRANSCRIPT

US Department of Transportation
Federal Highway Administration
Case Studies of Traffic Monitoring Programs inLarge Urban Areas
July 1997
Joseph Mergel
Prepared by:
Center for Transportation Information Volpe National Transportation Systems CenterUS Department of TransportationCambridge, MA 02142
Prepared for:
Federal Highway Administration, Office of Highway InformationManagementWashington, DC 20590

i
PREFACE
This is one of two documents prepared by the Center for TransportationInformation of the Volpe National Transportation Systems Center in support of the Federal Highway Administration*s Office of Highway InformationManagement.This report presents the results of four case studies of traffic monitoring dataoperations within urban areas. The companion report documents the status oftraffic monitoring data collection and program activities found in all largeurbanized areas.
The purpose of this project is to document a series of examples of urban trafficmonitoring data collection programs in order to support the development ofurban traffic monitoring databases and promote the upgrading of urban trafficmonitoring programs.

ii
TABLE OF CONTENTS
Section Page
PREFACE............................................................................................... i
1. INTRODUCTION................................................................................. 1 - 1
1.1 PURPOSE................................................................................. 1 - 11. 2 APPROACH.............................................................................. 1 - 11. 3 THE CASE STUDY AREAS...................................................... 1 - 2
2. FOCUS AREAS AND FINDINGS........................................................... 2 - 1
2.1 FOCUS AREAS.......................................................................... 2 - 12.2 FINDINGS................................................................................... 2 - 22.3 OBSERVATIONS FROM THE CASES...................................... 2 - 4
2.3.1 Philadelphia.................................................................. 2 - 42.3.2 Tampa - St. Petersburg - Clearwater............................ 2 - 62.3.3 Minneapolis - St. Paul................................................... 2 - 82.3.4 Portland......................................................................... 2 - 10
3. CASE DESCRIPTIONS........................................................................... 3 - 1
3.1 PHILADELPHIA CASE STUDY.................................................. 3 - 1
3.1.1 Introduction To The Case Study Area........................... 3 - 13.1.2 Data Collection Program............................................... 3 - 23.1.3 Issue Areas................................................................... 3 - 13
3.1.4 Further Information....................................................... 3 - 19
3.2 TAMPA - ST. PETERSBURG - CLEARWATER CASE STUDY. 3 - 21
3.2.1 Introduction To The Case Study Area............................3 - 213.2.2 Data Collection Program............................................... 3 - 223.2.3 Issue Areas................................................................... 3 - 303.2.4 Further Information...................................................... 3 - 38

iii
TABLE OF CONTENTS
Section Page
3.3 MINNEAPOLIS - ST. PAUL CASE STUDY......................................... 3 - 39
3.3.1 Introduction To The Case Study Area.......................... 3 - 393.3.2 Data Collection Program.............................................. 3 - 393.3.3 Issue Areas.................................................................. 3 - 45 3.3.4 Further Information....................................................... 3 - 52
3.4 PORTLAND CASE STUDY................................................................... 3 - 53
3.4.1 Introduction To The Case Study Area............................3 - 533.4.2 Data Collection Program............................................... 3 - 533.4.3 Issue Areas.................................................................. 3 - 60 3.4.4 Further Information...................................................... 3 - 65
APPENDIX A - GLOSSARY..................................................................... A - 1
APPENDIX B - BIBLIOGRAPHY............................................................... B - 1
APPENDIX C - CASE STUDY PARTICIPANTS......................................... C - 1
iv
LIST OF FIGURES
Figure Page
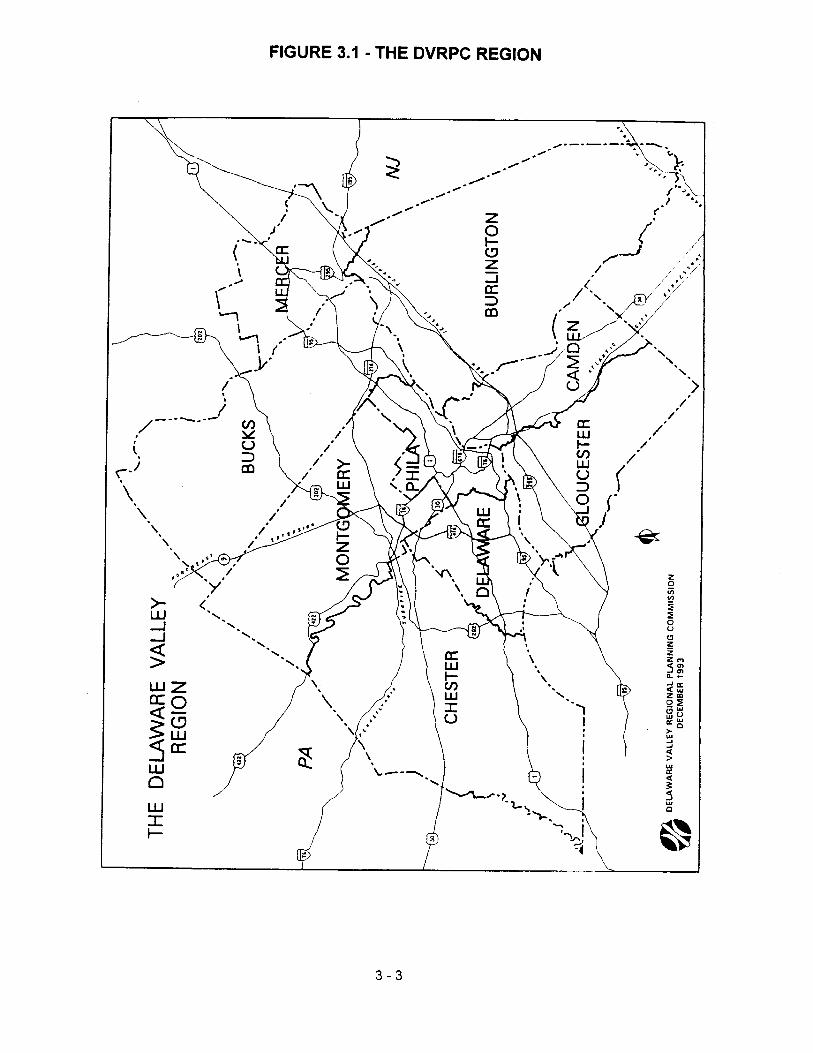
FIGURE 3.1 - THE DVRPC REGION......................................................... 3 - 3
FIGURE 3.2 - DVRPC APPROACH TO TRAFFIC DATA COLLECTION............................................................................................. 3 - 7
FIGURE 3.3 - DVRPC DATA PROCESSING FLOW................................... 3 - 8
FIGURE 3.4 - FDOT DISTRICT SEVEN...................................................... 3 - 23
FIGURE 3.5 - MINNEAPOLIS - ST. PAUL METRO AREA.......................... 3 - 40
FIGURE 3.6 - FREEWAY TRAFFIC VOLUMES.......................................... 3 - 48
FIGURE 3.7 - DISPLAY OF REAL TIME TRAFFIC CONDITIONS.............. 3 - 49
FIGURE 3.8 - PORTLAND METRO AREA................................................... 3 - 54

v
LIST OF TABLES
Table Page
TABLE 3.1 - DVRPC DATA COLLECTION PROGRAM................... 3 - 5
TABLE 3.2 - DVRPC TRAFFIC COUNTING AND MONITORING ACTIVITIES.................................................................................... 3 - 6
TABLE 3.3 - SAMPLE TRAFFIC COUNT DATA FROM THE DVRPC DATABASE........................................................................ 3 - 9
TABLE 3.4 - PINELLAS COUNTY MPO*S LEVEL OF SERVICE REPORT........................................................................................ 3 - 28
TABLE 3.5 - CITY OF TAMPA TRAFFIC DATA SPREADSHEET... 3 - 29
TABLE 3.6 - CITY OF CLEARWATER TRAFFIC SIGNAL SYSTEM SUMMARY TRAFFIC VOLUME REPORT........................ 3 - 33
TABLE 3.7 - PORTLAND REGION COUNT PROGRAM DATA...... 3 - 58
1 - 1
1. INTRODUCTION
1.1 PURPOSE Many metropolitan areas have begun or are planning to implement trafficmonitoring programs to meet the growing demand for traffic data. Several ofthese areas have requested information regarding FHWA guidance or programdevelopment in other jurisdictions. The latest FHWA guidance for urban areaswas produced in the early 1980*s and is out of date. This study is intended torespond to the existing need to update guidance information through theidentification of current program models and the dissemination of thatinformation.
The Volpe National Transportation Systems Center (VNTSC) researched thestatus of traffic monitoring operations in urbanized areas of over 200,000population by conducting telephone interviews with a number of staff fromStates, counties, cities, and metropolitan planning organizations responsible fortraffic monitoring operations. The inquiries were used to document the status oftraffic monitoring in urban areas and to identify a number of areas to be studiedin more detail. The results are presented in the report An Overview of TrafficMonitoring Programs in Large Urban Areas (forthcoming). The second phase ofthe project involves a series of four case studies, which are reported herein.
1.2 APPROACH
Each of the selected areas was visited to interview responsible programmanagers or staff and explore the specifics of the traffic monitoring dataprogram. Information on institutional arrangements, organization, staffing, datasharing, funding, costs, objectives, program size, procedures, data processing,data collection equipment, constraints, difficulties encountered, outputs, reportsproduced, etc., was considered. The examination emphasized the successesachieved and problems surmounted in the collection of reliable data. Since it isexpected that traffic data within an urban area may be collected by a variety oforganizations, the interaction, cooperation, organizational arrangements,agreements, and data sharing of the involved entities was explored. Due to theimportance and need for traffic data to support urban planning requirements,estimates of vehicle miles of travel, and the Highway Performance MonitoringSystem, the link between the traffic data collected and its use in these programswas emphasized.

1 - 2
The major points for consideration in the case studies that surfaced as a resultof the first phase of the project are as follows:
C Institutional Arrangements - inter agency contracting- inter agency coordination/cooperation- single agency data collection
C Use of ATMS/Traffic Management Center Data for PlanningC Data Use - input to Air Quality models - input to HPMS - support of CMS - State DOT needs - local agency needsC How Various Data Needs Fit Together in the Context of the Overall
Data Collection Effort C Funding Sources/Mechanisms
1.3 THE CASE STUDY AREAS
Four case study areas were selected to highlight the major issue areas identifiedin the first phase of the study. These cases are not presented as perfectmodels, but rather as examples for practice. It is hoped that readers will benefitfrom the information presented and find some applicability to their own area. The major issue areas addressed by each case study site, and selectedcharacteristics of the areas are summarized in the tables below.
Major Points Highlighted in the Candidate Case Study Areas
Inter Agency Inter Agency Single Funding Use of ATMSContracting Coordination/ Agency for Sources Data for
Cooperation Data PlanningCollection
Minneapolis X X XPhiladelphia X X XPortland XTampa X X

The mileage, population and land area for the urbanized areas were those indicated in the table1
titled “Selected Characteristics -1995” in Selected Highway Statistics, 1995.
1 - 3
Characteristics of the Candidate Case Study Areas1
Total Population Net Land Ozone CORoadway Area designation designation
Miles (SquareMiles)
Minneapolis 10,301 2,228,000 1,192 Attainment ModeratePhiladelphia 13,383 4,531,000 1,350 Severe ModeratePortland 5,509 1,329,000 469 Attainment AttainmentTampa 7,406 1,756,000 650 Attainment Attainment
2 - 1
2. FOCUS AREAS AND FINDINGS
2.1 FOCUS AREAS
The conclusions of the first phase of the project are indicated below. Thesewere based both on our review of the literature and our interviews withindividuals involved in traffic data collection at various levels of governmentthroughout the country.
CC The quality of urban area traffic data collection efforts, andpresumably of the resulting data, varies widely. Many programswould appear to meet currently accepted standards, many otherswould not, and in many cases there is no program.
CC Data within urban areas would not appear to be collected in any kindof coordinated fashion. Most data exchange is informal. The CMSrequirement of ISTEA appears to have forced agencies within urbanareas to take stock of their local jurisdictions** programs.
CC Funding and staffing cutbacks have hurt data collection efforts in therecent past, and continue to pose a threat in the future.
CC New technology would seem to hold promise as a solution tobudget/staff reductions, but does not seem to have lived up to its fullpotential.
These conclusions implied a need to explore three areas in the in-depth casestudies. First there is the need for assured funding for traffic monitoring datacollection. In addition, there is a need for the efficient use of data collectionresources. This has two aspects: one is the increased use of automation fortraffic monitoring data collection, as in ITS/ATMS: the other is in theconsolidation/coordination of traffic monitoring data collection amongjurisdictions within a given urbanized area.
To these was added the question of data use (input to Air Quality models, inputto HPMS, support of CMS, State DOT needs, local agency needs), and howvarious data needs fit together in the context of the overall data collection effort.

2 - 2
Specifically we were looking for answers to the following questions:
CC Could ATMS be used to provide planning type data?
CC How were traffic data collection programs funded in those urbanareas that managed to maintain viable programs, given that manyagencies reported that traffic data collection programs had beeneliminated or curtailed because of a lack of funding?
CC What were the key ingredients needed to achieve a coordinated /cooperative data collection program within a given urban area and toprovide all agencies in an area with the data they needed, in theproper form, and in a timely fashion?
2.2 FINDINGS
The conclusions of this report are based on our interviews with individualsinvolved in traffic data collection at various levels of government in the four casestudy areas. Specific observations from the individual areas are presented in thefollowing section. The general conclusions are as follows:
There are no unusual or innovative funding sources for traffic datacollection in widespread use at the present time.
State agencies and MPOs were found to use standard federal programfunds to pay for data collection. State and local agencies did not have asecure independent source of funding. Even in the case of Philadelphia,the MPO*s contracts with the state DOTs involved essentially a passthrough of standard federal planning funds to the MPO. However, implicitpressure from various types of growth management legislation, and aidallocation programs appear to have kept transportation planning datarelatively high on the list of budget priorities for local governments.
In a related vein, staff levels at state DOTs appear to be as much of apolicy decision as a budget question. Decreased staff size as opposed todecreased budget levels appears to be more of a threat to maintainingviable data collection programs at the State DOT level.
ATMS type systems can be used to collect planning data, but a wellthought out “ATMS” implementation plan is necessary if ATMS is toprovide useful planning type data.
Currently available hardware and software from traffic signal controlsystems and ramp metering systems is being utilized by various agencies

2 - 3
to collect traffic data. The keys to success seem to be a desire to use thesystem to collect planning data in the first place, designing the system sothat it is capable of collecting meaningful data, and maintaining thesystem so that reliable data is obtained over time. ATMS is seen as asolution to the problem of declining staff levels and increasing data needsi.e., automation to increase productivity, and the safety of data collection.
There also is a move toward automation of data collection in terms ofincreased use of permanent continuous count stations for increasedproductivity and safety.
There is no “magic” ingredient in the success of coordinated datacollection programs.
Successful programs were based on a spirit of cooperation andprofessionalism among all involved parties within a region. However, itappears to be helpful to have one agency take the lead in advocating andcoordinating the program.
While the consolidation of most traffic data collection efforts within asingle agency just happened in the Philadelphia area, it could be made tohappen elsewhere if all parties were in agreement.
While current programs generally provide the data that is needed, dataquality and accessibility are major concerns.
Agency needs, CMS requirements, HPMS requirements, and air qualitymodeling requirements all seem to be adequately served by the currentprograms. However, if CMS is to be real and not just a paper exercise,more and different types of data may be needed. HPMS data did notappear to be widely used in urban areas except for meeting federalreporting requirements.
Quality control of all aspects of data collection and processing isessential. This issue emerged during the course of the case study sitevisits. The loss of permanent staff devoted to data collection appears tohave had an adverse impact on the quality of data. The reliability ofequipment especially AVC technology also surfaced as a concern. Another concern expressed was that of making data collected by allinvolved agencies available to all partners in a consistent format on atimely basis.

2 - 4
The recommendations of this report are as follows:
All new ATMS systems should be designed and built with the capability ofcollecting traffic monitoring type data.
Despite the fact that ATMS type systems in a number of areas now collectdata for planning purposes, there are many other areas where thiscapability is not utilized. In an age of increasing data needs and decliningdata collection budgets and staff levels, this source of data should beutilized to its full potential.
The concept of a central clearinghouse for the evaluation of data collectionequipment , and the widespread dissemination of the resultant informationto data collection agencies, including those below the state DOT level,should be vigorously pursued.
A number of concerns regarding the accuracy of available traffic datacollection equipment, especially that used for vehicle classification andspeed, were volunteered by case study participants in the course of thesite visits. Some of the local agencies had been forced to conduct theirown tests on the equipment. The time and expense for eachtransportation agency to do their own testing is clearly wasteful andinefficient.
The state DOTs and FHWA, working through a pooled fund project, haveattempted to establish a test center and clearinghouse for vehicledetector equipment. Observations from the site visits reinforced thecrying need for such a facility, and more importantly the dissemination ofthe results to all transportation agencies involved in data collection,especially those at the city, county, and MPO level.
The need for such a facility will become even more evident as newtechnologies such as Global Positioning Systems come into morewidespread use.
2.3 OBSERVATIONS FROM THE CASES
2.3.1 Philadelphia
2.3.1.1 Value - The Philadelphia experience highlights three ingredients for asuccessful traffic data collection program:
C the need for a “critical mass” in data collection;
• the old adage, that practice makes perfect;

2 - 5
C and, the need to pursue innovative funding approaches.
“Critical mass”: This implies a need to do a certain amount of data collectionin order to justify a program, and concurrently implies a need to fully utilizeequipment and personnel. DVRPC makes extensive use of equipment andcrews. They have a year round count program (except for days with snow cover)employing their crews every day, every week of the year.
Conversely, the City of Philadelphia found that it was not economically feasibleto maintain an independent program in their Streets Department, and that it wasmore economical to hire DVRPC to do their required data collection.
This is a strong argument for pooling resources in an urban area to establish asingle viable program as opposed to struggling to maintain a number ofindependent programs.
“Practice makes perfect”: This simply means that experience gained on a fulltime job by permanent staff results in a better quality program than one staffedby temporary staff with a high degree of turnover. This helps to build aprogram*s reputation and in the case of DVRPC has resulted in more requestsfor work by other agencies. ( PENNDOT, for example, was highlycomplementary of DVRPC.)
PENNDOT also noted that quality control in data collection was an issue withsome other MPOs and District offices due to the lack of full time staff for datacollection.
“Innovative funding”: In the Philadelphia area context this means a mix of outside “contracts” and internal agency line item money for the data collectiongroup. DVRPC*s Office of Travel Monitoring seems to have developed aunique approach to funding which is a mix of outside sponsor support andinternal agency funds.
2.3.1.2 Adaptability/Cautions - DVRPC appears to have assumed theirpredominant role in traffic data collection by default. They had a need for datafor the own use in an area where the city and state historically had weak datacollection programs at best, and the counties did not collect data at all. Theyhave a highly competent in house staff. This situation may not be present in allareas. However, that is not to say that responsible data collection agencies in agiven urban area could not get together and agree to assign data collectionresponsibility to a single agency. In certain areas, a data collection agency atone level may be faced with staff but not with budget restrictions, while a data

2 - 6
collection agency at another level of government may not have any hiringrestrictions, but would require additional funding in order to expand their trafficdata collection program. In the Philadelphia case, staff cuts at the state levelforced the transfer of data collection responsibilities from the State DOT to locallevel agencies with a commensurate transfer of funds.
While there may be administrative implications involved in inter agencycontracting, as well as political implications connected with the transfer of atraditional agency function to another agency, these need not beinsurmountable. The requirement to collect more and better quality data withless, or at best the same amount of resources may leave agencies with littlechoice, and certainly makes a consolidation of traffic data collection programs anoption worth exploring in detail.
2.3.2 Tampa - St. Petersburg - Clearwater
2.3.2.1 Value - The Tampa situation highlights three major points related totraffic data collection:
C planning type data can be pulled from a computer controlled trafficsignal system with existing off-the-shelf software;
C there is a need for common data collection standards in order to makequality data available to all partners in a form that meets everyone*sunique needs; and
C a successful cooperative data collection and pooling effort seems tobe based on an intangible - a spirit of good will, and mutual respectand trust among the individuals at the various agencies.
Traffic Volume Data Can Be Obtained From An ATMS With ExistingSoftware: Planning data can be pulled from a computer controlled traffic signalsystem with existing off-the-shelf vendor software. For example, both the City ofClearwater and Hillsborough County systems can produce “summary” reports ofnumbers of vehicles by 15 minute intervals. However, there may be a need forsoftware to produce system summary data as a database as opposed to areport, and to store/transfer the data via electronic media. In Pinellas County,the City of Clearwater*s hard copy reports produced by the signal system haveto be entered by hand into the MPO*s county wide database. Overcoming thiswould appear to be a trivial problem, and Clearwater is in the process ofdeveloping an electronic version of the system*s output.
There are a number of ingredients essential to the success of an automated datacollection program.
2 - 7
Intelligent system design is a prerequisite. For example, it helps to have loopsin all lanes of multilane roadways if the system is to provide meaningful trafficvolume data.
A commitment to ongoing data checking/quality control and to loop maintenanceis essential to the successful use of data. Malfunctioning loop detectors must beidentified and repaired in a timely fashion if the system is to be used as a sourceof quality traffic count data.
The data users must define what they want to see, so that raw data can besummarized via electronic media in the format they desire. In HillsboroughCounty massive amounts of system data, e.g., vehicle counts by lane by secondare stored on CD ROM, but are not used for planning purposes.
Common Traffic Data Formats, And Data Collection Standards Are NeededAt Least Within A Given Region: There is a need for common data formats,standards, etc. Adequacy of coverage is not a problem in Florida since the 80*sbecause of concurrency. Making quality data available to all parties in acommon format that meets everyone*s needs is the real challenge. The PinellasCounty MPO has such a database, the Hillsborough County MPO is developingone and FDOT District Seven is planning on developing one. Here the majorproblem appears to be one of getting all agencies collecting data to produce theoutput in one consistent format in electronic form. As indicated above thePinellas County MPO currently has to transform the data obtained from thejurisdictions into a common format for use in their county wide database.
The Success Of A Cooperative/Coordinated Data Collection ProgramSeems To Be Based On An Intangible: The success of acooperative/coordinated data collection program seems to be a function of thepersonalities involved and their approach to solving a common problem. InFlorida the local jurisdictions must collect data because of concurrency, butnothing makes them share data except a spirit of good will among the individualsat the specific agencies, and the realization that it is in their own best interest tocooperate with other agencies involved in traffic data collection. The long termcontinuity of the individuals involved at each agency also seems to be animportant factor. These comments would also apply to the level of cooperationachieved between the multiple MPOs serving the region.
2 - 8
2.3.2.2 Adaptability/Cautions - While it is possible to obtain traffic volume datafrom an ATMS type system today, a number of impediments to doing so may bepresent in existing systems. First, all ATMS type systems may not have beenwell planned in terms of loop placement, and would require extensive andexpensive retro fitting with additional detectors in order to allow the system toprovide meaningful traffic volume data. Moreover, all currently operating ATMStype systems do not maintain loops adequately, and do not monitor dataadequately, if at all. The former problem may require additional fundingspecifically designated for system maintenance. Both problems may require achange in mind set on the part of the operating agencies.
Data conversion and database construction can be an expensive and timeconsuming process. Once in place, a common traffic database may provide longterm savings for all “partner” agencies. However, many agencies at the locallevel who are struggling to maintain their existing programs may not have theresources to invest in such an effort. Additional funding may be required to helplocal agencies put their data “production” efforts on a common electronic basis.
All states do not have concurrency legislation, and adequate data is not alwaysavailable. Thus, agencies who are hard pressed to meet their own datacollection requirements, may not always find it easy to respond to requests fordata from an outside agency. However, a spirit of cooperation should bepossible anywhere, as long as everyone can be convinced that it is in their ownbest interest to “buy in” to a cooperative/coordinated program.
2.3.3 Minneapolis - St. Paul
2.3.3.1 Value - The Minneapolis meetings reinforced three points related totraffic data collection:
C planning type data can be pulled from an ATMS, in this case a rampmetering system;
C a successful cooperative data collection and pooling effort seems tobe based on an intangible - a spirit of good will, and mutual respectand trust among the individuals at the various agencies;
C in addition, the Minneapolis situation highlighted the need for a “lead”agency (in this case the state DOT) in making a regional datacollection program successful.

2 - 9
Traffic Volume Data Can Be Obtained From An ATMS With ExistingSoftware: Planning data can be pulled from a computer controlled rampmetering system with existing software. The TMC can produce “summary”reports of numbers of vehicles in the AM peak, PM peak and 24 hour counts forvarious freeway segments. They have developed software to produce systemsummary data in the same format as that of a continuous traffic counter and aredeveloping a DBMS in order to make the data more user friendly and usable toplanners.
There are a number of ingredients essential to the success of such a program.
Intelligent system design is a prerequisite. For example, it helps to have loopsin all lanes of multilane roadways if the system is to provide meaningful trafficvolume data.
A commitment to ongoing data checking/quality control and to loop maintenanceis essential to the successful use of data. Malfunctioning loop detectors must beidentified and repaired in a timely fashion if the system is to be used as a sourceof quality traffic count data.
The data users must define what they want to see, so that raw data can besummarized via electronic media in the format they desire.
The Success Of A Cooperative/Coordinated Data Collection ProgramSeems To Be Based On An Intangible: The success of acooperative/coordinated data collection program seems to be a function of the professional approach of the individuals involved and their wish to solve acommon problem. In Minnesota the local jurisdictions collect data becausethese data are used in determining their state aid allocation for highways. However, there are no mandates requiring them to do so. Nothing makes themshare data except a spirit of good will among the individuals at the specificagencies, and the realization that it is in their own best interest to cooperate withMNDOT.
There Is A Need For A “Lead” Agency In Making A Regional DataCollection Program Successful: The Minneapolis area traffic data collectionprogram could be viewed as a “meat and potatoes” program, but it works. Whileit is undergoing changes, especially in the area of automation and dataprocessing methods, it makes data accessible to users in a form that they needwhen they need it. This fact is due to MNDOT, who long ago designed theprogram and established basic standards for data quality and consistency which
2 - 10
are followed by the jurisdictions. The state aid program is implicitly behind theneed to have traffic data by jurisdiction on a comparable basis.
2.3.3.2 Adaptability/Cautions - While it is possible to obtain traffic volume datafrom an ATMS type system today, a number of impediments to doing so may bepresent in existing systems. First, all ATMS type systems may not have beenwell planned in terms of loop placement, and would require extensive andexpensive retro fitting with additional detectors in order to allow the system toprovide meaningful traffic volume data. Moreover, all currently operating ATMStype systems do not maintain loops adequately, and do not monitor dataadequately, if at all. The former problem may require additional fundingspecifically designated for system maintenance. Both problems may require achange in mind set on the part of the operating agencies.
All states do not have a state aid allocation program for highways implicitly tiedto traffic data. Thus, agencies who are hard pressed to meet their own datacollection requirements, may not always find it easy to respond to requests fordata from an outside agency. However, a spirit of cooperation should bepossible anywhere, as long as everyone can be convinced that it is in their ownbest interest to “buy in” to a cooperative/coordinated program.
2.3.4 Portland
2.3.4.1 Value - The Portland situation is unusual in that as much can be learnedfrom the weaknesses of the program as its strengths. The former are recognizedby the participants. The major observations are as follows:
C a successful cooperative data collection and pooling effort seems tobe based on an intangible - a spirit of good will, and mutual respectand trust among the individuals at the various agencies;
C there is a need for a “lead” agency (in this case the MPO) in order tomake a regional data collection program successful; and
C common data collection standards and software are necessary inorder to make quality data available to all partners in a form that meetseveryone*s unique needs.
The Success Of A Cooperative/Coordinated Data Collection ProgramSeems To Be Based On An Intangible: The success of acooperative/coordinated data collection program seems to be a function of thepersonalities involved and their approach to solving a common problem. In
2 - 11
Portland, nothing makes the jurisdictions share data except a spirit of good willamong the individuals at the specific agencies, and the realization that gooddata supports good decision making. However, there are no mandates requiringthe sharing of data, and while the MPO defines its data needs, it must takewhatever the jurisdictions provide.
The Portland area data collection program is far from perfect . Potential budgetcuts are a threat to the local programs. Staffing cuts appear to be hurting thequality of the ODOT program. There are some problems of data incompatibilityand difficulties in translating different GIS languages and data..
The program is as good as it is primarily because of the dedication of the staff atall agency levels in doing the best they can with what they have now, while theywork toward a better system. All participants try their best, and cooperatevoluntarily in the face of declining budgets and staff levels, to maintain a qualityregional data collection program.
There Is A Need For A “Lead” Agency In Making A Regional DataCollection Program Successful: Metro administers Portland*s regional countprogram, and has recently acquired a small amount of funding to collect trafficcount data. Metro designed the regional count program and is the driving forcebehind its continuation. The count program was developed in order to supportthe region*s travel demand model, which the jurisdictions can access in order todo their own analysis. Metro may be viewed as the region*s leading agency interms of analytical capability related to transportation planning models. Metromaintains and enhances the regional planning model, and provides training tothe jurisdictional staff regarding the use of the model, the theory of traveldemand modeling, and computer network simulation analysis.
Common Traffic Count Data Formats, And Data Collection Standards AreNeeded At Least Within A Given Region: Making quality data available to allparties in a common format that meets everyone*s needs is the real challenge. Here the major problem appears to be one of getting all agencies collecting datato produce the output in one consistent electronic format.
While both the City of Portland and ODOT have their data in electronic form, it isnot in one consistent format. Furthermore, within ODOT, the data from variousdata collection activities, such as their annual freeway counts, HPMS counts ,etc., are not in one consolidated data base (because the information is collectedfor differently funded and mandated programs). The MPO currently has totransform the data obtained from the jurisdictions into a common format for usein their traffic count data spreadsheets (and anticipated regional database).
There is also a need for a commonly accepted GIS platform for the region (or

2 - 12
development of a better translation software), if the GIS is to be used to its fullpotential in the display and analysis of traffic data.
2.3.4.2 Adaptability/Cautions - Agencies who are hard pressed to meet theirown data collection requirements, may not always find it easy to respond torequests for data from an outside agency. However, a spirit of cooperationshould be possible anywhere, as long as everyone can be convinced that it is intheir own best interest to “buy in” to a cooperative/coordinated program.
Data conversion and database construction can be an expensive and timeconsuming process. Once in place, a common traffic database may provide longterm savings for all “partner” agencies. However, many agencies at the locallevel who are struggling to maintain their existing programs may not have theresources to invest in such an effort. Additional funding may be required to helplocal agencies put their data “production” efforts on a common electronic basis.

The nonattainment area includes the total nine-county DVRPC region as well as Salem and2
Cumberland counties in New Jersey, New Castle County in Delaware, and Cecil County inMaryland.
3 - 1
3. CASE DESCRIPTIONS
3.1. PHILADELPHIA CASE STUDY
3.1.1 Introduction To The Case Study Area
The Philadelphia urbanized area has a population of 4,531,000, a land area of1,383 square miles, and a roadway system of 13,383 miles. It is a Severenonattainment area for ozone, and a Moderate nonattainment area for CO . The2
Delaware Valley Regional Planning Commission or DVRPC (the PhiladelphiaMPO) is the primary traffic data collection agency in the area. In addition, theNew Jersey DOT has an independent data collection program in the New Jerseyportion of the urbanized area. There are 352 municipalities or minor civildivisions in the DVRPC region including the cities of Philadelphia, Trenton,Camden and Chester. The nine county DVRPC region is shown in Figure 3.1.
DVRPC as an agency is best described by their mission statement.
Created in 1965, the Delaware Valley Regional Planning Commission(DVRPC) is an interstate, intercounty and intercity agency which providescontinuing, comprehensive and coordinated planning for the orderly growthand development of the Delaware Valley region. The region includes Bucks,Chester, Delaware, and Montgomery counties as well as the City ofPhiladelphia in Pennsylvania and Burlington, Camden, Gloucester, andMercer counties in New Jersey. The Commission is an advisory agencywhich divides its planning and service functions between the Office of theExecutive Director, the Office of Public Affairs, and three line Divisions:Transportation Planning, Regional Planning, and Administration. DVRPC*smission for the 1990s is to emphasize technical assistance and services andto conduct high priority studies for member state and local governments,while determining and meeting the needs of the private sector.
This case study is based on information gathered during meetings held during asite visit made to Trenton NJ (10/15/96), Philadelphia (10/16/96), and HarrisburgPA (10/17/96). Meetings were held with staff of the New Jersey Department ofTransportation (NJDOT), the Delaware Valley Regional Planning Commission(DVRPC), and Pennsylvania Department of Transportation (PENNDOT) respectively in order to learn more about traffic data collection and use in thePhiladelphia area. This information was supplemented by documentation

3 - 2
supplied by the participating agencies, and information provided through thetelephone interviews conducted under the first phase of this project.
3.1.2 Data Collection Program
3.1.2.1 Introduction - The Delaware Valley Regional Planning Commission (DVRPC) is the primary traffic data collection agency in the Philadelphia area.The MPO maintains an extensive data collection program for their ownpurposes, and working under contract, DVRPC also does all counts forPENNDOT, and the City of Philadelphia. DVRPC also does counts forPENNDOT District 6 and the Pennsylvania counties. These counties also hireconsultants to do counts. In the four New Jersey counties DVRPC or NJDOTthrough it*s consultants do counts for the counties. The New Jersey DOT has anindependent data collection program in the New Jersey portion of the urbanizedarea.
3.1.2.2 Type of Program - DVRPC - The DVRPC*s Office of Travel Monitoringmaintains an extensive data collection program in the Philadelphia region. Theyhave a program supporting their own agency requirements including cordon lineand screen line counts, traffic monitoring in selected highway corridors, and insupport of area wide VMT estimation. In addition they collect data for theirmember governments, and collect data under contract for PENNDOT, NJDOT,PENNDOT - District 6, and the City of Philadelphia. Counts are done yearround, on a full time basis .
In Pennsylvania, the DVRPC traffic count data collection program utilizes 25permanent loop counters. Data is also collected at 1500 stations on an annualcycle, 300 stations on a 3 year cycle, and 100 stations as needed by programrequirements. All data is collected for a duration of 48 hours, and reported toPENNDOT for a full 24 hour duration. On the New Jersey side data is collectedat 800 stations on an annual cycle, and about 120 stations on a 3 year cycle. Alldata is collected for a duration of 48 hours. In addition to this permanentprogram the DVRPC conducts additional manual counts and mechanical countson an as needed basis.
City of Philadelphia data is collected on about a 6 year cycle - one area of theCity each year. The City of Philadelphia data also goes to PENNDOT for stateroutes and local federal aid routes. Data is collected for counties upon request.DVRPC also collects HPMS and other supplemental count data for PENNDOT. The HPMS sample sites are selected by PENNDOT.

3 - 4
DVRPC*s traffic data collection program for the upcoming year is summarized inTable 3.1.
The requirements driving the DVRPC data collection program are summarized inTable 3.2. Figure 3.2 illustrates their overall approach to traffic data collection.
In Pennsylvania, DVRPC*s vehicle classification data collection program forPENNDOT collects data at 50 stations on a 3 year cycle, and at 20 stations asneeded by program requirements. All data is collected for a duration of 48hours. In addition to this permanent program the DVRPC conducts about 10manual classification counts and 50 mechanical counts per year in thePennsylvania side of the area on an as needed basis. In New Jersey, DVRPC*svehicle classification data collection program collects data at 30 stations on aannual cycle (count duration of 48 hours). In addition, the DVRPC conductsabout 48 manual counts per year. (They do 12 sites once every quarter.)
It might be noted that DVRPC found that AVC machines were not reliable forvehicle classification at medium to high volumes over multiple lanes or whereoperating speeds were below 25 M.P.H.. Their solution was to use thisequipment on only one lane at a time, where operating conditions wereappropriate.
DVRPC has conducted a one time vehicle occupancy study in New Jerseyinvolving 54 sites and in Pennsylvania at 55 sites. The recent vehicleoccupancy study was the first done in the past 15-20 years.
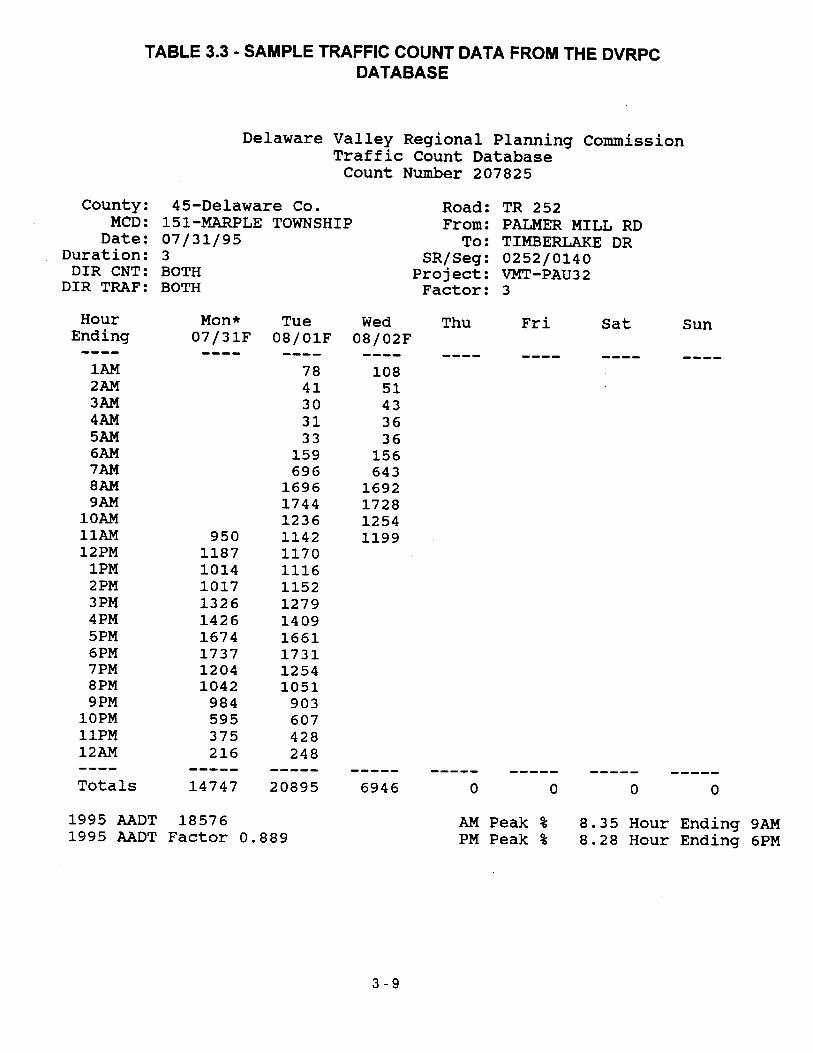
Figure 3.3 shows the data processing requirements necessitated by the need toservice multiple “clients”. A sample/example from the traffic count database isshown in Table 3.3.
DVRPC has complete traffic data files from 1985 to 1995 in a GIS format. GIStraffic records contain year, month, and day of the count; state, county, andmunicipality; road and SR (state route) number; from and to end points; AADT,AM peak percent of AADT, and PM peak percent of AADT; weather; and hourlycounts - 1:AM, 2:AM, 3:AM .... midnight.
PENNDOT - Traffic monitoring in Pennsylvania is a partnership between thedepartment, the 14 MPOs, several Local Development Districts and the DistrictOffices. The partnership takes shape through the annual Unified Planning WorkProgram drafted by each agency. Traffic counting and other activities arecontracted through these documents. With limited Department staff, otheragencies play a major role in data collection. In the Philadelphia area, DVRPCis the traffic data collection agent for PENNDOT.


3 - 10
Pennsylvania*s basic traffic counting program is comprised of 24 hour machinevolume counts, supplemented with a lesser number of (and a limited number ofshort duration manual) vehicle classification counts. All highway traffic countsare stored in the Department*s Roadway Management System (RMS).
HPMS in Pennsylvania includes approximately 5,500 sample sections that arecounted on a three-year cycle. In addition, 1000 so-called “donut” countlocations - needed to support CAAA VMT analyses outside urbanized areas butwithin nonattainment areas - are included under the HPMS umbrella. A subsetof HPMS traffic count locations has been selected for classification counts. Each of these 500 locations (selected across all highway functional classes) iscounted triennially.
Since HPMS is a sample based program, total coverage of the state systemrequires additional traffic counting efforts, the “Supplemental Count Program”.Consequently, segments not associated with at least one HPMS sample sectionhave been fitted with a supplemental traffic counting site. These sites arecounted on a triennial basis. Additionally, other locations with no recent trafficcount history are also counted.
A limited amount of short count traffic data is accomplished by way of manualcounts. Manual counts are taken were placement of machines is not possible,practical, or safe. The predominant number of machine counts involve countersequipped with road tubes. However, Pennsylvania has begun a program toinstall inductive loop systems on selected sections of its expressway system. For the most part these are double loop systems (two per lane) capable ofestimating speed and vehicle length.
PENNDOT has undergone serious downsizing in the last 16 years. They nowhave a central staff of 3 involved in traffic data collection. They have a pilotprogram where they (the central staff) have hired temporary employees for datacollection and report production. They may expand this in the future.
The MPOs collect data for the state within the TMAs under contract toPENNDOT. None of the MPOs do anything other than what the State asks/tellsthem to with the exception of Philadelphia. The district people supplement theMPO work for PENNDOT in the TMAs although this varies from TMA to TMA. Data from ATRs in the DVRPC region are still collected by PENNDOT viatelemetry.
A GIS is used to schedule counts for the upcoming year. The GIS data includesinformation on who did the count, the type, how often its done, the year of thecycle, and roadway attribute data. PENNDOT is still working on the capability ofautomatically loading count data into the GIS.

3 - 11
PENNDOT currently produces statewide flow maps by hand, but are going toautomate with GIS. They can do maps on their GIS, but need to check thesemanually (e.g., the placement of numbers over links, general “cosmetics” andthe validity of numbers). They are currently unable to keep up with theirreporting requirements, e.g. producing county flow maps in a timely fashion.
NJDOT - NJDOT collects volume, spot vehicle speed, AVC, weigh-in-motion,average passenger occupancy, and turning movement data. They are involvedin a cooperative data collection effort with DVRPC in the Trenton andPhiladelphia Urbanized Areas.
Of the three New Jersey MPOs, only DVRPC has its own active traffic monitoringprogram. Their activities for NJDOT are limited to volume counting, somevehicle classification, and local counts for estimating VMT. They performmanual 8-hour classification counts for NJDOT at 12 locations each quarter; andthey recently completed an evaluation of four models of AVC recorders and ananalysis of the comparability of truck percentages between 8-hour and 24-hourdatasets.
Statewide, NJDOT operates 48 permanent traffic counting stations; 57 majortraffic counting stations that are monitored for one week per month with portableequipment; 13 semi-permanent speed monitoring stations; 3 permanent AVCstations; and 17 weigh-in-motion stations. New Jersey*s TMS/H includes 2,990sites including these permanent and major stations, and sites to be monitoredusing portable equipment for 48 hours on a three-year update cycle.
There are four field staff left to do traffic volume and AVC data collection. Thereare two technicians engaged in speed monitoring activities in addition to otherwork. Five office staff process traffic volume and vehicle classification data, andtwo others process WIM and speed monitoring data. The traffic volume, AVC,and occupancy data collection was privatized at the end of 1995 with theexecution of four regional traffic monitoring contracts with consulting firms. Theconsultant only collects count data for HPMS. The rest of the input is producedby internal staff. Another firm was engaged to perform light maintenance on thepermanent traffic monitoring stations. There is also a $2.27 million constructionprogram to build 28 new permanent count stations throughout the state.
In the four New Jersey counties of the DVRPC area, for the three year datacollection cycle 1996 -1998, the NJDOT will be collecting speed data at 8 sites,WIM data at 28 sites, classification data at 107 sites, and volume data at 732sites. The New Jersey DOT also collects traffic count data in the area under apermanent program utilizing 13 continuous counters. All count data is up onGIS(DBMS), which also maps/displays data. They are in the process ofconverting to a standard system for the state.3.1.2.3 Data Collection Equipment - DVRPC has 105 traffic volume counters
3 - 12
for use in the area. Sixty of these can also collect classification data. Twenty fivetraffic count stations have permanently installed loops, while all other countstations and classification stations are utilized with road tubes.
The New Jersey DOT has 13 permanent continuous count stations in the fourcounty area making up the New Jersey portion of the Philadelphia urban area. Other equipment data was not available.
3.1.2.4 Data Collection Staff Levels - DVRPC relies on permanent in housestaff for data collection, supplemented by temporary help. The following are fulltime equivalents : 2 management and analysis; 3 data collection, processing andevaluation (2 of these 3 are temporary co-op positions); and 5 field persons. Staff levels for the New Jersey DOT were not available for the Philadelphia area.
3.1.2.5 Data Use - The purpose for which each agency within the urban areacollected the type(s) of data they did are indicated below.
The NJDOT collects traffic count data for the following purposes:HPMS input;VMT estimates;statewide transportation planning;environmental planning;other - pavement design and support of other management systems.
DVRPC collects traffic count, vehicle classification, and vehicle occupancy datafor the following purposes:
HPMS input;VMT estimates;CMS programs;local traffic planning;region-wide transportation planning;travel simulation models;corridor planning;major investment studies;pavement design and bridge projects;traffic trend analysis;preliminary engineering;traffic & signal improvements;air quality studies;travel forecasts; andprivate sector traffic requests.
3.1.2.6 Data Flows Within the Urban Area - Each individual interviewed as partof the initial phase of the project was asked if their agency shared or pooled data

3 - 13
with other agencies within the urban area. They were also asked if the data wereprovided informally or formally.
Informal exchange means that it was done as needed, on a case by case basis,e.g. an individual in one agency calling an individual in another to see if theyhad any recent data on a certain intersection or road segment. Formalexchange involves the transfer of a comprehensive data set on a regular orroutine basis, e.g. each year, an agency provides other agencies within the areawith a copy of all the traffic data it collected during the past year.
In the Pennsylvania portion of the region DVRPC provides traffic count data tothe Pennsylvania DOT and its member counties and cities on a formal basis. Vehicle classification data is also provided to PENNDOT. DVRPC also obtainswhatever other traffic count data the cities, counties, or PENNDOT haveavailable (primarily from counts performed by consultants) on an “informal”basis. Problems with the later include incompatible and inconsistent format, and identification of counts as to location, duration, etc.
In the New Jersey portion of the region the New Jersey DOT exchanges trafficcount data with DVRPC on a “formal” basis, and with the counties and cities onan “informal” basis. The New Jersey DOT has no problems with the current datasharing arrangements. DVRPC noted that it provided traffic count data to theNew Jersey DOT and its member counties on a “formal” basis, and that itreceived data from New Jersey DOT and consultants hired by the cities,counties or developers on an “informal” basis. DVRPC has no problems with thecurrent data sharing arrangements.
3.1.3 Issue Areas
The traffic monitoring program in the Philadelphia area should be of interestbecause of the somewhat unusual approach to institutional arrangements andfunding sources for the primary data collection agency, specifically the use ofinter agency contracting in data collection, and the role of a single agency formuch of the data collection in the region. These are discussed more fully below.
3.1.3.1 Institutional Arrangements - Inter Agency Contracting: Much ofDVRPC*s data collection is done under contract to other agencies, specificallyPENNDOT, PENNDOT District 6, the City of Philadelphia, and NJDOT. Whilethe DVRPC work for PENNDOT is part of a larger statewide program, the

3 - 14
relationship between DVRPC and PENNDOT is unique relative to that ofPENNDOT and other MPOs in the state.
Six years ago DVRPC only collected HPMS data for PENNDOT on a 3 yearcycle. Now they also collect other “supplemental“ counts. At one time all countswere classification counts, but now they use the TMG (Traffic Monitoring Guide)approach where classification counts are a subset of volume counts.
PENNDOT shifted data collection from a central staff to the MPOs in the earlyeighties. This was done in order to eliminate central office staff, to cut thebudget and reduce the size of government. In addition there is no central trafficanalysis capability. This is all done by the Districts and consultants. PENNDOTstill has 3 central staff who do counts on Interstates, special requests, and trainMPO staff. They have hired temporary summer help to do supplemental counts,but can*t hire any more permanent full time staff.
PENNDOT has contracts with the MPOs, the District offices, and LocalDevelopment Districts (like MPOs in rural areas) to collect data over the entirehighway system. PENNDOT provides equipment to the MPOs (except forDVRPC), and the Districts. However, this is changing, and PENNDOT will begiving the MPOs money to buy their own equipment.
Quality control is an issue with data coming from the some of the MPOs (qualityvaries widely). This is due to personnel turnover in the data collection staff atthe MPOs. This is also a problem with some of the Districts. Moreover some ofthe Districts tend to view data collection as a nuisance. However, PENNDOTfeels that they have a good working relationship with the MPOs.
PENNDOT District 6 also hires DVRPC or consultants to do project type counts.
NJDOT has several projects with DVRPC, including manual classificationcounts, local road counts for estimating VMT and other VMT counts at selectedlocations. Consultants now do all other counts for NJDOT statewide. DVRPCalso collects data for its own purposes at sites in the New Jersey portion of theDVRPC region.
Inter Agency Coordination/Cooperation: In Pennsylvania, data from theMPOs, and Districts goes into the RMS database on the PENNDOT mainframe.Only DVRPC, and the MPO in Pittsburgh have access, although all agenciesprovide input. PENNDOT does provide data to the other MPOs on request. TheRMS contains all count data in the state, regardless of the year of the count. (RMS data for every link in the state is not for a common year, but for whateverthe year of collection.) However, all traffic data stored in RMS is adjustedannually to provide current year traffic estimates for all roadway segments.

3 - 15
Base year traffic data for each roadway segment is also displayed.
NJDOT makes ADT data available on an electronic bulletin board.
Single Agency Data Collection: DVRPC*s role as the predominant traffic datacollection agency has evolved over time. The Penn-Jersey Transportation Studyin 1959 was the predecessor of DVRPC. They did an origin-destination (O-D)study and traffic counts. DVRPC was created in 1965. The data collectionprogram gradually expanded on a project by project basis in order to meetinternal DVRPC needs. DVRPC gradually developed their traffic data collectioncapability, and gradually took over the PENNDOT data collection program in thePhiladelphia area. They have done HPMS for PENNDOT since the start ofHPMS.
They also do project specific counts for PENNDOT District 6. Note that all datathat goes to the Districts also goes back to PENNDOT in Harrisburg, and viceversa.
DVRPC has collected data for the City of Philadelphia for the last 5-6 years. The City eliminated their program since it was too costly to maintain one in theirStreets Department. Apparently their were no economies of scale, and the Citycould not justify an independent program.
The Pennsylvania counties have not had count programs in recent memory. Thelocal jurisdictions in New Jersey are focused on projects and have no permanentprograms.
3.1.3.2 Use Of ATMS/Traffic Management Center Data For Planning - Thereare no operational ITS/ATMSs in the DVRPC region at present.
NJDOT is just getting into the use of ITS /ATMS in the Philadelphia area (Route70 for example), but no “operating “data is to be saved for “planning” purposes. In a related vein, NJDOT seems to be moving toward permanent counters anduse of telemetry for data collection wherever possible. Permanent counters arefelt to be more reliable, and safer than having crews manually place portablecounting equipment.
PENNDOT noted that the “TIMS”, the planned Traffic Management Center forthe Philadelphia area located at St., David*s, is supposed to provide “planning “data to PENNDOT Headquarters. However, it was noted that this would nothappen unless it was vigorously pursued by Headquarters.

3 - 16
3.1.3.3 Data Use - Input to Air Quality Models: DVRPC conducts air qualityplanning in a complex institutional environment. The non-attainment areacovers four states and contains all or part of four MPOs. DVRPC is the onlyMPO with in-house staff capable of completing the technical steps to determineconformity of the Plan and TIP. The other MPOs rely on their respective stateDOTs to conduct the analyses to determine air quality conformity. To determine the VMT for the region as required by the Clean Air ActAmendments of 1990 (CAAA), DVRPC has derived two sets of VMT figuresusing two methodologies: the travel simulation model and the enhanced HPMSmethod. The latter consists of the HPMS records supplemented by a number ofcounts collected at other locations in order to : 1) enlarge the sample size, and2) have a more balanced representation of roads in rural and urban areas and atall functional classification levels, including the local system.
EPA requires that estimates of VMT for past years be based on HighwayPerformance Monitoring System (HPMS) sample traffic counts and/or regionaltravel simulation models. However, these methods of estimating VMT havedisadvantages; HPMS does not monitor travel characteristics on local roads, andtravel simulation models traditionally include only a small portion of the localroads and collectors. Therefore DVRPC developed a third method to estimateVMT. This enhanced method involved a new round of traffic counts taken byDVRPC, which included a randomly selected panel of roads in the DelawareValley Region. This method followed the FHWA HPMS field manual guidelines. The sample panel included the current HPMS stations as well as countlocations on local roads and collectors. The sample size was compared to thestates* existing HPMS samples and additional locations were selected tosupplement these existing samples.
Mobile source emissions are calculated on simulated hourly VMT and speeddata from the computerized highway assignments. Hourly link level emissions,reflective of the appropriate set of MOBILE5a emissions factors are calculatedand aggregated to daily totals by state and for the region.
VMT that is projected to occur on local streets not included in the regionalnetwork is estimated independently from traffic assignments. Prior to calculatingemissions, off-network VMT is apportioned by hour to 5-km grid cells by theemissions calculator program. Hourly simulated travel speeds on local streetsincluded are used as a proxy for speeds on the excluded local streets whencalculating emissions. These hourly off-network gridded emissions are thensummed to daily totals by state and for the region and are included in thevehicular travel and emission tables.
As indicated above, NJDOT does the air quality analysis for the two counties ofthe Philadelphia nonattainment area that are not part of the DVRPC region.

3 - 17
NJDOT uses a travel demand model to estimate VMT required as input to theirair quality models. They “reconcile” volumes to match HPMS for future forecast,i.e., adjust models to make the model forecast match forecast HPMS volumes.They do not try to match historical numbers. They had to develop extra counts(1000/yr.) to get good county level estimates. They have completed the first yearof a 3 year cycle under this program.
PENNDOT does not do any VMT estimates for air quality analysis purposes forthe Philadelphia area.
Input to HPMS: All HPMS data collection for the Pennsylvania portion of theregion is done by DVRPC, and the data is input directly to the PENNDOTcomputer system.
In New Jersey, NJDOT*s consultants only do the traffic volume counts forHPMS. DVRPC also does local road counts for VMT estimates.
Support of CMS: The Philadelphia area CMS is still in the planning stage. Nodata has been collected yet, but they have identified corridors and datacollection needs. DVRPC is in the process of identifying additional counts thatwill be required to support the CMS.
NJDOT is doing a network based CMS for the State. Their effort is further alongthan that of DVRPC. The New Jersey CMS is based on available data, and isbaseline only at this point. “Delay” is the preferred measure although with theavailable data they can use other measures , e.g., LOS, V/C ratio, and traveltime. The New Jersey CMS was developed in conjunction with DVRPC for thefour New Jersey counties of the DVRPC region.
3.1.3.4 How Various Data Needs Fit Together In The Context Of The OverallData Collection Effort - At DVRPC there is no formal mechanism forcoordinating data collection, but it is checked informally - to avoid duplication ofefforts for different clients. They check their current count data, and wheneverpossible try to update counts at the same count locations. They now have theirtraffic database, location maps, and flow maps (for specific corridors only) on aGIS and are working on using their MIS to prioritize projects for the TIP.
The ISTEA had mandated six new management systems by 1995. Each ofthese would depend on data from a Traffic Monitoring System (TMS/H) beingdefined by each state. At the state level TMS/H was to provide a coordinatedand systematic process for the collection, analysis, summary, and retention ofhighway traffic data and characteristics. TMS/H was to support ISTEA

3 - 18
management systems at all levels, national monitoring programs, and internalstate DOT data requirements.
NJDOT has not made a final decision on implementation of the now optionalmanagement systems. However, it was felt that their TMS/H would beimplemented as described in their plan.
At PENNDOT all ISTEA management systems are in place now. The formerISTEA mandate was a driving force in the implementation of the managementsystems.
3.1.3.5 Funding Sources/Mechanisms - The two State DOTs, FHWA, FTA andmember counties are the source of DVRPC funds (90 to 95% of the funds areState and federal).
DVRPC*s Office of Travel Monitoring is funded by DVRPC, but also getsoutside projects/contracts, e.g. the City of Philadelphia, and PENNDOT District6. Roughly 40% of their funding comes from these “outside contracts”. Theyalso do “bill” other departments within DVRPC for certain special studies.
All of NJDOT*s data collection money is federal STP (Surface TransportationProgram), and SPR (State Planning and Research) funds. This also pays forthe consultant contracts. Their budget is fixed for the fiscal year with anallowance for special project counts. They do “bill” projects for design relatedcounts, if the project can afford it.
The funding source for the PENNDOT*s data collection program is all federalSPR, and PL (Metropolitan Planning) funds. There is no internal transfer offunds to the data collection group.
3.1.3.6 The Participants** View of Their Program**s Strengths and Weaknesses - The participants also provided an indication of what they feltwere the strongest and weakest points of their respective programs, or what theyfelt that they did best and what they would do differently to improve theirprograms.
DVRPC - Making data useful and available to users is the major challenge.Getting all data into a useable database/GIS is their major accomplishment.Transforming the raw data into a comprehensive database is the mostdemanding part of the process and will be completed in 1997.

3 - 19
The rapidly changing technology in hardware and software requires funds forcomputer equipment and processing. Inadequate funding in this arena wasseen as a major weakness in DVRPC*s current program.
PENNDOT - The development of their database management system, RMS(Roadway Management System), is viewed as their major accomplishment.
At PENNDOT, lack of in-house staff knowledge related to application of the TMG and statistics, inadequate coverage in the state count program, and the lack ofan experienced, permanent in house staff for data collection were viewed as themajor flaws in the program.
NJDOT - They viewed their strong point as their contracting process whichutilizes performance based “services contracts” that are awarded on merit, notlowest bid.
Developing reliable truck numbers has been NJDOT*s greatest problem, dueprimarily to problems with AVC equipment.
3.1.4 Further Information
Mr. John L. Burger, Senior Traffic AnalystDelaware Valley Regional Planning CommissionThe Bourse Building111 South Independence Mall EastPhiladelphia, PA 19106-2515
Telephone: (215)-592-1800
Mr. George W. KuziwManager, Bureau of Transportation Data DevelopmentNew Jersey Department of Transportation1035 Parkway Avenue CN600Trenton, NJ 08625-0600
Telephone: (609)-530-3522

3 - 20
Mr. Joseph McGinnes, Division ManagerTransportation Performance Monitoring Division Bureau of Planning and ResearchPennsylvania Department of Transportation6th Floor555 Walnut StreetHarrisburg, PA 17101-1900
Telephone: (717)-787-3200

3 - 21
3.2. TAMPA - ST. PETERSBURG - CLEARWATER CASE STUDY
3.2.1 Introduction To The Case Study Area
The Tampa - St. Petersburg - Clearwater area has a population of 1,756,000, aland area of 650 square miles, and a roadway system of 7,406 miles.
This case study is based on information gathered during meetings held during asite visit made to Tampa (11/12/96 - 11/13/96), and Clearwater, FL (11/14/96). Meetings were held with staff of the Florida Department of Transportation - District 7, Hillsborough County Florida - Traffic Engineering Department,Hillsborough County Metropolitan Planning Organization, Pinellas CountyMetropolitan Planning Organization, and City of Clearwater - Traffic EngineeringDepartment in order to learn more about traffic data collection and use in theTampa - St. Petersburg - Clearwater area. This information was supplementedby documentation supplied by the participating agencies, and informationprovided through the telephone interviews conducted under the first phase ofthis project. All jurisdictions involved in traffic data collection within the regionwere not contacted as part of this study.
The five counties comprising Florida Department of Transportation (FDOT) -District Seven are shown in Figure 3.4. The Tampa - St. Petersburg -Clearwater urbanized area covers Hillsborough, Pinellas, and parts of PascoCounties. The City of Tampa is located in Hillsborough County, while PinellasCounty contains the Cities of St. Petersburg and Clearwater.
FDOT is decentralized in accordance with legislative mandates. The CentralOffice in Tallahassee is responsible for policy, procedure and quality assurance. The Districts are responsible for construction and maintenance of roads andbridges, thus allowing local governments and planning organizations direct inputinto agency operations. Each District is managed by a District Secretary. Whilethe districts vary in organizational structure, each in general has major divisionsfor Administration, Planning, Production and Operations.
One unusual feature of the area is that there are three MPOs in the urbanizedarea, one for each county. The MPOs have set up several coordinatingmechanisms both at a policy level and a technical level The coordinatingmechanisms are designed to ensure ongoing communication and coordination inthe planning and project development process for the MPOs. In addition,Pinellas and Hillsborough Counties are part of the same air shed. Consequently, coordination of planning activities is necessary in order tocomprehensively address the air quality issues and other transportation mattersof regional concern.

3 - 22
The reason for multiple MPOs is due to the difference in the nature of theindividual counties. For example, Hillsborough County is urban with rural openspace and a great deal of new development. Pinellas County is almost totallyurbanized, with very limited existing rural and agricultural uses. Theseconditions imply different agenda regarding land use, transportation, etc., andhave led to a preference for keeping “planning” decision making at the lowestlocal level possible.
Another unusual feature underlying transportation planning in the area and theState of Florida as a whole is the concept of “concurrency”. Florida is a leader ingrowth management legislation. One of the major features of the growthmanagement legislation is “concurrency”. In concept, concurrency means thatdevelopment cannot occur unless the infrastructure exists to support thedevelopment.
The 1985 Growth Management Act requires local governments to adoptminimum level of service (LOS) standards for public facilities identified in theAct. The adopted level of service standards are incorporated into localgovernment Concurrency Management Systems to ensure that local roadwayfacilities needed to accommodate new growth are available concurrent with theimpacts of such growth. Thus, a roadway level of service can be decisive indetermining under what conditions a development is allowed to proceed underthe growth management law.
An important aspect of Florida*s growth management legislation is the link withCongestion Management Systems (CMSs). Concurrency and CMSs haveseveral important elements in common, such as performance standards, on-going data collection and system monitoring, and linkage to implementationstrategies. The data that local governments are required to collect to meetFlorida*s comprehensive planning requirement have generally formed the basisfor developing the CMS at the metropolitan level, without requiring localgovernments or MPOs to collect additional information.
3.2.2 Data Collection Program
3.2.2.1 Introduction - Traffic data collection in the Tampa region takes placewithin the context of a complex institutional environment. The programdescriptions below do not cover all programs but do cover the programs of themajor players in the area and those which are somewhat out of the ordinary. Available project resources did not allow for a comprehensive inventory of theprograms of all jurisdictions.
FIGURE 3.4 - FDOT DISTRICT SEVEN


3 - 23
While the Tampa urbanized area includes Pasco, Pinellas and Hillsboroughcounties, this study concentrated on programs in the later two counties whichcontain the largest cities in the region. In addition FDOT District Sevenincludes Citrus and Hernando counties. These are primarily rural and are notincluded in the urban area.
The Pinellas County MPO and Hillsborough County Traffic EngineeringDepartment provided data on their programs as part of this project*s initialphone interviews. FDOT District 7, the Hillsborough County MPO, HillsboroughCounty Traffic Engineering Department, Pinellas County MPO, and City ofClearwater were involved in the site visit. The information on the City of Tampaand Plant City programs was taken from documentation obtained during the sitevisit meetings.
In addition to the programs outlined below, traffic count data is collected by thePinellas County Public Works Department, and the Cities of Dunedin, Gulfport,Pinellas Park and St. Petersburg in Pinellas County, Temple Terrace inHillsborough County and the Pasco County Traffic Engineering Department.
3.2.2.2 Type of Program - Pinellas County MPO - Since 1991, the MPO hasbeen developing and updating its Highway Inventory System Database whichcontinues to be a primary source of information for its transportation planningefforts. About 550 counts/year go into their database. About 30% of these aredone by the MPO, 30% by FDOT, and 40% by the locals jurisdictions. All sharethe data. There are no duplicate counts. The MPO designed their program tofill in the gaps of the local and state programs. The MPO does about 175counts/year. These are 48 hour portable counts. In addition to this permanentprogram the MPO conducts mechanical counts on an as needed basis. A fewvehicle classification counts and speed studies are also conducted each year asneeded.
They feel they have good quality control on the count data. Adjustment factorscome from FDOT, but the MPO is trying to develop their own factors becausethey feel that FDOT*s are not representative due to the seasonal peakingcharacteristics of the County*s beach facilities. The MPO has data going back to1989, since they need historical data to do trend analysis.
One product of their data base is their annual flow map “Average Annual DailyTraffic Counts in Pinellas County”. They could produce the flow map from theirGIS, but given the large demand for the maps, its more economical to print themby conventional means.
The MPO also provides coordination and consistency review between local

3 - 24
government plans. To assist in this effort, the MPO prepares an annual roadwayLevel of Service Report. The Report provides a comprehensive analysis ofroadway operating levels of services, based on traffic volumes, signalization,scheduled improvements, projected traffic growth, etc. This information provides a standardized base of information that is made available to local communitiesfor use in state mandated growth management/concurrency plans, and for otherlocal transportation planning requirements. A sample output from this report isshown in Table 3.4, giving some indication of the variety of data available in theHighway Inventory System Database.
Hillsborough County - The County currently has 61 permanent count stationsand anticipates expanding this number to 85 within the next six months. Thesecount stations also collect data necessary for classification and speed counts.These are polled by telemetry. The Traffic Engineering Department hascontracted with Diamond Traffic Products to write software and a proceduresmanual that will enable the processing, downloading, and reporting ofpermanent count station information. Data collected from permanent countstations are downloaded each night and compiled into monthly files. The 12monthly files are then combined into a yearly file.
The County also implemented an extensive traffic control system. In addition tosignal detection loops, 21 signalized locations have system loops from whichtraffic volume data can be collected. These system loops have been inoperation for up to three years. However, data from the system, loops have notbeen integrated with the traffic count program. An additional 109 locations willbe added to the traffic control system by December 1996. They also have avideo surveillance system for incident management.
Data is also collected using portable counters at 288 stations on a 3 year cycle. All data is collected for a duration of 24 hours. In addition to this permanentprogram the County conducts additional manual counts (primarily turningmovement counts), and mechanical counts for signal timing and warrants on anas needed basis.
FDOT District Seven - The District Seven office of FDOT is responsible forperforming traffic counts on all state roads within the District. District Sevencollects data at about 1000 count locations. Three quarters of these are doneyearly. One fourth of all District counts are done quarterly and are classificationcounts. About 45% of the remaining 3/4 are also classification counts. All oftheir counts are 48 hour duration. The location of the count sites was bothplanned and based on historical sites. Segment breaks are selected basedprimarily on relatively significant changes in volumes. The volumes arereviewed annually to identify the need for new segmentation. A section iscomprised of numerous segments that are identified with beginning and endingmileposts along the section.
3 - 25
Almost all counts are done with road tubes. They have some sites withpermanent loops, but these don*t work. The loops were installed, but no moneywas set aside for operations/maintenance. In some cases the data collectiongroup wasn*t told where the loops were located.
The District supplies “raw data” to the Central Office, who applies the variousadjustment factors.
The Department also collects traffic count data on state roads using permanenttraffic counters. The several permanent count stations in the District providehistorical traffic volume information, and are used to adjust for seasonal trafficpatterns. The Central Office gets data via telemetry from these 12 permanentcontinuous count sites in the District. One issue is the inaccessibility of thepermanent count station data. All data is transferred electronically to the CentralOffice in Tallahassee, resulting in little or no control over the data at the Districtoffice. However, arrangements can be made to access the data by modem.
It should also be noted that a large amount of data is also collected at thecorridor level from Project Development and Environment (PD&E) and trafficoperations studies sponsored by the Department.
The District does not collect speed data, occupancy data , or WIM data. WIM isdone by the Central Office.
Historical traffic count data are available on disk for the years 1993 through1995. Data prior to 1993 are available only in hard copy. “SPS” software(developed by a consultant) is used to screen the data. All traffic data is inreport format. They have a GIS, but don*t use it. A lot of data “cleanup” isneeded before a GIS based system will become a reality.
City of Tampa - The Public Works Department, Traffic Operations performs 86124 hour traffic counts for concurrency management purposes. The City alsoperforms traffic counts on roads within city limits that are part of the StateHighway System. It is their opinion that the traffic counts performed by FDOTcannot be used for concurrency management purposes because the countstations are too far apart. Tampa also collects traffic turning movement counts atall 500+ of its signalized intersections annually. Counts are collected for 15hours each weekday on a rotating basis. In addition, special studies areconducted that may require signal warrants and turning movement counts. These are performed on an as needed basis. These special studies aremaintained in both hard copy and electronic form. Special counts are alsoperformed at the request of citizens, but are handled separately from thestandard counts.
The Public Works Department, Traffic Planning Office, manually enters the raw

3 - 26
counts provided in hard copy reports into a Microsoft Excel spreadsheet. Thespreadsheet is designed to estimate AADT using seasonal adjustment factors. The actual count is used regardless of when it is collected; no counts fromprevious years are inflated to the current year. Old count data are alwaysreplaced and are not saved or archived electronically. However, historical hardcopy records are maintained. The City has maintained AADT traffic counts since1990 in a spreadsheet and hard copy tabular listing. Hard copy files of trafficcounts also are available back to 1989. Table 3.5 provides an example of thecity*s traffic data spreadsheet.
Plant City - Plant City performs traffic counts in response to requests from theMPO and special requests from citizens. An estimated 5 to 10 counts areperformed every couple of weeks for the MPO on approximately 30 segments. The counts performed for the MPO are 48 hour, 15-minute increment counts. Atraffic signalization system is in place that has the capability to performcontinuous counts at 27 intersections in Plant City. Sensory and system loopsare in each lane at these locations. The system automatically generates a reportthat is provided to the MPO. This system is separate from the County TrafficSignal Control System.
3.2.2.3 Data Collection Equipment - The Pinellas County MPO has 24 trafficvolume counters for use in the area. In addition, they have eight classificationcounters which also can collect speed data. All count stations are utilized withportable equipment.
Hillsborough County has 107 traffic volume counters. These are used at 85count stations have that have permanently installed loops, and another 288stations that utilize road tubes. In addition, 16 counters are used for specialstudy programs.
3.2.2.4 Data Collection Staff Levels - The Pinellas County MPO relies onpermanent in house staff for data collection. The following are full timeequivalents: 1 administrative; and 2 field.
Hillsborough County has 2 permanent in house field staff involved in datacollection, plus an additional .5 permanent in house staff in administration and .5permanent in house staff in data processing/editing.

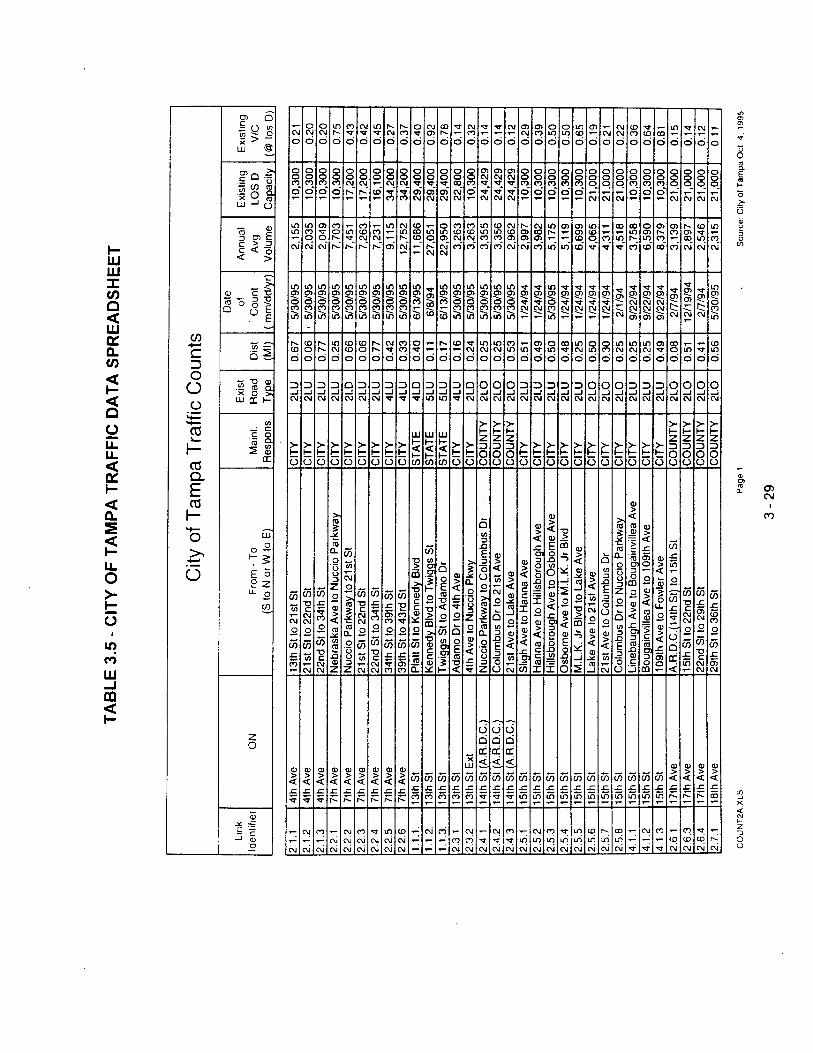

3 - 29
3.2.2.5 Data Use - The reasons why each type of agency within the urban areacollected the kind of data that they did are indicated below.
The Pinellas County MPO collects traffic count data for the following purposes:
CMS programs;local transportation planning;regional transportation planning models;corridor planning;major investment studies; andongoing systems monitoring.
Hillsborough County collects traffic count data for local traffic planning.
3.2.2.6 Data Flows Within the Urban Area - Each individual interviewed wasasked if their agency shared or pooled data with other agencies within the urbanarea. They were also asked if the data were provided informally or formally.
Informal exchange means that it was done as needed, on a case by case basis,e.g. an individual in one agency calling an individual in another to see if theyhad any recent data on a certain intersection or road segment. Formalexchange involves the transfer of a comprehensive data set on a regular orroutine basis, e.g. each year, an agency provides other agencies within the areawith a copy of all the traffic data it collected during the past year.
The Pinellas County MPO provides traffic count data to the Florida DOT and thecounty and cities on a informal basis. They also obtain traffic count data fromthe cities, county, and Florida DOT on an “informal” basis. The agency has noproblems with the current data sharing arrangements.
Hillsborough County provides traffic count data to the MPO on a informal basis.They also obtain traffic count data from the Florida DOT on an “informal” basis.The agency has no problems with the current data sharing arrangements.
FDOT noted that all data flow to/from other agencies is informal.
3.2.3 Issue Areas
The traffic monitoring program in the Tampa - St. Petersburg - Clearwater areashould be of interest because of the degree of interagency cooperation andcoordination that has been achieved in a complex institutional environment; theuse of ATMS/Traffic Management Center data for planning purposes; and the ongoing development of common transportation data bases. These are discussedmore fully below.

3 - 30
3.2.3.1 Institutional Arrangements - Inter Agency Coordination/Cooperation: In the Tampa - St. Petersburg - Clearwater region, inter agencycoordination/ cooperation has been achieved at two levels; at the regional levelbetween multiple MPOs; and also within the individual MPOs representing thecounties in the region.
The FDOT District Seven MPOs meet on a regular basis in order to ensureregional coordination in transportation planning and related issues. Examplesinclude their participation in the Coordinated Urban TransportationStudy(CUTS), the Regional Air Quality Task Force, the Joint Citizens AdvisoryCommittee, regional planning studies, such as the Regional Goods MovementStudy, and the Tampa Bay Commuter Rail Authority Plan. Policy level regionalcoordination is accomplished through the Chairman*s Coordinating Committee,which meets on a quarterly basis and includes the chairman of the four MPOs inthe area, as well as the FDOT District Secretary, and a representative of theTampa Bay regional Planning Council. MPO staff also participate in FDOT*sRegional Transportation Analysis (RTA). In addition, the MPOs and FDOT arecoordinating the development of a fully operational regional congestionmanagement system that functions as a component of the individual MPOCMSs.
As an example of “intra-MPO” coordination, the Pinellas County MPO providescoordination and consistency review between local government plans. To assistin this effort, the MPO prepares an annual roadway Level of Service Report. The Report provides a comprehensive analysis of roadway operating levels ofservices, based on traffic volumes, signalization, scheduled improvements,projected traffic growth, etc. This information provides a standardized base ofinformation that is made available to local communities for use in statemandated growth management/concurrency plans, and for other localtransportation planning requirements. This report is based on data on theMPO*s Highway Inventory System Database. This database is the result ofcoordinated data collection, and a cooperative data sharing arrangement on thepart of all agencies collecting traffic data in the county.
3.2.3.2 Use Of ATMS/Traffic Management Center Data For Planning - Thereare no State ITS initiatives in the area, but both Hillsborough County and variousjurisdictions in Pinellas County are heavily involved in the use of ITS typesystems.
In Pinellas County, the signal system in the entire county is under computercontrol. The system is divided into three pieces, the City of Clearwater, the Cityof St. Petersburg, and the rest of Pinellas County, but the pieces arecoordinated. The same system is used in the County and St. Petersburg as in
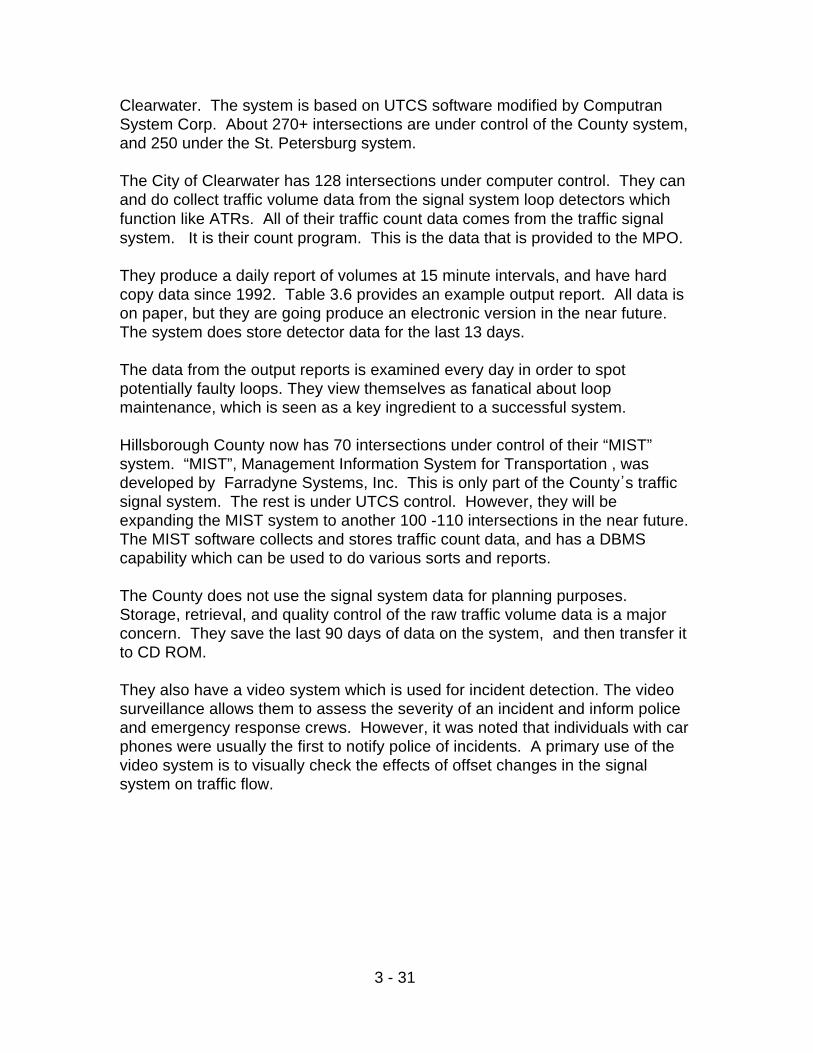
3 - 31
Clearwater. The system is based on UTCS software modified by ComputranSystem Corp. About 270+ intersections are under control of the County system, and 250 under the St. Petersburg system.
The City of Clearwater has 128 intersections under computer control. They canand do collect traffic volume data from the signal system loop detectors whichfunction like ATRs. All of their traffic count data comes from the traffic signalsystem. It is their count program. This is the data that is provided to the MPO.
They produce a daily report of volumes at 15 minute intervals, and have hardcopy data since 1992. Table 3.6 provides an example output report. All data ison paper, but they are going produce an electronic version in the near future.The system does store detector data for the last 13 days.
The data from the output reports is examined every day in order to spotpotentially faulty loops. They view themselves as fanatical about loopmaintenance, which is seen as a key ingredient to a successful system.
Hillsborough County now has 70 intersections under control of their “MIST”system. “MIST”, Management Information System for Transportation , wasdeveloped by Farradyne Systems, Inc. This is only part of the County*s trafficsignal system. The rest is under UTCS control. However, they will beexpanding the MIST system to another 100 -110 intersections in the near future. The MIST software collects and stores traffic count data, and has a DBMScapability which can be used to do various sorts and reports.
The County does not use the signal system data for planning purposes. Storage, retrieval, and quality control of the raw traffic volume data is a majorconcern. They save the last 90 days of data on the system, and then transfer itto CD ROM.
They also have a video system which is used for incident detection. The videosurveillance allows them to assess the severity of an incident and inform policeand emergency response crews. However, it was noted that individuals with carphones were usually the first to notify police of incidents. A primary use of thevideo system is to visually check the effects of offset changes in the signalsystem on traffic flow.

3 - 33
3.2.3.3 Data Use - Input to Air Quality Models: In Hillsborough County, because of concurrency the jurisdictions are collecting the traffic volume datarequired to support the MPO*s air quality analyses.
Likewise, in Pinellas County the MPO does the conformity analysis. Theavailable traffic count data is sufficient for their purposes, and they did not haveto request additional counts.
Input to HPMS: FDOT District Seven has primary responsibility for compilingthe Highway Performance Monitoring System (HPMS) data. HPMS data isreported to the federal government on a segment basis. The reported dataincludes a wide variety of items such as traffic volumes, pavement condition,functional classification, geometry and other basic information.
Physical characteristics data such as lane width, number of lanes, type ofshoulders, etc. comes from FDOT*s Roadway Characteristics Inventory (RCI)file. Traffic volumes on state maintained roads come from the latest availablestate counts. Traffic volumes on other roads are provided by the local agencies. No additional data collection efforts were required in order to support the HPMSsubmittal.
Support of CMS: FDOT noted that CMS will happen in the MPOs, regardless ofchanging federal requirements, since a CMS - like requirement is part of statelegislation.
In Pinellas County, because of concurrency and data needed to support theLong Range Plan, the traffic data currently collected is adequate to support theCMS. In addition to the highway system data, the MPO*s database includestransit routes, bicycle and pedestrian facilities, intermodal facilities, etc. Whileadditional data may be needed in the future to meet CMS requirements, thePinellas County MPO has an adequate database and monitoring system to meetthe current requirements. However, one data requirement, vehicle occupancy, isnot being addressed at this time. In the upcoming year such data will becollected on a limited basis. However, they anticipate that funding may be amajor problem in collecting all the data needed.
The Hillsborough County MPO will serve as the “CMS Clearinghouse” using itsGeographic Information System (GIS) database. The database currently storesroadway and transit operating characteristics, such as existing traffic volumesreported by state and local agencies, number of lanes, signals per mile,functional classification, transit route locations, headways, etc. A variety of

3 - 34
geometric and operational data are stored to aid in level of service analysis.
The MPO has established a link between its forecasting software (FSUTMS) andits Geographic Information System(GIS). The output from the MPO*s traveldemand forecasting model is uploaded into the GIS, which can then displayroadway or transit level of service characteristics. This information can be usedto monitor existing and future congestion levels in the context of land use,transportation facilities and accident locations.
Data used for the travel demand forecasting model and database are provided tothe MPO from FDOT and the MPO*s member jurisdictions. In HillsboroughCounty, because of concurrency, the jurisdictions are generally collecting therequired data, but this is “hit or miss” by jurisdiction.
Local Agency Needs: The 1985 Growth Management Act requires localgovernments to maintain Concurrency Management Systems to ensure that localroadway facilities needed to accommodate new growth are available concurrentwith the impacts of such growth. Thus, the data that local agencies are requiredto collect to meet Florida*s comprehensive planning requirement have generallyproved sufficient to meet most other local transportation planning datarequirements, without requiring local governments or MPOs to collect additionalinformation.
3.2.3.4 How Various Data Needs Fit Together In The Context Of The OverallData Collection Effort - Because of “Concurrency” most jurisdictions collect anadequate quantity of traffic data to meet their own needs, plus those imposed bythe need to provide input to air quality analyses, and such ISTEA requirementsas Congestion Management Systems. The real issues in the Tampa area haverevolved around the questions of data quality and compatibility, and makingdata available to all agencies in a common format
In Pinellas County, the MPO has developed and maintains its HighwayInventory System Database. The database includes data on other transportationfacilities such as transit routes, bicycle facilities, and sidewalks. Currently, alljurisdictions provide data to the MPO who enters it into the database. However,the database is currently not accessible by the jurisdictions, and they mustrequest various reports from the MPO.
The Florida Department of Transportation Maintains their RoadwayCharacteristics Inventory (RCI). The RCI covers physical characteristics of lanewidth, number of lanes, shoulders and intersection data. The RCI also containsinformation on the number of traffic signals per mile, and is used for a variety ofpurposes, including level of service analysis.

3 - 35
District Seven is currently conducting a traffic and roadway data collectionsurvey of cities and counties in the District. The purpose of this effort is toencourage the sharing of traffic and roadway data, eliminate duplication ofcollection efforts, and provide participants with additional data which would nototherwise be available. They view the survey as a “feasibility study” todetermine and define current data collection programs at all levels in the Districtand data collection needs. They feel that there is a need for compatible data ina district-wide, network database, and also a need to have assured funding fordatabase development, and for the hardware, software, and communicationsnecessary to support access by all jurisdictions.
The Hillsborough County MPO has a consultant building a database similar tothe one in Pinellas County. Their project is farther along than FDOT*s, butbehind Pinellas County who already has a common database in place. Theyhope to have an analysis capability by March/April 97. When completed, thisproject will put all data in a common database and will be accessible to alljurisdictions.
The County-Wide Data Collection and Analysis project was conceived toidentify, collect, manage, and analyze data required by Federal(ISTEA) andState regulations. The focus on traffic counts in this project was intended tomove towards the compatibility and transfer of traffic count data and informationamong agencies performing traffic counts, including FDOT District Seven,Hillsborough County, City of Tampa, and Plant City.
The Transportation Inventory Management and Analysis System (TIMAS) willallow the user to maintain an inventory of transportation facilities in thecommunity and provide a mechanism for analyzing past, current, and futureconditions of the transportation system. The foundation on which TIMAS isbased is a relational database of transportation facility characteristics. Thedatabase will include four types of data, including: 97 standard transportationdata attributes; 9 database look-up tables; 43 FDOT-requested, linearlyreferenced data attributes for selected non-state roads; and 23 other attributesidentified for Congestion Management, the Transportation Plan, and otherspecific data requirements of the MPO.
3.2.3.5 Funding Sources/Mechanisms - In District 7 all data collection for theDistrict is done by consultants, while processing and analysis is done in house.Most of the budget of $500 to $750k goes to consultants. Funding for datacollection was a budget line item. All districts in the state are organized andoperate differently.
For the Pinellas County MPO funding for data collection is a line item in the
3 - 36
budget. About 80% of the funds are Federal/State PL (Planning), or Section 8funds, with some State “D” funds.
STP money is the funding source for the Hillsborough County MPO.
3.2.3.6 The Participants** View of Their Program**s Strengths and Weaknesses - The agencies also provided an indication of what they felt werethe strongest and weakest points of their respective programs, or what they feltthat they did best and what they would do differently to improve their programs.
FDOT District Seven - The data integrity of the existing data in their RCI; theirrecently started quarterly count program; and a good historical database wereviewed as their program*s strong points.
The need for cross training of staff, and better in house expertise; an overdependence on consultants; the lack of maintenance of loop detectors; and thelack of permanent count stations in locations needed to meet current data needswere seen as the program*s weak points.
Hillsborough County MPO - They considered building the relationship betweenthe MPO and the jurisdictions; and their current efforts at developing a system ofcompatible data with good quality control for use by the MPO and jurisdictions asthe best features of their program.
The fact that the current program suffers from little quality control and incompatible data formats was seen as the weakest feature.
Pinellas County MPO - They viewed their cooperative arrangement with thejurisdictions, that is having achieved “buy in” to a common data base by thejurisdictions, as the best feature of their program. This success is based on a continuity of personnel, good communication, and mutual respect.
The weakest part of the program was seen as their getting required data fromFDOT in a timely fashion. Specifically it was felt that FDOT*s data collectionand reporting schedule barely met the deadlines required for input to theconcurrency management and TIP preparation processes. As an example, thelocal governments may need the MPO*s Annual LOS Report to meet variouslocal schedules at times which are incompatible with the state*s schedule forfinalizing data collection. Attempts are being made to resolve these schedulingissues.

3 - 37
3.2.4 Further Information
Mr. Charles Gray, Statistics AdministratorPlanning and Programs M.S. 7340Florida Department of Transportation - District Seven11201 North McKinley DriveTampa, FL 33612
Telephone: (813) 975-6439
Mr. Joe ZambitoSenior Planning ManagerHillsborough County Metropolitan Planning Organization601 E. Kennedy BoulevardTampa, FL 33602
Telephone: (813) 272-5940
Ms. Gina Goodwin, Transportation PlannerDepartment of PlanningPinellas County Metropolitan Planning Organization14 S. Ft. Harrison AvenueClearwater, FL 34616
Telephone: (813) 464-4751

3 - 38
3.3 MINNEAPOLIS - ST. PAUL CASE STUDY
3.3.1 Introduction To The Case Study Area
The Minneapolis area has a population of 2,228,000, a land area of 1,192square miles, and 10,301 mile roadway system. It is a Moderate nonattainmentarea for CO. The State DOT, and both city and county level agencies havepermanent traffic data collection programs. The MPO, Metropolitan Council,Twin Cities Area, does no data collection.
This case study is based on information gathered during meetings held during asite visit made to St. Paul (11/18/96), and Minneapolis (11/19/96). Meetingswere held with staff of the Minnesota Department of Transportation (MNDOT),Metropolitan Council of the Twin Cities (the region*s MPO), and the MinnesotaDepartment of Transportation, Traffic Management Center in order to learn moreabout traffic data collection and use in the Minneapolis - St. Paul area. Thisinformation was supplemented by documentation supplied by the participatingagencies, and information provided through the telephone interviews conductedunder the first phase of this project. All jurisdictions involved in traffic datacollection within the region were not contacted as part of this study.
The seven county metropolitan area is shown in Figure 3.5.
The Minnesota constitution sets aside a percentage of the revenue from gastaxes and motor vehicle registration fees for local road programs. Funding isallocated according to formulas established by law and administered by MNDOTin partnership with the cities and counties. One basis of this allocation is trafficdata reported to MNDOT by the jurisdictions. The funds are distributed to theindividual cities and counties for use on eligible projects on municipal state aidstreets and county state aid highways.
3.3.2 Data Collection Program
3.3.2.1 Introduction - The seven county cooperative counting program is thehallmark of the Minneapolis-St. Paul area*s traffic data collection program. TheMinnesota Department of Transportation, working with the Traffic ManagementCenter and District Traffic Engineers in the Metro District have established acooperative counting program with the metropolitan counties and municipalities. This cooperative program was undertaken for efficiency, convenience and toprevent duplication of vehicle counts. Special counts are also taken as the need

3 - 40
is identified. This work provides a data base for identifying trends, andevaluating system performance.
In addition to the State DOT, both city and county level agencies havepermanent data collection programs. There are about 187 communities in thearea, about half of which collect traffic count data. The program descriptionsbelow do not cover all programs. The programs for the City of Minneapolis andRamsey County are representative of the programs in the metropolitan area. Project resources did not allow for a comprehensive inventory of the programs ofall jurisdictions.
3.3.2.2 Type of Program - MNDOT - Using traffic data collected by thedepartment, the cities and the counties, MNDOT creates “The 7 County FlowMap”. The Department also obtains data from the MNDOT TMC. The TMCmonitors about 175 miles of freeway and provides data from their operations.These data are treated like that from a continuous count station.
The seven county metropolitan area count program is a cooperative countingprogram involving MNDOT, Metropolitan District personnel, the TrafficManagement Center (which monitors and manages traffic on the metro areafreeways and major arterial highways), highway department staff from each ofthe metropolitan counties, municipal engineers, and private consultants. TheMetro counting program has been in existence since 1972. The Metro district isone of eight MNDOT districts.
Short-term counts are taken over a two year cycle at MNDOT-specified countlocations. These sites are a combination of historical locations and thoseselected at the start of the program in order to fill in the gaps. The metropolitantrunk highways and county state-aid system road counts are completed by theend of the even years, while the municipal street system counts are completedby the end of the odd years. Minneapolis, St. Paul, and some 70 other citiesprovide data. MNDOT applies seasonal, and axle adjustment factors to the rawdata. Currently these factors are specific to the Metro area.
There are 52 pages in a detailed map series comprising “The 7 County FlowMap”. These maps are now done by hand, but MNDOT is moving to a GIS in thefuture. (Outside the Metro district, most maps are produced automatically.)
MNDOT has 81 continuous counters in the area, and also collects data atanother 8,400 sites on a two year cycle (48 hr. duration). MNDOT collectsvehicle classification data in the area using 6 continuous counters, and atanother 23 stations where classification data is collected manually on a two yearcycle (16 hr. duration). MNDOT also collects truck weight data in the area at 6WIM sites.
3 - 41
Annual average daily traffic (AADT) volumes are the measure of roadway usecommonly reported by MNDOT. These data are estimates of how many vehiclesare traveling in both directions on the state*s roadway segments during anaverage, or typical, day of the year. These traffic volume data are derived fromthree kinds of traffic counting activities. The first involves continuous trafficcounting devices; the second involves short-term counting devices with roadtubes; and the third activity involves either manual or portable automatic vehicleclassification. Information from these tasks is analyzed and combined to createAADT volumes that are mapped, and distributed for use by MNDOT, county andlocal highway departments, and area planning organizations, as well as thegeneral public.
MNDOT*s continuous traffic counters are located primarily on trunk highwaysthroughout the state. Traffic volumes are retrieved from these devices once ortwice a week. The data are then edited using a PC-based expert data editingsystem to cull out bad data and check for equipment malfunctions. After thedata have been edited, they are ready to be used to create seasonal/day-of-week adjustment factors for the short-term count data.
Short-term count data are collected primarily with equipment that senses vehicleaxles and records the axle count information on portable counters located at theside of the roadway. Pneumatic road tubes are used to sense vehicle axles andthe axle data are stored on counters until traffic count personnel from the localMNDOT district offices transmit the data to the Traffic Forecasting and AnalysisSection for entry into the PC-based traffic count database. District traffic countpersonnel also can enter the data directly into the database.
After the short-term count data entered into the database, they are evaluatedagainst past AADT estimates and recounts are ordered when anomalous datavalues (due to equipment malfunctions, for example) indicate the need for arecount. The value of experience in data collection staff was noted in that therecount rate on counts taken by “inexperienced” staff was found to exceed thatof “experienced” staff.
The short-term counts are factored by a database application with day of weekand seasonal adjustment data from the continuous count program as well as withaxle corrections from the vehicle classification program to generate adjustedaverage daily traffic volumes for the roadway segments where counts have beentaken. At the end of the counting season, the short-term counts are evaluatedfor spatial and temporal coherency and placed on draft traffic volume maps. Thedraft maps are circulated to MNDOT district and/or county and municipalengineers for feedback. Final traffic volume maps are then prepared anddistributed to MNDOT*s traffic volume data users.

3 - 42
Traffic volume data are also entered into the Department*s TransportationInformation System (TIS) so that MNDOT safety analysts and pavementengineers, for example, can have access to traffic information vital to their work. The TIS data resides on a mainframe computer. It contains data on about 9000locations statewide.
MNDOT TMC - The TMC collects data (speed and lane occupancy every fiveminutes) at half mile intervals on the mainline freeways, and at everyexit/entrance ramp. They have 3000 detectors at 700 stations and 400 rampsover the freeway system. Data from only 20-30 stations are provided forplanning purposes. The TMC has 2-3 years of data stored.
Ramsey County Public Works Department - The Ramsey County Public WorksDepartment also collects data at 250 sites on a two year cycle (48 hr. duration) ,and conducts about 50 turning movement and 28 approach volume mechanicalcounts/year on an “as needed” basis. The County conducts about 25 speeddata collection studies per year on an as needed basis. These are a mix ofmechanical counts and radar.
City of Minneapolis -The City of Minneapolis, Transportation Division collectstraffic volume data at 1200 sites on a two year cycle (48 hr. duration). The Cityalso conducts about 25 classification counts /year (using mechanical counters)on an as needed basis.
Minneapolis also has started a neighborhood data collection program. This putsplanning money into hands of the neighborhood organizations, most of who hireconsultants to collect data on residential street systems that are generallyignored by most traditional data collection programs.
3.3.2.3 Data Collection Equipment - Ramsey County has 12 counters whichcollect both volume and speed data. Road tubes are used at 250 traffic volumedata collection sites and 25 speed data collection sites. They also retrieve countdata using their traffic signal system detectors.
The City of Minneapolis uses 35 counters to do volume counts. Road tubes areused at the 1200 traffic volume data collection sites.
3.3.2.4 Data Collection Staff Levels - All state counts are done by MNDOTdistrict personnel. MNDOT estimated that consultants do about 1/3 of thecounts for the local jurisdictions with the remainder done by the jurisdictions* inhouse staff.
Ramsey County has a permanent in house staff of 1.5 full time equivalents

3 - 43
working on data collection. The City of Minneapolis also relies on permanent inhouse staff for data collection. The following are full time equivalents: 1administrative; 1.5 field; and 0.1 data processing.
3.3.2.5 Data Use - The reasons why each type of agency within the urban areacollected the kind of data that they did are indicated below.
The Minnesota DOT collects traffic count data, vehicle classification data, andtruck weight data for the following purposes:
HPMS input;VMT estimates;regional transportation planning models;statewide transportation planning;corridor planning;county and municipal aid allocation;roadway design geometrics;structural pavement design;pavement management;ESAL factors;traffic and ESAL forecasting.
Ramsey County collects traffic count data and travel time/speed data for localtraffic planning, and corridor planning.
The City of Minneapolis collects traffic count data and vehicle classification datafor local traffic planning.
3.3.2.6 Data Flows Within the Urban Area - Each individual interviewed as partof the initial phase of the project was asked if their agency shared or pooled datawith other agencies within the urban area. They were also asked if the data wereprovided informally or formally.
Informal exchange means that it was done as needed, on a case by case basis,e.g. an individual in one agency calling an individual in another to see if theyhad any recent data on a certain intersection or road segment. Formalexchange involves the transfer of a comprehensive data set on a regular orroutine basis, e.g. each year, an agency provides other agencies within the areawith a copy of all the traffic data it collected during the past year.
MNDOT provides traffic count data to the MPO, counties and cities on a formalbasis. MNDOT receives data from the counties, cities and the TrafficManagement Center on a formal basis. The agency has no problems with thecurrent data sharing arrangements.
3 - 44
Ramsey County provides traffic count data to MNDOT on a formal basis, and tothe MPO and the City on an informal basis. In turn the County receives trafficcount data from MNDOT and the City on a formal basis. The agency has noproblems with the current data sharing arrangements.
The City of Minneapolis exchanges traffic count data with the State DOT and theCounty on a formal basis. The agency has no problems with the current datasharing arrangements.
3.3.3 Issue Areas
The traffic monitoring program in the Minneapolis - St. Paul area should be ofinterest because of the use of ATMS data for planning purposes; the degree ofinteragency cooperation and coordination that has been achieved; and the roleof a lead agency in defining a comprehensive data set for the region, anddividing up data collection responsibility among the jurisdictions. These arediscussed more fully below.
3.3.3.1 Institutional Arrangements - Inter Agency Coordination/Cooperation: Under the seven county cooperative counting program, traffic counting isconducted on a two year cycle by Metro district, county and municipal personnel. The purpose of the traffic monitoring and evaluation program is to provideappropriate traffic data as needed to determine annual average daily traffic ontrunk highways, county state aid highways, and municipal state aid streets toindicate travel trends and patterns. Data is also used for analysis oftransportation caused air pollution and noise.
Counts are taken on all state trunk highways, county state aid highways,municipal state aid streets, and at selected locations on city streets forestimating vehicle miles traveled. Traffic volumes representing AADT are shownon the 52 sheet series maps covering the seven-county Metropolitan Area andindividual municipal maps showing the volumes on the county and municipalstate aid system. Traffic volumes are also displayed in summary fashion on asingle metro traffic volume map.
This coordinated program is based on cooperation. The cities and counties arenot reimbursed by MNDOT for their counts, and there has not been a problem oflocal jurisdictions refusing to provide data without compensation.
Moreover, while MNDOT*s county and municipal count program is used by theState Aid Division as one of the tools for allocation of State highway funds forlocal road programs, there is no legislative mandate regarding the reporting of

3 - 45
traffic count data.
3.3.3.2 Use Of ATMS/Traffic Management Center Data For Planning - TheTraffic Management Center (TMC) is the communications and computer centerfor managing traffic on the areas freeways. The TMC currently operates nearly400 ramp meters. Ramp metering increases the number of vehicles the freewaycan carry.
MNDOT*s TMC has been in operation since 1974. The system started with 400loop detectors, and now has 3000 detectors in total. Data is collected at 175sites with loop detectors located in every lane. These are located every 1/2 mileon freeways, and at exit/entrance ramps. About 5% of the detectors are out atany given time, mostly due to scheduled highway reconstruction. The system has 400 signal controllers. Each could serve up to 24 loops, but in fact eachonly serves 7 or 8 loops.
Real time operating data is collected every 30 seconds. The data includesvolume, lane occupancy, and speed, which is calculated. At the end of eachday, the system data is processed, copied and archived. The system data isstored on hard drive and optical disk. They have data on the system fromJanuary 1994.
The traffic volume data for the metro traffic volume maps is sent electronically toMNDOT*s Traffic Analysis and Forecast Unit in “ATR” format. The data is at 5minute intervals - 24 hours/day. The data processing is done by the researchgroup of MNDOT*s Metro Division using software that was developed in house. The TMC also plots this summary data for their own internal use. Figure 3.6shows a sample freeway segment. The figures at each site indicate, indescending order, AM peak volume, PM peak volume, and 24 hour volume.
The TMC has software, which was developed in house, to screen the data andflag suspicious data (which helps detect malfunctions in the loop detectors). Theoutput of this process must be checked manually now, but the University ofMinnesota is currently working on a project to further automate this process.
Work is also underway to put their data into an “Oracle” database in order tomake it more user friendly and available for planning. This should be availablewithin 6 months to a year.
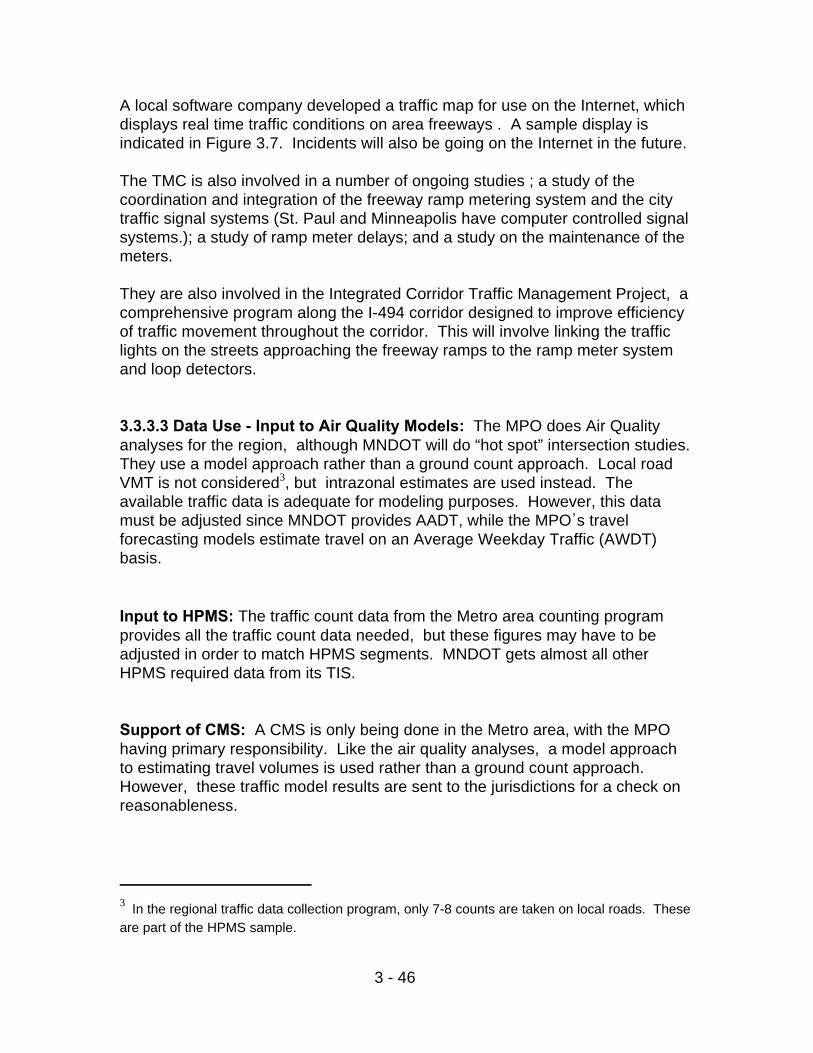
In the regional traffic data collection program, only 7-8 counts are taken on local roads. These3
are part of the HPMS sample.
3 - 46
A local software company developed a traffic map for use on the Internet, whichdisplays real time traffic conditions on area freeways . A sample display isindicated in Figure 3.7. Incidents will also be going on the Internet in the future.
The TMC is also involved in a number of ongoing studies ; a study of the coordination and integration of the freeway ramp metering system and the citytraffic signal systems (St. Paul and Minneapolis have computer controlled signalsystems.); a study of ramp meter delays; and a study on the maintenance of themeters.
They are also involved in the Integrated Corridor Traffic Management Project, acomprehensive program along the I-494 corridor designed to improve efficiencyof traffic movement throughout the corridor. This will involve linking the trafficlights on the streets approaching the freeway ramps to the ramp meter systemand loop detectors.
3.3.3.3 Data Use - Input to Air Quality Models: The MPO does Air Qualityanalyses for the region, although MNDOT will do “hot spot” intersection studies. They use a model approach rather than a ground count approach. Local roadVMT is not considered , but intrazonal estimates are used instead. The3
available traffic data is adequate for modeling purposes. However, this datamust be adjusted since MNDOT provides AADT, while the MPO*s travelforecasting models estimate travel on an Average Weekday Traffic (AWDT)basis.
Input to HPMS: The traffic count data from the Metro area counting program provides all the traffic count data needed, but these figures may have to beadjusted in order to match HPMS segments. MNDOT gets almost all otherHPMS required data from its TIS.
Support of CMS: A CMS is only being done in the Metro area, with the MPOhaving primary responsibility. Like the air quality analyses, a model approachto estimating travel volumes is used rather than a ground count approach. However, these traffic model results are sent to the jurisdictions for a check onreasonableness.


3 - 48
FIGURE 3.7 - DISPLAY OF REAL TIME TRAFFIC CONDITIONS

3 - 49
The MPO uses a model rather than ground count approach because they feelthey have a “good” model based on their 1990 data collection and calibrationeffort. In addition, they noted that the data needed to fully support the CMS,such as peak hour traffic volumes, is not available in all cases. However, theyrealize that the model results are becoming less valid with the passage of time.
Local Agency Needs: The MPO gets AADTs from MNDOT*s regional flowmaps. The map data is usually 2 years old when the MPO gets it, and therecurrently is no electronic version of the data available. However, they notedthat they can get the latest available data from MNDOT if needed.
The MPO feels that they get adequate count data coverage for their modelcalibration needs, although these AADTs have to be converted to AWDTs asindicated above.
The MPO did their own peak-hour and vehicle classification counts at selectedscreenlines for their 1990 Travel Behavior Inventory. This study is the source ofmuch of the data needed to adjust the MNDOT data.
The MPO also receives auto occupancy data from the TMC, who does do anvehicle occupancy study every year at about 14 sites.
3.3.3.4 How Various Data Needs Fit Together In The Context Of The OverallData Collection Effort - The Minnesota Department of Transportation, workingwith the Traffic Management Center and District Traffic Engineers in the MetroDistrict have established a cooperative counting program with the counties andmunicipalities. This cooperative program was undertaken for efficiency,convenience and to prevent duplication of vehicle counts. This work provides adata base for identifying trends, and evaluating system performance.
The available count data have proved to be adequate and sufficient for theneeds of MNDOT, and the MPO in supporting required HPMS data submittalsand air quality analysis. With minor adjustments it has served the purposes ofthe MPO in their model calibration efforts. Any deficiency in the current programwould seem to lie in its inability to provide some of the more detailed dataelements needed to support the region*s CMS.
3.3.3.5 Funding Sources/Mechanisms - MNDOT*s Metro area trafficmonitoring program is funded through a combination of federal and state dollars. About 80 % of the money is federal PL and SPR funds.
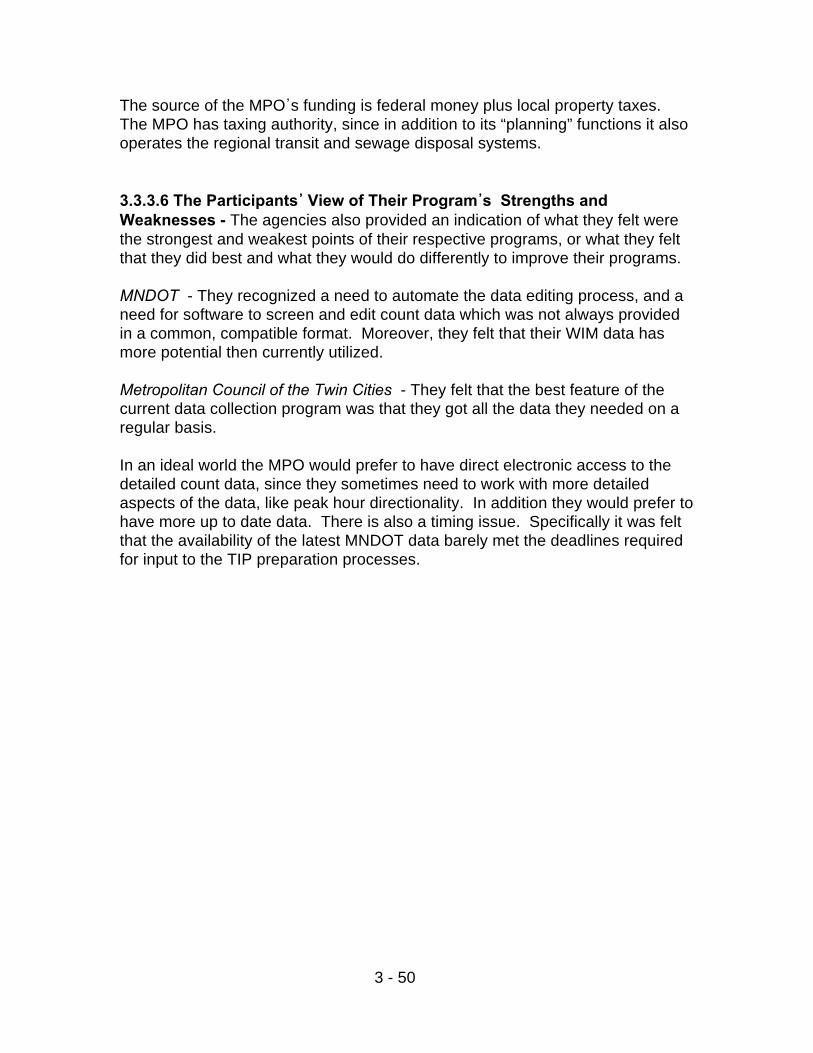
3 - 50
The source of the MPO*s funding is federal money plus local property taxes. The MPO has taxing authority, since in addition to its “planning” functions it alsooperates the regional transit and sewage disposal systems.
3.3.3.6 The Participants** View of Their Program**s Strengths and Weaknesses - The agencies also provided an indication of what they felt werethe strongest and weakest points of their respective programs, or what they feltthat they did best and what they would do differently to improve their programs.
MNDOT - They recognized a need to automate the data editing process, and aneed for software to screen and edit count data which was not always providedin a common, compatible format. Moreover, they felt that their WIM data hasmore potential then currently utilized.
Metropolitan Council of the Twin Cities - They felt that the best feature of thecurrent data collection program was that they got all the data they needed on aregular basis.
In an ideal world the MPO would prefer to have direct electronic access to thedetailed count data, since they sometimes need to work with more detailedaspects of the data, like peak hour directionality. In addition they would prefer tohave more up to date data. There is also a timing issue. Specifically it was feltthat the availability of the latest MNDOT data barely met the deadlines requiredfor input to the TIP preparation processes.
3 - 51
3.3.4 Further Information
Mr. George CepressDirector, Traffic Forecast and Analysis SectionOffice of Management Data ServicesMinnesota Department of Transportation95 John Ireland Boulevard MS - 450St. Paul, MN 55155
Telephone: (612)-296-0217
Ms. Connie KozlakMetropolitan Council of the Twin CitiesMears Park Centre230 East Fifth StreetSt. Paul, MN 55101-1634
Telephone:(612)-229-2720
Mr. Ron DahlMinnesota Department of TransportationTraffic Management Center1101 Fourth Ave. SouthMinneapolis, MN 55404
Telephone:(612)-341-7269

3 - 52
3.4 PORTLAND CASE STUDY
3.4.1 Introduction To The Case Study Area
The Portland area has a population of 1,329,000, a land area of 469 squaremiles, and a 5,509 mile roadway system. It is now in attainment for both CO andozone. The State DOT, and both city and county level agencies havepermanent data collection programs. The MPO, Metro, does limited datacollection. Metro, the Portland Metropolitan Planning Organization is the directlyelected regional government and designated MPO for the Portland metropolitanarea. The organization covers three counties and 24 cities. The Portlandmetropolitan area is shown in Figure 3.8.
This case study is based on information gathered during meetings held during asite visit made to Portland on 11/20/96. Meetings were held with staff of theOregon Department of Transportation, Region 1; Portland Department ofTransportation, Bureau of Traffic Management; and the Metro TransportationDepartment, Travel Forecasting Section, in order to learn more about traffic datacollection and use in the Portland area. This information was supplemented bydocumentation supplied by the participating agencies, and information providedthrough the telephone interviews conducted under the first phase of this project. All jurisdictions involved in traffic data collection within the region were notcontacted as part of this study.
3.4.2 Data Collection Program
3.4.2.1 Introduction - While it does only limited data collection on its own, Metroadministers the regional count program. These count data are important toMetro and the jurisdictions and are critical to the computer modeling andplanning process. Metro sends a list of locations to the jurisdictions requestingtraffic count data. There are currently five separate jurisdictions in the Portlandmetro area which measure traffic flows along designated cutlines/screenlinesand submit copies of their data to Metro. These jurisdictions include the OregonDepartment of Transportation, the City of Portland, and the Counties ofClackamas, Multnomah, and Washington.
The Oregon Department of Transportation*s, Region 1, the City of Portland*sOffice of Transportation (Bureau of Traffic Management), and MultnomahCounty*s Transportation Division provided data on their programs as part of thisproject*s initial phone interviews. ODOT Region 1, the City of Portland, andMetro were involved in the site visit.


3 - 54
The program descriptions that follow do not cover all programs. Projectresources did not allow for a comprehensive inventory of the programs of alljurisdictions. In addition to the programs outlined below, traffic count data iscollected by the Counties of Clackamas and Washington in Oregon. ThePortland - Vancouver TMA (Transportation Management Area) also includesClark County, Washington. However, this study concentrated on programs inOregon, which contains Portland, the largest city in the region.
3.4.2.2 Type of Program - ODOT Region 1 - ODOT Region 1 collects data at1200 sites per year on a 3 year cycle (the “statewide” program). All freeways inRegion 1 are counted every year. They also perform about 800 intersectioncounts each year.
Region 1 does the actual counts, but the schedule for the HPMS counts and“statewide counts” comes from ODOT Headquarters. The raw count data goesto the state capitol, Salem, where the counts are tabulated. However, theadjustment factors used are specific to the Portland area, not statewide factors.
Region 1 does hourly counts (48 hr. duration), but collects data at 15 minuteintervals for peak hours. These are all portable tube counts. Equipment is nota problem. They count from March to October with 2 permanent in-house staff,using consultants if they have an overload.
Counts are done geographically, roughly on a county by county basis, just todistribute the workload. The MPO requested counts generally coincide withcounts they do on a 3 year cycle as part of the statewide program.
There are also about 20 permanent continuous count stations in the Portlandarea. These are polled weekly. Region 1 collects this data directly, althoughHeadquarters also can access the sites via telemetry.
All data (HPMS, statewide count, freeway) is in electronic form, but it is not in aconsolidated data base.
Classification counts are done at 28 sites per year on a three year cycle forHPMS. These are manual counts, and are done by consultants. ODOT doesabout 12 classification counts /year for special studies.
Vehicle occupancy studies are now done only for special studies such as theWestside Corridor, but in the future, these will have to be done on a regularbasis in support of the CMS.

3 - 55
Multnomah County - Multnomah County collects traffic volume data at 200stations per year (24 hour duration). They also conduct about 25 manual turningmovement counts, and about 50 other mechanical counts per year as needed. In addition they conduct about 25 speed sample studies per year on an asneeded basis. City of Portland - The City of Portland collects traffic count data at 50 continuouscount stations. They also collect data at 120 stations on a two year cycle (24hour duration). In addition they conduct about 300 manual turning movementcounts per year and 2000 mechanical counts per year as needed. About 85% oftheir counts are done as special studies.
They also conduct about 13 manual and 37 mechanical vehicle classificationcounts per year as needed, and about 2000 speed studies per year on request.They collect vehicle occupancy data at 4 stations every 3 months and conductabout 15 other occupancy studies per year on an as needed basis. All trafficdata goes into their database.
The City does 120 counts every 2 years for Metro. They do cordon countsaround the City every year opposite the Metro count requirement. They collectdata at 97 intersections for the City*s “CMS”. This is their Traffic SystemPerformance Evaluation (TSPE). They will also be doing travel time studiesevery 3-4 years using GPS as part of the TSPE. (This was only done once sofar.) The TSPE also calls for an occupancy study every 3-4 years.
They have 4 people doing counts full time, year round. Their data collectionprogram is operating at capacity now, but they could hire more people if theadditional funding was available.
Metro - There are currently five separate jurisdictions in the Portland metro areawhich measure traffic flows along designated cutlines/screenlines and submitcopies of their data to Metro, every two years, as part of the regional countprogram. Metro has requested that each agency report traffic count totals atcertain locations to avoid both overlaps and gaps in gathering and reportingdata. Further, Metro asks each organization to collect data in the spring or fall ofthe year (preferably either in the month of May or October) so as to obtain whatis believed to be the most typical auto counts, and to summarize information bythe hour, by direction of travel, and by average weekday (AWD) totals.
Data for cutlines and screenlines are tabulated for 24-hour periods. Cutlinesmay be defined as artificial lines or boundaries which intercept major traffic flowsalong selected axes. Screenlines are located along physical barriers. Thesechosen traffic data collection points are established to measure the major travelflows into and out of a central area, or between suburban and downtown, or

3 - 56
suburban and outlying commercial areas. Metro has designated 52 cutlines andscreenlines within the Portland metropolitan area.
The count location data are used to calibrate the regional transportationplanning model. Metro has requested count data at 386 points from 1986 on.The count data is for 15 minute intervals in the peak periods, hourly the rest ofthe day. All conventional counts are 24 hr. duration. Table 3.7 shows anexample of the available data.
The data is currently in a “Lotus type” spreadsheet format. There are plans totransfer the information to a relational database. Data may be accessible to alljurisdictions via the relational database in the future.
While there are some variations among data collecting agencies, overall theycount traffic on a 24 hour basis in order to obtain an average weekday (AWD)total per location. Some agencies collect 15 - minute peak - period informationat different times than others, which may hinder comparisons. The methods forcollecting data used by the various agencies includes automatic countingdevices (pneumatic hoses and inductive loops) at permanent record locationpoints, as well as individuals who collected information manually. Metro getsabout 60% of what they ask for on average, although this varies widely. Metronoted that the jurisdictions try their best, but that budgets do not allow them to doall that the MPO asks.
In addition to the cutline program, Metro does receive some data from various“special studies” conducted by the jurisdictions.
Metro will soon be getting vehicle classification counts at 44 locations tosupplement the count data. (They have a need for data on trucks fordevelopment of truck freight models.) Count locations were selected by acommittee of the region*s traffic experts. A consultant working for ODOT is nowcompleting the counts. Additionally, Metro uses vehicle classification data fromthe state*s submittal to the Highway Performance Monitoring System (HPMS). Counts from approximately 100 HPMS locations are utilized.
3.4.2.3 Data Collection Equipment - Ten of ODOT*s traffic count stations havepermanently installed loops. Vehicle classification data is also collected at thesestations. Traffic count data is collected at all other stations with road tubes.
Multnomah County collects traffic count data with road tubes at the 200 stationsmonitored under their permanent program.


3 - 58
The City of Portland collects data at 50 sites having permanent loops. Data atall other sites is collected using road tubes. They also have 6 video units foroccupancy studies.
3.4.2.4 Data Collection Staff Levels - ODOT relies on a mix of permanent inhouse staff (0.5 administrative, 0.5 data processing and 4.5 field) and temporarycontractor staff (7.5 field). Multnomah County has a permanent in house staff of0.5 full time equivalents working on data collection. The City of Portland has amix of permanent (2 field and 2 data processing) and temporary in house staff (1data processing) for data collection.
3.4.2.5 Data Use - The reasons why each type of agency within the urban areacollected the types of data that they did are indicated below.
ODOT collects traffic count data, vehicle classification data, travel time/speeddata, and vehicle occupancy data for the following purposes:
HPMS input;VMT estimates;CMS programs;regional transportation planning models;statewide transportation planning;corridor planning;major investment studies;environmental planning;other - freight intermodal planning.
Multnomah County collects traffic count data for local traffic planning.
The City of Portland collects traffic count data, vehicle classification data, traveltime/speed data, and vehicle occupancy data for local traffic planning, andenvironmental planning.
Metro has recently begun to collect some vehicle classification data for its truckmodeling effort, but generally gathers data collected by other agencies for itstraffic model of the region.
3.4.2.6 Data Flows Within the Urban Area - Each individual interviewed as partof the initial phase of the project was asked if their agency shared or pooled datawith other agencies within the urban area. They were also asked if the data wereprovided informally or formally.
Informal exchange means that it was done as needed, on a case by case basis,

3 - 59
e.g. an individual in one agency calling an individual in another to see if theyhad any recent data on a certain intersection or road segment. Formalexchange involves the transfer of a comprehensive data set on a regular orroutine basis, e.g. each year, an agency provides other agencies within the areawith a copy of all the traffic data it collected during the past year.
ODOT provides count and occupancy data to the counties and cities on aninformal basis, and receives count data from the City, counties and consultantson an informal basis. The agency has no problems with the current data sharingarrangements.
Multnomah County exchanges data with the City and consultants on an informalbasis, and data exchange with the MPO is on a formal basis and an informalbasis. The agency has no problems with the current data sharing arrangements.
The City of Portland provides data to ODOT and to consultants on an informalbasis, while data is provided to the MPO on both a formal and informal basis. The agency has no problems with the current data sharing arrangements.
3.4.3 Issue Areas
The traffic monitoring program in the Portland area should be of interestbecause of the interagency cooperation and coordination that has beenachieved; and the role of a lead agency in dividing up data collectionresponsibility among the jurisdictions. These are discussed more fully below.
3.4.3.1 Institutional Arrangements - Inter Agency Coordination/Cooperation- While it does only limited data collection on its own, Metro administers theregional count program. These count data are important to Metro and thejurisdictions and are critical to the computer modeling and planning process.There are currently five separate jurisdictions in the Portland metro area whichmeasure traffic flows along designated cutlines/screenlines and submit copies oftheir data to Metro. Metro sends a list of locations to the jurisdictions at whichthey collect traffic count data. These five agencies are: The City of Portland,ODOT, and the Counties of Clackamus, Multnomah, and Washington.
Metro developed the regional travel demand model, but the jurisdictions canaccess the model and do their own analysis. ODOT, Tri-Met, and the threecounties, the City of Gresham, and the City of Portland have modemconnections to the transportation planning EMME/2 database. Thesejurisdictions are able to use the software as a remote workstation. Metroprovides training to the jurisdictional staff regarding the use of the EMME/2Transportation Planning Package, the theory of travel demand modeling, andcomputer network simulation analysis. The jurisdictions perform studies to

3 - 60
determine development, transportation policy and infrastructure impacts.
This is a selling point for cooperative data collection, i.e., the model is only asgood as the data used to calibrate it. Data is the key to model validation, andthe model*s outputs are the basis of investment decisions.
The cooperative approach has worked to date, but this may be changing. “Measure 50”, a statewide ballot measure, cut back local property taxes. Thismay impact traffic counts at the local level. The City of Portland indicated thatthey now provide data to the MPO free of charge, but that this might have tochange in the future.
3.4.3.2 Use Of ATMS/Traffic Management Center Data For Planning - BothODOT and the City of Portland have ATMS type systems in place now, but thesesystems are not used to their full potential in terms of collecting traffic data.
ODOT currently collects count data at state controlled signals in the area. ODOT controls the signals at the ends of ramps to/from freeways, while the Citycontrols signals on city streets. ODOT uses “WAPITI” software to produce trafficvolume reports from the signal system data.
ODOT also has a ramp metering system in place on the area*s freeways. Theywill be implementing a system to collect data from the ramp meters and mainlinedetectors (much like the system in Minneapolis) in the future. This shouldcoincide with the opening of their TMOC (Traffic Management & OperationCenter) within the year. ODOT*s TMOC will also have access to information onthe City*s signal control system. Recognizing the importance of functioning loopdetectors to quality data, ODOT has earmarked $800,000 per year toward loopmaintenance/replacement.
ODOT sees ATMS as a solution to the problem of declining staff levels andincreasing data needs i.e., automation to increase productivity, and the problemof safety associated with data collection on urban highways.
The City of Portland also sees ATMS as way of data collection in the future.They currently collect data from their traffic signal control system for planning asneeded, but not on a regular or systematic basis. While the system software canproduce reports of traffic count data, the count “data” can not be easily extractedfrom the reports and converted into a data file. In addition about 10% of theCity*s loops are out at any given time, which, in their minds, casts some doubton the quality of the data.
About 450 of the City*s 930 signals are presently connected to the system.However, the system currently only collects and saves data at 20 locations. Thedata is saved for one week. The system uses JHK 2000 software.

3 - 61
Metro would like to see a system where the loop detector data could bedownloaded to their data base directly. However, they feel that they will needadditional funding, and institutional consensus to get to tap into the ODOT/Cityof Portland ATMS data.
3.4.3.3 Data Use - Input to Air Quality Models: Metro does the air qualityanalysis for the region, working in conjunction with the Oregon Department ofEnvironmental Quality (DEQ). There is no ODOT work in this area. Metro usesmodel based VMT and speed estimates, rather than those based on groundcounts. However, the integrity of the model data is ensured through a validationprocess.
Input to HPMS: ODOT Region 1 only collects the traffic count data, whileODOT in Salem prepares the rest of the HPMS submittal. Traffic counting onlocal roads is only done for the HPMS sample.
Support of CMS: Metro will be using a simulation based approach for theirCMS. The proposed CMS will require the following data from the jurisdictionscollected on a three year cycle: traffic volume, by hour; roadway capacity,vehicle occupancy; average vehicle speeds; and travel times on selected routes.
ODOT has indicated that the requested traffic count data would probably notpresent a problem, since generally they are collecting the required data already. However, the travel time data, which is not currently collected, may present aproblem.
The CMS for Metro requires additional data collection on the part of the City,primarily additional volume counts, and speed data which is presently notcollected at the specified locations. The City feels that the additional datacollection burden is such that they may have to start charging the MPO for thisextra data collection in the future.
The City has its own version of a CMS in place now. This is their Traffic SystemPerformance Evaluation (TSPE). Legislation such as the Oregon TransportationPlanning Rule (TPR) and the Intermodal Surface Transportation Efficiency Act(ISTEA) has promoted or required the development of programs that havequantified goals and a means for monitoring those goals. These new programsinclude the state-mandated Transportation System Plan (TSP), the ISTEA-mandated Congestion Management System (CMS), and the City of Portland*sStreet System Operations Plan.
The TSPE was undertaken to identify and develop indicators that can be used tomonitor traffic system performance, as required by these programs. The TSPE

3 - 62
gives the City of Portland a tool to identify current areas of operationaldeficiency and provide a baseline for future performance monitoring. It isenvisioned as an ongoing evaluation program that will be implementedperiodically (every three years). The TSPE includes five performance indicators: District Accessibility, Street Auto User Characteristics, Travel Time, Traffic Flow,and Multimodal Service Level.
3.4.3.4 How Various Data Needs Fit Together In The Context Of The OverallData Collection Effort - Metro*s regional count program was designed tosupport their model calibration needs and VMT estimation process. Theavailable count data has proved to be adequate and sufficient for the needs ofODOT and the MPO in supporting required HPMS data submittals, air qualityanalyses, and to a certain extent, the traffic volume measures of the region*sCMS. The major deficiency in the current program would seem to lie in itsinability to provide the travel time measures proposed for use in the CMS.
The MPO is perceived as the regional data clearinghouse. For example, theMPO supports the City of Portland by providing them with “regional” data fromneighboring counties. While there currently is no regional traffic data base, some data is exchanged electronically. A regional traffic data base, accessibleto the jurisdictions, is under development.
ODOT will implement the management systems proposed under ISTEA. Theyalready had pavement and bridge management systems before ISTEA, and theystill plan on implementing the safety, transit, and intermodal managementsystems even though these are no longer mandatory. All management systemsare being done out of ODOT Headquarters in Salem.
3.4.3.5 Funding Sources/Mechanisms - The City of Portland*s traffic datacollection programs are funded as part of the City*s transportation fund. Sources of revenue are gasoline taxes from the State, parking meters andtickets. In addition, the City will begin selling computer time to MultnomahCounty in order to operate the County*s traffic signal system.
About 60% of the funding for the MPO*s Transportation System MonitoringProgram is federal money (PL, STP, and Section 8). The remainder is providedby ODOT, Tri-Met (the region*s transit agency), and Metro itself.
The member cities and counties also pay voluntary dues to the MPO, but thissupports the MPO*s technical assistance program. The purpose of thisprogram is to provide technical support to the cities and counties of the region interms of staff support to obtain data or evaluate a particular transportationproblem; computer usage; and staff training.

3 - 63
3.4.3.6 The Participants** View of Their Program**s Strengths and Weaknesses - The agencies also provided an indication of what they felt werethe strongest and weakest points of their respective programs, or what they feltthat they did best and what they would do differently to improve their programs.
ODOT - They would like to go to automated data collection, i.e., morepermanently installed loops, or increased use of video cameras for trafficcounting. They saw the collection of data on urban freeway ramps as a realproblem in terms of logistics and safety, and the lack of data for freeway links asdeficiencies of their current program.
In their case, the money is available for data collection, but not the people. Theyhave lost half their field staff. While they have tried to increase productivity withbetter equipment, they have had to go to contractors, and temporary staff inorder to keep up with their work load.
City of Portland - They felt that their staff had done a good job at the nuts andbolts of data collection and in getting data that people need. Managing the data,and making data available and accessible to users was seen as the realproblem.
They indicated that they could use help in equipment evaluation, since theyhave had problems with speed and classification equipment. They have alsohad a problem in taking data from various brands of counters and converting thedata to a common format. They have developed software to do this on theirown.
Metro - Given limited resources at all of the agencies involved, the MPO feelslucky to have cooperative data sharing. Everybody is seen as willing to helpeach other out as best they can, but the MPO felt that they must constantly sellthe importance of data, and the data collection process.
Metro felt that the quality of data has suffered somewhat due to various agencystaff cuts, and the need to contract out data collection. The MPO believes thatquality of data is of the utmost importance, and if given the choice would preferto see less quantity (i.e., locations) and more quality.
The MPO sees a need for getting all traffic data into a common electronic format,and for a uniform GIS for the region. As an example, they noted that the Cityhas parking data in a GIS, but that the data was somewhat difficult to translate.
Vehicle classification equipment was also seen as a problem. They would like tosee the technology improved by either private sector efforts or governmentsponsored research.

3 - 64
3.4.4 Further Information
Mr. Dennis MitchellRegional Traffic EngineerOregon Department of Transportation, Region 1123 NW FlandersPortland, OR 97209
Telephone:(503)-731-8218
Mr. Tom JensenPortland Department of TransportationBureau of Traffic Management1120 SW 5th AvenuePortland, OR 97204
Telephone:(503)-823-5211
Mr. Dick WalkerTravel Forecasting ManagerMetro600 Northeast Grand AvenuePortland, OR 97232-2736
Telephone: (503)-797-1765

A - 1
APPENDIX A - GLOSSARY
AADT (Annual Average Daily Traffic)
The estimate of typical daily traffic on a road segment for all days of the week,Sunday through Saturday, over the period of one year.
ADT (Average Daily Traffic)
The total traffic volume during a given time period (more than a day and lessthan a year) divided by the number of days in that time period.
ATMS (Advanced Traffic Management System)
An array of human, hardware, and software components designed to monitor,control and manage traffic on streets and highways. This includes those usedfor surveillance and control of traffic on freeways and arterials, detection ofroadway traffic flow and incidents, and communication with vehicles, trafficmanagement centers, and organizations responsible for traffic management.
ATR (Automatic Traffic Recorder)
A device that records the continuous passage of vehicles across a given sectionof roadway by hours of the day, days of the week or months of the year.
ATR Counts
Base traffic counts recorded at an automatic traffic recorder.
AVC (Automatic Vehicle Classifier)
A device that works in conjunction with computerized electronic equipment thatcounts and classifies vehicles by type and axle configuration.

A - 2
Axle Correction Factor
The factor developed to adjust vehicle axle sensor base data for the incidence ofvehicles with more than two axles, or the estimate of total axles based onautomatic vehicle classification data divided by the total number of vehiclescounted.
Base Count
A traffic count that has not been adjusted for axle factors (effects of trucks) orseasonal (day-of-week/month-of-the-year) effects.
Base Data
The unedited and unadjusted measurements of traffic volume, vehicleclassification, and vehicle or axle weight.
Clean Air Act Amendments of 1990 (CAAA)
Legislation authorizing the Environmental Protection Agency (EPA) to establishand implement rules, which among other topics concerns mobile pollutantemission sources which affect air quality.
Congestion Mitigation/Air Quality Improvement Program (CMAQ)
A funding program for projects that contribute to the attainment of a NationalAmbient Air Quality Standard or are included in a State Implementation Planpursuant to the Clean Air Act of 1990.
Congestion Management System (CMS)
A systematic process that provides information for decision makers ontransportation system performance and alternative strategies to alleviatecongestion and enhance the mobility of persons and goods.

A - 3
Count
The data collected as a result of measuring and recording traffic characteristicssuch as vehicle volume, classification, speed, weight, or a combination of thesecharacteristics.
Count Period
The beginning and ending date and time of traffic characteristic measurement.
Count Type
The traffic characteristic being measured, the measurement device, and timeperiod.
Coverage Count
A traffic count taken as part of the requirement for system-level estimates oftraffic. The count is typically short-term, and may be volume, classification, orWeigh-in-Motion.
Duration
The time period over which traffic is monitored, e.g., 48 hours.
DVMT (Daily Vehicle Miles Traveled)
Annual Average Daily Traffic on a road segment, expressed as AADT, multipliedby the length of the road segment.
ESAL (Equivalent Single Axle Load)
Summation of equivalent 18,000-pound single axle loads used to combine mixedtraffic to design traffic for the design period.

A - 4
Frequency
The cycle over which traffic data is collected at a location, e.g., once every 3years.
Functional Classification
The grouping of streets and highways into classes, or systems, according to thecharacter of service they are intended to provide. The recognition that individualroads do not serve travel independently and most travel involves movementthrough a network of roads is basic to functional classification.
GIS (Geographic Information System)
A method of storing, analyzing, and displaying spatial data.
HPMS (Highway Performance Monitoring System)
A federally mandated data reporting system for all roads except local.
Incident Management
A systematic approach to reduce non-recurring congestion by increased incidentdetection, response, and clearance; driver information systems; constructionmanagement; and traffic management.
Intelligent Transportation System (ITS)
A system that employs electronics, communications, and/or informationprocessing to improve the efficiency of surface transportation operations andprovide real-time information about travel options.
Intersection Counts
Traffic counts taken at an intersection, either manually or with counters, to studythe flow of vehicles through the intersection. Generally, straight movements arerecorded with counters, and turning movements are either taken manually or incombination with counters.
A - 5
Loop Detector
A detector that senses changes in inductance, of its inductive loop sensor,caused by the passage or presence of a vehicle near the sensor.
Manual Counts
Measurement of traffic characteristics based on human observation, which mayor may not be electronically recorded.
Mechanical Counts
Measurement of traffic characteristics by sensors and electronic recording of themeasurements, independent of human observations.
MPO (Metropolitan Planning Organization)
Regional agency responsible for urbanized area transportation planning.
NHS (National Highway System)
A designated system of highways of National Significance mandated under theIntermodal Surface Transportation Efficiency Act of 1991. The purpose of theNHS is to provide an interconnected system of principal arterial routes to servemajor population centers, airports and public transportation facilities, to meetnational defense requirements and to serve interstate and interregional travel.
Peak Period
The highest period of traffic flow during the a.m. and p.m. time period.
Permanent Count Stations
ATRs that are permanently placed at specific locations throughout the region torecord the distribution and variation of traffic flow by hours of the day, days ofthe week, and months of the year from year to year.
PL ( Planning)

A - 6
FHWA planning and research funding program. Metropolitan planning funds(the 1 percent funds authorized under 23 U.S.C. 104(f) to carry out theprovisions of 23 U.S.C. 134(a)).
Project-Related Count
A traffic count taken to support a roadway or bridge project.
Seasonal Factors
Parameters used to adjust base counts which consider travel behaviorfluctuations by day of the week and month of the year.
SHRP (Strategic Highway Research Program)
A five year program for pavement and operations research funded by Congressand managed through the National Academy of Sciences. One of the fourresearch areas, long-term Pavement Performance, is planned as a 20-yearprogram.
Special Count
A traffic count taken to respond to a request for traffic information, not includedas part of the coverage or project-related count plan.
Special Purpose Count
A traffic count taken for the specific purpose of better understanding traffic flowcharacteristics at predetermined sections of roadway. These may includestudying the effects of traffic accidents, roadway closures or traffic re-routing.
SPR (State Planning and Research)
FHWA planning and research funding program. State planning and researchfunds (the 2 percent funds authorized under 23 U.S.C. 307(c)(1)).
STP (Surface Transportation Program)
FHWA planning and research funding program. Surface transportation program

A - 7
funds authorized under 23 U.S.C. 104(b)(3) used for highway and transitresearch and development and technology transfer programs, surfacetransportation planning programs, or development and establishment ofmanagement systems under 23 U.S.C. 303.
TMA (Transportation Management Area)
An urbanized area with a population greater than 200,000. These weredesignated as a result of ISTEA.
TMC (Traffic Management Center)
Also known as Traffic Operations Center, it serves as the nerve center for atraffic management system. Data on traffic conditions collected in real time byany of a variety of means is transmitted to the TMC where traffic engineers,assisted by computer, monitor traffic flow and respond to congestion in a varietyof ways, such as adjustments to traffic signal timing, transmitting information oncurrent conditions to motorists via changeable message signs, etc.
Traffic Monitoring Guide (TMG)
Document that provides FHWA*s recommended approach to the monitoring oftraffic characteristics. The guide provides direction for persons interested inconducting a statistically based monitoring of traffic counting, vehicleclassification, and truck weighing.
Traffic Monitoring System for Highways (TMS/H)
A systematic process for the collection, analysis, summary, and retention ofhighway related person and vehicular traffic data, on public highways andstreets.
Traffic Program
The collection, editing, summarization, reporting and analysis of traffic volume,classification and weight data.
Travel Time
The amount of time a vehicle spends traversing a route or route segment.

A - 8
Average speed can be computed by taking the length of the highway or streetsegment under consideration and dividing it by the average travel time for thatsegment.
Vehicle Classification
The measurement, summarization and reporting of traffic volume by vehicle typeand axle configuration.
Vehicle Occupancy
The average number of people traveling in vehicles on a given roadway, within agiven geographical area, etc.
VMT (Vehicle Miles Traveled)
Average Sunday through Saturday vehicle movement on a specific roadsegment multiplied by the length of the road segment, reported in the form ofdaily and annual VMT.
WIM (Weigh-in-Motion)
The process of estimating a moving vehicle*s static gross weight and the portionof that weight that is carried by each wheel, axle, or axle group or combinationthereof, by measurement and analysis of dynamic forces applied by its tires to ameasuring device.
B - 1
APPENDIX B - BIBLIOGRAPHY
PHILADELPHIA
Annual Report, Bureau of Planning and Research, Performance MonitoringDivision, Pennsylvania Department of Transportation, Harrisburg, July, 1996.
Bureau of Transportation Data Development, Traffic Monitoring System, List ofMonitoring Locations, New Jersey Department of Transportation, Trenton, April4, 1995.
Conformity of the Delaware Valley*s Direction 2020 Transportation Plan,Delaware Valley Regional Planning Commission, Philadelphia, September,1995.
Enhanced Planning Review of the Philadelphia Metropolitan Area, ReportRSPA/VNTSC-SS-TM694-07, prepared for the Federal Transit Administration, Office of Planning and Federal Highway Administration, Office of Environmentand Planning, Volpe National Transportation Systems Center, Cambridge, June1996.
Estimating and Monitoring 1993 VMT in the Delaware Valley Region, DelawareValley Regional Planning Commission, Philadelphia, July, 1995.
Highway Traffic Trends in the Delaware Valley Region, 1960-1985-1990,Delaware Valley Regional Planning Commission, Philadelphia, January, 1992.
New Jersey Truck Research Study, Delaware Valley Regional PlanningCommission, Philadelphia, June, 1995.
PennDOT*s Management & Monitoring Systems, September, 1996.
Pennsylvania*s Traffic Monitoring System for Highways, PennsylvaniaDepartment of Transportation, Harrisburg.
Traffic Impacts of I-476, Delaware Valley Regional Planning Commission,Philadelphia, December, 1993.
Traffic Monitoring Program for Selected Highway Corridors - Phase III, DelawareValley Regional Planning Commission, Philadelphia, December, 1993.
Traffic Monitoring System - Highway Component, Implementation Plan, NewJersey Department of Transportation, Trenton, 9/30/94.

B - 2
Travel Trends in the Philadelphia Central Business District, 1960-1985-1990,Delaware Valley Regional Planning Commission, Philadelphia, October, 1991.
TAMPA - ST. PETERSBURG - CLEARWATER
County-Wide Data Collection and Analysis, Identification of Transportation DataAttributes and Database Design, prepared for Hillsborough County MetropolitanPlanning Organization, Tindale-Oliver & Associates, Inc., November, 1996.
County-Wide Data Collection and Analysis, Inventory of Existing TransportationData and Data Needs in Hillsborough County, prepared for Hillsborough CountyMetropolitan Planning Organization, Tindale-Oliver & Associates, Inc., June,1996.
Evaluation of Traffic and Highway Data Collection Survey, Off-System PublicRoads Eligible for Federal-Aid Funding, Volume 1, prepared for FloridaDepartment of Transportation, Transportation Statistics Office, ParsonsBrinckerhoff, February, 1995.
Florida*s Mobility Management Process / Congestion Management System WorkPlan, Florida Department of Transportation, December, 1994.
Hillsborough County Congestion Management System, Goals, PerformanceMeasures, and Work Plan, prepared for Hillsborough County MetropolitanPlanning Organization, JHK & Associates, Inc., Orlando, January, 1995.
Hillsborough County Congestion Management System, System PerformanceReport, prepared for Hillsborough County Metropolitan Planning Organization,JHK & Associates, Inc., December, 1995.
Report on the Use of the Traffic Congestion Management System in the TIPDevelopment Process, Pinellas County MPO, August 28, 1996.
1996 Transportation Level of Service Report, Pinellas County MetropolitanPlanning Organization, May, 1996.
1996/97 Unified Planning Work Program for the Pinellas Area TransportationStudy, Pinellas County Planning Department, Clearwater, May, 1996.

B - 3
MINNEAPOLIS - ST. PAUL
Calibration and Validation of the Highway Assignment Model for the MinneapolisSt. Paul Region, prepared for Metropolitan Council, Strgar-Roscoe-Fausch, Inc.,June 8, 1994.
Congestion Management System for the Twin Cities Metropolitan Area,Preliminary Draft, Metropolitan Council of the Twin Cities, St. Paul, November 1,1995.
MN/DOT*s Traffic Counting Program, Minnesota Department of Transportation,St. Paul.
Prospectus for the Transportation Planning Process, Twin Cities MetropolitanArea, Metropolitan Council, St. Paul, April, 1996.
Roggenbuck, Kevin, Minor Arterial Capacity Analysis in St. Paul, TechnicalMemorandum, Metropolitan Council, St. Paul, September 12, 1996.
Roggenbuck, Kevin, Assessment of the Traffic Impact of Work Trips fromOutside the Region, Technical Memorandum, Metropolitan Council, St. Paul,October 16, 1996.
Solicitation Process for Federal Surface Transportation Program, CongestionMitigation Air Quality Program, and Transportation Enhancements Program,Metropolitan Council, St. Paul, October 30, 1995.
1990 Travel Behavior Inventory Summary Report, Twin Cities Metropolitan Area,Publication No. 35-95-009, Metropolitan Council, St. Paul, June, 1994.
1996 Transportation Unified Planning Work Program for the Twin CitiesMetropolitan Area, Publication No. 35-95-060, Metropolitan Council of the TwinCities Area.
1997-2000 Transportation Improvement Program for the Twin Cities MetropolitanArea, Publication No. 35-96-040, Metropolitan Council, St. Paul, August 8, 1996.

B - 4
PORTLAND
Congestion Management System, Portland Metropolitan Area, Discussion Draft,June, 1996.
FY 1996-97 Unified Work Program, Transportation Planning in the Portland -Vancouver Metropolitan Area, Metro, Southwest Washington RegionalTransportation Council, Oregon Department of Transportation, City of Portland,and Tri-Met, March 28, 1996.
Portland Interim CMS, undated draft
Portland Regionwide Advanced Traffic Management System Study- AdvancedTraffic Management Systems (ATMS) Plan, DKS Associates, October, 1993.
State of Oregon, Traffic Congestion Management System, CMS Perspective,Oregon Department of Transportation, Traffic Section, Salem, Oregon, June,1995.
Traffic Count Summaries, Average Weekday & Peak-Hour Volumes for METROCutline Locations, 1986-1988-1990-1992-1994, METRO, Portland, October,1995.
Traffic System Performance Evaluation, prepared for City of Portland, JHK &Associates, Inc., Emeryville, CA, July, 1996.
Transportation System Monitoring Activities, METRO, Portland, January, 1993.

C - 1
APPENDIX C - CASE STUDY PARTICIPANTS
PHILADELPHIA
Delaware Valley Regional Planning Commission
John Burger (215)-592-1800Bob Murray (215)-592-1800Taghi Ozbeki (215)-592-1800Mario Stegossi (215)-592-1800Thabet Zakaria (215)-592-1800
New Jersey Department of Transportation
Jim Carl (609)-530-3510George W. Kuziw (609)-530-3522Lou Whiteley (609)-530-3501
Pennsylvania Department of Transportation
Joe McGinnes (717)-787-3200David Ori (717)-772-2736Larry Shifflet (717)-787-3245
TAMPA - ST. PETERSBURG - CLEARWATER
Florida Department of Transportation, District Seven
William C. Gardner (813) 975-4834Charles Gray (813) 975-6439Donald Scott (813) 975-6444
Hillsborough County Florida, Traffic Engineering
John Vanacore (813) 272-5912
Hillsborough County Metropolitan Planning Organization
Joe Zambito (813) 272-5940

C - 2
Pinellas County Metropolitan Planning Organization
Gina Goodwin (813) 464-4751Marc Hanger (813) 464-4751Ramon Solis (813) 464-4751Sarah Ward (813) 464-4751
City of Clearwater, Traffic Engineering Department
Don Andrus (813) 562-4747 ext. 4770
MINNEAPOLIS - ST. PAUL
Minnesota Department of Transportation
George Cepress (612)-296-0217Dudley Gjersvig (612)-296-1664Bill Martins (612)-296-1664Dick Murray (612)-296-1661Mel Roseen (612)-725-2373Warren Seavey Jr. (612)-296-1659
Metropolitan Council of the Twin Cities
Mark Filipi (612)-229-2725Connie Kozlak (612)-229-2720Kevin Roggenbuck (612)-229-2728
Minnesota Department of Transportation, Traffic Management Center
Ron Dahl (612)-341-7269
PORTLAND
Oregon Department of Transportation, Region 1
Lee Gunderson (503)-731-8206Dennis Mitchell (503)-731-8218John Whitehead (503)-731-8211
C - 3
City of Portland, Office of Transportation, Bureau of Traffic Management
Robert Burchfield (503)-823-5175Tom Jensen (503)-823-5211Jamie Throckmorton (503)-823-5152
Metro
David Horowitz (503)-797-1769Dick Walker (503)-797-1765