case: 3:15-cv-00324-jdp document #: 71 filed: 01/04/16...
TRANSCRIPT
Case: 3:15-cv-00324-jdp Document #: 71 Filed: 01/04/16 Page 1 of 48
1
I. Introduction
My name is Kenneth Mayer and I currently am a Professor of Political Science
at the University of Wisconsin-Madison, and a faculty affiliate at the UW-Madison
La Follette School of Public Affairs. I joined the faculty in 1989. I teach courses on
American politics, the presidency, Congress, campaign finance, election law, and
electoral systems.
I have been retained by counsel representing the plaintiffs in this lawsuit to
determine whether, in my opinion, recent changes in voting and voter registration
practices in Wisconsin, including 2011 Act 23 and 2013 Act 146, impose burdens on, or
barriers to, the ability of otherwise eligible electors to register and vote. I have also been
asked to determine whether those burdens fall disproportionately on identifiable
populations, especially racial minorities, young voters, students, and registrants who do
not possess a driver’s license or Department of Transportation (“DOT”) photo ID. I also
provide evidence on the numbers and characteristics of registrants who had taken
advantage of corroboration and late weekend registration, practices which were banned
by recently enacted legislation.
This report contains the opinions that I intend to give in this matter. I describe
my methods for estimating the effects that the voting and registration changes have on the
probability that a registered elector votes, both at the individual level and at the aggregate
ward and municipality levels.
My opinions, which are based on the technical and specialized knowledge that I
have gained from my education, training and experience, are premised on commonly
used, widely accepted and reliable methods of analysis and my knowledge of the
Case: 3:15-cv-00324-jdp Document #: 71 Filed: 01/04/16 Page 2 of 48
2
academic literature on voting and registration. My opinions are also based on my review
and analysis of the following information and materials:
1. The Statewide Voter Registration System (SVRS) database of registered voters, generated on September 24, 2015.
2. The DOT database of driver’s license and DOT photo ID records. 3. Emails produced by the Government Accountability Board as part of the
discovery process in this litigation. 4. Government Accountability Board, Report to the Governor, Voter
Registration Four Year Record Maintenance, July 31, 2015, and Four Year Maintenance Training Manual, June 1, 2015, available at http://www.gab. wi.gov/sites/default/files/publication/69/2014_15_four_year_maintenance_crm_svrs_pdf_20894.pdf.
5. Data on race identification provided by Catalist, a national voter data
analytics firm whose work has been cited in peer-reviewed journals and has been accepted in other voting-rights litigation, used for individuals who do not possess a Wisconsin driver’s license or DOT photo ID.
6. GIS shape files of municipalities and 2012 wards created by the Legislative
Technology Services Bureau, available at http://legis.wisconsin.gov/gis/data. 7. Carnegie Classifications Data File, Carnegie Foundation for the
Advancement of Teaching, February 2012, available at http://carnegieclassifi cations.iu.edu/.
8. Source material as cited in this report.
I performed all statistical analysis using Stata/MP 13.1 for Mac.
II. Qualifications, Publications, Testimony, and Compensation
I have a Ph.D. in political science from Yale University, where my graduate
training included courses in econometrics and statistics. My undergraduate degree is
from the University of California, San Diego, where I majored in political science and
minored in applied mathematics. My curriculum vitae is attached to this report as
Exhibit 1.
Case: 3:15-cv-00324-jdp Document #: 71 Filed: 01/04/16 Page 3 of 48
3
All publications that I have authored and published in the past ten years appear
in my curriculum vitae. My articles have been published in the following peer-reviewed
journals: Journal of Politics, American Journal of Political Science, Election Law
Journal, Legislative Studies Quarterly, Presidential Studies Quarterly, American
Politics Research, Congress and the Presidency, Public Administration Review, PS:
Political Science and Politics, Richmond Law Review, the UCLA Pacific Basin Law
Journal, and the University of Utah Law Review. My work on campaign finance has
been published in Legislative Studies Quarterly, Regulation, PS: Political Science and
Politics, Richmond Law Review, the Democratic Audit of Australia, and an edited
volume on electoral competitiveness published by the Brookings Institution Press. My
research on campaign finance has been cited by the Government Accountability Office
and by legislative research agencies in Connecticut and Wisconsin.
My work on election administration has been published in the Election Law
Journal, American Journal of Political Science, Public Administration Review, and
American Politics Research. I was part of a research group retained as consultants by
the Wisconsin Government Accountability Board to review its compliance with
federal mandates and reporting systems, and to survey local election officials
throughout the state. I serve on the Steering Committee of the Wisconsin Elections
Research Center, a unit with the UW-Madison College of Letters and Science. In 2012 I
was retained by the U.S. Department of Justice to analyze data and methods regarding
Florida’s efforts to identify and remove claimed ineligible noncitizens from the statewide
file of registered voters.
In the past eight years, I have testified as an expert witness in trial or deposition
Case: 3:15-cv-00324-jdp Document #: 71 Filed: 01/04/16 Page 4 of 48
4
in the following cases: Whitford et al. v. Nichol et al., No. 15-CV-421-bbc (W.D. Wis.
2015); Baldus et al. v. Brennan et al., 849 F. Supp. 2d 840 (E.D. Wis. 2012); Milwaukee
Branch of the NAACP et al. v. Walker et al., 2014 WI 98, 357 Wis. 2d 469, 851 N.W.2d
262; McComish et al. v. Brewer et al., No. CV-08-1550, 2010 WL 2292213 (D. Ariz.
June 23, 2010); and Kenosha County v. City of Kenosha, No. 11-CV-1813 (Kenosha
County Circuit Court, Kenosha, WI, 2011).
I am being compensated at a rate of $300 per hour.
III. Opinions
A. Summary
My opinions may be summarized as follows:
(1) An individual level analysis of the probability of voting in 2014 shows that registrants who are Black, Hispanic, reside in student wards, or do not possess an ID were significantly less likely than other voters to vote in 2014, even if they had voted in earlier elections. A control analysis of voting in the 2010 election, prior to the voting and registration changes at issue in this case, showed either no effects or much smaller effects.
(2) In November 2014, approximately 8.4% of registered voters did not have a Wisconsin driver’s license or DOT photo ID. The percentage of registrants who did not possess a license or DOT photo ID was higher for African Americans (9.8%), Hispanics (11.1%), and people living in student wards (21.1%).
(3) While the photo ID requirement was not in effect for the 2014 election, a majority of voters, and large majorities of minority and young voters, believed that it was. Turnout rates were significantly lower among registrants who did not possess a license or ID, with the relationship four times larger than it was in 2010, before Act 23 was passed.
(4) In 2010, the last statewide election in which late weekend registration was permitted in the 3 days before an election, significantly more people registered over this period in municipalities with higher African American population concentrations. This relationship holds even after removing Milwaukee from the analysis, and controlling for municipality size.
Case: 3:15-cv-00324-jdp Document #: 71 Filed: 01/04/16 Page 5 of 48

5
(5) Turnout in student wards (described below, defined as wards that include or are nearby colleges and universities, and which have large concentrations of 18-24 year old registrants) dropped significantly between 2010 and 2014.
(6) The elimination of corroboration to verify residence has cut off a form of proof of residence that could affect thousands of otherwise eligible voters. According to GAB communications, in October 2012 there were 19,464 current active voters who had registered with a corroborating witness.
I conclude that the changes to voting and registration enacted since 2011 impose
substantial burdens on voters when registering or casting a ballot, either in the form of
additional documentation required, elimination of “safety valve” procedures for eligible
voters who do not possess the qualifying documents, or narrowing or eliminating
opportunities to register or cast ballots. As the following analysis will show, those
burdens have the greatest effect on identifiable population subgroups, particularly racial
minorities, young voters, students, and registrants without ID, depressing their turnout by
making it significantly harder to register and vote.
The negative impact is largest in 2014 and almost entirely absent in 2010, which
is strong – even conclusive – evidence that the effects are the result of changes to voting
and registration practices enacted after the 2010 elections.
IV. Analysis of the SVRS
The Statewide Voter Registration System is a “single, uniform, centralized and
computerized statewide voter registration database.” 1 It is the basic administrative
system used by the Government Accountably Board and municipal clerks to track and
manage registered voters, locate registrants in the correct ward and political jurisdiction,
insure eligibility, and administer elections. Data in the system are cross-referenced with
data from other state agencies, including the DOT, the Department of Corrections, and
1 http://www.gab.wi.gov/clerks/svrs/introduction; accessed November 24, 2015.
Case: 3:15-cv-00324-jdp Document #: 71 Filed: 01/04/16 Page 6 of 48
6
the Department of Health Services, to verify identity and flag (or remove) ineligible
voters. The SVRS is not a static system, but rather changes continuously as registrants
are added to or removed from the database.2
In this report, I will use the term “SVRS” to refer to a file of all registered voters
created on September 24, 2015. This file includes all publicly available fields, as well as
some confidential data (date of birth) which I used in the course of my analysis.
Each record in the SVRS is a single individual, identified by name, address, date
of birth, the last four digits of a social security number, and WI driver’s license or DOT
ID number if a registrant used that document as proof of identity. It includes the date of
registration, registration method, voter status, and a “voter history,” which records
whether a registrant voted in each election since February 2006.
The SVRS file contains 3,380,338 records of active voters. A small number of
these records are duplicates, primarily the same individual who has registered and
reregistered over time (although others appear to be simple clerical errors).3 After I
performed the matching process described below, I removed 12,668 voters who
registered after the November 2014 election and 244 registrants under age 18 in
November 2014, leaving 3,367,426 registrants eligible to vote on November 4, 2014.
A. Data Accuracy
All large databases have errors (Herzog, Scheuren and Winkler 2007, chapter 3)
2 Registrants can be removed (or set to inactive) because of death, felony conviction, or through the four-year record maintenance process when a registrant has failed to vote in any election over a four-year period and does not respond to a mail notification. 3 I identified duplicate records as those with identical names, addresses, and dates of birth. There are 248 records duplicated once, two duplicated twice, and one duplicated three times. Even if these are different people, removing them will not affect any subsequent analysis since they constituted only .007% of records in the SVRS.
Case: 3:15-cv-00324-jdp Document #: 71 Filed: 01/04/16 Page 7 of 48
7
either because of data entry or processing errors. Since over 1,600 separate individuals or
offices can enter data in the SVRS, and most registration information has been manually
entered using paper forms submitted by voters, errors are inevitable.4 As I expected, I
found a number of data entry errors, invalid fields, or missing data. Most of the errors
have no effect on any subsequent analysis, either because I did not use that particular
field, was able to correct the mistakes, or because the numbers were so small as to have
no material effect.
Some identifiable issues:
Some clerks did not distinguish between voting at the polls (AP) or absentee (ABS), using instead an X to signify that someone voted.
There were several municipalities where clerks did not enter voting history for the
June 2012 recall election.
1,818 registrants do not have a zip code listed, and 33 have obviously incorrect zip codes (fewer than 5 digits, letters, listed as “WI,” or located outside of Wisconsin).
5,325 registrants are recorded as having the driver’s license number
“W1111111111111,” and several dozen more appear with repeated numbers such as “D1111111111111,” “S1111111111111,” or “A1234567891011.”
121 registrants are coded as having a date of birth in the 19th century (1899 or
earlier).
10,706 registrants are coded as having a date of birth of 1/1/00, which would mean that they were either 15 or 115 as of September 2015, which is clearly a default entry rather than an accurate recording of a date of birth. This is nearly ten times the total number of centenarians recorded in Wisconsin as of the 2010 Census (1,179),5 and almost 100 times the average number of individuals
4 Wisconsin has had a “click and mail” option for voter registration since August 2012 (http://www.gab.wi.gov/node/2443), which allows for voters to submit their information electronically. But it is not widely used, is available only for registrants who possess a Wisconsin driver’s license or ID, and is not a fully online registration system (clerks must still manually enter data from the submitted forms). 5 United States Census Bureau. 2012. Centenarians 2010: 2010 Census Special Report. C2010SR-03, table 2, p. 8.
Case: 3:15-cv-00324-jdp Document #: 71 Filed: 01/04/16 Page 8 of 48
8
recorded as having any other date of birth (107). 669 of these individuals matched to the DOT data using driver’s license numbers.
182,515 registrants are coded as registering on 1/1/18; this error occurs in every
county in Wisconsin. This cannot be correct, and appears to be a default entry, since 99% of registrants with that registration date were in the SVRS as of 2010, and 84% since the beginning of the SVRS system in 2006.
These errors do not undermine the ability to draw accurate inferences from the
SVRS, as they constitute a tiny fraction of the overall data (the 1/1/00 birthdate
represents only 0.3% of all SVRS records, and even the 1/1/18 registration date affects
only 5% of records and I am able to correct for that using voter histories to identify when
a registrant entered in the SVRS).
B. Obtaining Voter Race by Linking to Wisconsin Department of Transportation Data
To evaluate any disparate impact of voting changes on the basis of race, I require
data on the race of each registrant. The SVRS does not include that information.
The primary method I used to obtain that information was matching (or linking)
the SVRS with a file from the DOT of driver’s licenses and DOT photo IDs. In the DOT
file, each individual is identified by name, address, date of birth, and a unique customer
number assigned by DOT that remains the same if an individual changes his or her name
or switches from a DOT photo ID to a driver’s license (or vice versa). The key
information in this file is the self-identified race; matching this file to the SVRS will
allow me to investigate the effect of voting changes on different demographic groups.
The matching process involves identifying individuals who are in both the DOT and
SVRS file, and combining their information into a single record.
Matching the SVRS records with DOT data does two things: First, it provides
race identifiers for everyone in the SVRS who has a driver’s license or state ID. Second,
Case: 3:15-cv-00324-jdp Document #: 71 Filed: 01/04/16 Page 9 of 48
9
knowing how many registered voters do not have a WI license or DOT photo ID is
important information, as it affects the ability of these registrants to cast a ballot under
Act 23.
Matching records between two large files is not an entirely exact process; all
large-scale matching methods involve a nonzero error. The two types of errors are false
matches and false non-matches. A false match occurs when a person in the SVRS is
matched with a different individual in the DOT file, as might occur when there are
multiple people with the same name and birthdate. A false non-match occurs when the
same individual appears in both files but it is not possible to accurately link them,
because of errors in the data in one or both files. Here, we would be incorrectly inferring
that a person in the SVRS does not appear in the DOT file as possessing a driver’s license
or ID.
Because the only information I am adding from the DOT field is race, I performed
all matching as a “many to one” match, which allowed a single record from the DOT data
to link to multiple records in the SVRS. An analysis of race in the DOT files showed that
individuals with the same name and date of birth have the same race in over 90% of
cases. Even if I am not linking to the correct individual across the two files, I am almost
certain to assign the correct race for the individual in the SVRS file. Moreover, there are
few duplicates in the SVRS (530 on the quadruplet of last name, first name, date of birth,
and zip code [0.016%], and 8,840 on the triplet of last name, first name, and date of birth
[0.26%]). Even if every duplicated record has the wrong race (unlikely, since over 90%
of the duplicated records in the DOT data have the same race identifier), I will still be
accurate in 99.74% of the uniquely identified records.
Case: 3:15-cv-00324-jdp Document #: 71 Filed: 01/04/16 Page 10 of 48
10
The merging (or linking) was performed via the following process:
1. Removing Duplicated Records from the DOT Data
The full DOT database includes all individuals who possess a driver’s license or
DOT photo ID, and has 5,056,311 records. Prior to merging the file with the SVRS, I
removed all individuals who are deceased (132,864), under the age of the youngest
person in the SVRS (121,195), and possess both a license and DOT photo ID, or appear
more than once with the same license or ID number (188,922).
After removing these records, I then eliminated duplicated records with the same
first name, last name, date of birth, and zip code. This resulted in only 167 deletions,
leaving 4,613,163 unique records in the DOT data.
2. Conforming fields in DOT and SVRS data
Names and identification numbers are entered and recorded differently in the two
datasets. Some of the differences involve how spaces and special characters (particularly
dashes and single quotes) are recorded. Suffixes (Jr., Sr., III, etc.) are part of the last
name in the DOT file, but are a separate field in the SVRS. The DOT data include only a
middle initial, while the SVRS has middle names or middle initials, depending on what
the registrant entered. Driver’s license numbers are recorded with dashes in the SVRS,
but without dashes in the DOT file. ZIP codes are recorded as a 9-digit ZIP+4 code in
the SVRS, but as a 5-digit code in the DOT files.
To conform the two data sets, I removed all special characters and spaces from
the name and ID fields in both files, added suffixes to the SVRS last name field, and
extracted the first 5 digits from the ZIP field in the SVRS. I converted all dates of birth
Case: 3:15-cv-00324-jdp Document #: 71 Filed: 01/04/16 Page 11 of 48
11
to a numerical equivalent using the “date” command in Stata.6 To make the ZIP code
fields consistent, I extracted the first 5 digits of the ZIP code field in the SVRS.
3. Matching on Driver’s License and ID numbers
The first matching used the unique driver’s license/ID field in both the SVRS and
DOT files. I performed an exact match on this field, which successfully linked 2,281,264
records across the files.7 In this and all subsequent matching passes, I removed linked
records from the DOT file to insure I would not link the same record based on different
matching criteria.
4. Matching on First Name, Last Name, Date of Birth, and ZIP Code
After the first match, there were 1,099,074 unlinked SVRS records remaining. In
a second pass I performed an exact match on the quadruplet of first name, last name, date
of birth, and ZIP code. This linked another 631,444 records.
5. Matching on First Name, Last Name, and Date of Birth
After the first two passes, I am left with 467,630 unlinked records in the SVRS.
In a third pass, I performed an exact match on name and date of birth.8 This linked an
additional 184,284 records.
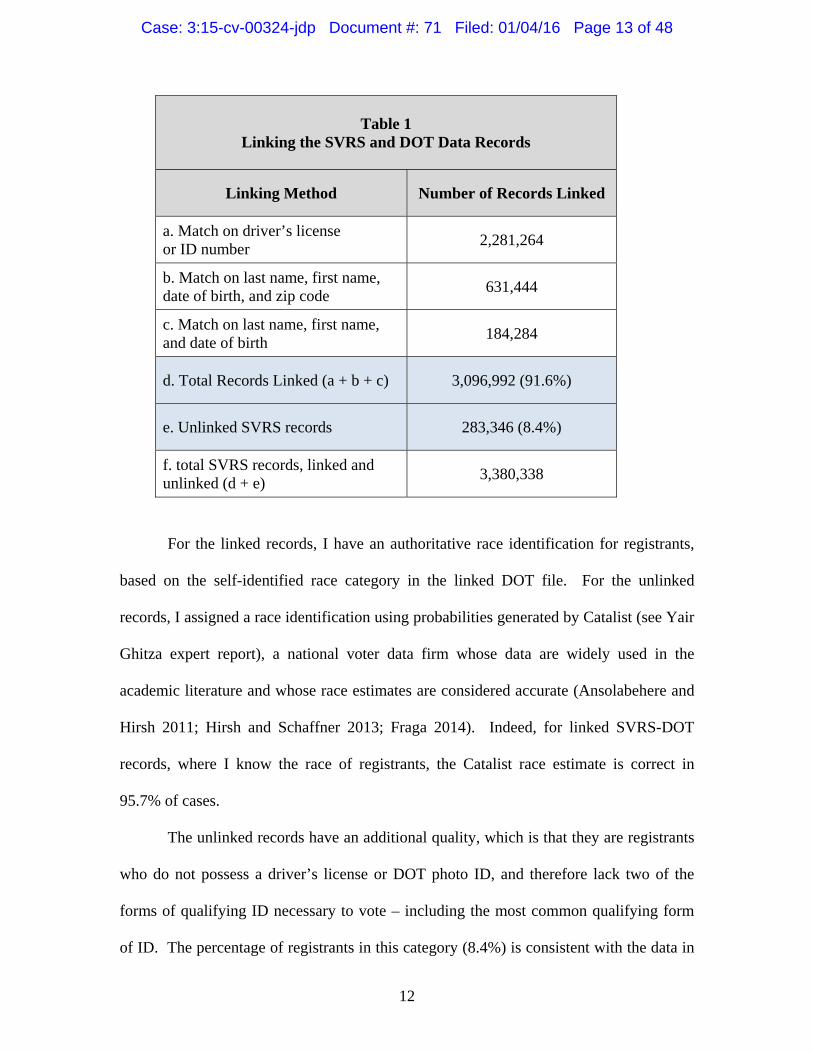
6. Results
At the end of the linking process, I have a file consisting of the following SVRS
records (out of 3,380,338 records):
6 This command converts a date expressed as a string (in a “month/day/year” format in both the SVRS and DOT data) to an integer stored as the number of days since January 1, 1960. Dates after this default are positive, and those before are negative. The command is not affected by inconsistencies in how dates are entered. 7 Exact matching is commonly used to link voter registration and driver’s license databases in both the academic literature and expert testimony (Stewart 2012, 2013). 8 There are exactly 1,000 duplicate DOT records on this triplet, but they have the same race 90% of the time (900/1,000).
Case: 3:15-cv-00324-jdp Document #: 71 Filed: 01/04/16 Page 12 of 48
12
Table 1 Linking the SVRS and DOT Data Records
Linking Method Number of Records Linked
a. Match on driver’s license or ID number
2,281,264
b. Match on last name, first name, date of birth, and zip code
631,444
c. Match on last name, first name, and date of birth
184,284
d. Total Records Linked (a + b + c) 3,096,992 (91.6%)
e. Unlinked SVRS records 283,346 (8.4%)
f. total SVRS records, linked and unlinked (d + e)
3,380,338
For the linked records, I have an authoritative race identification for registrants,
based on the self-identified race category in the linked DOT file. For the unlinked
records, I assigned a race identification using probabilities generated by Catalist (see Yair
Ghitza expert report), a national voter data firm whose data are widely used in the
academic literature and whose race estimates are considered accurate (Ansolabehere and
Hirsh 2011; Hirsh and Schaffner 2013; Fraga 2014). Indeed, for linked SVRS-DOT
records, where I know the race of registrants, the Catalist race estimate is correct in
95.7% of cases.
The unlinked records have an additional quality, which is that they are registrants
who do not possess a driver’s license or DOT photo ID, and therefore lack two of the
forms of qualifying ID necessary to vote – including the most common qualifying form
of ID. The percentage of registrants in this category (8.4%) is consistent with the data in
Case: 3:15-cv-00324-jdp Document #: 71 Filed: 01/04/16 Page 13 of 48
13
earlier analysis of the Wisconsin SVRS – the district court in Frank v. Walker, 17 F.
Supp. 3d 837, 854 (E.D. Wis. 2014), found that approximately 300,000 or 9% of
registered voters lacked a qualifying ID – as well as the results of similar linking analysis
in other states (Stewart 2013).
All subsequent analysis uses this file: the SVRS with voter history, with the race
of each registrant, after removal of those who registered after the date of the 2014
election or who were under age 18 on that day.
V. Results
With the linked SVRS and DOT data, I have an authoritative record of all
registered voters (who are, by definition, eligible to vote), along with their age and race,
their address (including ward and municipality), voting history, and whether they possess
a Wisconsin driver’s license or DOT-issued photo ID. I can use these data to analyze the
impact voting and registration changes have had on specific populations.
Changes in voting laws and procedures “almost invariably affect some types of
voters more than others” (Herron and Smith 2012, 332). The ability of a prospective
voter to overcome the burdens imposed by restrictive registration or voting rules depends
on socioeconomic status, race, age, and a number of other discrete factors, such as
whether an eligible voter possesses one of the forms of identification now required to cast
a vote. My aim here is not to discuss the academic literature in detail, but to assess the
actual effects of recently imposed restrictions.
A. Effects on Students
The new registration and voting requirements are likely to have a disproportionate
effect on student populations, for three reasons. First, this population is
Case: 3:15-cv-00324-jdp Document #: 71 Filed: 01/04/16 Page 14 of 48
14
disproportionately young, falling into the age brackets less likely to turn out than older
voters, and therefore less likely to overcome barriers to voting. Second, this population is
less likely to possess the identification documents required to comply with the photo ID
requirements of Act 23. A significant number of students are from out of state9 and are
less likely than other voters to possess a WI license or DOT photo ID. 19.8% of residents
of student wards (compared to 7.2% of residents of non-student wards) do not link to the
DOT file, indicating that they do not possess a WI driver’s license or DOT photo ID.
Third, students who wish to use a qualifying college or university ID as their photo ID
are required to bring proof of enrollment.
Because I am interested in the effect of voting restrictions on students, I identified
registrants who reside in wards with a large percentage of students. I began by
identifying all nonprofit 4-year or graduate institutions with enrollment over 500, using
data from the Carnegie Foundation for the Advancement of Teaching, Carnegie
Classifications Data File, February 2012.10 This includes all 4-year campuses of the
University of Wisconsin system and 21 of 24 members of the Wisconsin Association of
Independent Colleges and Universities.
I located each institution by mapping its main street address onto GIS software,
and counted as a student ward those that included university or college facilities. I then
identified wards that were either contiguous to the campuses, or nearby wards where
9 In 2014-2015, there were 36,034 students in the UW system who were from other U.S. states or territories, or who were citizens living abroad (UW System Single Year Headcount Reports, 2014-2015 Headcount by Institution and Geographic Origin, https://www.wisconsin.edu/reports-statistics/download/student_statistics_/2014-15/pdf/r_ b104_tot.pdf). Another 20,000 non-Wisconsin students are enrolled in Wisconsin’s private colleges and universities (Wisconsin Association of Independent Colleges and Universities, http://www.waicu.org/research/waicu-facts). 10 http://carnegieclassifications.iu.edu/.
Case: 3:15-cv-00324-jdp Document #: 71 Filed: 01/04/16 Page 15 of 48
15
registered 18 to 24 year olds were at least 10% of the total registered ward population.
The percentages range from a low of 7.1% in Wauwatosa Ward 7 (Medical College of
Wisconsin) to 98.7% in Madison Ward 59 (UW-Madison). The average percentage of
18-24 year olds in identified student wards is 48.6%, compared to 7.1% in all other
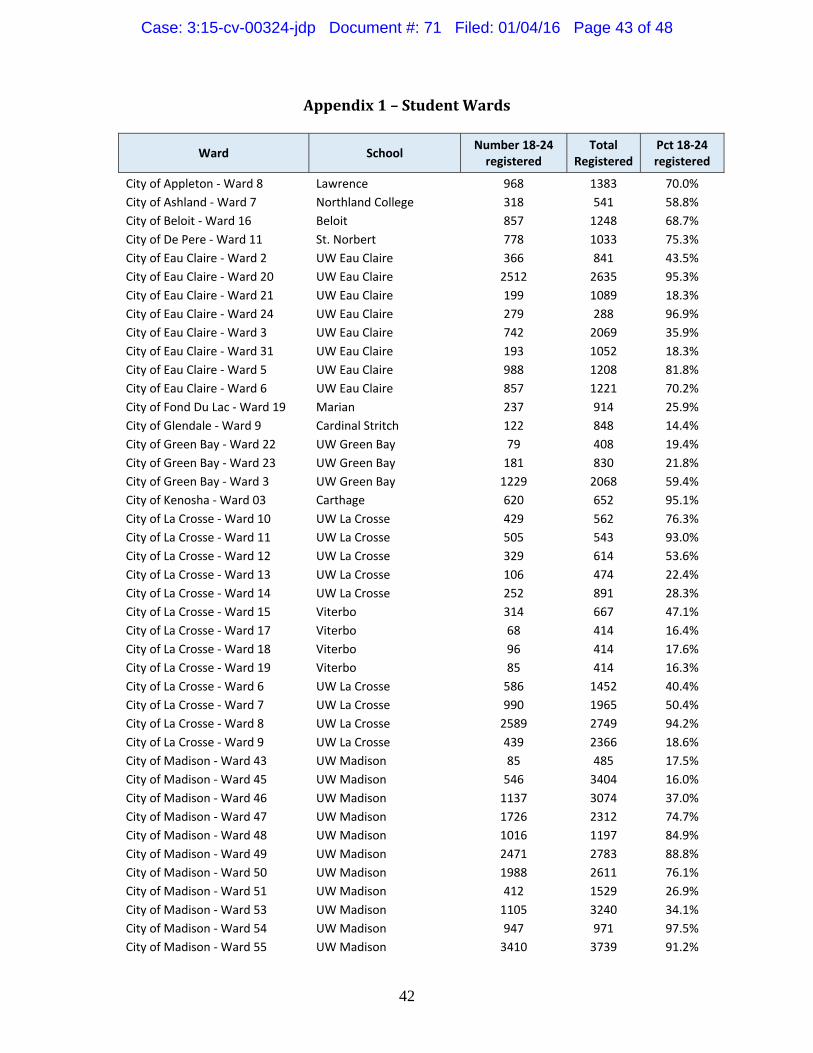
wards. The list of student wards is in Appendix 1.
My analysis is very conservative, and is likely to significantly understate the true
effect on students, since I did not include the Wisconsin Technical College system, which
is more likely to have part-time students who do not live on campus and are more widely
distributed over a larger geographic area than students at 4-year schools: there were
362,119 students enrolled in the system in the 2011-2012 academic year, constituting
78,228 Full Time Equivalent students (Wisconsin Legislative Technology Services
Bureau 2013, 4).
B. Effects on Registrants Who do Not Possess ID
Wisconsin Act 23 requires voters to show an approved form of photo
identification before being permitted to cast a ballot or when returning an absentee
ballot.11 Wisconsin’s law is among the strictest in the country, with a limited number of
qualifying IDs, no exception for voters who do not have or were unable to obtain an ID,
and a requirement that mailed absentee ballots include an image of a photo ID.12
11 Acceptable forms of ID are a Wisconsin driver’s license or DOT photo ID, a U.S. passport, a military ID, a naturalization certificate issued no more than 2 years earlier, a tribal ID of a federally recognized Indian tribe, or a student identification card that has an expiration date and a signature. 12 The only exceptions to the ID requirement in Wisconsin are that voters who have a religious objection to being photographed, and absentee voters who are indefinitely confined, do not need to provide an ID in order to vote.
Case: 3:15-cv-00324-jdp Document #: 71 Filed: 01/04/16 Page 16 of 48
16
The National Conference on State Legislatures classifies eight states as having
“strict photo-ID” laws: Georgia, Indiana, Kansas, Mississippi, Tennessee, Texas,
Virginia, and Wisconsin.13 Unlike Wisconsin, all of these other states permit a larger
number of qualified ID types, and none of these states apply the ID requirements to mail-
in absentee votes. In addition, Indiana and Texas have an indigency or other affidavit
exception for voters who do not have an ID.
Most previous analyses of the effect of voter ID laws, using aggregate turnout
data, have proven inconclusive, partly because they were conducted when few states had
ID requirements, and partly because it was difficult to accurately classify the different
types of ID laws (the most common modeling assumption treated ID laws as the same, or
placed them into a small number of categories that obscured important differences among
them; see Erickson and Minnite 2009). A 2014 study by the Government Accountability
Office, however, took advantage of both additional data and quasi-experimental
techniques to compare turnout in ID and similar non-ID states. The GAO concluded that
ID laws reduced turnout by a statistically significant margin of 1.9-3.2 percentage points
(GAO 2014, 49). The GAO also concluded that the decrease in turnout was between 1.5-
3.7 percentage points larger among African Americans than among white voters (GAO
2014, 52). Finally, the GAO found that voter ID had a large depressive effect on turnout
among younger voters and those who had been registered for less than 1 year (GAO
2014, 54).
13 The defining characteristic of a strict law is a requirement that all in-person voters show a photo ID, and permitting non-ID holders to cast a provisional ballot and produce their ID within several days after the election in order to have that ballot counted (http://www.ncsl.org/research/elections-and-campaigns/voter-id.aspx).
Case: 3:15-cv-00324-jdp Document #: 71 Filed: 01/04/16 Page 17 of 48
17
The Wisconsin voter ID law was challenged in both state and federal court, and
has only been in effect for one primary election involving only local races (in February
2012). In the state courts, the law was temporarily enjoined by the Dane County Circuit
Court in March 2012, which permanently enjoined the law in July 2012 after a trial. The
Wisconsin Supreme Court overturned that injunction and upheld the law in July 2014, but
only after requiring significant changes in how the law is interpreted and administered in
order to avoid having it function as a “de facto poll tax.”14 In the federal courts, the law
was permanently enjoined by the U.S. District Court in Milwaukee in April 2014 after a
trial.15 That injunction was stayed by the Seventh Circuit on September 12, 2014, which
allowed the law to go back into effect,16 and the injunction was then reversed by the
Seventh Circuit on October 6, 2014.17 The U.S. Supreme Court vacated the Seventh
Circuit’s stay of the injunction on October 9, 2014, which resulted in the injunction going
back into effect for the 2014 election.18 The Supreme Court later denied review of the
Seventh Circuit’s reversal of the injunction, which allowed the law to go back into effect
once again.19 Thus, in the three months before the 2014 election the law was blocked,
amended, reinstated, and then blocked again within weeks of election day.
One consequence of this flurry of legal activity and conflicting decisions was that
voters were confused about whether the law was in effect or not. In October, after the
Supreme Court had blocked the law from taking effect, the Marquette Poll found that a
14 Milwaukee Branch of NAACP v. Walker, 2014 WI 98 ¶ 50, 357 Wis. 2d 469, 851 N.W.2d 262. 15 Frank v. Walker, 17 F. Supp. 3d 837 (E.D. Wis. 2014). 16 Frank v. Walker, 766 F.3d 755 (7th Cir. 2014). 17 Frank v. Walker, 768 F.3d 744 (7th Cir. 2014). 18 Frank v. Walker, 135 S. Ct. 7 (2014). 19 Frank v. Walker, 135 S. Ct. 1551 (2015).
Case: 3:15-cv-00324-jdp Document #: 71 Filed: 01/04/16 Page 18 of 48
18
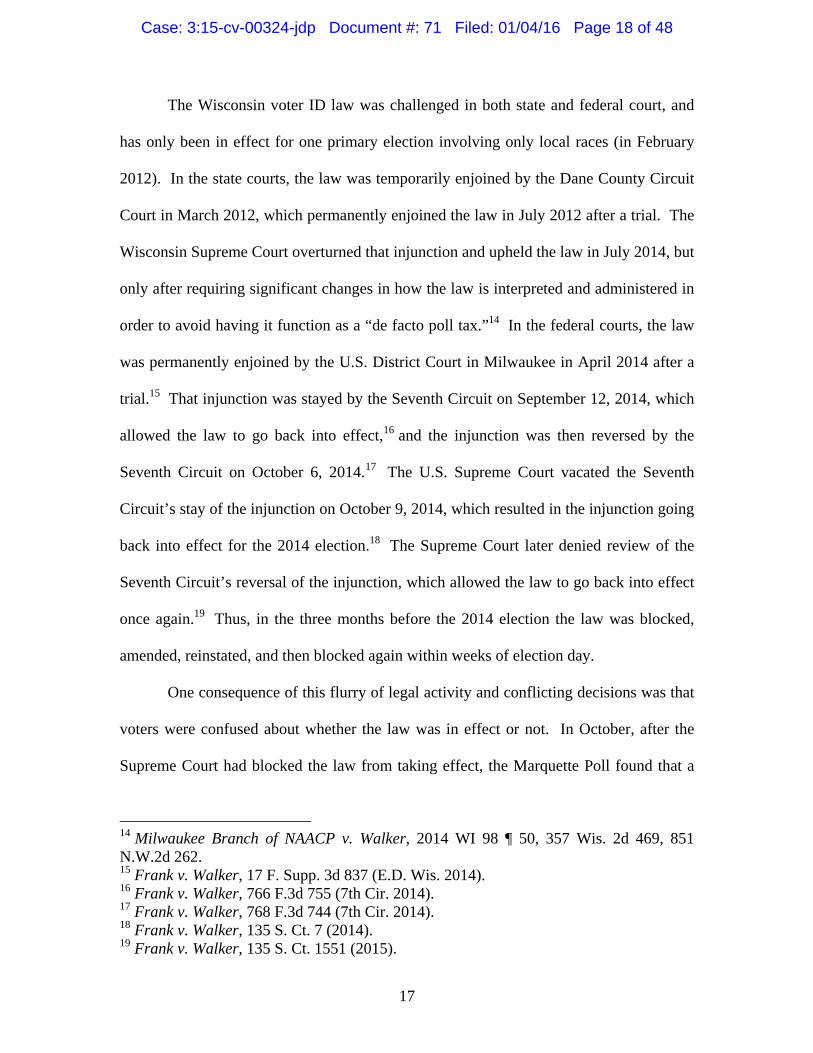
majority of registered voters believed that the law was in effect, and that they would have
to show a photo ID in order to vote:20
Table 2 – Voter Knowledge of Voter ID Requirements, October 2014
Q 25. “Will Voters be required to present a government issued photo ID in order vote this November or will they not have to show a photo ID to vote
in this election?
Registered
Voters White Black Hispanic Age 18-29
Required to show photo ID
53.4% 53.0% 55.1% 74.1% 63.4%
Not required to show photo ID
39.9% 41.4% 43.8% 14.6% 30.9%
Don’t Know/ No Answer
6.7% 5.6% 1.1% 11.3% 5.7%
As Table 2 shows, while 53.4% of all registered voters believed they would have to show
a photo ID in order to vote, the percentage was slightly higher among Black (55.1%), and
much higher among Hispanic (74.1%) and young (63.4%), registrants.
In addition, the data below show that 8.4% of registered voters in the SVRS do
not possess a Wisconsin driver’s license or DOT photo ID, and the percentages are,
again, higher among Blacks (9.8% do not possess), Hispanics (11.1%) and registrants
who reside in a student ward (21.4%). The ID possession rates among minorities are
consistent with what other studies have found (Stewart 2013).
20 Marquette Poll, October 9-12, 2014, Results for Registered Voters, Q25. Topline instrument available at https://law.marquette.edu/poll/wp-content/uploads/2014/10/MLS P26ToplinesRV.pdf (accessed November 20, 2015). Age and race crosstabs downloaded from https://law.marquette.edu/poll/results-data/.
Case: 3:15-cv-00324-jdp Document #: 71 Filed: 01/04/16 Page 19 of 48

19
Table 3 Percentage of Registered Voters Who do Not Possess a Wisconsin
Driver’s License or DOT Photo ID, November 2014
Number Not
Possessing ID Percent of Group Not
Possessing ID
All Registered Voters 282,015 8.4%
White 251,105 8.3%
Black 19,462 9.8%
Hispanic 6,779 11.1%
Reside in Student Ward 33,289 21.4%
A voter without an ID who believed one was necessary to vote would be less
likely to present at the polls on election day. Because a majority of Wisconsin voters
believed the voter ID law to be in effect, 2014 serves as a trial of what effect a lack of ID
will have on turnout.
C. Summary Statistics
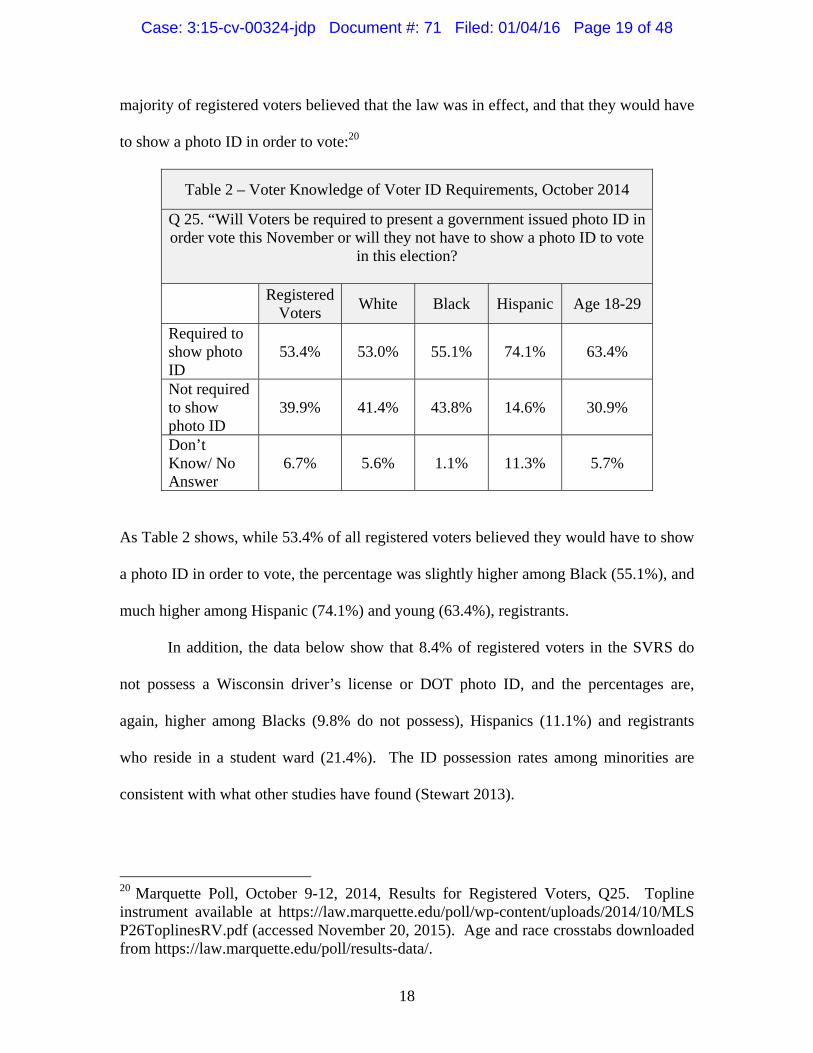
Table 4 shows the number of registrants in the SVRS as of November 2014, June
2012 (the month of the recall), and November 2010, all calculated from the SVRS in
September 2015.
Case: 3:15-cv-00324-jdp Document #: 71 Filed: 01/04/16 Page 20 of 48
20
Table 4 Summary Counts of SVRS Registrants on Election Day, and Comparison
to GAB Counts
Election SVRS
Registration Count
GAB Registration
Totals21
Difference (%)
2014 3,367,42622 3,402,858 35,422 (1%)
Recall 2,965,132 3,337,939 372,807 (11.2%)
2010 2,714,237 3,450,847 736,610 (21.3%)
Table 5 shows the number of votes tabulated from the SVRS and the official vote
count from the Government Accountability Board.
Table 5 Summary of SVRS Vote Counts and Comparison to Official GAB
Canvass
Election SVRS Vote
Count GAB Vote
Totals23 Difference (%)
2014 2,401,451 2,422,040 20,797 (0.9%)
Recall 2,405,516 2,516,065 110,549 (4.4%)
2010 2,004,823 2,185,017 180,194 (8.2%)
The differences between the SVRS and GAB counts reflect the removal of voters
as well as possible data entry errors by clerks who failed to enter vote histories into the
SVRS. The increasing gap over time indicates that as one goes further back into the 21 Registration statistics taken from GAB-190F: Election Voting and Registration Statistics Report, November 2014, June 2012, and November 2010. http://www.gab.wi. gov/elections-voting/statistics. 22 I have removed all registrations that occurred after the 2014 election (12,688) and all registrants who were under age 18 on election day in 2014 (244). 23 Totals for 2014, 2012, and 2010 taken from http://www.gab.wi.gov/elections-voting/statistics. Recall totals are the votes recorded for Governor in the GAB Canvass Reporting System, taken from http://www.gab.wi.gov/elections-voting/results/2012/ recall-election.
Case: 3:15-cv-00324-jdp Document #: 71 Filed: 01/04/16 Page 21 of 48
21
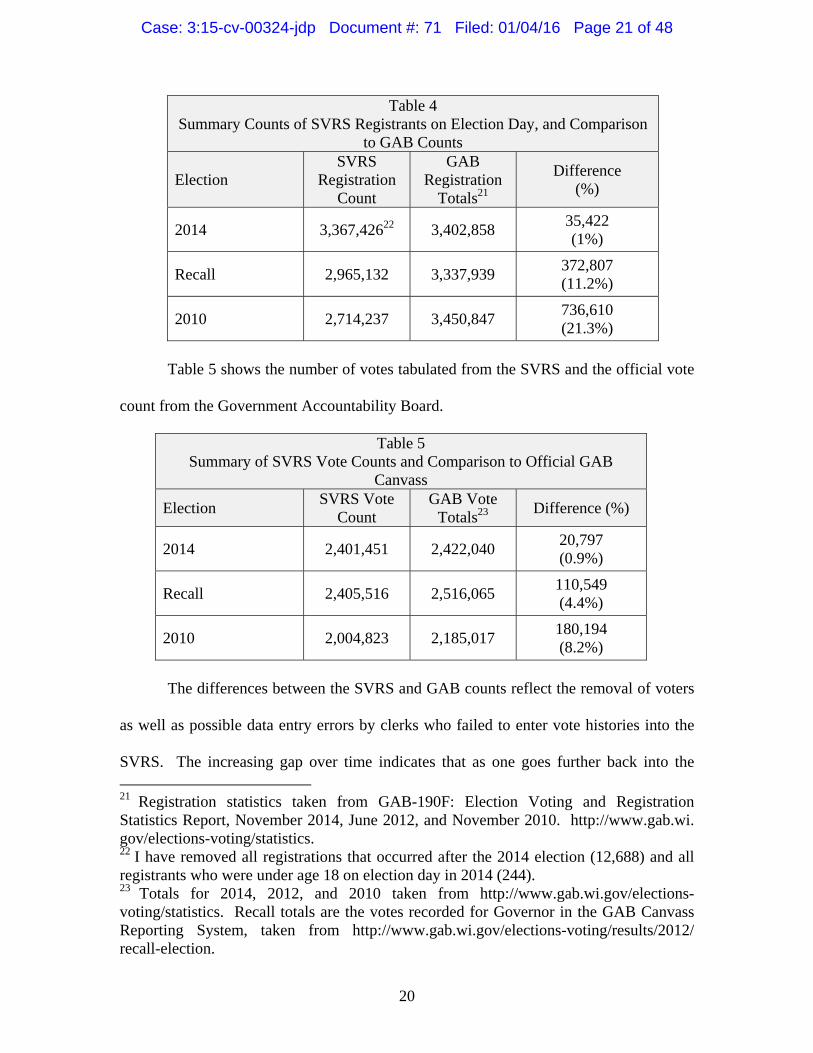
voter histories, more people who voted in earlier elections dropped out of the SVRS,
either because of death, moving, or removal via the HAVA voter-roll maintenance
provisions. The small differences in 2014 – which show that the SVRS captured 99.1%
of all votes and 99% of all registrants – allow me to draw meaningful inferences from the
voters in the system.
Table 6 Percentage of Registrations in SVRS as of Election Date who Voted
Race 2014 Recall 2010 Recall-
2014 Drop Off
2010-2014 Drop Off
White 72.8% 81.8% 74.9% -9.1% -2.1%
Black 62.2% 77.7% 65.5% -15.5% -3.4%
Hispanic 49.6% 66.6% 53.9% -17.1% -4.3%
Other24 51.7% 66.6% 57.1% -14.9% -5.4%
Reside in Student Ward
54.5% 75.4% 72.7% -20.9% -18.2%
Total 71.3% 81.1% 73.9% -9.8% -2.5%
GAB Turnout 71.2% 75.4% 62.3%
The SVRS captures a snapshot of registrants at one point in time (September
2015). Because people register more or less continually, any turnout statistics must
account for the fact that people in the SVRS in 2015 might not have been in the system in
previous years. Any calculation that simply divides, for example, the number of people
in the SVRS who voted in 2012 with the number of people in the SVRS in 2015 will
significantly underestimate turnout percentages, because the numerator includes only
people who were in the system as of that election and have remained in the system, while
24 Asian, Native American, or unknown.
Case: 3:15-cv-00324-jdp Document #: 71 Filed: 01/04/16 Page 22 of 48
22
the denominator includes everyone who registered after the 2012 election and therefore
by definition did not (and could not) vote in that election.
Table 6 displays overall turnout of different racial groups, as a percentage of the
total numbers of each racial group in the SVRS as of the date of the election. For 2010
and the recall, I removed all registrants who were not in the SVRS as of the dates of those
elections.25 As a point of comparison, I also included an actual turnout figure for each
election, calculated using the registrant numbers and votes from GAB-190 forms.26
For 2014, the SVRS and GAB total turnout percentages are almost identical,
which is expected; any residual errors would be the result of individuals voting in 2014
and then dropping out of the SVRS afterwards, and errors in recording the voter histories.
The overall turnout percentage of registrants in the SVRS is 73.9% in 2010, 81.1% in the
recall, and 71.3% in 2014.27 The bump in the recall turnout is consistent with what the
actual GAB turnout figures show, and is likely in part the result of a gradual decline in
the number of registrants since the 2010 election, and the fact that the June recall took
place before mobilizing (and thus registration) for the 2012 presidential election had
25 For the 2014 election, I included all registrants who were in the SVRS as of that date, which includes the full data, since I have already removed registrants who entered after the election as well as individuals under age 18 on election day. 26 Municipalities and counties use the GAB-190-F to record and report federal election statistics and election administration data to the GAB (the equivalent form for non-federal elections is GAB-190-NF, which is required when a state office election or state referendum is held): the number of registrants prior to late registration; the number of late and election day registrations; the number and types of ballots cast; the number of provisional ballots; information on absentee and military overseas ballots; the disposition of ballots (counted, rejected, returned); and information on the number and ages of election inspectors and whether they worked in shifts. 27 Turnout figures for each election are for registrants who are in the SVRS on the date of the election.
Case: 3:15-cv-00324-jdp Document #: 71 Filed: 01/04/16 Page 23 of 48
23
intensified. Based on GAB data, there were 112,908 fewer registrants in the recall
election than there were in 2010 (Table 4).
The relevant quantity in Table 6 is the net change in turnout from one election to
the next, particularly between 2010 (when none of the post-election voting changes were
in effect) and 2014 (when most of the changes had been implemented and a majority of
voters believed that the voter ID requirements were in effect). Between 2010 and 2014,
overall turnout (among voters in the SVRS on the date of each election) declined by 2.5
percentage points. But the decline was not uniform. Among white registrants, turnout
declined by 2.1%, while among Black and Hispanic registrants the declines were 3.4%
and 4.3%, respectively. Turnout among registrants who lived in student wards dropped
precipitously, from 72.7% in 2010 to 54.5% in 2014 (a drop of 18.2 percentage points).
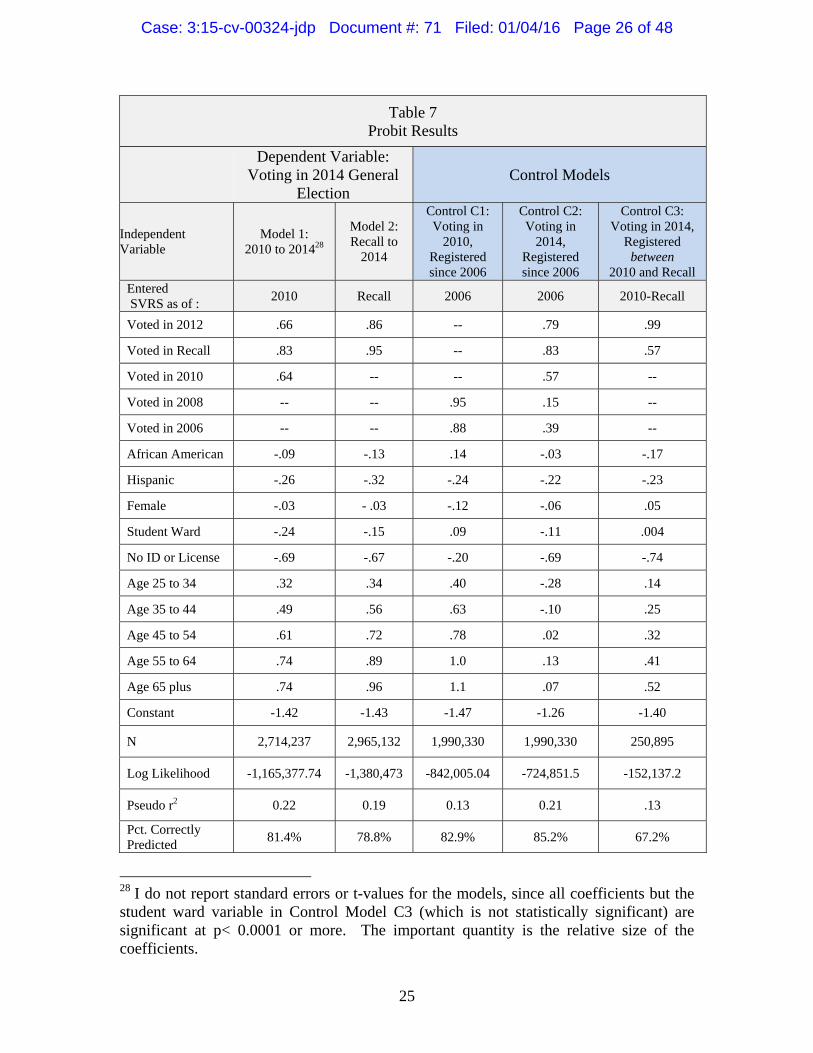
D. Individual Effects: Turnout
A more fully specified model can isolate the separate effects of key variables on
the probability of voting. I estimated two probit models:
Model 1 estimates a registrant’s probability of voting in the 2014 election, using voting history in the 2012 presidential election, the recall election, the 2010 election and a series of demographic variables. This gives me an overall estimate of changes that occurred between 2010, before the registration and voting changes were enacted, and 2014, when most of them were in place and a majority of voters believed that the voter ID law was in effect. This model captures all registrants who were in the SVRS as of the 2010 election (that is, it excludes everyone who registered afterwards). Model 2 estimates a registrant’s probability of voting in the 2014 election, using voting history in the recall and the same demographic variables in Model 1. This gives me estimates of what might have changed between the recall (when some of the voting and registration changes were in effect) and 2014. This model captures all registrants who were in the SVRS as of the recall, and will include those who registered after the 2010 election.
Case: 3:15-cv-00324-jdp Document #: 71 Filed: 01/04/16 Page 24 of 48
24
I also estimated three control models:
Control Model C1 estimates a registrant’s probability of voting in the 2010 election, which took place before any of the post-election voting and registration changes took place, using voter history in 2006 and 2008 and the same demographic variables as the models above. This will show the effects of the variables prior to any changes, and can serve as a point of comparison. Control Model C2 estimates a registrant’s probability of voting in the 2014 election, using only registrants who have been in the SVRS since 2006, and adding vote histories for 2010 and 2008. This will indicate whether the effects in Models 1 and 2 are the result of churn in the SVRS (additions and dropouts) over time, and provides a point of comparison with Control Model C1 since I am using the same population of registrants. Control Model C3 estimates a registrant’s probability of voting in 2014 using only registrants who entered the system after the 2010 election but on or before the recall. Unlike Control Models C1 and C2, this control will capture only registrants who entered the SVRS in a specific window, and will provide an additional check on the effect of SVRS churn.
The full model specifications are in Appendix 2.
The models and controls provide estimates for two separate elections and five
separate populations of registrants, distinguished by when they entered the SVRS: (1)
2014 voting behavior estimated for individuals who have been in the SVRS since 2006;
(2) 2014 voting behavior estimated for individuals who registered on or before the June
2012 recall; (3) 2014 voting behavior estimated for individuals who registered on or
before the 2010 election; (4) 2010 voting behavior for individuals who had been in the
SVRS since 2006; and (5) 2014 voting behavior for individuals who registered after the
2010 election but on or before the date of the 2012 recall election.
Case: 3:15-cv-00324-jdp Document #: 71 Filed: 01/04/16 Page 25 of 48
25
Table 7 Probit Results
Dependent Variable:
Voting in 2014 General Election
Control Models
Independent Variable
Model 1: 2010 to 201428
Model 2: Recall to
2014
Control C1: Voting in
2010, Registered since 2006
Control C2: Voting in
2014, Registered since 2006
Control C3: Voting in 2014,
Registered between
2010 and Recall Entered SVRS as of :
2010 Recall 2006 2006 2010-Recall
Voted in 2012 .66 .86 -- .79 .99
Voted in Recall .83 .95 -- .83 .57
Voted in 2010 .64 -- -- .57 --
Voted in 2008 -- -- .95 .15 --
Voted in 2006 -- -- .88 .39 --
African American -.09 -.13 .14 -.03 -.17
Hispanic -.26 -.32 -.24 -.22 -.23
Female -.03 - .03 -.12 -.06 .05
Student Ward -.24 -.15 .09 -.11 .004
No ID or License -.69 -.67 -.20 -.69 -.74
Age 25 to 34 .32 .34 .40 -.28 .14
Age 35 to 44 .49 .56 .63 -.10 .25
Age 45 to 54 .61 .72 .78 .02 .32
Age 55 to 64 .74 .89 1.0 .13 .41
Age 65 plus .74 .96 1.1 .07 .52
Constant -1.42 -1.43 -1.47 -1.26 -1.40
N 2,714,237 2,965,132 1,990,330 1,990,330 250,895
Log Likelihood -1,165,377.74 -1,380,473 -842,005.04 -724,851.5 -152,137.2
Pseudo r2 0.22 0.19 0.13 0.21 .13
Pct. Correctly Predicted
81.4% 78.8% 82.9% 85.2% 67.2%
28 I do not report standard errors or t-values for the models, since all coefficients but the student ward variable in Control Model C3 (which is not statistically significant) are significant at p< 0.0001 or more. The important quantity is the relative size of the coefficients.
Case: 3:15-cv-00324-jdp Document #: 71 Filed: 01/04/16 Page 26 of 48
26
These models allow me to estimate the effect of different demographic
characteristics on vote probability, conditional upon whether someone voted in the
previous elections. The political science literature supports the conclusion that voting is a
learned habit, and that past turnout is a good predictor of future voting habits (Green and
Shachar 2000; Fowler 2006). The demographic variables capture the effects of well-
established voting covariates (age in particular), and the variables for race, ID possession,
or residence in a student ward will capture the marginal effects of voting restrictions on
these populations.
The coefficients are all in the expected direction, with the exception of the effect
of being female (but this effect is likely a consequence of the fact that I only have gender
information for registrants who linked to the DOT data; women and men with ID vote at
roughly the same rate). Prior voting behavior is a very strong determinant of voting in
2014, as is increasing age (Leighley and Nagler 1992).
The most important coefficients are those for race, residence in a student ward,
and possession of an ID. These coefficients are all negative, and show that minorities,
registrants who reside in student wards, and registrants without ID were significantly less
likely than other registrants to vote in 2014. All of these effects are consistent with the
expected consequences of changes in voting laws which have a disparate impact on
students, minorities, and those without IDs.
Probit is used for dependent variables that have values of 0 or 1. Because it is a
nonlinear method, the coefficients do not translate directly into probabilities (as would be
true for linear regression). To see the actual marginal effects, I must evaluate the
probabilities after fixing the values of other coefficients.
Case: 3:15-cv-00324-jdp Document #: 71 Filed: 01/04/16 Page 27 of 48

27
One way of doing this is to set all coefficients to their mean values; this gives the
marginal effect on what can be considered an “average” voter somewhere in the middle
of the cumulative voting probability distribution:
Table 8 Marginal Effects on an Individual Registrant’s
Probability of Voting
All Variables Set to Mean Values29
Election 2014 2014 2010 2014 2014
Variable Model 1
(2010-2014)
Model 2 (Recall-2014)
Control C1: (2006-2010)
Control C2: (2006-2014)
Control C3: Registration
between 2010 and Recall
Black -2.4% -3.9% 3.4% -0.07% -6.8%
Hispanic -7.1% -9.6% -6.0% -4.7% -9.3%
Student Ward
-6.7% -4.5% 2.1% -2.4% 0.2%
No ID -19.3% -20.4% -5.1% -15.1% -29.8%
Age 65 Plus
20.6% 29.0% 28.4% 1.5% 20.8%
Voted in 2012
18.4% 25.9% -- 17.4% 39.5%
Voted in Recall
23.1% 28.8% -- 18.3% 22.7%
Voted in 2010
17.7% -- -- 12.6% --
This shows that for an average registrant, the probability of voting in 2014
decreases by between 2.4% and 3.9% among African American voters, by 7.1%-9.6%
among Hispanic voters, by 4.5%-6.7% for registrants living in student wards, and by
19.3%-20.6% for voters who do not possess a driver’s license or ID. Note that these
29 For each variable in the leftmost column, all of the other variables in the model are set to their mean values. The marginal effect of the control variable is determined by the difference in probability when the value of the variable is changed from 0 to 1. Entries in the table are therefore the independent marginal effect of that variable, controlling for the effects of all other variables.
Case: 3:15-cv-00324-jdp Document #: 71 Filed: 01/04/16 Page 28 of 48
28
effects occur after I have controlled for whether a registrant voted in 2010, the recall, or
the 2012 presidential election.30
The control coefficients for age and previous voting are all in the expected
direction. Voting in previous elections and being age 65 or older significantly increases
the probability of voting in 2014.
The effects of the voting and registration changes after 2010 are most noticeable
when they are compared to the control models, which estimate voting probabilities in
2010, before the voting and registration changes (Control Model C1), and the 2014
voting probabilities for these same registrants (Control Model C2). In 2010, prior to the
voting changes (Control Model C1), African American registrants were more likely than
other voters to vote. Registrants living in student wards were more likely to vote than
registrants in non-student wards, although this probability must be interpreted with
caution since we are observing a registrant’s residence in 2014, not 2010, and someone
who moved to a student ward after 2010 would still be counted as living in one in 2010.
Control Model C2 estimates the probabilities of 2014 voting for the same group
of registrants in Control Model C1. The coefficients show, uniformly, that the 2014
effects are very different from the 2010 effects, for the same voters. A Black registrant
has an increased probability of voting in 2010 (+3.4 percentage points), but a lower
probability of voting in 2014 (-.07 percentage points). This difference is statistically
significant at p<0.00001.
For registrants who have been in the SVRS since 2006, those living in student
wards were more likely to vote in 2010 (+2.1 percentage points), but less likely to vote in
30 White voters are the excluded category among the race variables; the effects on Black and Hispanic voters can be interpreted as compared to non-minority (i.e., white) voters.
Case: 3:15-cv-00324-jdp Document #: 71 Filed: 01/04/16 Page 29 of 48
29
2014 (-2.5 percentage points). Voters without ID were less likely to vote in 2010 (-5.1
percentage points), but the effect was three times larger in 2014 (-15.1 percentage points).
I expect the effects in Model 1 to be larger than in Model C2 because the voters in the
control have been in the SVRS for 8 years and have a more extensive voting history than
voters in Model 1 (registrants who have been in the SVRS since 2010). All other things
being equal, I expect, based on my knowledge of the political science literature,
individuals who have been registered for a longer time to be more likely to vote than
those who have been registered for less time, because they are likely older and have on
the whole voted more times than more recent registrants.
Control Model C3 estimates the effects for registrants who entered the SVRS
between the 2010 election and the recall (counting those who registered on the date of the
recall). The results show that the negative effects of the voting and registration changes
are not dependent on when an individual registered and, except for the case of residing in
a student ward, are larger for individuals who registered in this window.
The effects of not possessing an ID are dramatic. Since not possessing an ID is
correlated with other demographic variables – Blacks and Hispanics are less likely than
whites to possess one, as are younger people compared to older – I expect not having an
ID to lower the probability of voting irrespective of any other requirements. And, as
expected this relationship holds in 2010, when a registrant who does not possess an ID is
5.1 percentage points less likely to vote than a registrant who does have one. This can
serve as a baseline measure of the relationship between ID possession and turnout. But in
2014 – post Act 23, at a time when there was substantial confusion about whether the
voter ID law was in effect and a majority of voters believed that it was – the negative
Case: 3:15-cv-00324-jdp Document #: 71 Filed: 01/04/16 Page 30 of 48
30
effect of not having an ID quadruples, from -5.1% in 2010 (Control Model C1) to
between -19.3% (Model 1) and -20.4% (Model 2).
This individual level analysis shows that the probability that an individual voted,
and the size of the effects of the covariates, changed dramatically between 2010 and
2014.
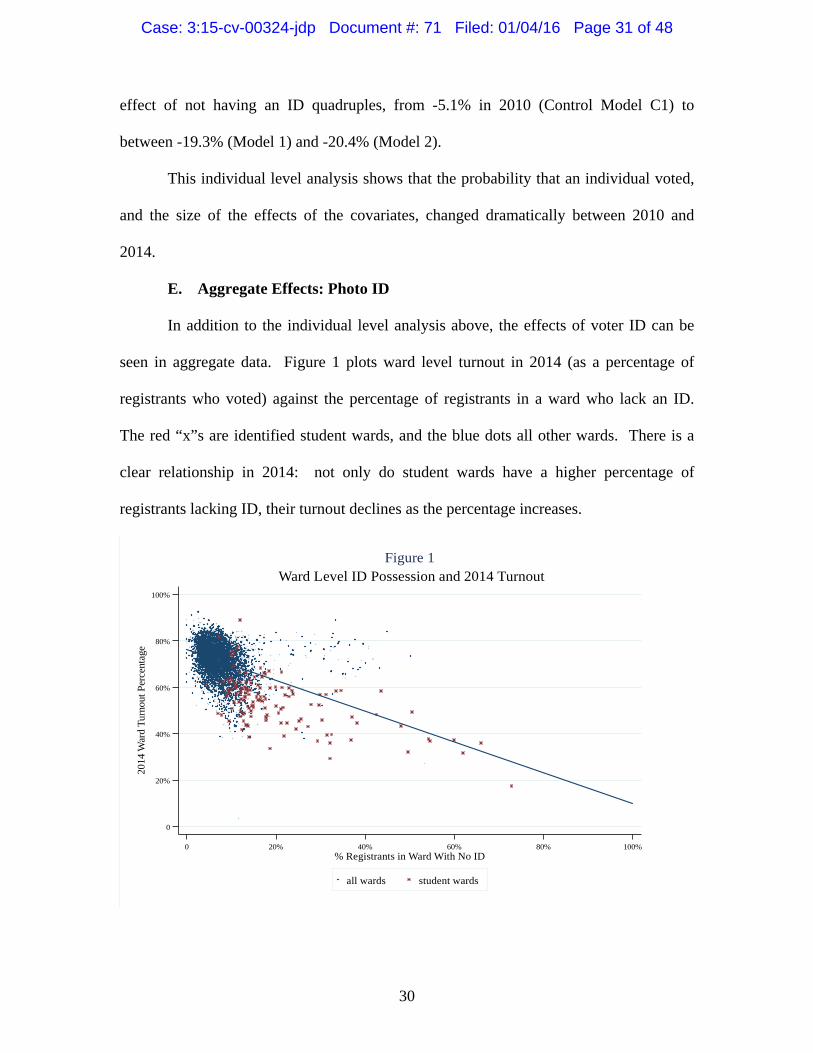
E. Aggregate Effects: Photo ID
In addition to the individual level analysis above, the effects of voter ID can be
seen in aggregate data. Figure 1 plots ward level turnout in 2014 (as a percentage of
registrants who voted) against the percentage of registrants in a ward who lack an ID.
The red “x”s are identified student wards, and the blue dots all other wards. There is a
clear relationship in 2014: not only do student wards have a higher percentage of
registrants lacking ID, their turnout declines as the percentage increases.
0
20%
40%
60%
80%
100%
2014
War
d T
urno
ut P
erce
ntag
e
0 20% 40% 60% 80% 100%% Registrants in Ward With No ID
all wards student wards
Ward Level ID Possession and 2014 TurnoutFigure 1
Case: 3:15-cv-00324-jdp Document #: 71 Filed: 01/04/16 Page 31 of 48
31
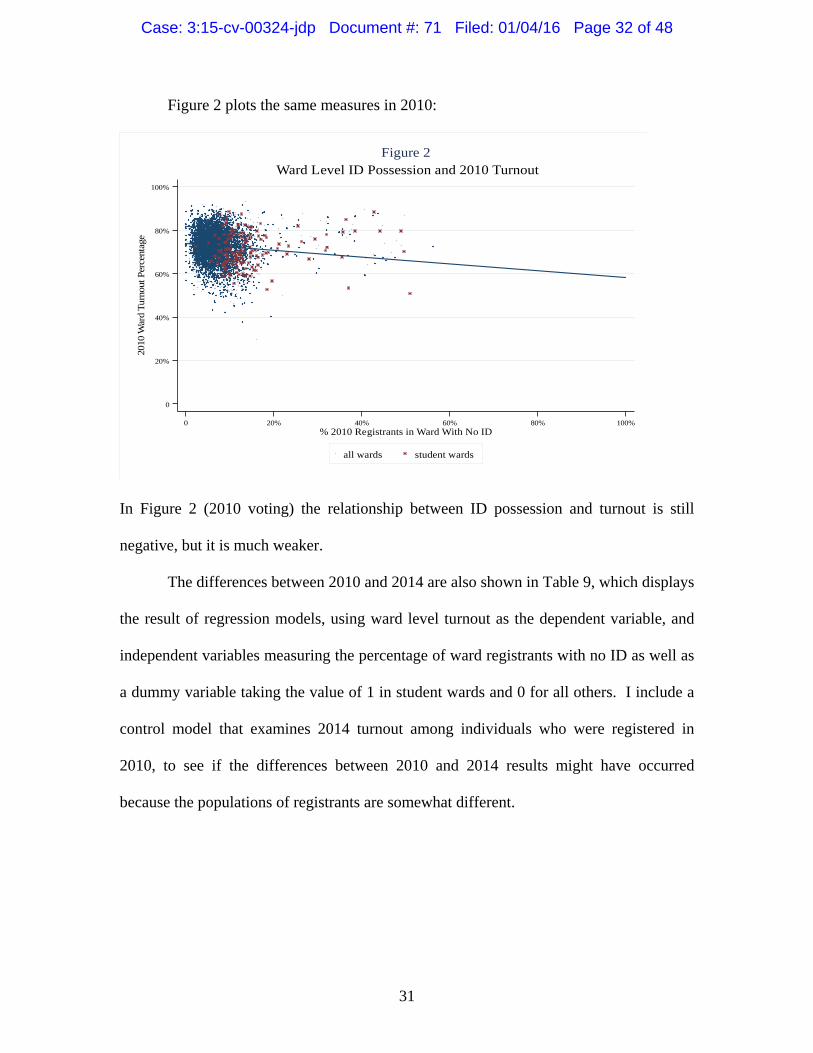
Figure 2 plots the same measures in 2010:
In Figure 2 (2010 voting) the relationship between ID possession and turnout is still
negative, but it is much weaker.
The differences between 2010 and 2014 are also shown in Table 9, which displays
the result of regression models, using ward level turnout as the dependent variable, and
independent variables measuring the percentage of ward registrants with no ID as well as
a dummy variable taking the value of 1 in student wards and 0 for all others. I include a
control model that examines 2014 turnout among individuals who were registered in
2010, to see if the differences between 2010 and 2014 results might have occurred
because the populations of registrants are somewhat different.
0
20%
40%
60%
80%
100%
2010
War
d T
urno
ut P
erce
ntag
e
0 20% 40% 60% 80% 100%% 2010 Registrants in Ward With No ID
all wards student wards
Ward Level ID Possession and 2010 TurnoutFigure 2
Case: 3:15-cv-00324-jdp Document #: 71 Filed: 01/04/16 Page 32 of 48

32
Table 9 Analysis of Ward Level Turnout, 2010 and 2014
Independent Variables
Dependent Variable:
Ward Level 2014 Turnout
Dependent Variable:
Ward Level 2010 Turnout
Control: Ward Level 2014
Turnout, People Registered
since 2010
% of Registrants in Ward Without ID
-0.559*** (.02)
-0.152***
(.021) -0.487***
(.02)
Student Ward
-0.108***
(.008) -.005 (.008)
-.183***
(.008)
Constant .758 .738 0.795
n 6,587 6,581 6,581
r2 .086 .085 .083
*** p <.0001 The regression results confirm the visual conclusion. In 2014, non-possession of
ID is strongly associated with lower turnout: each 10% increase in the number of
registrants in a ward lacking ID will cause a 5.59% decrease in turnout. Student wards
are also strongly and independently affected and have, on average, turnout 10.8% lower
than non-student wards, even after controlling for the ward level rate of ID possession.
In 2010, by contrast, there is a much weaker relationship between ID possession
and turnout (a 1.5% decrease for every 10% increase in the number of ward registrants
who do not have an ID), and no relationship at all between student wards and turnout
(this coefficient is not statistically different from 0).
The control regression examines 2014 turnout using the same registration
population as the 2010 regression. The results confirm that the 2014 results are not an
Case: 3:15-cv-00324-jdp Document #: 71 Filed: 01/04/16 Page 33 of 48
33
aberration: the same registrants who showed only a weak relationship between IDs and
turnout in 2010 show a strong negative relationship in 2014: a 10% increase in the rate of
non-possession of IDs results in a 4.87% decrease in turnout, and student ward turnout is
18.3% lower than non-student wards.
F. Aggregate Effects: Late Registration
Act 23 ended the practice of late registration over the weekend before an election.
Prior to Act 23, voters could register until 5PM the Monday before an election (or when
the clerk’s office closed if it stayed open past 5); afterwards, the cutoff was moved to the
Friday before election day. Late registrants could also cast an in-person absentee ballot
when they registered over these three days.31
Research on early voting has found consistently that minority voters are more
likely than white voters to vote on the weekend before an election. In a study of early
voting in Florida, Herron and Smith found that “on the last Sunday [before the 2008
election] the group with the highest relative participation rate was Hispanic voters,
followed by African American voters” (Herron and Smith 2012, 343). They concluded
that restricting early voting “very well could negatively impact turnout among
Democratic, minority, younger, occasional, and first-time voters” (2008, 347). Gronke
and Stewart (2013) found the same pattern. In a follow up study of the 2012 election in
Florida (after the number of early voting days had been reduced and early voting had
been eliminated on the Sunday before election day), Herron and Smith concluded that
voters who voted on the Sunday before the 2008 election were significantly less likely to
vote in 2012, indicating that “the voting rights of racial and ethnic minorities appear to
31 2014 Wisconsin Act 146 eliminated in-person early voting over this 3-day period as well.
Case: 3:15-cv-00324-jdp Document #: 71 Filed: 01/04/16 Page 34 of 48
34
have been disproportionately hampered by the reduction in the number of early voting
days and particularly the elimination of the final Sunday of early voting” (2014, 662).
Wisconsin does not track early voting or distinguish between in-person absentee
or mail absentee votes. The SVRS does, however, include a field noting the date of a
registration application and the date the registration becomes effective.32 The two entries
match 88% of the time, indicating that the registrant was validated immediately (or on the
same day). There is some noise in these entries, because one field but not the other can
change when a voter updates his or her registration, and some of the effective dates are
obviously incorrect (for example, the 1/1/18 date noted above). But these errors have no
effect on the main inferences about late weekend registration.
Between 2006 and 2010 (the last general election before late weekend registration
was eliminated), 14,806 electors registered in the last weekend before a general election.
Figure 3 plots the total number of late weekend registrants from 2006 and 2010 (using the
effective date to determine when registration occurred) by municipality, plotted against
the percentage of each municipality that is African American. If the pattern in Wisconsin
is similar to that found in other states, we should see a positive relationship between
African American concentrations and the number of late weekend registrants.
32 While all 3,367,426 SVRS registrants have an effective date entered, only 2,101,359 (or 62.4%) have an application date entered.
Case: 3:15-cv-00324-jdp Document #: 71 Filed: 01/04/16 Page 35 of 48

35
Figure 3 shows that this is in fact the case. Municipalities with larger African
American concentrations are associated with more registrants taking advantage of late
weekend registration. The two lines are bivariate ordinary least squares regression lines
of late registration and the percent African American; the blue line is for all
municipalities, the red excludes Milwaukee (the point in the upper right quadrant of the
graph).
Figure 4 is the same graph, but only for registrants whose effective date and
application date are the same (indicating no lag or error in the registration date). It shows
that the overall number of late registrants is lower than for the full population, but the
relationship between African American concentration and late registration is the same.
0
200
400
600
800
Tota
l Lat
e R
egis
tran
ts 2
006-
2010
0 10% 20% 30% 40% 50%
Municipality % African American
Bivariate OLS All Municipalities
Bivariate OLS Excluding Milwaukee
2006-2010 Late Weekend Registration, By Municipality
Figure 3
Case: 3:15-cv-00324-jdp Document #: 71 Filed: 01/04/16 Page 36 of 48

36
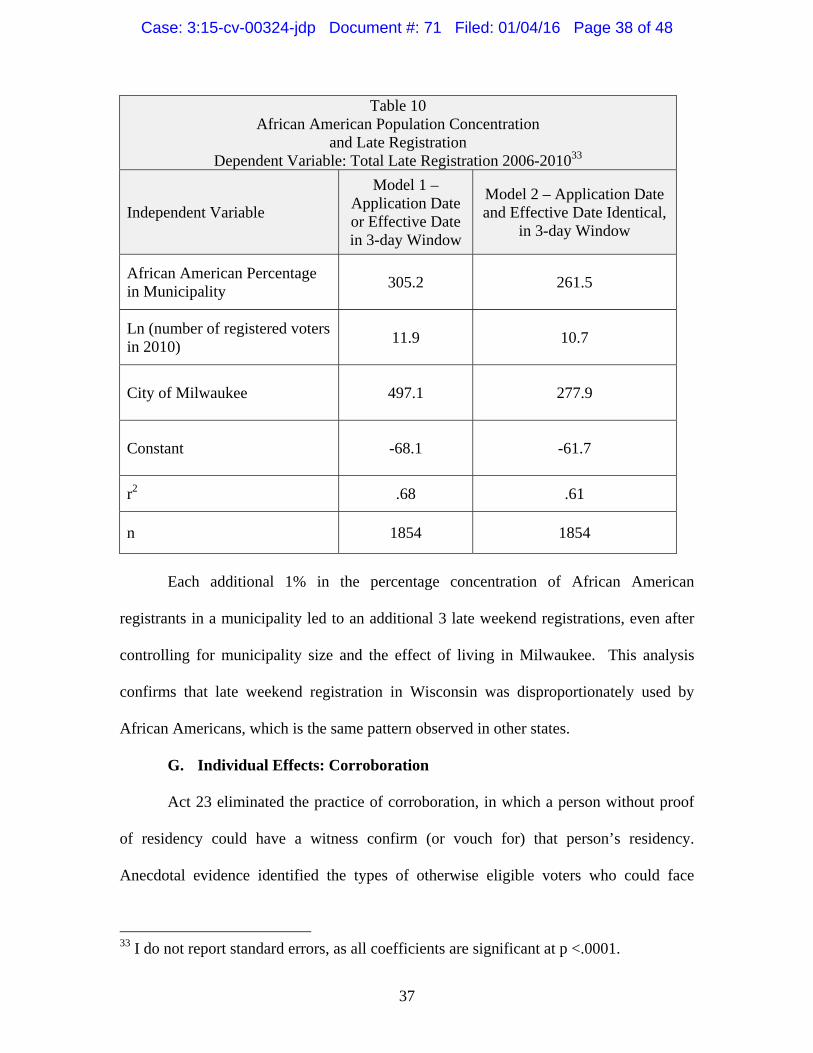
These simple bivariate graphs and regressions are confirmed by multivariate
analysis (Table 10). The model is simple, using the number of late weekend registrants
in each municipality as the dependent variable, and the percentage of registrants in the
municipality who are African American, the natural logarithm (ln) of the total number of
registrants in 2010, and a dummy variable that is set to 1 for the City of Milwaukee.
0
100
200
300
400
500
Tota
l Lat
e R
egis
tran
ts 2
006-
2010
0 10% 20% 30% 40% 50%
Municipality % African American
Bivariate OLS All Municipalities
Bivariate OLS Excluding Milwaukee
Registrants with Same Effective Date and Application Date
2006-2010 Late Weekend Registration, By Municipality
Figure 4
Case: 3:15-cv-00324-jdp Document #: 71 Filed: 01/04/16 Page 37 of 48
37
Table 10 African American Population Concentration
and Late Registration Dependent Variable: Total Late Registration 2006-201033
Independent Variable
Model 1 – Application Date or Effective Date in 3-day Window
Model 2 – Application Date and Effective Date Identical,
in 3-day Window
African American Percentage in Municipality
305.2 261.5
Ln (number of registered voters in 2010)
11.9 10.7
City of Milwaukee 497.1 277.9
Constant -68.1 -61.7
r2 .68 .61
n 1854 1854
Each additional 1% in the percentage concentration of African American
registrants in a municipality led to an additional 3 late weekend registrations, even after
controlling for municipality size and the effect of living in Milwaukee. This analysis
confirms that late weekend registration in Wisconsin was disproportionately used by
African Americans, which is the same pattern observed in other states.
G. Individual Effects: Corroboration
Act 23 eliminated the practice of corroboration, in which a person without proof
of residency could have a witness confirm (or vouch for) that person’s residency.
Anecdotal evidence identified the types of otherwise eligible voters who could face
33 I do not report standard errors, as all coefficients are significant at p <.0001.
Case: 3:15-cv-00324-jdp Document #: 71 Filed: 01/04/16 Page 38 of 48

38
difficulty registering without this provision, primarily because they lack documentary
proof of residence: the homeless, young people living with their parents, students living
in dorms, recently moved voters who do not yet have utility bills or other qualifying
proof of residence, and individuals whose spouses are on utility bills and bank statements
(Wisconsin Election Protection 2012, 2013).
While I do not have specific data on how many people were unable to register
because they were no longer permitted to use corroborating witnesses to prove residency,
we do know how many people registered using corroboration as late as 2012: internal
Government Accountability Board emails show that 19,464 active voters used
corroboration as of October 2012, and a total of 35,332 registrants used corroboration
since 2006.34
VI. Conclusion
There is no doubt that the changes to voting enacted in Wisconsin since 2011
have significantly lowered the probability that a voter can cast a ballot in 2014, with the
effects falling particularly hard on racial minorities, students, young voters, and those
without ID. The effects on these subpopulations are either absent altogether in 2010,
before the voting laws changed, or significantly smaller than they were in 2014.
The effects exist at both the individual and aggregate levels, and are not the result
of changes in the composition of the SVRS over time, or the different cohorts of
registrants who enter into the system over different time spans.
Since the SVRS consists of registered voters, it does not by itself tell us anything
about barriers to registration (since by definition we observe only people who have
34 David J. Meyer to Ann Oberle, Sarah Whitt, and Brian Bell, October 18, 2012.
Case: 3:15-cv-00324-jdp Document #: 71 Filed: 01/04/16 Page 39 of 48
39
overcome them). But there is evidence that at least two practices that have been
eliminated since 2010 – late weekend registration in the 3 days before an election, and
voter corroboration – were used when they were available, and that late registration was
more common in cities with higher concentrations of African Americans.
Case: 3:15-cv-00324-jdp Document #: 71 Filed: 01/04/16 Page 40 of 48
40
Bibliography
Ansolabehere, Stephen, and Eitan Hersh. 2011. “Gender, Race, Age and Voting: A Research Note.” Presented at the 2011 Annual Meeting of the American Political Science Association, September 1-4, Seattle, WA.
Burden, Barry C. and Jacob R. Neihiesel. 2011. “Election Administration and the Pure
Effect of Voter Registration on Turnout.” Political Research Quarterly XX: 1-14.
Erikson, Robert S. and Lorraine C. Minnite. 2009. “Modeling Problems in the Voter
Identification – Voter Turnout Debate.” Election Law Journal 8:85-101. Fowler, James H. 2006. “Habitual Voting and Behavioral Turnout.” Journal of Politics
68:335-344. Green, Donald P. and Ron Shachar. 2000. “Habit Formation and Political Behaviour:
Evidence of Consuetude in Voter Turnout.” British Journal of Political Science 30:561-573.
Fraga, Bernard L. 2014. “Candidates or Districts? Reevaluating the Role of Race in
Voter Turnout.” American Journal of Political Science. http://onlinelibrary. wiley.com/doi/10.1111/ajps.12172/full.
Gronke, Paul, and Charles Stewart III. 2013. “Early Voting in Florida.” MIT Working
Paper 2013-12. Hersh, Eitan D. and Brian F. Schaffner. 2013. “Targeted Campaign Appeals and the
Value of Ambiguity.” Journal of Politics 75:520-534. Herzog, Thomas N., Fritz J. Scheuren, and William E. Winkler. 2007. Data Quality and
Record Linkage Techniques. New York: Springer Verlaug. Herron, Michael C. and Daniel A. Smith. 2011. “Souls to the Polls: Early Voting in
Florida in the Shadow of House Bill 1355.” Election Law Journal 11:331-347 (No.3).
Herron, Michael C. and Daniel A. Smith. 2013. “The Effects of House Bill 1355 on
Voter Registration in Florida.” State Politics & Policy Quarterly XX:1-27. Herron, Michael C. and Daniel A. Smith. 2014. “Race, Party, and the Consequences of
Restricting Early Voting in Florida in the 2012 General Election.” Political Research Quarterly 67:646-665.
Leighley, Jan E. and Jonathan Nagler. 1992. “Individual and Systemic Influences on
Turnout: Who Votes? 1984.” Journal of Politics 54:718-740.
Case: 3:15-cv-00324-jdp Document #: 71 Filed: 01/04/16 Page 41 of 48
41
Shaw, Daron, Stephen Ansolabehere, and Charles Stewart III. 2015. “A Brief Yet
Practical Guide to Reforming U.S. Voter Registration Systems.” Election Law Journal 14: 26-31.
Stewart, Charles III. 2012. “Declaration of Charles Stewart III.” State of South Carolina
v. Holder et al., 1:12-CV-203-CKK-BMK-JDB (Dist. D.C.). Stewart, Charles III. 2013. “Voter ID: Who Has Them? Who Shows Them?” Oklahoma
Law Review 66:21-52. White, Ariel R., Noah L. Nathan, and Julie K. Faller. 2015. “What do I Need to Vote?
Bureaucratic Discretion and Discrimination by Local Election Officials.” American Political Science Review 109:129-142.
Wisconsin Election Protection. 2012. 2012 Recall Election Report: Report from Non-
Partisan Observers of Voting in the Recall Election in the State of Wisconsin on June 5, 2012.
Wisconsin Election Protection. 2013. 2012 Presidential Election Report: Report from
Non-Partisan Observers of Voting in the November 6, 2012 General Election.
Case: 3:15-cv-00324-jdp Document #: 71 Filed: 01/04/16 Page 42 of 48
42
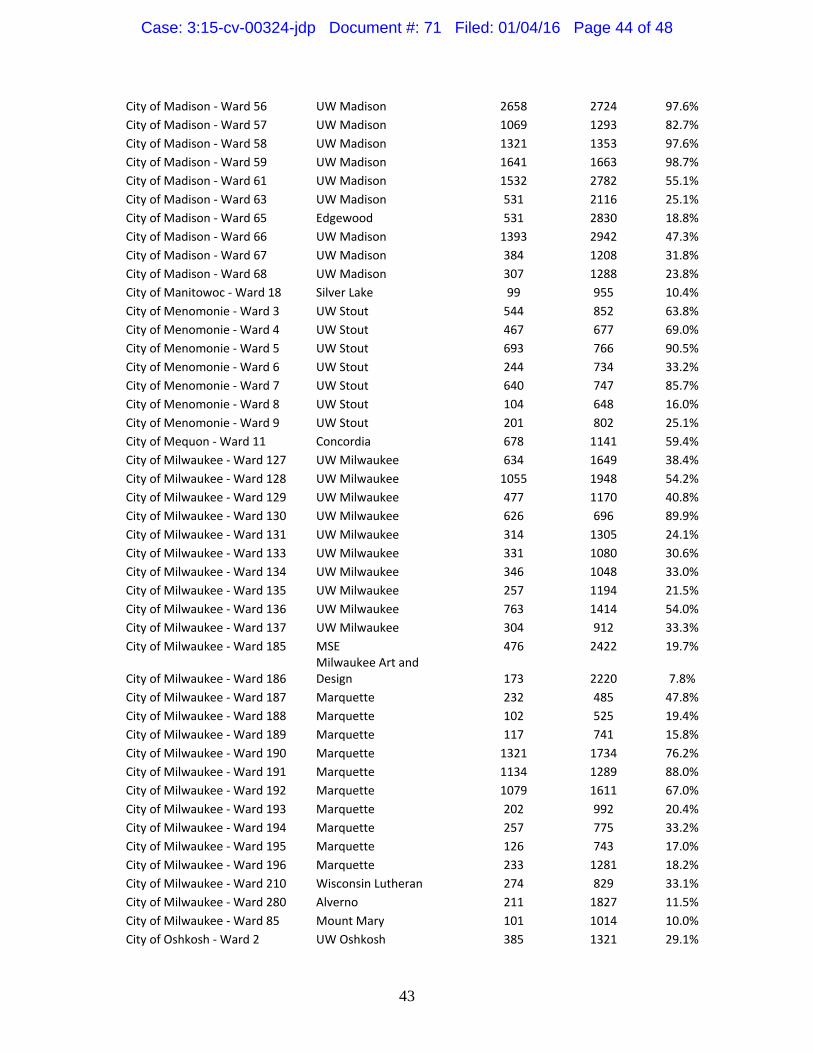
Appendix1–StudentWards
Ward School Number 18‐24 registered
Total Registered
Pct 18‐24 registered
City of Appleton ‐ Ward 8 Lawrence 968 1383 70.0%
City of Ashland ‐ Ward 7 Northland College 318 541 58.8%
City of Beloit ‐ Ward 16 Beloit 857 1248 68.7%
City of De Pere ‐ Ward 11 St. Norbert 778 1033 75.3%
City of Eau Claire ‐ Ward 2 UW Eau Claire 366 841 43.5%
City of Eau Claire ‐ Ward 20 UW Eau Claire 2512 2635 95.3%
City of Eau Claire ‐ Ward 21 UW Eau Claire 199 1089 18.3%
City of Eau Claire ‐ Ward 24 UW Eau Claire 279 288 96.9%
City of Eau Claire ‐ Ward 3 UW Eau Claire 742 2069 35.9%
City of Eau Claire ‐ Ward 31 UW Eau Claire 193 1052 18.3%
City of Eau Claire ‐ Ward 5 UW Eau Claire 988 1208 81.8%
City of Eau Claire ‐ Ward 6 UW Eau Claire 857 1221 70.2%
City of Fond Du Lac ‐ Ward 19 Marian 237 914 25.9%
City of Glendale ‐ Ward 9 Cardinal Stritch 122 848 14.4%
City of Green Bay ‐ Ward 22 UW Green Bay 79 408 19.4%
City of Green Bay ‐ Ward 23 UW Green Bay 181 830 21.8%
City of Green Bay ‐ Ward 3 UW Green Bay 1229 2068 59.4%
City of Kenosha ‐ Ward 03 Carthage 620 652 95.1%
City of La Crosse ‐ Ward 10 UW La Crosse 429 562 76.3%
City of La Crosse ‐ Ward 11 UW La Crosse 505 543 93.0%
City of La Crosse ‐ Ward 12 UW La Crosse 329 614 53.6%
City of La Crosse ‐ Ward 13 UW La Crosse 106 474 22.4%
City of La Crosse ‐ Ward 14 UW La Crosse 252 891 28.3%
City of La Crosse ‐ Ward 15 Viterbo 314 667 47.1%
City of La Crosse ‐ Ward 17 Viterbo 68 414 16.4%
City of La Crosse ‐ Ward 18 Viterbo 96 414 17.6%
City of La Crosse ‐ Ward 19 Viterbo 85 414 16.3%
City of La Crosse ‐ Ward 6 UW La Crosse 586 1452 40.4%
City of La Crosse ‐ Ward 7 UW La Crosse 990 1965 50.4%
City of La Crosse ‐ Ward 8 UW La Crosse 2589 2749 94.2%
City of La Crosse ‐ Ward 9 UW La Crosse 439 2366 18.6%
City of Madison ‐ Ward 43 UW Madison 85 485 17.5%
City of Madison ‐ Ward 45 UW Madison 546 3404 16.0%
City of Madison ‐ Ward 46 UW Madison 1137 3074 37.0%
City of Madison ‐ Ward 47 UW Madison 1726 2312 74.7%
City of Madison ‐ Ward 48 UW Madison 1016 1197 84.9%
City of Madison ‐ Ward 49 UW Madison 2471 2783 88.8%
City of Madison ‐ Ward 50 UW Madison 1988 2611 76.1%
City of Madison ‐ Ward 51 UW Madison 412 1529 26.9%
City of Madison ‐ Ward 53 UW Madison 1105 3240 34.1%
City of Madison ‐ Ward 54 UW Madison 947 971 97.5%
City of Madison ‐ Ward 55 UW Madison 3410 3739 91.2%
Case: 3:15-cv-00324-jdp Document #: 71 Filed: 01/04/16 Page 43 of 48
43
City of Madison ‐ Ward 56 UW Madison 2658 2724 97.6%
City of Madison ‐ Ward 57 UW Madison 1069 1293 82.7%
City of Madison ‐ Ward 58 UW Madison 1321 1353 97.6%
City of Madison ‐ Ward 59 UW Madison 1641 1663 98.7%
City of Madison ‐ Ward 61 UW Madison 1532 2782 55.1%
City of Madison ‐ Ward 63 UW Madison 531 2116 25.1%
City of Madison ‐ Ward 65 Edgewood 531 2830 18.8%
City of Madison ‐ Ward 66 UW Madison 1393 2942 47.3%
City of Madison ‐ Ward 67 UW Madison 384 1208 31.8%
City of Madison ‐ Ward 68 UW Madison 307 1288 23.8%
City of Manitowoc ‐ Ward 18 Silver Lake 99 955 10.4%
City of Menomonie ‐ Ward 3 UW Stout 544 852 63.8%
City of Menomonie ‐ Ward 4 UW Stout 467 677 69.0%
City of Menomonie ‐ Ward 5 UW Stout 693 766 90.5%
City of Menomonie ‐ Ward 6 UW Stout 244 734 33.2%
City of Menomonie ‐ Ward 7 UW Stout 640 747 85.7%
City of Menomonie ‐ Ward 8 UW Stout 104 648 16.0%
City of Menomonie ‐ Ward 9 UW Stout 201 802 25.1%
City of Mequon ‐ Ward 11 Concordia 678 1141 59.4%
City of Milwaukee ‐ Ward 127 UW Milwaukee 634 1649 38.4%
City of Milwaukee ‐ Ward 128 UW Milwaukee 1055 1948 54.2%
City of Milwaukee ‐ Ward 129 UW Milwaukee 477 1170 40.8%
City of Milwaukee ‐ Ward 130 UW Milwaukee 626 696 89.9%
City of Milwaukee ‐ Ward 131 UW Milwaukee 314 1305 24.1%
City of Milwaukee ‐ Ward 133 UW Milwaukee 331 1080 30.6%
City of Milwaukee ‐ Ward 134 UW Milwaukee 346 1048 33.0%
City of Milwaukee ‐ Ward 135 UW Milwaukee 257 1194 21.5%
City of Milwaukee ‐ Ward 136 UW Milwaukee 763 1414 54.0%
City of Milwaukee ‐ Ward 137 UW Milwaukee 304 912 33.3%
City of Milwaukee ‐ Ward 185 MSE 476 2422 19.7%
City of Milwaukee ‐ Ward 186 Milwaukee Art and Design 173 2220 7.8%
City of Milwaukee ‐ Ward 187 Marquette 232 485 47.8%
City of Milwaukee ‐ Ward 188 Marquette 102 525 19.4%
City of Milwaukee ‐ Ward 189 Marquette 117 741 15.8%
City of Milwaukee ‐ Ward 190 Marquette 1321 1734 76.2%
City of Milwaukee ‐ Ward 191 Marquette 1134 1289 88.0%
City of Milwaukee ‐ Ward 192 Marquette 1079 1611 67.0%
City of Milwaukee ‐ Ward 193 Marquette 202 992 20.4%
City of Milwaukee ‐ Ward 194 Marquette 257 775 33.2%
City of Milwaukee ‐ Ward 195 Marquette 126 743 17.0%
City of Milwaukee ‐ Ward 196 Marquette 233 1281 18.2%
City of Milwaukee ‐ Ward 210 Wisconsin Lutheran 274 829 33.1%
City of Milwaukee ‐ Ward 280 Alverno 211 1827 11.5%
City of Milwaukee ‐ Ward 85 Mount Mary 101 1014 10.0%
City of Oshkosh ‐ Ward 2 UW Oshkosh 385 1321 29.1%
Case: 3:15-cv-00324-jdp Document #: 71 Filed: 01/04/16 Page 44 of 48
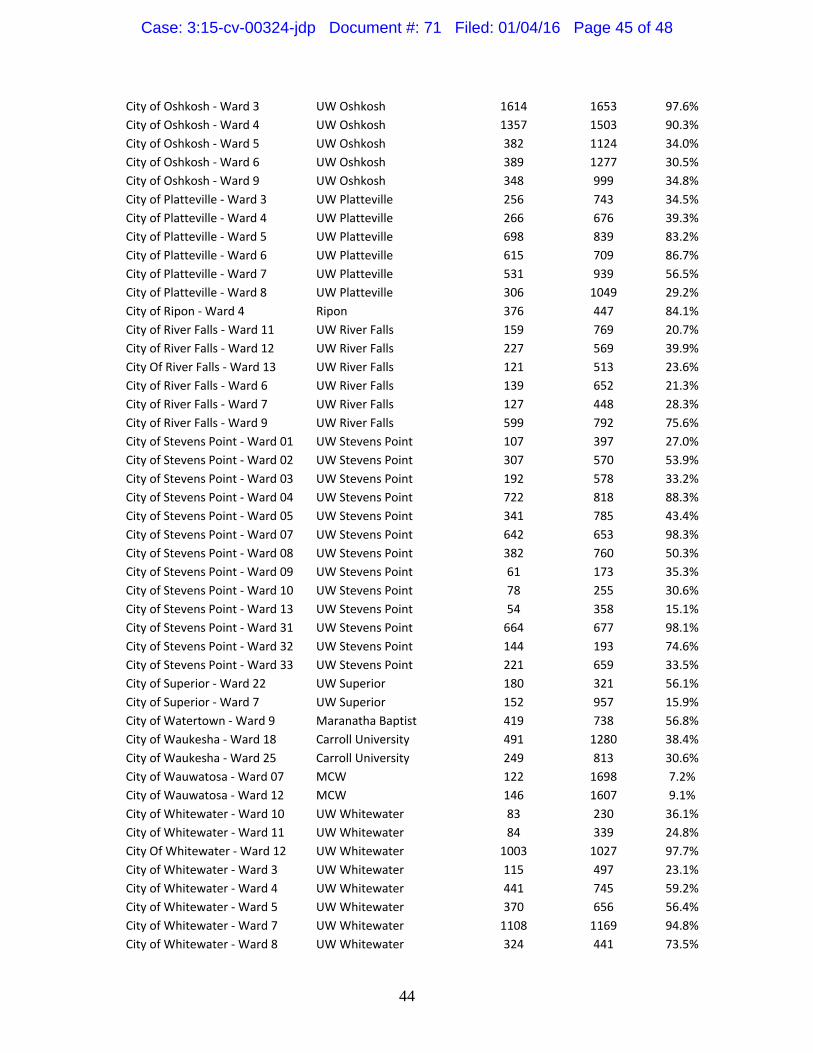
44
City of Oshkosh ‐ Ward 3 UW Oshkosh 1614 1653 97.6%
City of Oshkosh ‐ Ward 4 UW Oshkosh 1357 1503 90.3%
City of Oshkosh ‐ Ward 5 UW Oshkosh 382 1124 34.0%
City of Oshkosh ‐ Ward 6 UW Oshkosh 389 1277 30.5%
City of Oshkosh ‐ Ward 9 UW Oshkosh 348 999 34.8%
City of Platteville ‐ Ward 3 UW Platteville 256 743 34.5%
City of Platteville ‐ Ward 4 UW Platteville 266 676 39.3%
City of Platteville ‐ Ward 5 UW Platteville 698 839 83.2%
City of Platteville ‐ Ward 6 UW Platteville 615 709 86.7%
City of Platteville ‐ Ward 7 UW Platteville 531 939 56.5%
City of Platteville ‐ Ward 8 UW Platteville 306 1049 29.2%
City of Ripon ‐ Ward 4 Ripon 376 447 84.1%
City of River Falls ‐ Ward 11 UW River Falls 159 769 20.7%
City of River Falls ‐ Ward 12 UW River Falls 227 569 39.9%
City Of River Falls ‐ Ward 13 UW River Falls 121 513 23.6%
City of River Falls ‐ Ward 6 UW River Falls 139 652 21.3%
City of River Falls ‐ Ward 7 UW River Falls 127 448 28.3%
City of River Falls ‐ Ward 9 UW River Falls 599 792 75.6%
City of Stevens Point ‐ Ward 01 UW Stevens Point 107 397 27.0%
City of Stevens Point ‐ Ward 02 UW Stevens Point 307 570 53.9%
City of Stevens Point ‐ Ward 03 UW Stevens Point 192 578 33.2%
City of Stevens Point ‐ Ward 04 UW Stevens Point 722 818 88.3%
City of Stevens Point ‐ Ward 05 UW Stevens Point 341 785 43.4%
City of Stevens Point ‐ Ward 07 UW Stevens Point 642 653 98.3%
City of Stevens Point ‐ Ward 08 UW Stevens Point 382 760 50.3%
City of Stevens Point ‐ Ward 09 UW Stevens Point 61 173 35.3%
City of Stevens Point ‐ Ward 10 UW Stevens Point 78 255 30.6%
City of Stevens Point ‐ Ward 13 UW Stevens Point 54 358 15.1%
City of Stevens Point ‐ Ward 31 UW Stevens Point 664 677 98.1%
City of Stevens Point ‐ Ward 32 UW Stevens Point 144 193 74.6%
City of Stevens Point ‐ Ward 33 UW Stevens Point 221 659 33.5%
City of Superior ‐ Ward 22 UW Superior 180 321 56.1%
City of Superior ‐ Ward 7 UW Superior 152 957 15.9%
City of Watertown ‐ Ward 9 Maranatha Baptist 419 738 56.8%
City of Waukesha ‐ Ward 18 Carroll University 491 1280 38.4%
City of Waukesha ‐ Ward 25 Carroll University 249 813 30.6%
City of Wauwatosa ‐ Ward 07 MCW 122 1698 7.2%
City of Wauwatosa ‐ Ward 12 MCW 146 1607 9.1%
City of Whitewater ‐ Ward 10 UW Whitewater 83 230 36.1%
City of Whitewater ‐ Ward 11 UW Whitewater 84 339 24.8%
City Of Whitewater ‐ Ward 12 UW Whitewater 1003 1027 97.7%
City of Whitewater ‐ Ward 3 UW Whitewater 115 497 23.1%
City of Whitewater ‐ Ward 4 UW Whitewater 441 745 59.2%
City of Whitewater ‐ Ward 5 UW Whitewater 370 656 56.4%
City of Whitewater ‐ Ward 7 UW Whitewater 1108 1169 94.8%
City of Whitewater ‐ Ward 8 UW Whitewater 324 441 73.5%
Case: 3:15-cv-00324-jdp Document #: 71 Filed: 01/04/16 Page 45 of 48

45
City Of Whitewater ‐ Ward 9 UW Whitewater 550 645 85.3%
Town of Herman ‐ Ward 3 Lakeland 190 360 52.8%
Village of Fox Point ‐ Ward 4 Cardinal Stritch 83 496 16.7%
Village Of Somers ‐ Ward 12 UW Parkside 309 375 82.4%
Case: 3:15-cv-00324-jdp Document #: 71 Filed: 01/04/16 Page 46 of 48

46
Appendix2–RegressionModelSpecifications
Model12014 2010
2012 25 34 35 44 45 54 55 64 65
Model22014 2012
25 34 35 44 45 54 55 64 65
ControlModel12010 2008 2006
2012 25 34 35 44 45 54 55 64 65
ControlModel2(registeredsince2006)2014 2010
2012 2008 2006 25 34 35 44 45 54 14 55 64 15 65
ControlModel3(registeredbetween2010and2012)2014 2012
25 34 35 44 45 54 55 64 65
Voted2014 =1ifRegistrantvotedinthe2014generalelection,0otherwise
Voted2012 =1ifRegistrantvotedinthe2012generalelection,0otherwise
VotedRecall =1ifRegistrantvotedintherecallelection,0otherwise
Voted2010 =1ifRegistrantvotedinthe2010generalelection,0otherwise
Voted2008 =1ifRegistrantvotedinthe2008generalelection,0otherwise
Case: 3:15-cv-00324-jdp Document #: 71 Filed: 01/04/16 Page 47 of 48
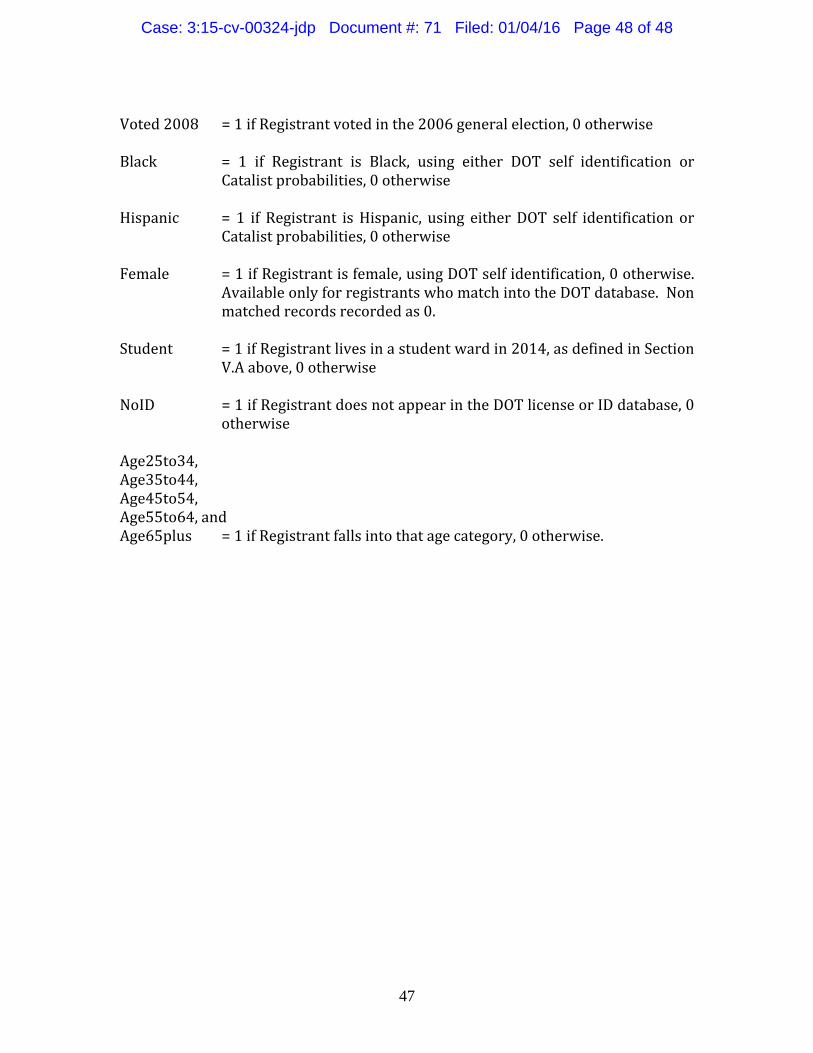
47
Voted2008 =1ifRegistrantvotedinthe2006generalelection,0otherwiseBlack = 1 if Registrant is Black, using either DOT self identification or
Catalistprobabilities,0otherwiseHispanic = 1 if Registrant isHispanic, using eitherDOT self identification or
Catalistprobabilities,0otherwiseFemale =1ifRegistrantisfemale,usingDOTselfidentification,0otherwise.
AvailableonlyforregistrantswhomatchintotheDOTdatabase.Nonmatchedrecordsrecordedas0.
Student =1ifRegistrantlivesinastudentwardin2014,asdefinedinSection
V.Aabove,0otherwiseNoID =1ifRegistrantdoesnotappearintheDOTlicenseorIDdatabase,0
otherwiseAge25to34,Age35to44,Age45to54,Age55to64,andAge65plus =1ifRegistrantfallsintothatagecategory,0otherwise.
Case: 3:15-cv-00324-jdp Document #: 71 Filed: 01/04/16 Page 48 of 48

Exhibit 1
Case: 3:15-cv-00324-jdp Document #: 71-1 Filed: 01/04/16 Page 1 of 12

1
Kenneth R. Mayer Curriculum Vitae
Professor of Political Science Department of Political Science Affiliate Faculty, La Follette School of Public Affairs 110 North Hall / 1050 Bascom Mall University of Wisconsin - Madison Madison, WI 53706
voice: 608-263-2286 / cell: 608-216-6554/ fax: 608-265-2663 [email protected] http://www. polisci.wisc.edu/users/kmayer
Education Ph.D. Yale University, 1988 (Political Science) M.A., M.Phil. Yale University, 1987 (Political Science) B.A. University of California, San Diego 1982 (Political Science)
Positions Held Education and Social and Behavioral Sciences Institutional Review Board. 2009-2014.
Acting Chair, Summer 2011. Chair, May 2012- June 2014 Fulbright-ANU Distinguished Chair in Political Science, Australian National University
(Canberra, ACT), July – December 2006. Professor, Department of Political Science, University of Wisconsin-Madison, July 2000 –
present Director, Data and Computation Center, College of Letters and Science, University of
Wisconsin-Madison, June 1996-September 2003 Associate Professor, Department of Political Science, University of Wisconsin-Madison, June
1996-June 2000. Assistant Professor, Department of Political Science, University of Wisconsin-Madison, August
1989-June 1996. Consultant, The RAND Corporation, Washington DC, 1988-1994. Conducted study of
acquisition reform, and the effects of acquisition policy on the defense industrial base. Also performed computer simulations of U.S. strategic force posture and capabilities.
Contract Specialist, Naval Air Systems Command, Washington D.C., 1985-1986. Responsible for cost and price analysis, contract negotiation, and contract administration for aerial target missile programs in the $5 million - $100 million range.
Honors and Awards American Political Science Association, State Politics and Policy Section, best journal article
published in the American Journal of Political Science in 2014. Awarded for Burden, Canon, Mayer, and Moynihan, “Election Laws, Mobilization, and Turnout.”
Robert H. Durr Award, from the Midwest Political Science Association, for best paper applying quantitative methods to a substantive problem presented at the 2013 meeting. Awarded for Burden, Canon, Mayer, and Moynihan, “Election Laws and Partisan Gains.”
Leon Epstein Faculty Fellow, College of Letters and Science, 2012-2015 Recipient, Jerry J. and Mary M. Cotter Award, College of Letters and Science, 2011-2012
Case: 3:15-cv-00324-jdp Document #: 71-1 Filed: 01/04/16 Page 2 of 12
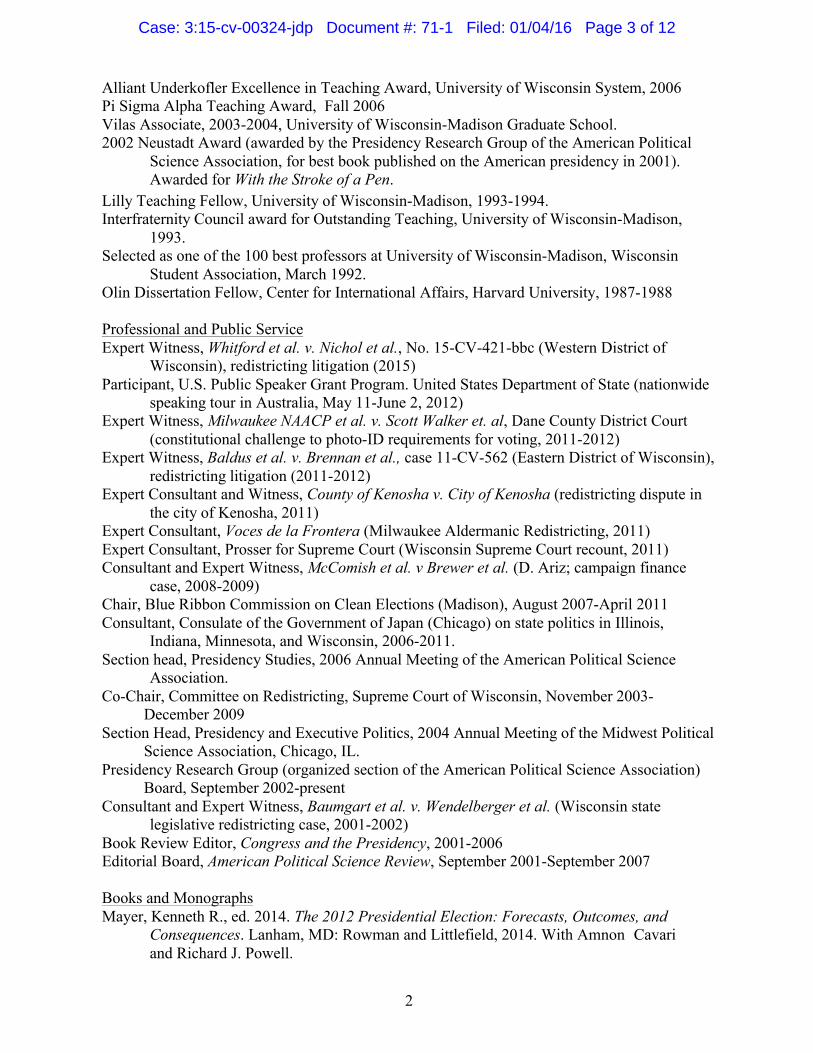
2
Alliant Underkofler Excellence in Teaching Award, University of Wisconsin System, 2006 Pi Sigma Alpha Teaching Award, Fall 2006 Vilas Associate, 2003-2004, University of Wisconsin-Madison Graduate School. 2002 Neustadt Award (awarded by the Presidency Research Group of the American Political
Science Association, for best book published on the American presidency in 2001). Awarded for With the Stroke of a Pen.
Lilly Teaching Fellow, University of Wisconsin-Madison, 1993-1994. Interfraternity Council award for Outstanding Teaching, University of Wisconsin-Madison,
1993. Selected as one of the 100 best professors at University of Wisconsin-Madison, Wisconsin
Student Association, March 1992. Olin Dissertation Fellow, Center for International Affairs, Harvard University, 1987-1988
Professional and Public Service Expert Witness, Whitford et al. v. Nichol et al., No. 15-CV-421-bbc (Western District of
Wisconsin), redistricting litigation (2015) Participant, U.S. Public Speaker Grant Program. United States Department of State (nationwide
speaking tour in Australia, May 11-June 2, 2012) Expert Witness, Milwaukee NAACP et al. v. Scott Walker et. al, Dane County District Court
(constitutional challenge to photo-ID requirements for voting, 2011-2012) Expert Witness, Baldus et al. v. Brennan et al., case 11-CV-562 (Eastern District of Wisconsin),
redistricting litigation (2011-2012) Expert Consultant and Witness, County of Kenosha v. City of Kenosha (redistricting dispute in
the city of Kenosha, 2011) Expert Consultant, Voces de la Frontera (Milwaukee Aldermanic Redistricting, 2011) Expert Consultant, Prosser for Supreme Court (Wisconsin Supreme Court recount, 2011) Consultant and Expert Witness, McComish et al. v Brewer et al. (D. Ariz; campaign finance
case, 2008-2009) Chair, Blue Ribbon Commission on Clean Elections (Madison), August 2007-April 2011 Consultant, Consulate of the Government of Japan (Chicago) on state politics in Illinois,
Indiana, Minnesota, and Wisconsin, 2006-2011. Section head, Presidency Studies, 2006 Annual Meeting of the American Political Science
Association. Co-Chair, Committee on Redistricting, Supreme Court of Wisconsin, November 2003-
December 2009 Section Head, Presidency and Executive Politics, 2004 Annual Meeting of the Midwest Political
Science Association, Chicago, IL. Presidency Research Group (organized section of the American Political Science Association)
Board, September 2002-present Consultant and Expert Witness, Baumgart et al. v. Wendelberger et al. (Wisconsin state
legislative redistricting case, 2001-2002) Book Review Editor, Congress and the Presidency, 2001-2006 Editorial Board, American Political Science Review, September 2001-September 2007
Books and Monographs Mayer, Kenneth R., ed. 2014. The 2012 Presidential Election: Forecasts, Outcomes, and
Consequences. Lanham, MD: Rowman and Littlefield, 2014. With Amnon Cavari and Richard J. Powell.
Case: 3:15-cv-00324-jdp Document #: 71-1 Filed: 01/04/16 Page 3 of 12

3
-----, ed. 2013. The Enduring Debate: Classic and Contemporary Readings in American Government. 7th ed. New York: W.W. Norton & Co. (with David T. Canon and John Coleman). Previous editions 1st (1997), 2nd (2000), 3rd (2002), 4th (2006) 5th (2009) 6th
(2011).
-----, ed. 2013. Faultlines: Readings in American Government, 4th ed. New York: W.W. Norton & Co. (with David T. Canon and John Coleman). Previous editions 1st (2004), 2nd
(2007), 3rd (2011) -----. 2009. 2008 Election Data Collection Grant Program: Wisconsin Evaluation Report.
Report to the Wisconsin Government Accountability Board, September 2009. With Barry C. Burden, David T. Canon, Stéphane Lavertu, and Donald P. Moynihan.
-----, ed. 2002. Readings in American Government, 7th edition. New York: W.W. Norton & Co. (with Theodore J. Lowi, Benjamin Ginsberg, David T. Canon, and John Coleman). Previous editions 4th (1996), 5th (1998), 6th (2000).
-----. 2001. With the Stroke of a Pen: Executive Orders and Presidential Power. Princeton, NJ: Princeton University Press. Winner of the 2002 Neustadt Award.
-----. 1999. The Dysfunctional Congress? The Individual Roots of an Institutional Dilemma. Boulder, CO: Westview Press. (with David T. Canon). 2nd edition in process, expected publication date 2014.
-----. 1999. Issue Advocacy in Wisconsin: Analysis of the 1998 Elections and A Proposal for Enhanced Disclosure. September.
-----. 1998. Public Financing and Electoral Competition in Minnesota and Wisconsin. Citizens’ Research Foundation. April.
-----. 1993. The Development of the Advanced Medium Range Air-to-Air Missile: A Case Study of Risk and Reward in Weapon System Acquisition. N-3620-AF. Santa Monica: RAND Corporation.
-----. 1992. Barriers to Managing Risk in Large Scale Weapons System Development Programs. N-4624-AF. Santa Monica: RAND Corporation (with Thomas K. Glennan, Jr., Susan J. Bodilly, Frank Camm, and Timothy J. Webb).
-----. 1991. The Political Economy of Defense Contracting. New Haven: Yale University Press. Articles and Other Scholarly Papers Mayer, Kenneth R. 2014. “Lessons of Defeat: Republican Party Responses to the 2012
Presidential Election. In Amnon Cavari, Richard J. Powell, and Kenneth R. Mayer, eds. The 2012 Presidential Election: Forecasts, Outcomes, and Consequences. Lanham, MD: Rowman and Littlefield.
-----. 2014. “Alien Abduction, and Voter Impersonation in the 2012 U.S. General Election: Evidence from a Survey List Experiment.” Election Law Journal 13:460-475 (No.4, December 2014). With John S. Ahlquist and Simon Jackman.
-----. 2014. “Election Laws, Mobilization, and Turnout: The Unanticipated Consequences of Election Reform.” American Journal of Political Science,58:95-109 (No. 1, January). With Barry C. Burden, David T. Canon, and Donald P. Moynihan. Winner of the State Politics and Politics section of the American Political Science Association, for the best article published in the AJPS in 2014.
-----. 2013. “Public Election Funding: An Assessment of What We Would Like to Know.” The Forum 11:365-485 (No. 3).
-----. 2013. “Selection Method, Partisanship, and the Administration of Elections.” American Politics Research 41:1-34. With Barry C. Burden, David T. Canon, Stéphane Lavertu, and Donald Moynihan.
Case: 3:15-cv-00324-jdp Document #: 71-1 Filed: 01/04/16 Page 4 of 12
4
-----. 2012. “The Effect of Administrative Burden on Bureaucratic Perception of Policies: Evidence from Election Administration.” Public Administration Review 72:741-451 (No. 5, September/October 2012). With Barry C. Burden, David T. Canon, and Donald Moynihan.
-----. 2011. “Early Voting and Election Day Registration in the Trenches: Local Officials’ Perceptions of Election Reform.” Election Law Journal 10:89-102 (No. 2). With Barry C. Burden, David T. Canon, and Donald Moynihan.
-----. 2010. "Is Political Science Relevant? Ask an Expert Witness," The Forum: Vol. 8 : Iss. 3, Article 6. DOI: 10.2202/1540-8884.1391 Available at: http://www.bepress.com/forum/vol8/iss3/art6
-----. 2009. “Thoughts on the Revolution in Presidency Studies,” Presidential Studies Quarterly 39 (no. 4, December)
-----. 2009. “Unilateral Action.” George C. Edwards, III, and William G. Howell, Oxford Handbook of the American Presidency (New York: Oxford University Press, 2009)
-----. 2009. “Executive Orders,” in Joseph Bessette and Jeffrey Tulis, The Constitutional Presidency. (Baltimore: Johns Hopkins University Press, 2009)
-----. 2008. “Does Australia Have a Constitution? Part I – Powers: A Constitution Without Constitutionalism.” UCLA Pacific Basin Law Journal 25:228-264 (No. 2, Spring). With Howard Schweber.
-----. 2008. “Does Australia Have a Constitution? Part II: The Rights Constitution.” UCLA Pacific Basin Law Journal 25:265-355 (No. 2, Spring). With Howard Schweber.
-----. 2007. “The Base Realignment and Closure Process: Is It Possible to Make Rational Policy?” Brademas Center for the Study of Congress, New York University.
-----. 2007 “Controlling Executive Authority in a Constitutional System” (comparative analysis of executive power in the U.S. and Australia), manuscript, February 2007.
-----. 2007. “Public Election Funding, Competition, and Candidate Gender.” PS: Political Science and Politics XL:661-667 (No. 4,October). With Timothy Werner
-----. 2006. “Do Public Funding Programs Enhance Electoral Competition?” In Michael P. McDonald and John Samples, eds., The Marketplace of Democracy: Electoral Competition and American Politics (Washington, DC: Brookings Institution Press, 2006). With Timothy Werner and Amanda Williams. Excerpted in Daniel H. Lowenstein, Richard L. Hasen, and Daniel P. Tokaji, Election Law: Cases and Materials (Durham, NC: Carolina Academic Press, 2008).
-----. 2005. “The Last 100 Days.” Presidential Studies Quarterly 35:533-553 (No. 3, September). With William Howell.
-----. 2004. “The Return of the King? Presidential Power and the Law,” PRG Report XXVI, No. 2 (Spring).
-----. 2003. “Political Reality and Unforeseen Consequences: Why Campaign Finance Reform is Too Important To Be Left To The Lawyers,” University of Richmond Law Review 37:1069-1110 (No. 4, May).
-----. 2002. “Unilateral Presidential Powers: Significant Executive Orders, 1949-1999.” Presidential Studies Quarterly 32:367-386 (No. 2, June). With Kevin Price.
-----. 2002. “Review Essay: Assessing The 2000 Presidential Election – Judicial and Social Science Perspectives.” Congress and the Presidency 29: 91-98 (No. 1, Spring)
-----. 2001. “Answering Ayres: Requiring Campaign Contributors to Remain Anonymous Would Not Resolve Corruption Concerns.” Regulation 24 (No. 4, Winter):24-29.
-----. 2001. “Presidential Emergency Powers.” Oxford Analytica Daily Brief, December 18. -----. 2001. “Hey, Wait a Minute: The Assumptions Behind the Case for Campaign Finance
Case: 3:15-cv-00324-jdp Document #: 71-1 Filed: 01/04/16 Page 5 of 12
5
Reform.” Gerald C. Lubenow, ed., A User’s Guide to Campaign Finance Reform (Lanham, MD: Rowman & Littlefield).
-----. 2001. “Everything You Thought You Knew About Impeachment Was Wrong.” Leonard V. Kaplan and Beverly I. Moran, ed., Aftermath: The Clinton Impeachment and the Presidency in the Age of Political Spectacle (New York: New York University Press). With David T. Canon.
-----. 2000. “Student Attitudes Toward Instructional Technology in the Large Introductory US Government Course.” PS: Political Science and Politics 33: no. 3 (September). With John Coleman.
-----. 2000. “The Institutionalization of Power.” Robert Y. Shapiro, Martha Joynt Kumar, and Lawrence R. Jacobs, ed. Presidential Power: Forging the Presidency for the 21st
Century (New York: Columbia University Press). With Thomas J. Weko. -----. 1999. “The Limits of Delegation – the Rise and Fall of BRAC.” Regulation 22:32-38
(No. 3, October) -----. 1999. “Executive Orders and Presidential Power.” The Journal of Politics 61:445-466 (No.
2, May). -----. 1997. Campaign Finance Reform in the States. Report prepared for and presented to the
Governor’s Blue Ribbon Commission on Campaign Finance Reform (State of Wisconsin). February. Portions reprinted in Anthony Corrado, Thomas E. Mann, Daniel R. Ortiz, Trevor Potter, and Frank J. Sorauf, ed. 1997. Campaign Finance Reform: A Sourcebook (Washington, D.C.: Brookings Institution)
----- 1996. "Bringing Politics Back In: Defense Policy and the Theoretical Study of Institutions and Processes." Public Administration Review 56:180-190 (with Anne Khademian).
-----. 1996. "Does Public Financing of Campaigns Work?" Trends in Campaign Financing, no. 3. Occasional Paper Series, Citizens' Research Foundation, Los Angeles, CA (with John M. Wood).
-----. 1995. "Closing Military Bases (Finally): Solving Collective Dilemmas Through Delegation." Legislative Studies Quarterly, 20:393-414.
-----. 1995. "Electoral Cycles in Federal Government Prime Contract Awards: State-Level Evidence from the 1988 and 1992 Presidential Elections." American Journal of Political Science 40:162-185.
-----. 1995. "The Impact of Public Financing on Electoral Competitiveness: Evidence from Wisconsin, 1964-1990." Legislative Studies Quarterly 20:69-88 (with John M. Wood).
-----. 1993. "Policy Disputes as a Source of Administrative Controls: Congressional Micromanagement of the Department of Defense," Public Administration Review 53:293-302.
-----. 1993. "Congressional-DoD Relations After the Cold War: The Politics of Uncertainty," in Downsizing Defense, Ethan Kapstein ed. Washington DC: Congressional Quarterly Press.
-----. 1993. "Combat Aircraft Production in the United States, 1950-2000: Maintaining Industry Capability in an Era of Shrinking Budgets." Defense Analysis 9:159-169.
-----. 1991. "Elections, Business Cycles, and the Timing of Defense Contract Awards in the United States," in The Political Economy of Military Spending, Alex Mintz ed. London: Routledge.
-----. 1990. "Patterns of Congressional Influence In Defense Contracting," in Arms, Politics, and the Economy: Contemporary and Historical Perspectives, Robert Higgs ed. New York: Holmes and Meier.
Case: 3:15-cv-00324-jdp Document #: 71-1 Filed: 01/04/16 Page 6 of 12
6
Other Publications and Book Reviews Kenneth R. Mayer. 2011. Review of Jason K. Dempsey, Our Army: Soldiers, Politicians, and
American Civil-Military Relations. The Forum 9 (No. 3). Available at: http://www.bepress.com/forum/vol9/iss3/art10
------. 2010. “Voting Early, but Not Often.” New York Times, October 25. With Barry C. Burden
------. 2008. Review of John Samples, The Fallacy of Campaign Finance Reform and Raymond J. La Raja, Small Change: Money, Political Parties, and Campaign Finance Reform , in The Forum 6 (No. 1). Available at http://www.bepress.com/forum/vol6/iss1/art18/
-----. 2007. Review Essay, Executing the Constitution: Putting the President Back Into the Constitution, Christopher S, Kelley, ed.; Presidents in Culture: The Meaning of Presidential Communication, David Michael Ryfe; Executive Orders and the Modern Presidency: Legislating from the Oval Office, Adam L. Warber. In Perspective on Politics 5:635-637 (No. 3, September)
-----. 2006. “Campaigns, Elections, and Campaign Finance Reform.” Focus on Law Studies, XXI, No. 2 (Spring 2006). American Bar Association, Division for Public Education.
-----. 2006. Issue Briefs (Midterm Elections, Homeland Security; Foreign Affairs and Defense Policy; Education; Budget and Economy; Entitlement Reform) 2006 Reporter’s Source Book. Project Vote Smart. With Meghan Condon.
-----. 2006. , “Sunlight as the Best Disinfectant: Campaign Finance in Australia.” Democratic Audit of Australia, Australian National University, October.
-----. 2006. “Return to the Norm,” Brisbane Courier-Mail, November 10. -----. 2004. Issue Briefs (Campaign Finance Reform, Homeland Security; Foreign Affairs and
Defense Policy; Education; Budget and Economy; Entitlement Reform), 2004 Reporter’s Source Book. Project Vote Smart. With Patricia Strach and Arnold Shober.
-----. 2004. “Where's That Crystal Ball When You Need It? Finicky Voters and Creaky Campaigns Made for a Surprise Electoral Season. And the Fun's Just Begun.” Madison Magazine. April.
-----. 2002. “Capitol Overkill.” Madison Magazine, July. -----. 2002. Issue Briefs (Homeland Security; Foreign Affairs and Defense Policy; Education;
Economy, Budget and Taxes; Social Welfare Policy), 2002 Reporter’s Source Book. Project Vote Smart. With Patricia Strach and Paul Manna.
-----. 1999. “An Analysis of the Issue of Issue Ads.” Guest Column Op-ed. Wisconsin State Journal, November 7.
-----. 1999. “Background of Issue Ad Controversy.” Guest Column Op-ed. Wisconsin State Journal, November 7.
-----. 1999. “Eliminating Public Funding Reduces Election Competition." Guest Column Op- ed. Wisconsin State Journal, June 27.
-----. 1998. Review of Executive Privilege: The Dilemma of Secrecy and Democratic Accountability, by Mark J. Rozell. Congress and the Presidency, 25.
-----. 1996. “Like Marriage, New Presidency Starts In Hope.” Wisconsin State Journal. March 31.
-----. 1994. Review of The Tyranny of the Majority: Fundamental Fairness in Representative Democracy, by Lani Guinier. Congress and the Presidency 21: 149-151.
-----. 1994. Review of The Best Defense: Policy Alternatives for U.S. Nuclear Security From the 1950s to the 1990s, by David Goldfischer. Science, Technology, and Environmental Politics Newsletter 6.
Case: 3:15-cv-00324-jdp Document #: 71-1 Filed: 01/04/16 Page 7 of 12
7
-----. 1993. Review of The Strategic Defense Initiative, by Edward Reiss. American Political Science Review 87: 1061-1062
-----. 1993. Review of The Political Economy of Defense: Issues and Perspectives, Andrew L. Ross ed. Armed Forces and Society 19:460-462.
-----. 1993. Review of Space Weapons and the Strategic Defense Initiative, by Crockett Grabbe. Annals of the American Academy of Political and Social Science 527: 193-194.
-----. 1992. "Limits Wouldn't Solve the Problem." Guest Column Op-ed. Wisconsin State Journal, November 5 (with David T. Canon).
-----. 1992. "Convention Ceded Middle Ground." Guest Column Op-ed. Wisconsin State Journal, August 23.
-----. 1992. "CBS Economy Poll Meaningless." Guest Column Op-ed. Wisconsin State Journal, February 3.
-----. 1988. "It's a Matter of Character: Pentagon Doesn't Need New Laws, it Needs Good People." Op-ed. Los Angeles Times, July 8.
Convention and Conference Papers Mayer, Kenneth. 2015. “What Happens at the Polling Place: Using Administrative Data to
Understand Irregularities at the Polls.” Presented at Conference on New Research on Election Administration and Reform, Massachusetts Institute of Technology, Cambridge, MA, June 8. With Barry C. Burden, David T. Canon, Donald P. Moynihan, and Jake R Neiheisel.
-----. 2013. “Election Laws and Partisan Gains: What are the Effects of Early Voting and Same Day Registration on the Parties' Vote Shares”. Presented at the 2013 Annual Meeting of the Midwest Political Science Association, Chicago, IL, April 11-14. Winner of the Robert H. Durr Award.
-----. 2011. “The Effect of Public Funding on Electoral Competition: Evidence from the 2008 and 2010 Cycles.” Presented at the 2011 Annual Meeting of the American Political Science Association, Seattle, WA, September 1-4. With Amnon Cavari.
-----.2011. “What Happens at the Polling Place: A Preliminary Analysis in the November 2008 General Election.” Presented at the 2011 Annual Meeting of the American Political Science Association, Seattle, WA, September 1-4. With Barry C. Burden, David T. Canon, Donald P. Moynihan, and Jake R. Neiheisel.
-----. 2010. “Election Laws, Mobilization, and Turnout: The Unanticipated Consequences of Election Reform.” With Barry C. Burden, David T. Canon, Stéphane Lavertu and Donald P. Moynihan. Presented at the 2010 Annual Meeting of the American Political Science Association, Washington, DC, September 2-5.
-----. 2010. “Selection Methods, Partisanship, and the Administration of Elections.” With Barry C. Burden, David T. Canon, Stéphane Lavertu and Donald P. Moynihan. Paper presented at the 2010 Annual Meeting of the Midwest Political Science Association, Chicago, IL, April 22-25. Revised version presented at the 2011 Annual Meeting of the European Political Science Association, June 16-19, Dublin, Ireland.
-----. 2009. “The Effects and Costs of Early Voting, Election Day Registration, and Same Day Registration in the 2008 Elections.” With Barry C. Burden, David T. Canon, and Donald P. Moynihan. Paper presented at the 2009 Annual Meeting of the American Political Science Association, Toronto, Canada, September 3-5.
-----. 2007. “Comparative Election Administration: Can We Learn Anything From the Australian Electoral Commission?” Paper presented at the 2007 Annual Meeting of the American Political Science Association, Chicago, IL, August 29-September 1.
Case: 3:15-cv-00324-jdp Document #: 71-1 Filed: 01/04/16 Page 8 of 12
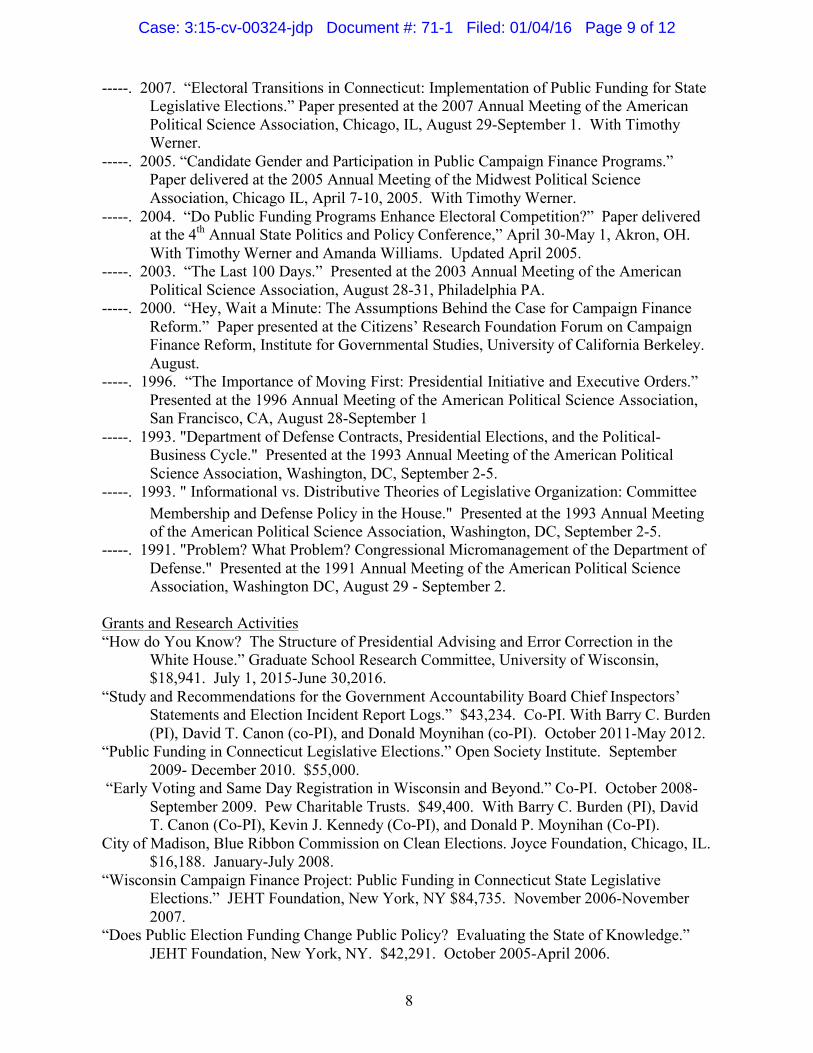
8
-----. 2007. “Electoral Transitions in Connecticut: Implementation of Public Funding for State Legislative Elections.” Paper presented at the 2007 Annual Meeting of the American Political Science Association, Chicago, IL, August 29-September 1. With Timothy Werner.
-----. 2005. “Candidate Gender and Participation in Public Campaign Finance Programs.” Paper delivered at the 2005 Annual Meeting of the Midwest Political Science Association, Chicago IL, April 7-10, 2005. With Timothy Werner.
-----. 2004. “Do Public Funding Programs Enhance Electoral Competition?” Paper delivered at the 4th Annual State Politics and Policy Conference,” April 30-May 1, Akron, OH. With Timothy Werner and Amanda Williams. Updated April 2005.
-----. 2003. “The Last 100 Days.” Presented at the 2003 Annual Meeting of the American Political Science Association, August 28-31, Philadelphia PA.
-----. 2000. “Hey, Wait a Minute: The Assumptions Behind the Case for Campaign Finance Reform.” Paper presented at the Citizens’ Research Foundation Forum on Campaign Finance Reform, Institute for Governmental Studies, University of California Berkeley. August.
-----. 1996. “The Importance of Moving First: Presidential Initiative and Executive Orders.” Presented at the 1996 Annual Meeting of the American Political Science Association, San Francisco, CA, August 28-September 1
-----. 1993. "Department of Defense Contracts, Presidential Elections, and the Political- Business Cycle." Presented at the 1993 Annual Meeting of the American Political Science Association, Washington, DC, September 2-5.
-----. 1993. " Informational vs. Distributive Theories of Legislative Organization: Committee Membership and Defense Policy in the House." Presented at the 1993 Annual Meeting of the American Political Science Association, Washington, DC, September 2-5.
-----. 1991. "Problem? What Problem? Congressional Micromanagement of the Department of Defense." Presented at the 1991 Annual Meeting of the American Political Science Association, Washington DC, August 29 - September 2.
Grants and Research Activities “How do You Know? The Structure of Presidential Advising and Error Correction in the
White House.” Graduate School Research Committee, University of Wisconsin, $18,941. July 1, 2015-June 30,2016.
“Study and Recommendations for the Government Accountability Board Chief Inspectors’ Statements and Election Incident Report Logs.” $43,234. Co-PI. With Barry C. Burden (PI), David T. Canon (co-PI), and Donald Moynihan (co-PI). October 2011-May 2012.
“Public Funding in Connecticut Legislative Elections.” Open Society Institute. September 2009- December 2010. $55,000.
“Early Voting and Same Day Registration in Wisconsin and Beyond.” Co-PI. October 2008- September 2009. Pew Charitable Trusts. $49,400. With Barry C. Burden (PI), David T. Canon (Co-PI), Kevin J. Kennedy (Co-PI), and Donald P. Moynihan (Co-PI).
City of Madison, Blue Ribbon Commission on Clean Elections. Joyce Foundation, Chicago, IL. $16,188. January-July 2008.
“Wisconsin Campaign Finance Project: Public Funding in Connecticut State Legislative Elections.” JEHT Foundation, New York, NY $84,735. November 2006-November 2007.
“Does Public Election Funding Change Public Policy? Evaluating the State of Knowledge.” JEHT Foundation, New York, NY. $42,291. October 2005-April 2006.
Case: 3:15-cv-00324-jdp Document #: 71-1 Filed: 01/04/16 Page 9 of 12
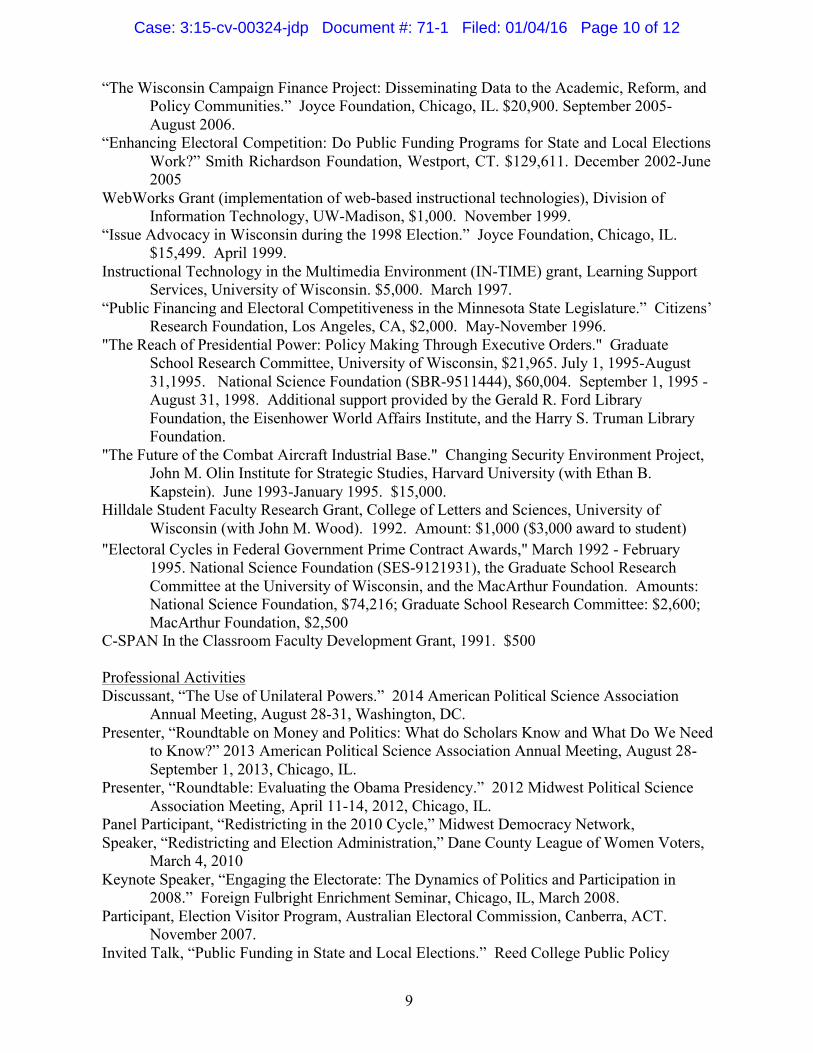
9
“The Wisconsin Campaign Finance Project: Disseminating Data to the Academic, Reform, and Policy Communities.” Joyce Foundation, Chicago, IL. $20,900. September 2005- August 2006.
“Enhancing Electoral Competition: Do Public Funding Programs for State and Local Elections Work?” Smith Richardson Foundation, Westport, CT. $129,611. December 2002-June 2005
WebWorks Grant (implementation of web-based instructional technologies), Division of Information Technology, UW-Madison, $1,000. November 1999.
“Issue Advocacy in Wisconsin during the 1998 Election.” Joyce Foundation, Chicago, IL. $15,499. April 1999.
Instructional Technology in the Multimedia Environment (IN-TIME) grant, Learning Support Services, University of Wisconsin. $5,000. March 1997.
“Public Financing and Electoral Competitiveness in the Minnesota State Legislature.” Citizens’ Research Foundation, Los Angeles, CA, $2,000. May-November 1996.
"The Reach of Presidential Power: Policy Making Through Executive Orders." Graduate School Research Committee, University of Wisconsin, $21,965. July 1, 1995-August 31,1995. National Science Foundation (SBR-9511444), $60,004. September 1, 1995 - August 31, 1998. Additional support provided by the Gerald R. Ford Library Foundation, the Eisenhower World Affairs Institute, and the Harry S. Truman Library Foundation.
"The Future of the Combat Aircraft Industrial Base." Changing Security Environment Project, John M. Olin Institute for Strategic Studies, Harvard University (with Ethan B. Kapstein). June 1993-January 1995. $15,000.
Hilldale Student Faculty Research Grant, College of Letters and Sciences, University of Wisconsin (with John M. Wood). 1992. Amount: $1,000 ($3,000 award to student)
"Electoral Cycles in Federal Government Prime Contract Awards," March 1992 - February 1995. National Science Foundation (SES-9121931), the Graduate School Research Committee at the University of Wisconsin, and the MacArthur Foundation. Amounts: National Science Foundation, $74,216; Graduate School Research Committee: $2,600; MacArthur Foundation, $2,500
C-SPAN In the Classroom Faculty Development Grant, 1991. $500 Professional Activities Discussant, “The Use of Unilateral Powers.” 2014 American Political Science Association
Annual Meeting, August 28-31, Washington, DC. Presenter, “Roundtable on Money and Politics: What do Scholars Know and What Do We Need
to Know?” 2013 American Political Science Association Annual Meeting, August 28- September 1, 2013, Chicago, IL.
Presenter, “Roundtable: Evaluating the Obama Presidency.” 2012 Midwest Political Science Association Meeting, April 11-14, 2012, Chicago, IL.
Panel Participant, “Redistricting in the 2010 Cycle,” Midwest Democracy Network, Speaker, “Redistricting and Election Administration,” Dane County League of Women Voters,
March 4, 2010 Keynote Speaker, “Engaging the Electorate: The Dynamics of Politics and Participation in
2008.” Foreign Fulbright Enrichment Seminar, Chicago, IL, March 2008. Participant, Election Visitor Program, Australian Electoral Commission, Canberra, ACT.
November 2007. Invited Talk, “Public Funding in State and Local Elections.” Reed College Public Policy
Case: 3:15-cv-00324-jdp Document #: 71-1 Filed: 01/04/16 Page 10 of 12
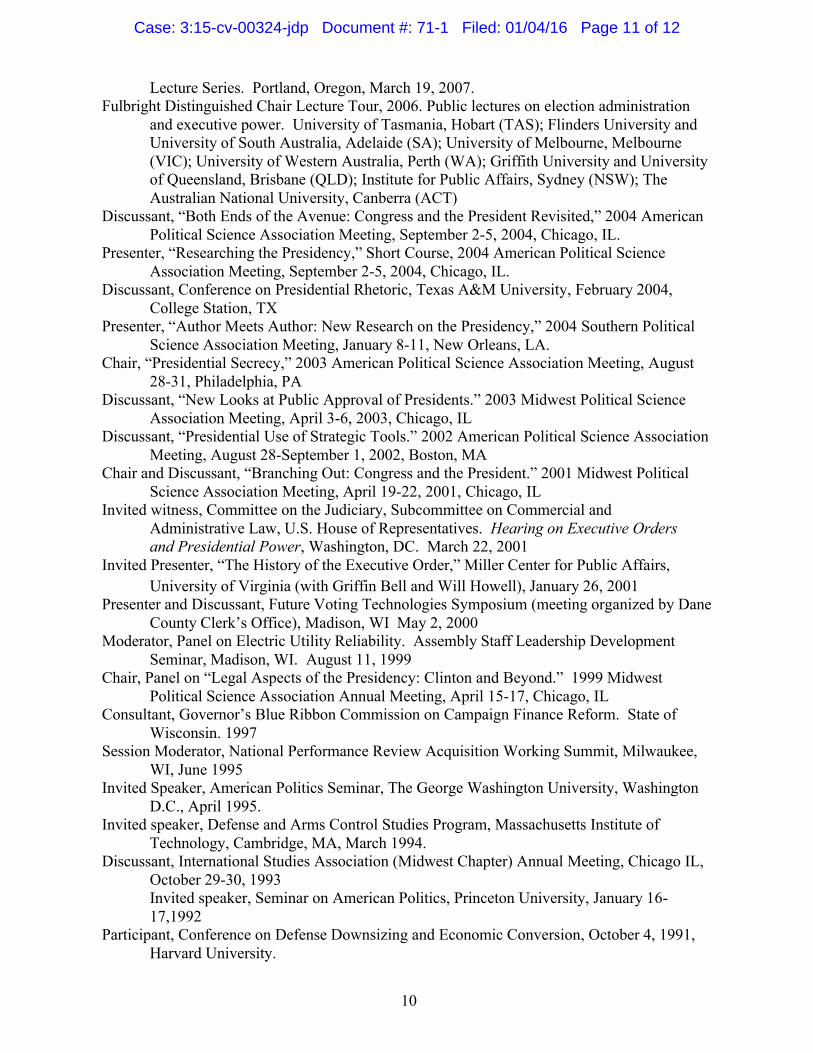
10
Lecture Series. Portland, Oregon, March 19, 2007. Fulbright Distinguished Chair Lecture Tour, 2006. Public lectures on election administration
and executive power. University of Tasmania, Hobart (TAS); Flinders University and University of South Australia, Adelaide (SA); University of Melbourne, Melbourne (VIC); University of Western Australia, Perth (WA); Griffith University and University of Queensland, Brisbane (QLD); Institute for Public Affairs, Sydney (NSW); The Australian National University, Canberra (ACT)
Discussant, “Both Ends of the Avenue: Congress and the President Revisited,” 2004 American Political Science Association Meeting, September 2-5, 2004, Chicago, IL.
Presenter, “Researching the Presidency,” Short Course, 2004 American Political Science Association Meeting, September 2-5, 2004, Chicago, IL.
Discussant, Conference on Presidential Rhetoric, Texas A&M University, February 2004, College Station, TX
Presenter, “Author Meets Author: New Research on the Presidency,” 2004 Southern Political Science Association Meeting, January 8-11, New Orleans, LA.
Chair, “Presidential Secrecy,” 2003 American Political Science Association Meeting, August 28-31, Philadelphia, PA
Discussant, “New Looks at Public Approval of Presidents.” 2003 Midwest Political Science Association Meeting, April 3-6, 2003, Chicago, IL
Discussant, “Presidential Use of Strategic Tools.” 2002 American Political Science Association Meeting, August 28-September 1, 2002, Boston, MA
Chair and Discussant, “Branching Out: Congress and the President.” 2001 Midwest Political Science Association Meeting, April 19-22, 2001, Chicago, IL
Invited witness, Committee on the Judiciary, Subcommittee on Commercial and Administrative Law, U.S. House of Representatives. Hearing on Executive Orders and Presidential Power, Washington, DC. March 22, 2001
Invited Presenter, “The History of the Executive Order,” Miller Center for Public Affairs, University of Virginia (with Griffin Bell and Will Howell), January 26, 2001
Presenter and Discussant, Future Voting Technologies Symposium (meeting organized by Dane County Clerk’s Office), Madison, WI May 2, 2000
Moderator, Panel on Electric Utility Reliability. Assembly Staff Leadership Development Seminar, Madison, WI. August 11, 1999
Chair, Panel on “Legal Aspects of the Presidency: Clinton and Beyond.” 1999 Midwest Political Science Association Annual Meeting, April 15-17, Chicago, IL
Consultant, Governor’s Blue Ribbon Commission on Campaign Finance Reform. State of Wisconsin. 1997
Session Moderator, National Performance Review Acquisition Working Summit, Milwaukee, WI, June 1995
Invited Speaker, American Politics Seminar, The George Washington University, Washington D.C., April 1995.
Invited speaker, Defense and Arms Control Studies Program, Massachusetts Institute of Technology, Cambridge, MA, March 1994.
Discussant, International Studies Association (Midwest Chapter) Annual Meeting, Chicago IL, October 29-30, 1993 Invited speaker, Seminar on American Politics, Princeton University, January 16- 17,1992
Participant, Conference on Defense Downsizing and Economic Conversion, October 4, 1991, Harvard University.
Case: 3:15-cv-00324-jdp Document #: 71-1 Filed: 01/04/16 Page 11 of 12
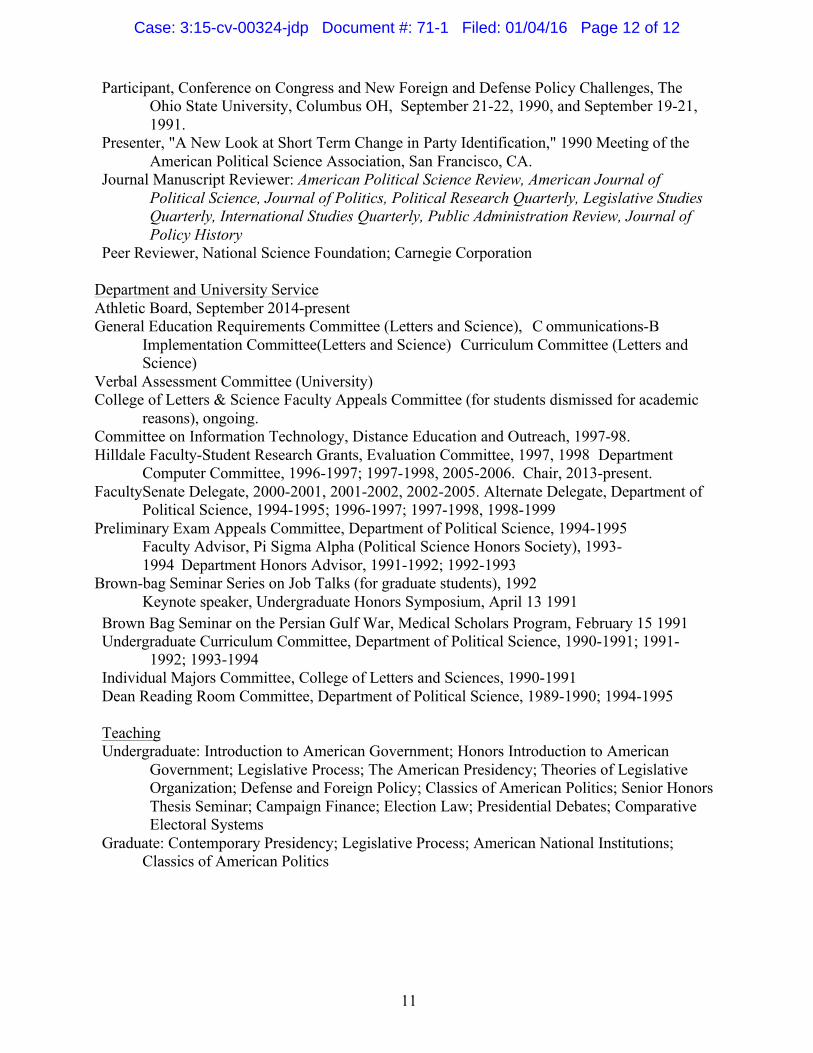
11
Participant, Conference on Congress and New Foreign and Defense Policy Challenges, The Ohio State University, Columbus OH, September 21-22, 1990, and September 19-21, 1991.
Presenter, "A New Look at Short Term Change in Party Identification," 1990 Meeting of the American Political Science Association, San Francisco, CA.
Journal Manuscript Reviewer: American Political Science Review, American Journal of Political Science, Journal of Politics, Political Research Quarterly, Legislative Studies Quarterly, International Studies Quarterly, Public Administration Review, Journal of Policy History
Peer Reviewer, National Science Foundation; Carnegie Corporation Department and University Service Athletic Board, September 2014-present General Education Requirements Committee (Letters and Science), C ommunications-B
Implementation Committee(Letters and Science) Curriculum Committee (Letters and Science)
Verbal Assessment Committee (University) College of Letters & Science Faculty Appeals Committee (for students dismissed for academic
reasons), ongoing. Committee on Information Technology, Distance Education and Outreach, 1997-98. Hilldale Faculty-Student Research Grants, Evaluation Committee, 1997, 1998 Department
Computer Committee, 1996-1997; 1997-1998, 2005-2006. Chair, 2013-present. FacultySenate Delegate, 2000-2001, 2001-2002, 2002-2005. Alternate Delegate, Department of
Political Science, 1994-1995; 1996-1997; 1997-1998, 1998-1999 Preliminary Exam Appeals Committee, Department of Political Science, 1994-1995
Faculty Advisor, Pi Sigma Alpha (Political Science Honors Society), 1993-1994 Department Honors Advisor, 1991-1992; 1992-1993
Brown-bag Seminar Series on Job Talks (for graduate students), 1992 Keynote speaker, Undergraduate Honors Symposium, April 13 1991
Brown Bag Seminar on the Persian Gulf War, Medical Scholars Program, February 15 1991 Undergraduate Curriculum Committee, Department of Political Science, 1990-1991; 1991-
1992; 1993-1994 Individual Majors Committee, College of Letters and Sciences, 1990-1991 Dean Reading Room Committee, Department of Political Science, 1989-1990; 1994-1995
Teaching Undergraduate: Introduction to American Government; Honors Introduction to American
Government; Legislative Process; The American Presidency; Theories of Legislative Organization; Defense and Foreign Policy; Classics of American Politics; Senior Honors Thesis Seminar; Campaign Finance; Election Law; Presidential Debates; Comparative Electoral Systems
Graduate: Contemporary Presidency; Legislative Process; American National Institutions; Classics of American Politics
Case: 3:15-cv-00324-jdp Document #: 71-1 Filed: 01/04/16 Page 12 of 12