carter’s, inc. 2012 annual report carters.com | oshkoshbgosh
TRANSCRIPT

Carter’s, Inc. 2012 A
nnual Report
Carter’s, Inc. 2012 Annual ReportCarter’s, Inc. | 1170 Peachtree Street NE, Suite 900 | Atlanta, Georgia 30309 | 404-745-2700carters.com | oshkoshbgosh.com

248097_OshKosh_CVR_R5.indd 2 4/4/13 11:27 PM

The day they’re born your life begins.
It’s the tiniest hands and smallest feet that lead you on the journey of a lifetime.
And through every moment, you can count on Carter’s to be right there with you.
We pay attention to all of the little details that make getting dressed
easier for moms and more comfortable for kids.
So, bathe them in love and count on Carter’s to clothe them in comfort,
from their first night home to their first day of school and every first in between.
Dear Fellow Shareholders, 2012 was a very good year for our Company. We achieved a record level of sales and earnings, gained market share, and enabled exceptional returns for our shareholders.
2012 Highlights:
•Increasedsalesby13%to$2.4billion,our24thconsecutiveyearofsalesgrowth •Grewsalesineverydistributionchannel–wholesale,retailstores,andonline •ImprovedourmarketshareintheUnitedStatesto16.5%,whichrepresents over70%moresharethanournearestcompetitor •Increasednetincomeby41%to$161million •Generatedrecordoperatingcashflowof$279million •Enableda36%increaseinshareholdervalue
Our Focus
Overthepastdecade,weachievedacompoundannualgrowthrateof15%insalesand24%innetincome.Tobuildonthistrackrecordofgrowth,wearefocusedonthefollowing priorities for our business:
•Leadthemarketinproductvalueandbrandpresentation We are fortunate to own two of the best known and most trusted brands in baby and young children’s apparel, Carter’s and OshKosh B’gosh.Generationsoffamilies have trusted our iconic brands for quality and value.
In 2012, we focused on strengthening our product offerings, brand marketing, and supply chain capabilities. Consumers responded favorably to the compelling value and presentation of our brands with strong demand across all channels of distribution. •Extendthereachofourbrands Wearethelargestbrandedmarketerofyoungchildren’sapparelintheUnited States. Our brands are sold in nearly 18,000 stores by national and regional retailers, in our own stores, and online. In 2012, our sales grew with nearly all of our largest wholesale partners. These are very important relationships with many of the best retailers in the country, and we work hard every day to help strengthen their children’s apparel business. This past year,wewerehonoredtoberecognizedbyWalmartandBabies“R”UsasaSupplier oftheYear.Theseawardsreflecttheeffortsofmanytalentedemployeesthroughout our Company.
We continue to improve the convenience of shopping for our brands. In 2012, we opened63Carter’s and 8 OshKoshstoresintheUnitedStates,bringingourtotal storecountto581.Mostofthesestoresarelocatedinoutletcenters.Overthepast decade, we have successfully extended our retail store model to non-outlet centers in more densely populated areas. We believe we have significant opportunities for growth in our retail business.
OurneweCommercebusinessnearlydoubledto$142millioninsalesin2012. Consumers clearly enjoy the convenience of shopping for our brands online. We expectoureCommercebusinesstogrowtonearly$200millioninsalesin2013 andreach$300millioninsalesby2017.
Our international operations have continued to grow as an important component ofourbusiness.In2012,internationalsalesgrew60%andrepresented9%ofour Company'ssalesand17%ofouroperatingincome.
Over the past year, we opened 18 retail stores in Canada, grew sales with our global wholesale partners, and established eCommerce capabilities to extend the reach of our brands to more than 80 countries.
Ourlonger-termobjectiveistoreplicateoursuccessfulU.S.multi-channelmodel in key international markets. Near-term, our focus is growing market share in Canada, Japan, and China. Collectively, the market for young children’s apparel in thesecountriesisestimatedtobe$25billion.Wecurrentlyhavelessthan1%total share of these markets, which we believe provide meaningful opportunity for growth.
•Improveprofitability We made good progress in 2012 recovering from the abnormal spike in cotton prices which impacted our profitability in 2011 and the first half of 2012. To improve profitability, we strengthened our product offerings, pricing and promotional strategies, and supply chain capabilities.
In 2012, we acquired one of our sourcing agents based in Hong Kong to help us accelerate our direct sourcing strategy. We also invested in a long-term lease of aonemillionsquarefootdistributioncenterinGeorgia.Thisfacilityenabledusto support the growth of eCommerce sales last year and is expected to support our growth plans for all channels of distribution in the years to come.
We are committed to improving our operating margin to its peak level of 14%overtimeby:
•growingourhighmarginretail,eCommerce,andinternationalbusinesses; •strengtheningoursupplychaincapabilities; • improvinginventorymanagementdisciplines;and • improvingOshKosh profitability.
Weareplanninggoodgrowthinsalesandearningsin2013.Tofurtherstrengthenour business we are making significant investments this year to consolidate our ConnecticutoperationsintoanewheadquartersinGeorgia,buildoutournewmulti-channel distribution center, integrate our new operations in Japan, and strengthen our information systems.
We consider ourselves fortunate to own the iconic Carter’s and OshKosh B'gosh brands and to have so many opportunities to grow and improve our business. We are also fortunate to be supported by a very talented and engaged organization that is passionate about providing the best value and experience in young children’s apparel.
On behalf of our Board of Directors, Leadership Team, and all of our employees, thank you for your investment in Carter’s.
Sincerely,
MichaelD.CaseyChairmanandChiefExecutiveOfficer
April4,2013

*$100investedon12/31/07instockorindex,includingreinvestmentofdividends.YearsendedDecember31. Carter’s,Inc.wasaddedtotheS&PMidCap400indexandremovedfromtheS&PSmallCap600indexafter thecloseoftradingon1/13/2012.
Copyright©2013S&P,adivisionofTheMcGraw-HillCompaniesInc.Allrightsreserved.
FinancialHighlights(dollars in thousands, except per share data)
Fiscal Fiscal FiscalSummary of Operations 2012 2011 2010
As reported (a)
Net sales $2,381,734 $2,109,734 $1,749,256
Grossmargin 39.4% 32.8% 38.6%
Operating income $261,986 $187,466 $243,256
Operating margin 11.0% 8.9% 13.9%
Net income $161,150 $114,016 $146,472
Diluted earnings per share $2.69 $1.94 $2.46
Net cash provided by operating activities $278,619 $81,074 $85,821
As adjusted (b)
Operating income $275,065 $199,672 $243,256
Operating margin 11.5% 9.5% 13.9%
Net income $170,717 $123,229 $146,472
Diluted earnings per share $2.85 $2.09 $2.46
(a)Results“asreported”arepresentedinaccordancewithaccountingprinciplesgenerallyacceptedintheUnitedStatesofAmerica(“GAAP”).(b)Results“asadjusted”arenon-GAAPfinancialmeasurements.Areconciliationofresults“asreported”toresults“asadjusted”immediately
followsourAnnualReportonForm10-Konpage92.
Carter’s, Inc.
S&P500
S&PSmallCap600
S&P Apparel Retail
S&PMidCap400
$300
$250
$200
$150
$200
$150
$100
$50
12/07 12/08 12/09 12/10 12/11 12/12
ComparisonofFiveYearCumulativeTotalReturn*AmongCarter’s,Inc.,theS&P500Index,theS&PSmallCap600Index,theS&PMidCap400IndexandtheS&PApparelRetailIndex
OurStory
Carter’s,Inc.ownsthelargestshareofthe$21billionbabyandyoungchildren’sapparelmarket(ageszerotoseven)intheUnitedStates.Weowntwoofthebestknownandtrusted brand names in young children’s apparel, Carter’s and OshKosh B’gosh. Both of theseiconicbrandshavemorethan100yearsofrichhistory;Carter’swasestablishedin1865andOshKoshB’Goshin1895.OurGenuine Kids, Just One You, and Precious Firsts brands are sold at Target, and our Child of Mine brand is sold at Walmart.
We have the broadest distribution of young children’s apparel in the market. In 2012, ourmulti-channelbusinessmodelgeneratednearly$2.4billioninnetsales.IntheUnitedStates,wereachawiderangeofconsumersthroughnearly18,000stores,includingthelargestretailersinthecountry,581Company-operatedstores,andourwebsites. Internationally, we reach consumers in approximately 80 countries through 82 Company-operated stores in Canada, approximately 100 retail points of sale in Japan, our websites, and wholesale and licensing partnerships. We offer a broad productassortment–includingbaby,sleepwear,playclothes,andrelatedaccessories–allatveryaffordableprices.

Form 10-K
2012 Annual Report
Form 10-K

Form 10-K
UNITED STATES SECURITIES AND EXCHANGE COMMISSION
Washington, D.C. 20549
FORM 10-Kx ANNUAL REPORT PURSUANT TO SECTION 13 OR 15(d) OF THE
SECURITIES EXCHANGE ACT OF 1934 FOR THE FISCAL YEAR ENDED DECEMBER 29, 2012
OR
¨ TRANSITION REPORT PURSUANT TO SECTION 13 OR 15(d) OF THE SECURITIES EXCHANGE ACT OF 1934 FOR THE TRANSITION PERIOD FROM TO
Commission file number: 001-31829
CARTER’S, INC.(Exact name of Registrant as specified in its charter)
Delaware 13-3912933(State or other jurisdiction of
incorporation or organization) (I.R.S. Employer
Identification No.)
The Proscenium 1170 Peachtree Street NE, Suite 900
Atlanta, Georgia 30309(Address of principal executive offices, including zip code)
(404) 745-2700(Registrant’s telephone number, including area code)
SECURITIES REGISTERED PURSUANT TO SECTION 12(b) OF THE ACT:
TITLE OF EACH CLASS NAME OF EACH EXCHANGE ON WHICH REGISTERED
Carter’s, Inc.’s common stock par value $0.01 per share New York Stock Exchange
SECURITIES REGISTERED PURSUANT TO SECTION 12(g) OF THE ACT:None
Indicate by check mark if the Registrant is a well-known seasoned issuer, as defined in Rule 405 of the Securities Act. Yes x No ¨
Indicate by check mark if the Registrant is not required to file reports pursuant to Section 13 or Section 15(d) of the Act. Yes ¨ No x
Indicate by check mark whether the Registrant (1) has filed all reports required to be filed by Section 13 or 15(d) of the Securities Exchange Act of 1934 during the preceding 12 months (or for such shorter period that the Registrant was required to file such reports), and (2) has been subject to such filing requirements for the past 90 days. Yes x No ¨
Indicate by check mark whether the Registrant has submitted electronically and posted on its corporate website, if any, every Interactive Data File required to be submitted and posted pursuant to Rule 405 of Regulation S-T (§232.405 of this chapter) during the preceding 12 months (or for such shorter period that the Registrant was required to submit and post such files). Yes x No ¨
Indicate by check mark if disclosure of delinquent filers pursuant to Item 405 of Regulation S-K is not contained herein, and will not be contained, to the best of the Registrant’s knowledge, in definitive proxy or information statements incorporated by reference in Part III of this Form 10-K or any amendment to this Form 10-K. x
Indicate by check mark whether the Registrant is a large accelerated filer, an accelerated filer, a non-accelerated filer, or a smaller reporting company. See definitions of “large accelerated filer,” “accelerated filer,” and “smaller reporting company” in Rule 12b-2 of the Exchange Act. (Check one):Large Accelerated Filer x Accelerated Filer ¨ Non-Accelerated Filer ¨ Smaller Reporting Company ¨
Indicate by check mark whether the Registrant is a shell company (as defined in Rule 12b-2 of the Exchange Act). Yes ¨ No x
The approximate aggregate market value of the voting stock held by non-affiliates of the Registrant as of June 30, 2012 (the last business day of our most recently completed second quarter) was $3,036,300,705.
There were 59,348,239 shares of Carter’s, Inc. common stock with a par value of $0.01 per share outstanding as of the close of business on February 25, 2013.
DOCUMENTS INCORPORATED BY REFERENCE
Portions of the definitive proxy statement to be filed with the Securities and Exchange Commission pursuant to Regulation 14A relating to the Annual Meeting of shareholders of Carter’s, Inc., to be held on May 9, 2013, will be incorporated by reference in Part III of this Form 10-K. Carter’s, Inc. intends to file such proxy statement with the Securities and Exchange Commission not later than 120 days after its fiscal year ended December 29, 2012.

CARTER’S, INC.
INDEX TO ANNUAL REPORT ON FORM 10-K FOR FISCAL YEAR ENDED DECEMBER 29, 2012
PagePart I
Item 1 Business. . . . . . . . . . . . . . . . . . . . . . . . . . . . . . . . . . . . . . . . . . . . . . . . . . . . . . . . . . . . . . . . . 1Item 1A Risk Factors . . . . . . . . . . . . . . . . . . . . . . . . . . . . . . . . . . . . . . . . . . . . . . . . . . . . . . . . . . . . . 7Item 1B Unresolved Staff Comments. . . . . . . . . . . . . . . . . . . . . . . . . . . . . . . . . . . . . . . . . . . . . . . . 14Item 2 Properties . . . . . . . . . . . . . . . . . . . . . . . . . . . . . . . . . . . . . . . . . . . . . . . . . . . . . . . . . . . . . . . 15Item 3 Legal Proceedings . . . . . . . . . . . . . . . . . . . . . . . . . . . . . . . . . . . . . . . . . . . . . . . . . . . . . . . . 15Item 4 Mine Safety Disclosures . . . . . . . . . . . . . . . . . . . . . . . . . . . . . . . . . . . . . . . . . . . . . . . . . . . 15
Part IIItem 5 Market for Registrant’s Common Equity, Related Stockholder Matters, and Issuer
Purchases of Equity Securities . . . . . . . . . . . . . . . . . . . . . . . . . . . . . . . . . . . . . . . . . . . 16Item 6 Selected Financial Data . . . . . . . . . . . . . . . . . . . . . . . . . . . . . . . . . . . . . . . . . . . . . . . . . . . 18Item 7 Management’s Discussion and Analysis of Financial Condition and Results
of Operations . . . . . . . . . . . . . . . . . . . . . . . . . . . . . . . . . . . . . . . . . . . . . . . . . . . . . . . . . 20Item 7A Quantitative and Qualitative Disclosures about Market Risk . . . . . . . . . . . . . . . . . . . . 38Item 8 Financial Statements and Supplementary Data . . . . . . . . . . . . . . . . . . . . . . . . . . . . . . . . 39Item 9 Changes in and Disagreements with Accountants on Accounting and Financial
Disclosure . . . . . . . . . . . . . . . . . . . . . . . . . . . . . . . . . . . . . . . . . . . . . . . . . . . . . . . . . . . . 82Item 9A Controls and Procedures. . . . . . . . . . . . . . . . . . . . . . . . . . . . . . . . . . . . . . . . . . . . . . . . . . . 82Item 9B Other Information . . . . . . . . . . . . . . . . . . . . . . . . . . . . . . . . . . . . . . . . . . . . . . . . . . . . . . . . 83
Part III Item 10 Directors and Executive Officers of the Registrant. . . . . . . . . . . . . . . . . . . . . . . . . . . . . 84Item 11 Executive Compensation. . . . . . . . . . . . . . . . . . . . . . . . . . . . . . . . . . . . . . . . . . . . . . . . . . . 84Item 12 Security Ownership of Certain Beneficial Owners and Management and Related
Stockholder Matters. . . . . . . . . . . . . . . . . . . . . . . . . . . . . . . . . . . . . . . . . . . . . . . . . . . . 84Item 13 Certain Relationships and Related Transactions . . . . . . . . . . . . . . . . . . . . . . . . . . . . . . . 84Item 14 Principal Accountant Fees and Services . . . . . . . . . . . . . . . . . . . . . . . . . . . . . . . . . . . . . . 84
Part IVItem 15 Exhibits and Financial Statement Schedules . . . . . . . . . . . . . . . . . . . . . . . . . . . . . . . . . . 85
SIGNATURES . . . . . . . . . . . . . . . . . . . . . . . . . . . . . . . . . . . . . . . . . . . . . . . . . . . . . . . . . . . . . . . . . . . . . . . . 88
CERTIFICATIONS . . . . . . . . . . . . . . . . . . . . . . . . . . . . . . . . . . . . . . . . . . . . . . . . . . . . . . . . . . . . . . . . . . . . 89

1
Form 10-K
PART I
Our market share data is based on information provided by The NPD Group, Inc. (“NPD”). Unless otherwise indicated, references to market share in this Annual Report on Form 10-K are expressed as a percentage of total children’s retail sales for a segment of the market. As the Company defines it, the baby and young children’s apparel market includes apparel and related products for ages zero to seven.
The NPD market share data presented is based on NPD’s definition of the baby and playclothes categories, which are different from the Company’s definitions of these categories. The data presented is based upon The NPD Group/Consumer Tracking Service for Children’s Apparel in the United States (“U.S.”) and represents the twelve month period ending December, 2012.
Unless the context indicates otherwise, in this filing on Form 10-K, “Carter’s,” the “Company,” “we,” “us,” “its,” and “our” refers to Carter’s, Inc. and its wholly owned subsidiaries.
ITEM 1. BUSINESS
GENERAL
We are the largest branded marketer in the U.S. of apparel exclusively for babies and young children. We own two of the most highly recognized and most trusted brand names in the children’s apparel industry, Carter’s and OshKosh B’gosh. Established in 1865, our Carter’s brand is recognized and trusted by consumers for high-quality apparel for children sizes newborn to seven. Established in 1895, OshKosh is a well-known brand, trusted by consumers for its line of apparel for children sizes newborn to 12. We have extensive experience in the young children’s apparel market and focus on delivering products that satisfy our consumers’ needs. Our strategy is to market high-quality, essential core products at prices that deliver an attractive value proposition for consumers.
In the U.S., our products are sold through approximately 17,000 wholesale locations (including national department stores, chain and specialty stores, and discount retailers), 581 Company-operated stores and our websites. As of December 29, 2012, we operated 413 Carter’s and 168 OshKosh outlet, brand, and specialty stores in the U.S. Internationally, as of December 29, 2012, our products are sold via 82 Company-operated stores in Canada, in addition to our wholesale, licensing, and online channels.
We believe each of our brands has its own unique positioning in the marketplace. In the U.S., our brands compete in the $21 billion children’s apparel market, for children ages zero to seven, with our Carter’s brand achieving the #1 position with a 13.9% market share and our OshKosh brand having a 2.6% market share. We offer multiple product categories, including baby, sleepwear, playclothes, and other accessories. Our distribution strategy enables us to reach a broad range of consumers across various channels, socio-economic groups, and geographic regions.
On June 30, 2011, we purchased Bonnie Togs (the “Acquisition”), a Canadian specialty retailer focused exclusively on the children’s apparel and accessories marketplace. Prior to the Acquisition, Bonnie Togs was a significant international licensee of the Company. The operating results for the Canadian business have been consolidated in the Company’s operating results effective from the date of the Acquisition.
The Company is organized into the following five business segments: Carter’s wholesale, Carter’s retail, OshKosh retail, OshKosh wholesale, and international.
The Company is a Delaware corporation. The Company and its predecessors have been doing business since 1865. The Company’s principal executive offices are located at The Proscenium, 1170 Peachtree Street NE, Suite 900, Atlanta, Georgia 30309, and our telephone number is (404) 745-2700.

2
OUR BRANDS, PRODUCTS, AND DISTRIBUTION CHANNELS
CARTER’S BRANDS — U.S.
Under our Carter’s brand, we design, source, and market a broad array of products, primarily for sizes newborn to seven. Our Carter’s brand is sold in department stores, national chains, specialty stores, off-price sales channels, through our Carter’s retail stores, and online at www.carters.com. Additionally, we sell our Child of Mine brands at Walmart and our Just One You and Precious Firsts brands at Target. In fiscal 2012, we sold over 289 million units of Carter’s, Child of Mine, Just One You, and Precious Firsts products in the U.S., an increase of approximately 4% from fiscal 2011. Our strategy is to drive sales growth through our focus on essential, high-volume, core apparel products for babies and young children. Such products include bodysuits, pajamas, blanket sleepers, gowns, bibs, and receiving blankets. Our top ten core baby and sleepwear products accounted for approximately 60% of our baby and sleepwear net sales in fiscal 2012 in the U.S. We believe our core apparel products are essential consumer staples and less dependent on changes in fashion trends.
We have cross-functional product teams focused on the development of our Carter’s baby, sleepwear, and playclothes products. These teams are skilled in identifying and developing high-volume, core products. Each team includes members from merchandising, design, sourcing, product development, forecasting, and supply chain logistics. These teams follow a disciplined approach to fabric usage, color rationalization, and productivity and are supported by a dedicated art department and state-of-the-art design systems. We also license our brand names to other companies to create a broad collection of lifestyle products, including bedding, hosiery, shoes, room décor, furniture, gear, and toys. The licensing team directs the use of our designs, art, and selling strategies to all licensees.
We believe this disciplined approach to core product design results in compelling product offering to consumers, reduces our exposure to fashion risk, and supports efficient operations. We conduct consumer research as part of our product development process and engage in product testing in our own stores.
CARTER’S BRAND POSITIONING — U.S.
Our strategy is to drive our brand image as the leader in baby and young children’s apparel and to consistently provide high-quality products at a great value to consumers. We employ a disciplined merchandising strategy that identifies and focuses on core products. We believe that we have strengthened our brand image with the consumer by differentiating our core products through fabric improvements, new artistic applications, and new packaging and presentation strategies. We also attempt to differentiate our products through store-in-store fixturing, branding and signage packages, and advertising. We have invested in display fixtures for our major wholesale customers that more clearly present our core products on their floors to enhance brand and product presentation. We also strive to provide our wholesale customers with a consistent, high-level of service, including delivering and replenishing products on time to fulfill customer needs. Our retail stores focus on the customer experience through store design, visual enhancements, clear product presentation, and experienced customer service.
CARTER’S PRODUCTS — U.S.
Baby
Carter’s brand baby products include bodysuits, pants, undershirts, receiving blankets, layette gowns, bibs, caps, and booties. In fiscal 2012, we generated $784.1 million in net sales of these products in the U.S., representing 32.9% of our consolidated net sales.
Our Carter’s brand is the leading brand in the baby category in the U.S. In fiscal 2012, in the department stores, national chains, outlet, specialty stores, and off-price sales channels, our aggregate Carter’s brand market share in the U.S. was approximately 24.0% for baby ages zero to two, which represents nearly five times the market share of the next largest brand. We sell a complete range of baby products for newborns, primarily made of cotton. We attribute our leading market position to our brand strength, distinctive

3
Form 10-K
print designs, artistic applications, reputation for quality, and ability to manage our dedicated floor space for our retail customers. We tier our products through marketing programs targeted toward gift-givers, experienced mothers, and first-time mothers. Our Carter’s Little Layette product line, the largest component of our baby business, provides parents with essential core products and accessories, including value-focused multi-packs. Our Little Collections product line consists of coordinated baby programs designed for first-time mothers and gift-givers.
Playclothes
Carter’s brand playclothes products include knit and woven cotton apparel for everyday use in sizes three months to seven. In fiscal 2012, we generated $596.4 million in net sales of these products in the U.S., or 25.0%, of our consolidated net sales. We continue to focus on building our Carter’s brand in the playclothes market by developing a base of essential, high-volume, core products that utilize original print designs and innovative artistic applications. Our aggregate 2012 Carter’s brand playclothes market share in the U.S. was approximately 13.8% in the $16 billion department store, national chain, outlet, specialty store, and off-price sales channels.
Sleepwear
Carter’s brand sleepwear products include pajamas and blanket sleepers in sizes 12 months to seven. In fiscal 2012, we generated $305.8 million in net sales of these products in the U.S., or 12.8%, of our consolidated net sales. Our Carter’s brand is the leading brand of sleepwear for babies and young children within the department store, national chain, outlet, specialty store, and off-price sales channels in the U.S. In fiscal 2012, in these channels, our Carter’s brand market share was approximately 26.8%, which represents more than three times the market share of the next largest brand. As in our baby product line, we differentiate our sleepwear products by offering high-volume, high-quality core products with distinctive print designs and artistic applications.
Other products
Our other product offerings include bedding, outerwear, swimwear, shoes, socks, diaper bags, gift sets, toys, and hair accessories. In fiscal 2012, we generated $116.2 million in net sales of these other products in our Carter’s retail stores and online, or 4.9%, of our consolidated net sales.
Royalty income
We currently extend our Carter’s, Child of Mine, Just One You, and Precious Firsts product offerings by licensing these brands to 16 domestic marketers in the U.S. These licensing partners develop and sell products through our multiple sales channels, while leveraging our brand strength, customer relationships, and designs. Licensed products provide our customers and consumers with a range of lifestyle products that complement and expand upon our core baby and young children’s apparel offerings. Our license agreements require strict adherence to our quality and compliance standards and provide for a multi-step product approval process. We work in conjunction with our licensing partners in the development of their products and ensure that they fit within our brand vision of high-quality, core products at attractive values to the consumer. In addition, we work closely with our wholesale customers and our licensees to gain dedicated floor space for licensed product categories. In fiscal 2012, our Carter’s brand generated $20.7 million in domestic royalty income.
OSHKOSH BRANDS — U.S.
Under our OshKosh brand, we design, source, and market a broad array of young children’s apparel, primarily for children in sizes newborn to 12. Our OshKosh brand is currently sold in our OshKosh retail stores, department stores, national chains, specialty stores, through off-price sales channels, and online at www.oshkoshbgosh.com and www.oshkosh.com. In fiscal 2012, we sold approximately 46 million units of OshKosh products in the U.S. through our retail stores, to our wholesale customers, and online, a decrease

4
of approximately 8% from fiscal 2011. We also have a licensing agreement with Target through which Target sells products under our Genuine Kids from OshKosh brand. Given its long history of durability, quality, and style, we believe our OshKosh brand represents a significant long-term growth opportunity for us, especially in the $16 billion young children’s playclothes market in the U.S. We continue to focus on our core product development and marketing disciplines, improving the productivity of our existing OshKosh retail stores, developing new retail formats, investing in new employees and talent development, leveraging our relationships with major wholesale accounts, and leveraging our infrastructure and supply chain.
OSHKOSH BRAND POSITIONING — U.S.
We believe our OshKosh brand stands for high-quality playclothes in sizes newborn to 12. Our core OshKosh brand products include denim, overalls, t-shirts, fleece, and other playclothes. Our OshKosh brand is generally positioned towards an older segment (young children, sizes 2 to 7) and at slightly higher average prices than our Carter’s brand. We believe our OshKosh brand has significant brand name recognition, which consumers associate with high-quality, durable, and authentic playclothes for young children.
OSHKOSH PRODUCTS — U.S.
Playclothes
Our OshKosh brand is best known for its playclothes products. In fiscal 2012, we generated $307.5 million in net sales of OshKosh brand playclothes products in the U.S., which accounted for approximately 12.9% of our consolidated net sales. OshKosh brand playclothes products include denim apparel products with multiple wash treatments and coordinating garments, overalls, woven bottoms, knit tops, and playclothes products for everyday use in sizes newborn to 12. We plan to grow this business by strengthening our product offerings, improving product value, reducing product complexity, and leveraging our strong customer relationships and global supply chain expertise. We believe our OshKosh brand represents a significant opportunity for us to increase our share in the playclothes category as the $16 billion young children’s playclothes market in the U.S. is highly fragmented. For the twelve months ended December 2012, this market was six times the size of the baby and sleepwear markets combined.
Other products
The remainder of our OshKosh brand product offerings include baby, sleepwear, outerwear, shoes, hosiery, and accessories. In fiscal 2012, we generated $56.2 million in net sales of these other products in our OshKosh retail stores and online, which accounted for 2.4% of our consolidated net sales.
Royalty income
We partner with a number of domestic licensees to extend the reach of our OshKosh brand. We currently have six domestic licensees selling apparel and accessories. Our largest licensing agreement is with Target Corporation. All Genuine Kids from OshKosh products sold by Target are sold pursuant to this licensing agreement. Our licensed products provide our customers and consumers with a range of OshKosh products including outerwear, underwear, swimwear, socks, shoes, and accessories. In fiscal 2012, we earned approximately $9.7 million in domestic royalty income from our OshKosh brands.
INTERNATIONAL
Our international segment includes Company-operated retail, wholesale, and online operations in addition to royalty income from our international licensees. In fiscal 2012, our international sales were $218.3 million, or 9.2% of consolidated net sales. As of December 29, 2012, we operated 82 retail stores in Canada. Additionally, our products are sold in approximately 50 countries through wholesale and licensing relationships.

5
Form 10-K
We partner with approximately 25 licensees to sell the Carter’s and OshKosh brands internationally in approximately 35 countries. In fiscal 2012, our OshKosh international licensees generated retail sales of approximately $91.0 million, on which we earned approximately $6.0 million in royalty income. In fiscal 2012, our international licensees generated Carter’s brand retail sales of $11.4 million on which we earned $0.9 million in royalty income.
SEGMENTS
Business segment financial information for our five business segments: Carter’s wholesale, Carter’s retail, OshKosh retail, OshKosh wholesale, and international, is contained in Item 8 - “Financial Statements and Supplementary Data,” Note 17 - “Segment Information” to the accompanying audited consolidated financial statements.
SALES, MARKETING, AND DISTRIBUTION
As described above, we sell our products through the wholesale channel, through our retail stores in the U.S. and Canada, and online.
Our Carter’s brand wholesale customers include major retailers, such as, Costco, JCPenney, Kohl’s, Macy’s, Sam’s Club, Target, Toys “R” Us, and Walmart. We collaboratively plan with our wholesale customers for our baby products, which we refer to as core basics. We intend to drive continued growth with our wholesale customers through our focus on managing our key accounts’ business through product mix, fixturing, brand presentation, advertising, and frequent meetings with the senior management of our major wholesale customers.
Our OshKosh brand wholesale customers include major retailers, such as, Belk, Bon-Ton, Fred Meyer, JCPenney, Kohl’s, and Sears. We continue to work with our customers to establish seasonal plans for playclothes products. The majority of our OshKosh brand playclothes products will be planned and ordered seasonally as we introduce new products.
As of December 29, 2012, we operated 413 Carter’s retail stores in the U.S., of which 235 were brand stores and 178 were outlet stores. These stores carry a complete assortment of first-quality baby and young children’s apparel, accessories, and gift items. Our stores average approximately 4,500 square feet per location and are distinguished by an easy, consumer-friendly shopping environment. Our brand stores are generally located in high-traffic, strip centers located in or near major cities. We believe our brand strength and our assortment of core products have made our stores a destination location within many outlet and strip centers. Our outlet stores are generally located within 20 to 30 minutes of densely-populated areas.
As of December 29, 2012, we operated 168 OshKosh retail stores in the U.S., of which 147 were outlet stores and 21 were brand and specialty stores. These stores carry a wide assortment of young children’s apparel, accessories, and gift items and average approximately 4,600 square feet per location.
As of December 29, 2012, we operated 82 retail stores in Canada. These stores average approximately 5,500 square feet per location, slightly larger than our U.S. based stores, and offer a similar product assortment, localized for climate differences.
Additionally, in 2012, we invested in a one million square foot multi-channel distribution center in Braselton, Georgia. All of our eCommerce business demand for the U.S. is fulfilled at the Braselton facility.
Store expansion
We use a real estate selection process whereby we fully assess all new locations based on demographic factors, retail adjacencies, and population density. Our stores are located in many of the outlet centers in the U.S. and we continue to add new brand store locations to our real estate portfolio.

6
Marketing
Our strategy is to strengthen our online and direct marketing with a focus on driving higher spend per customer, purchase frequency, and increasing return on our marketing investment. In fiscal 2012, we invested in a national marketing campaign for Carter’s. The objective of the initiative was to further strengthen Carter’s as the leading brand in young children’s apparel in all channels of distribution; reinforce the brand’s core attributes of trust, value and quality; and increase overall brand awareness.
GLOBAL SOURCING NETWORK
We source products internationally, primarily from Asia. One sourcing agent currently manages approximately 80% of our inventory purchases. Our sourcing network consists of over 75 vendors located in over 15 countries. We believe that our sourcing arrangements are sufficient to meet our current operating requirements and provide capacity for growth.
In fiscal 2012, we established new sourcing operations in Hong Kong. Our goal is to shift the mix of our direct sourcing from approximately 5% to 50% over the next five years in an effort to improve the performance of our supply chain.
COMPETITION
The baby and young children’s apparel market is highly competitive. Competition is generally based upon product quality, brand name recognition, price, selection, service, and convenience. Both branded and private label manufacturers compete in the baby and young children’s apparel market. Our primary competitors in the wholesale channel include private label product offerings, and, in alphabetical order, Disney and Gerber. Our primary competitors in the retail store channel include, Disney, Gymboree, Old Navy, The Children’s Place, and The Gap. Most retailers, including our wholesale customers, have significant private label product offerings that compete with our products. Because of the highly-fragmented nature of the industry, we also compete with many small manufacturers and retailers. We believe that the strength of our Carter’s, OshKosh, and related brand names combined with our breadth of product offerings and operational expertise position us well against these competitors.
TRADEMARKS AND COPYRIGHTS
We own many trademarks and copyrights, including Carter’s®, OshKosh®, OshKosh B’gosh®, Child of Mine®, Just One You®, Precious Firsts™, Little Collections™, and Little Layette®, many of which are registered in the U.S. and in more than 120 foreign countries.
EMPLOYEES
As of December 29, 2012, we had 11,786 employees, 3,498 of whom were employed on a full-time basis and 8,288 of whom were employed on a part-time basis. We have no unionized employees. We have had no labor-related work stoppages and believe that our labor relations are good.
In fiscal 2012, we announced an initiative to consolidate certain retail and finance operations currently managed in Connecticut to Atlanta. This initiative is expected to be completed in fiscal 2013.
AVAILABLE INFORMATION
Our Internet address is www.carters.com. We are not including the information contained on our website as part of, or incorporating it by reference into, this Annual Report on Form 10-K. On our website, we make available, free of charge, our Annual Reports on Form 10-K, quarterly reports on Form 10-Q, current reports on Form 8-K, proxy statements, director and officer reports on Forms 3, 4, and 5, and any amendments to these reports, as soon as reasonably practicable after we electronically file such material with, or furnish it to, the Securities and Exchange Commission (“SEC”). Our SEC reports can be accessed through the investor relations section of our website. The information found on our website is not part

7
Form 10-K
of this or any other report we file with or furnish to the SEC. We also make available on our website, the Carter’s Code of Ethics, our Corporate Governance Principles, and the charters for the Compensation, Audit, and Nominating and Corporate Governance Committees of the Board of Directors. Our SEC filings are also available for reading and copying at the SEC’s Public Reference Room at 100 F Street, NE, Washington, D.C. 20549. Information on the operation of the Public Reference Room may be obtained by calling the SEC at 1-800-SEC-0330. In addition, the SEC maintains an Internet site, www.sec.gov, containing reports, proxy and information statements, and other information regarding issuers that file electronically with the SEC.
ITEM 1A. RISK FACTORS
You should carefully consider each of the following risk factors as well as the other information contained in this Annual Report on Form 10-K and other filings with the SEC in evaluating our business. The risks and uncertainties described below are not the only we face. Additional risks and uncertainties not presently known to us or that we currently consider immaterial may also impact our business operations. If any of the following risks actually occur, our operating results may be affected.
Risks Relating to Our Business
The loss of one or more of our major customers could result in a material loss of revenues.
In fiscal 2012, we derived approximately 25% of our consolidated net sales from our top four customers. We do not enter into long-term sales contracts with our major customers, relying instead on product performance, long-standing relationships, and on our position in the marketplace. As a result, we face the risk that one or more of our major customers may significantly decrease their business with us or terminate their relationship with us. Any such decrease or termination of our major customers’ business could result in a material decrease in our sales and operating results.
The acceptance of our products in the marketplace is affected by consumers’ tastes and preferences, along with fashion trends.
We believe that continued success depends on our ability to provide a compelling value proposition for our consumers in the Company’s distribution channels. There can be no assurance that the demand for our products will not decline, or that we will be able to successfully and timely evaluate and adapt our products to changes in consumers’ tastes and preferences or fashion trends. If consumers’ tastes and preferences are not aligned with our product offerings, demand for our products may decline, promotional pricing may be required to move seasonal merchandise, and our gross margins and results of operations could be adversely affected.
The value of our brand, and our sales, could be diminished if we are associated with negative publicity.
Although our employees, agents, and third-party compliance auditors periodically visit and monitor the operations of our vendors, independent manufacturers, and licensees, we do not control these vendors, independent manufacturers, licensees, or their labor practices. A violation of our vendor policies, licensee agreements, labor laws, or other laws by these vendors, independent manufacturers, or licensees could damage our brand image. As a result, negative publicity regarding our Company, brands or products, including licensed products, could adversely affect our reputation and sales. Further, while the Company takes steps to ensure the reputation of its brand is maintained through its license agreements, there can be no guarantee that the Company’s brand image will not be negatively impacted through its association with products or actions of licensees.

8
Our failure to protect our intellectual property rights could diminish the value of our brand, weaken our competitive position, and adversely affect our results.
We currently rely on a combination of trademark, unfair competition and copyright laws, as well as licensing arrangements, to establish and protect our intellectual property rights. The steps taken by us or by our licensees to protect our proprietary rights may not be adequate to prevent infringement of our trademarks or proprietary rights by others. In addition, intellectual property protection may be unavailable or limited in some foreign countries where laws or law enforcement practices may not protect our proprietary rights and where third parties may have rights to conflicting marks, and it may be more difficult for us to successfully challenge the use of our proprietary rights by other parties in those countries. If we fail to protect and maintain our intellectual property rights, the value of our brand could be diminished and our competitive position may suffer. Further, third parties may assert intellectual property claims against us, particularly as we expand our business geographically, and any such claim could be expensive and time consuming to defend, regardless of its merit. Successful infringement claims against us could result in significant monetary liability or prevent us from selling some of our products, which could have an adverse effect on our results.
We may incur substantial costs as a result of investigations or other proceedings related to previously disclosed investigations.
As previously reported, beginning in the fourth quarter of fiscal 2009, the SEC and the United States Attorney’s Office began conducting investigations, with which the Company cooperated, related to customer margin support provided by the Company, including undisclosed margin support commitments and related matters. In December 2010, the Company and the SEC entered into a non-prosecution agreement pursuant to which the SEC agreed not to charge the Company with any violations of the federal securities laws, commence any enforcement action against the Company, or require the Company to pay any financial penalties in connection with the SEC’s investigation of customer margin support provided by the Company, conditioned upon the Company’s continued cooperation with the SEC’s investigation and with any related enforcement proceedings. The Company may continue to incur substantial expenses for legal services due to the SEC and United States Attorney’s Office investigations. These matters may continue to divert management’s time and attention away from operations. The Company also expects to bear additional costs pursuant to its advancement and indemnification obligations to directors and officers under our organizational documents in connection with proceedings related to these matters. Our insurance may not provide coverage to offset such costs.
The Company’s and its vendors’ databases containing personal information of our retail and eCommerce customers could be breached, which could subject us to adverse publicity, litigation, and expenses. In addition, if we are unable to comply with security standards created by the banks and payment card industry, our operations could be adversely affected.
We rely on the security of our networks and databases and, in certain circumstances, those of third parties, such as vendors, to protect our proprietary information and information about our customers. If unauthorized parties gain access to these networks or databases, they may be able to steal, publish, delete, or modify our private and sensitive third-party information. In such circumstances, we could be held liable to our customers or other parties or be subject to regulatory or other actions for breaching privacy law or failing to adequately protect such information. This could result in costly investigations and litigation, civil or criminal penalties, operational changes, and negative publicity that could adversely affect our financial condition, results of operations, and reputation. Further, if we are unable to comply with the security standards, established by banks and payment card industry, we may be subject to fines, restrictions, and expulsion from card acceptance programs, which could adversely affect our retail operations.

9
Form 10-K
Increases in production costs and deflationary pressures on our selling prices may adversely affect our results.
The Company’s product costs are subject to fluctuations in costs such as manufacturing, cotton, labor, fuel, and transportation. In recent years, we have experienced increased costs of cotton, labor, fuel, and transportation, and have also had higher costs for foreign sourced products as a result of the devaluation of the U.S. dollar relative to certain foreign currencies. Although we expect product costs to decline in 2013 compared to 2012, we expect product costs will generally remain above historic levels. While we raised our selling prices on many of our products over the past two years, we have been unable to fully absorb the cost increases and our profitability has been adversely impacted. In recent years, the Company experienced deflationary pressure on its selling prices, in part driven by intense price competition in the young children’s apparel industry. If future product cost increases are more than anticipated and if we are unable to offset such cost increases through selling price increases or otherwise, our profitability could be adversely affected. Future deflationary pressures on our selling prices could also adversely affect our profitability.
Our business is sensitive to overall levels of consumer spending, particularly in the young children’s apparel segment.
Consumers’ demand for young children’s apparel, specifically brand name apparel products, is impacted by the overall level of consumer spending. Discretionary consumer spending is impacted by employment levels, gasoline and utility costs, business conditions, availability of consumer credit, tax rates, interest rates, levels of consumer indebtedness, and overall levels of consumer confidence. Recent and further reductions, or lower-than-expected growth, in the level of discretionary spending may have a material adverse effect on the Company’s sales and results of operations.
We source substantially all of our products through foreign production arrangements. Our dependence on foreign supply sources could result in disruptions to our operations in the event of political instability, unfavorable economic conditions, international events, or new foreign regulations and such disruptions may increase our cost of goods sold and decrease gross profit.
We source substantially all of our products through a network of vendors primarily in Asia, principally, coordinated by our sourcing agents and directly through our Hong Kong sourcing office. The following could disrupt our foreign supply chain, increase our cost of goods sold, decrease our gross profit, or impact our ability to get products to our customers:
• financial instability of one or more of our major vendors;
• political instability or other international events resulting in the disruption of trade in foreign countries from which we source our products;
• interruptions in the supply of raw materials, including cotton, fabric, and trim items;
• significant changes in the cost of labor in our sourcing locations;
• the imposition of new regulations relating to imports, duties, taxes, and other charges on imports;
• the occurrence of a natural disaster, unusual weather conditions, or an epidemic in foreign countries from which we source our products;
• changes in the United States customs procedures concerning the importation of apparel products;
• unforeseen delays in customs clearance of any goods;
• disruptions in the global transportation network such as a port strike, capacity withholding, world trade restrictions, or war;
• the application of foreign intellectual property laws;
10
• the ability of our vendors to secure sufficient credit to finance the manufacturing process including the acquisition of raw materials;
• exchange rate fluctuations between the Company’s and/or its subsidiaries’ functional currency and the currencies paid to foreign contractors; and
• other events beyond our control that could interrupt our supply chain and delay receipt of our products into the United States.
We currently source most of our products through a single port. Labor disruptions at that port or otherwise along our supply chain may adversely affect our relationships with customers, reputation with consumers, and results of operations.
Our business depends on our ability to source and distribute products in a timely manner. Labor disputes at independent factories where our goods are produced, the shipping port we use, or our transportation carriers create significant risks for our business, particularly if these disputes result in work slowdowns, lockouts, strikes, or other disruptions during our peak manufacturing and importing times. This may have a material adverse effect on our relationships with our customers and our business, potentially resulting in canceled orders by customers, unanticipated inventory accumulation, and reduced revenues and earnings.
We source substantially all of our products through a network of vendors. We have limited control over these vendors and we may experience delays, product recalls, or loss of revenues if our products do not meet our quality standards.
Our vendors may not continue to provide products that are consistent with our standards. We have occasionally received, and may in the future continue to receive, shipments of product that fail to conform to our quality control standards. A failure in our quality control program may result in diminished product quality, which may result in increased order cancellations and returns, decreased consumer demand for our products, or product recalls, any of which may have a material adverse effect on our results of operations and financial condition. Because we do not control our vendors, products that fail to meet our standards, or other unauthorized products, could end up in the marketplace without our knowledge. This could materially harm our brand and our reputation in the marketplace.
We may experience delays, product recalls, or loss of revenues if our products do not meet regulatory requirements.
Our products are subject to regulation of and regulatory standards set by various governmental authorities including the Consumer Product Safety Commission, with respect to quality and safety. These regulations and standards may change from time to time. Our inability, or that of our vendors, to comply on a timely basis with regulatory requirements could result in significant fines or penalties, which could adversely affect our reputation and sales. Issues with the compliance of merchandise we sell with these regulations and standards, regardless of our culpability, or customer concerns about such issues, could result in damage to our reputation, lost sales, uninsured product liability claims or losses, merchandise recalls, and increased costs.
Any significant disruption to our eCommerce business, including order acceptance and processing, order fulfillment, web-hosting, warehousing, and call center operations, could result in lost sales and could harm our brand and our reputation in the marketplace.
The operation of our eCommerce business depends on the ability to maintain the efficient and uninterrupted operation of online order-taking and fulfillment operations. We currently rely on a third party to host our eCommerce website, process and manage web orders, and operate a call center supporting our eCommerce business. Over the course of fiscal 2012, we transitioned fulfillment services in house and expect to transition additional services through 2013. Any significant disruption in the operations of our eCommerce business or in our ability to transition third party services effectively could result in lost sales and could harm our brand and our reputation in the marketplace.

11
Form 10-K
The loss of a sourcing agent could negatively impact our ability to timely deliver our inventory supply and disrupt our business, which may adversely affect our operating results.
One sourcing agent currently manages approximately 80% of our inventory purchases. Although we believe that other buying agents could be retained, or we could procure some of the inventory directly, the loss of this buying agent could delay our ability to timely receive inventory supply and disrupt our business, which could result in a material adverse effect on our operating results. In addition, we have recently increased the amount of our inventory that we source directly and plan to continue to further increase such amounts. We have limited experience in directly sourcing inventory purchases from foreign vendors and we may experience difficulty in the transition, which could disrupt our business, increase our costs, and have a material adverse effect on our operating results.
We operate in a highly competitive market and the size and resources of some of our competitors may allow them to compete more effectively than we can, resulting in a loss of market share and, as a result, a decrease in revenue and gross profit.
The baby and young children’s apparel market is highly competitive. Both branded and private label manufacturers compete in the baby and young children’s apparel market. Our primary competitors in our wholesale businesses include private label product offerings and Disney and Gerber. Our primary competitors in the retail store channel include Disney, Gymboree, Old Navy, The Children’s Place, and The Gap. Because of the fragmented nature of the industry, we also compete with many other manufacturers and retailers. Some of our competitors have greater financial resources and larger customer bases than we have. As a result, these competitors may be able to:
• adapt to changes in customer requirements more quickly;
• take advantage of acquisition and other opportunities more readily;
• devote greater resources to the marketing and sale of their products; and
• adopt more aggressive pricing strategies than we can.
The Company’s retail success and future growth is dependent upon identifying locations and negotiating appropriate lease terms for retail stores.
The Company’s retail stores are located in leased retail locations across the United States and Canada. Successful operation of a retail store depends, in part, on the overall ability of the retail location to attract a consumer base sufficient to make store sales volume profitable. If the Company is unable to identify new retail locations with consumer traffic sufficient to support a profitable sales level, retail growth may be limited. Further, if existing stores do not maintain a sufficient customer base that provides a reasonable sales volume or the Company is unable to negotiate appropriate lease terms for the retail stores, there could be a material adverse impact on the Company’s sales, gross margin, and results of operations.
Profitability and our reputation and relationships could be negatively impacted if we do not adequately forecast the demand for our products and, as a result, create significant levels of excess inventory or insufficient levels of inventory.
If the Company does not adequately forecast demand for its products and purchases inventory to support an inaccurate forecast, the Company could experience increased costs and lower selling prices due to the need to dispose of excess inventory. In addition, if we forecast demand for our products that is lower than actual demand, we may experience insufficient levels of inventory, which could result in damage to our relationships with customers and our reputation with consumers.

12
We may not achieve sales growth plans, cost savings, and other assumptions that support the carrying value of our intangible assets.
As of December 29, 2012, the Company had goodwill of $136.6 million for Carter’s and goodwill of $53.2 million for Bonnie Togs, and tradename assets of $220.2 million for the Carter’s brand, and $85.5 million for the OshKosh brand on its consolidated balance sheet. The carrying value of these assets is subject to annual impairment reviews as of the last day of each fiscal year or more frequently, if deemed necessary, due to any significant events or changes in circumstances. Estimated future cash flows used in these impairment reviews could be negatively impacted if we do not achieve our sales plans, planned cost savings, and other assumptions that support the carrying value of these intangible assets, which could result in impairment of the remaining asset values. Any impairment would adversely affect our results of operations.
The Company’s success is dependent upon retaining key individuals within the organization to execute the Company’s strategic plan.
The Company’s ability to attract and retain qualified executive management, marketing, merchandising, design, sourcing, operations, and support function staffing is key to the Company’s success. If the Company were unable to attract and retain qualified individuals in these areas, an adverse impact on the Company’s growth and results of operations may result.
The consolidation of the Company’s Shelton, Connecticut-based operations with our Atlanta, Georgia-based operations may adversely affect our results of operations, financial position, and cash flows more than anticipated.
Actual charges related to the previously announced consolidation could be greater than estimated. The office consolidation may not be completed during the expected timeframe. If we do not effectively transition our workforce by identifying and relocating key positions and hiring qualified candidates in Georgia, we could experience business disruption due to a loss of historical knowledge and a lack of business continuity. We may not be able to achieve all or any of the expected benefits of the office consolidation as a result of any such business disruption or other factors. Disruption to our operations as a result of the consolidation could adversely affect our operations and financial results.
Failure to implement needed upgrades to our information technology systems could adversely affect our business.
As our business grows in size, complexity, and geography, we expect our information technology infrastructure to be in regular need of enhancement and upgrades. Failure to upgrade as needed or complications encountered in upgrading systems could cause disruptions that may adversely affect our business results or operations. Further, additional investment needed to upgrade and expand our information technology infrastructure could require significant investment of additional resources and capital.
We may not effectively transition our distribution functions to our new Braselton, Georgia facility. If we encounter problems with our distribution facilities, our ability to deliver our products to the market could be adversely affected.
If we are unsuccessful in timely or effectively transitioning our distribution functions to this facility, we may not achieve planned efficiency improvements and may not have sufficient distribution capacity, which could cause sales to decline and costs to increase and could have a material adverse effect on our results of operations. In addition, our new distribution facilities in Braselton, Georgia are expected to be more complex to operate than our current facilities and we may face difficulty in hiring and training needed personnel. Our ability to meet customer expectations, manage inventory, complete sales, and achieve objectives for operating efficiencies depends on the proper operation of this facility. Disruptions could adversely affect our results of operations.

13
Form 10-K
We may be unsuccessful in expanding into international markets.
Our business strategy includes expanding into new international markets, which may be accomplished either directly or through partners. For example, we recently acquired retail operations in Japan. We do not have significant experience operating in markets outside of the United States and Canada. Consumer demand, behavior, tastes, and purchasing trends may differ in international markets and, as a result, sales of our products may not be successful or meet our expectations, or the margins on those sales may not be in line with those we currently anticipate. We may encounter differences in business culture and the legal environment that may make working with commercial partners and hiring and retaining an adequate employee base more challenging. We may also face difficulties integrating foreign business operations with our current operations. Any of these challenges could hinder our success in new markets. Our entry into new markets may have upfront investment costs that may not be accompanied by sufficient revenues to achieve typical or expected operational and financial performance and such costs may be greater than expected. We cannot be sure that we can successfully complete any planned expansion or that new international business will be profitable or meet our expectations. If our international expansion plans are unsuccessful, our results could be materially adversely affected.
Our ability to conduct business in international markets may be affected by legal, regulatory, political, and economic risks.
Our ability to capitalize on growth in new international markets and to maintain the current level of operations in our existing international markets is subject to legal, regulatory, political, and economic risks. These include:
• the burdens of complying with foreign laws and regulations, including trade and labor restrictions;
• compliance with U.S. and other country laws relating to foreign operations, including the Foreign Corrupt Practices Act, which prohibits U.S. companies from making improper payments to foreign officials for the purpose of obtaining or retaining business;
• unexpected changes in regulatory requirements; and
• new tariffs or other barriers in some international markets.
We are also subject to general political and economic risks in connection with our international operations, including:
• political instability and terrorist attacks;
• differences in business culture;
• different laws governing relationships with employees and business partners;
• changes in diplomatic and trade relationships; and
• general economic fluctuations in specific countries or markets.
We cannot predict whether quotas, duties, taxes, or other similar restrictions will be imposed by the U.S. or foreign countries upon the import or export of our products in the future, or what effect any of these actions would have, if any, on our business, financial condition, or results of operations. Changes in regulatory, geopolitical, social or economic policies, and other factors may have a material adverse effect on our business in the future or may require us to exit a particular market or significantly modify our current business practices.
14
The Company’s future success and growth through expansion of its international operations could be adversely affected by violations of the United States Foreign Corrupt Practices Act and similar world-wide anti-bribery laws.
The United States Foreign Corrupt Practices Act, and similar world-wide anti-bribery laws prohibit companies and their intermediaries from making improper payments to non-United States officials for the purpose of obtaining or retaining business. The Company’s policies mandate compliance with anti-bribery laws. The Company cannot provide assurance that our internal control policies and procedures, or those of our vendors, will protect from reckless or criminal acts committed by the Company’s employees, agents, or vendors. Violations of these laws, or allegations of such violations, could disrupt the business and result in a material adverse effect on the Company’s financial condition, results of operations, and cash flows.
ITEM 1B. UNRESOLVED STAFF COMMENTS
None.

15
Form 10-K
ITEM 2. PROPERTIES
We lease space for retail stores, showrooms, distribution centers, and offices, principally in the U.S. and Canada. The majority of our premises are leased.
The following sets forth information with respect to our key properties:
Location
Approx. floor space in
square feet Principal use Lease
expiration date
Braselton, Georgia . . . . . . . . . . . . . . . . . 1,060,000 Distribution/warehousing September 2023Stockbridge, Georgia . . . . . . . . . . . . . . . 505,000 Distribution/warehousing April 2015Chino, California . . . . . . . . . . . . . . . . . . 413,000 Distribution/warehousing July 2014Stockbridge, Georgia . . . . . . . . . . . . . . . 311,000 Additional distribution/warehousing December 2013Hogansville, Georgia . . . . . . . . . . . . . . . 258,000 Distribution/warehousing (1) OwnedPhipps Tower, Atlanta, Georgia . . . . . . 225,000 Corporate headquarters April 2030Griffin, Georgia . . . . . . . . . . . . . . . . . . . 215,000 Finance/information technology/
benefits administration/rework Owned
The Proscenium, Atlanta, Georgia . . . . 154,000 Executive offices/Carter’s design/merchandising/marketing (2)
December 2013
Cambridge, Ontario . . . . . . . . . . . . . . . . 125,000 Distribution/warehousing October 2019Shelton, Connecticut . . . . . . . . . . . . . . . 64,000 Finance/retail store administration (2) February 2019Cambridge, Ontario . . . . . . . . . . . . . . . . 46,332 Bonnie Togs distribution/
warehousing May 2014
Cambridge, Ontario . . . . . . . . . . . . . . . . 36,500 Bonnie Togs executive offices/distribution/warehousing
June 2021
Fayetteville, Georgia . . . . . . . . . . . . . . . . 30,000 Wholesale customer service/information technology
September 2020
(1) We are in the process of closing the Hogansville, Georgia, facility.
(2) We have announced our plans to consolidate the premises leased at both The Proscenium in Atlanta, Georgia, and Shelton, Connecticut at Phipps Tower in Atlanta, Georgia.
At December 29, 2012, the Company operated 581 leased retail stores, located primarily in outlet and strip centers, across the United States, having an average size of approximately 4,500 square feet. In addition, the Company operates 82 leased retail stores in Canada, having an average size of approximately 5,500 square feet. The majority of the Company’s lease terms range between five to ten years.
ITEM 3. LEGAL PROCEEDINGS
The Company is subject to various claims and pending or threatened lawsuits in the normal course of our business. The Company is not currently a party to any legal proceedings that it believes would have a material adverse effect on its financial position, results of operations, or cash flows.
ITEM 4. MINE SAFETY DISCLOSURES
Not applicable.

16
PART II
ITEM 5. MARKET FOR REGISTRANT’S COMMON EQUITY, RELATED STOCKHOLDER MATTERS, AND ISSUER PURCHASES OF EQUITY SECURITIES
Our common stock trades on the New York Stock Exchange under the symbol CRI. The last reported sale price per share of our common stock on February 25, 2013 was $57.84. On that date there were approximately 200 holders of record of our common stock.
The following table sets forth for the periods indicated the high and low sales prices per share of common stock as reported by the New York Stock Exchange:
2012 High Low
First quarter . . . . . . . . . . . . . . . . . . . . . . . . . . . . . . . . . . . . . . . . . . . . . . $50.21 $38.66Second quarter . . . . . . . . . . . . . . . . . . . . . . . . . . . . . . . . . . . . . . . . . . . $57.27 $47.95Third quarter . . . . . . . . . . . . . . . . . . . . . . . . . . . . . . . . . . . . . . . . . . . . . $57.62 $48.67Fourth quarter . . . . . . . . . . . . . . . . . . . . . . . . . . . . . . . . . . . . . . . . . . . . $56.10 $49.61
2011 High Low
First quarter . . . . . . . . . . . . . . . . . . . . . . . . . . . . . . . . . . . . . . . . . . . . . . $30.26 $26.50Second quarter . . . . . . . . . . . . . . . . . . . . . . . . . . . . . . . . . . . . . . . . . . . $32.88 $27.72Third quarter . . . . . . . . . . . . . . . . . . . . . . . . . . . . . . . . . . . . . . . . . . . . . $34.50 $27.44Fourth quarter . . . . . . . . . . . . . . . . . . . . . . . . . . . . . . . . . . . . . . . . . . . . $41.70 $29.92
SHARE REPURCHASES
The following table provides information about shares acquired from employees during the fourth quarter of fiscal 2012 to satisfy the required withholding of taxes in connection with the vesting of restricted stock:
Period
Total number
of shares purchased
(1)
Average price paid per share
Total number of shares
purchased as part of
publicly announced
plans or programs
Approximate dollar value of
shares that may yet be purchased under the plans
or programs
September 30, 2012 through October 27, 2012 . . . . — $ — — Not applicableOctober 28, 2012 through November 24, 2012 . . . . 994 $52.24 — Not applicableNovember 25, 2012 through December 29, 2012 . . . — $ — — Not applicable
Total . . . . . . . . . . . . . . . . . . . . . . . . . . . . . . . . . . . . . . . 994 $52.24 — Not applicable
(1) All of the shares were surrendered by our employees to satisfy required tax withholding upon the vesting of restricted stock awards.

17
Form 10-K
Repurchase program
During fiscal 2010, the Company’s Board of Directors approved a share repurchase authorization, pursuant to which the Company is authorized to purchase up to $100 million of its outstanding common shares. The total remaining capacity under this authorization was approximately $58.9 million as of December 29, 2012. This authorization has no expiration date. The timing and amount of any future share repurchases will be determined by the Company’s management, based upon its evaluation of market conditions, share price, other investment priorities, and other factors. The Company did not repurchase any shares of its common stock during fiscal 2012 and 2011 pursuant to any share repurchase authorization.
DIVIDENDS
Provisions in our revolving credit facility currently restrict the ability of our operating subsidiary, The William Carter Company (“TWCC”), from paying cash dividends to our parent company, Carter’s, Inc., in excess of $15.0 million unless TWCC and its consolidated subsidiaries meet certain leverage ratio and minimum availability requirements under the credit facility, which could materially restrict Carter’s, Inc. from paying cash dividends on our common stock. We do not anticipate paying cash dividends on our common stock in the foreseeable future but intend to retain future earnings, if any, for reinvestment in the future operation and expansion of our business and related development activities. Any future decision to pay cash dividends will be at the discretion of our Board of Directors and will depend upon our financial condition, results of operations, terms of financing arrangements, capital requirements, and any other factors as our Board of Directors deems relevant.
RECENT SALES OF UNREGISTERED SECURITIES
Not applicable.

18
ITEM 6. SELECTED FINANCIAL DATA
The following selected financial and other data has been derived from our consolidated financial statements for each of the five years presented. The following information should be read in conjunction with Item 7 “Management’s Discussion and Analysis of Financial Condition and Results of Operations” and Item 8 “Financial Statements and Supplementary Data,” which includes the consolidated financial statements and related notes appearing elsewhere in this Annual Report on Form 10-K, or the respective prior fiscal years’ Form 10-K. Certain prior year amounts have been reclassified to facilitate comparability with current year presentation.
For the fiscal years ended
(dollars in thousands, except per share data)December 29,
2012December 31,
2011January 1,
2011January 2,
2010January 3, 2009 (d)
Operating Data: Wholesale sales - Carter’s . . . . . . . . . . . . . . $ 981,445 $ 939,115 $ 827,815 $ 742,224 $ 730,043Retail sales - Carter’s . . . . . . . . . . . . . . . . . . 818,909 671,590 546,233 489,740 422,436Retails sales - OshKosh . . . . . . . . . . . . . . . . 283,343 280,900 264,887 257,289 249,130Wholesale sales - OshKosh . . . . . . . . . . . . . 79,752 81,888 75,484 72,448 73,014International . . . . . . . . . . . . . . . . . . . . . . . . . 218,285 136,241 34,837 27,976 19,897
Total net sales. . . . . . . . . . . . . . . . . . . . . . 2,381,734 2,109,734 1,749,256 1,589,677 1,494,520Cost of goods sold . . . . . . . . . . . . . . . . . . . . . 1,443,786 1,417,456 1,074,539 984,506 974,949
Gross profit (a) . . . . . . . . . . . . . . . . . . . . . . . 937,948 692,278 674,717 605,171 519,571Selling, general, and administrative
expenses (b) . . . . . . . . . . . . . . . . . . . . . . . 713,211 542,086 469,037 445,979 413,258Royalty income . . . . . . . . . . . . . . . . . . . . . . . (37,249) (37,274) (37,576) (36,421) (33,685)
Operating income . . . . . . . . . . . . . . . . . . . . . 261,986 187,466 243,256 195,613 139,998Interest income . . . . . . . . . . . . . . . . . . . . . . . (255) (386) (575) (219) (1,491)Interest expense . . . . . . . . . . . . . . . . . . . . . . 6,995 7,534 10,445 12,004 19,578Foreign exchange gain . . . . . . . . . . . . . . . . . (145) (570) — — —
Income before income taxes . . . . . . . . . . . . 255,391 180,888 233,386 183,828 121,911Provision for income taxes . . . . . . . . . . . . . . 94,241 66,872 86,914 68,188 44,007
Net income . . . . . . . . . . . . . . . . . . . . . . . . . . . $ 161,150 $ 114,016 $ 146,472 $ 115,640 $ 77,904
Per Common Share Data: Basic net income . . . . . . . . . . . . . . . . . . . . . . $ 2.73 $ 1.96 $ 2.50 $ 2.03 $ 1.37Diluted net income . . . . . . . . . . . . . . . . . . . . $ 2.69 $ 1.94 $ 2.46 $ 1.97 $ 1.33
Balance Sheet Data: Working capital (c) . . . . . . . . . . . . . . . . . . . . $ 713,468 $ 629,394 $ 532,891 $ 505,051 $ 359,919Total assets . . . . . . . . . . . . . . . . . . . . . . . . . . $1,630,109 $1,402,709 $1,257,182 $1,208,599 $1,038,012Total debt, including current maturities . . $ 186,000 $ 236,000 $ 236,000 $ 334,523 $ 338,026Stockholder’s equity . . . . . . . . . . . . . . . . . . . $ 985,479 $ 805,709 $ 679,936 $ 556,024 $ 413,551
Cash Flow Data: Net cash provided by operating activities . . $ 278,619 $ 81,074 $ 85,821 $ 188,859 $ 181,041Net cash used in investing activities . . . . . . $ (83,392) $ (106,692) $ (39,496) $ (29,516) $ (34,947)Net cash (used in) provided by financing
activities . . . . . . . . . . . . . . . . . . . . . . . . . . $ (46,317) $ 11,505 $ (133,984) $ 13,349 $ (32,757)
Other Data: Gross Margin . . . . . . . . . . . . . . . . . . . . . . . . 39.4% 32.8% 38.6% 38.1% 34.8%Depreciation and amortization . . . . . . . . . . $ 39,473 $ 32,548 $ 31,727 $ 32,274 $ 30,158Capital expenditures . . . . . . . . . . . . . . . . . . . $ 83,398 $ 45,495 $ 39,782 $ 33,600 $ 34,947

19
Form 10-K
NOTES TO SELECTED FINANCIAL DATA
(a) Gross profit in fiscal 2011 includes $6.7 million in additional expenses related to the amortization of the fair value step-up of inventory acquired as a result of the Acquisition.
(b) Selling, general, & administrative expenses includes the following items:
For the fiscal years ended
(dollars in thousands)December 29,
2012December 31,
2011January 1,
2011January 2,
2010January 3,
2009
Workforce reduction, facility write-down, and closure costs . . . . . . . . . . $9,490 $ — — $10,771 $2,609
Investigation expenses . . . . . . . . . . . . . . . . . . . $ — $ — — $ 5,717 $ —Executive retirement charges . . . . . . . . . . . . . . $ — $ — — $ — $5,325Revaluation of contingent consideration . . . . $3,589 $2,484 — $ — $ —Acquisition-related charges . . . . . . . . . . . . . . . $ — $3,050 — $ — $ —
(c) Represents total current assets less total current liabilities.
(d) Fiscal 2008 contained 53 weeks of financial results.

20
ITEM 7. MANAGEMENT’S DISCUSSION AND ANALYSIS OF FINANCIAL CONDITION AND RESULTS OF OPERATIONS
The following is a discussion of our results of operations and current financial condition. You should read this discussion in conjunction with our consolidated historical financial statements and notes included elsewhere in this Annual Report on Form 10-K. Our discussion of our results of operations and financial condition includes various forward-looking statements about our markets, the demand for our products and services, and our future results. We based these statements on assumptions that we consider reasonable. Actual results may differ materially from those suggested by our forward-looking statements for various reasons including those discussed in the “Risk Factors” in Item 1A of this Annual Report on Form 10-K. Those risk factors expressly qualify all subsequent oral and written forward-looking statements attributable to us or persons acting on our behalf. Except for any ongoing obligations to disclose material information as required by the federal securities laws, we do not have any intention or obligation to update forward-looking statements after we file this Annual Report on Form 10-K.
Fiscal year
Our fiscal year ends on the Saturday, in December or January nearest the last day of December, resulting in an additional week of results every five or six years. Consistent with this policy, fiscal 2012 ended on December 29, 2012, fiscal 2011 ended on December 31, 2011, and fiscal 2010 ended on January 1, 2011. Each of these fiscal years contained 52 weeks of financial results.
Our business
We are the largest branded marketer in the United States of apparel exclusively for babies and young children. We own two of the most highly recognized and most trusted brand names in the children’s apparel industry, Carter’s and OshKosh B’gosh (“OshKosh”). Established in 1865, our Carter’s brand is recognized and trusted by consumers for high-quality apparel for children sizes newborn to seven. Established in 1895, OshKosh is a well-known brand, trusted by consumers for its line of apparel for children sizes newborn to 12. We have extensive experience in the young children’s apparel market and focus on delivering products that satisfy our consumers’ needs. Our strategy is to market high-quality, essential core products at prices that deliver an attractive value proposition for consumers.
In the U.S., our brands compete in the $21 billion children’s apparel market, for children ages zero to seven, with our Carter’s brand achieving the #1 position with a 13.9% market share and our OshKosh brand having a 2.6% market share. We offer multiple product categories, including baby, sleepwear, playclothes, and other accessories. Our distribution strategy enables us to reach a broad range of consumers across various channels, socio-economic groups, and geographic regions.
In the U.S., our products are sold through approximately 17,000 wholesale locations (including national department stores, chain and specialty stores, and discount retailers), 581 Company-operated stores and through our websites. As of December 29, 2012, we operated 413 Carter’s and 168 OshKosh outlet, brand, and specialty stores in the U.S. Internationally, as of December 29, 2012, our products are sold via 82 Company-operated stores in Canada, in addition to our wholesale, licensing, and online channels.
Consistent with our strategy to extend the reach of our brands, on February 1, 2013, we closed on a transaction with a former licensee in Japan. The Company currently sells Carter’s and OshKosh B’gosh branded products through 97 retail locations, which include 14 branded stores and 83 additional retail points of distribution.

21
Form 10-K
Overview
In the fourth quarter of fiscal 2012, we announced our plans to consolidate the retail and finance operations currently managed in our Shelton, Connecticut facility with our Atlanta, Georgia based operations. In conjunction with the plan to close the facility, we recorded charges of approximately $6.4 million, primarily related to severance, relocation and recruiting expenses, and accelerated depreciation.
In the fourth quarter of fiscal 2012, we entered into a lease agreement for approximately 225,000 square feet of office space located in Atlanta, Georgia. This office space will serve as the new, world-wide corporate headquarters. The lease agreement expires on April 30, 2030. We plan to occupy the facility no later than December 31, 2013.
In the first quarter of fiscal 2012, we announced our plans to close our Hogansville, Georgia facility, consistent with our strategy to strengthen our distribution capabilities and open a new, larger multi-channel distribution facility in Braselton, Georgia. In conjunction with the plan to close the Hogansville distribution facility, we recorded charges of approximately $3.1 million in closing-related costs, primarily related to severance and accelerated depreciation.
On June 30, 2011, we purchased Bonnie Togs (the “Acquisition”), a Canadian specialty retailer focused exclusively on the children’s apparel and accessories marketplace. Prior to the Acquisition, Bonnie Togs was a significant international licensee of the Company. The operating results for the Canadian business have been consolidated in the Company’s operating results effective from the date of the Acquisition.
Segments
The five business segments we use to manage and evaluate our performance are: Carter’s wholesale, Carter’s retail, OshKosh retail, OshKosh wholesale, and international.

22
RESULTS OF OPERATIONS
The following table sets forth, for the periods indicated (i) selected statement of operations data expressed as a percentage of net sales and (ii) the number of retail stores open at the end of each period:
For the fiscal years ended
December 29,
2012 December 31,
2011 January 1,
2011
Net salesCarter’s Wholesale. . . . . . . . . . . . . . . . . . . . . . . . . . . . . . . . . . . . . 41.2% 44.5% 47.3%Carter’s Retail . . . . . . . . . . . . . . . . . . . . . . . . . . . . . . . . . . . . . . . . 34.4% 31.8% 31.2%
Total Carter’s . . . . . . . . . . . . . . . . . . . . . . . . . . . . . . . . . . . . . . 75.6% 76.3% 78.5%
OshKosh Retail . . . . . . . . . . . . . . . . . . . . . . . . . . . . . . . . . . . . . . . 11.9% 13.3% 15.2%OshKosh Wholesale . . . . . . . . . . . . . . . . . . . . . . . . . . . . . . . . . . . 3.3% 3.9% 4.3%
Total OshKosh . . . . . . . . . . . . . . . . . . . . . . . . . . . . . . . . . . . . . 15.2% 17.2% 19.5%
International. . . . . . . . . . . . . . . . . . . . . . . . . . . . . . . . . . . . . . . . . . 9.2% 6.5% 2.0%
Consolidated net sales . . . . . . . . . . . . . . . . . . . . . . . . . . . . . . . . . . 100.0% 100.0% 100.0%Cost of goods sold . . . . . . . . . . . . . . . . . . . . . . . . . . . . . . . . . . . . . 60.6% 67.2% 61.4%
Gross profit. . . . . . . . . . . . . . . . . . . . . . . . . . . . . . . . . . . . . . . . . . . 39.4% 32.8% 38.6%Selling, general, and administrative expenses. . . . . . . . . . . . . . . 29.9% 25.7% 26.8%Royalty income. . . . . . . . . . . . . . . . . . . . . . . . . . . . . . . . . . . . . . . . (1.6)% (1.7)% (2.2)%
Operating income . . . . . . . . . . . . . . . . . . . . . . . . . . . . . . . . . . . . . 11.0% 8.9% 13.9%Interest expense, net . . . . . . . . . . . . . . . . . . . . . . . . . . . . . . . . . . . 0.3% 0.3% 0.6%Foreign currency gain . . . . . . . . . . . . . . . . . . . . . . . . . . . . . . . . . . —% —% —%
Income before income taxes . . . . . . . . . . . . . . . . . . . . . . . . . . . . . 10.7% 8.6% 13.3%Provision for income taxes . . . . . . . . . . . . . . . . . . . . . . . . . . . . . . 4.0% 3.2% 4.9%
Net income . . . . . . . . . . . . . . . . . . . . . . . . . . . . . . . . . . . . . . . . . . . 6.8% 5.4% 8.4%
Number of retail stores at end of period:Carter’s - U.S. . . . . . . . . . . . . . . . . . . . . . . . . . . . . . . . . . . . . . . 413 359 306OshKosh - U.S. . . . . . . . . . . . . . . . . . . . . . . . . . . . . . . . . . . . . . 168 170 180International . . . . . . . . . . . . . . . . . . . . . . . . . . . . . . . . . . . . . . . 82 65 —
Total . . . . . . . . . . . . . . . . . . . . . . . . . . . . . . . . . . . . . . . . . . . 663 594 486
Note: Results may not be additive due to rounding.

23
Form 10-K
FISCAL YEAR ENDED DECEMBER 29, 2012 COMPARED WITH FISCAL YEAR ENDED DECEMBER 31, 2011
CONSOLIDATED NET SALES
In fiscal 2012, consolidated net sales increased $272.0 million, or 12.9%, to $2.4 billion. The growth reflects higher sales across all segments, except OshKosh Wholesale, and the effect of a full year of sales in fiscal 2012 from the acquisition of Bonnie Togs versus six months of sales in the prior year. Consolidated net sales for fiscal 2012 include $46.1 million in off-price channel sales, compared to $79.5 million in fiscal 2011.
For the fiscal years ended
(dollars in thousands)December 29,
2012 % ofTotal
December 31, 2011
% ofTotal
Net sales:Carter’s Wholesale . . . . . . . . . . . . . . . . . . . . . . . . . . . . . . $ 981,445 41.2% $ 939,115 44.5%Carter’s Retail . . . . . . . . . . . . . . . . . . . . . . . . . . . . . . . . . 818,909 34.4% 671,590 31.8%
Total Carter’s . . . . . . . . . . . . . . . . . . . . . . . . . . . . . . . 1,800,354 75.6% 1,610,705 76.3%
OshKosh Retail . . . . . . . . . . . . . . . . . . . . . . . . . . . . . . . . 283,343 11.9% 280,900 13.3%OshKosh Wholesale. . . . . . . . . . . . . . . . . . . . . . . . . . . . . 79,752 3.3% 81,888 3.9%
Total OshKosh . . . . . . . . . . . . . . . . . . . . . . . . . . . . . . 363,095 15.2% 362,788 17.2%
International . . . . . . . . . . . . . . . . . . . . . . . . . . . . . . . . . . . 218,285 9.2% 136,241 6.5%
Total net sales . . . . . . . . . . . . . . . . . . . . . . . . . . . . . . . $2,381,734 100.0% $2,109,734 100.0%
CARTER’S WHOLESALE SALES
Carter’s wholesale sales increased $42.3 million, or 4.5%, in fiscal 2012 to $981.4 million. This growth was primarily driven by a 5.2% increase in average price per unit, partially offset by a 0.7% decrease in units shipped as compared to fiscal 2011. The increase in average price per unit resulted from improved price realization across our product offerings and lower levels of off-price channel sales. The decrease in units shipped was primarily due to fewer shipments in the off-price channel.
CARTER’S RETAIL SALES
Carter’s retail store sales increased $147.3 million, or 21.9%, in fiscal 2012 to $818.9 million. The increase was driven by incremental sales of $77.3 million generated by new store openings, $54.3 million generated by eCommerce sales, and a comparable store sales increase of $23.5 million, or 3.9%, partially offset by the impact of store closings of $7.8 million. On a comparable store basis, the average transaction value increased 3.6% principally due to improved price realization.
Our comparable store sales calculations include sales for all stores that were open during the comparable fiscal period, including remodeled stores, and certain relocated stores. If a store relocates within the same center with no business interruption or material change in square footage, the sales of such store will continue to be included in the comparable store calculation. If a store relocates to another center, or there is a material change in square footage, such store is treated as a new store. Stores that are closed during the period are included in the comparable store sales calculation up to the last full fiscal month of operations.
During fiscal 2012, we opened 63 Carter’s stores and closed nine stores. There were a total of 413 Carter’s retail stores as of December 29, 2012. In total, we plan to open approximately 60 and close five Carter’s retail stores during fiscal 2013.

24
OSHKOSH RETAIL SALES
OshKosh retail store sales increased $2.4 million, or 0.9%, in fiscal 2012 to $283.3 million. The increase reflects incremental sales of $15.1 million generated by eCommerce sales and $3.8 million generated by new store openings, partially offset by the impact of store closings of $11.4 million and a comparable store sales decrease of $5.1 million, or 2.0%. On a comparable store basis, the average transaction value increased 4.0% as a result of improved price realization, and the number of transactions decreased 5.8% due to a decline in traffic.
During fiscal 2012, we opened eight OshKosh stores and closed ten stores. There were a total of 168 OshKosh retail stores as of December 29, 2012. In total, we plan to open approximately 15 and close four OshKosh retail stores during fiscal 2013.
OSHKOSH WHOLESALE SALES
OshKosh wholesale sales decreased $2.1 million, or 2.6%, in fiscal 2012 to $79.8 million. Our wholesale sales experienced an 11.6% decrease in units shipped and a 10.2% increase in average price per unit, primarily due to lower off-price channel sales in fiscal 2012, as compared to fiscal 2011.
INTERNATIONAL SALES
Our international sales include our Canadian retail and wholesale operations, and international wholesale sales.
International sales increased $82.0 million, or 60.2%, in fiscal 2012 to $218.3 million. Our international retail sales increased $69.5 million to $136.5 million, reflecting a full year of Canadian sales in fiscal 2012 as compared to two quarters in fiscal 2011. In addition, international wholesale sales increased $12.5 million, or 18.1%, to $81.8 million, driven by a full year of Canadian wholesale sales in fiscal 2012 as compared to two quarters in fiscal 2011, along with higher wholesale sales in other countries.
During fiscal 2012, we opened 18 retail stores in Canada and closed one store. There were a total of 82 retail stores in Canada as of December 29, 2012. In fiscal 2013, we plan to open a total of approximately 20 retail stores in Canada and close one.
GROSS PROFIT
Our gross profit increased $245.7 million, or 35.5%, to $937.9 million in fiscal 2012. Gross margin increased from 32.8% in fiscal 2011 to 39.4% in fiscal 2012. Gross margin in fiscal 2012 was favorably affected by higher selling prices, lower product costs, greater contribution from the direct-to-consumer business, and the absence of the Acquisition fair value adjustment.
We include distribution costs in selling, general, and administrative expenses. Accordingly, our gross profit may not be comparable to other companies that include such distribution costs in their cost of goods sold.
SELLING, GENERAL, AND ADMINISTRATIVE EXPENSES
Selling, general, and administrative expenses in fiscal 2012 increased $171.1 million, or 31.6%, to $713.2 million. As a percentage of net sales, selling, general, and administrative expenses increased from 25.7% to 29.9% in fiscal 2012.
The increase in selling, general, and administrative expenses as a percentage of net sales reflects:
• $28.2 million in higher provisions for performance-based compensation;
• $27.9 million in higher international retail store expenses, reflecting a full year of sales from our Canadian business in fiscal 2012 versus six months of sales in fiscal 2011;

25
Form 10-K
• $17.2 million in incremental operating expenses associated with the growth of the eCommerce business;
• $15.6 million in marketing expenses primarily related to branding initiatives; and
• $9.5 million in expenses related to the facility closure of the Hogansville distribution center and the Shelton office consolidation.
Slightly offsetting these increases were:
• $3.0 million in professional service fees recorded in fiscal 2011 in connection with the acquisition of Bonnie Togs.
ROYALTY INCOME
We license the use of our Carter’s, Just One You, Child of Mine, OshKosh B’gosh, OshKosh, Genuine Kids from OshKosh, and Precious Firsts brand names. Royalty income from these brands in fiscal 2012 was approximately $37.2 million (including $6.8 million of international royalty income), a decrease of 0.1%, as compared to fiscal 2011. The slight decrease reflects the absence of international royalty income from our former licensee, Bonnie Togs, which was acquired in June 2011, primarily offset by increased sales from other licensees.
OPERATING INCOME
Operating income increased $74.5 million, or 39.8%, to $262.0 million in fiscal 2012 due to the factors described above.
INTEREST EXPENSE, NET
Interest expense, net in fiscal 2012 decreased $0.4 million, or 5.7%, to $6.7 million, compared to fiscal 2011. Weighted-average borrowings for fiscal 2012 were $210.4 million at an effective interest rate of 3.23%, as compared to weighted-average borrowings for fiscal 2011 of $236.0 million at an effective interest rate of 3.25%. The effective interest rate calculation includes the amortization of debt issuance costs.
FOREIGN CURRENCY GAIN
During fiscal 2012, we recorded foreign currency gains of $0.1 million related to the mark-to-market adjustment on foreign currency exchange contracts and foreign currency denominated payables.
During fiscal 2011, we recorded foreign currency gains of $0.6 million, as a result of a forward foreign currency exchange contract to reduce our risk from exchange fluctuations on the purchase price of Bonnie Togs and the mark-to-market adjustments on foreign currency exchange contracts and foreign currency denominated payables.
INCOME TAXES
Our effective tax rate was 36.9% for fiscal 2012 as compared to 37.0% for fiscal 2011. The slight decrease in our effective rate is attributable to our Canadian operations which carry a lower overall effective tax rate. For both years, the effective tax rate was favorably affected by the recognition of previously recorded uncertain tax positions.
NET INCOME
Our net income for fiscal 2012 increased $47.1 million, or 41.3%, to $161.2 million as compared to $114.0 million in fiscal 2011.

26
FISCAL YEAR ENDED DECEMBER 31, 2011 COMPARED WITH FISCAL YEAR ENDED JANUARY 1, 2011
CONSOLIDATED NET SALES
Consolidated net sales for fiscal 2011 were $2.1 billion, an increase of $360.5 million, or 20.6%, compared to $1.7 billion in fiscal 2010 and reflects growth in all of our segments and the Acquisition.
For the fiscal years ended
(dollars in thousands)December 31,
2011% of Total
January 1, 2011
% of Total
Net sales:Carter’s Wholesale . . . . . . . . . . . . . . . . . . . . . . . . . . . . . . . . $ 939,115 44.5% $ 827,815 47.3%Carter’s Retail . . . . . . . . . . . . . . . . . . . . . . . . . . . . . . . . . . . 671,590 31.8% 546,233 31.2%
Total Carter’s . . . . . . . . . . . . . . . . . . . . . . . . . . . . . . . . . 1,610,705 76.3% 1,374,048 78.5%
OshKosh Retail . . . . . . . . . . . . . . . . . . . . . . . . . . . . . . . . . . 280,900 13.3% 264,887 15.2%OshKosh Wholesale. . . . . . . . . . . . . . . . . . . . . . . . . . . . . . . 81,888 3.9% 75,484 4.3%
Total OshKosh . . . . . . . . . . . . . . . . . . . . . . . . . . . . . . . . 362,788 17.2% 340,371 19.5%
International . . . . . . . . . . . . . . . . . . . . . . . . . . . . . . . . . . . . . 136,241 6.5% 34,837 2.0%
Total net sales . . . . . . . . . . . . . . . . . . . . . . . . . . . . . . . . . $2,109,734 100% $1,749,256 100%
CARTER’S WHOLESALE SALES
Carter’s wholesale sales increased $111.3 million, or 13.4%, in fiscal 2011 to $939.1 million. This growth was driven by an 8% increase in units shipped and a 5% increase in average price per unit, as compared to fiscal 2010. The increase in units shipped was primarily driven by continued strong demand for our Carter’s and Child of Mine product offerings and an increase in shipments to the off-price channel. The increase in average price per unit primarily reflects higher average selling prices on our product offerings.
CARTER’S RETAIL SALES
Carter’s retail sales increased $125.4 million, or 22.9%, in fiscal 2011 to $671.6 million. The increase was driven by incremental sales of $57.0 million generated by new store openings, $40.8 million generated by eCommerce sales, and a comparable store sales increase of $29.1 million, or 5.6% (based on 296 locations), partially offset by the effect of store closures of $1.5 million. During fiscal 2011, on a comparable store basis, average prices increased 5.0% on our product offerings, units per transaction increased 1.9%, and transactions decreased 1.3%. Despite a decline in consumer traffic, we believe comparable store sales were strong.
There were a total of 359 Carter’s retail stores open as of December 31, 2011. During fiscal 2011, we opened 56 and closed three Carter’s retail stores.
OSHKOSH RETAIL SALES
OshKosh retail sales increased $16.0 million, or 6.0%, in fiscal 2011 to $280.9 million. The increase reflects incremental sales of $12.9 million generated by eCommerce sales and $8.9 million generated by new store openings, partially offset by the effect of store closings of $5.0 million and a comparable store sales decrease of $0.7 million, or 0.3% (based on 163 locations). On a comparable store basis, units per transaction increased 2.4%, average prices increased 1.0%, and transactions decreased 3.6% on our product offerings. We believe this decrease was driven by the decline in consumer traffic.

27
Form 10-K
There were a total of 170 OshKosh retail stores open as of December 31, 2011. During fiscal 2011, we opened three and closed 13 OshKosh retail stores.
OSHKOSH WHOLESALE SALES
OshKosh wholesale sales increased $6.4 million, or 8.5%, in fiscal 2011 to $81.9 million. The increase in OshKosh wholesale sales was driven by an 8% increase in average price per unit and a 1% increase in units shipped, as compared to fiscal 2010. The increase in average price per unit primarily reflects higher average selling prices. The increase in units shipped was primarily driven by an increase in shipments to our off-price customers.
INTERNATIONAL SALES
International sales increased $101.4 million, or 291.1%, in fiscal 2011 to $136.2 million. The increase reflects six months of sales from our new Canadian operations in the current year and higher international wholesale sales, primarily driven by expansion in our multi-national accounts and growth in the Middle East. We operated a total of 65 retail stores in Canada as of December 31, 2011.
GROSS PROFIT
Our gross profit increased $17.6 million, or 2.6%, to $692.3 million in fiscal 2011. Gross margin decreased from 38.6% in fiscal 2010 to 32.8% in fiscal 2011.
The decrease in gross profit as a percentage of net sales reflects:
(i) higher product costs of approximately $180 million primarily related to increases in cotton prices and labor rates; and
(ii) an amortization charge of approximately $6.7 million related to a fair value step-up of inventory acquired at the Acquisition and sold during fiscal 2011.
Partially offsetting these decreases were:
(i) approximately $101 million in selective price increases; and
(ii) approximately $40 million in incremental volume related to our new Canadian operations in fiscal 2011.
The Company includes distribution costs in its selling, general, and administrative expenses. Accordingly, the Company’s gross profit may not be comparable to other companies that include such distribution costs in their cost of goods sold.
SELLING, GENERAL, AND ADMINISTRATIVE EXPENSES
Selling, general, and administrative expenses in fiscal 2011 increased $73.0 million, or 15.6%, to $542.1 million. As a percentage of net sales, selling, general, and administrative expenses was 25.7% in fiscal 2011 as compared to 26.8% in fiscal 2010.
The improvements in selling, general, and administrative expenses as a percentage of net sales reflect:
(i) a 70 basis points decrease (from 12.3% to 11.6%) in our U.S. retail store expenses as compared to fiscal 2010;
(ii) approximately $11 million in lower provisions for performance-based compensation for fiscal 2011; and
(iii) controlling growth in spending to a lower rate than growth in net sales.
Partially offsetting these reductions were:
(i) $21.4 million in Bonnie Togs selling, general and administrative expenses;

28
(ii) $3.0 million of Bonnie Togs acquisition-related expenses during fiscal 2011; and
(iii) $2.5 million of accretion expense associated with the revaluation of the Bonnie Togs contingent consideration.
ROYALTY INCOME
Our royalty income decreased $0.3 million, or 0.8%, to $37.3 million in fiscal 2011. The decrease was primarily due to the absence of six months of international royalty income in fiscal 2011 from our former licensee, Bonnie Togs.
We license the use of our Carter’s, Just One You, and Child of Mine brands. Domestic royalty income from these brands was approximately $18.5 million, an increase of 0.9%, or $0.2 million, as compared to fiscal 2010 resulting from higher sales by our Carter’s brand and Just One You brand licensees, partially offset by lower sales from our Child of Mine brand licensees. The Carter’s brand internationally generated $1.3 million in royalty income in fiscal 2011 as compared to $1.9 million in fiscal 2010.
We also license the use of our OshKosh B’gosh, OshKosh, and Genuine Kids from OshKosh brands. Domestic royalty income from these brands increased approximately $0.5 million, or 5.1%, to $10.3 million in fiscal 2011. This increase was driven by increased sales by our Genuine Kids from OshKosh brand sold at Target. The OshKosh brand internationally generated $7.1 million in royalty income in fiscal 2011 as compared to $7.5 million in fiscal 2010.
OPERATING INCOME
Our operating income decreased $55.8 million, or 22.9%, to $187.5 million in fiscal 2011. This decrease in operating income is attributable to the factors described above.
INTEREST EXPENSE, NET
Interest expense, net, in fiscal 2011 decreased $2.7 million, or 27.6%, to $7.1 million. This decrease is attributable to $47.3 million in lower weighted-average borrowings. In fiscal 2011, weighted-average borrowings were $236 million at an effective interest rate of 3.25%, as compared to weighted-average borrowings of $283.3 million at an effective interest rate of 3.67%. The effective interest rate calculation includes the amortization of debt issuance costs. In fiscal 2010, we recorded $1.7 million in interest expense related to our interest rate swap agreements and a $1.7 million write-off of debt issuance costs related to the prepayment of a portion of our term loan debt.
FOREIGN CURRENCY GAIN
As part of the Acquisition, we entered into a forward foreign currency exchange contract to reduce its risk from exchange rate fluctuations on the purchase price of Bonnie Togs. The contract was settled on June 30, 2011 and a gain of $0.2 million was recognized in earnings during the second quarter of fiscal 2011. In addition, during fiscal 2011, we recorded $0.4 million net gain primarily related to our Canadian subsidiary’s foreign currency exchange contracts and its foreign denominated payables.
INCOME TAXES
Our effective tax rate was approximately 37.0% in fiscal 2011 as compared to approximately 37.2% in fiscal 2010. The effective tax rate in both years was reduced by the reversal of reserves for uncertain tax positions.
NET INCOME
As a result of the factors described above, our net income for fiscal 2011 decreased $32.5 million, or 22.2%, to $114.0 million as compared to $146.5 million in fiscal 2010.

29
Form 10-K
FINANCIAL CONDITION, CAPITAL RESOURCES, AND LIQUIDITY
Our primary cash needs are working capital and capital expenditures. Substantially all of our cash is held in the U.S. Our primary source of liquidity will continue to be cash and cash equivalents on hand, cash flow from operations, and borrowings under our revolving credit facility, and we expect that these sources will fund our ongoing requirements for working capital and capital expenditures. These sources of liquidity may be affected by events described in our risk factors, as further discussed in Part I, Item 1A of this filing.
Net accounts receivable at December 29, 2012 were $168.0 million compared to $157.8 million at December 31, 2011. The increase of $10.3 million, or 6.5%, as compared to December 31, 2011 primarily reflects higher sales of Carter’s brand and certain wholesale product offerings in the latter part of fiscal 2012 as compared to fiscal 2011.
Net inventories at December 29, 2012 were $349.5 million compared to $347.2 million at December 31, 2011. The increase of $2.3 million, or 0.7%, as compared to December 31, 2011, reflects growth in the business and timing of shipments, partially offset by lower product costs.
Net cash provided by operating activities for fiscal 2012 was $278.6 million compared to net cash provided by operating activities of $81.1 million in fiscal 2011. The increase in operating cash flow primarily reflects favorable changes in net working capital and increased earnings.
Our capital expenditures were $83.4 million in fiscal 2012 compared to $45.5 million in fiscal 2011, primarily reflecting approximately $50.0 million for U.S. and international retail store openings and remodelings, $13.4 million related to Braselton, and $9.8 million for information technology.
We plan to invest approximately $200 million in capital expenditures in fiscal 2013, primarily for U.S. and international retail store openings and remodelings, the expansion of our distribution capacity with the addition of the Braselton, Georgia facility, and expenditures related to the new corporate headquarters in Atlanta.
REVOLVING CREDIT FACILITY
On October 15, 2010, we entered into a $375 million ($130 million sub-limit for letters of credit and a swing line sub-limit of $40 million) revolving credit facility with Bank of America as sole lead arranger and administrative agent, JP Morgan Chase Bank as syndication agent, and other financial institutions. This revolving credit facility was immediately drawn upon to pay off our former term loan of $232.2 million and pay transaction fees and expenses of $3.8 million, leaving approximately $130 million available under the revolver for future borrowings (net of letters of credit of approximately $8.6 million).
On December 22, 2011, we amended and restated the revolving credit facility to, among other things, provide a U.S. dollar revolving facility of $340 million ($130 million sub-limit for letters of credit and a swing line sub-limit of $40 million) and a $35 million multicurrency revolving facility ($15 million sub-limit for letters of credit and a swing line sub-limit of $5 million), which is available for borrowings by either TWCC or our Canadian subsidiary, in U.S. dollars or Canadian dollars.
On August 31, 2012, we amended and restated the revolving credit facility to, among other things, improve interest rates applicable to pricing, extend the maturity of the facility, and allow borrowings in currencies other than U.S. dollars or Canadian dollars subject to the consent of all multicurrency lenders. The aggregate principal amount of the facility remained unchanged at $375 million consisting of a $340 million U.S. dollar revolving credit facility and a $35 million multicurrency revolving credit facility (although the sub-limit for U.S. dollar letters of credit was increased to $175 million). In connection with the amendment, we recorded approximately $1.9 million in debt issuance costs which, together with the existing unamortized debt issuance costs, will be amortized over the new remaining term of the facility (five years). The term of the revolving credit facility expires August 31, 2017.

30
Pricing options
The revolving credit facility provides for two pricing options for U.S. dollar facility revolving loans: (i) revolving loans on which interest is payable quarterly at a base rate equal to the highest of (x) the Federal Funds Rate plus ½ of 1%, (y) the rate of interest in effect for such day as publicly announced from time to time by Bank of America, N.A. as its prime rate, or (z) the Eurodollar Rate plus 1%, plus, in each case, an applicable margin initially equal to 0.75%, which may be adjusted based upon a leverage-based pricing grid ranging from 0.50% to 1.25% and (ii) revolving loans on which interest accrues for one, two, three, six or if, generally available, nine or twelve month interest periods (but is payable not less frequently than every three months) at a rate of interest per annum equal to an adjusted British Bankers Association LIBOR rate, plus an applicable margin initially equal to 1.75%, which may be adjusted based upon a leverage-based pricing grid ranging from 1.50% to 2.25%.
The revolving credit facility also provides for two pricing options for multicurrency facility revolving loans denominated in U.S. dollars: (i) revolving loans on which interest is payable quarterly at a base rate equal to the highest of (x) the Federal Funds Rate plus ½ of 1%, (y) the rate of interest in effect for such day as publicly announced from time to time by Bank of America, N.A., Canada Branch in Toronto as its reference rate for loans in U.S. dollars to its Canadian borrowers, or (z) the Eurodollar Rate plus 1%, plus, in each case, an applicable margin initially equal to 0.75%, which may be adjusted based upon a leverage-based pricing grid ranging from 0.50% to 1.25% and (ii) revolving loans on which interest accrues for one, two, three, six or if, generally available, nine or twelve month interest periods (but is payable not less frequently than every three months) at a rate of interest per annum equal to an adjusted British Bankers Association LIBOR rate, plus an applicable margin initially equal to 1.75%, which may be adjusted based upon a leverage-based pricing grid ranging from 1.50% to 2.25%.
In addition, the revolving credit facility provides for two pricing options for multicurrency facility revolving loans denominated in Canadian dollars: (i) revolving loans on which interest is payable quarterly at a base rate equal to the highest of (x) the rate of interest in effect for such day as publicly announced from time to time by Bank of America, N.A., Canada Branch in Toronto as its prime rate for loans in Canadian Dollars to Canadian Borrowers and (y) the rate of interest in effect for such day for Canadian dollar bankers’ acceptances having a term of one month that appears on the Reuters Screen CDOR Page plus ½ of 1%, plus, in each case, an applicable margin initially equal to 0.75%, which may be adjusted based upon a leverage-based pricing grid ranging from 0.50% to 1.25%, and (ii) revolving loans on which interest accrues for one, two, three, six or if, generally available, nine or twelve month interest periods (but is payable not less frequently than every three months) at a rate of interest per annum equal to an adjusted British Bankers Association LIBOR rate, plus an applicable margin initially equal to 1.75%, which may be adjusted based upon a leverage-based pricing grid ranging from 1.50% to 2.25%.
The multicurrency revolving facility also provides for borrowings in currencies other than U.S. Dollars or Canadian dollars, subject to certain limitations. For such multicurrency revolving loans, interest accrues for one, two, three, six or if, generally available, nine or twelve month interest periods (but is payable not less frequently than every three months) at a rate of interest per annum equal to an adjusted British Bankers Association LIBOR rate, plus an applicable margin initially equal to 1.75%, which may be adjusted based upon a leverage-based pricing grid ranging from 1.50% to 2.25%.
Amounts outstanding under the revolving credit facility currently accrue interest at a LIBOR rate plus 1.50%.
Covenants
The revolving credit facility contains and defines financial covenants, including a lease adjusted leverage ratio (defined as, with certain adjustments, the ratio of the Company’s consolidated indebtedness plus six times rent expense to consolidated net income before interest, taxes, depreciation, amortization, and rent expense (“EBITDAR”)) to exceed (x) if such period ends on or before December 31, 2016, 3.75:1.00 and (y) if such period ends after December 31, 2016, 3.50:1.00; and consolidated fixed charge coverage

31
Form 10-K
ratio (defined as, with certain adjustments, the ratio of consolidated EBITDAR to consolidated fixed charges (defined as interest plus rent expense)), for any such period to be less than 2.50:1.00. As of December 29, 2012, we are in compliance with our financial debt covenants.
Provisions in our senior credit facility currently restrict the ability of our operating subsidiary, The William Carter Company (“TWCC”), from paying cash dividends to our parent company, Carter’s, Inc., in excess of $15.0 million unless TWCC and its consolidated subsidiaries meet certain leverage ratio and minimum availability requirements under the credit facility, which could materially restrict Carter’s, Inc. from paying cash dividends on our common stock. We do not anticipate paying cash dividends on our common stock in the foreseeable future, but intend to retain future earnings, if any, for reinvestment in the future operation and expansion of our business and related development activities. Any future decision to pay cash dividends will be at the discretion of our Board of Directors and will depend upon our financial condition, results of operations, terms of financing arrangements, capital requirements, and any other factors as our Board of Directors deems relevant.
Outstanding amount and interest expense
During 2012, we made total net payments on our revolving credit facility of $50.0 million. At December 29, 2012, we had approximately $186.0 million in revolver borrowings, exclusive of $12.4 million of outstanding letters of credit, leaving approximately $189.0 million available for future borrowings. Weighted-average borrowings for fiscal 2012 were $210.4 million at an effective interest rate of 3.23%, as compared to weighted-average borrowings for fiscal 2011 of $236.0 million at an effective interest rate of 3.25%. The effective interest rate calculation includes the amortization of debt issuance costs.
Our operating results are subject to risk from interest rate fluctuations on our revolving credit facility, which carries variable interest rates. As of December 29, 2012, our outstanding variable rate debt aggregated approximately $186.0 million. An increase or decrease of 1% in the applicable rate applied to our weighted-average borrowings would have increased or decreased our fiscal 2012 interest cost by approximately $2.1 million.
BONNIE TOGS ACQUISITION
On June 30, 2011, we purchased Bonnie Togs for total consideration of up to CAD $95 million, of which USD $61.2 million was paid in cash at closing. The sellers may also be paid contingent consideration ranging from zero to CAD $35 million if the Canadian business meets certain earnings targets for the period beginning July 1, 2011 and ending on June 27, 2015. Sellers may receive a portion of the contingent consideration of up to CAD $25 million if interim earnings targets are met through June 2013 and June 2014, respectively. Any such payments are not recoverable in the event of any failure to meet overall targets.
As of December 29, 2012, a discounted contingent consideration liability of approximately $29.7 million was recorded, based upon the high probability that Bonnie Togs will attain its earnings targets, of which approximately $14.4 million is included in other current liabilities and the remainder is included in other long-term liabilities, on the accompanying audited consolidated balance sheet.
FACILITY CLOSURES
In conjunction with the plan to close the Hogansville, Georgia distribution facility, we expect to incur, in fiscal 2013, closure-related charges of approximately $2.2 million, comprising $0.6 million for one-time termination benefits, $0.5 million in accelerated depreciation, and other closure costs of $1.0 million. The salvage value of this facility is estimated to be $2.0 million.
On October 11, 2012, we announced our plans to consolidate the retail and financial operations currently managed in our Shelton, Connecticut facility with our Atlanta, Georgia based operations. We expect to complete this consolidation by the end of fiscal 2013. We anticipate pre-tax consolidation-related expenses in fiscal 2013 of approximately $32 - $36 million. Included in the total are cash charges of approximately

32
$30 million, comprising $13 million of recruiting and relocation expenses, $5 million of employee severance and other benefit costs, $8 million of lease-related charges, and $5 million of other closure costs. We also expect approximately $4 million in non-cash accelerated depreciation expense.
SHARE REPURCHASES
During fiscal 2010, our Board of Directors approved a share repurchase authorization pursuant to which we are authorized to purchase up to $100 million of our outstanding common shares. The total remaining capacity under this authorization was approximately $58.9 million as of December 29, 2012. This authorization has no expire date. We did not repurchase any shares of our common stock during the fiscal years ended December 29, 2012 and December 31, 2011 pursuant to any repurchase authorization other than the shares of common stock from the Company’s employees to satisfy tax withholding obligations upon vesting of restricted stock to such employees. Future repurchases may occur from time to time in the open market, in negotiated transactions, or otherwise. The timing and amount of any repurchases will be determined by management, based on its evaluation of market conditions, share price, other investment priorities, and other factors.
COMMITMENTS
The following table summarizes as of December 29, 2012, the maturity or expiration dates of mandatory contractual obligations and commitments for the following fiscal years:
(dollars in thousands) 2013 2014 2015 2016 2017 Thereafter Total
Long-term debt. . . . . . . . . . . . . . . . . $ — $ — $ — $ — $186,000 $ — $186,000Interest on debt (a). . . . . . . . . . . . . . 3,181 3,181 3,181 3,181 2,120 — 14,844Operating leases. . . . . . . . . . . . . . . . 95,091 85,407 78,579 72,922 67,941 259,768 659,708
Total financial obligations . . . . . 98,272 88,588 81,760 76,103 256,061 259,768 860,552Letters of credit . . . . . . . . . . . . . . . . 12,368 — — — — — 12,368
Total financial obligations and commitments (b) (c) . . . . . . . $110,640 $88,588 $81,760 $76,103 $256,061 $259,768 $872,920
(a) Reflects estimated variable rate interest on obligations outstanding on our revolving credit facility as of December 29, 2012 using an interest rate of 1.71% (rate in effect at December 29, 2012).
(b) The table above excludes our reserves for income taxes, as we are unable to reasonably predict the ultimate amount or timing of settlement.
(c) The table above excludes purchase obligations. Our estimate as of December 29, 2012 for commitments to purchase inventory in the normal course of business, which are cancellable (with or without penalty, depending on the stage of production) and span a period of one year or less is estimated to be $550 - $650 million.
In addition to the total contractual obligations and commitments in the table above, we have post-retirement benefit obligations and contingent consideration liabilities, which are included in other current and other long-term liabilities, as further described in our notes to the accompanying audited consolidated financial statements.
LIQUIDITY OUTLOOK
Based on our current outlook, we believe that cash generated from operations and available cash, together with amounts available under our revolving credit facility, will be adequate to meet our working capital needs and capital expenditure requirements for the foreseeable future, although no assurance can be given in this regard.

33
Form 10-K
EFFECTS OF INFLATION AND DEFLATION
In recent years, we have experienced increased costs of cotton, labor, fuel, and transportation, and have also had higher costs for foreign sourced products as a result of the devaluation of the U.S. dollar relative to certain foreign currencies. Although we expect product costs to decline in fiscal 2013 compared to fiscal 2012, we expect product costs will generally remain above historic levels. While we raised our selling prices on many of our products over the past two years, we have been unable to fully absorb the cost increases and our profitability has been adversely impacted. In recent years, we experienced deflationary pressure on its selling prices, in part driven by intense price competition in the young children’s apparel industry.
SEASONALITY
We experience seasonal fluctuations in our sales and profitability due to the timing of certain holidays and key retail shopping periods, generally resulting in lower sales and gross profit in the first half of our fiscal year. More of our consolidated net sales over the past five fiscal years, excluding the effect of the Acquisition in fiscal 2011, have typically been generated in the second half of our fiscal year (approximately 57%). Accordingly, our results of operations during the first half of the year may not be indicative of the results we expect for the full year.
CRITICAL ACCOUNTING POLICIES AND ESTIMATES
Our discussion and analysis of our financial condition and results of operations are based upon our consolidated financial statements, which have been prepared in accordance with accounting principles generally accepted in the United States of America. The preparation of these financial statements requires us to make estimates and judgments that affect the reported amounts of assets, liabilities, revenues, expenses, and related disclosure of contingent assets and liabilities. We base our estimates on historical experience and on various other assumptions that we believe are reasonable under the circumstances, the results of which form the basis for making judgments about the carrying values of assets and liabilities that are not readily apparent from other sources. Actual results may differ from these estimates under different assumptions or conditions.
Our significant accounting policies are described in Note 2 to our accompanying audited consolidated financial statements. The following discussion addresses our critical accounting policies and estimates, which are those policies that require management’s most difficult and subjective judgments, often as a result of the need to make estimates about the effect of matters that are inherently uncertain.
REVENUE RECOGNITION
We recognize wholesale and eCommerce revenue after shipment of products to customers, when title passes, when all risks and rewards of ownership have transferred, the sales price is fixed or determinable, and collectability is reasonably assured. In certain cases, in which we retain the risk of loss during shipment, revenue recognition does not occur until the goods have reached the specified customer. In the normal course of business, we grant certain accommodations and allowances to our wholesale customers to assist these customers with inventory clearance or promotions. Such amounts are reflected as a reduction of net sales and are recorded based upon agreements with customers, historical trends, and annual forecasts. Retail store revenues are recognized at the point of sale. We reduce revenue for estimated customer returns and deductions. We also maintain an allowance for doubtful accounts for estimated losses resulting from the inability of our customers to make payments and other actual and estimated deductions. If the financial condition of our customers were to deteriorate, resulting in an impairment of their ability to make payments, an additional allowance could be required. Past due balances over 90 days are reviewed individually for collectability. Our credit and collections department reviews all other balances regularly. Account balances are charged off against the allowance when we believe it is probable the receivable will not be recovered.

34
We record cooperative advertising arrangements with major wholesale customers at fair value. Such fair value is determined based upon, among other factors, comparable market analysis for similar advertisements. We have included the fair value of these arrangements of approximately $4.6 million, $3.6 million, and $4.0 million for fiscal years 2012, 2011, and 2010, respectively, as a component of selling, general, and administrative expenses on the accompanying consolidated statements of operations rather than as a reduction of revenue. Amounts determined to be in excess of the fair value of these arrangements are recorded as a reduction of net sales.
INVENTORY
We provide reserves for slow-moving inventory equal to the difference between the cost of inventory and the estimated market value based upon assumptions about future demand and market conditions. If actual market conditions are less favorable than we project, additional write-downs may be required.
GOODWILL AND TRADENAME
As of December 29, 2012, we had approximately $189.7 million in Carter’s and Bonnie Togs goodwill and $305.9 million of aggregate value related to the Carter’s, OshKosh, and Bonnie Togs tradename assets. The fair value of the Carter’s and OshKosh tradenames were valued at the time of the applicable acquisition using discounted cash flow analysis (in 2001, in the case of Carter’s, and 2005, in the case of OshKosh). The Carter’s and OshKosh tradenames were determined to have indefinite lives. The Bonnie Togs tradename was valued at the date of the acquisition in 2011, also using a discounted cash flow analysis. The Bonnie Togs tradename was determined to have a definite life and is being amortized over two years.
The carrying values of the goodwill and indefinite lived tradename assets are subject to annual impairment reviews as of the last day of each fiscal year. Impairment reviews may also be triggered by any significant events or changes in circumstances affecting our business. Factors affecting such impairment reviews include the continued market acceptance of our offered products and the development of new products. We use discounted cash flow models for quantitative assessments to determine the fair value of these assets, using assumptions we believe hypothetical marketplace participants would use. For indefinite-lived intangible assets, if the carrying amount exceeds the fair value, an impairment charge is recognized in the amount equal to that excess. For indefinite-lived intangibles, we may utilize a qualitative assessment, as described below, to determine whether the fair value of the indefinite-lived asset is less than its carrying value.
We perform impairment tests of goodwill at the reporting unit level. We may utilize a qualitative assessment to determine if it is “more likely than not” that the fair value of the reporting unit is less than its carrying value. If so, it is determined that the two-step goodwill impairment test using quantitative assessments is required to be performed. If not, no further testing is required and the relevant qualitative factors supporting the strength in fair value are documented. Qualitative factors may include, but are not limited to: macroeconomic conditions; industry and market considerations; cost factors that may have a negative effect on earnings; overall financial performance; and other relevant entity-specific events.
Under the quantitative assessment, the first step is to compare the fair value of a reporting unit to its carrying value, including goodwill. We use discounted cash flow models to determine the fair value of a reporting unit. The assumptions used in these models are consistent with those we believe hypothetical marketplace participants would use. If the fair value of a reporting unit is less than its carrying value, the second step of the impairment test must be performed in order to determine the impairment loss, if any. The second step compares the implied fair value of the reporting unit goodwill with the carrying amount of that goodwill. If the carrying amount of the reporting unit’s goodwill exceeds its implied fair value, an impairment charge is recognized in an amount equal to that excess. The loss recognized cannot exceed the carrying amount of the goodwill.

35
Form 10-K
A deterioration of macroeconomic conditions may not only negatively impact the estimated operating cash flows used in our cash flow models, but may also negatively impact other assumptions used in our analysis, including, but not limited to, the estimated cost of capital and/or discount rates. Additionally, we are required to ensure that assumptions used to determine fair value in our analysis are consistent with the assumptions a hypothetical marketplace participant would use. As a result, the cost of capital and/or discount rates used in our analysis may increase or decrease based on market conditions and trends, regardless of whether our actual cost of capital has changed. Therefore, we may recognize an impairment of an intangible asset or assets even though realized actual cash flows are approximately equal to or greater than our previously forecast amounts.
Based upon our most recent assessment, performed as of December 29, 2012, there was no impairment in the value of goodwill or indefinite-lived tradename assets.
ACCRUED EXPENSES
Accrued expenses for workers’ compensation, incentive compensation, health insurance, 401(k), and other outstanding obligations are assessed based on actual commitments, statistical trends, and estimates based on projections and current expectations, and these estimates are updated periodically as additional information becomes available.
LOSS CONTINGENCIES
We record accruals for various contingencies including legal exposures as they arise in the normal course of business. We determine whether to disclose and accrue for loss contingencies based on an assessment of whether the risk of loss is remote, reasonably possible, or probable. Our assessment is developed in consultation with our internal and external counsel and other advisors and is based on an analysis of possible outcomes under various strategies. Loss contingency assumptions involve judgments that are inherently subjective and can involve matters that are in litigation, which, by its nature is unpredictable. We believe that our assessment of the probability of loss contingencies is reasonable, but because of the subjectivity involved and the unpredictable nature of the subject matter at issue, our assessment may prove ultimately to be incorrect, which could materially impact our consolidated financial statements.
ACCOUNTING FOR INCOME TAXES
As part of the process of preparing the accompanying audited consolidated financial statements, we are required to estimate our actual current tax exposure (state, federal, and foreign). We assess our income tax positions and record tax benefits for all years subject to examination based upon management’s evaluation of the facts, circumstances, and information available at the reporting dates. We determine whether it is “more likely than not” that a tax position will be sustained upon the examination by the appropriate taxing authorities before any part of the benefit can be recorded in the financial statements. For those income tax positions where it is not “more likely than not” that a tax benefit will be sustained, no tax benefit has been recognized in the financial statements. Where applicable, associated interest and penalties are also recognized.
We also assess permanent and temporary differences resulting from differing bases and treatment of items for tax and accounting purposes, such as the carrying value of intangibles, deductibility of expenses, depreciation of property, plant, and equipment, stock-based compensation expense, and valuation of inventories. Temporary differences result in deferred tax assets and liabilities, which are included within our consolidated balance sheets. We must then assess the likelihood that our deferred tax assets will be recovered from future taxable income. Actual results could differ from this assessment if sufficient taxable income is not generated in future periods. To the extent we determine the need to establish a valuation allowance or increase such allowance in a period, we must include an expense within the tax provision in the accompanying consolidated statements of operations.

36
FOREIGN CURRENCY
The functional currency of substantially all of our foreign operations is the local currency. Assets and liabilities are translated into U.S. dollars using the current exchange rates in effect at the balance sheet date, while revenues and expenses are translated at the average exchange rates for the period. The resulting translation adjustments are recorded as a component of accumulated other comprehensive income (loss) within stockholders’ equity.
EMPLOYEE BENEFIT PLANS
We sponsor a defined contribution (401(k)) plan, a frozen defined benefit pension plan and other unfunded post-retirement plans. The defined benefit pension and post-retirement plans require an actuarial valuation to determine plan obligations, and related periodic costs. Plan valuations require economic assumptions, including expected rates of return on plan assets, discount rates to value plan obligations and employee demographic assumptions including mortality rates. The actuarial assumptions used may differ materially from actual results due to changing market and economic conditions. Actual results that differ from the actuarial assumptions are reflected as unrecognized gains and losses. Unrecognized gains and losses that exceed 10% of the greater of the plan’s projected benefit obligations or market value of assets are amortized to earnings over the estimated service life of the remaining plan participants.
Any future obligation under our pension plan not funded from investment returns on plan assets will be funded from cash flows from operations.
The most significant assumption used to determine the Company’s projected benefit obligation under its defined benefit plans is the discount rate used to determine the projected benefit obligation. A 0.25% change in the assumed discount rate would result in an increase or decrease in the amount of the pension plan’s projected benefit obligation of approximately $2.5 million.
See the employee benefit plans footnote to our accompanying audited consolidated financial statements for further details on rates and assumptions.
STOCK-BASED COMPENSATION ARRANGEMENTS
We account for the cost resulting from stock-based compensation arrangements at grant date fair value, utilizing the Black-Scholes option pricing model, which requires the use of subjective assumptions. These assumptions include the following:
Volatility—This is a measure of the amount by which a stock price has fluctuated or is expected to fluctuate. We use actual monthly historical changes in the market value of our stock covering the expected life of stock options being valued. An increase in the expected volatility will increase compensation expense.
Risk-free interest rate—This is the U.S. Treasury rate as of the grant date having a term equal to the expected term of the stock option. An increase in the risk-free interest rate will increase compensation expense.
Expected term—This is the period of time over which the stock options granted are expected to remain outstanding and is based on historical experience and estimated future exercise behavior. Separate groups of employees that have similar historical exercise behavior are considered separately for valuation purposes. An increase in the expected term will increase compensation expense.
Dividend yield—We do not have plans to pay dividends in the foreseeable future. An increase in the dividend yield will decrease compensation expense.
Forfeitures—We estimate forfeitures of stock-based awards based on historical experience and expected future activity.

37
Form 10-K
Changes in the subjective assumptions can materially affect the estimate of fair value of stock-based compensation and consequently, the related amount recognized in the accompanying consolidated statements of operations.
We account for performance-based awards over the vesting term of the awards that are expected to vest based on whether it is probable that the performance criteria will be achieved. We reassess the probability of vesting at each reporting period for awards with performance criteria and adjusts stock-based compensation expense based on its probability assessment.
FORWARD-LOOKING STATEMENTS
Statements contained herein that relate to our future performance, including, without limitation, statements with respect to our anticipated results of operations or level of business for fiscal 2013 or any other future period, are forward-looking statements within the meaning of the safe harbor provisions of the Private Securities Litigation Reform Act of 1995. Such statements are based on current expectations only and are subject to certain risks, uncertainties, and assumptions. Should one or more of these risks or uncertainties materialize, or should underlying assumptions prove incorrect, actual results may vary materially from those anticipated, estimated, or projected. These risks are described herein under Item 1A of Part I. We undertake no obligation to publicly update or revise any forward-looking statements, whether as a result of new information, future events, or otherwise.

38
ITEM 7A. QUANTITATIVE AND QUALITATIVE DISCLOSURES ABOUT MARKET RISK
CURRENCY AND INTEREST RATE RISKS
In the operation of our business, we have market risk exposures including those related to foreign currency risk and interest rates. These risks and our strategies to manage our exposure to them are discussed below.
We contract for production with third parties primarily in Asia. While these contracts are stated in United States dollars, there can be no assurance that the cost for the future production of our products will not be affected by exchange rate fluctuations between the United States dollar and the local currencies of these contractors. Due to the number of currencies involved, we cannot quantify the potential impact of future currency fluctuations on net income (loss) in future years. To date, such exchange fluctuations have not had a material impact on our financial condition or results of operations.
Transactions by our Canadian subsidiary may be denominated in a currency other than the entity’s functional currency, which is the Canadian dollar. Fluctuations in exchange rates, primarily between the United States dollar and the Canadian dollar, may affect our results of operations, financial position, and cash flows. We employ foreign exchange contracts to hedge foreign currency exchange rate risk associated with the procurement of U.S. dollar denominated finished goods destined for the Canadian market. These foreign exchange contracts are marked to market at the end of each reporting period, which could result in earnings volatility. As of December 29, 2012, there are no outstanding foreign exchange contracts.
Our operating results are subject to risk from interest rate fluctuations on our revolving credit facility, which carries variable interest rates. As of December 29, 2012, our outstanding variable rate debt aggregated approximately $186.0 million. Weighted-average borrowings for fiscal 2012 were $210.4 million. An increase or decrease of 1% in the effective interest rate would have increased or decreased our fiscal 2012 interest cost by approximately $2.1 million.
OTHER RISKS
We enter into various purchase order commitments with our suppliers. We can cancel these arrangements, although in some instances, we may be subject to a termination charge reflecting a percentage of work performed prior to cancellation.

39
Form 10-K
ITEM 8. FINANCIAL STATEMENTS AND SUPPLEMENTARY DATA
CARTER’S, INC.
INDEX TO CONSOLIDATED FINANCIAL STATEMENTS
Page
Report of Independent Registered Public Accounting Firm . . . . . . . . . . . . . . . . . . . . . . . . . . . . . . . . . . . 40
Consolidated Balance Sheets at December 29, 2012 and December 31, 2011 . . . . . . . . . . . . . . . . . . . . . 41
Consolidated Statements of Operations for the fiscal years ended December 29, 2012, December 31, 2011, and January 1, 2011 . . . . . . . . . . . . . . . . . . . . . . . . . . . . . . . . . . . . . . . . . . . . . . . . 42
Consolidated Statements of Comprehensive Income for the fiscal years ended December 29, 2012, December 31, 2011, and January 1, 2011 . . . . . . . . . . . . . . . . . . . . . . . . . . . . . . . . . . . . . . . . . . . . . . . . 43
Consolidated Statements of Cash Flows for the fiscal years ended December 29, 2012, December 31, 2011, and January 1, 2011 . . . . . . . . . . . . . . . . . . . . . . . . . . . . . . . . . . . . . . . . . . . . . . . . 44
Consolidated Statements of Changes in Stockholders’ Equity for the fiscal years ended December 29, 2012, December 31, 2011, and January 1, 2011 . . . . . . . . . . . . . . . . . . . . . . . . . . . . . . . 45
Notes to Consolidated Financial Statements . . . . . . . . . . . . . . . . . . . . . . . . . . . . . . . . . . . . . . . . . . . . . . . . 46

40
REPORT OF INDEPENDENT REGISTERED PUBLIC ACCOUNTING FIRM
To the Board of Directors and Stockholders of Carter’s, Inc.:
In our opinion, the accompanying consolidated financial statements listed in the accompanying index present fairly, in all material respects, the financial position of Carter’s, Inc. and its subsidiaries at December 29, 2012 and December 31, 2011 and the results of their operations and their cash flows for each of the three years in the period ended December 29, 2012 in conformity with accounting principles generally accepted in the United States of America. Also in our opinion, the Company maintained, in all material respects, effective internal control over financial reporting as of December 29, 2012 based on criteria established in Internal Control - Integrated Framework issued by the Committee of Sponsoring Organizations of the Treadway Commission (COSO). The Company’s management is responsible for these financial statements, for maintaining effective internal control over financial reporting and for its assessment of the effectiveness of internal control over financial reporting, included in Management’s Report on Internal Control over Financial Reporting appearing under Item 9A. Our responsibility is to express opinions on these financial statements and on the Company’s internal control over financial reporting based on our integrated audits. We conducted our audits in accordance with the standards of the Public Company Accounting Oversight Board (United States). Those standards require that we plan and perform the audits to obtain reasonable assurance about whether the financial statements are free of material misstatement and whether effective internal control over financial reporting was maintained in all material respects. Our audits of the financial statements included examining, on a test basis, evidence supporting the amounts and disclosures in the financial statements, assessing the accounting principles used and significant estimates made by management, and evaluating the overall financial statement presentation. Our audit of internal control over financial reporting included obtaining an understanding of internal control over financial reporting, assessing the risk that a material weakness exists, and testing and evaluating the design and operating effectiveness of internal control based on the assessed risk. Our audits also included performing such other procedures as we considered necessary in the circumstances. We believe that our audits provide a reasonable basis for our opinions.
A company’s internal control over financial reporting is a process designed to provide reasonable assurance regarding the reliability of financial reporting and the preparation of financial statements for external purposes in accordance with generally accepted accounting principles. A company’s internal control over financial reporting includes those policies and procedures that (i) pertain to the maintenance of records that, in reasonable detail, accurately and fairly reflect the transactions and dispositions of the assets of the company; (ii) provide reasonable assurance that transactions are recorded as necessary to permit preparation of financial statements in accordance with generally accepted accounting principles, and that receipts and expenditures of the company are being made only in accordance with authorizations of management and directors of the company; and (iii) provide reasonable assurance regarding prevention or timely detection of unauthorized acquisition, use, or disposition of the company’s assets that could have a material effect on the financial statements.
Because of its inherent limitations, internal control over financial reporting may not prevent or detect misstatements. Also, projections of any evaluation of effectiveness to future periods are subject to the risk that controls may become inadequate because of changes in conditions, or that the degree of compliance with the policies or procedures may deteriorate.
/s/ PricewaterhouseCoopers LLPStamford, CTFebruary 27, 2013

41
Form 10-K
CARTER’S, INC.
CONSOLIDATED BALANCE SHEETS
(dollars in thousands, except for share data)
See accompanying notes to the consolidated financial statements
December 29,
2012December 31,
2011
ASSETS Current assets:
Cash and cash equivalents. . . . . . . . . . . . . . . . . . . . . . . . . . . . . . . . . . . . . . . . . . . $ 382,236 $ 233,494Accounts receivable, net . . . . . . . . . . . . . . . . . . . . . . . . . . . . . . . . . . . . . . . . . . . . 168,046 157,754Finished goods inventories, net. . . . . . . . . . . . . . . . . . . . . . . . . . . . . . . . . . . . . . . 349,530 347,215Prepaid expenses and other current assets . . . . . . . . . . . . . . . . . . . . . . . . . . . . . 22,216 18,519Deferred income taxes. . . . . . . . . . . . . . . . . . . . . . . . . . . . . . . . . . . . . . . . . . . . . . 35,675 25,165
Total current assets. . . . . . . . . . . . . . . . . . . . . . . . . . . . . . . . . . . . . . . . . . . . . . 957,703 782,147Property, plant, and equipment, net. . . . . . . . . . . . . . . . . . . . . . . . . . . . . . . . . . . . . . 170,110 122,346Tradenames . . . . . . . . . . . . . . . . . . . . . . . . . . . . . . . . . . . . . . . . . . . . . . . . . . . . . . . . . 305,884 306,176Goodwill . . . . . . . . . . . . . . . . . . . . . . . . . . . . . . . . . . . . . . . . . . . . . . . . . . . . . . . . . . . . 189,749 188,679Deferred debt issuance costs, net. . . . . . . . . . . . . . . . . . . . . . . . . . . . . . . . . . . . . . . . 2,878 2,624Other intangible assets, net. . . . . . . . . . . . . . . . . . . . . . . . . . . . . . . . . . . . . . . . . . . . . 188 258Other assets . . . . . . . . . . . . . . . . . . . . . . . . . . . . . . . . . . . . . . . . . . . . . . . . . . . . . . . . . 3,597 479
Total assets. . . . . . . . . . . . . . . . . . . . . . . . . . . . . . . . . . . . . . . . . . . . . . . . . . $1,630,109 $1,402,709
LIABILITIES AND STOCKHOLDERS’ EQUITYCurrent liabilities:
Current maturities of long-term debt. . . . . . . . . . . . . . . . . . . . . . . . . . . . . . . . . . $ — $ —Accounts payable . . . . . . . . . . . . . . . . . . . . . . . . . . . . . . . . . . . . . . . . . . . . . . . . . . 149,625 102,804Other current liabilities . . . . . . . . . . . . . . . . . . . . . . . . . . . . . . . . . . . . . . . . . . . . . 94,610 49,949
Total current liabilities . . . . . . . . . . . . . . . . . . . . . . . . . . . . . . . . . . . . . . . . . . . 244,235 152,753Long-term debt. . . . . . . . . . . . . . . . . . . . . . . . . . . . . . . . . . . . . . . . . . . . . . . . . . . . . . . 186,000 236,000Deferred income taxes. . . . . . . . . . . . . . . . . . . . . . . . . . . . . . . . . . . . . . . . . . . . . . . . . 114,341 114,421Other long-term liabilities. . . . . . . . . . . . . . . . . . . . . . . . . . . . . . . . . . . . . . . . . . . . . . 100,054 93,826
Total liabilities. . . . . . . . . . . . . . . . . . . . . . . . . . . . . . . . . . . . . . . . . . . . . . . 644,630 597,000
Commitments and contingenciesStockholders’ equity: Preferred stock; par value $.01 per share; 100,000 shares authorized;
none issued or outstanding at December 29, 2012, and December 31, 2011, respectively . . . . . . . . . . . . . . . . . . . . . . . . . . . . . . . . . . — —
Common stock, voting; par value $.01 per share; 150,000,000 shares authorized; 59,126,639 and 58,595,421 shares issued and outstanding at December 29, 2012 and December 31, 2011, respectively . . . . . . . . . . . . . . . 591 586Additional paid-in capital . . . . . . . . . . . . . . . . . . . . . . . . . . . . . . . . . . . . . . . . . . . 250,276 231,738Accumulated other comprehensive loss. . . . . . . . . . . . . . . . . . . . . . . . . . . . . . . . (11,205) (11,282)Retained earnings . . . . . . . . . . . . . . . . . . . . . . . . . . . . . . . . . . . . . . . . . . . . . . . . . 745,817 584,667
Total stockholders’ equity . . . . . . . . . . . . . . . . . . . . . . . . . . . . . . . . . . . . . . . . 985,479 805,709
Total liabilities and stockholders’ equity . . . . . . . . . . . . . . . . . . . . . . . . . $1,630,109 $1,402,709
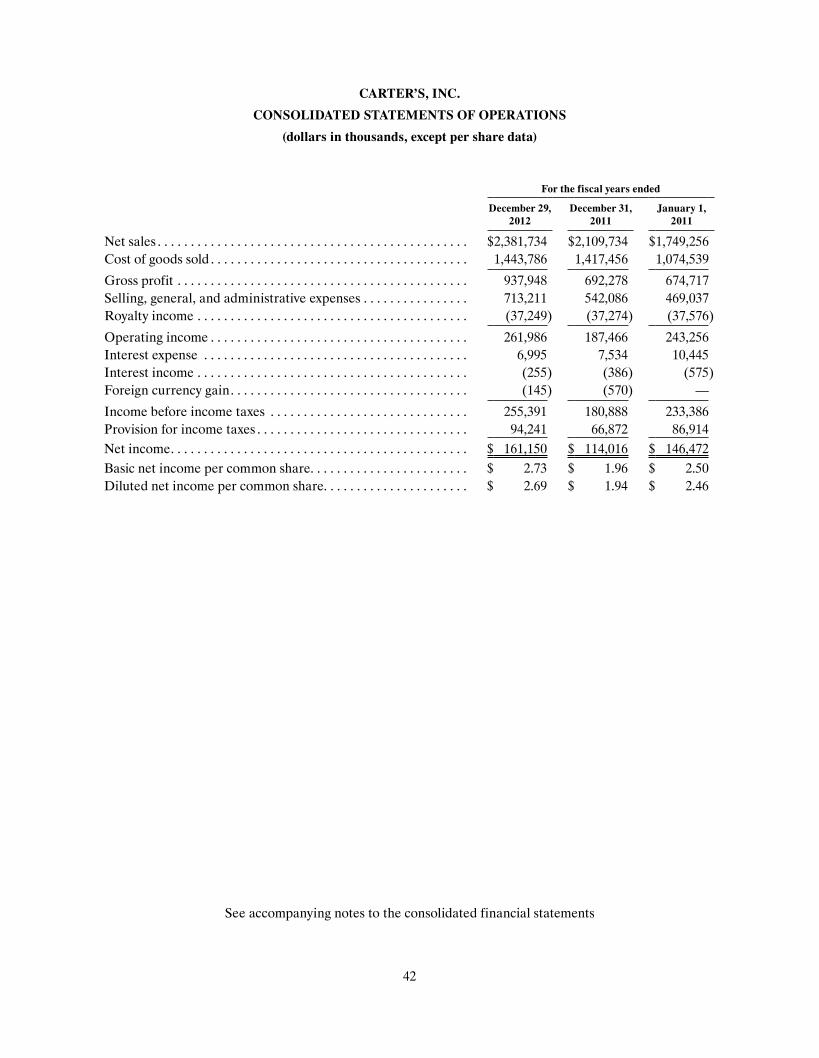
42
See accompanying notes to the consolidated financial statements
CARTER’S, INC.
CONSOLIDATED STATEMENTS OF OPERATIONS
(dollars in thousands, except per share data)
For the fiscal years ended
December 29,
2012 December 31,
2011 January 1,
2011
Net sales . . . . . . . . . . . . . . . . . . . . . . . . . . . . . . . . . . . . . . . . . . . . . . . $2,381,734 $2,109,734 $1,749,256Cost of goods sold . . . . . . . . . . . . . . . . . . . . . . . . . . . . . . . . . . . . . . . 1,443,786 1,417,456 1,074,539
Gross profit . . . . . . . . . . . . . . . . . . . . . . . . . . . . . . . . . . . . . . . . . . . . 937,948 692,278 674,717Selling, general, and administrative expenses . . . . . . . . . . . . . . . . 713,211 542,086 469,037Royalty income . . . . . . . . . . . . . . . . . . . . . . . . . . . . . . . . . . . . . . . . . (37,249) (37,274) (37,576)
Operating income . . . . . . . . . . . . . . . . . . . . . . . . . . . . . . . . . . . . . . . 261,986 187,466 243,256Interest expense . . . . . . . . . . . . . . . . . . . . . . . . . . . . . . . . . . . . . . . . 6,995 7,534 10,445Interest income . . . . . . . . . . . . . . . . . . . . . . . . . . . . . . . . . . . . . . . . . (255) (386) (575)Foreign currency gain . . . . . . . . . . . . . . . . . . . . . . . . . . . . . . . . . . . . (145) (570) —
Income before income taxes . . . . . . . . . . . . . . . . . . . . . . . . . . . . . . 255,391 180,888 233,386Provision for income taxes . . . . . . . . . . . . . . . . . . . . . . . . . . . . . . . . 94,241 66,872 86,914Net income . . . . . . . . . . . . . . . . . . . . . . . . . . . . . . . . . . . . . . . . . . . . . $ 161,150 $ 114,016 $ 146,472Basic net income per common share. . . . . . . . . . . . . . . . . . . . . . . . $ 2.73 $ 1.96 $ 2.50Diluted net income per common share. . . . . . . . . . . . . . . . . . . . . . $ 2.69 $ 1.94 $ 2.46

43
Form 10-K
See accompanying notes to the consolidated financial statements
CARTER’S, INC.
CONSOLIDATED STATEMENTS OF COMPREHENSIVE INCOME
(dollars in thousands)
For the fiscal years ended
December 29,
2012December 31,
2011 January 1,
2011
Net income . . . . . . . . . . . . . . . . . . . . . . . . . . . . . . . . . . . . . . . . . . . . . . . . $161,150 $114,016 $146,472Other comprehensive income (loss):
Unrealized (loss) gain on OshKosh defined benefit plan, net of tax of $690, $3,660 and ($620), for the fiscal years 2012, 2011, and 2010, respectively . . . . . . . . . . . . . . . . . . . . . . . (1,163) (6,206) 1,137
Unrealized gain (loss) on Carter’s post-retirement benefit obligation, net of tax of ($107), $36, and ($100), for fiscal years 2012, 2011, and 2010, respectively . . . . . . . . . . . . . . . . . . 182 (62) 185
Realized gain on interest rate swap, net of tax of $97 . . . . . . . . . . — — 166Unrealized gain on interest rate swap, net of tax of $378 . . . . . . . — — 688Foreign currency translation adjustments. . . . . . . . . . . . . . . . . . . . 1,058 (3,124) —
Total other comprehensive income (loss) . . . . . . . . . . . . . . . . . . . . 77 (9,392) 2,176
Comprehensive income . . . . . . . . . . . . . . . . . . . . . . . . . . . . . . . . . . . . . $161,227 $104,624 $148,648

44
See accompanying notes to the consolidated financial statements
CARTER’S, INC.
CONSOLIDATED STATEMENTS OF CASH FLOWS
(dollars in thousands)
For the fiscal years ended
December 29,
2012December 31,
2011January 1,
2011
Cash flows from operating activities: Net income . . . . . . . . . . . . . . . . . . . . . . . . . . . . . . . . . . . . . . . . . . . . . . . . . . . . . . $161,150 $ 114,016 $ 146,472Adjustments to reconcile net income to net cash provided by
operating activities: Depreciation and amortization . . . . . . . . . . . . . . . . . . . . . . . . . . . . . . . . . . 39,473 32,548 31,727Amortization of Bonnie Togs inventory step-up . . . . . . . . . . . . . . . . . . . . — 6,672 —Non-cash revaluation of contingent consideration . . . . . . . . . . . . . . . . . . 3,589 2,484 —Amortization of Bonnie Togs tradename and non-compete
agreements. . . . . . . . . . . . . . . . . . . . . . . . . . . . . . . . . . . . . . . . . . . . . . . . 375 187 —Amortization of debt issuance costs . . . . . . . . . . . . . . . . . . . . . . . . . . . . . . 877 708 2,616Non-cash stock-based compensation expense . . . . . . . . . . . . . . . . . . . . . . 13,049 9,644 7,303Income tax benefit from stock-based compensation. . . . . . . . . . . . . . . . . (2,760) (6,900) (9,249)Loss (gain) on disposal of property, plant, and equipment . . . . . . . . . . . 802 139 (118)Deferred income taxes . . . . . . . . . . . . . . . . . . . . . . . . . . . . . . . . . . . . . . . . . (9,651) 9,128 4,370Effect of changes in operating assets and liabilities:
Accounts receivable . . . . . . . . . . . . . . . . . . . . . . . . . . . . . . . . . . . . . . . . (10,200) (33,222) (39,359)Inventories . . . . . . . . . . . . . . . . . . . . . . . . . . . . . . . . . . . . . . . . . . . . . . . . (1,790) (20,571) (84,509)Prepaid expenses and other assets . . . . . . . . . . . . . . . . . . . . . . . . . . . . (6,004) (948) (6,269)Accounts payable and other liabilities . . . . . . . . . . . . . . . . . . . . . . . . . 89,709 (32,811) 32,837
Net cash provided by operating activities . . . . . . . . . . . . . . . . . . . 278,619 81,074 85,821Cash flows from investing activities:
Capital expenditures . . . . . . . . . . . . . . . . . . . . . . . . . . . . . . . . . . . . . . . . . . . . . . (83,398) (45,495) (39,782)Acquisition of Bonnie Togs, net of cash acquired . . . . . . . . . . . . . . . . . . . . . . — (61,207) —Proceeds from sale of property, plant, and equipment . . . . . . . . . . . . . . . . . . 6 10 286
Net cash used in investing activities . . . . . . . . . . . . . . . . . . . . . . . . (83,392) (106,692) (39,496)Cash flows from financing activities:
Payments on term loan . . . . . . . . . . . . . . . . . . . . . . . . . . . . . . . . . . . . . . . . . . . . — — (334,523)Borrowings under revolving credit facility . . . . . . . . . . . . . . . . . . . . . . . . . . . . 2,500 — 236,000Payments on revolving credit facility. . . . . . . . . . . . . . . . . . . . . . . . . . . . . . . . . (52,500) — —Payment of debt issuance costs . . . . . . . . . . . . . . . . . . . . . . . . . . . . . . . . . . . . . (1,916) — (3,479)Repurchase of common stock . . . . . . . . . . . . . . . . . . . . . . . . . . . . . . . . . . . . . . — — (50,000)Income tax benefit from stock-based compensation . . . . . . . . . . . . . . . . . . . . 2,760 6,900 9,249Withholdings from vesting of restricted stock . . . . . . . . . . . . . . . . . . . . . . . . . (2,846) (2,181) (927)Proceeds from exercise of stock options. . . . . . . . . . . . . . . . . . . . . . . . . . . . . . 5,685 6,786 9,696
Net cash (used in) provided by financing activities . . . . . . . . . . . (46,317) 11,505 (133,984)
Effect of exchange rate changes on cash. . . . . . . . . . . . . . . . . . . . . . . . . . . . . . . . . (168) 225 —
Net increase (decrease) in cash and cash equivalents . . . . . . . . . . . . . . . . . . . . . . 148,742 (13,888) (87,659)Cash and cash equivalents, beginning of period . . . . . . . . . . . . . . . . . . . . . . . . . . 233,494 247,382 335,041Cash and cash equivalents, end of period . . . . . . . . . . . . . . . . . . . . . . . . . . . . . . . . $382,236 $ 233,494 $ 247,382

45
Form 10-K
See accompanying notes to the consolidated financial statements
CARTER’S, INC.
CONSOLIDATED STATEMENTS OF CHANGES IN STOCKHOLDERS’ EQUITY
(dollars in thousands)
Commonstock - shares
Commonstock - $
Additionalpaid-incapital
Accumulated other comprehensive(loss) income
Retainedearnings
Totalstockholders’
equity
Balance at January 2, 2010 . . . . . . . . . . . 58,081,822 $581 $235,330 $ (4,066) $324,179 $556,024Income tax benefit from stock-based
compensation . . . . . . . . . . . . . . . . . . . — — 9,249 — — 9,249Exercise of stock options . . . . . . . . . . . . . 1,326,099 13 9,683 — — 9,696Withholdings from vesting of restricted
stock . . . . . . . . . . . . . . . . . . . . . . . . . . (31,004) — (927) — — (927)Restricted stock activity. . . . . . . . . . . . . . 149,333 1 (1) — — —Stock-based compensation expense . . . . — — 6,396 — — 6,396Issuance of common stock . . . . . . . . . . . . 26,147 — 850 — — 850Repurchases of common stock . . . . . . . . (2,058,830) (20) (49,980) — — (50,000)Comprehensive income . . . . . . . . . . . . . . — — — 2,176 146,472 148,648
Balance at January 1, 2011 . . . . . . . . . . . 57,493,567 $575 $210,600 $ (1,890) $470,651 $679,936
Income tax benefit from stock-based compensation . . . . . . . . . . . . . . . . . . . — — 6,900 — — 6,900
Exercise of stock options . . . . . . . . . . . . . 821,336 8 6,778 — — 6,786Withholdings from vesting of restricted
stock . . . . . . . . . . . . . . . . . . . . . . . . . . (70,827) (1) (2,180) — — (2,181)Restricted stock activity. . . . . . . . . . . . . . 312,825 4 (4) — — —Stock-based compensation expense . . . . — — 8,474 — — 8,474Issuance of common stock . . . . . . . . . . . . 38,520 — 1,170 — — 1,170Comprehensive (loss) income . . . . . . . . . — — — (9,392) 114,016 104,624
Balance at December 31, 2011 . . . . . . . . 58,595,421 $586 $231,738 $(11,282) $584,667 $805,709
Income tax benefit from stock-based compensation . . . . . . . . . . . . . . . . . . . — — 2,760 — — 2,760
Exercise of stock options . . . . . . . . . . . . . 254,567 3 5,682 — — 5,685Withholdings from vesting of restricted
stock . . . . . . . . . . . . . . . . . . . . . . . . . . (61,536) (1) (2,845) — — (2,846)Restricted stock activity. . . . . . . . . . . . . . 316,479 3 (3) — — —Stock-based compensation expense . . . . — — 11,864 — — 11,864Issuance of common stock . . . . . . . . . . . . 21,708 — 1,080 — — 1,080Comprehensive income . . . . . . . . . . . . . . — — — 77 161,150 161,227
Balance at December 29, 2012 . . . . . . . . 59,126,639 $591 $250,276 $(11,205) $745,817 $985,479

46
CARTER’S, INC.
NOTES TO CONSOLIDATED FINANCIAL STATEMENTS
NOTE 1—THE COMPANY
Carter’s, Inc. and its wholly owned subsidiaries (collectively, the “Company,” and “its”) design, source, and market branded childrenswear under the Carter’s, Child of Mine, Just One You, Precious Firsts, OshKosh, and other brands. The Company’s products are sourced through contractual arrangements with manufacturers worldwide for wholesale distribution to major domestic and international retailers and for its 413 Carter’s, 168 OshKosh, and 82 international retail stores that market its brand name merchandise and other licensed products manufactured by other companies.
On June 30, 2011, the Company purchased Bonnie Togs (the “Acquisition”), a Canadian specialty retailer focused exclusively on the children’s apparel and accessories marketplace. Bonnie Togs sells products under the Carter’s and OshKosh brands, as well as other brands. Prior to the Acquisition, Bonnie Togs was a significant international licensee of the Company. The Company’s audited consolidated financial statements include Bonnie Togs, effective the date of the Acquisition.
NOTE 2—SUMMARY OF SIGNIFICANT ACCOUNTING POLICIES
PRINCIPLES OF CONSOLIDATION
The accompanying audited consolidated financial statements include the accounts of Carter’s, Inc. and its wholly owned subsidiaries. All intercompany transactions and balances have been eliminated in consolidation.
RECLASSIFICATIONS
Certain prior year amounts have been reclassified for comparative purposes.
FISCAL YEAR
The Company’s fiscal year ends on the Saturday, in December or January, nearest the last day of December, resulting in an additional week of results every five or six years. The accompanying audited consolidated financial statements reflect the Company’s financial position as of December 29, 2012 and December 31, 2011 and results of operations for the fiscal years ended December 29, 2012 (also referred to as fiscal 2012), December 31, 2011 (fiscal 2011), and January 1, 2011 (fiscal 2010), each of which comprised 52 weeks.
USE OF ESTIMATES IN THE PREPARATION OF THE CONSOLIDATED FINANCIAL STATEMENTS
The preparation of these consolidated financial statements in conformity with accounting principles generally accepted in the United States of America (“GAAP”) requires management to make estimates and assumptions that affect the reported amounts of assets and liabilities and disclosures of contingent assets and liabilities, at the date of the financial statements, and the reported amounts of revenues and expenses during the reporting period. Actual results could differ from those estimates.
FOREIGN CURRENCY TRANSLATION AND TRANSACTIONS
Translation adjustments
The functional currency of substantially all of the Company’s foreign operations is the local currency. Assets and liabilities are translated into U.S. dollars using the current exchange rates in effect at the balance sheet date, while revenues and expenses are translated at the average exchange rates for the

47
Form 10-K
CARTER’S, INC.
NOTES TO CONSOLIDATED FINANCIAL STATEMENTS
period. The resulting translation adjustments are recorded as a component of accumulated other comprehensive income (loss) within the accompanying audited consolidated balance sheet, as a component of stockholders’ equity.
Transaction adjustments
The Company also recognizes gains and losses on transactions that are denominated in a currency other than the respective entity’s functional currency. Foreign currency transaction gains and losses include the mark-to-market adjustment related to open foreign currency exchange contracts, amounts realized on the settlement of foreign currency exchange contracts, and intercompany loans with foreign subsidiaries that are of a short-term investment nature. Foreign currency transaction gains and losses are recognized in earnings and separately disclosed in the audited consolidated statements of operations.
CASH AND CASH EQUIVALENTS
The Company considers all highly liquid investments that have original maturities of three months or less to be cash equivalents. Cash and cash equivalents consists of deposit accounts, U.S. Treasury securities, and cash management funds invested in U.S. government instruments. These investments are stated at cost, which approximates fair value.
ACCOUNTS RECEIVABLE
The components of accounts receivable, net, as of December 29, 2012 and December 31, 2011 are as follows:
(dollars in thousands)December 29,
2012 December 31,
2011
Trade receivables. . . . . . . . . . . . . . . . . . . . . . . . . . . . . . . . . $159,586 $143,090Royalties receivable . . . . . . . . . . . . . . . . . . . . . . . . . . . . . . 11,020 9,224Tenant allowances and other receivables . . . . . . . . . . . . . 5,028 10,460Total gross receivables . . . . . . . . . . . . . . . . . . . . . . . . . . . . 175,634 162,774
Less:Allowance for doubtful accounts . . . . . . . . . . . . . . . . . . . (7,188) (4,620)Sales returns reserve . . . . . . . . . . . . . . . . . . . . . . . . . . . . . . (400) (400)
Total reserves . . . . . . . . . . . . . . . . . . . . . . . . . . . . . . . . . . . . (7,588) (5,020)
Accounts receivable, net . . . . . . . . . . . . . . . . . . . . . . . . . . . $168,046 $157,754
Concentration of credit risk
In both fiscal 2012 and 2011, no one customer accounted for 10% or more of the Company’s consolidated net sales. In fiscal 2010, one customer accounted for approximately 10% of the Company’s consolidated net sales.
Approximately 78.2% of the Company’s gross accounts receivable at December 29, 2012 and 79.9% at December 31, 2011 were from its ten largest wholesale customers. Of these customers, four had individual receivable balances in excess of 10% of gross accounts receivable (but not more than 13.6%) at December 29, 2012. Sales to these customers represent 53.0% and 51.3% of total wholesale net sales for fiscal 2012 and fiscal 2011, respectively. At December 31, 2011, three customers had individual receivable balances in excess of 10% of gross accounts receivable (but not more than 19.0%).
NOTE 2—SUMMARY OF SIGNIFICANT ACCOUNTING POLICIES (Continued)

48
CARTER’S, INC.
NOTES TO CONSOLIDATED FINANCIAL STATEMENTS
Allowance for doubtful accounts
The Company maintains an allowance for doubtful accounts for estimated losses resulting from the inability of its customers to make payments and other actual and estimated deductions. If the financial condition of a customer were to deteriorate, resulting in an impairment of its ability to make payments, an additional allowance could be required. Past due balances over 90 days are reviewed individually for collectibility. The Company’s credit and collections department reviews all other balances regularly. Account balances are charged off against the allowance when it is probable that the receivable will not be recovered. The Company also records reserves for potential returns based on historical experience.
INVENTORIES
Inventories, which consist primarily of finished goods, are stated at the lower of cost (first-in, first-out basis for wholesale inventory and average cost for retail inventories) or market. The Company provides reserves for slow-moving inventory equal to the difference between the cost of inventory and the estimated market value based upon assumptions about future demand and market conditions. The Company also adjusts its inventory to reflect estimated shrinkage based on historical trends.
PROPERTY, PLANT, AND EQUIPMENT
Property, plant, and equipment are stated at cost, less accumulated depreciation and amortization. When fixed assets are sold or otherwise disposed of, the accounts are relieved of the original cost of the assets, and the related accumulated depreciation or amortization and any resulting profit or loss is credited or charged to income. For financial reporting purposes, depreciation and amortization are computed on the straight-line method over the estimated useful lives of the assets as follows: buildings from 15 to 26 years and retail store fixtures, equipment, and computers from 3 to 10 years. Leasehold improvements and fixed assets purchased under capital leases, if any, are amortized over the lesser of the asset life or related lease term. The Company capitalizes the cost of its fixtures designed and purchased for use at major wholesale accounts. The cost of these fixtures is amortized over 3 years.
VALUATION OF GOODWILL AND OTHER INTANGIBLE ASSETS
The Company’s goodwill balance is comprised of amounts related to the acquisition of Carter’s, Inc., and Bonnie Togs. The goodwill balances have indefinite useful lives and are not deductible for tax purposes. The Company’s other intangible assets are comprised of tradenames and non-compete agreements. The tradenames are related to Carter’s, OshKosh, and Bonnie Togs. The Carter’s and OshKosh tradenames have indefinite useful lives and the Bonnie Togs tradename has a definite life and is being amortized over two years. The Bonnie Togs non-compete agreements for certain executives are being amortized over four years.
Annual impairment reviews
The carrying values of the goodwill and indefinite-lived tradename assets are subject to annual impairment reviews which are performed as of the last day of each fiscal year. Additionally, a review for potential impairment is performed whenever significant events or changes in circumstances indicate that the carrying value of the assets may not be recoverable. Significant assumptions in the impairment models include estimates of future cash flows, discount rates, and, in the case of tradenames, royalty rates. Based upon the Company’s most recent assessment, performed as of December 29, 2012, there was no impairment in the value of goodwill or indefinite-lived tradename assets.
NOTE 2—SUMMARY OF SIGNIFICANT ACCOUNTING POLICIES (Continued)

49
Form 10-K
CARTER’S, INC.
NOTES TO CONSOLIDATED FINANCIAL STATEMENTS
Goodwill
The Company performs impairment tests of its goodwill at the reporting unit level. The Company may utilize a qualitative assessment to determine if it is “more likely than not” that the fair value of the reporting unit is less than its carrying value. If so, the two-step goodwill impairment test is required to be performed. If not, no further testing is required and the Company documents the relevant qualitative factors that support the strength in its fair value. Qualitative factors may include, but are not limited to: macroeconomic conditions, industry and market considerations, cost factors that may have a negative effect on earnings, overall financial performance, and other relevant entity-specific events.
The first step of a quantitative assessment, where one is deemed necessary, is to compare the fair value of the reporting unit to its carrying value, including goodwill. The Company uses a discounted cash flow model to determine the fair value, using assumptions consistent with those of hypothetical marketplace participants. If the fair value of a reporting unit is less than its carrying value, the second step of the impairment test must be performed. The second step compares the implied fair value of the reporting unit goodwill with the carrying value of that goodwill, in order to determine the amount of the impairment loss and charge to the consolidated statement of operations.
Indefinite-lived tradenames
For indefinite-lived tradenames, the Company may utilize a qualitative assessment, as described above, to determine whether the fair value of an indefinite-lived asset is less than its carrying value. If a quantitative assessment is necessary, the Company determines fair value using a discounted cash flow model that uses the relief from royalty method. If the carrying amount exceeds the fair value, an impairment charge is recognized in the amount of the excess.
The Company’s goodwill and other intangible assets were as follows:
Weighted- average
useful life
December 29, 2012 December 31, 2011
(dollars in thousands)Gross
amountAccumulated amortization
Net amount
Gross amount
Accumulated amortization
Net amount
Carter’s goodwill (1) . . . . . . . . . . Indefinite $136,570 $ — $136,570 $136,570 $ — $136,570Bonnie Togs goodwill (2) . . . . . . Indefinite $ 53,179 $ — $ 53,179 $ 52,109 $ — $ 52,109Carter’s tradename . . . . . . . . . . . Indefinite $220,233 $ — $220,233 $220,233 $ — $220,233OshKosh tradename . . . . . . . . . . Indefinite $ 85,500 $ — $ 85,500 $ 85,500 $ — $ 85,500Bonnie Togs tradename (2) . . . . . 2 years $ 604 $453 $ 151 $ 592 $150 $ 442Non-compete agreements (2). . . 4 years $ 301 $113 $ 188 $ 295 $ 37 $ 258
(1) $45.9 million of which relates to the Carter’s wholesale segment, $82.0 million of which relates to the Carter’s retail segment, and $8.6 million of which relates to the international segment.
(2) Relates to the international segment. The change in the gross amount of goodwill and other intangible assets reflect foreign currency translation adjustments for the applicable periods.
Amortization expense for intangible assets subject to amortization was approximately $0.4 million, $0.2 million, and $1.8 million for the fiscal years ended December 29, 2012, December 31, 2011, and January 1, 2011, respectively. Future intangible asset amortization per year is not significant.
NOTE 2—SUMMARY OF SIGNIFICANT ACCOUNTING POLICIES (Continued)
50
CARTER’S, INC.
NOTES TO CONSOLIDATED FINANCIAL STATEMENTS
IMPAIRMENT OF OTHER LONG-LIVED ASSETS
The Company reviews other long-lived assets, including property, plant, and equipment, and licensing agreements, for impairment whenever events or changes in circumstances indicate that the carrying amount of such an asset may not be recoverable. Management will determine whether there has been a permanent impairment on such assets held for use in the business by comparing anticipated undiscounted future cash flows from the use and eventual disposition of the asset or asset group to the carrying value of the asset. The amount of any resulting impairment will be calculated by comparing the carrying value to fair value, which may be estimated using the present value of the same cash flows. Long-lived assets that meet the definition of held for sale will be valued at the lower of carrying amount or fair value.
DEFERRED DEBT ISSUANCE COSTS
Debt issuance costs associated with the Company’s revolving credit facility are deferred and amortized to interest expense using the straight-line method over the term of the related debt. The straight-line method approximates the effective interest method.
FAIR VALUE MEASUREMENTS
The fair value framework requires the Company to categorize certain assets and liabilities into three levels, based upon the assumptions used to price those assets or liabilities. The three levels are defined as follows:
Level 1: Quoted prices in active markets for identical assets or liabilities.
Level 2: Quoted prices for similar assets and liabilities in active markets or inputs that are observable.
Level 3: Unobservable inputs reflecting management’s own assumptions about the inputs used in pricing the asset or liability.
The Company measures its contingent consideration liability, pension assets, foreign exchange forward contracts, and deferred compensation plan investment assets at fair value, as disclosed in the accompanying notes to the consolidated financial statements. The Company’s cash and cash equivalents, accounts receivable, and accounts payable are short-term in nature. As such, their carrying value approximates fair value. Additionally, the fair value of the Company’s outstanding borrowings under the revolving credit facility approximated carrying value and would have been disclosed as a Level 2 liability in the fair value hierarchy had it been measured at fair value.
DERIVATIVE INSTRUMENTS
The Company is exposed to market risk resulting from changes in foreign currency rates and interest rates, and as a result, enters into derivative instruments for risk management purposes or to satisfy requirements under previous contractual arrangements. The Company does not use derivative instruments for trading or other speculative purposes.
The Company’s derivative instruments are recorded on the balance sheet at fair value. The accounting for changes in the fair value of a derivative instrument is dependent upon whether the derivative has been designated and qualifies as part of a hedging relationship and further, on what type of hedging relationship. The Company’s foreign exchange contracts are not accounted for as hedges and therefore, any changes in the fair value of these contracts are recorded in foreign currency gain (loss) in the consolidated statements of operations. The Company’s prior senior credit facility required at least 25% of the variable rate debt under the facility to be hedged. As a result, the Company entered into interest rate swap
NOTE 2—SUMMARY OF SIGNIFICANT ACCOUNTING POLICIES (Continued)

51
Form 10-K
CARTER’S, INC.
NOTES TO CONSOLIDATED FINANCIAL STATEMENTS
agreements to hedge the risk of interest rate fluctuations. These swaps were designated as cash flow hedges and changes in the fair value of the interest rate swap agreements were recognized in accumulated other comprehensive (loss) income.
REVENUE RECOGNITION
Revenues consist of sales to customers, net of returns, accommodations, allowances, deductions, and cooperative advertising. The Company considers revenue realized or realizable and earned when the product has been shipped, when title passes, when all risks and rewards of ownership have transferred, the sales price is fixed or determinable, and collectibility is reasonably assured. In certain cases, in which the Company retains the risk of loss during shipment, revenue recognition does not occur until the goods have reached the specified customer.
In the normal course of business, the Company grants certain accommodations and allowances to its wholesale customers in order to assist these customers with inventory clearance and promotions. Such amounts are reflected as a reduction of net sales and are recorded based on agreements with customers, historical trends, and annual forecasts.
The Company records its cooperative advertising arrangements with certain of its major wholesale customers at fair value. Fair value is determined based upon, among other factors, comparable market analysis for similar advertisements. The Company has included the fair value of these arrangements of approximately $4.6 million, $3.6 million, and $4.0 million for fiscal 2012, 2011, and 2010, respectively, as a component of selling, general, and administrative expenses on the accompanying audited consolidated statements of operations, rather than as a reduction of revenue. Amounts determined to be in excess of the fair value of these arrangements are recorded as a reduction of net sales.
Retail store revenues are recognized at the point of sale. The Company reduces revenue for estimated customer returns and deductions.
ACCOUNTING FOR SHIPPING AND HANDLING FEES AND COSTS
Shipping and handling costs include related labor costs, third-party shipping costs, shipping supplies, and certain distribution overhead. Such costs are absorbed by the Company and are included in selling, general, and administrative expenses. These costs amounted to approximately $53.0 million, $45.2 million, and $33.3 million for fiscal 2012, 2011, and 2010, respectively.
With respect to the freight component of the Company’s shipping and handling costs, certain customers arrange for shipping and pay the related freight costs directly to third parties. However, in the event that the Company arranges and pays the freight for these customers and bills them for this service, such amounts billed are included in revenue and the related cost is charged to cost of goods sold. In addition, shipping and handling costs billed to the Company’s eCommerce customers are included in revenue and the related cost is charged to cost of goods sold. The Company billed customers approximately $9.3 million, $5.3 million, and $1.5 million for fiscal years 2012, 2011, and 2010, respectively.
ROYALTIES AND LICENSE FEES
The Company licenses the Carter’s, Just One You, Precious Firsts, Child of Mine, OshKosh B’gosh, OshKosh, and Genuine Kids from OshKosh trademarks to other companies for use on baby and young children’s products, including bedding, outerwear, sleepwear, shoes, underwear, socks, room décor, toys, stationery, hair accessories, furniture, gear, and related products. These royalties are recorded as earned, based upon the sales of licensed products by licensees and reported as royalty income in the statements of operations.
NOTE 2—SUMMARY OF SIGNIFICANT ACCOUNTING POLICIES (Continued)

52
CARTER’S, INC.
NOTES TO CONSOLIDATED FINANCIAL STATEMENTS
STOCK-BASED COMPENSATION ARRANGEMENTS
The Company recognizes the cost resulting from all stock-based payment transactions in the financial statements at grant date fair value. Stock-based compensation expense is recognized over the requisite service period, net of estimated forfeitures.
Stock options
The Company determines the fair value of stock options using the Black-Scholes option pricing model, which requires the use of the following subjective assumptions:
Volatility—This is a measure of the amount by which a stock price has fluctuated or is expected to fluctuate. The Company uses actual monthly historical changes in the market value of its stock covering the expected life of options being valued. An increase in the expected volatility will increase stock-based compensation expense.
Risk-free interest rate—This is the U.S. Treasury rate as of the grant date having a term equal to the expected term of the stock option. An increase in the risk-free interest rate will increase stock-based compensation expense.
Expected term—This is the period of time over which the stock options granted are expected to remain outstanding and is based on historical experience and estimated future exercise behavior. Separate groups of employees that have similar historical exercise behavior are considered separately for valuation purposes. An increase in the expected term will increase stock-based compensation expense.
Dividend yield—The Company does not have plans to pay dividends in the foreseeable future. An increase in the dividend yield will decrease stock-based compensation expense.
Forfeitures—The Company estimates forfeitures of stock-based awards based on historical experience and expected future activity.
Changes in these subjective assumptions can materially affect the estimate of fair value of stock-based compensation expense and the related amount recognized in the audited consolidated statements of operations.
Time-based restricted stock awards
The fair value of time-based restricted stock awards is determined based on the quoted closing price of the Company’s common stock on the date of grant and is recognized as compensation expense over the vesting term of the awards, net of estimated forfeitures.
Performance-based restricted stock awards
The Company accounts for its performance-based restricted stock awards based on the quoted closing price of the Company’s common stock on the date of grant and records stock-based compensation expense over the vesting term of the awards based on the probability that the performance criteria will be achieved. The Company reassesses the probability of vesting at each reporting period and adjusts stock-based compensation expense based on its probability assessment.
NOTE 2—SUMMARY OF SIGNIFICANT ACCOUNTING POLICIES (Continued)

53
Form 10-K
CARTER’S, INC.
NOTES TO CONSOLIDATED FINANCIAL STATEMENTS
Stock awards
The fair value of stock granted to non-management board members is determined based on the quoted closing price of the Company’s common stock on the date of grant. The Company records the stock-based compensation expense over a one year period.
INCOME TAXES
The accompanying audited consolidated financial statements reflect current and deferred tax provisions. The deferred tax provision is determined under the liability method. Deferred tax assets and liabilities are recognized based on differences between the book and tax bases of assets and liabilities using presently enacted tax rates. Valuation allowances are established when it is “more likely than not” that a deferred tax asset will not be recovered. The provision for income taxes is the sum of the amount of income taxes paid or payable for the year as determined by applying the provisions of enacted tax laws to the taxable income for that year, the net change during the year in deferred tax assets and liabilities, and the net change during the year in any valuation allowances.
The Company assesses its income tax positions and records tax benefits for all years subject to examination based upon management’s evaluation of the facts, circumstances, and information available at the reporting dates. The Company determines whether it is “more likely than not” that a tax position will be sustained upon examination by the appropriate taxing authorities before any part of the benefit can be recorded in the financial statements. For those tax positions where it is not “more likely than not” that a tax benefit will be sustained, no tax benefit is recognized. Where applicable, associated interest and penalties are also recorded. Interest and penalties, if any, are recorded within the provision for incomes taxes in the consolidated statements of operations and are classified on the consolidated balance sheets with the related liability for uncertain tax contingency liabilities.
SUPPLEMENTAL CASH FLOW INFORMATION
Interest paid in cash approximated $6.0 million, $7.0 million, and $7.8 million for fiscal years 2012, 2011, and 2010, respectively. Income taxes paid in cash approximated $97.4 million, $61.6 million, and $71.7 million for the fiscal years 2012, 2011, and 2010, respectively.
EARNINGS PER SHARE
The Company calculates basic and diluted net income per common share under the two-class method for unvested share-based payment awards that contain non-forfeitable rights to dividends or dividend equivalents (whether paid or unpaid).
Basic net income per share is calculated by dividing net income for the period by the weighted-average common shares outstanding for the period. Diluted net income per share includes the effect of dilutive instruments, such as stock options and restricted stock awards, and uses the average share price for the period in determining the number of shares that are to be added to the weighted-average number of shares outstanding.
EMPLOYEE BENEFIT PLANS
The Company has several defined benefit plans. Various actuarial methods and assumptions are used in determining net pension and post-retirement costs and obligations. Key assumptions include the discount rate used to determine the present value of future benefits and the expected long-term rate of return on plan assets. The over-funded or under-funded status of the defined benefit plans is recorded as an asset or
NOTE 2—SUMMARY OF SIGNIFICANT ACCOUNTING POLICIES (Continued)

54
CARTER’S, INC.
NOTES TO CONSOLIDATED FINANCIAL STATEMENTS
liability on the consolidated balance sheet. The gains or losses that arise during the period are recognized as a component of comprehensive income, net of tax. These costs are then subsequently recognized as components of net periodic benefit cost in the consolidated statements of operations.
FACILITY CLOSURE AND OFFICE CONSOLIDATION
The Company records severance costs when the appropriate notifications have been made to affected employees or when the decision is made, if the benefits are contractual. When employees are required to work for a period before termination, the severance costs are recognized over the required service period. Relocation and recruitment costs are expensed as incurred. Lease termination costs are recognized when the lease has been contractually terminated and, where the premises are retained and sub-leased, an estimate is made of sub-lease income. Useful lives assigned to fixed assets at the facility to be closed are revised based on the specifics of the exit plan.
RENT EXPENSE AND DEFERRED RENT
The Company enters into a significant number of lease transactions related to properties for its retail stores in addition to leases for offices, distribution facilities, and other uses. The lease agreements may contain provisions related to allowances for property improvements, rent escalation, and free rent periods.
For property improvement allowances, the Company records a deferred lease credit on the consolidated balance sheet and amortizes the deferred lease credit as a reduction of rent expense over the terms of the applicable lease. For scheduled rent escalation clauses during the lease term, the Company records rent expense on a straight-line basis over the term of the lease. The difference between the rent expense and the amount payable under the lease is included within the Company’s liabilities on the consolidated balance sheet. The term of the lease over which the Company amortizes allowances and minimum rental expenses on a straight-line basis begins on the date of initial possession, which is generally when the Company enters the space and/or begins construction.
Where leases provide for contingent rents, which are generally determined as a percentage of gross sales, the Company records additional rent expense when management determines that achieving the specified level of revenue during the fiscal year is probable. Amounts accrued for contingent rent are included within the Company’s liabilities on the consolidated balance sheet.
SEASONALITY
The Company experiences seasonal fluctuations in its sales and profitability due to the timing of certain holidays and key retail shopping periods, typically resulting in lower sales and gross profit in the first half of its fiscal year. Accordingly, the Company’s results of operations during the first half of the year may not be indicative of the results for the full year.
RECENT ACCOUNTING PRONOUNCEMENTS
In May 2011, the Financial Accounting Standards Board (“FASB”) issued updated accounting guidance related to fair value measurements and disclosures that result in common fair value measurements and disclosures between GAAP and International Financial Reporting Standards. This guidance includes amendments that clarify the intent about the application of existing fair value measurements and disclosures, while other amendments change a principle or requirement for fair value measurements or disclosures. This guidance was effective for interim and annual periods beginning after December 15, 2011 and the required disclosures are included within the fair value measurements footnote.
NOTE 2—SUMMARY OF SIGNIFICANT ACCOUNTING POLICIES (Continued)

55
Form 10-K
CARTER’S, INC.
NOTES TO CONSOLIDATED FINANCIAL STATEMENTS
In June 2011, the FASB issued guidance to amend the presentation of comprehensive income to allow an entity the option to present the total of comprehensive income, the components of net income, and the components of other comprehensive income either in a single continuous statement of comprehensive income or in two separate but consecutive statements. In both instances, an entity is required to present each component of net income along with total net income, each component of other comprehensive income along with a total for other comprehensive income, and a total amount for comprehensive income. The guidance eliminated the option to present the components of other comprehensive income as part of the statement of changes in stockholders’ equity. These standards were effective for interim and annual periods beginning after December 15, 2011, and were applied retrospectively. In February 2013, the FASB issued guidance finalizing the reporting of amounts reclassified out of accumulated other comprehensive income. The new standard requires either in a single note or parenthetically on the face of the financial statements, the effect of significant amounts reclassified from each component of accumulated other comprehensive income based on its source and the income statement line items affected by the reclassification. The guidance is effective for annual reporting periods and interim periods within those years, beginning after December 15, 2012. Therefore, the guidance is effective for the Company’s first quarter of fiscal 2013 and impacts disclosure requirements only.
In September 2011, the FASB issued new guidance on testing goodwill for impairment. This guidance gives companies the option to perform a qualitative assessment to first assess whether the fair value of a reporting unit is less than its carrying amount. If an entity determines it is not more likely than not that the fair value of the reporting unit is less than its carrying amount, then performing the two-step impairment test is unnecessary. This guidance was effective for fiscal years beginning after December 15, 2011 and applied to certain annual impairment tests performed on December 29, 2012.
In July 2012, the FASB issued new guidance on impairment testing of indefinite-lived intangible assets, other than goodwill. The new guidance gives companies the option to perform a qualitative assessment to first assess whether the fair value of an indefinite-lived intangible asset is less than its carrying value. If the company determines it is not more likely than not that the fair value of the indefinite-lived intangible assets is less than the carrying value, then determining the fair value of the indefinite-lived intangible asset would be unnecessary. This guidance is effective for annual and interim impairment tests performed for fiscal years beginning after September 15, 2012 and early adoption is permitted. The Company has early adopted the guidance for certain annual impairment tests performed on December 29, 2012.
NOTE 3—ACQUISITION OF BONNIE TOGS
On June 30, 2011, the Company purchased all of the outstanding shares of capital stock of Bonnie Togs for total consideration of up to CAD $95 million, of which USD $61.2 million was paid in cash at closing. The sellers may also be paid contingent consideration ranging from zero to CAD $35 million if certain earnings targets for the period beginning July 1, 2011 and ending on June 27, 2015 are met. Sellers may receive a portion of the contingent consideration of up to CAD $25 million if interim earnings targets are met through June 2013 and June 2014, respectively. Any such payments are not recoverable by the Company in the event of any failure to meet overall targets.
NOTE 2—SUMMARY OF SIGNIFICANT ACCOUNTING POLICIES (Continued)
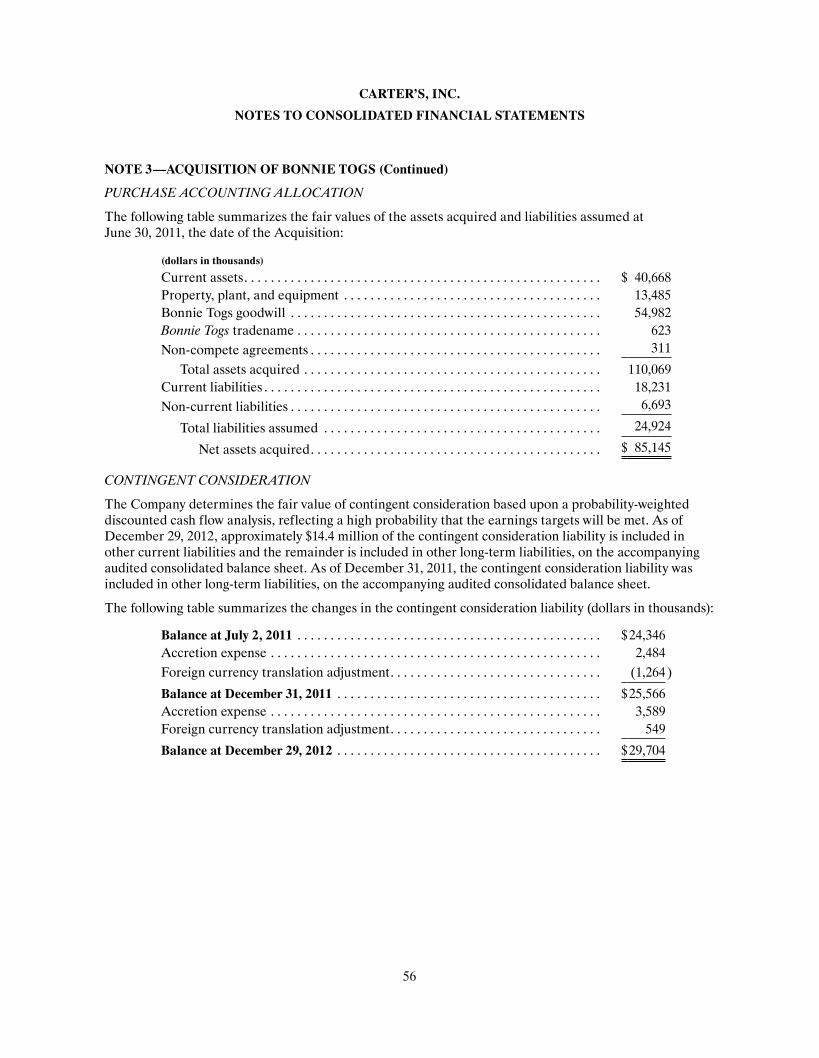
56
CARTER’S, INC.
NOTES TO CONSOLIDATED FINANCIAL STATEMENTS
PURCHASE ACCOUNTING ALLOCATION
The following table summarizes the fair values of the assets acquired and liabilities assumed at June 30, 2011, the date of the Acquisition:
(dollars in thousands)
Current assets. . . . . . . . . . . . . . . . . . . . . . . . . . . . . . . . . . . . . . . . . . . . . . . . . . . . . . $ 40,668Property, plant, and equipment . . . . . . . . . . . . . . . . . . . . . . . . . . . . . . . . . . . . . . . 13,485Bonnie Togs goodwill . . . . . . . . . . . . . . . . . . . . . . . . . . . . . . . . . . . . . . . . . . . . . . . 54,982Bonnie Togs tradename . . . . . . . . . . . . . . . . . . . . . . . . . . . . . . . . . . . . . . . . . . . . . . 623Non-compete agreements . . . . . . . . . . . . . . . . . . . . . . . . . . . . . . . . . . . . . . . . . . . . 311
Total assets acquired . . . . . . . . . . . . . . . . . . . . . . . . . . . . . . . . . . . . . . . . . . . . . 110,069Current liabilities . . . . . . . . . . . . . . . . . . . . . . . . . . . . . . . . . . . . . . . . . . . . . . . . . . . 18,231Non-current liabilities . . . . . . . . . . . . . . . . . . . . . . . . . . . . . . . . . . . . . . . . . . . . . . . 6,693
Total liabilities assumed . . . . . . . . . . . . . . . . . . . . . . . . . . . . . . . . . . . . . . . . . . 24,924
Net assets acquired. . . . . . . . . . . . . . . . . . . . . . . . . . . . . . . . . . . . . . . . . . . . $ 85,145
CONTINGENT CONSIDERATION
The Company determines the fair value of contingent consideration based upon a probability-weighted discounted cash flow analysis, reflecting a high probability that the earnings targets will be met. As of December 29, 2012, approximately $14.4 million of the contingent consideration liability is included in other current liabilities and the remainder is included in other long-term liabilities, on the accompanying audited consolidated balance sheet. As of December 31, 2011, the contingent consideration liability was included in other long-term liabilities, on the accompanying audited consolidated balance sheet.
The following table summarizes the changes in the contingent consideration liability (dollars in thousands):
Balance at July 2, 2011 . . . . . . . . . . . . . . . . . . . . . . . . . . . . . . . . . . . . . . . . . . . . . . $24,346Accretion expense . . . . . . . . . . . . . . . . . . . . . . . . . . . . . . . . . . . . . . . . . . . . . . . . . . 2,484Foreign currency translation adjustment. . . . . . . . . . . . . . . . . . . . . . . . . . . . . . . . (1,264)
Balance at December 31, 2011 . . . . . . . . . . . . . . . . . . . . . . . . . . . . . . . . . . . . . . . . $25,566Accretion expense . . . . . . . . . . . . . . . . . . . . . . . . . . . . . . . . . . . . . . . . . . . . . . . . . . 3,589Foreign currency translation adjustment. . . . . . . . . . . . . . . . . . . . . . . . . . . . . . . . 549
Balance at December 29, 2012 . . . . . . . . . . . . . . . . . . . . . . . . . . . . . . . . . . . . . . . . $29,704
NOTE 3—ACQUISITION OF BONNIE TOGS (Continued)

57
Form 10-K
CARTER’S, INC.
NOTES TO CONSOLIDATED FINANCIAL STATEMENTS
PRO FORMA RESULTS
The following unaudited pro forma summary presents information as if Bonnie Togs had been acquired at the beginning of the periods presented and assumes that there were no other changes in the Company’s operations. The pro forma information does not necessarily reflect the actual results that would have occurred had the Company been combined during the periods presented, nor is it necessarily indicative of the future results of operations of the combined companies.
For the fiscal years ended
(dollars in thousands, except share data)December 31,
2011 January 1,
2011
Pro forma net sales . . . . . . . . . . . . . . . . . . . . . . . . . . . . . . . . . . $2,156,000 $1,840,000Pro forma net income . . . . . . . . . . . . . . . . . . . . . . . . . . . . . . . . $ 121,000 $ 150,000Pro forma basic earnings per share . . . . . . . . . . . . . . . . . . . . . $ 2.09 $ 2.55Pro forma diluted earnings per share . . . . . . . . . . . . . . . . . . . $ 2.07 $ 2.51
Excluded from the pro forma results shown above for the fiscal year ended December 31, 2011, was a pre-tax charge of $6.7 million related to the amortization of the step-up of acquired Bonnie Togs inventory to fair value.
NOTE 4—ACCUMULATED OTHER COMPREHENSIVE (LOSS) INCOME
Accumulated other comprehensive (loss) income is summarized as follows:
(dollars in thousands)
Pension liability
adjustment
Post-retirement liability
adjustment
Cumulative translation adjustment
Derivative hedging
adjustment
Accumulated other comprehensive
income
Balance at January 2, 2010 . . . . . . . . . . $ (4,031) $ 819 $ — $(854) $ (4,066)Current year change . . . . . . . . . . . . . . . 1,137 185 — 854 2,176
Balance at January 1, 2011 . . . . . . . . . . (2,894) 1,004 — — (1,890)Current year change . . . . . . . . . . . . . . . (6,206) (62) (3,124) — (9,392)
Balance at December 31, 2011 . . . . . . . (9,100) 942 (3,124) — (11,282)Current year change . . . . . . . . . . . . . . . (1,163) 182 1,058 — 77
Balance at December 29, 2012 . . . . . . . $ (10,263) $1,124 $(2,066) $ — $ (11,205)
As of December 29, 2012 and December 31, 2011, the cumulative pension liability adjustments are net of tax effect of $6.0 million and $5.3 million, respectively. As of December 29, 2012 and December 31, 2011, the post-retirement liability adjustments are net of tax effect of approximately $0.7 million and $0.6 million, respectively.
NOTE 3—ACQUISITION OF BONNIE TOGS (Continued)

58
CARTER’S, INC.
NOTES TO CONSOLIDATED FINANCIAL STATEMENTS
NOTE 5—PROPERTY, PLANT, AND EQUIPMENT
Property, plant, and equipment, net consists of the following:
(dollars in thousands)December 29,
2012 December 31,
2011
Fixtures, equipment, and computers . . . . . . . . . . . . . . . . . . . . $ 194,073 $ 166,574Land, buildings, and improvements . . . . . . . . . . . . . . . . . . . . . 132,089 96,770Marketing fixtures . . . . . . . . . . . . . . . . . . . . . . . . . . . . . . . . . . . 13,399 15,351Construction in progress . . . . . . . . . . . . . . . . . . . . . . . . . . . . . . 17,806 11,705 357,367 290,400Accumulated depreciation and amortization . . . . . . . . . . . . . (187,257) (168,054)
Total . . . . . . . . . . . . . . . . . . . . . . . . . . . . . . . . . . . . . . . . . . . . $ 170,110 $ 122,346
Depreciation and amortization expense was approximately $39.5 million, $32.5 million, and $30.0 million for the fiscal years ended December 29, 2012, December 31, 2011, and January 1, 2011, respectively.
NOTE 6—LONG-TERM DEBT
REVOLVING CREDIT FACILITY
On October 15, 2010, the Company entered into a $375 million ($130 million sub-limit for letters of credit and a swing line sub-limit of $40 million) revolving credit facility with Bank of America as sole lead arranger and administrative agent, JP Morgan Chase Bank as syndication agent, and other financial institutions. This revolving credit facility was immediately drawn upon to pay off the Company’s former term loan of $232.2 million and pay transaction fees and expenses of $3.8 million, leaving approximately $130 million available under the revolver for future borrowings (net of letters of credit of approximately $8.6 million). In connection with the repayment of the Company’s former term loan, in the fourth quarter of fiscal 2010 the Company wrote off approximately $1.2 million in unamortized debt issuance costs. In addition, in connection with the revolving credit facility, the Company recorded $3.5 million of debt issuance costs to be amortized over the term of the revolving credit facility.
On December 22, 2011, the Company and lenders amended and restated the revolving credit facility to, among other things, provide a U.S. dollar revolving facility of $340 million ($130 million sub-limit for letters of credit and a swing line sub-limit of $40 million) and a $35 million multicurrency revolving facility ($15 million sub-limit for letters of credit and a swing line sub-limit of $5 million), which is available for borrowings by either TWCC or its Canadian subsidiary, in U.S. dollars or Canadian dollars.
On August 31, 2012, the Company and lenders amended and restated the revolving credit facility to, among other things, improve interest rates applicable to pricing, extend the maturity of the facility, and allow borrowings in currencies other than U.S. dollars or Canadian dollars subject to the consent of all multicurrency lenders. The aggregate principal amount of the facility remained unchanged at $375 million consisting of a $340 million U.S. dollar revolving credit facility and a $35 million multicurrency revolving credit facility (although the sub-limit for U.S. dollar letters of credit was increased to $175 million). In connection with the amendment, the Company recorded approximately $1.9 million in debt issuance costs which, together with the existing unamortized debt issuance costs, will be amortized over the new remaining term of the facility (five years). The revolving credit facility expires August 31, 2017.

59
Form 10-K
CARTER’S, INC.
NOTES TO CONSOLIDATED FINANCIAL STATEMENTS
During fiscal 2012, the Company repaid borrowings under its revolving credit facility of $50.0 million. At December 29, 2012, the Company had approximately $186.0 million in revolver borrowings (fair value approximates book value), exclusive of $12.4 million of outstanding letters of credit, at an effective interest rate of 1.71%.
PRICING OPTIONS
The revolving credit facility provides for two pricing options for U.S. dollar facility revolving loans: (i) revolving loans on which interest is payable quarterly at a base rate equal to the highest of (x) the Federal Funds Rate plus ½ of 1%, (y) the rate of interest in effect for such day as publicly announced from time to time by Bank of America, N.A. as its prime rate, or (z) the Eurodollar Rate plus 1%, plus, in each case, an applicable margin initially equal to 0.75%, which may be adjusted based upon a leverage-based pricing grid ranging from 0.50% to 1.25% and (ii) revolving loans on which interest accrues for one, two, three, six or if, generally available, nine or twelve month interest periods (but is payable not less frequently than every three months) at a rate of interest per annum equal to an adjusted British Bankers Association LIBOR rate, plus an applicable margin initially equal to 1.75%, which may be adjusted based upon a leverage-based pricing grid ranging from 1.50% to 2.25%.
The revolving credit facility also provides for two pricing options for multicurrency facility revolving loans denominated in U.S. dollars: (i) revolving loans on which interest is payable quarterly at a base rate equal to the highest of (x) the Federal Funds Rate plus ½ of 1%, (y) the rate of interest in effect for such day as publicly announced from time to time by Bank of America, N.A., Canada Branch in Toronto as its reference rate for loans in U.S. dollars to its Canadian borrowers, or (z) the Eurodollar Rate plus 1%, plus, in each case, an applicable margin initially equal to 0.75%, which may be adjusted based upon a leverage-based pricing grid ranging from 0.50% to 1.25% and (ii) revolving loans on which interest accrues for one, two, three, six or if, generally available, nine or twelve month interest periods (but is payable not less frequently than every three months) at a rate of interest per annum equal to an adjusted British Bankers Association LIBOR rate, plus an applicable margin initially equal to 1.75%, which may be adjusted based upon a leverage-based pricing grid ranging from 1.50% to 2.25%.
In addition, the revolving credit facility provides for two pricing options for multicurrency facility revolving loans denominated in Canadian dollars: (i) revolving loans on which interest is payable quarterly at a base rate equal to the highest of (x) the rate of interest in effect for such day as publicly announced from time to time by Bank of America, N.A., Canada Branch in Toronto as its prime rate for loans in Canadian Dollars to Canadian Borrowers and (y) the rate of interest in effect for such day for Canadian dollar bankers’ acceptances having a term of one month that appears on the Reuters Screen CDOR Page plus ½ of 1%, plus, in each case, an applicable margin initially equal to 0.75%, which may be adjusted based upon a leverage-based pricing grid ranging from 0.50% to 1.25%, and (ii) revolving loans on which interest accrues for one, two, three, six or if, generally available, nine or twelve month interest periods (but is payable not less frequently than every three months) at a rate of interest per annum equal to an adjusted British Bankers Association LIBOR rate, plus an applicable margin initially equal to 1.75%, which may be adjusted based upon a leverage-based pricing grid ranging from 1.50% to 2.25%.
The multicurrency revolving facility also provides for borrowings in currencies other than U.S. dollars or Canadian dollars, subject to certain limitations. For such multicurrency revolving loans, interest accrues for one, two, three, six or if, generally available, nine or twelve month interest periods (but is payable
NOTE 6—LONG-TERM DEBT (Continued)

60
CARTER’S, INC.
NOTES TO CONSOLIDATED FINANCIAL STATEMENTS
not less frequently than every three months) at a rate of interest per annum equal to an adjusted British Bankers Association LIBOR rate, plus an applicable margin initially equal to 1.75%, which may be adjusted based upon a leverage-based pricing grid ranging from 1.50% to 2.25%.
Amounts outstanding under the revolving credit facility currently accrue interest at a LIBOR rate plus 1.50%.
COVENANTS
The revolving credit facility contains and defines financial covenants, including a lease adjusted leverage ratio (defined as, with certain adjustments, the ratio of the Company’s consolidated indebtedness plus six times rent expense to consolidated net income before interest, taxes, depreciation, amortization, and rent expense (“EBITDAR”)) to exceed (x) if such period ends on or before December 31, 2016, 3.75:1.00 and (y) if such period ends after December 31, 2016, 3.50:1.00; and consolidated fixed charge coverage ratio (defined as, with certain adjustments, the ratio of consolidated EBITDAR to consolidated fixed charges (defined as interest plus rent expense)), for any such period to be less than 2.50:1.00. As of December 29, 2012, the Company was in compliance with its financial debt covenants.
Provisions in the Company’s senior credit facility currently restrict the ability of its operating subsidiary, The William Carter Company (“TWCC”), from paying cash dividends to its parent company, Carter’s, Inc., in excess of $15.0 million unless TWCC and its consolidated subsidiaries meet certain leverage ratio and minimum availability requirements under the credit facility, which could materially restrict Carter’s, Inc. from paying cash dividends on its common stock. The Company does not anticipate paying cash dividends on its common stock in the foreseeable future, but intends to retain future earnings, if any, for reinvestment in the future operation and expansion of its business and related development activities. Any future decision to pay cash dividends will be at the discretion of the Company’s Board of Directors and will depend upon the Company’s financial condition, results of operations, terms of financing arrangements, capital requirements, and any other factors as the Board of Directors deems relevant.
NOTE 7—COMMON STOCK
During fiscal 2007, the Company’s Board of Directors approved a share repurchase authorization, pursuant to which the Company is authorized to purchase up to $100 million of its outstanding common shares. During fiscal 2010, the Company’s Board of Directors approved a share repurchase authorization, pursuant to which the Company is authorized to purchase up to an additional $100 million of its outstanding common shares. During fiscal 2010, the Company repurchased and retired 2,058,830 shares, or approximately $50.0 million, of its common stock at an average price of $24.29 per share.
Since inception of the repurchase program and through fiscal 2012, the Company repurchased and retired 6,658,410 shares, or approximately $141.1 million, of its common stock at an average price of $21.19 per share. The total remaining capacity under this authorization was approximately $58.9 million as of December 29, 2012.
Future repurchases may occur from time to time in the open market, in negotiated transactions, or otherwise. The timing and amount of any repurchases will be determined by the Company’s management, based on its evaluation of market conditions, share price, other investment priorities, and other factors.
The provisions in the Company’s revolving credit facility could materially restrict the Company from paying cash dividends on its common stock.
NOTE 6—LONG-TERM DEBT (Continued)

61
Form 10-K
CARTER’S, INC.
NOTES TO CONSOLIDATED FINANCIAL STATEMENTS
NOTE 8—STOCK-BASED COMPENSATION
Under the Company’s Amended and Restated Equity Incentive Plan (the “Plan”), the Compensation Committee of the Board of Directors may award incentive stock options, stock appreciation rights, restricted stock, unrestricted stock, stock deliverable on a deferred basis (including restricted stock units), and performance-based stock awards.
At the Company’s May 13, 2011 shareholders’ meeting, the shareholders approved a proposal to amend the Plan to (i) increase the maximum number of shares of stock available under the existing Plan by 3,725,000 shares from 12,053,392 shares to 15,778,392 shares and (ii) eliminating the Company’s ability to grant cash awards and provide tax gross-ups under the Plan. As of December 29, 2012, there are 3,241,657 shares available for grant under the Plan. The Plan makes provision for the treatment of awards upon termination of service or in the case of a merger or similar corporate transaction. Participation in the Plan is limited to Directors and those key employees selected by the Compensation Committee.
The limit on shares available under the Plan, the individual limits, and other award terms are subject to adjustment to reflect stock splits or stock dividends, combinations, and certain other events. All stock options issued under the Plan expire no later than ten years from the date of grant. The Company believes that the current level of authorized shares is sufficient to satisfy future option exercises.
The Company recorded stock-based compensation cost as follows:
For the fiscal years ended
(dollars in thousands)December 29,
2012December 31,
2011January 1,
2011
Stock options . . . . . . . . . . . . . . . . . . . . . . . . . . . . . . . $ 4,093 $3,546 $2,961Restricted stock:
Time-based awards. . . . . . . . . . . . . . . . . . . . . . . . 5,376 4,624 3,099Performance-based awards . . . . . . . . . . . . . . . . . 2,395 304 335Stock awards . . . . . . . . . . . . . . . . . . . . . . . . . . . . . 1,185 1,170 908
Total. . . . . . . . . . . . . . . . . . . . . . . . . . . . . . . . . . . . . . . $13,049 $9,644 $7,303
All of the cost was reflected as a component of selling, general, and administrative expenses.
STOCK OPTIONS
Stock options vest in equal annual installments over a three- or four-year period. The Company issues new shares to satisfy stock option exercises.

62
CARTER’S, INC.
NOTES TO CONSOLIDATED FINANCIAL STATEMENTS
Changes in the Company’s stock options for the fiscal year ended December 29, 2012 are as follows:
Number of
shares
Weighted- average exercise
price
Weighted- average
remaining contractual terms
(years)
Aggregate intrinsic value (in thousands)
Outstanding, December 31, 2011 . . . . . . . . . . . . . . . 1,992,700 $22.62Granted . . . . . . . . . . . . . . . . . . . . . . . . . . . . . . . . . . . . 364,000 $43.23Exercised. . . . . . . . . . . . . . . . . . . . . . . . . . . . . . . . . . . (254,567) $22.33Forfeited . . . . . . . . . . . . . . . . . . . . . . . . . . . . . . . . . . . (23,700) $32.97Expired . . . . . . . . . . . . . . . . . . . . . . . . . . . . . . . . . . . . — —
Outstanding, December 29, 2012 . . . . . . . . . . . . . . . 2,078,433 $26.14 6.3 $58,401Vested and Expected to Vest,
December 29, 2012 . . . . . . . . . . . . . . . . . . . . . . . . 2,020,036 $25.91 6.3 $57,231Exercisable, December 29, 2012 . . . . . . . . . . . . . . . . 1,141,219 $20.29 4.8 $38,746
The intrinsic value of stock options exercised during the fiscal years ended December 29, 2012, December 31, 2011, and January 1, 2011 was approximately $7.2 million, $18.9 million, and $26.9 million, respectively. At December 29, 2012, there was approximately $8.0 million of unrecognized compensation cost (net of estimated forfeitures) related to stock options which is expected to be recognized over a weighted-average period of approximately 2.5 years.
The table below presents the assumptions used to calculate the fair value of options granted in each of the respective fiscal years:
For the fiscal years ended
December 29,
2012December 31,
2011January 1,
2011
Expected Volatility . . . . . . . . . . . . . . . . . . . . . . . . . . . 34.74% 34.98% 34.57%Risk-free interest rate . . . . . . . . . . . . . . . . . . . . . . . . . 1.37% 2.62% 3.02%Expected term (years) . . . . . . . . . . . . . . . . . . . . . . . . . 5.9 6.7 7.0Dividend yield. . . . . . . . . . . . . . . . . . . . . . . . . . . . . . . . — — —Weighted average fair value of options granted . . . . $15.28 $11.85 $11.80
RESTRICTED STOCK AWARDS
Restricted stock awards issued under the Plan vest based upon continued service or performance targets.
NOTE 8—STOCK-BASED COMPENSATION (Continued)

63
Form 10-K
CARTER’S, INC.
NOTES TO CONSOLIDATED FINANCIAL STATEMENTS
The following table summarizes activity related to all restricted stock awards during the fiscal year ended December 29, 2012:
Restricted stock
awards
Weighted- average
grant-date fair value
Outstanding, December 31, 2011 . . . . . . . . . . . . . . . . . . . . . . . . . . 617,401 $26.63Granted . . . . . . . . . . . . . . . . . . . . . . . . . . . . . . . . . . . . . . . . . . . . . . . 355,708 43.36Vested . . . . . . . . . . . . . . . . . . . . . . . . . . . . . . . . . . . . . . . . . . . . . . . . (194,455) 27.90Forfeited . . . . . . . . . . . . . . . . . . . . . . . . . . . . . . . . . . . . . . . . . . . . . . (11,725) 33.02
Outstanding, December 29, 2012 . . . . . . . . . . . . . . . . . . . . . . . . . . 766,929 $33.97
Time-based restricted stock awards
Restricted stock awards vest in equal annual installments or cliff vest after a three- or four-year period. At December 29, 2012, there was approximately $11.4 million of unrecognized compensation cost (net of estimated forfeitures) related to restricted stock which is expected to be recognized over a weighted-average period of approximately 2.6 years.
Performance-based restricted stock awards
During the fiscal year ended January 3, 2009, the Company granted its Chief Executive Officer 75,000 performance-based restricted shares at a fair market value of $17.92 per share. As of December 31, 2011, the performance targets had been met and 75% of the grant had vested. The grant became fully vested as of December 31, 2012.
During the fiscal year ended December 31, 2011, the Company granted its Chief Executive Officer 80,000 performance-based restricted shares at a fair market value of $28.39 per share. Vesting of these shares is contingent upon meeting specific performance targets through fiscal 2014. Currently, the Company believes that these targets will be achieved and has recorded compensation expense based on the pro ration of the total ultimate expected value of the award.
During the fiscal year ended December 29, 2012, the Company granted its Chief Executive Officer 100,000 performance-based restricted shares at a fair market value of $42.61 per share. In addition, the Company granted its other executive officers a total of 52,000 performance-based restricted shares at a fair market value of $42.61 per share. Vesting of these shares is also contingent upon meeting specific performance targets through 2014. Currently, the Company believes that these targets will be achieved and has recorded compensation expense based on the pro ration of the total ultimate expected value of the award.
At December 29, 2012, there was approximately $6.2 million of unrecognized compensation cost (net of estimated forfeitures) related to performance-based restricted stock awards which is expected to be recognized over a weighted-average period of approximately 2.7 years.
NOTE 8—STOCK-BASED COMPENSATION (Continued)

64
CARTER’S, INC.
NOTES TO CONSOLIDATED FINANCIAL STATEMENTS
Stock awards
During fiscal 2010, 2011, and 2012, the Company issued shares of common stock to its non-management board members, as follows:
Number of
shares issuedFair value per share
Aggregate value (in thousands)
2010 . . . . . . . . . . . . . . . . . . . . . . . . . . . . . . . . . . . . . 24,032 $33.29 $ 8002,115 $23.65 $ 50
26,147 $ 850
2011 . . . . . . . . . . . . . . . . . . . . . . . . . . . . . . . . . . . . . 38,520 $30.38 $1,1702012 . . . . . . . . . . . . . . . . . . . . . . . . . . . . . . . . . . . . 21,708 $49.76 $1,080
The Company received no proceeds from the issuance of these shares.
NOTE 9—EMPLOYEE BENEFIT PLANS
The Company maintains a defined contribution plan, a deferred compensation plan, and three defined benefit plans. The three defined benefit plans include: the OshKosh B’Gosh pension plan, a post-retirement life and medical plan, and a retirement plan for certain former officers and their spouses.
OSHKOSH B’GOSH PENSION PLAN
Funded status
The retirement benefits under the OshKosh B’Gosh pension plan were frozen as of December 31, 2005. A reconciliation of changes in the projected pension benefit obligation and plan assets is as follows:
For the fiscal years ended
(dollars in thousands)December 29,
2012December 31,
2011
Change in projected benefit obligation:Projected benefit obligation at beginning of year . . . . . . . $53,928 $45,367Interest cost. . . . . . . . . . . . . . . . . . . . . . . . . . . . . . . . . . . . . . 2,388 2,454Actuarial loss . . . . . . . . . . . . . . . . . . . . . . . . . . . . . . . . . . . . 4,503 7,656Benefits paid . . . . . . . . . . . . . . . . . . . . . . . . . . . . . . . . . . . . . (1,488) (1,549)
Projected benefit obligation at end of year . . . . . . . . . . . . . . . $59,331 $53,928
Change in plan assets: Fair value of plan assets at beginning of year . . . . . . . . . . $42,470 $43,118Actual return on plan assets . . . . . . . . . . . . . . . . . . . . . . . . 4,792 901Benefits paid . . . . . . . . . . . . . . . . . . . . . . . . . . . . . . . . . . . . . (1,488) (1,549)
Fair value of plan assets at end of year . . . . . . . . . . . . . . . . . . $45,774 $42,470
Unfunded status . . . . . . . . . . . . . . . . . . . . . . . . . . . . . . . . . . $13,557 $11,458
NOTE 8—STOCK-BASED COMPENSATION (Continued)

65
Form 10-K
CARTER’S, INC.
NOTES TO CONSOLIDATED FINANCIAL STATEMENTS
The unfunded status is included in other long-term liabilities in the accompanying audited consolidated balance sheets for both fiscal 2012 and 2011. The Company does not expect to make any contributions to the OshKosh defined benefit plan during fiscal 2013 as the plan’s funding exceeds the minimum funding requirements. The accumulated benefit obligation is equal to the projected benefit obligation as of December 29, 2012 and December 31, 2011 because the plan is frozen.
Net periodic pension (benefit) cost
The net periodic pension cost (benefit) included in the statement of operations was comprised of:
For the fiscal years ended
(dollars in thousands)December 29,
2012December 31,
2011January 1,
2011
Interest cost . . . . . . . . . . . . . . . . . . . . . . . . . . . . $ 2,388 $ 2,454 $ 2,392Expected return on plan assets . . . . . . . . . . . . (2,852) (3,112) (2,875)Recognized actuarial loss . . . . . . . . . . . . . . . . . 710 1 135
Net periodic pension cost (benefit) . . . . . . $ 246 $ (657) $ (348)
Assumptions
The actuarial computations utilized the following assumptions, using year-end measurement dates:
Benefit obligation 2012 2011
Discount rate . . . . . . . . . . . . . . . . . . . . . . . . . . . . . . . . . . . . 4.0% 4.5%
Net periodic pension cost 2012 2011 2010
Discount rate . . . . . . . . . . . . . . . . . . . . . . . . . . . . . . . . . . . . 4.5% 5.5% 5.5%Expected long-term rate of return on assets . . . . . . . . . . 7.0% 7.5% 7.5%
The discount rates used at December 29, 2012, December 31, 2011, and January 1, 2011, were determined with consideration given to Citigroup Pension Discount and Liability index, the Barclay Capital Aggregate Bond index, and the Moody’s Aa Corporate Bond rate, adjusted for the timing of expected plan distributions. The Company believes these indexes reflect a risk-free rate consistent with a portfolio of high quality debt instruments with maturities that are comparable to the timing of the expected payments under the plan. The expected long-term rate of return assumption considers historic returns adjusted for changes in overall economic conditions that may affect future returns and a weighting of each investment class.
The Company currently expects benefit payments for its defined benefit pension plans as follows for the next ten fiscal years;
(dollars in thousands)Fiscal Year
2013 . . . . . . . . . . . . . . . . . . . . . . . . . . . . . . . . . . . . . . . . . . . . . . . . . . . . . . . . . . . $ 1,9002014 . . . . . . . . . . . . . . . . . . . . . . . . . . . . . . . . . . . . . . . . . . . . . . . . . . . . . . . . . . . . $ 1,4902015 . . . . . . . . . . . . . . . . . . . . . . . . . . . . . . . . . . . . . . . . . . . . . . . . . . . . . . . . . . . $ 1,7402016 . . . . . . . . . . . . . . . . . . . . . . . . . . . . . . . . . . . . . . . . . . . . . . . . . . . . . . . . . . . . $ 1,9402017 . . . . . . . . . . . . . . . . . . . . . . . . . . . . . . . . . . . . . . . . . . . . . . . . . . . . . . . . . . . . $ 2,3502018-2022 . . . . . . . . . . . . . . . . . . . . . . . . . . . . . . . . . . . . . . . . . . . . . . . . . . . . . . . $13,520
NOTE 9—EMPLOYEE BENEFIT PLANS (Continued)

66
CARTER’S, INC.
NOTES TO CONSOLIDATED FINANCIAL STATEMENTS
Plan assets
The Company’s investment strategy is to invest in a well diversified portfolio consisting of approximately 10 mutual funds or group annuity contracts that minimize concentration of risks by utilizing a variety of asset types, fund strategies, and fund managers. The target allocation for plan assets is 50% equity securities, 42% bond funds, and 8% real estate investments.
Equity securities primarily include funds invested in large-cap and mid-cap companies, primarily located in the United States, with up to 5% of the plan assets invested in international equities. Fixed income securities include funds holding corporate bonds of companies from diverse industries, and U.S. Treasuries. Real estate funds include investments in actively managed commercial real estate projects located in the United States.
The fair value of the Company’s pension plan assets at December 29, 2012 and December 31, 2011 by asset category were as follows:
(dollars in thousands)Asset Category
December 29, 2012 December 31, 2011
Total Level 1 Level 2 Total Level 1 Level 2
Cash and cash equivalents. . . . . . . . . $ 104 $ — $ 104 $ 97 $ — $ 97Equity Securities:
U.S. Large-Cap blend (a). . . . . . . 10,574 5,292 5,282 9,752 4,889 4,863U.S. Large-Cap growth . . . . . . . . 5,284 5,284 — 4,883 4,883 —U.S. Mid-Cap growth. . . . . . . . . . 2,446 — 2,446 — — —U.S. Mid-Cap blend . . . . . . . . . . . — — — 2,265 — 2,265U.S. Small-Cap blend. . . . . . . . . . 2,456 2,456 — 2,247 2,247 —International blend. . . . . . . . . . . . 2,283 2,283 — 2,114 2,114 —
Fixed income securities:Corporate bonds (b). . . . . . . . . . . 18,761 18,761 — 17,548 17,548 —
Real estate (c). . . . . . . . . . . . . . . . . . . 3,866 3,866 — 3,564 3,564 —
$45,774 $37,942 $7,832 $42,470 $35,245 $7,225
(a) This category comprises low-cost equity index funds not actively managed that track the S&P 500.
(b) This category invests in both U.S. Treasuries and mid-term corporate debt from U.S. issuers from diverse industries.
(c) This category invests in active management of U.S. commercial real estate projects.
POST-RETIREMENT LIFE AND MEDICAL PLAN
Under a defined benefit plan frozen in 1991, the Company offers a comprehensive post-retirement medical plan to current and certain future retirees and their spouses. The Company also offers life insurance to current and certain future retirees. Employee contributions are required as a condition of participation for both medical benefits and life insurance and the Company’s liabilities are net of these expected employee contributions.
NOTE 9—EMPLOYEE BENEFIT PLANS (Continued)

67
Form 10-K
CARTER’S, INC.
NOTES TO CONSOLIDATED FINANCIAL STATEMENTS
Accumulated post-retirement benefit obligation
The following is a reconciliation of the accumulated post-retirement benefit obligation (“APBO”) under this plan:
For the fiscal years ended
(dollars in thousands)December 29,
2012 December 31,
2011
APBO at beginning of period . . . . . . . . . . . . . . . . . . . . . . . . . $7,335 $7,405Service cost . . . . . . . . . . . . . . . . . . . . . . . . . . . . . . . . . . . . . . . . 135 130Interest cost . . . . . . . . . . . . . . . . . . . . . . . . . . . . . . . . . . . . . . . . 282 390Actuarial (gain) loss . . . . . . . . . . . . . . . . . . . . . . . . . . . . . . . . . (372) 49Plan participants’ contribution . . . . . . . . . . . . . . . . . . . . . . . . 23 43Benefits paid . . . . . . . . . . . . . . . . . . . . . . . . . . . . . . . . . . . . . . . (527) (682)
APBO at end of period . . . . . . . . . . . . . . . . . . . . . . . . . . . . $6,876 $7,335
The APBO is included in other current liabilities and other long-term liabilities in the accompanying audited consolidated balance sheets for both fiscal 2012 and 2011.
Net periodic post-retirement benefit cost
The components of post-retirement benefit expense charged to the statement of operations are as follows:
For the fiscal years ended
(dollars in thousands) December 29,
2012 December 31,
2011 January 1,
2011
Service cost – benefits attributed to service during the period . . . . . . . . . . . . . . . . . . . . . . . . . . . . . . . . . $135 $130 $ 73
Interest cost on accumulated post-retirement benefit obligation . . . . . . . . . . . . . . . . . . . . . . . . . . . 282 390 426
Amortization net actuarial gain . . . . . . . . . . . . . . . . . . (84) (49) (22)
Total net periodic post-retirement benefit cost . . . $333 $471 $477
Assumptions
The actuarial computations utilized the following assumptions, using year-end measurement dates:
Benefit obligation 2012 2011
Discount rate . . . . . . . . . . . . . . . . . . . . . . . . . . . . . . . . . 3.5% 4.0%
Net periodic pension cost 2012 2011 2010
Discount rate . . . . . . . . . . . . . . . . . . . . . . . . . . . . . . . . . 4.0% 5.5% 5.5%
NOTE 9—EMPLOYEE BENEFIT PLANS (Continued)

68
CARTER’S, INC.
NOTES TO CONSOLIDATED FINANCIAL STATEMENTS
The discount rates used at December 29, 2012 and December 31, 2011, were determined with primary consideration given to the Citigroup Pension Discount and Liability index adjusted for the timing of expected plan distributions. The Company believes this index reflects a risk-free rate with maturities that are comparable to the timing of the expected payments under the plan. The discount rate used at January 1, 2011 was determined with consideration given to the Citigroup Pension Discount and Liability Index, as well as Moody’s Aa Corporate Bond rate, and the Barclays Capital Aggregate Bond Index, adjusted for the timing of expected plan distributions.
The effects on the Company’s plan of all future increases in health care costs are borne primarily by employees; accordingly, increasing medical costs are not expected to have any material effect on the Company’s future financial results.
The Company’s contribution for these post-retirement benefit obligations was $0.5 million, $0.6 million, and $0.5 million in fiscal 2012, 2011, and 2010, respectively. The Company expects that its contribution and benefit payments for post-retirement benefit obligations each year from fiscal 2013 through fiscal 2017 will be approximately $0.5 million to $0.6 million. For the five years subsequent to fiscal 2017, the aggregate contributions and benefit payments for post-retirement benefit obligations will be approximately $2.2 million. The Company does not pre-fund this plan and as a result there are no plan assets. The measurement date used to determine the post-retirement benefit obligations is as of the end of the fiscal year.
Due to the anticipated employee turnover as a result of the Company’s decision to relocate its Shelton, Connecticut office and close its Hogansville, Georgia distribution center, the Company expects that certain employees currently eligible for this benefit will leave the Company prior to retirement, and will no longer be eligible for the benefit. This turnover may impact the APBO of this plan in future periods.
PLAN FOR CERTAIN FORMER OFFICERS
The Company has an obligation under a defined benefit plan covering certain former officers and their spouses. At December 29, 2012 and December 31, 2011, the present value of the estimated remaining payments under this plan was approximately $0.6 million and is included in other current and long-term liabilities in the accompanying audited consolidated balance sheets. The amount of pension expense associated with this plan was not significant for the fiscal years ended December 29, 2012, December 31, 2011 and January 1, 2011.
DEFERRED COMPENSATION PLAN
The Company maintains a deferred compensation plan allowing salary and incentive compensation deferrals for qualifying employees as permitted by the Internal Revenue Code. Participant deferrals earn investment returns based on a select number of investment options, including equity, debt, and real estate mutual funds. Beginning in fiscal 2012, the Company invests comparable amounts in marketable securities to mitigate the risk associated with the investment return on the employee deferrals.
NOTE 9—EMPLOYEE BENEFIT PLANS (Continued)

69
Form 10-K
CARTER’S, INC.
NOTES TO CONSOLIDATED FINANCIAL STATEMENTS
DEFINED CONTRIBUTION PLAN
The Company also sponsors a defined contribution plan within the United States. This plan covers employees who are at least 21 years of age and have completed three months of service, during which at least 250 hours were served. The plan provides for a discretionary employer match. The Company’s expense for the defined contribution plan totaled approximately $6.3 million, $4.5 million, and $4.3 million for the fiscal years ended December 29, 2012, December 31, 2011, and January 1, 2011, respectively.
NOTE 10—INCOME TAXES
PROVISION FOR INCOME TAXES
The provision for income taxes consists of the following:
For the fiscal years ended
(dollars in thousands)December 29,
2012December 31,
2011January 1,
2011
Current tax provision: Federal. . . . . . . . . . . . . . . . . . . . . . . . . . . . . . . . . . . $ 87,070 $48,141 $74,310State . . . . . . . . . . . . . . . . . . . . . . . . . . . . . . . . . . . . . 8,905 4,550 7,332Foreign. . . . . . . . . . . . . . . . . . . . . . . . . . . . . . . . . . . 7,917 5,053 902
Total current provision. . . . . . . . . . . . . . . . . . . $103,892 $57,744 $82,544 Deferred tax provision (benefit):
Federal. . . . . . . . . . . . . . . . . . . . . . . . . . . . . . . . . . . $ (7,815) $10,511 $ 3,751State . . . . . . . . . . . . . . . . . . . . . . . . . . . . . . . . . . . . . (846) 309 619Foreign. . . . . . . . . . . . . . . . . . . . . . . . . . . . . . . . . . . (990) (1,692) —
Total deferred provision. . . . . . . . . . . . . . . . . . (9,651) 9,128 4,370
Total provision. . . . . . . . . . . . . . . . . . . . . . . $ 94,241 $66,872 $86,914
The foreign portion of the current tax position relates to Canadian income taxes on the Company’s Canadian operations, subsequent to the Acquisition, and foreign tax withholdings related to the Company’s foreign royalty income. The foreign portion of the deferred tax provision relates to temporary differences in Canada and the tax benefit of a Hong Kong operating loss incurred in fiscal 2012. An immaterial deferred tax asset related to initial Japan operations has been fully offset with a valuation allowance, and does not impact the fiscal 2012 tax provision or effective tax rate. The components of income before income taxes are as follows:
For the fiscal years ended
(dollars in thousands)December 29,
2012December 31,
2011 January 1,
2011
Domestic . . . . . . . . . . . . . . . . . . . . . . . . . . . . . . . . . . . . $239,159 $174,627 $233,386Foreign . . . . . . . . . . . . . . . . . . . . . . . . . . . . . . . . . . . . . . 16,232 6,261 —
Total . . . . . . . . . . . . . . . . . . . . . . . . . . . . . . . . . . . . . . . . $255,391 $180,888 $233,386
NOTE 9—EMPLOYEE BENEFIT PLANS (Continued)

70
CARTER’S, INC.
NOTES TO CONSOLIDATED FINANCIAL STATEMENTS
NOTE 10—INCOME TAXES (Continued)
EFFECTIVE RATE RECONCILIATION
The difference between the Company’s effective income tax rate and the federal statutory tax rate is reconciled below:
For the fiscal years ended
December 29,
2012 December 31,
2011 January 1,
2011
Statutory federal income tax rate . . . . . . . . . . . . . . . . . 35.0% 35.0% 35.0%State income taxes, net of federal income tax
benefit . . . . . . . . . . . . . . . . . . . . . . . . . . . . . . . . . . . . 2.5% 2.6% 2.6%Impact of foreign operations. . . . . . . . . . . . . . . . . . . . . (0.7)% (0.3)% —%Settlement of uncertain tax positions . . . . . . . . . . . . . (0.5)% (1.0)% (0.4)%Acquisition expenses . . . . . . . . . . . . . . . . . . . . . . . . . . . 0.6% 0.7% —%
Total . . . . . . . . . . . . . . . . . . . . . . . . . . . . . . . . . . . . . . 36.9% 37.0% 37.2%
The Company and its subsidiaries file income tax returns in the United States and in various states and local jurisdictions. The Company’s subsidiaries also file income tax returns in Canada (including various Canadian provinces), Hong Kong, and Japan. The Internal Revenue Service completed its income tax audit for fiscal 2009 during fiscal 2011. The federal statute of limitations for fiscal 2008 closed during the third quarter of fiscal 2012. In most cases, the Company is no longer subject to state and local tax authority examinations for years prior to fiscal 2008.
DEFERRED TAXES
Components of deferred tax assets and liabilities were as follows:
(dollars in thousands)December 29,
2012December 31,
2011
Assets (Liabilities)
Deferred tax assets:Accounts receivable allowance . . . . . . . . . . . . . . . . . . . . . . . . $ 4,036 $ 5,611Inventory . . . . . . . . . . . . . . . . . . . . . . . . . . . . . . . . . . . . . . . . . . 8,974 8,979Accrued liabilities . . . . . . . . . . . . . . . . . . . . . . . . . . . . . . . . . . 16,361 5,834Equity-based compensation . . . . . . . . . . . . . . . . . . . . . . . . . . 8,795 7,197Deferred employee benefits . . . . . . . . . . . . . . . . . . . . . . . . . . 8,626 7,610Deferred rent . . . . . . . . . . . . . . . . . . . . . . . . . . . . . . . . . . . . . . 15,543 11,765Other . . . . . . . . . . . . . . . . . . . . . . . . . . . . . . . . . . . . . . . . . . . . . 5,333 4,306
Total deferred tax assets . . . . . . . . . . . . . . . . . . . . . . . . . . $ 67,668 $ 51,302
Deferred tax liabilities: Depreciation . . . . . . . . . . . . . . . . . . . . . . . . . . . . . . . . . . . . . . . $ (29,141) $ (23,892)Tradename and licensing agreements . . . . . . . . . . . . . . . . . . (114,140) (113,976)Other . . . . . . . . . . . . . . . . . . . . . . . . . . . . . . . . . . . . . . . . . . . . . (3,053) (2,690)
Total deferred tax liabilities. . . . . . . . . . . . . . . . . . . . . . . . $(146,334) $(140,558)

71
Form 10-K
CARTER’S, INC.
NOTES TO CONSOLIDATED FINANCIAL STATEMENTS
The net deferred tax liability is classified on the accompanying audited consolidated balance sheets as follows:
(dollars in thousands)December 29,
2012December 31,
2011
Assets (Liabilities)
Current net deferred tax asset . . . . . . . . . . . . . . . . . . . . . . . . . . . . $ 35,675 $ 25,165Non-current net deferred tax liability . . . . . . . . . . . . . . . . . . . . . . (114,341) (114,421)
Total deferred tax liability . . . . . . . . . . . . . . . . . . . . . . . . . . . . . $ (78,666) $ (89,256)
The Company has not provided deferred taxes on undistributed earnings from its Canadian subsidiary, as the Company anticipates that these earnings will be reinvested indefinitely. Undistributed earnings from the Company’s Canadian subsidiary at December 29, 2012, amounted to approximately $25.0 million. These earnings have been reinvested in Canadian operations and the Company does not currently plan to initiate any action that would result in these earnings being repatriated to the U.S. Because of the availability of foreign tax credits, it is not practicable to determine the U.S. federal income tax liability that would be payable if such earnings were not reinvested indefinitely. As of December 29, 2012, the Company has not yet generated earnings from its Hong Kong or Japanese subsidiaries.
UNCERTAIN TAX POSITIONS
The following is a reconciliation of the beginning and ending amount of unrecognized tax benefits:
(dollars in thousands)
Balance at January 2, 2010 . . . . . . . . . . . . . . . . . . . . . . . . . . . . . . . . . . . . . . . . . . . . . . $ 7,731Additions based on tax positions related to fiscal 2010 . . . . . . . . . . . . . . . . . . . . . . . 2,150Reductions for prior year tax positions . . . . . . . . . . . . . . . . . . . . . . . . . . . . . . . . . . . . . —Reductions for lapse of statute of limitations . . . . . . . . . . . . . . . . . . . . . . . . . . . . . . . (1,200)Reductions for prior year tax settlements . . . . . . . . . . . . . . . . . . . . . . . . . . . . . . . . . . . —
Balance at January 1, 2011 . . . . . . . . . . . . . . . . . . . . . . . . . . . . . . . . . . . . . . . . . . . . . . $ 8,681Additions based on tax positions related to fiscal 2011 . . . . . . . . . . . . . . . . . . . . . . . 2,100Reductions for prior year tax positions . . . . . . . . . . . . . . . . . . . . . . . . . . . . . . . . . . . . . —Reductions for lapse of statute of limitations . . . . . . . . . . . . . . . . . . . . . . . . . . . . . . . (1,727)Reductions for prior year tax settlements . . . . . . . . . . . . . . . . . . . . . . . . . . . . . . . . . . . (709)
Balance at December 31, 2011 . . . . . . . . . . . . . . . . . . . . . . . . . . . . . . . . . . . . . . . . . . . . $ 8,345Additions based on tax positions related to fiscal 2012 . . . . . . . . . . . . . . . . . . . . . . . 2,384Additions for prior year tax positions . . . . . . . . . . . . . . . . . . . . . . . . . . . . . . . . . . . . . . 1,020Reductions for lapse of statute of limitations . . . . . . . . . . . . . . . . . . . . . . . . . . . . . . . (1,831)Reductions for prior year tax settlements . . . . . . . . . . . . . . . . . . . . . . . . . . . . . . . . . . . (155)
Balance at December 29, 2012 . . . . . . . . . . . . . . . . . . . . . . . . . . . . . . . . . . . . . . . . . . . . $ 9,763
NOTE 10—INCOME TAXES (Continued)

72
CARTER’S, INC.
NOTES TO CONSOLIDATED FINANCIAL STATEMENTS
As of December 29, 2012, the Company had gross unrecognized tax benefits of approximately $9.8 million, of which $6.8 million, if ultimately recognized, will affect the Company’s effective tax rate in the period settled. The Company has recorded tax positions for which the ultimate deductibility is more likely than not, but for which there is uncertainty about the timing of such deductions. Because of deferred tax accounting, changes in the timing of these deductions would not affect the annual effective tax rate, but would accelerate the payment of cash to the taxing authorities.
Included in the reserves for unrecognized tax benefits are approximately $1.7 million of reserves for which the statute of limitations is expected to expire within the next fiscal year. If these tax benefits are ultimately recognized, such recognition, net of federal income taxes, may affect the annual effective tax rate for fiscal 2013 and the effective tax rate in the quarter in which the benefits are recognized.
The Company recognizes interest related to unrecognized tax benefits as a component of interest expense and penalties related to unrecognized tax benefits as a component of income tax expense. During fiscal 2012, 2011, and 2010, interest expense recorded on uncertain tax positions was not significant. The Company had approximately $0.7 million and $0.5 million of interest accrued on uncertain tax positions as of December 29, 2012 and December 31, 2011, respectively.
NOTE 11—FAIR VALUE MEASUREMENTS
The following table summarizes assets and liabilities measured at fair value on a recurring basis:
December 29, 2012 December 31, 2011
(dollars in thousands) Level 1 Level 2 Level 3 Level 1 Level 2 Level 3
Assets Investments . . . . . . . . . . . . . . . . . . . $3.2 $ — $ — $ — $ — $ —Foreign exchange forward
contracts (1) . . . . . . . . . . . . . . . . $ — $ — $ — $0.6 $ — $ —Liabilities
Contingent consideration . . . . . . . . $ — $ — $29.7 $ — $ — $25.6
(1) Included in prepaid expenses and other current assets in the accompanying audited consolidated balance sheet.
INVESTMENTS
Beginning in fiscal 2012, the Company invests in marketable securities, principally equity based mutual funds, to mitigate the risk associated with the investment return on employee deferrals of compensation. All of the marketable securities purchased are included in other assets on the accompanying audited consolidated balance sheet. During fiscal 2012, gains (losses) on the mark to market of marketable securities were not significant.
The fair value of the Company’s pension plan assets at December 29, 2012 and December 31, 2011, by asset category, are disclosed in the employee benefit plans footnote to the consolidated financial statements.
NOTE 10—INCOME TAXES (Continued)

73
Form 10-K
CARTER’S, INC.
NOTES TO CONSOLIDATED FINANCIAL STATEMENTS
FOREIGN EXCHANGE FORWARD CONTRACTS
As part of the Company’s overall strategy to manage the level of exposure to the risk of foreign currency exchange rate fluctuations, primarily exposure to changes in the value of the U.S. dollar in relation to the Canadian dollar, the Company hedges a portion of its foreign currency exposures anticipated over the ensuing twelve-month period. The Company uses foreign exchange contracts that generally have maturities of up to 12 months to provide continuing coverage throughout the hedging period.
As of December 29, 2012, the Company had no open foreign exchange forward contract positions. At December 31, 2011, the Company had contracts for the purchase of $24.5 million of U.S. dollars at fixed rates. The fair value of these forward contracts at December 31, 2011, was an asset of $0.6 million. The Company accounts for these foreign exchange contracts as undesignated hedge positions that are marked to fair value through earnings at each reporting date. During fiscal 2012 and fiscal 2011, the Company recorded (losses) gains on the mark-to-market of foreign currency exchange contracts of $(0.9) million and $1.6 million, respectively.
Acquisition-related forward contract
On June 22, 2011, as part of the Acquisition, the Company entered into a foreign currency exchange forward contract to reduce its risk from exchange rate fluctuations on the purchase price of Bonnie Togs. The contract was settled on June 30, 2011 and a gain of $0.2 million was recognized in earnings.
CONTINGENT CONSIDERATION
The following summarizes the significant unobservable inputs for the Company’s Level 3 fair value measurements at December 29, 2012:
(dollars in millions)Fair Value
(USD) Valuation technique
Unobservableinputs
Amount (CAD)
Contingent consideration . . . . . . . . . . $29.7 Discounted cash flow Estimated contingent consideration payment
C$ 35
Discount rate 18% Probability assumption 100%
INTEREST RATE HEDGE AGREEMENTS
Prior to fiscal 2011, the Company entered into interest rate swap agreements to hedge the risk of interest rate fluctuations. These interest rate swap agreements were designated as cash flow hedges of the variable interest payments on a portion of the Company’s variable rate term loan debt. As of January 2, 2010, approximately $238.9 million of the Company’s $334.5 million of outstanding debt was hedged under interest rate swap agreements. In connection with the repayment of the Company’s former term loan in fiscal 2010, the Company terminated its two remaining interest rate swap agreements totaling $100.0 million originally scheduled to mature in January 2011. During fiscal 2010, the Company recorded approximately $1.7 million in interest expense related to its swap agreements.
NOTE 11—FAIR VALUE MEASUREMENTS (Continued)

74
CARTER’S, INC.
NOTES TO CONSOLIDATED FINANCIAL STATEMENTS
NOTE 12—LEASE COMMITMENTS
As of December 29, 2012, all of the Company’s leases are classified as operating leases.
Rent expense under operating leases was approximately $101.1 million, $84.6 million, and $70.1 million for the fiscal years ended December 29, 2012, December 31, 2011, and January 1, 2011, respectively.
Minimum annual rental commitments under current noncancellable operating leases as of December 29, 2012 were as follows:
(dollars in thousands)Fiscal Year
Totalnoncancellable
leases
2013 . . . . . . . . . . . . . . . . . . . . . . . . . . . . . . . . . . . . . . $ 95,0912014 . . . . . . . . . . . . . . . . . . . . . . . . . . . . . . . . . . . . . . 85,4072015 . . . . . . . . . . . . . . . . . . . . . . . . . . . . . . . . . . . . . . 78,5792016 . . . . . . . . . . . . . . . . . . . . . . . . . . . . . . . . . . . . . . 72,9222017 . . . . . . . . . . . . . . . . . . . . . . . . . . . . . . . . . . . . . . 67,941Thereafter . . . . . . . . . . . . . . . . . . . . . . . . . . . . . . . . . 259,768
Total . . . . . . . . . . . . . . . . . . . . . . . . . . . . . . . . . . . $659,708
Amounts related to buildings include leases on retail stores as well as various corporate offices, distribution facilities, and other premises. As of December 29, 2012, the minimum annual rental commitments include amounts related to the lease on the new headquarter premises in Atlanta (signed in December 2012) and the new distribution facility in Braselton (signed in April 2012).
At December 29, 2012, the Company operated 581 leased retail stores, located primarily in outlet and strip centers, across the United States, having an average size of approximately 4,500 square feet. In addition, the Company operates 82 leased retail stores in Canada, having an average size of approximately 5,500 square feet. The majority of the Company’s lease terms range between 5 to 10 years.

75
Form 10-K
CARTER’S, INC.
NOTES TO CONSOLIDATED FINANCIAL STATEMENTS
NOTE 13—EARNINGS PER SHARE
The following is a reconciliation of basic common shares outstanding to diluted common and common equivalent shares outstanding:
For the fiscal years ended
December 29,
2012December 31,
2011January 1,
2011
Weighted-average number of common and common equivalent shares outstanding: Basic number of common shares outstanding. . . . . . . 58,217,503 57,513,748 58,135,868Dilutive effect of unvested restricted stock . . . . . . . . . 186,018 129,262 117,708Dilutive effect of stock options . . . . . . . . . . . . . . . . . . . 665,666 571,907 762,473
Diluted number of common and common equivalent shares outstanding . . . . . . . . . . . . . . . . . 59,069,187 58,214,917 59,016,049
Basic net income per common share: Net income . . . . . . . . . . . . . . . . . . . . . . . . . . . . . . . . . . . $161,150,000 $114,016,000 $146,472,000Income allocated to participating securities . . . . . . . . (2,095,309) (1,210,944) (1,202,948)
Net income available to common shareholders. . . . . . $159,054,691 $112,805,056 $145,269,052
Basic net income per common share . . . . . . . . . . . . . . $ 2.73 $ 1.96 $ 2.50Diluted net income per common share:
Net income . . . . . . . . . . . . . . . . . . . . . . . . . . . . . . . . . . . $161,150,000 $114,016,000 $146,472,000Income allocated to participating securities . . . . . . . . (2,071,926) (1,199,147) (1,187,501)
Net income available to common shareholders. . . . . . $159,078,074 $112,816,853 $145,284,499
Diluted net income per common share . . . . . . . . . . . . $ 2.69 $ 1.94 $ 2.46
For the fiscal years ended December 29, 2012, December 31, 2011, and January 1, 2011, antidilutive shares of approximately 613,000, 935,000, and 599,000 respectively, were excluded from the computation of diluted earnings per share. The volume of antidilutive shares is in part due to the related unamortized compensation costs.
NOTE 14—COMMITMENTS AND CONTINGENCIES
The Company is subject to various claims and pending or threatened lawsuits in the normal course of business. The Company is not currently a party to any legal proceedings that it believes would have a material adverse effect on its financial position, results of operations, or cash flows.
The Company’s contractual obligations and commitments also includes obligations associated with facility closures and employee severance agreements, operating leases, the revolving credit agreement, and employee benefit plans, as disclosed elsewhere in the notes to the consolidated financial statements.

76
CARTER’S, INC.
NOTES TO CONSOLIDATED FINANCIAL STATEMENTS
NOTE 15—OTHER CURRENT AND LONG-TERM LIABILITIES
Other current liabilities consisted of the following:
(dollars in thousands)December 29,
2012December 31,
2011
Accrued bonuses and incentive compensation . . . $30,541 $ 9,417Contingent consideration . . . . . . . . . . . . . . . . . . . . . 14,442 —Accrued workers’ compensation . . . . . . . . . . . . . . . 5,446 6,059Accrued sales and use taxes . . . . . . . . . . . . . . . . . . . 5,402 5,232Accrued salaries and wages . . . . . . . . . . . . . . . . . . . 5,517 5,150Accrued gift certificates . . . . . . . . . . . . . . . . . . . . . . 6,011 4,992Accrued 401(k) contributions . . . . . . . . . . . . . . . . . 6,200 4,600Accrued closure costs . . . . . . . . . . . . . . . . . . . . . . . . 4,251 84Other current liabilities . . . . . . . . . . . . . . . . . . . . . . 16,800 14,415
Total . . . . . . . . . . . . . . . . . . . . . . . . . . . . . . . . . . . $94,610 $49,949
Other long-term liabilities consisted of the following:
(dollars in thousands)December 29,
2012December 31,
2011
Deferred lease incentives . . . . . . . . . . . . . . . . . . . . . $ 29,913 $23,477Accrued rent . . . . . . . . . . . . . . . . . . . . . . . . . . . . . . . 20,485 15,719Contingent consideration . . . . . . . . . . . . . . . . . . . . . 15,262 25,566OshKosh pension plan . . . . . . . . . . . . . . . . . . . . . . . 13,557 11,458Unrecognized tax benefits . . . . . . . . . . . . . . . . . . . . 10,479 8,832Post-retirement medical plan . . . . . . . . . . . . . . . . . . 6,201 6,660Deferred compensation . . . . . . . . . . . . . . . . . . . . . . 3,996 2,026Other . . . . . . . . . . . . . . . . . . . . . . . . . . . . . . . . . . . . . 161 88
Total . . . . . . . . . . . . . . . . . . . . . . . . . . . . . . . . . . . $100,054 $93,826

77
Form 10-K
CARTER’S, INC.
NOTES TO CONSOLIDATED FINANCIAL STATEMENTS
NOTE 16—VALUATION AND QUALIFYING ACCOUNTS
Information regarding accounts receivable is as follows:
(dollars in thousands)
Accounts receivable reserves
Sales returns reserves Total
Balance, January 2, 2010 . . . . . . . . . . . . . . . . . . . . $ 2,216 $ 400 $ 2,616Additions, charged to expense . . . . . . . . . . . . . 5,163 268 5,431Charges to reserve . . . . . . . . . . . . . . . . . . . . . . . (4,528) (268) (4,796)
Balance, January 1, 2011 . . . . . . . . . . . . . . . . . . . . $ 2,851 $ 400 $ 3,251Additions, charged to expense . . . . . . . . . . . . . 7,227 1,121 8,348Charges to reserve . . . . . . . . . . . . . . . . . . . . . . . (5,458) (1,121) (6,579)
Balance, December 31, 2011 . . . . . . . . . . . . . . . . . . $ 4,620 $ 400 $ 5,020Additions, charged to expense . . . . . . . . . . . . . 8,251 954 9,205Charges to reserve . . . . . . . . . . . . . . . . . . . . . . . (5,683) (954) (6,637)
Balance, December 29, 2012 . . . . . . . . . . . . . . . . . . $ 7,188 $ 400 $ 7,588
NOTE 17—SEGMENT INFORMATION
The Company reports segment information based upon a “management approach.” The management approach refers to the internal reporting that is used by management for making operating decisions and assessing the performance of the Company’s reportable segments. The Company reports its corporate expenses separately as they are not included in the internal measures of segment operating performance used by the Company to measure the underlying performance of its reportable segments.
Segment results include the direct costs of each segment and all other costs are allocated based upon detailed estimates and analysis of actual time and expenses incurred to support the operations of each segment or units produced or sourced to support each segment’s revenue. Certain costs, including incentive compensation for certain employees, and various other general corporate costs that are not specifically allocable to segments, are included in corporate expenses below. Intersegment sales and transfers are recorded at cost and are treated as a transfer of inventory. The accounting policies of the segments are the same as those described in Note 2 to the consolidated financial statements. The Company’s reportable segments are Carter’s wholesale, Carter’s retail, OshKosh retail, OshKosh wholesale, and international.

78
CARTER’S, INC.
NOTES TO CONSOLIDATED FINANCIAL STATEMENTS
The table below presents certain segment information for the periods indicated:
For the fiscal years ended
(dollars in thousands)December 29,
2012% of Total
December 31, 2011
% of Total
January 1, 2011
% of Total
Net sales:Carter’s Wholesale. . . . . . . . . . . . . $ 981,445 41.2% $ 939,115 44.5% $ 827,815 47.3%Carter’s Retail (a). . . . . . . . . . . . . . 818,909 34.4% 671,590 31.8% 546,233 31.2%
Total Carter’s . . . . . . . . . . . . . . 1,800,354 75.6% 1,610,705 76.3% 1,374,048 78.5%OshKosh Retail (a) . . . . . . . . . . . . 283,343 11.9% 280,900 13.3% 264,887 15.2%OshKosh Wholesale . . . . . . . . . . . 79,752 3.3% 81,888 3.9% 75,484 4.3%
Total OshKosh . . . . . . . . . . . . . 363,095 15.2% 362,788 17.2% 340,371 19.5%
International (b). . . . . . . . . . . . . . . 218,285 9.2% 136,241 6.5% 34,837 2.0%
Total net sales . . . . . . . . . . . $2,381,734 100.0% $2,109,734 100.0% $1,749,256 100.0%
% of segment net sales
% of segment net sales
% of segment net sales
Operating income (loss):Carter’s Wholesale. . . . . . . . . . . . . $ 172,673 17.6% $ 117,897 12.6% $ 152,281 18.4%Carter’s Retail (a). . . . . . . . . . . . . . 145,940 17.8% 105,818 15.8% 113,277 20.7%
Total Carter’s . . . . . . . . . . . . . . 318,613 17.7% 223,715 13.9% 265,558 19.3%
OshKosh Retail (a) . . . . . . . . . . . . (7,752) (2.7)% (9,658) (3.4)% 19,356 7.3%OshKosh Wholesale . . . . . . . . . . . 4,086 5.1% 822 1.0% 3,863 5.1%
Total OshKosh . . . . . . . . . . . . . (3,666) (1.0)% (8,836) (2.4)% 23,219 6.8%
International (b) (c) . . . . . . . . . . . . 43,376 19.9% 27,273 20.0% 16,925 48.6%Total segment
operating income . . . . . 358,323 15.0% 242,152 11.5% 305,702 17.5%Corporate expenses (d) (e) (f). . . . (96,337) (4.0)% (54,686) (2.6)% (62,446) (3.6)%
Total operating income . . . $ 261,986 11.0% $ 187,466 8.9% $ 243,256 13.9%
(a) Includes eCommerce results.
(b) Net sales include international retail, eCommerce, and wholesale sales. Operating income includes international licensing income.
(c) Includes charges of $3.6 million and $2.5 million for the fiscal years ended December 29, 2012 and December 31, 2011, respectively, associated with the revaluation of the Company’s contingent consideration. Also, includes a charge of $6.7 million for the fiscal year ended December 31, 2011 related to the amortization of the fair value step-up for Bonnie Togs inventory acquired.
(d) Corporate expenses generally include expenses related to incentive compensation, stock-based compensation, executive management, severance and relocation, finance, building occupancy, information technology, certain legal fees, consulting, and audit fees.
NOTE 17—SEGMENT INFORMATION (Continued)

79
Form 10-K
CARTER’S, INC.
NOTES TO CONSOLIDATED FINANCIAL STATEMENTS
(e) Includes $3.1 million in facility closure-related costs related to the closure of a distribution facility located in Hogansville, Georgia and $6.4 million related to the Shelton, CT office consolidation, for the fiscal year ended December 29, 2012. See Note 18 - Facility Closure.
(f) Includes $3.0 million of professional service fees associated with the Acquisition for the fiscal year ended December 31, 2011.
ADDITIONAL DATA BY SEGMENT
Inventory
The table below represents inventory, net, by segment:
For the fiscal years ended
(dollars in thousands)December 29,
2012December 31,
2011
Carter’s Wholesale. . . . . . . . . . . . . . . . . . . . . . . . . . $191,988 $178,523Carter’s Retail . . . . . . . . . . . . . . . . . . . . . . . . . . . . . 67,167 65,696OshKosh Retail . . . . . . . . . . . . . . . . . . . . . . . . . . . . 23,914 31,879OshKosh Wholesale . . . . . . . . . . . . . . . . . . . . . . . . 30,185 38,406International. . . . . . . . . . . . . . . . . . . . . . . . . . . . . . . 36,276 32,711
Total . . . . . . . . . . . . . . . . . . . . . . . . . . . . . . . . . . . $349,530 $347,215
Wholesale inventories include inventory produced and warehoused for the retail segment.
GEOGRAPHICAL DATA
Revenue
The Company’s international sales principally represent sales to customers in Canada. Such sales were 68.8% and 56.2% of total international sales in fiscal 2012 and 2011.
Long-lived assets
The following represents property, plant, and equipment, net, by geographic area:
(dollars in thousands)December 29,
2012December 31,
2011
United States . . . . . . . . . . . . . . . . . . . . . . . . . . . . . . $149,357 $108,342International. . . . . . . . . . . . . . . . . . . . . . . . . . . . . . . 20,753 14,004
Total . . . . . . . . . . . . . . . . . . . . . . . . . . . . . . . . . . . $170,110 $122,346
Long-lived assets in the international segment relate principally to Canada. Long-lived assets in Canada were 94.0% and 100% of total international long-lived assets at the end of fiscal 2012 and 2011.
NOTE 17—SEGMENT INFORMATION (Continued)

80
CARTER’S, INC.
NOTES TO CONSOLIDATED FINANCIAL STATEMENTS
NOTE 18—FACILITY CLOSURE
HOGANSVILLE DISTRIBUTION FACILITY
Consistent with the Company’s strategy to strengthen its distribution capabilities, the Company decided to close its Hogansville, Georgia facility in fiscal 2013 and open a new, larger multi-channel distribution facility in Braselton, Georgia. On March 14, 2012, the Company announced to affected employees its plan to close the Hogansville facility. Approximately 210 employees are affected by this closure.
In conjunction with the plan to close the Hogansville distribution facility, the Company recorded approximately $3.1 million in closing-related costs during fiscal 2012. The total amount of charges consisted of severance of approximately $2.0 million, accelerated depreciation (included in selling, general, and administrative expenses) of $0.9 million, and other closure costs of $0.1 million.
As of December 29, 2012, there was approximately $2.0 million of restructuring reserves included in other current liabilities on the accompanying audited consolidated balance sheet related to this closure. In fiscal 2013, the Company expects to incur additional closure-related charges of approximately $2.2 million, comprising $0.6 million for one-time termination benefits, $0.5 million in accelerated depreciation, and other closure costs of $1.0 million. The salvage value of this facility is estimated to be $2.0 million.
The following table summarizes restructuring reserves related to the closure of the Hogansville facility which are included in other current liabilities in the accompanying audited consolidated balance sheet as of December 29, 2012:
(dollars in thousands) Severance Other closure costs Total
Balance at December 31, 2011 . . . . . . . . . . . . . . . . $ — $ — $ —Provision . . . . . . . . . . . . . . . . . . . . . . . . . . . . . . . . . 2,039 125 2,164Payments . . . . . . . . . . . . . . . . . . . . . . . . . . . . . . . . . — (125) (125)
Balance at December 29, 2012 . . . . . . . . . . . . . . . . $2,039 $ — $2,039
When the Company determined that it was probable that the Hogansville facility would be closed, an impairment test was performed under the “held and used” model. The Company determined that the assets were not impaired; however, the estimated useful lives of the assets were reassessed and depreciation was accelerated over the expected remaining shutdown period.
OFFICE CONSOLIDATION
On October 11, 2012, the Company announced plans to consolidate its retail and financial operations currently managed in its Shelton, Connecticut facility with the Company’s Atlanta, Georgia-based operations. Approximately 175 employees are affected by this closure.
In conjunction with the plan to close the facility, the Company recorded approximately $6.4 million in closing-related costs during fiscal 2012, all of which has been included in selling, general, and administrative expenses. The total amount of charges consisted of recruiting, relocation and other closure costs of $3.1 million, employee severance and other benefit costs of approximately $2.2 million, and accelerated depreciation of $1.1 million.

81
Form 10-K
CARTER’S, INC.
NOTES TO CONSOLIDATED FINANCIAL STATEMENTS
As of December 29, 2012, approximately $3.1 million has been paid in cash, principally related to recruiting, relocation and other costs, and approximately $2.2 million in restructuring reserves have been included in other current liabilities on the accompanying audited consolidated balance sheets related to this closure.
In fiscal 2013, the Company expects to incur additional closure-related charges of approximately $32 - 36 million. Included in the total are cash charges of approximately $30 million, comprising $13 million of recruiting and relocation expenses, $5 million of employee severance and other benefit costs, $8 million of lease-related charges, and $5 million of other closure costs. The Company also expects approximately $4 million in non-cash accelerated depreciation expense. The Company expects to complete this consolidation by the end of fiscal 2013.
NOTE 19—UNAUDITED QUARTERLY FINANCIAL DATA
The unaudited summarized financial data by quarter for the fiscal years ended December 29, 2012 and December 31, 2011 is presented in the table below:
(dollars in thousands, except per share data) Quarter 1 Quarter 2 Quarter 3 Quarter 4
2012:
Net sales . . . . . . . . . . . . . . . . . . . . . . . . . . . . . . . . $551,662 $472,162 $668,657 $689,253Gross profit . . . . . . . . . . . . . . . . . . . . . . . . . . . . . 194,739 183,243 270,077 289,889Selling, general, and administrative
expenses . . . . . . . . . . . . . . . . . . . . . . . . . . . . . 149,705 156,290 185,167 222,049Royalty income . . . . . . . . . . . . . . . . . . . . . . . . . . (8,766) (7,474) (10,482) (10,527)Operating income . . . . . . . . . . . . . . . . . . . . . . . . 53,800 34,427 95,392 78,367Net income . . . . . . . . . . . . . . . . . . . . . . . . . . . . . . 32,275 20,805 59,378 48,692Basic net income per common share. . . . . . . . . 0.55 0.35 1.01 0.82Diluted net income per common share. . . . . . . 0.54 0.35 0.99 0.81
2011: Net sales . . . . . . . . . . . . . . . . . . . . . . . . . . . . . . . . $469,000 $394,488 $639,617 $606,629Gross profit . . . . . . . . . . . . . . . . . . . . . . . . . . . . . 158,085 135,043 192,113 207,037Selling, general, and administrative
expenses . . . . . . . . . . . . . . . . . . . . . . . . . . . . . 113,780 121,290 145,842 161,174Royalty income . . . . . . . . . . . . . . . . . . . . . . . . . . (9,329) (8,269) (10,494) (9,182)Operating income . . . . . . . . . . . . . . . . . . . . . . . . 53,634 22,022 56,765 55,045Net income . . . . . . . . . . . . . . . . . . . . . . . . . . . . . . 32,123 12,659 34,449 34,785Basic net income per common share. . . . . . . . . 0.56 0.22 0.59 0.59Diluted net income per common share. . . . . . . 0.55 0.22 0.58 0.59
NOTE 18—FACILITY CLOSURE (Continued)
82
ITEM 9. CHANGES IN AND DISAGREEMENTS WITH ACCOUNTANTS ON ACCOUNTING AND FINANCIAL DISCLOSURE
Not applicable.
ITEM 9A. CONTROLS AND PROCEDURES
Evaluation of Disclosure Controls and Procedures
Our Chief Executive Officer and Chief Financial Officer have evaluated the effectiveness of the design and operation of our disclosure controls and procedures (as defined under Rules 13a-15(e) and 15d-15(e) promulgated under the Securities Exchange Act of 1934, as amended (the “Exchange Act”)) as of the end of the period covered by this report. Based upon that evaluation, our Chief Executive Officer and Chief Financial Officer have concluded that our disclosure controls and procedures are effective as of December 29, 2012.
Management’s Report on Internal Control over Financial Reporting
Our management is responsible for establishing and maintaining adequate internal control over financial reporting, as such term is defined in Exchange Act Rule 13a-15(f). Our internal control over financial reporting is a process designed by, or under the supervision of, our Chief Executive Officer and Chief Financial Officer, to provide reasonable assurance regarding the reliability of financial reporting and the preparation of financial statements for external purposes in accordance with generally accepted accounting principles. Internal control over financial reporting includes those policies and procedures that:
• pertaintothemaintenanceofrecordsthat,inreasonabledetail,accuratelyandfairlyreflectthetransactions and dispositions of the assets of the Company;
• providereasonableassurancethattransactionsarerecordedasnecessarytopermitpreparationoffinancial statements in accordance with generally accepted accounting principles, and that receipts and expenditures of the Company are being made only in accordance with authorizations of management and directors of the Company; and
• providereasonableassuranceregardingpreventionortimelydetectionofunauthorizedacquisition,use or disposition of the Company’s assets that could have a material effect on the financial statements.
Because of its inherent limitations, internal control over financial reporting may not prevent or detect misstatements. Also, projections of any evaluation of effectiveness to future periods are subject to the risk that controls may become inadequate because of changes in conditions, or that the degree of compliance with the policies or procedures may deteriorate.
Management, including our Chief Executive Officer and Chief Financial Officer, assessed the effectiveness of the Company’s internal control over financial reporting as of December 29, 2012. In making this assessment, management used the criteria set forth by the Committee of Sponsoring Organizations of the Treadway Commission (“COSO”) in Internal Control-Integrated Framework . Based on this assessment, management has concluded that the Company’s internal control over financial reporting was effective as of December 29, 2012.
The effectiveness of Carter’s, Inc. and its subsidiaries’ internal control over financial reporting as of December 29, 2012 has been audited by PricewaterhouseCoopers LLP, an independent registered public accounting firm, as stated in their report which appears herein.

83
Form 10-K
Changes in Internal Control over Financial Reporting
There were no changes in the Company’s internal controls over financial reporting during the fourth quarter of fiscal 2012 that have materially affected, or are reasonably likely to materially affect, the Company’s internal control over financial reporting.
ITEM 9B. OTHER INFORMATION
Not applicable.

84
PART III
ITEM 10. DIRECTORS AND EXECUTIVE OFFICERS OF THE REGISTRANT
The information called for by Item 10 is incorporated herein by reference to the definitive proxy statement relating to the Annual Meeting of Stockholders of Carter’s, Inc. to be held on May 9, 2013. Carter’s, Inc. intends to file such definitive proxy statement with the Securities and Exchange Commission pursuant to Regulation 14A within 120 days after the end of the fiscal year covered by this Annual Report on Form 10-K.
ITEM 11. EXECUTIVE COMPENSATION
The information called for by Item 11 is incorporated herein by reference to the definitive proxy statement referenced above in Item 10.
ITEM 12. SECURITY OWNERSHIP OF CERTAIN BENEFICIAL OWNERS AND MANAGEMENT AND RELATED STOCKHOLDER MATTERS
EQUITY COMPENSATION PLAN INFORMATION
The following table provides information about our equity compensation plan as of our last fiscal year:
Equity Compensation Plan Information
Plan Category
Number of securities to be issued upon
exercise of outstanding options, warrants, and rights
Weighted-average exercise price of
outstanding options,
warrants, and rights
Number of securities remaining available for future issuance
under equity compensation plans (excluding securities
reflected in first column)
Equity compensation plans approved by security holders (1) . . . . . . . . . . . . . . . . . . . . . . . . 2,078,433 $26.14 3,241,657
Equity compensation plans not approved by security holders . . . . . . . . . . . . . . . . . . . . . . . . . . . — — —
Total . . . . . . . . . . . . . . . . . . . . . . . . . . . . . . . . . . . . . . . 2,078,433 $26.14 3,241,657
(1) Represents stock options that are outstanding or that are available for future issuance pursuant to the Carter’s, Inc. Amended and Restated Equity Incentive Plan.
Additional information called for by Item 12 is incorporated herein by reference to the definitive proxy statement referenced above in Item 10.
ITEM 13. CERTAIN RELATIONSHIPS AND RELATED TRANSACTIONS
The information called for by Item 13 is incorporated herein by reference to the definitive proxy statement referenced above in Item 10.
ITEM 14. PRINCIPAL ACCOUNTANT FEES AND SERVICES
The information called for by Item 14 is incorporated herein by reference to the definitive proxy statement referenced above in Item 10.

85
Form 10-K
PART IV
ITEM 15. EXHIBITS AND FINANCIAL STATEMENT SCHEDULES
Page
(A) 1. Financial Statements filed as part of this report . . . . . . . . . . . . . . . . . . . . . . . . . . . . . . . . . . . . . . 39 Report of Independent Registered Public Accounting Firm . . . . . . . . . . . . . . . . . . . . . . . . . . . . 40 Consolidated Balance Sheets at December 29, 2012 and December 31, 2011 . . . . . . . . . . . . . . 41
Consolidated Statements of Operations for the fiscal years ended December 29, 2012,
December 31, 2011, and January 1, 2011 . . . . . . . . . . . . . . . . . . . . . . . . . . . . . . . . . . . . . . . . . 42
Consolidated Statements of Comprehensive Income for the fiscal years ended December 29,
2012, December 31, 2011, and January 1, 2011 . . . . . . . . . . . . . . . . . . . . . . . . . . . . . . . . . . . . 43
Consolidated Statements of Cash Flows for the fiscal years ended December 29, 2012,
December 31, 2011, and January 1, 2011 . . . . . . . . . . . . . . . . . . . . . . . . . . . . . . . . . . . . . . . . . 44
Consolidated Statements of Changes in Stockholders’ Equity for the fiscal years ended
December 29, 2012, December 31, 2011, and January 1, 2011 . . . . . . . . . . . . . . . . . . . . . . . . 45 Notes to Consolidated Financial Statements . . . . . . . . . . . . . . . . . . . . . . . . . . . . . . . . . . . . . . . . . 46
2. Financial Statement Schedules: None
(B) Exhibits:
Exhibit Number Description of Exhibits
3.1 Certificate of Incorporation of Carter’s, Inc., as amended on May 12, 2006. Incorporated by reference to Carter’s, Inc.’s Annual Report on Form 10-K filed on February 28, 2007.
3.2 Amended and Restated By-laws of Carter’s, Inc. Incorporated by reference to Carter’s, Inc. Annual Report on Form 10-K filed on February 29, 2012.
4.1 Specimen Certificate of Common Stock. Incorporated by reference to Carter’s, Inc.’s Registration Statement on Form S-1 (No. 333-98679) filed on October 10, 2003.
10.1 Second Amended and Restated Credit Agreement dated as of August 31, 2012, among The William Carter Company, as U.S. borrower, The Genuine Canadian Corp., as Canadian borrower, Bank of America, N.A., as Administrative Agent, U.S. Dollar Facility Swing Line Lender, U.S. Dollar Facility L/C Issuer and Collateral Agent, Bank of America, N.A., Canada Branch, as Canadian Agent, Multicurrency Facility Swing Line Lender and as a Multicurrency Facility L/C Issuer, JPMorgan Chase Bank, N.A., as Syndication Agent, Royal Bankof Canada, SunTrust Bank and U.S. Bank National Association, as Co-Documentation Agents and Merrill Lynch, Pierce, Fenner & Smith Incorporated, as Sole Lead Arranger and Sole Bookrunning Manager, and certain other lenders party thereto. Incorporated by reference to Carter’s, Inc. Current Report on Form 8-K filed on September 4, 2012.
10.2 Amended and Restated Severance Agreement between The William Carter Company and Michael D. Casey, dated as of March 2, 2011. Incorporated by reference to Carter’s, Inc.’s Annual Report on Form 10-K filed on March 2, 2011.
10.3 Severance Agreement between The William Carter Company and Lisa A. Fitzgerald, dated as of March 2, 2011. Incorporated by reference to Carter’s, Inc.’s Annual Report on Form 10-K filed on March 2, 2011.
10.4 Amended and Restated Severance Agreement between The William Carter Company and Brian J. Lynch, dated as of March 2, 2011. Incorporated by reference to Carter’s, Inc.’s Annual Report on Form 10-K filed on March 2, 2011.

86
Exhibit Number Description of Exhibits
10.5 Amended and Restated Severance Agreement between Carter’s Retail, Inc. and James C. Petty, dated as of March 2, 2011. Incorporated by reference to Carter’s, Inc.’s Annual Report on Form 10-K filed on March 2, 2011.
10.6 Amended and Restated Severance Agreement between The William Carter Company and Richard F. Westenberger, dated as of March 2, 2011. Incorporated by reference to Carter’s, Inc.’s Annual Report on Form 10-K filed on March 2, 2011.
10.7 Amended and Restated Equity Incentive Plan. Incorporated by reference to Carter’s, Inc.’s Schedule 14A filed on April 5, 2011.
10.8 Lease Agreement dated February 16, 2001 between The William Carter Company and Proscenium, L.L.C. Incorporated by reference to The William Carter Company’s Registration Statement filed on Form S-4 (No. 333-72790) on November 5, 2001.
10.9 Amended and Restated Stockholders Agreement dated as of August 15, 2001 among Carter’s, Inc. and the stockholders of Carter’s, Inc., as amended. Incorporated by reference to Carter’s, Inc.’s Registration Statement on Form S-1 (No. 333-98679) filed on October 10, 2003.
10.10 Amended and Restated Annual Incentive Compensation Plan. Incorporated by reference to Carter’s, Inc.’s Schedule 14A filed on April 5, 2011.
10.11 Fourth Amendment dated December 21, 2004 to the Lease Agreement dated February 16, 2001, as amended by that certain First Lease Amendment dated as of May 31, 2001, by that certain Second Amendment dated as of July 26, 2001, and by that certain Third Amendment dated December 3, 2001, between The William Carter Company and The Manufacturers Life Insurance Company (USA). Incorporated by reference to Carter’s, Inc.’s Annual Report on Form 10-K filed on March 16, 2005.
10.12 Fifth Amendment dated November 4, 2010 to the Lease Agreement dated February 16, 2001, between The William Carter Company and John Hancock Life Insurance Company (USA), as amended by that certain First Lease Amendment dated as of May 31, 2001, by that certain Second Amendment dated as of July 26, 2001, by that certain Third Amendment dated December 3, 2001, between The William Carter Company and The Manufacturers Life Insurance Company (USA), and by that certain Fourth Amendment dated December 21, 2004. Incorporated by reference to Carter’s, Inc.’s Annual Report on Form 10-K filed on March 2, 2011.
10.13 Sixth Amendment dated November 15, 2010 to the Lease Agreement dated February 16, 2001, as amended by that certain First Lease Amendment dated as of May 31, 2001, by that certain Second Amendment dated as of July 26, 2001, by that certain Third Amendment dated December 3, 2001, between The William Carter Company and The Manufacturers Life Insurance Company (USA), by that certain Fourth Amendment dated December 21, 2004, and by that certain Fifth Amendment dated November 4, 2010 between The William Carter Company and John Hancock Life Insurance Company (USA). Incorporated by reference to Carter’s, Inc.’s Annual Report on Form 10-K filed on March 2, 2011.
10.14 The William Carter Company Severance plan, dated as of March 1, 2009. Incorporated by reference to Carter’s, Inc.’s Annual Report on Form 10-K filed on March 2, 2011.
10.15 The William Carter Company Deferred Compensation Plan, dated as of November 10, 2010. Incorporated by reference to Carter’s, Inc.’s Annual Report on Form 10-K filed on March 2, 2011.
87
Form 10-K
Exhibit Number Description of Exhibits
10.16 Lease Agreement dated March 29, 2012 between The William Carter Company and Duke Secured Financing 2009-1 ALZ, LLC. Incorporated by reference to Carter’s, Inc. Quarterly Report on Form 10-Q filed on April 27, 2012.
10.17 Lease Agreement dated December 14, 2012 between The William Carter Company and Phipps Tower Associates, LLC. & Lease Termination Agreement dated December 14, 2012 between The William Carter Company and John Hancock Life Insurance Company (U.S.A). Incorporated by reference to Carter’s, Inc. Current Report on Form 8-K filed on December 14, 2012.
21 Subsidiaries of Carter’s, Inc.23 Consent of Independent Registered Public Accounting Firm.31.1 Rule 13a-15(e)/15d-15(e) and 13a-15(f)/15d-15(f) Certification.31.2 Rule 13a-15(e)/15d-15(e) and 13a-15(f)/15d-15(f) Certification.32 Section 1350 Certification.

88
SIGNATURES
Pursuant to the requirements of Section 13 or 15(a) of the Securities Exchange Act of 1934, the Registrant has duly caused this report to be signed on their behalf by the undersigned, thereunto duly authorized.
CARTER’S, INC.
/s/ Michael D. casey
Michael D. CaseyChief Executive Officer
Date: February 27, 2013
Pursuant to the requirements of the Securities Exchange Act of 1934, this report has been signed below by the following persons on behalf of the Registrant and in the capacities and on the dates indicated.
Name Title Date
/s/ Michael D. casey Chairman and Chief Executive Officer(Principal Executive Officer)
February 27, 2013Michael D. Casey
/s/ RichaRD F. WestenbeRgeR Executive Vice President and Chief Financial Officer (Principal Financial and Accounting Officer)
February 27, 2013 Richard F. Westenberger
/s/ aMy WooDs bRinkley Director
February 27, 2013 Amy Woods Brinkley
/s/ Vanessa J. castagna Director
February 27, 2013 Vanessa J. Castagna
/s/ a. bRuce cleVeRly Director
February 27, 2013 A. Bruce Cleverly
/s/ JeVin s. eagle Director
February 27, 2013 Jevin S. Eagle
/s/ Paul Fulton Director
February 27, 2013 Paul Fulton
/s/ WilliaM J. MontgoRis Director
February 27, 2013 William J. Montgoris
/s/ DaViD PulVeR Director
February 27, 2013 David Pulver
/s/ John R. Welch Director
February 27, 2013 John R. Welch
/s/ thoMas e. WhiDDon Director
February 27, 2013 Thomas E. Whiddon

89
Form 10-K
Exhibit 31.1
CERTIFICATION
I, Michael D. Casey, certify that:
1. I have reviewed this annual report on Form 10-K of Carter’s, Inc.;
2. Based on my knowledge, this report does not contain any untrue statement of a material fact or omit to state a material fact necessary to make the statements made, in light of the circumstances under which such statements were made, not misleading with respect to the period covered by this report;
3. Based on my knowledge, the financial statements, and other financial information included in this report, fairly present in all material respects the financial condition, results of operations and cash flows of the registrant as of, and for, the periods presented in this report;
4. The registrant’s other certifying officer and I are responsible for establishing and maintaining disclosure controls and procedures (as defined in Exchange Act Rules 13a-15(e) and 15d-15(e)) and internal control over financial reporting (as defined in Exchange Act Rules 13a-15(f) and 15d-15(f)) for the registrant and have:
(a) Designed such disclosure controls and procedures, or caused such disclosure controls and procedures to be designed under our supervision, to ensure that material information relating to the registrant, including its consolidated subsidiaries, is made known to us by others within those entities, particularly during the period in which this report is being prepared;
(b) Designed such internal control over financial reporting, or caused such internal control over financial reporting to be designed under our supervision, to provide reasonable assurance regarding the reliability of financial reporting and the preparation of financial statements for external purposes in accordance with generally accepted accounting principles;
(c) Evaluated the effectiveness of the registrant’s disclosure controls and procedures and presented in this report our conclusions about the effectiveness of the disclosure controls and procedures, as of the end of the period covered by this report based on such evaluation; and
(d) Disclosed in this report any change in the registrant’s internal control over financial reporting that occurred during the registrant’s most recent fiscal quarter (the registrant’s fourth fiscal quarter in the case of an annual report) that has materially affected, or is reasonably likely to materially affect, the registrant’s internal control over financial reporting; and
5. The registrant’s other certifying officer and I have disclosed, based on our most recent evaluation of internal control over financial reporting, to the registrant’s auditors and the audit committee of the registrant’s board of directors (or persons performing the equivalent functions):
(a) All significant deficiencies and material weaknesses in the design or operation of internal control over financial reporting which are reasonably likely to adversely affect the registrant’s ability to record, process, summarize and report financial information; and
(b) Any fraud, whether or not material, that involves management or other employees who have a significant role in the registrant’s internal control over financial reporting.
Date: February 27, 2013 /s/ Michael D. casey
Michael D. CaseyChief Executive Officer

90
Exhibit 31.2
CERTIFICATION
I, Richard F. Westenberger, certify that:
1. I have reviewed this annual report on Form 10-K of Carter’s, Inc.;
2. Based on my knowledge, this report does not contain any untrue statement of a material fact or omit to state a material fact necessary to make the statements made, in light of the circumstances under which such statements were made, not misleading with respect to the period covered by this report;
3. Based on my knowledge, the financial statements, and other financial information included in this report, fairly present in all material respects the financial condition, results of operations and cash flows of the registrant as of, and for, the periods presented in this report;
4. The registrant’s other certifying officer and I are responsible for establishing and maintaining disclosure controls and procedures (as defined in Exchange Act Rules 13a-15(e) and 15d-15(e)) and internal control over financial reporting (as defined in Exchange Act Rules 13a-15(f) and 15d-15(f)) for the registrant and have:
(a) Designed such disclosure controls and procedures, or caused such disclosure controls and procedures to be designed under our supervision, to ensure that material information relating to the registrant, including its consolidated subsidiaries, is made known to us by others within those entities, particularly during the period in which this report is being prepared;
(b) Designed such internal control over financial reporting, or caused such internal control over financial reporting to be designed under our supervision, to provide reasonable assurance regarding the reliability of financial reporting and the preparation of financial statements for external purposes in accordance with generally accepted accounting principles;
(c) Evaluated the effectiveness of the registrant’s disclosure controls and procedures and presented in this report our conclusions about the effectiveness of the disclosure controls and procedures, as of the end of the period covered by this report based on such evaluation; and
(d) Disclosed in this report any change in the registrant’s internal control over financial reporting that occurred during the registrant’s most recent fiscal quarter (the registrant’s fourth fiscal quarter in the case of an annual report) that has materially affected, or is reasonably likely to materially affect, the registrant’s internal control over financial reporting; and
5. The registrant’s other certifying officer and I have disclosed, based on our most recent evaluation of internal control over financial reporting, to the registrant’s auditors and the audit committee of the registrant’s board of directors (or persons performing the equivalent functions):
(a) All significant deficiencies and material weaknesses in the design or operation of internal control over financial reporting which are reasonably likely to adversely affect the registrant’s ability to record, process, summarize and report financial information; and
(b) Any fraud, whether or not material, that involves management or other employees who have a significant role in the registrant’s internal control over financial reporting.
Date: February 27, 2013 /s/ RichaRD F. WestenbeRgeR
Richard F. WestenbergerChief Financial Officer

91
Form 10-K
Exhibit 32
CERTIFICATION
Each of the undersigned in the capacity indicated hereby certifies that, to his knowledge, this Annual Report on Form 10-K for the fiscal year ended December 29, 2012 fully complies with the requirements of Section 13(a) or 15(d) of the Securities Exchange Act of 1934, and the information contained in this Report fairly presents, in all material respects, the financial condition and results of operations of Carter’s, Inc.
Date: February 27, 2013 /s/ Michael D. casey
Michael D. CaseyChief Executive Officer
Date: February 27, 2013 /s/ RichaRD F. WestenbeRgeR
Richard F. WestenbergerChief Financial Officer
The foregoing certifications are being furnished solely pursuant to 18 U.S.C. § 1350 and are not being filed as part of the Annual Report on Form 10-K or as a separate disclosure document.

92
RECONCILIATION OF NON-GAAP FINANCIAL MEASUREMENTS
In addition to presenting results prepared in accordance with generally accepted accounting principles (or “GAAP”), the Company has provided adjusted, non-GAAP financial measurements that present gross margin, SG&A, operating income, net income, and net income per diluted share, excluding the following items:
Fiscal year ended December 29, 2012
(dollars in millions, except earnings per share) SG&AOperating
IncomeNet
IncomeDiluted
EPS
As reported (GAAP): . . . . . . . . . . . . . . . . . . . . . . . . . . . . . . . . . . . . . . . $713.2 $262.0 $161.2 $2.69Shelton office consolidation costs (a) . . . . . . . . . . . . . . . . . . . . . . . . . . . (6.4) 6.4 4.0 0.07Revaluation of contingent consideration (b) . . . . . . . . . . . . . . . . . . . . . . (3.6) 3.6 3.6 0.06Facility closure costs – Hogansville DC (c) . . . . . . . . . . . . . . . . . . . . . . (3.1) 3.1 1.9 0.03
As adjusted: . . . . . . . . . . . . . . . . . . . . . . . . . . . . . . . . . . . . . . . . . . . . . . $700.1 $275.1 $170.7 $2.85
Fiscal year ended December 31, 2011
(dollars in millions, except earnings per share)Gross
Margin SG&AOperating
IncomeNet
IncomeDiluted
EPS
As reported (GAAP): . . . . . . . . . . . . . . . . . . . . . . . . . . . . . . $692.3 $542.1 $187.5 $114.0 $1.94Amortization of fair value step-up of inventory (d) . . . . . 6.7 — 6.7 4.8 0.08Revaluation of contingent consideration (b) . . . . . . . . . . . — (2.5) 2.5 2.5 0.04Professional fees/other expenses (e) . . . . . . . . . . . . . . . . . . — (3.0) 3.0 1.9 0.03
As adjusted: . . . . . . . . . . . . . . . . . . . . . . . . . . . . . . . . . . . . . $699.0 $536.6 $199.7 $123.2 $2.09
(a) Costs related to Shelton, CT office consolidation, announced in the fourth quarter of fiscal 2012.
(b) Revaluation of contingent consideration liability associated with the Company’s June 2011 acquisition of Bonnie Togs.
(c) Costs related to the closure of a distribution facility located in Hogansville, GA, announced in the first quarter of fiscal 2012.
(d) Expense related to the amortization of the fair value step-up for Bonnie Togs inventory acquired.
(e) Professional service fees and other expenses associated with the acquisition of Bonnie Togs.
The adjusted non-GAAP financial information is not necessarily indicative of the Company’s future condition or results of operations. These adjustments, which the Company does not believe to be indicative of on-going business trends, are excluded from the above calculations to allow a more comparable evaluation and analysis of historical trends. The adjusted, non-GAAP financial measurements included in this Annual Report should not be considered as alternative to gross margin, SG&A, operating income, net income, or earnings per share, or to any other measurement of performance derived from GAAP.
There were no adjusting items to the reported GAAP results for the fiscal year ended January 1, 2011.

Proxy
Notice of 2013 Annual Meeting of Shareholders and
Proxy Statement


Proxy
April 4, 2013
Dear Shareholder,
It is my pleasure to invite you to attend our 2013 Annual Meeting of Shareholders on May 9, 2013. The meeting will be held at 8:00 a.m. at our offices located at 1170 Peachtree Street NE, 6th Floor, Atlanta, Georgia 30309.
The attached Notice of the 2013 Annual Meeting of Shareholders and Proxy Statement describe the formal business to be conducted at the meeting. Whether or not you plan to attend the Annual Meeting, your shares can be represented if you promptly submit your voting instructions by telephone, over the internet, or by completing, signing, dating, and returning your proxy card in the enclosed envelope.
On behalf of the Board of Directors and Leadership Team of Carter’s, Inc., thank you for your continued support.
Sincerely,
Michael D. Casey Chairman and Chief Executive Officer


Proxy
1170 Peachtree Street NE, Suite 900 Atlanta, Georgia 30309
Tel: (404) 745-2700 Fax: (404) 892-3079
NOTICE OF 2013 ANNUAL MEETING OF SHAREHOLDERS
Notice is hereby given that the 2013 Annual Meeting of Shareholders of Carter’s, Inc. (the “Annual Meeting”) will be held at 8:00 a.m. on May 9, 2013 at our offices located at 1170 Peachtree Street NE, 6th Floor, Atlanta, Georgia 30309. The business matters for the Annual Meeting are as follows:
1) The election of three Class I Directors;
2) An advisory approval of executive compensation;
3) The ratification of the appointment of PricewaterhouseCoopers LLP as the Company’s independent registered public accounting firm for fiscal 2013; and
4) Any other business that may properly come before the meeting.
Shareholders of record at the close of business on March 26, 2013 are entitled to receive notice of, attend, and vote at the Annual Meeting. Your vote is very important. Whether or not you plan to attend the Annual Meeting, to ensure that your shares are represented at the Annual Meeting, please complete, sign, date, and return the proxy card in the envelope provided or submit your voting instructions by telephone or over the internet.
If you plan to attend the Annual Meeting and are a registered shareholder, please bring the invitation attached to your proxy card. If your shares are registered in the name of a bank or your broker, please bring your bank or brokerage statement showing your beneficial ownership with you to the Annual Meeting or request an invitation by writing to me at the address set forth above.
Important Notice Regarding the Availability of Proxy Materials for the 2013 Annual Meeting of Shareholders of Carter’s, Inc. to be held on May 9, 2013:
The proxy materials and the Annual Report to Shareholders are available at http://www.carters.com/annuals.
By order of the Board of Directors,
Irina Braude Deputy Counsel and Secretary April 4, 2013

PROXY STATEMENT
TABLE OF CONTENTS
Page
General Information About the Proxy Materials and the Annual Meeting . . . . . . . . . . . . . . . . . . . . . . . 1
Board of Directors and Corporate Governance Information . . . . . . . . . . . . . . . . . . . . . . . . . . . . . . . . . . 5
Proposal Number One – Election of Class I Directors . . . . . . . . . . . . . . . . . . . . . . . . . . . . . . . . . . . . . . . . 12
Compensation of Directors . . . . . . . . . . . . . . . . . . . . . . . . . . . . . . . . . . . . . . . . . . . . . . . . . . . . . . . . . . . . . . 13
Executive Officers’ Biographical Information and Experience . . . . . . . . . . . . . . . . . . . . . . . . . . . . . . . . . 14
Compensation Discussion and Analysis . . . . . . . . . . . . . . . . . . . . . . . . . . . . . . . . . . . . . . . . . . . . . . . . . . . . 16
Compensation Committee Report . . . . . . . . . . . . . . . . . . . . . . . . . . . . . . . . . . . . . . . . . . . . . . . . . . . . . . . . 25
Fiscal 2012 Summary Compensation Table . . . . . . . . . . . . . . . . . . . . . . . . . . . . . . . . . . . . . . . . . . . . . . . . . 26
Fiscal 2012 Grants of Plan-Based Awards . . . . . . . . . . . . . . . . . . . . . . . . . . . . . . . . . . . . . . . . . . . . . . . . . . 28
Option Exercises and Stock Vested in Fiscal 2012 . . . . . . . . . . . . . . . . . . . . . . . . . . . . . . . . . . . . . . . . . . . 29
Outstanding Equity Awards at Fiscal 2012 Year-End . . . . . . . . . . . . . . . . . . . . . . . . . . . . . . . . . . . . . . . . . 30
Securities Ownership of Beneficial Owners, Directors, and Executive Officers . . . . . . . . . . . . . . . . . . . 33
Equity Compensation Plan Information . . . . . . . . . . . . . . . . . . . . . . . . . . . . . . . . . . . . . . . . . . . . . . . . . . . 34
Proposal Number Two – Advisory Vote on Approval of Executive Compensation . . . . . . . . . . . . . . . . 35
Transactions with Related Persons, Promoters, and Certain Control Persons . . . . . . . . . . . . . . . . . . . . 35
Audit Committee Report . . . . . . . . . . . . . . . . . . . . . . . . . . . . . . . . . . . . . . . . . . . . . . . . . . . . . . . . . . . . . . . . 36
Proposal Number Three – Ratification of Independent Registered Public Accounting Firm . . . . . . . . 37
Other Matters . . . . . . . . . . . . . . . . . . . . . . . . . . . . . . . . . . . . . . . . . . . . . . . . . . . . . . . . . . . . . . . . . . . . . . . . . 38
Appendix A: 2012 Retail Survey Participant List . . . . . . . . . . . . . . . . . . . . . . . . . . . . . . . . . . . . . . . . . . . . A-1

1
Proxy
GENERAL INFORMATION ABOUT THE PROXY MATERIALS AND THE ANNUAL MEETING
Why am I receiving this proxy statement?
The Board of Directors of Carter’s, Inc. (“we,” “us,” “our,” “Carter’s,” or the “Company”) is soliciting proxies for our 2013 Annual Meeting of Shareholders on May 9, 2013 (the “Annual Meeting”). This proxy statement and accompanying proxy card are being mailed on or about April 9, 2013 to shareholders of record as of March 26, 2013 (“record date”).
You are receiving this proxy statement because you owned shares of Carter’s common stock on the record date and are, therefore, entitled to vote at the Annual Meeting. By use of a proxy, you can vote regardless of whether or not you attend the Annual Meeting. This proxy statement provides information on the matters on which the Company’s Board of Directors (the “Board”) would like you to vote so that you can make an informed decision.
What is the purpose of the Annual Meeting?
The purpose of the Annual Meeting is to address the following business matters:
1. The election of three Class I Directors (see page 12);
2. An advisory approval of executive compensation (the “say-on-pay” vote) (see page 35);
3. The ratification of the appointment of PricewaterhouseCoopers LLP (“PwC”) as the Company’s independent registered public accounting firm for fiscal 2013 (see page 37); and
4. All other business that may properly come before the meeting.
Who is asking for my vote?
The Company is soliciting your proxy on behalf of the Board. The Company is paying for the costs of this solicitation and proxy statement.
Who can attend the Annual Meeting?
All shareholders of record, or their duly appointed proxies, may attend the Annual Meeting. As of the record date, there were 59,375,511 shares of common stock issued and outstanding.
What are my voting rights?
Each share of common stock is entitled to one vote on each matter submitted to shareholders at the Annual Meeting.
What is the difference between holding shares as a shareholder of record and as a beneficial owner?
If your shares are registered directly in your name with the Company’s transfer agent, American Stock Transfer and Trust Company, you are considered the shareholder of record for these shares. As the shareholder of record, you have the right to grant your voting proxy directly to persons listed on your proxy card or vote in person at the Annual Meeting.

2
If your shares are held in a brokerage account or by another nominee, you are considered the beneficial owner of shares held “in street name.” These proxy materials are being forwarded to you together with a voting instruction card. As a beneficial owner, you have the right to direct your broker, trustee, or nominee how to vote, and you are also invited to attend the Annual Meeting. Because you are a beneficial owner and not the shareholder of record, you may not vote your shares in person at the Annual Meeting unless you obtain a proxy from the broker, trustee, or nominee that holds your shares. Your broker, trustee, or nominee should have provided directions for you to instruct the broker, trustee, or nominee on how to vote your shares.
What is a broker non-vote?
If you are a beneficial owner whose shares are held of record by a broker and you do not provide voting instructions to your broker, your shares will not be voted on any proposal on which the broker does not have discretionary authority to vote. This is called a “broker non-vote.” Your broker only has discretionary authority to vote on Proposal Number Three. Therefore, your broker will not have discretion to vote on Proposal Number One and Proposal Number Two unless you specifically instruct your broker on how to vote your shares by returning your completed and signed voting instruction card.
What are my choices when casting a vote with respect to the election of Class I Directors, and what vote is needed to elect the Director nominees?
In voting on the election of Class I Directors (Proposal Number One), shareholders may:
1. vote for any of the nominees,
2. vote against any of the nominees, or
3. abstain from voting on any of the nominees.
Pursuant to our by-laws and our Corporate Governance Principles, the nominees who receive a majority of the votes cast at the Annual Meeting will be elected as Class I Directors. This means that the number of votes cast “for” a Director nominee must exceed the number of votes cast “against” that nominee and votes to “abstain” with respect to that nominee. Broker non-votes and votes to abstain on Proposal Number One will be counted toward the quorum, and abstentions will have the practical effect of a vote “against” a Director nominee.
What are my choices when casting an advisory vote on approval of executive compensation, commonly referred to as the “say-on-pay” vote, and what vote is needed to approve this Proposal?
In voting on executive compensation (Proposal Number Two), shareholders may:
1. vote for the approval of compensation of the Company’s named executive officers as described in this proxy statement,
2. vote against the approval of compensation of the Company’s named executive officers as described in this proxy statement, or
3. abstain from voting on compensation of the Company’s named executive officers as described in this proxy statement.
Because this Proposal Number Two asks for a non-binding, advisory vote, there is no required vote that would constitute approval. We value the opinions expressed by our shareholders in this advisory vote, and our Compensation Committee will consider the outcome of the vote when designing our compensation programs and making future compensation decisions for our named executive officers. Abstentions and broker non-votes, if any, will not have any impact on this advisory vote.

3
Proxy
What are my choices when voting on the ratification of the appointment of PwC as the Company’s independent registered public accounting firm for fiscal 2013, and what vote is needed to approve this Proposal?
In voting on the ratification of PwC (Proposal Number Three), shareholders may:
1. vote to ratify PwC’s appointment,
2. vote against ratifying PwC’s appointment, or
3. abstain from voting on ratifying PwC’s appointment.
The approval of Proposal Number Three requires the affirmative vote of a majority of the votes properly cast at our Annual Meeting. Abstentions will not affect the outcome of this proposal. A broker or other nominee will generally have discretionary authority to vote on this proposal because it is considered a routine matter, and, therefore, we do not expect broker non-votes with respect to this proposal.
What constitutes a quorum?
A quorum is the minimum number of shares required to be present to transact business at the Annual Meeting. Pursuant to the Company’s by-laws, the presence at the Annual Meeting, in person, by proxy, or by remote communication, of the holders of at least a majority of the shares entitled to be voted will constitute a quorum. Broker non-votes and abstentions will be counted as shares that are present at the meeting for purposes of determining a quorum. If a quorum is not present, the meeting will be adjourned until a quorum is obtained.
How does the Board recommend that I vote?
The Board recommends a vote:
FOR the election of the nominees for Class I Directors (Proposal Number One);
FOR the approval of executive compensation of the Company’s named executive officers as described in this proxy statement (Proposal Number Two); and
FOR the ratification of the appointment of PwC (Proposal Number Three).
How do I vote?
If you are a shareholder of record, you may vote in one of four ways. First, you may vote by mail by signing, dating, and mailing your proxy card in the enclosed envelope. Second, you may vote in person at the Annual Meeting. Third, you may vote over the internet by completing the voting instruction form found at www.proxyvote.com. You will need your proxy card when voting over the internet. Fourth, you may vote by touch-tone telephone by calling 1-800-690-6903.
If your shares are held in a brokerage account or by another nominee, these proxy materials are being forwarded to you together with a voting instruction card. Follow the instructions on the voting instruction card in order to vote your shares by proxy or in person.
Can I change my vote after I return my proxy card?
Yes. Even after you have submitted your proxy card, you may change your vote at any time before your proxy votes your shares by submitting written notice of revocation to Irina Braude, General Counsel and Secretary of Carter’s, Inc., at the Company’s address set forth in the Notice of the Annual Meeting, or by submitting another proxy card bearing a later date. Alternatively, if you have voted by telephone or over the internet, you may change your vote by calling 1-800-690-6903 and following the instructions. The powers granted by you to the proxy holders will be suspended if you attend the Annual Meeting in person, although attendance at the Annual Meeting will not by itself revoke a previously granted proxy. If you hold your shares through a broker or other custodian and would like to change your voting instructions, please review the directions provided to you by that broker or custodian.
May I vote confidentially?
Yes. Our policy is to keep your individual votes confidential, except as appropriate to meet legal requirements, to allow for the tabulation and certification of votes, or to facilitate proxy solicitation.

4
Who will count the votes?
A representative of Broadridge Financial Solutions, Inc. will count the votes and act as the inspector of election for the Annual Meeting.
What happens if additional matters are presented at the Annual Meeting?
As of the date of this proxy statement, the Board knows of no matters other than those set forth herein that will be presented for determination at the Annual Meeting. If, however, any other matters properly come before the Annual Meeting and call for a vote of shareholders, the Board intends proxies to be voted in accordance with the judgment of the proxy holders.
Where can I find the voting results of the Annual Meeting?
We intend to announce preliminary voting results at the Annual Meeting and publish final results in our current report on Form 8-K within four business days after the Annual Meeting.
What is “householding” of the Annual Meeting materials?
The Securities and Exchange Commission (the “SEC”) has adopted rules that permit companies and intermediaries, such as brokers, to satisfy delivery requirements for proxy statements with respect to two or more shareholders sharing the same address by delivering a single proxy statement to those shareholders. This process, which is commonly referred to as “householding,” potentially provides extra convenience for shareholders and cost savings for companies. The Company and some brokers “household” proxy materials, delivering a single proxy statement and annual report to multiple shareholders sharing an address unless contrary instructions have been received from the affected shareholders. If, at any time, you no longer wish to participate in householding and would prefer to receive a separate proxy statement and annual report, or if you are receiving multiple copies of the proxy statement and annual report and wish to receive only one, please notify your broker if your shares are held in a brokerage account, or the Company if you hold shares registered directly in your name. You can notify the Company by sending a written request to Ms. Braude at the Company’s address set forth in the Notice of the Annual Meeting or by calling us at (404) 745-2889.
How may I obtain a copy of the Company’s Annual Report?
A copy of our fiscal 2012 Annual Report accompanies this proxy statement and is available at http://www.carters.com/annuals. Shareholders may also obtain a free copy of our Annual Report by sending a request in writing to Ms. Braude at the Company’s address set forth in the Notice of the Annual Meeting.
When are shareholder proposals due for consideration in next year’s proxy statement or at next year’s annual meeting?
Any proposals to be considered for inclusion in next year’s proxy statement must be submitted in writing to Ms. Braude at the Company’s address set forth in the Notice of the Annual Meeting, and must be received prior to the close of business on December 5, 2013. There are additional requirements under our by-laws and the proxy rules to present a proposal, including continuing to own a minimum number of shares of our stock until next year’s annual meeting and appearing in person at the annual meeting to explain your proposal. Shareholders who wish to make a proposal to be considered at next year’s annual meeting, other than proposals to be considered for inclusion in next year’s proxy statement, must notify the Company in the same manner specified above no earlier than January 9, 2014 and no later than February 8, 2014.
Who can help answer my questions?
If you have any questions about the Annual Meeting or how to submit or revoke your proxy, or to request an invitation to the Annual Meeting, contact Ms. Braude at the Company’s address set forth in the Notice of the Annual Meeting or by calling us at (404) 745-2889.

5
Proxy
BOARD OF DIRECTORS AND CORPORATE GOVERNANCE INFORMATION
Board of Directors
The Board believes that each Director, including the nominees for election as Class I Directors (Proposal Number One), has valuable skills and experiences that, taken together, provide the Company with the variety and depth of knowledge, judgment, and strategic vision necessary to provide effective oversight of the Company’s business operations. Our Directors have extensive experience in different fields, including apparel and retail (Ms. Castagna and Messrs. Casey, Eagle, Fulton, Pulver, Welch, and Whiddon); brand marketing (Ms. Brinkley, Ms. Castagna, and Messrs. Cleverly and Eagle); logistics and technology (Mr. Whiddon); global sourcing (Messrs. Eagle and Welch); and finance and accounting (Ms. Brinkley and Messrs. Casey, Montgoris, Pulver, and Whiddon).
The Board also believes that, as indicated in the following biographies, each Director has demonstrated significant leadership as chief executive officers (Ms. Castagna and Messrs. Casey, Eagle, and Pulver); division presidents (Ms. Brinkley and Messrs. Cleverly, Fulton, and Welch); and other senior executive officers (Ms. Brinkley and Messrs. Montgoris and Whiddon). In addition, many of our Directors have significant experience in the oversight of public companies due to his or her services as a Director of Carter’s and other companies.
Amy Woods Brinkley became a Director in February 2010. Ms. Brinkley is the Manager and Owner of AWB Consulting, LLC, which provides executive advising and risk management consulting services. Ms. Brinkley retired from Bank of America Corporation in 2009 after spending more than 30 years with the company. Ms. Brinkley served as its Chief Risk Officer from 2002 through mid-2009. Prior to 2002, Ms. Brinkley served as President of the company’s Consumer Products division and was responsible for the credit card, mortgage, consumer finance, telephone, and eCommerce businesses. Before that, Ms. Brinkley held positions of Executive Vice President and marketing executive overseeing the company’s Olympic sponsorship and its national rebranding and name change. Ms. Brinkley is currently a director of TD Bank Group and the Bank of America Charitable Foundation. She also serves as a trustee for the Princeton Theological Seminary and on the board of commissioners for the Carolinas Healthcare System.
Michael D. Casey became a Director in August 2008 and was named Chairman of the Board of Directors in August 2009. Mr. Casey joined the Company in 1993 as Vice President of Finance. Mr. Casey was named Senior Vice President of Finance in 1997, Senior Vice President and Chief Financial Officer in 1998, Executive Vice President and Chief Financial Officer in 2003, and Chief Executive Officer in 2008. Prior to joining the Company, Mr. Casey worked for Price Waterhouse LLP, a predecessor firm to PricewaterhouseCoopers LLP, from 1982 to 1993. Mr. Casey also serves as a director of National Vision, Inc.
Vanessa J. Castagna became a Director in November 2009. Ms. Castagna served as Executive Chairwoman of Mervyns, LLC from 2005 until early 2007. Ms. Castagna previously served as Chairwoman and Chief Executive Officer of JCPenney Stores, Catalog and Internet for J. C. Penney Company, Inc. from 2002 through 2004. While at JCPenney, Ms. Castagna also served as its Chief Operating Officer from 1990 to 2002. Prior to that, Ms. Castagna held various senior-level merchandising positions at Target, Walmart, and Marshall’s. Ms. Castagna is currently a director of Levi Strauss & Co. and serves on the board of trustees of Purdue University.
A. Bruce Cleverly became a Director in March 2008. Mr. Cleverly retired as President of Global Oral Care from Procter & Gamble Company/The Gillette Company in September 2007, a position he held since 2005. Mr. Cleverly joined The Gillette Company in 1975 as a Marketing Assistant and held positions of increasing responsibility in brand management and general management in the United States, Canada, and the United Kingdom. In 2001, Mr. Cleverly became President of Gillette’s worldwide Oral Care business. In October 2005, Mr. Cleverly became President of The Procter & Gamble Company’s Global Oral Care division. Mr. Cleverly is a director of Rain Bird Corporation and Shaser BioScience, Inc.

6
Jevin S. Eagle became a Director in July 2010. Mr. Eagle is the Chief Executive Officer and Director of DavidsTea Inc., a specialty tea retailer in the U.S. and Canada, which he joined in April 2012. Mr. Eagle previously held several senior leadership positions at Staples, Inc. from 2002 to 2012, serving most recently as Executive Vice President, Merchandising and Marketing. Prior to joining Staples, Mr. Eagle worked for McKinsey & Company, Inc. from 1994 to 2001 where he was a partner in McKinsey’s retail practice.
Paul Fulton became a Director in May 2002. Mr. Fulton retired as President of Sara Lee Corporation in 1993 after spending 34 years with the company. He is currently non-executive chairman of the board of directors of Bassett Furniture Industries, Inc. and a director of Premier Commercial Bank. Mr. Fulton was previously a director of Bank of America Corporation, where he served from 1993 to 2007; Lowe’s Companies, Inc., where he served from 1996 to 2007; and Sonoco Products Company, Inc., where he served from 1989 to 2005.
William J. Montgoris became a Director in August 2007. Mr. Montgoris retired as Chief Operating Officer of The Bear Stearns Companies, Inc. in 1999, a position he held since August 1993, after spending 20 years with the company. While at Bear Stearns, Mr. Montgoris also served as the company’s Chief Financial Officer from April 1987 until October 1996. Mr. Montgoris currently serves as the non-executive chairman of the board of directors of Stage Stores, Inc. and a director of OfficeMax Incorporated. Mr. Montgoris is also on the board of trustees of Colby College.
David Pulver became a Director in January 2002. Mr. Pulver has been a private investor for more than 25 years and is the President of Cornerstone Capital, Inc. Mr. Pulver was previously a director of Hearst-Argyle Television, Inc., where he served from 1997 through 2009 and Costco Wholesale Corporation, where he served from 1983 through 1993. Mr. Pulver currently serves as a trustee of Colby College and as a director of the Bladder Cancer Advocacy Network (BCAN). Mr. Pulver was a founder of The Children’s Place, Inc. and served as its Chairman and Co-Chief Executive Officer until 1982.
John R. Welch became a Director in February 2003. Mr. Welch retired as President of Mast Industries (Far East) Ltd., a leading global sourcing company, in April 2002 after spending 18 years with the company. Mr. Welch also served as Executive Vice President of Operations at Warnaco Knitwear, a division of Warnaco, Inc. from August 1978 to December 1983. Mr. Welch is currently a director of Brandot International Ltd.
Thomas E. Whiddon became a Director in August 2003. Mr. Whiddon retired as Executive Vice President-Logistics and Technology of Lowe’s Companies, Inc. in March 2003, a position he held since 2000. From 1996 to 2000, Mr. Whiddon served as Lowe’s Chief Financial Officer. Since his retirement, Mr. Whiddon has worked as a consultant, serving various companies in executive capacities on an interim basis. Mr. Whiddon is currently a director of Sonoco Products Company, Inc., Dollar Tree Stores, Inc., and BayCare Health System. Mr. Whiddon has been an Advisory Director of Berkshire Partners since October 2005 and previously served as a director of Bare Escentuals, Inc.
Board Leadership Structure
The Company’s Corporate Governance Principles provide that positions of Chairman of the Board of Directors and Chief Executive Officer may be combined if the non-management Directors determine it is in the best interest of the Company. In August 2009, the non-management Directors appointed Mr. Casey, who was the then-current Chief Executive Officer and a sitting Board member, as Chairman. The Board believes it is appropriate to continue to combine the positions of the Chairman and Chief Executive Officer. Mr. Casey has 19 years of management, finance, and administrative leadership experience at the Company. In addition, Mr. Casey has extensive knowledge of, and experience with, all other aspects of the Company’s business, including with its employees, customers, vendors, and shareholders. Having Mr. Casey serve as both Chairman and Chief Executive Officer helps promote unified leadership and direction for both the Board and management.

7
Proxy
In connection with Mr. Casey’s appointment as Chairman, the non-management Directors also created the position of Lead Independent Director and appointed Mr. Whiddon to serve in that role. The non-management Directors created the Lead Independent Director position to, among other things, ensure that the non-management Directors maintain proper oversight of management and Board process. The responsibilities of the Lead Independent Director include:
• servingasanadvisortotheChiefExecutiveOfficeronBoard,executivemanagement,andothersignificant matters;
• serving,asnecessary,asaliaisonbetweennon-managementDirectorsandtheChiefExecutiveOfficer;
• providingannualBoardassessmentandotherfeedbacktotheChiefExecutiveOfficer;
• advisingtheChiefExecutiveOfficerontheBoard’sinformationalneeds;
• consultingonBoardmeetingmaterials,schedules,andagendas;
• callingandpresidingoverexecutivesessionsofnon-managementDirectors;
• presidingatBoardmeetingsintheabsenceoftheChairman;and
• afterconsultationwiththeChiefExecutiveOfficer,communicatingwithmajorshareholdersorother interested parties, as appropriate.
Risk Oversight
The Company’s senior management is responsible for assessing, managing, and mitigating the Company’s strategic, financial, operational, and compliance risks, while the Board and its committees are responsible for overseeing management’s efforts in these areas. The Board receives updates from senior management on such risks at its Board meetings at least annually, and more frequently, as appropriate. The Board’s Audit Committee is responsible for overseeing the procedures and capabilities of the Company’s risk management program and gives particular attention to the Company’s financial risks. The Audit Committee receives regular updates from the Company’s risk management committee and senior management relating to the Company’s efforts in this area. The Board’s Compensation Committee considers the risks associated with the Company’s compensation policies and practices with respect to both executive compensation and compensation generally. Our Compensation Committee reviewed the Company’s compensation policies and practices to confirm that there are no risks arising from such compensation policies and practices that are reasonably likely to have a material adverse effect on the Company.
Board Meetings
Our Corporate Governance Principles require Carter’s to have at least four regularly scheduled Board meetings each year, and each Director is expected to attend each meeting. The Board met four times during fiscal 2012. In fiscal 2012, no Director participated in less than 75% of the aggregate number of all of the Board and applicable committee meetings. Although the Company does not have a policy regarding Director attendance at annual meetings, all Directors, with the exception of Mr. Cleverly, attended the Company’s annual meeting in fiscal 2012.
Executive Sessions
Executive sessions of non-management Directors are held at least four times a year. Any non-management Director can request that an additional executive session be scheduled. The Board’s Lead Independent Director presides at the executive sessions of non-management Directors.

8
Board Committees
Our Board has a standing Audit Committee, Compensation Committee, and Nominating and Corporate Governance Committee. The Board may also establish other committees to assist in the discharge of its responsibilities.
Audit Committee
The members of our Audit Committee are Ms. Brinkley and Messrs. Montgoris, Pulver, and Whiddon. Mr. Pulver serves as Chairman of the committee. During fiscal 2012, the Audit Committee held eleven meetings. The primary responsibilities of the Audit Committee include:
• oversightofthequalityandintegrityoftheconsolidatedfinancialstatements,includingtheaccounting, auditing, and reporting practices of the Company;
• oversightoftheCompany’sinternalcontrolsoverfinancialreporting;
• appointmentoftheindependentregisteredpublicaccountingfirmandoversightofitsperformance, including its qualifications and independence;
• oversightoftheCompany’scompliancewithlegalandregulatoryrequirements;and
• oversightoftheperformanceoftheCompany’sinternalauditfunction.
The Audit Committee operates pursuant to a written charter that addresses the requirements of the New York Stock Exchange’s (“NYSE”) listing standards. The charter is available in the Investor Relations section of our website at www.carters.com or in print by contacting Ms. Braude at the Company’s address set forth in the Notice of the Annual Meeting. The Board has determined that each member of the Audit Committee is independent and meets the financial literacy requirements set forth in the NYSE’s listing standards. The Board has also determined that each of Messrs. Montgoris, Pulver, and Whiddon is an “audit committee financial expert” as defined by the SEC.
The Audit Committee Report is included in this proxy statement on page 36.
Compensation Committee
The members of our Compensation Committee are Messrs. Cleverly, Eagle, Fulton, and Welch. Mr. Fulton serves as Chairman of the committee. During fiscal 2012, the Compensation Committee held five meetings. The primary responsibilities of the Compensation Committee include:
• establishingtheCompany’sphilosophy,policies,andstrategyrelativetoexecutivecompensation,including the mix of base salary and short-term and long-term incentive compensation within the context of stated guidelines for compensation relative to peer companies;
• evaluatingtheperformanceoftheChiefExecutiveOfficerandotherexecutiveofficersrelativetoapproved performance goals and objectives;
• settingthecompensationoftheChiefExecutiveOfficerandotherexecutiveofficersbaseduponanevaluation of their performance;
• assistingtheBoardindevelopingandevaluatingcandidatesforkeyexecutivepositionsandensuring a succession plan is in place for the Chief Executive Officer and other executive officers;
• evaluatingcompensationplans,policies,andprogramswithrespecttotheChiefExecutiveOfficer,other executive officers, and non-management Directors;
• monitoringandevaluatingbenefitprogramsfortheCompany’sChiefExecutiveOfficerandotherexecutive officers; and
• producinganannualreportonexecutivecompensationforinclusionintheCompany’sannualproxy statement. This year’s Compensation Committee Report is included in this proxy statement on page 25.

9
Proxy
The Compensation Committee operates pursuant to a written charter that addresses the requirements of the NYSE’s listing standards. The charter is available in the Investor Relations section of our website at www.carters.com or in print by contacting Ms. Braude at the Company’s address set forth in the Notice of the Annual Meeting. The Board has determined that each member of the Compensation Committee is independent as defined in the NYSE’s listing standards.
Compensation Committee Interlocks and Insider Participation
None of the members of our Compensation Committee serving during fiscal 2012 has been an officer or other employee of the Company. None of our executive officers has served as a member of the board of directors or compensation committee of any entity that has one or more executive officers serving on our Board.
Nominating and Corporate Governance Committee
The members of our Nominating and Corporate Governance Committee are Ms. Castagna and Messrs. Cleverly, Welch, and Whiddon. Mr. Welch serves as Chairman of the committee. During fiscal 2012, the Nominating and Corporate Governance Committee held four meetings. The primary responsibilities of the Nominating and Corporate Governance Committee include:
• identifyingandrecommendingcandidatesqualifiedtobecomeBoardmembers;
• recommendingDirectorsforappointmenttoBoardCommittees;and
• developingandrecommendingtotheBoardasetofcorporategovernanceprinciplesandmonitoring the Company’s compliance with and effectiveness of such principles.
The Nominating and Corporate Governance Committee operates pursuant to a written charter that addresses the requirements of the NYSE’s listing standards. The charter is available in the Investor Relations section of our website at www.carters.com or in print by contacting Ms. Braude at the Company’s address set forth in the Notice of the Annual Meeting. The Board has determined that each member of the Nominating and Corporate Governance Committee is independent as defined in the NYSE’s listing standards.
Consideration of Director Nominees
The Nominating and Corporate Governance Committee regularly assesses the appropriateness of the size of the Board of Directors. In the event that vacancies occur or are anticipated, the Committee will consider prospective nominees that come to its attention through current Board members, professional search firms, or certain shareholders. The Board believes that it is appropriate to limit the group of shareholders who can propose nominees due to time constraints on the Nominating and Corporate Governance Committee. The Committee will consider persons recommended by shareholders who hold more than 1% of our common stock for inclusion as nominees for election to the Board if the names of such persons are submitted to Ms. Braude at the Company’s address set forth in the Notice of the Annual Meeting. This submission must be made in writing and in accordance with our by-laws, including mailing the submission in a timely manner, share ownership at the time of the Annual Meeting, and including the nominee’s name, address, and qualifications for Board membership.
When evaluating a potential candidate for membership on the Board, the Committee considers each candidate’s skills and experience and assesses the needs of the Board and its committees at that point in time. Although the Committee does not have a formal policy on diversity, it believes that diversity is an important factor in determining the composition of the Board, and seeks to have Board members with diverse backgrounds, experiences, and points of view. In connection with its assessment of all prospective nominees, the Committee will determine whether to interview such prospective nominees, and if warranted, one or more members of the Committee, and others as appropriate, will interview such prospective nominees in person or by telephone. Once this evaluation is completed, if warranted, the Committee selects the nominees for election at the Annual Meeting.

10
Interested Party Communications
A shareholder or other interested party may submit a written communication to the Board, non-management Directors, or Lead Independent Director. The submission must be delivered to Ms. Braude at the Company’s address set forth in the Notice of the Annual Meeting.
The Board, non-management Directors, or Lead Independent Director may require the submitting shareholder to furnish such information as may be reasonably required or deemed necessary to sufficiently review and consider the submission of such shareholder.
Each submission will be forwarded, without editing or alteration, to the Board, non-management Directors, or Lead Independent Director, as appropriate, at, or prior to, the next scheduled meeting of the Board. The Board, non-management Directors, or Lead Independent Director, as appropriate, will determine, in their sole discretion, the method by which such submission will be reviewed and considered.
Corporate Governance Principles and Code of Ethics
The Company is committed to conducting its business with the highest level of integrity and maintaining the highest standards of corporate governance. Our Corporate Governance Principles and Code of Ethics provide the structure within which our Board and management operate the Company. The Company’s Code of Ethics applies to all Directors and Company employees, including the Company’s executive officers. Our Corporate Governance Principles and Code of Ethics are available on the Company’s website at www.carters.com or in print by contacting Ms. Braude at the Company’s address set forth in the Notice of the Annual Meeting.
Director Independence
The NYSE listing standards and the Company’s Corporate Governance Principles require a majority of the Company’s Directors to be independent from the Company and the Company’s management. For a Director to be considered independent, the Board must determine that the Director has no direct or indirect material relationship with the Company. The Board considers all relevant information provided by each Director regarding any relationships each Director may have with the Company or management. To assist it in making such independence determinations, the Board has established the following independence tests, which address all the specific independence tests of the NYSE’s listing standards. A Director will not be considered independent if:
• (a)theDirectoris,orwithinthelastthreeyearshasbeen,employedbytheCompany;or(b)animmediate family member of the Director is, or within the last three years has been, employed as an executive officer of the Company;
• theDirector,oranimmediatefamilymemberoftheDirector,hasreceived,duringanytwelve-month period within the last three years, direct compensation from the Company exceeding $120,000, other than Director or committee fees and pension or other forms of deferred compensation for prior service (provided such compensation is not contingent in any way on continued service);
• (a)theDirector,oranimmediatefamilymemberoftheDirector,isacurrentpartnerofafirmthat is the Company’s internal auditor or independent registered public accounting firm; (b) the Director is a current employee of such a firm; (c) the Director has an immediate family member who is a current employee of such a firm and who participates in the firm’s audit, assurance, or tax compliance (but not tax planning) practice; or (d) the Director, or an immediate family member of the Director, was, within the last three years (but is no longer), a partner or employee of such a firm and personally worked on the Company’s audit within that time;
• theDirector,oranimmediatefamilymemberoftheDirector,is,orwithinthelastthreeyearshasbeen, employed as an executive officer of another company where any of the Company’s present executive officers serve or served on that company’s compensation committee;

11
Proxy
• theDirectorisacurrentemployee,orhasanimmediatefamilymemberwhoisanexecutiveofficer,of another company that has made payments to, or receives payments from, the Company for property or services in an amount which, in any of the last three fiscal years, exceeds the greater of $1.0 million, or 2%, of such other company’s consolidated gross revenues;
• theDirector,oranimmediatefamilymemberoftheDirector,is,orwithinthelastthreeyearshasbeen, employed by a company that has a director who is an officer of the Company;
• theDirectorservesasanofficer,director,ortrustee,orasamemberofafundraisingorganizationor committee of a not-for-profit entity to which the Company made, in any of the last three fiscal years, contributions in excess of the greater of (i) $50,000, or (ii) 2% of the gross annual revenues or charitable receipts of such entity; or
• theDirectorisanexecutiveofficerofanothercompanythatisindebtedtotheCompany,ortowhich the Company is indebted, and the total amount of either company’s indebtedness to the other exceeds 1% of the total consolidated assets of such company.
Applying these standards, the Board has determined that all of our non-management Directors are independent.
12
PROPOSAL NUMBER ONE ELECTION OF CLASS I DIRECTORS
The Board proposes that the three Class I Director nominees be re-elected to the Board to serve until the annual meeting in 2016, or until his or her earlier resignation, death, or removal. In addition to the three Class I nominees, the Company’s current Class II and Class III Directors are listed below. Each nominee currently serves as a Class I Director.
Class I Nominees—Terms Expiring at the Annual Meeting
Name Age
Vanessa J. Castagna . . . . . . . . . . . . . . . . . . . . . . . . . . . . . . . . . . . . . . . . . . . . . . . . . . . . . 63William J. Montgoris . . . . . . . . . . . . . . . . . . . . . . . . . . . . . . . . . . . . . . . . . . . . . . . . . . . . 66David Pulver . . . . . . . . . . . . . . . . . . . . . . . . . . . . . . . . . . . . . . . . . . . . . . . . . . . . . . . . . . . 71
The individuals who will continue to serve as Class II and Class III Directors after the Annual Meeting are:
Class II Directors—Terms Expiring at the Annual Meeting in 2014
Name Age
Amy Woods Brinkley . . . . . . . . . . . . . . . . . . . . . . . . . . . . . . . . . . . . . . . . . . . . . . . . . . . . 57Michael D. Casey . . . . . . . . . . . . . . . . . . . . . . . . . . . . . . . . . . . . . . . . . . . . . . . . . . . . . . . 52A. Bruce Cleverly . . . . . . . . . . . . . . . . . . . . . . . . . . . . . . . . . . . . . . . . . . . . . . . . . . . . . . . 67Jevin S. Eagle . . . . . . . . . . . . . . . . . . . . . . . . . . . . . . . . . . . . . . . . . . . . . . . . . . . . . . . . . . 46
Class III Directors—Terms Expiring at the Annual Meeting in 2015
Name Age
Paul Fulton . . . . . . . . . . . . . . . . . . . . . . . . . . . . . . . . . . . . . . . . . . . . . . . . . . . . . . . . . . . . 78John R. Welch . . . . . . . . . . . . . . . . . . . . . . . . . . . . . . . . . . . . . . . . . . . . . . . . . . . . . . . . . . 81Thomas E. Whiddon . . . . . . . . . . . . . . . . . . . . . . . . . . . . . . . . . . . . . . . . . . . . . . . . . . . . . 60
The Board recommends a vote FOR the election of Vanessa J. Castagna, William J. Montgoris, and David Pulver as Class I Directors.
Vote Required
Pursuant to our by-laws and our Corporate Governance Principles, the nominees who receive a majority of the votes cast at the Annual Meeting will be elected as Class I Directors. This means that the number of votes cast “for” a Director nominee must exceed the number of votes cast “against” that nominee and votes to “abstain” with respect to that nominee. Abstentions and broker non-votes will be counted towards a quorum, and abstentions will have the practical effect of a vote “against” a Director nominee. Any nominee who does not receive a majority of votes cast “for” his or her election is required to tender his or her resignation. The Nominating and Corporate Governance Committee is then required to make a recommendation to the Board as to whether it should accept or reject such resignation. The Board, taking into account such recommendation, will decide whether to accept such resignation. The Board’s decision will be publicly disclosed within ninety (90) days after the results of the election are certified. A Director whose resignation is under consideration shall abstain from participating in any recommendation or decision regarding his or her resignation. If the resignation is not accepted, the Director will continue to serve until the next Annual Meeting of Shareholders at which such Director faces re-election and until such Director’s successor is elected and qualified.

13
Proxy
COMPENSATION OF DIRECTORS
Each of our non-management Directors receives an annual retainer, meeting fees, and an annual equity grant. Each of our committee Chairmen and our lead independent director receives an additional retainer. With respect to each Director who served on the Board in fiscal 2012, each such Director’s annual retainer was comprised of a $55,000 cash payment and a standard grant of our common stock valued at approximately $120,000. Each Director received meeting fees of $2,500 for each regularly scheduled Board meeting, $1,000 for each special Board meeting, and $1,000 for each regularly scheduled or special meeting of our standing Board committees.
In fiscal 2012, the Chairman of our Audit Committee and our Lead Independent Director each received $20,000 cash retainers, and the Chairmen of our Compensation and Nominating and Corporate Governance Committees each received $15,000 cash retainers.
We reimburse Directors for travel expenses incurred in connection with attending Board and committee meetings and for other expenses incurred while conducting Company business. Mr. Casey receives no additional compensation for serving on the Board. There are no family relationships among any of the Directors or our executive officers and none of our non-management Directors performed any services for the Company other than services as Directors.
The following table provides information concerning the compensation of our non-management Directors for fiscal 2012.
FISCAL 2012 DIRECTOR COMPENSATION TABLE
Name
Fees Earned or Paid in Cash
(a)
Stock Awards
($) (b)
Total ($)
Amy Woods Brinkley (c) . . . . . . . . . . . . . . . . . . . . . . . . . . . . . . . . . . . . . $ 76,000 $120,021 $196,021Vanessa J. Castagna . . . . . . . . . . . . . . . . . . . . . . . . . . . . . . . . . . . . . . . . . $ 69,000 $120,021 $189,021A. Bruce Cleverly . . . . . . . . . . . . . . . . . . . . . . . . . . . . . . . . . . . . . . . . . . . $ 74,000 $120,021 $194,021Jevin S. Eagle (c) . . . . . . . . . . . . . . . . . . . . . . . . . . . . . . . . . . . . . . . . . . . . $ 70,000 $120,021 $190,021Paul Fulton . . . . . . . . . . . . . . . . . . . . . . . . . . . . . . . . . . . . . . . . . . . . . . . . $ 85,000 $120,021 $205,021William J. Montgoris . . . . . . . . . . . . . . . . . . . . . . . . . . . . . . . . . . . . . . . . $ 76,000 $120,021 $196,021David Pulver . . . . . . . . . . . . . . . . . . . . . . . . . . . . . . . . . . . . . . . . . . . . . . . $ 96,000 $120,021 $216,021John R. Welch . . . . . . . . . . . . . . . . . . . . . . . . . . . . . . . . . . . . . . . . . . . . . . $ 89,000 $120,021 $209,021Thomas E. Whiddon (c) . . . . . . . . . . . . . . . . . . . . . . . . . . . . . . . . . . . . . . $100,000 $120,021 $220,021
(a) This column reports the amount of cash compensation earned in fiscal 2012 through annual cash retainers and meeting fees.
(b) We issued 2,412 shares of common stock to each non-management Director with a grant date fair value of $49.76 per share.
(c) As of December 29, 2012, Amy Woods Brinkley owned 3,004 shares of restricted common stock, Jevin S. Eagle owned 4,229 shares of restricted common stock, and Thomas E. Whiddon owned 16,000 exercisable stock options.
For complete beneficial ownership information of our common stock for each Director, see heading “Securities Ownership of Beneficial Owners, Directors, and Executive Officers” on page 33.
Utilizing data on non-management Director compensation from the Company’s peer group, as well as considering general industry trends presented by Hay Group, the Compensation Committee determined not to increase non-management Director compensation for fiscal 2013.
Under the Company’s minimum ownership guidelines, no Director may sell Company stock (other than to cover the tax obligations resulting from the vesting of Company restricted stock or from exercising vested stock options) unless he or she owns shares of Company stock with a total market value in excess of five (5) times his or her annual cash retainer, or $275,000, by the end of his or her second term of service on the Board. Each of our Directors complied with these ownership guidelines in fiscal 2012.

14
EXECUTIVE OFFICERS’ BIOGRAPHICAL INFORMATION AND EXPERIENCE
The following table sets forth the name, age, and position of each of our executive officers as of the date of this proxy statement.
Name Age Position
Michael D. Casey . . . . . . . . . 52 Chairman of the Board of Directors and Chief Executive OfficerBrian J. Lynch. . . . . . . . . . . . 50 PresidentKevin D. Corning. . . . . . . . . 50 Executive Vice President, InternationalLisa C. Evans . . . . . . . . . . . . 58 Executive Vice President and Brand Leader for Carter’sLisa A. Fitzgerald. . . . . . . . . 50 Executive Vice President and Brand Leader for OshKosh B’goshWilliam G. Foglesong . . . . . 43 Senior Vice President of MarketingChristopher W. Rork . . . . . . 46 Executive Vice President of Supply ChainRichard F. Westenberger. . . 44 Executive Vice President, Chief Financial Officer, and TreasurerJeffrey B. Williams. . . . . . . . 39 Senior Vice President of RetailJill A. Wilson . . . . . . . . . . . . 46 Senior Vice President of Human Resources and Talent Development
Michael D. Casey joined the Company in 1993 as Vice President of Finance. Mr. Casey was named Senior Vice President of Finance in 1997, Senior Vice President and Chief Financial Officer in 1998, Executive Vice President and Chief Financial Officer in 2003, and Chief Executive Officer in 2008. Mr. Casey became a Director in 2008 and was named Chairman of the Board of Directors in 2009. Prior to joining the Company, Mr. Casey worked for Price Waterhouse LLP, a predecessor firm to PricewaterhouseCoopers LLP, from 1982 to 1993. Mr. Casey also serves as a director of National Vision, Inc.
Brian J. Lynch joined the Company in 2005 as Vice President of Merchandising. Mr. Lynch was promoted to Senior Vice President in 2008. In 2009, Mr. Lynch was promoted to Executive Vice President and Brand Leader for Carter’s. In 2012, Mr. Lynch was promoted to President. Prior to joining the Company, Mr. Lynch was with The Walt Disney Company for nine years in various merchandising, brand management, and strategy roles in the Disney Parks & Resorts division. Prior to Disney, Mr. Lynch worked for Champion Products, a division of Hanesbrands Inc.
Kevin D. Corning joined the Company in 2012 as Executive Vice President, International. From 2008 to 2012, Mr. Corning served as a General Manager in the Luxury & Lifestyle division of DKSH, the leading market expansion services company, where he was responsible for the manufacturing, marketing, and retail distribution of leading brands in Asia, including Levi’s and Dockers. From 2005 to 2007, Mr. Corning served as President of Masterfoods Brazil, a division of Mars, Incorporated. Mr. Corning started his career with Kraft Foods, Inc. and also worked for eight years with Nike, Inc. in various management positions, including country general manager roles in Chile and Brazil. Prior to his business career, Mr. Corning served in the United States Army for five years as a helicopter pilot and paratrooper.
Lisa C. Evans joined the Company in 2009 as Senior Vice President of Sales. In 2013, Ms. Evans was promoted to Executive Vice President and Brand Leader for Carter’s. From 2005 to 2009, Ms. Evans worked for Macy’s, Inc. as Senior Vice President and General Merchandise Manager for various product lines. Prior to that, Ms. Evans served as a Senior Vice President and General Merchandise Manager with The May Company.

15
Proxy
Lisa A. Fitzgerald joined the Company in 2010 as Executive Vice President and Brand Leader for OshKosh B’gosh. From 2000 to 2009, Ms. Fitzgerald worked for Lands’ End, Inc., a specialty apparel division of Sears Holdings Corporation, having served as Executive Vice President of Merchandising, Design, and Creative, and as Interim President in 2008. Prior to that, Ms. Fitzgerald worked for Gymboree as Vice President and General Merchandise Manager for its Baby product line.
William G. Foglesong joined the Company in 2010 as Senior Vice President of Marketing, with responsibilities for marketing and eCommerce. From 2008 to 2010, Mr. Foglesong was the Vice President of Marketing and Direct-To-Consumer at Spanx, Inc., a leading woman’s apparel company. From 2002 to 2008, Mr. Foglesong worked at The Home Depot, Inc. where he held various management positions, including General Manager of Home Depot Direct. Mr. Foglesong started his career with General Electric and gained additional experience at The Boston Consulting Group where he focused on building internet strategies for his clients. Mr. Foglesong serves as a director of Kids in Distressed Situations, Inc. (K.I.D.S.).
Christopher W. Rork joined the Company in 2011 as Executive Vice President of Supply Chain. From 2007 to 2011, Mr. Rork was with Levi Strauss & Co., where he was responsible for product development, sourcing and for supply planning, logistics, and distribution for its Asian operations. From 2006 to 2007, Mr. Rork worked as the Chief Operating Officer for Little Me, Inc., a children’s apparel design and marketing company. Prior to 2006, Mr. Rork spent six years with Ralph Lauren Corporation where he held various manufacturing, operations, product development, and sourcing positions.
Richard F. Westenberger joined the Company in 2009 as Executive Vice President and Chief Financial Officer. Mr. Westenberger’s responsibilities include management of the Company’s finance and information technology functions. Prior to joining the Company, Mr. Westenberger served as Vice President of Corporate Finance and Treasurer of Hewitt Associates, Inc. from 2006 to 2008. From 1996 to 2006, Mr. Westenberger held various senior financial management positions at Sears Holdings Corporation and its predecessor organization, Sears, Roebuck and Co., including Senior Vice President and Chief Financial Officer of Lands’ End, Inc., Vice President of Corporate Planning & Analysis, and Vice President of Investor Relations. Prior to Sears, Mr. Westenberger was with Kraft Foods, Inc. He began his career at Price Waterhouse LLP, a predecessor firm to PricewaterhouseCoopers LLP, and is a certified public accountant.
Jeffrey B. Williams joined the Company in 2004 as Director of Supply Chain. Mr. Williams was promoted to Vice President of Inventory Management in 2004 and was named Vice President of Operations in 2006. Mr. Williams was promoted to Senior Vice President, Retail Planning and Allocation in 2007 and was named Senior Vice President, Retail Operations and Strategy in 2011. In 2012, Mr. Williams was promoted to Senior Vice President of Retail. Prior to joining the Company, Mr. Williams served in management roles at The Home Depot, Inc. and Bain & Company.
Jill A. Wilson joined the Company in 2009 as Vice President of Human Resources. In 2010, Ms. Wilson was promoted to Senior Vice President of Human Resources and Talent Development. Ms. Wilson joined the Company after more than 20 years with The May Company and Macy’s. While at Macy’s, Ms. Wilson held various Human Resources positions of increasing responsibility, including Group Vice President of Human Resources. Ms. Wilson has experience in a broad range of human resources disciplines, including talent management, organizational development, compensation, and talent acquisition.

16
COMPENSATION DISCUSSION AND ANALYSIS
Overview
This Compensation Discussion and Analysis, or CD&A, is intended to provide information regarding the Company’s executive compensation program and practices. This CD&A covers a variety of topics, including the Company’s compensation philosophy regarding executive compensation, the role of our Compensation Committee in setting compensation of our executive officers, including our named executive officers, and our executive compensation decisions for fiscal 2012.
Our named executive officers for fiscal 2012 were:
• Michael D. Casey, Chief Executive Officer;
• Richard F. Westenberger, Executive Vice President and Chief Financial Officer;
• Lisa A. Fitzgerald, Executive Vice President and Brand Leader for OshKosh B’gosh;
• Brian J. Lynch, President;
• Christopher W. Rork, Executive Vice President of Supply Chain; and
• James C. Petty, Former President of Retail Stores.
Mr. Petty has announced that he will be retiring from the Company on June 30, 2013. As of December 2012, Mr. Petty no longer serves as an executive officer of the Company.
Executive Compensation Highlights for 2012
The Compensation Committee decided to retain its executive compensation program in 2012 as it believes the programs remain appropriate to attract, retain and motivate superior executive talent. After review of various factors, including our financial performance, the Compensation Committee took the following actions, among others, with respect to fiscal 2012 compensation for our named executive officers:
• Reviewed and modified the peer group used by the Compensation Committee as a source of comparative compensation data;
• Adjusted base salaries to better align with the Company’s compensation philosophy and to reflect changes in executive responsibilities;
• Paid out annual cash incentive compensation at 198% of target based on the Company’s strong fiscal 2012 performance in net sales, adjusted EBIT, and adjusted EPS;
• Granted stock options and time- and performance-based restricted shares; and
• Reviewed and revised executive ownership guidelines.
Compensation Philosophy
The Company is committed to achieving long-term, sustainable growth and increasing shareholder value. Our compensation philosophy is to set our named executive officers’ total direct compensation at levels that will attract, motivate, and retain superior executive talent in a highly competitive environment. The Company’s compensation program for our named executive officers is designed to support these objectives and encourage strong financial performance on an annual and long-term basis by linking a significant portion of our named executive officers’ total direct compensation to Company performance in the form of incentive compensation and long-term performance stock. The principal elements of the compensation structure for our named executive officers are base salary, annual cash incentive compensation, and long-term equity incentive compensation. Together, the Company refers to these three elements as total direct compensation.

17
Proxy
Say-on-Pay Results
At the 2012 Annual Meeting of Shareholders, over 84% of the votes cast were in favor of the advisory vote to approve executive compensation. In determining to maintain its compensation philosophy consistent with prior years, the Compensation Committee considered this positive say-on-pay vote. At the 2013 Annual Meeting of Shareholders, the Company plans to again hold an annual advisory vote to approve executive compensation. The Compensation Committee plans to continue to consider the results from this year’s and future advisory votes on executive compensation.
Role of the Compensation Committee and Independent Consultant
Our Compensation Committee sets the total direct compensation of our named executive officers. Our Compensation Committee also sets the financial performance targets for our named executive officers’ annual cash incentive compensation and vesting terms for their equity awards, including performance-based awards. Our Compensation Committee has engaged Hay Group, an independent compensation consultant, to advise it on executive and Director compensation matters. Hay Group also assists the Committee in gathering and analyzing comparative compensation data both from among the companies in Hay Group’s Retail Executive and Management Total Remuneration Survey and from our peer group, each as described in more detail below. With the goal of maintaining the effectiveness of our executive compensation program, and to keep it consistent with our compensation philosophy, our Compensation Committee reviews the reasonableness of compensation for our executive officers, including our named executive officers, and compares it with compensation data from Hay Group’s retail survey and our peer group.
Hay Group serves at the discretion of the Compensation Committee and meets privately with the Compensation Committee and with its Chairman. At the direction of the Compensation Committee, our Chief Executive Officer works with Hay Group to review comparative compensation data and makes recommendations for base salary, annual cash incentive compensation, and long-term equity incentive compensation for our named executive officers, other than himself. Compensation for our Chief Executive Officer is set by the Compensation Committee, without any involvement by the Chief Executive Officer or other named executive officers, based on recommendations made by Hay Group. The Compensation Committee has assessed the independence of Hay Group pursuant to the SEC rules and has determined that the work provided by Hay Group did not raise a conflict of interest.
In setting compensation of all named executive officers, our Compensation Committee takes into account multiple objective and subjective factors, including:
(i) The nature and scope of each executive’s responsibilities;
(ii) Comparative compensation data for executives in similar positions at companies in the Retail Survey and in our peer group;
(iii) Each executive’s experience, performance, and contribution to the Company;
(iv) The Company’s performance;
(v) Prior equity awards and potential future earnings from equity awards;
(vi) Retention needs; and
(vii) Any other factors the Committee deems relevant.
The Retail Survey and Peer Group Analysis
The survey conducted by Hay Group is comprised of more than 100 companies in the retail and wholesale industry and provides comparable compensation information by controlling for differences in companies’ revenue size and in the scope of responsibility of different executives. In August 2012, the Compensation Committee, at the advice of Hay Group, began using a subset of Hay Group’s survey which consists of 54 companies (Retail Survey as listed in Appendix A) for executive compensation market

18
assessment. The Compensation Committee believes that these companies are engaged in businesses more similar to the Company’s business than the other companies in Hay Group’s survey because they are largely apparel and related products retailers or department stores who primarily sell apparel and related products. In addition, our Compensation Committee has established a peer group, which is generally comprised of companies in the retail or wholesale industries that primarily conduct business in apparel or related accessories, sell products under multiple brands through retail and outlet stores, and have net sales generally between one-half and two times the Company’s net sales. In fiscal 2012, our peer group was comprised of the following sixteen companies:
Aeropostale, Inc. Fossil, Inc.American Eagle Outfitters, Inc. Guess?, Inc.
Ann, Inc. Hanesbrands Inc.Ascena Retail Group, Inc. Jones Group, Inc.
Chico’s FAS, Inc. Quiksilver, Inc.The Children’s Place Retail Stores, Inc. Under Armour, Inc.
Coach, Inc. Urban Outfitters, Inc.Columbia Sportswear Company The Warnaco Group, Inc.
In August 2012, our Compensation Committee conducted with Hay Group its annual review of our peer group and determined to remove Coldwater Creek, Inc. and Pacific Sunwear of California, Inc. as both companies no longer fit the criteria above. Collective Brands, Inc. was also removed as it was acquired in 2012. Based on the review, the Compensation Committee determined to add Fossil, Inc., Under Armour, Inc., and Urban Outfitters, Inc. to the peer group as they fit the criteria established for the peer group.
Total Direct Compensation
In setting a total direct compensation target for each named executive officer, our Compensation Committee considers both objective and subjective factors set forth above, as well as prior equity awards, potential future earnings from equity awards, and retention needs. The Compensation Committee also reviews total direct compensation, and its individual components, at the 25th, 50th, and 75th percentile levels paid to executives in similar positions at the companies in the Retail Survey and our peer group to understand where the compensation it sets falls relative to the market practices.
Throughout fiscal 2012, our Compensation Committee reviewed compensation data from the Retail Survey and our peer group to compare the compensation of our named executive officers. In fiscal 2012, as set forth in more detail in the Fiscal 2012 Summary Compensation Table, the total direct compensation of each of our named executive officers was as follows:
Named Executive OfficerTotal Direct
Compensation
Michael D. Casey . . . . . . . . . . . . . . . . . . . . . . . . . . . . . . . . . . . . . . . . . . . . . . $9,766,346Richard F. Westenberger . . . . . . . . . . . . . . . . . . . . . . . . . . . . . . . . . . . . . . . . $1,824,242Lisa A. Fitzgerald . . . . . . . . . . . . . . . . . . . . . . . . . . . . . . . . . . . . . . . . . . . . . . $1,930,588Brian J. Lynch . . . . . . . . . . . . . . . . . . . . . . . . . . . . . . . . . . . . . . . . . . . . . . . . . $1,934,668Christopher W. Rork . . . . . . . . . . . . . . . . . . . . . . . . . . . . . . . . . . . . . . . . . . . $1,851,503James C. Petty . . . . . . . . . . . . . . . . . . . . . . . . . . . . . . . . . . . . . . . . . . . . . . . . . $1,880,888
Base Salary
When setting base salaries for our named executive officers, our Compensation Committee considers the subjective and objective factors set forth above and also reviews base salaries at the 25th, 50th, and 75th percentile levels paid to executives in similar positions at the companies in the Retail Survey and our peer group, as appropriate.

19
Proxy
Utilizing base salary data from the Retail Survey and, with respect to Messrs. Casey and Westenberger, base salary data for the Company’s peer group, as well as making adjustments in light of the objective and subjective factors discussed above, the Committee determined to increase base salaries for fiscal 2013 to better align with market competitive levels. The base salary for Mr. Lynch was increased when he was promoted to President on December 14, 2012. Because Mr. Petty has announced that he will be retiring from the Company on June 30, 2013, his base salary was not adjusted. The following table details the base salaries we provided in fiscal 2012 to each of our named executive officers and their corresponding base salaries for fiscal 2013, which, with the exception of Messrs. Lynch and Petty, will become effective April 28, 2013. The base salaries set for 2013 approximate the 50th percentile (median) levels paid to executives in similar positions at the companies in the Retail Survey and our peer group.
Base Salary
Named Executive Officer Fiscal 2012 Fiscal 2013
Michael D. Casey . . . . . . . . . . . . . . . . . . . . . . . . . . . . . . . . . . . . . . . . . . . . . . . . . . . . . . .Chairman of the Board and Chief Executive Officer
$850,000 $900,000
Richard F. Westenberger . . . . . . . . . . . . . . . . . . . . . . . . . . . . . . . . . . . . . . . . . . . . . . . . .Executive Vice President and Chief Financial Officer
$480,000 $515,000
Lisa A. Fitzgerald . . . . . . . . . . . . . . . . . . . . . . . . . . . . . . . . . . . . . . . . . . . . . . . . . . . . . . .Executive Vice President and Brand Leader for OshKosh B’gosh
$515,000 $530,000
Brian J. Lynch . . . . . . . . . . . . . . . . . . . . . . . . . . . . . . . . . . . . . . . . . . . . . . . . . . . . . . . . . .President
$525,000 $650,000
Christopher W. Rork. . . . . . . . . . . . . . . . . . . . . . . . . . . . . . . . . . . . . . . . . . . . . . . . . . . . .Executive Vice President of Supply Chain
$465,000 $500,000
James C. Petty . . . . . . . . . . . . . . . . . . . . . . . . . . . . . . . . . . . . . . . . . . . . . . . . . . . . . . . . . .Former President of Retail Stores
$495,000 $495,000
Annual Cash Incentive Compensation
The Company makes annual cash incentive compensation (through the Annual Incentive Plan) a significant component of our named executive officers’ targeted total direct compensation in order to motivate our executives to meet and exceed the Company’s annual operating plans. For each named executive officer, our Compensation Committee approves target annual cash incentive compensation as a percentage of such named executive officer’s base salary. In establishing these annual cash incentive compensation targets, the Compensation Committee considers our named executive officers’ potential total direct compensation in light of the Company’s compensation philosophy and comparative compensation data. Our named executive officers may also receive special bonuses in recognition of special circumstances or for superior performance.
In February 2012, our Compensation Committee set the following fiscal 2012 annual cash incentive compensation targets for our named executive officers: 125% of base salary for Mr. Casey and 75% of base salary for Ms. Fitzgerald and Messrs. Westenberger, Lynch, Rork and Petty. In February 2013, taking into consideration comparative compensation data in light of his promotion to the role of President, the Compensation Committee increased the annual cash incentive compensation target for Mr. Lynch to 100% of base salary for fiscal 2013. The fiscal 2013 annual cash incentive compensation targets for the other named executive officers remained consistent with the fiscal 2012 levels.
The named executive officers can earn their annual cash incentive compensation based upon the Company’s achievement of financial performance targets pre-determined by the Compensation Committee. In accordance with our Incentive Compensation Plan, for fiscal 2012, the Compensation Committee used three financial performance metrics to determine the amount, if any, of annual cash incentive compensation to be paid under our Incentive Compensation Plan: net sales (weighted at 25%); earnings before interest and taxes (“EBIT”), adjusted, if applicable, in the same manner as for presentation to the financial markets (weighted at 25%); and earnings per share (“EPS”), adjusted, if applicable, in

20
the same manner as for presentation to the financial markets (weighted at 50%). Our Compensation Committee selected net sales, EBIT, and EPS as performance metrics because it believes they are key financial measures that are aligned with the interests of our shareholders and help to measure the quality of our earnings.
Our Compensation Committee has the discretion not to award or reduce annual cash incentive compensation, even if the Company achieves its financial performance targets, and to take into account personal performance in determining the percentage of each named executive officer’s annual cash incentive compensation to be paid, if any. For example, our Compensation Committee has discretion to reduce future incentive compensation awards based on financial restatements or misconduct. In addition, in accordance with the requirements of the Sarbanes-Oxley Act of 2002, Messrs. Casey and Westenberger are subject to the adjustment, cancellation or recovery of incentive awards or payments made to them in the event of a financial restatement.
Our named executive officers could have earned from 0% to 200% of their target annual cash incentive compensation in fiscal 2012 based upon the Company’s achievement of the following financial targets, weighted at the following percentages:
Net Sales($ in billions)
(25%)
EBIT($ in millions)
(25%)EPS
(50%)
25% of Target Annual Cash Incentive Compensation (Threshold) . . . . . $2.247 $215.0 $2.20100% of Target Annual Cash Incentive Compensation (Target) . . . . . . . . $2.322 $243.0 $2.50200% of Target Annual Cash Incentive Compensation (Maximum) . . . . $2.397 $271.0 $2.80Actual 2012 Performance . . . . . . . . . . . . . . . . . . . . . . . . . . . . . . . . . . . . . . . . $2.382 $275.1 $2.85
Based on the Company’s fiscal 2012 performance, our named executive officers were awarded 198% of their cash incentive compensation targets for fiscal 2012. Actual payouts for the named executive officers are shown in the Summary Compensation Table.
Long-Term Equity Incentive Compensation
Our Equity Incentive Plan allows for various types of equity awards, including stock options, restricted stock, restricted stock units, stock appreciation rights, and deferred stock. Awards under our Equity Incentive Plan are granted to recruit, motivate, and retain employees and in connection with promotions or increased responsibility. Historically, our Compensation Committee has awarded time and performance-based stock options, time and performance-based restricted stock, and time-based restricted stock units, although it could use other forms of equity awards in the future.
All awards under our Equity Incentive Plan must be approved by our Compensation Committee. Our Compensation Committee determines the type, timing, and amount of equity awards granted to each of our named executive officers after considering their previous equity awards, base salary, and target annual cash incentive compensation in light of the Company’s compensation philosophy. Our Compensation Committee also considers the comparative compensation data in the Retail Survey and our peer group, and our desire to retain and motivate our named executive officers and to align their goals with the long-term goals of our shareholders. Our Compensation Committee’s practice is to approve grants of stock options, restricted stock, and restricted stock units at regularly scheduled meetings. Our Compensation Committee may also make equity grants at special meetings or by unanimous written consent. Our Compensation Committee could select a date subsequent to a regularly scheduled meeting on which to grant equity awards. Our Compensation Committee sets the exercise prices of equity awards at the closing price of our common stock on the NYSE on the date of grant.
In considering the value of equity awards, we calculate the value of stock option awards by using the Black-Scholes option pricing valuation method and the value of time-based and performance-based restricted stock awards equal to the closing price of our common stock on the date of grant.

21
Proxy
In February 2012, based on criteria described above, our Compensation Committee approved annual stock option and restricted stock grants for each named executive officer. The Committee, acting on a recommendation from Hay Group, expanded the use of performance-based restricted stock awards, which were previously granted solely to Mr. Casey in March 2011, to all other named executive officers. By tying a portion of restricted stock awards granted to all named executive officers in fiscal 2012 to the Company’s performance, as described in more detail below, the Committee was attempting to more closely align goals of our named executive officers with the long-term goals of our shareholders. Mr. Casey received an annual grant of 70,000 time-based stock options, 35,000 shares of time-based restricted stock, and 100,000 shares of performance-based restricted stock. Ms. Fitzgerald, and Messrs. Lynch, Petty, Rork and Westenberger each received an annual grant of 8,000 time-based stock options, 4,000 shares of time-based restricted stock, and 8,000 shares of performance-based restricted stock. Each named executive officer’s performance-based restricted shares granted in February 2012 are eligible to vest in fiscal 2015 in varying percentages (between 25% and 100%) if the Company achieves certain compound annual growth in earnings per share (as adjusted for items judged to be non-recurring or unusual in nature), measured from fiscal 2011 to fiscal 2014. Once vested, the performance-based restricted shares granted to Mr. Casey may not be sold for an additional one-year period (except to satisfy tax obligations resulting from vesting of such shares).
In February 2013, based on criteria described above, our Compensation Committee approved annual stock option, restricted stock and performance-based restricted stock grants for each named executive officer. Mr. Casey received an annual grant of 50,000 time-based stock options, 25,000 shares of time-based restricted stock, and 50,000 shares of performance-based restricted stock. Mr. Lynch received an annual grant of 18,000 time-based stock options, 9,000 shares of time-based restricted stock, and 18,000 shares of performance-based restricted stock. Ms. Fitzgerald, and Messrs. Rork and Westenberger each received an annual grant of 8,000 time-based stock options, 4,000 shares of time-based restricted stock, and 8,000 shares of performance-based restricted stock. Each named executive officer’s performance-based restricted shares granted in February 2013 are eligible to vest in fiscal 2016 in varying percentages (between 25% and 100%) if the Company achieves certain compound annual growth in earnings per share (as adjusted for items judged to be non-recurring or unusual in nature), measured from fiscal 2012 to fiscal 2015. Once vested, the performance-based restricted shares granted to Mr. Casey may not be sold for an additional one-year period (except to satisfy tax obligations resulting from vesting of such shares).
All of the time-based stock option and time-based restricted stock awards granted to our named executive officers in fiscal 2012 and fiscal 2013 are subject to the equity retention policy described above and vest in four equal, annual installments on the anniversary of the grant date, contingent on the executive officer’s continued employment with the Company.
Stock Ownership Guidelines and Equity Retention Policy
Our Compensation Committee regularly reviews the equity ownership of our named executive officers compared to the Company’s minimum ownership guidelines. Under the Company’s minimum ownership guidelines, no named executive officer may sell Company stock (other than to cover the tax obligations resulting from the vesting of Company restricted stock or from exercising vested stock options) unless he or she owns shares of Company stock with a total market value in excess of a multiple of his or her base salary and continues to maintain such level of ownership after selling Company stock. For fiscal 2012, the ownership multiples for our named executive officers were as follows: Chief Executive Officer - seven times his base salary; Chief Financial Officer, Brand Leader for OshKosh B’gosh, Brand Leader for Carter’s, and Executive Vice President of Supply Chain - three times their respective base salaries. Each of our named executive officers met these ownership guidelines in fiscal 2012. In February 2013, taking into consideration comparative compensation data, our Compensation Committee determined to set the ownership multiple for President at four times his base salary.

22
Our equity retention policy for executive officers requires that, prior to any sale, any time-based restricted stock granted to an executive officer after January 1, 2009 be held for four years following the date of grant, except for any withholding to cover tax obligations resulting from the vesting of such shares. The policy also requires that time-based options granted after January 1, 2009 be held for at least one year from the date of vesting. Further, hedging Company stock is prohibited under the Company’s policies.
401(k) Plan
The Company’s 401(k) matching program provides Company matching of employee contributions at the discretion of the Company based on the Company’s performance. In February 2013, the Company announced that contributions made to the Company’s 401(k) plan in fiscal 2012 would be matched 100% by the Company for all employees.
Internal Revenue Code Section 162(m)
Section 162(m) of the Internal Revenue Code of 1986, as amended, imposes a $1 million limit on the amount that a public company may deduct for compensation paid to a company’s principal executive officer and the company’s three most highly compensated executive officers, other than its principal financial officer. This limitation generally does not apply to performance-based compensation that is awarded under a plan that is approved by the shareholders of a company and that also meets certain other technical requirements. Our compensation program for our named executive officers is generally intended to operate within the deductibility requirements under Section 162(m). However, the Compensation Committee may decide, from time to time, to award compensation that is not fully deductible under Section 162(m) to ensure that our executive officers are compensated at a competitive level or for other reasons consistent with our compensation policies and philosophies.
Severance Agreements with Current Named Executive Officers
Each of our current named executive officers has a severance agreement with the Company. In the event that a named executive officer is terminated by the Company for “cause,” retires, becomes disabled, or dies, the executive or his or her estate will be provided his or her base salary and medical and other benefits through the termination of his or her employment.
If a named executive officer is terminated without “cause,” or a named executive officer terminates for “good reason” (with “cause” and “good reason” defined in each executive’s respective agreement and summarized below) the Company will be obligated to pay such executive’s base salary for 24 months in the case of: Messrs. Casey and Petty, and for 12 months in the case of: Ms. Fitzgerald and Messrs. Lynch, Rork and Westenberger. The Company is also obligated to pay Messrs. Casey, Lynch, Petty, Rork, and Westenberger and Ms. Fitzgerald a pro-rated annual cash incentive compensation amount that would have been earned by each such executive if he or she had been employed at the end of the year in which his or her employment was terminated. The determination of whether an annual cash incentive compensation is payable to the named executive officer will not take into account any individual performance goals and shall be based solely on the extent to which Company performance goals have been met. Additionally, the Company is obligated to pay the medical, dental, and life insurance benefits for 24 months for Mr. Casey, and for 12 months in the case of Ms. Fitzgerald and Messrs. Lynch, Petty, Rork and Westenberger.
In the event that within two years following a “change of control” (with “change of control” defined in each executive’s agreement) the Company terminates the named executive officer’s employment, other than for “cause” or such executive terminates his or her employment for “good reason,” the Company shall pay such named executive officer base salary, medical, dental, and life insurance benefits for 36 months in the case of Mr. Casey, and 24 months in the case of: Ms. Fitzgerald and Messrs. Lynch, Petty, Rork, and Westenberger. In the event of a “change of control” of the Company, all unvested stock options and all unvested shares of restricted stock held by the named executive shall fully vest.
Severance payments made to the named executive officers are subject to the requirements of Section 409A of the Internal Revenue Code of 1986, as amended.

23
Proxy
Under the agreements with each of our named executive officers, “cause” is generally deemed to exist when such named executive officer has: (i) been convicted of a felony or entered a plea of guilty or no contest to a felony; (ii) committed fraud or other act involving dishonesty for personal gain which is materially injurious to the Company; (iii) materially breached his or her obligations of confidentiality, intellectual property assignment, non-competition, non-solicitation, or non-disparagement against the Company after a cure period, provided such breach by its nature was curable; (iv) willfully engaged in gross misconduct which is injurious to the Company; or, (v) after a cure period, willfully refused to substantially perform his duties or is grossly negligent in performance of such duties.
Under the agreements with our named executive officers, “good reason” is generally deemed to exist when there is (i) a material reduction in executive’s title, duties, or responsibilities; (ii) a material change in the geographic location at which the executive must perform services; or (iii) a material breach of the executive’s agreement by the Company.
Potential Payments Upon a Termination and Change of Control
Termination
As described in more detail above under the heading “Severance Agreements,” we have entered into certain agreements and maintain certain plans that may require us in the future, to make certain payments and provide certain benefits in the event of a termination of employment.
For purposes of the table below, a hypothetical termination without “cause” or for “good reason” is assumed to have occurred as of December 29, 2012, the last day of fiscal 2012. However, none of our named executive officers were terminated on December 29, 2012. There can be no assurance that a termination of employment of any of our named executive officers would produce the same or similar results as those set forth below on any other date. The terms “without cause” and “good reason” are defined in the agreements with our executives and summarized above under the heading “Severance Agreements.”
Michael Casey
Richard Westenberger
Lisa Fitzgerald
Brian Lynch
Christopher Rork
James Petty
Base Salary . . . . . . . . . . . . . . . . . Cash Incentive
Compensation (a) . . . . . . . . .
$ 1,700,000 $ 480,000 $ 515,000 $ 650,000 $ 465,000 $ 990,000
2,103,705 712,800 764,800 779,650 690,550 735,100Health and Other Benefits . . . . 32,224 17,208 17,208 16,371 9,183 17,208
Total . . . . . . . . . . . . . . . . . . . . $ 3,835,929 $ 1,210,008 $ 1,297,008 $ 1,446,021 $ 1,164,733 $ 1,742,308
(a) Cash incentive compensation calculations are based on cash incentive compensation targets achieved in fiscal 2012 described in more detail under the heading “Annual Cash Incentive Compensation” above.
Termination Following a Change of Control
As described in more detail above under the heading “Severance Agreements,” we have entered into certain agreements that may require us to make certain payments and provide certain benefits to our named executive officers in the event of a change of control (with “change of control” defined in each executive’s agreement).
For purposes of the table below, we have assumed that all unvested stock options and all unvested shares of restricted stock have fully vested immediately prior to a change of control on December 29, 2012, the last day of fiscal 2012, and that a termination without “cause” occurred immediately following a change of control on December 29, 2012. However, neither a change of control nor a termination without “cause” occurred on December 29, 2012, and none of the stock options or restricted stock awards was accelerated. The closing price on the NYSE of the Company’s common stock on the last trading day of fiscal 2012 was

24
$54.24 per share, and the intrinsic value of accelerated stock option vesting would have been as set forth below. There can be no assurance that a change of control would produce the same or similar results as those set forth below on any other date or at any other price.
MichaelCasey
RichardWestenberger
LisaFitzgerald
BrianLynch
ChristopherRork
James Petty
Base Salary . . . . . . . . . . . . . . . Cash Incentive
Compensation (a) . . . . . . .
$ 2,550,000 $ 960,000 $1,030,000 $1,300,000 $ 930,000 $ 990,000
2,103,705 712,800 764,800 779,650 690,550 735,100Health and Other Benefits . . 48,335 34,416 34,416 32,742 18,366 34,416Option Value . . . . . . . . . . . . . 21,637,300 1,491,240 1,450,640 2,283,010 814,840 3,745,540Restricted Stock Value . . . . . 16,068,600 1,545,840 1,844,160 1,749,240 1,261,080 1,586,520
Total . . . . . . . . . . . . . . . . . . $42,407,940 $4,744,296 $5,124,016 $6,144,642 $3,714,836 $7,091,576
(a) Cash incentive compensation calculations are based on cash incentive compensation targets achieved in fiscal 2012 described in more detail under the heading “Annual Cash Incentive Compensation” above.
Perquisites and Other Benefits
The Company maintains an apartment for Mr. Rork in Hong Kong, which Mr. Rork utilizes while traveling on business. Rent payments for this apartment were approximately $3,673 per month in fiscal 2012. Except for the 401(k) matching program, which applies to all employees, and maintaining an apartment in Hong Kong, each as described in more detail above, our named executive officers do not receive any perquisites or other benefits.

25
Proxy
COMPENSATION COMMITTEE REPORT
The Compensation Committee of the Board has reviewed and discussed with Company management the Compensation Discussion and Analysis included in this proxy statement. Based on such review and discussions, the Compensation Committee has recommended to the Board that the Compensation Discussion and Analysis be included in this proxy statement for filing with the SEC.
Submitted by the Compensation Committee
Mr. Paul Fulton, Chairman Mr. A. Bruce Cleverly Mr. Jevin S. Eagle Mr. John R. Welch

26
FISCAL 2012 SUMMARY COMPENSATION TABLE
The table below provides information concerning the compensation of our named executive officers.
In the “Salary” column, we disclose the base salary paid to each of our named executive officers during fiscal 2012, 2011, and 2010.
In the “Bonus” column, we disclose the cash bonuses earned during fiscal 2012, 2011, and 2010, other than amounts earned pursuant to the Company’s Amended and Restated Incentive Compensation Plan.
In the “Stock Awards” and “Option Awards” columns, we disclose the total fair value of the grants made in fiscal 2012, 2011, and 2010, without a reduction for assumed forfeitures. For restricted stock, the fair value is calculated using the closing price on the NYSE of our stock on the date of grant. For time-based and performance-based stock options, the fair value is calculated based on assumptions summarized in Note 8 to our audited consolidated financial statements, which are included in our fiscal 2012 Annual Report on Form 10-K.
In the column “Non-Equity Incentive Plan Compensation,” we disclose the dollar value of all compensation earned in fiscal 2012, 2011, and 2010 pursuant to the Company’s Incentive Compensation Plan.
In the column “All Other Compensation,” we disclose the dollar value of all other compensation that could not properly be reported in other columns of the Fiscal 2012 Summary Compensation Table, including perquisites, and amounts reimbursed for the payment of taxes, and other payments paid by the Company for the benefit of our named executive officers.
Name and Principal PositionFiscalYear
Salary($)
Bonus($)
StockAwards
($)(a)
OptionAwards
($)(b)
Non-EquityIncentive
PlanCompensation
($)
All OtherCompensation
($)(c)
Total($)
Michael D. Casey . . . . . . . . . . . . . . . . . . . . . . . .Chairman of the Board of Directors and
Chief Executive Officer
2012 $ 818,846 $ — $5,752,350 $1,068,900 $2,103,750 $ 22,500 $9,766,3462011 $ 760,000 $ — $3,408,800 $ 960,000 $ 855,000 $ 22,000 $6,005,8002010 $ 739,231 $ — $1,121,600 $ 951,200 $2,280,000 $ 22,000 $5,114,031
Richard F. Westenberger . . . . . . . . . . . . . . . . . .Executive Vice President and
Chief Financial Officer
2012 $ 460,962 $ — $ 511,320 $ 122,160 $ 712,800 $ 17,000 $1,824,2422011 $ 425,000 $ — $ 455,040 $ 144,000 $ 239,100 $ 16,500 $1,279,6402010 $ 416,346 $ — $ 112,160 $ 154,570 $ 637,500 $ 16,500 $1,337,076
Lisa A. Fitzgerald . . . . . . . . . . . . . . . . . . . . . . . .Executive Vice President and
Brand Leader for OshKosh B’gosh
2012 $ 509,808 $ — $ 511,320 $ 122,160 $ 764,800 $ 22,500 $1,930,5882011 $ 500,000 $ — $ 455,040 $ 144,000 $ 281,250 $ 16,500 $1,396,7902010 $ 451,923 $ 250,000(d) $ 560,800 $ 475,600 $ 750,000 $123,166 $2,611,489
Brian J. Lynch . . . . . . . . . . . . . . . . . . . . . . . . . . .President
2012 $ 499,038 $ — $ 511,320 $ 122,160 $ 779,650 $ 22,500 $1,934,6682011 $ 445,192 $ — $ 597,240 $ 144,000 $ 253,150 $ 16,500 $1,456,082
Christopher W. Rork . . . . . . . . . . . . . . . . . . . . .Executive Vice President of Supply Chain
2012 $ 459,808 $ — $ 511,320 $ 122,160 $ 690,550 $ 67,665 $1,851,5032011 $ 294,231 $ 100,000 (e) $ 452,700 $ 375,000 $ 253,150 $108,972 $1,584,053
James C. Petty . . . . . . . . . . . . . . . . . . . . . . . . . . .Former President of Retail Stores
2012 $ 489,808 $ — $ 511,320 $ 122,160 $ 735,100 $ 22,500 $1,880,888
(a) The amounts disclosed in this column represent the total grant date fair value for the following grants:
(i) Mr. Casey was granted 40,000 shares of restricted stock on February 16, 2010 with a grant date fair value of $28.04 per share, 40,000 shares of restricted stock on February 24, 2011 with a grant date fair value of $28.44 per share and 35,000 shares of restricted stock on February 22, 2012 with a grant date fair value of $42.61 per share. These grants vest in four equal, annual installments following the date of grant. Mr. Casey was granted 80,000 shares of performance-based restricted stock on March 30, 2011, with a grant date fair value of $28.39 per share and 100,000 shares of performance-based restricted stock on February 22, 2012, with a grant date fair value of $42.61 per share. Vesting of the performance shares is contingent upon meeting specific performance targets through fiscal 2014. Once vested, the performance-based restricted shares granted in 2012 may not be sold for an additional one year period (except to satisfy tax obligations resulting from vesting of such shares).
(ii) Mr. Westenberger was granted 4,000 shares of restricted stock on February 16, 2010 with a grant date fair value of $28.04 per share, 16,000 shares of restricted stock on February 24, 2011 with a grant date fair value of $28.44 per share and 4,000 shares of restricted stock on February 22, 2012 with a grant date fair value of $42.61 per share. These grants vest in four equal, annual installments following the date of grant. Mr. Westenberger was granted 8,000 shares of performance-based restricted stock on February 22, 2012, with a grant date fair value of $42.61 per share. Vesting of the performance shares is contingent upon meeting specific performance targets through fiscal 2014.

27
Proxy
(iii) Ms. Fitzgerald was granted 20,000 shares of restricted stock on February 16, 2010 with a grant date fair value of $28.04 per share, 16,000 shares of restricted stock on February 24, 2011 with a grant date fair value of $28.44 per share and 4,000 shares of restricted stock on February 22, 2012 with a grant date fair value of $42.61 per share. These grants vest in four equal, annual installments following the date of grant. Ms. Fitzgerald was granted 8,000 shares of performance-based restricted stock on February 22, 2012, with a grant date fair value of $42.61 per share. Vesting of the performance shares is contingent upon meeting specific performance targets through fiscal 2014.
(iv) Mr. Lynch was granted 21,000 shares of restricted stock on February 24, 2011 with a grant date fair value of $28.44 per share and 4,000 shares of restricted stock on February 22, 2012 with a grant date fair value of $42.61 per share. These grants vest in four equal, annual installments following the date of grant. Mr. Lynch was granted 8,000 shares of performance-based restricted stock on February 22, 2012, with a grant date fair value of $42.61 per share. Vesting of the performance shares is contingent upon meeting specific performance targets through fiscal 2014.
(v) Mr. Rork was granted 15,000 shares of restricted stock on May 12, 2011 with a grant date fair value of $30.18 per share and 4,000 shares of restricted stock on February 22, 2012 with a grant date fair value of $42.61 per share. These grants vest in four equal, annual installments following the date of grant. Mr. Rork was granted 8,000 shares of performance-based restricted stock on February 22, 2012, with a grant date fair value of $42.61 per share. Vesting of the performance shares is contingent upon meeting specific performance targets through fiscal 2014.
(vi) Mr. Petty was granted 4,000 shares of restricted and 8,000 shares of performance-based restricted stock on February 22, 2012 with grant date fair values of $42.61 per share. The restricted stock vests in four equal installments following the date of grant. The vesting of the performance shares is contingent upon meeting specific performance targets through fiscal 2014.
(b) The amounts disclosed in this column represent the total grant date fair value for the following grants:
(i) Mr. Casey was granted 80,000 time-based stock options on February 16, 2010 with a Black-Scholes fair value of $11.89 per share and an exercise price of $28.04 per share, 80,000 time-based stock options on February 24, 2011 with a Black-Scholes fair value of $12.00 per share and an exercise price of $28.44 per share and 70,000 time-based stock options on February 22, 2012 with a Black-Scholes fair value of $15.27 per share and an exercise price of $42.61 per share. These grants vest in four equal, annual installments following the date of grant.
(ii) Mr. Westenberger was granted 13,000 time-based stock options on February 16, 2010 with a Black-Scholes fair value of $11.89 per share and an exercise price of $28.04 per share, 12,000 time-based stock options on February 24, 2011 with a Black-Scholes fair value of $12.00 per share and an exercise price of $28.44 per share and 8,000 time-based stock options on February 22, 2012 with a Black-Scholes fair value of $15.27 per share and an exercise price of $42.61 per share. These grants vest in four equal, annual installments following the date of grant.
(iii) Ms. Fitzgerald was granted 40,000 time-based stock options on February 16, 2010 with a Black-Scholes fair value of $11.89 per share and an exercise price of $28.04 per share, 12,000 time-based stock options on February 24, 2011 with a Black-Scholes fair value of $12.00 per share and an exercise price of $28.44 per share and 8,000 time-based stock options on February 22, 2012 with a Black-Scholes fair value of $15.27 per share and an exercise price of $42.61 per share. These grants vest in four equal, annual installments following the date of grant.
(iv) Mr. Lynch was granted 12,000 time-based stock options on February 24, 2011 with a Black-Scholes fair value of $12.00 per share and an exercise price of $28.44 per share and 8,000 time-based stock options on February 22, 2012 with a Black-Scholes fair value of $15.27 per share and an exercise price of $42.61 per share. These grants vest in four equal, annual installments following the date of grant.
(v) Mr. Rork was granted 30,000 time-based stock options on May 12, 2011 with a Black-Scholes fair value of $12.50 per share and an exercise price of $30.18 per share and 8,000 time-based stock options on February 22, 2012 with a Black-Scholes fair value of $15.27 per share and an exercise price of $42.61 per share. These grants vests in four equal, annual installments following the date of grant.
(vi) Mr. Petty was granted 8,000 time-based stock options on February 22, 2012 with a Black-Scholes fair value of $15.27 per share and an exercise price of $42.61 per share.
(c) The amounts shown as “All Other Compensation” for fiscal 2012 consist of the following:
Name
401(k) Company
Match RelocationPerquisites
(i)
Tax Gross-Ups
(ii) Total
Michael D. Casey . . . . . . . . . . . . . . . . . . . . . . . . . . . . . . . . . . . . . . . $22,500 $ — $ — $ — $22,500Richard F. Westenberger . . . . . . . . . . . . . . . . . . . . . . . . . . . . . . . . . $17,000 $ — $ — $ — $17,000Lisa A. Fitzgerald . . . . . . . . . . . . . . . . . . . . . . . . . . . . . . . . . . . . . . . $22,500 $ — $ — $ — $22,500Brian J. Lynch . . . . . . . . . . . . . . . . . . . . . . . . . . . . . . . . . . . . . . . . . . $22,500 $ — $ — $ — $22,500Christopher W. Rork . . . . . . . . . . . . . . . . . . . . . . . . . . . . . . . . . . . . $13,794 $4,157 $44,078 $5,636 $67,665James C. Petty . . . . . . . . . . . . . . . . . . . . . . . . . . . . . . . . . . . . . . . . . . $22,500 $ — $ — $ — $22,500
(i) Rent payments for the apartment the Company maintains for Mr. Rork in Hong Kong.
(ii) Mr. Rork’s gross-up is comprised of amounts related to relocation reimbursements.
(d) Special one-time sign-on bonus for Ms. Fitzgerald.
(e) Special one-time sign-on bonus for Mr. Rork.

28
FISCAL 2012 GRANTS OF PLAN-BASED AWARDS
The following table provides information concerning each grant of plan-based awards made to a named executive officer in fiscal 2012. This includes incentive compensation awards granted under our Incentive Compensation Plan and stock option and restricted stock awards granted under our Equity Incentive Plan. The threshold, target, and maximum columns reflect the range of estimated payouts under these plans for fiscal 2012. The exercise price disclosed is equal to the closing market price of our common stock on the date of grant. The last column reports the aggregate grant date fair value of all awards made in fiscal 2012 as if they were fully vested on the grant date.
Estimated Future Payouts UnderNon-Equity Incentive Plan Awards
(a)
Estimated Future Payouts Under Equity Incentive Plan
Awards
Exerciseor BasePrice of OptionAwards($/Sh)
GrantDate FairValue of
Stock andOptionAwardsName
AwardType
EquityAwardGrantDate
Threshold($)
Target($)
Maximum($)
Threshold(#)
Target(#)
Maximum(#)
Michael D. Casey . . . . . . . . . . . Cash Incentive Compensation $ 265,625 $1,062,500 $2,125,000Shares (b) 2/22/2012 35,000 35,000 $1,491,350Shares (c) 2/22/2012 100,000 100,000 $4,261,000Options (d) 2/22/2012 70,000 70,000 $ 42.61 $1,068,900
Richard F. Westenberger . . . . Cash Incentive Compensation $ 90,000 $ 360,000 $ 720,000Shares (b) 2/22/2012 4,000 4,000 $ 170,440Shares (c) 2/22/2012 8,000 8,000 $ 340,880Options (d) 2/22/2012 8,000 8,000 $ 42.61 $ 122,160
Lisa A. Fitzgerald . . . . . . . . . . Cash Incentive Compensation $ 96,563 $ 386,250 $ 772,500Shares (b) 2/22/2012 4,000 4,000 $ 170,440Shares (c) 2/22/2012 8,000 8,000 $ 340,880Options (d) 2/22/2012 8,000 8,000 $ 42.61 $ 122,160
Brian J. Lynch . . . . . . . . . . . . . Cash Incentive Compensation $ 98,438 $ 393,750 $ 787,500Shares (b) 2/22/2012 4,000 4,000 $ 170,440Shares (c) 2/22/2012 8,000 8,000 $ 340,880Options (d) 2/22/2012 8,000 8,000 $ 42.61 $ 122,160
Christopher W. Rork . . . . . . . . Cash Incentive Compensation $ 87,188 $ 348,750 $ 697,500Shares (b) 2/22/2012 4,000 4,000 $ 170,440Shares (c) 2/22/2012 8,000 8,000 $ 340,880Options (d) 2/22/2012 8,000 8,000 $ 42.61 $ 122,160
James C. Petty . . . . . . . . . . . . . Cash Incentive Compensation $ 92,813 $ 371,250 $ 742,500Shares (b) 2/22/2012 4,000 4,000 $ 170,440Shares (c) 2/22/2012 8,000 8,000 $ 340,880Options (d) 2/22/2012 8,000 8,000 $ 42.61 $ 122,160
(a) The amounts shown under the “Threshold” column represent 25% of the target cash incentive compensation, assuming threshold level performance is achieved under the financial performance measures. The amounts shown under the “Target” column represent 100% of the target cash incentive compensation, assuming target level performance is achieved under the financial performance measures. The amounts shown under the “Maximum” column represent 200% of the target cash incentive compensation, assuming maximum level performance is achieved under the financial performance measures.
(b) Shares of time-based restricted stock were granted pursuant to the Company’s Equity Incentive Plan. These restricted shares vest ratably in four equal, annual installments following the date of grant.
(c) Shares of performance-based restricted stock were granted pursuant to the Company’s Equity Incentive Plan. These restricted shares vest upon meeting specific performance targets through fiscal 2014. Once vested, the performance-based restricted shares granted to Mr. Casey may not be sold for an additional one-year period (except to satisfy tax obligations resulting from vesting of such shares).
(d) Time-based stock options were granted pursuant to the Company’s Equity Incentive Plan. These stock options vest ratably in four equal, annual installments following the date of grant.

29
Proxy
OPTION EXERCISES AND STOCK VESTED IN FISCAL 2012
The following table provides information concerning our named executive officers’ exercises of stock options and vesting of restricted stock during fiscal 2012. The table reports, on an aggregate basis, the number of securities acquired upon exercise of stock options, the dollar value realized upon exercise of stock options, the number of shares of restricted stock that have vested, and the dollar value realized upon the vesting of restricted stock.
Option Awards Stock Awards
Name
Number ofShares Acquired
on Exercise(#)
Value Realizedon Exercise
($) (a)
Number ofShares Acquired
on Vesting(#)
Value Realizedon Vesting
($) (b)
Michael D. Casey . . . . . . . . . . . . . . . . . . . . — $ — 32,500 $1,480,800Richard F. Westenberger . . . . . . . . . . . . . . — $ — 7,500 $ 324,060Lisa A. Fitzgerald . . . . . . . . . . . . . . . . . . . . — $ — 9,000 $ 393,040Brian J. Lynch . . . . . . . . . . . . . . . . . . . . . . . 20,000 $ 540,300 9,750 $ 445,073Christopher W. Rork . . . . . . . . . . . . . . . . . — $ — 3,750 $ 190,275James C. Petty . . . . . . . . . . . . . . . . . . . . . . . 70,250 $1,969,675 13,750 $ 664,750
(a) Aggregate dollar amount was calculated by multiplying the number of shares acquired by the difference between the market price of the underlying securities at the time of exercise and the exercise price of the stock options.
(b) Aggregate dollar amount was calculated by multiplying the number of shares acquired on vesting by the market price of the Company’s stock on the date of vesting.

30
OUTSTANDING EQUITY AWARDS AT FISCAL 2012 YEAR-END
The following table provides information regarding unexercised stock options, stock that has not yet vested, and equity incentive plan awards for each named executive officer outstanding as of the end of fiscal 2012. Each outstanding award is represented by a separate row that indicates the number of securities underlying the award.
Option Awards Stock Awards
Name
Number ofSecurities
UnderlyingUnexercised
Options(#)
(Exercisable)
Number ofSecurities
UnderlyingUnexercised
Options(#) (a)
(Unexercisable)
Equity IncentivePlan Awards:
Number ofSecurities
UnderlyingUnexercisedUnearnedOptions
(#)
OptionExercise
Price($)
OptionExpiration
Date
Equity IncentivePlan Awards:
Number ofUnearned Shares,
Units orOther Rights
That HaveNot Vested
(#) (b)
Equity IncentivePlan Awards:
Market orPayout Value of
Unearned Shares,Units or Other
Rights That HaveNot Vested
($) (c)
Michael D. Casey . . . . . . . . . . . 200,000 $ 14.81 3/22/201412,000 $ 34.32 2/16/201612,000 $ 22.19 2/15/2017
125,000 $ 17.90 8/6/201875,000 25,000 $ 18.14 3/12/201940,000 40,000 $ 28.04 2/16/202020,000 60,000 $ 28.44 2/24/2021
70,000 $ 42.61 2/22/2022296,250 $16,068,600
Richard F. Westenberger . . . . 15,000 5,000 $ 16.84 2/6/20196,500 6,500 $ 28.04 2/16/20203,000 9,000 $ 28.44 2/24/2021
8,000 $ 42.61 2/22/202228,500 $ 1,545,840
Lisa A. Fitzgerald . . . . . . . . . . 20,000 20,000 $ 28.04 2/16/20203,000 9,000 $ 28.44 2/24/2021
8,000 $ 42.61 2/22/202234,000 $ 1,844,160
Brian J. Lynch . . . . . . . . . . . . . 2,800 $ 34.32 2/16/20166,000 $ 22.19 2/15/20178,000 $ 22.79 12/3/20178,000 $ 14.48 5/8/2018
15,000 5,000 $ 18.14 3/12/20196,500 6,500 $ 28.04 2/16/20203,000 9,000 $ 28.44 2/24/2021
8,000 $ 42.61 2/22/202232,250 $ 1,749,240
Christopher W. Rork . . . . . . . . 7,500 22,500 $ 30.18 5/12/20218,000 $ 42.61 2/22/2022
23,250 $ 1,261,080
James C. Petty . . . . . . . . . . . . . 56,250 $ 14.18 7/1/201812,500 6,250 $ 18.14 3/12/20195,250 10,500 $ 28.04 2/16/20203,000 9,000 $ 28.44 2/24/2021
8,000 $ 42.61 2/22/202229,250 $ 1,586,520

31
Proxy
(a) Unexercisable options relate to the following awards:
(i) Mr. Casey was granted 100,000 time-based stock options on March 12, 2009 with a Black-Scholes fair value of $7.63 per share and an exercise price of $18.14 per share, 80,000 time-based stock options on February 16, 2010 with a Black-Scholes fair value of $11.89 per share and an exercise price of $28.04 per share, 80,000 time-based stock options on February 24, 2011 with a Black-Scholes fair value of $12.00 per share and an exercise price of $28.44 per share and 70,000 time-based stock options on February 22, 2012 with a Black-Scholes fair value of $15.27 per share and an exercise price of $42.61 per share. These stock option grants vest in four equal, annual installments following the date of grant.
(ii) Mr. Westenberger was granted 20,000 time-based stock options on February 6, 2009 with a Black-Scholes fair value of $7.05 per share and an exercise price of $16.84 per share, 13,000 time-based stock options on February 16, 2010 with a Black-Scholes fair value of $11.89 per share and an exercise price of $28.04 per share, 12,000 time-based stock options on February 24, 2011 with a Black-Scholes fair value of $12.00 per share and an exercise price of $28.44 per share, and 8,000 time-based stock options on February 22, 2012 with a Black-Scholes fair value of $15.27 per share and an exercise price of $42.61 per share. These stock option grants vest in four equal, annual installments following the date of grant.
(iii) Ms. Fitzgerald was granted 40,000 time-based stock options on February 16, 2010 with a Black-Scholes fair value of $11.89 per share and an exercise price of $28.04 per share, 12,000 time-based stock options on February 24, 2011 with a Black-Scholes fair value of $12.00 per share and an exercise price of $28.44 per share, and 8,000 time-based stock options on February 22, 2012 with a Black-Scholes fair value of $15.27 per share and an exercise price of $42.61 per share. These stock option grants vest in four equal, annual installments following the date of grant.
(iv) Mr. Lynch was granted 20,000 time-based stock options on March 12, 2009 with a Black-Scholes fair value of $7.63 per share and an exercise price of $18.14 per share, 13,000 time-based stock options on February 16, 2010 with a Black-Scholes fair value of $11.89 per share and an exercise price of $28.04 per share, 12,000 time-based stock options on February 24, 2011 with a Black-Scholes fair value of $12.00 per share and an exercise price of $28.44 per share, and 8,000 time-based stock options on February 22, 2012 with a Black-Scholes fair value of $15.27 per share and an exercise price of $42.61 per share. These stock option grants vest in four equal, annual installments following the date of grant.
(v) Mr. Rork was granted 30,000 time-based stock options on May 12, 2011 with a Black-Scholes fair value of $12.50 per share and an exercise price of $30.18 per share, and 8,000 time-based stock options on February 22, 2012 with a Black-Scholes fair value of $15.27 per share and an exercise price of $42.61 per share. These stock option grants vest in four equal, annual installments following the date of grant.
(vi) Mr. Petty was granted 25,000 time-based stock options on March 12, 2009 with a Black-Scholes fair value of $7.63 per share and an exercise price of $18.14 per share, 21,000 time-based stock options on February 16, 2010 with a Black-Scholes fair value of $11.89 per share and an exercise price of $28.04 per share, 12,000 time-based stock options on February 24, 2011 with a Black-Scholes fair value of $12.00 per share and an exercise price of $28.44 per share, and 8,000 time-based stock options on February 22, 2012 with a Black-Scholes fair value of $15.27 per share and an exercise price of $42.61 per share. These stock option grants vest in four equal, annual installments following the date of grant.
(b) Equity Incentive Plan awards relate to the following grants:
(i) Mr. Casey was granted 75,000 shares of performance-based restricted stock on August 7, 2008 with a grant date fair value of $17.92 per share. Fifty percent of these shares vested on March 2, 2011 and 25% vested on December 31, 2011. The remaining 25% of these shares vested on December 31, 2012. Mr. Casey was granted 50,000 shares of time-based restricted stock on March 12, 2009 with a grant date fair value of $18.14 per share, 40,000 shares of time-based restricted stock on February 16, 2010 with a grant date fair value of $28.04 per share, 40,000 shares of time-based restricted stock on February 24, 2011 with a grant date fair value of $28.44 per share, and 35,000 shares of time-based restricted stock on February 22, 2012 with a grant date fair value of $42.61 per share. These grants vest in four equal, annual installments following the date of grant. Mr. Casey was granted 80,000 shares of performance-based restricted stock on March 30, 2011 with a grant date fair of $28.39 per share, and 100,000 shares of performance-based restricted stock on February 22, 2012 with a grant date fair value of $42.61 per share. Vesting of these shares is contingent upon meeting specific performance targets through fiscal 2014. Once vested, the performance-based restricted shares granted in 2012 may not be sold for an additional one year period (except to satisfy tax obligations resulting from vesting of such shares).
(ii) Mr. Westenberger was granted 10,000 shares of time-based restricted stock on February 6, 2009 with a grant date fair value of $16.84 per share, 4,000 shares of time-based restricted stock on February 16, 2010 with a grant date fair value of $28.04 per share, and 16,000 shares of time-based restricted stock on February 24, 2011 with a grant date fair value of $28.44 per share, and 4,000 shares of time-based restricted stock on February 22, 2012 with a grant date fair value of $42.61 per share. These grants vest in four equal, annual installments following the date of grant. Additionally, Mr. Westenberger was granted 8,000 shares of performance-based restricted stock on February 22, 2012 with a grant date fair value of $42.61 per share. Vesting of these shares is contingent upon meeting specific performance targets through fiscal 2014.
(iii) Ms. Fitzgerald was granted 20,000 shares of time-based restricted stock on February 16, 2010 with a grant date fair value of $28.04 per share, 16,000 shares of time-based restricted stock on February 24, 2011 with a grant date fair value of $28.44 per share, and 4,000 shares of time-based restricted stock on February 22, 2012 with a grant date fair value of $42.61 per share. These grants vest in four equal, annual installments following the date of grant. Additionally,

32
Ms. Fitzgerald was granted 8,000 shares of performance-based restricted stock on February 22, 2012 with a grant date fair value of $42.61 per share. Vesting of these shares is contingent upon meeting specific performance targets through fiscal 2014.
(iv) Mr. Lynch was granted 10,000 shares of time-based restricted stock on March 12, 2009 with a grant date fair value of $18.14 per share, 4,000 shares of time-based restricted stock on February 16, 2010 with a grant date fair value of $28.04 per share, 21,000 shares of time-based restricted stock on February 24, 2011 with a grant date fair value of $28.44 per share, and 4,000 shares of time-based restricted stock on February 22, 2012 with a grant date fair value of $42.61 per share. These grants vest in four equal, annual installments following the date of grant. Additionally, Mr. Lynch was granted 8,000 shares of performance-based restricted stock on February 22, 2012 with a grant date fair value of $42.61 per share. Vesting of these shares is contingent upon meeting specific performance targets through fiscal 2014.
(v) Mr. Rork was granted 15,000 shares of time-based restricted stock on May 12, 2011 with a grant date fair value of $30.18 per share and 4,000 shares of time-based restricted stock on February 22, 2012 with a grant date fair value of $42.61 per share. These grants vest in four equal, annual installments following the date of grant. Additionally, Mr. Rork was granted 8,000 shares of performance-based restricted stock on February 22, 2012 with a grant date fair value of $42.61 per share. Vesting of these shares is contingent upon meeting specific performance targets through fiscal 2014.
(vi) Mr. Petty was granted 7,000 shares of time-based restricted stock on March 12, 2009 with a grant date fair value of $18.14 per share, 7,000 shares of time-based restricted stock on February 16, 2010 with a grant date fair value of $28.04 per share, 16,000 shares of time-based restricted stock on February 24, 2011 with a grant date fair value of $28.44 per share, and 4,000 shares of time-based restricted stock on February 22, 2012 with a grant date fair value of $42.61 per share. These grants vest in four equal, annual installments following the date of grant. Additionally, Mr. Petty was granted 8,000 shares of performance-based restricted stock on February 22, 2012 with a grant date fair value of $42.61 per share. Vesting of these shares is contingent upon meeting specific performance targets through fiscal 2014.
(c) Amount based on the closing market price per share of the Company’s common stock on, December 29, 2012 of $54.24.

33
Proxy
SECURITIES OWNERSHIP OF BENEFICIAL OWNERS, DIRECTORS, AND EXECUTIVE OFFICERS
The following table sets forth the number of shares of the Company’s common stock owned by each of the following parties as of March 26, 2013, or as of such other date as indicated: (a) each person known by the Company to own beneficially more than five percent of the outstanding common stock; (b) the Company’s named executive officers; (c) each Director; and (d) all Directors and executive officers as a group. Unless otherwise indicated below, the holders’ address is 1170 Peachtree Street NE, 9th Floor, Atlanta, Georgia 30309.
Beneficial Ownership
Name of Beneficial Owner Shares Percent
Viking Global Investors L.P. (1) . . . . . . . . . . . . . . . . . . . . . . . . . . . . . . . 3,738,900 6.3%S.A.C. Capital Advisors, L.P. (2) . . . . . . . . . . . . . . . . . . . . . . . . . . . . . . . 3,000,213 5.1%Hoplite Capital Management LLC (3) . . . . . . . . . . . . . . . . . . . . . . . . . . 2,980,990 5.0%Matrix Capital Management Company LLC (4) . . . . . . . . . . . . . . . . . . 2,975,000 5.0%Michael D. Casey (5) . . . . . . . . . . . . . . . . . . . . . . . . . . . . . . . . . . . . . . . . 1,179,708 2.0%Richard F. Westenberger (6) . . . . . . . . . . . . . . . . . . . . . . . . . . . . . . . . . . 82,382 *Lisa A. Fitzgerald (7) . . . . . . . . . . . . . . . . . . . . . . . . . . . . . . . . . . . . . . . . 87,899 *Brian J. Lynch (8) . . . . . . . . . . . . . . . . . . . . . . . . . . . . . . . . . . . . . . . . . . . 125,890 *Christopher W. Rork (9) . . . . . . . . . . . . . . . . . . . . . . . . . . . . . . . . . . . . . . 53,926 *Amy Woods Brinkley . . . . . . . . . . . . . . . . . . . . . . . . . . . . . . . . . . . . . . . . 12,700 *Vanessa J. Castagna . . . . . . . . . . . . . . . . . . . . . . . . . . . . . . . . . . . . . . . . . 14,930 *A. Bruce Cleverly . . . . . . . . . . . . . . . . . . . . . . . . . . . . . . . . . . . . . . . . . . . 18,439 *Jevin S. Eagle (10) . . . . . . . . . . . . . . . . . . . . . . . . . . . . . . . . . . . . . . . . . . . 13,036 *Paul Fulton . . . . . . . . . . . . . . . . . . . . . . . . . . . . . . . . . . . . . . . . . . . . . . . . 118,055 *William J. Montgoris . . . . . . . . . . . . . . . . . . . . . . . . . . . . . . . . . . . . . . . . 27,347 *David Pulver . . . . . . . . . . . . . . . . . . . . . . . . . . . . . . . . . . . . . . . . . . . . . . . 45,756 *John R. Welch . . . . . . . . . . . . . . . . . . . . . . . . . . . . . . . . . . . . . . . . . . . . . . 67,066 *Thomas E. Whiddon (11) . . . . . . . . . . . . . . . . . . . . . . . . . . . . . . . . . . . . . 84,485 *All directors and executive officers as a group (12) . . . . . . . . . . . . . . . 2,103,673 3.5%
* Indicates less than 1% of our common stock.
(1) This information is based on Schedule 13G/A, filed with the SEC on February 14, 2013. Viking Global Investors L.P. has shared voting power and dispositive power covering 3,738,900 shares of our common stock. Viking Global Performance LLC has shared voting and dispositive power covering 3,342,700 shares of our common stock. Viking Long Fund GP LLC has shared voting and dispositive power covering 396,200 shares of our common stock. Viking Global Equities L.P. has shared voting and dispositive power covering 1,119,900 shares of our common stock. Viking Global Equities II L.P. shared voting and dispositive power covering 66,500 shares of our common stock. VGE III Portfolio Ltd. has shared voting and dispositive power covering 2,156,300 shares of our common stock. Viking Long Fund Master Ltd has shared voting and dispositive power covering 396,200 shares of our common stock. O. Andreas Halvorsen, David C. Ott, Thomas W. Purcell, Jr. and Daniel S. Sundheim have shared voting and dispositive power covering 3,738,900 shares of our common stock. The address for Viking Global Investors L.P. is 55 Railroad Avenue, Greenwich, CT 06830.
(2) This information is based on Schedule 13G, filed with the SEC on March 19, 2013. S.A.C. Capital Advisors, L.P. has shared voting power and dispositive power covering 2,174,313 shares of our common stock. S.A.C. Capital Advisors, Inc. has shared voting and dispositive power covering 2,174,313 shares of our common stock. CR Intrinsic Investors, LLC has shared voting and dispositive power covering 220,900 shares of our common stock. Sigma Capital Management, LLC has shared voting and dispositive power covering 605,000 shares of our common stock. Steven A. Cohen has shared voting and dispositive power covering 3,000,213 shares of our common stock. The address for S.A.C. Capital Advisors, L.P. is 72 Cummings Point Road, Stamford, CT 06902.
(3) This information is based on Schedule 13G, filed with the SEC on February 14, 2013. Hoplite Capital Management LLC has voting power and dispositive power covering 2,980,990 shares of our common stock. John T. Lykouretzos has shared voting and dispositive power covering 2,980,990 shares of our common stock. The address for Hoplite Capital Management LLC is 810 Seventh Avenue, 34th Floor, New York, NY 10019.

34
(4) This information is based on Form 13F, filed with the SEC on February 14, 2013. Matrix Capital Management Company LLC has sole voting and sole dispositive power covering 2,975,000 shares of our common stock. The address for Matrix Capital Management Company, LLC is 1000 Winter Street, Waltham, MA 02451.
(5) Includes 566,500 shares subject to exercisable stock options, including stock options that will become exercisable during the 60 days after March 26, 2013 and 311,250 shares of restricted common stock.
(6) Includes 37,750 shares subject to exercisable stock options, including stock options that will become exercisable during the 60 days after March 26, 2013 and 32,000 shares of restricted common stock.
(7) Includes 38,000 shares subject to exercisable stock options, including stock options that will become exercisable during the 60 days after March 26, 2013 and 36,000 shares of restricted common stock.
(8) Includes 62,550 shares subject to exercisable stock options, including stock options that will become exercisable during the 60 days after March 26, 2013 and 49,500 shares of restricted common stock.
(9) Includes 17,000 shares subject to exercisable stock options, including stock options that will become exercisable during the 60 days after March 26, 2013 and 30,500 shares of restricted common stock.
(10) Includes 4,229 shares of restricted common stock.
(11) Includes 16,000 shares subject to exercisable stock options, including stock options that will become exercisable during the 60 days after March 26, 2013.
(12) Includes 792,800 shares subject to exercisable stock options, including stock options that will become exercisable during the 60 days after March 26, 2013.
Section 16(a) Beneficial Ownership Reporting Compliance
Section 16(a) of the Securities Exchange Act of 1934, as amended, requires that the Company’s executive officers and directors, and persons who beneficially own more than ten percent (10%) of the Company’s common stock, file initial reports of ownership and changes in ownership with the SEC and the NYSE. Based on a review of the copies of such forms furnished to the Company, the Company believes that all forms were filed in a timely manner during fiscal 2012, except for one late Form 4 filed by Paul Fulton in connection with one transaction.
EQUITY COMPENSATION PLAN INFORMATION
The following table provides information about the Company’s equity compensation plan as of the end of its last fiscal year:
Plan Category
Number of securities
to be issued upon exercise of
outstanding options, warrants, and rights
Weighted-average exercise price of
outstanding options, warrants, and rights
Number of securities remaining available for future
issuance under equity compensation plans (excluding securities
reflected infirst column)
Equity compensation plans approved by security holders (1) . . . . . . . . . . . . . . . . . . . . . 2,078,433 (1) $26.14 3,241,657
Equity compensation plans not approved by security holders . . . . . . . . . . . . . . . . . . . . . . . . — — —
Total . . . . . . . . . . . . . . . . . . . . . . . . . . . . . . . . . . . . 2,078,433 $26.14 3,241,657
(1) Represents stock options that are outstanding or that are available for future issuance pursuant to the Company’s Amended and Restated Equity Incentive Plan.

35
Proxy
PROPOSAL NUMBER TWO ADVISORY VOTE ON APPROVAL OF EXECUTIVE COMPENSATION
The Compensation Discussion and Analysis section of this proxy statement beginning on page 16 describes the Company’s executive compensation program and the compensation decisions that the Compensation Committee and Board of Directors made in 2012 with respect to the compensation of the Company’s named executive officers.
The Company is committed to achieving long-term, sustainable growth and increasing shareholder value. The Company’s compensation program for its named executive officers is designed to support these objectives and encourage strong financial performance on an annual and long-term basis by linking a significant portion of the named executive officers’ total direct compensation to Company performance in the form of incentive compensation.
The Board of Directors is asking shareholders to cast a non-binding, advisory vote FOR the following resolution:
“RESOLVED, that the compensation paid to the Company’s named executive officers, as disclosed pursuant to Item 402 of Regulation S-K, including the Compensation Discussion and Analysis, compensation tables and narrative discussion, is hereby APPROVED.”
This proposal is commonly referred to as the “say-on-pay” vote. This vote is not intended to address any specific item of compensation, but rather the overall compensation of our named executive officers and the policies and practices described in this proxy statement. Although the vote we are asking you to cast is non-binding, the Compensation Committee and the Board value the views of our shareholders and intend to consider the outcome of the vote when determining future compensation arrangements for our named executive officers.
The Board recommends a vote FOR the approval of compensation of the Company’s named executive officers as disclosed in this proxy statement.
Vote Required
Because this Proposal Number Two asks for a non-binding, advisory vote, there is no required vote that would constitute approval. We value the opinions expressed by our shareholders in this advisory vote, and our Compensation Committee will consider the outcome of the vote when designing our compensation programs and making future compensation decisions for our named executive officers. Abstentions and broker non-votes, if any, will not have any impact on this advisory vote.
TRANSACTIONS WITH RELATED PERSONS, PROMOTERS, AND CERTAIN CONTROL PERSONS
The Company has a written policy that requires all transactions with related persons be reviewed by our Chief Financial Officer, and all such transactions involving more than $10,000 be reviewed with and approved by our Audit Committee. Our Chief Financial Officer annually reviews all transactions with related persons with our Audit Committee.
There were no such transactions during fiscal 2012.

36
AUDIT COMMITTEE REPORT
The Audit Committee reviews the Company’s accounting, auditing, and financial reporting process on behalf of the Board. The Audit Committee’s charter is available in the Investor Relations section of our website at www.carters.com. Management has the primary responsibility for establishing and maintaining adequate internal financial controls, for preparing the financial statements, and for the public reporting process. PwC, the Company’s independent registered public accounting firm, is responsible for expressing opinions on the conformity of the Company’s audited consolidated financial statements with accounting principles generally accepted in the United States of America and on the effectiveness of the Company’s internal control over financial reporting.
The Audit Committee has reviewed and discussed with management and PwC the audited consolidated financial statements for the fiscal year ended December 29, 2012 and PwC’s evaluation of the effectiveness of the Company’s internal control over financial reporting. The Audit Committee has discussed with PwC the matters that are required to be discussed by the Statement on Auditing Standards No. 61, as amended (AICPA, Professional Standards, Vol. 1, AU section 380), as adopted by the Public Company Accounting Oversight Board in Rule 3200T. The Audit Committee has received the written disclosures and the letter from PwC required by applicable requirements of the Public Company Accounting Oversight Board regarding PwC’s communications with the Audit Committee concerning independence, and has discussed with PwC the firm’s independence.
Based on the considerations and discussions referred to above, the Audit Committee recommended to our Board of Directors that the audited consolidated financial statements for the fiscal year ended December 29, 2012 be included in our Annual Report on Form 10-K for fiscal 2012 for filing with the SEC.
Submitted by the Audit Committee
Mr. David Pulver, Chairman Ms. Amy Woods Brinkley Mr. William J. Montgoris Mr. Thomas E. Whiddon

37
Proxy
PROPOSAL NUMBER THREE RATIFICATION OF INDEPENDENT REGISTERED PUBLIC ACCOUNTING FIRM
The Audit Committee of the Board of Directors has appointed PwC to serve as the Company’s independent registered public accounting firm for fiscal 2013. The Board is submitting the appointment of PwC as the Company’s independent registered public accounting firm for shareholder ratification. The Board recommends that shareholders ratify this appointment at the Annual Meeting. Shareholder ratification of the appointment of PwC is not required by law or otherwise. The Board is submitting this matter to shareholders for ratification because the Board believes it to be a good corporate practice. If the shareholders do not ratify the appointment, the Audit Committee may reconsider whether or not to retain PwC. Even if the appointment is ratified, the Audit Committee may appoint a different independent registered public accounting firm at any time during the year if, in its discretion, it determines that such a change would be in the Company’s best interest and that of the Company’s shareholders. A representative of PwC is expected to attend the Annual Meeting, and he or she will have the opportunity to make a statement and be available to respond to appropriate questions. For additional information regarding the Company’s relationship with PwC, please refer to the Audit Committee Report above.
The Audit Committee has also adopted policies and procedures for pre-approving all non-audit work performed by PwC. The Audit Committee has pre-approved the use of PwC for specific types of services that fall within categories of non-audit services, including various tax services. The Audit Committee receives regular updates as to the fees associated with the services that are subject to pre-approval. Services that do not fall within a pre-approved category require specific consideration and pre-approval by the Audit Committee.
The aggregate fees that the Company incurred for professional services rendered by PwC for fiscal years 2012 and 2011 were as follows:
2012 2011
Audit Fees . . . . . . . . . . . . . . . . . . . . . . . . . . . . . . . . . $ 1,260,100 $ 1,084,900Audit-Related Fees . . . . . . . . . . . . . . . . . . . . . . . . . . — 211,902Tax Fees . . . . . . . . . . . . . . . . . . . . . . . . . . . . . . . . . . . 3,425 —All Other Fees . . . . . . . . . . . . . . . . . . . . . . . . . . . . . . 3,640 3,640
Total Fees . . . . . . . . . . . . . . . . . . . . . . . . . . . . . . . $ 1,267,165 $ 1,300,442
• Audit Fees for fiscal years 2012 and 2011 were for professional services rendered for the integrated audit of the consolidated financial statements and internal control over financial reporting of the Company, other auditing procedures related to the adoption of new accounting pronouncements and review of other significant transactions, and related out-of-pocket expenses.
• Audit-Related Fees for fiscal 2011 were for professional services rendered in connection with the acquisition of our Canadian subsidiary and licensee audits.
• Tax Fees for fiscal 2012 were for assistance with an audit performed by the State of California.
• All Other Fees for fiscal years 2012 and 2011 consisted of software license fees.
The Board recommends a vote FOR the ratification of the appointment of PricewaterhouseCoopers LLP as the Company’s independent registered public accounting firm.
Vote Required
The approval of Proposal Number Three requires the affirmative vote of a majority of the votes properly cast at our Annual Meeting. Abstentions will not affect the outcome of this proposal. A broker or other nominee will generally have discretionary authority to vote on this proposal because it is considered a routine matter, and, therefore, we do not expect broker non-votes with respect to this proposal.

38
OTHER MATTERS
As of the date of this proxy statement, we know of no business that will be presented for consideration at the Annual Meeting, other than the items referred to above. If any other matter is properly brought before the Annual Meeting for action by shareholders, proxies in the enclosed form returned to the Company will be voted in accordance with the recommendation of the Board or, in the absence of such a recommendation, in accordance with the judgment of the proxy holder.

A-1
Proxy
APPENDIX A
2012 RETAIL SURVEY PARTICIPANT LIST
Abercrombie & Fitch Co.Aeropostale, Inc.American Eagle Outfitters, Inc.Ann Taylor Stores CorporationAscena Retail Group, Inc.Bebe Stores, Inc.Belk, Inc.Body Central Corp.Burlington Coat FactoryCharlotte Russe Holding, Inc.Charming Shoppes, Inc.Chico’s FAS, Inc.The Children’s Place Retail Stores, Inc.Coach, Inc.Collective Brands, Inc.Destination Maternity CorporationDick’s Sporting Goods, IncDSW, Inc.Express, Inc.Fifth & Pacific Companies, Inc.Finish Line, Inc.Foot Locker, Inc.Fossil, Inc.Gap Inc.Hot Topic, Inc.J. C. Penney Company, Inc.J. Crew Group, Inc.
America’s Collectibles Network, Inc. (Jewelry Television)Kenneth Cole Productions, Inc.Kohl’s CorporationL.L. Bean, Inc.Limited Brands, Inc.Limited Stores, LLCLord & TaylorMacy’s, Inc.Neiman Marcus, Inc.New York & Company, Inc.Nordstrom, Inc.Perry Ellis International, Inc.Phillips-Van Heusen CorporationPinnacle Textile Industries, LLC.Polo Ralph Lauren CorporationQVC, Inc.Retail Brand Alliance, Inc. (Brooks Brothers)Ross Stores, Inc.rue21, inc.Saks IncorporatedSears Holding CorporationStage Stores, Inc.The Bon-Ton Stores, Inc.The Sports Authority, Inc.The Talbots, Inc.TJX Companies, Inc.Vera Bradley, Inc.

(This page intentionally left blank.)

(This page intentionally left blank.)

(This page intentionally left blank.)

This page intentionally left blank.

AnnualMeeting
The2013AnnualMeetingofShareholders willbeheldat8:00a.m.onMay9,2013. The meeting will be held at our offices located at:
1170PeachtreeStreetNE 6thFloorAtlanta,Georgia30309
CommonStock
Symbol: CRIExchange:NewYorkStockExchange
TransferAgent
American Stock Transfer & Trust Company, LLC 620115thAvenueBrooklyn,NewYork11219(800)937-5449
IndependentRegisteredPublicAccountingFirm
PricewaterhouseCoopers LLP 300AtlanticStreetStamford,Connecticut06901
LegalCounsel
Ropes&GrayLLPPrudential Tower800 Boylston StreetBoston,Massachusetts02199
InvestorRelations
For further information on Carter’s, Inc., or for additional copies of this Annual Report, Proxy Statement, Form 10-K, or other financial information, please visit the investor relations section of the Company’s website at www.carters.com. You may also contact Carter’[email protected](404)745-2889.
©2013Carter’s,Inc.Allrightsreserved.Carter’s, Count on Carter’s, Just One You, Precious Firsts, Child of Mine, Simple Joys, OshKosh B’gosh, OshKosh, and Genuine Kids are trademarks owned by subsidiaries of Carter’s, Inc.
All market share data provided in this Annual Report is based on informationprovidedbyNPDGroup,Inc.asofFebruary27,2013.References to specific market share are expressed as a percentage of total retail sales of a particular market.

LeadershipTeam
MichaelD.CaseyChairman of the Board of Directors &ChiefExecutiveOfficer
BrianJ.LynchPresident
KevinD.CorningExecutiveVicePresident,International
LisaC.EvansExecutiveVicePresident&Brand Leader for Carter’s
LisaA.FitzgeraldExecutiveVicePresident&Brand Leader for OshKosh B’gosh
WilliamG.FoglesongSeniorVicePresidentofMarketing
ChristopherW.RorkExecutiveVicePresident of Supply Chain
RichardF.WestenbergerExecutiveVicePresident & Chief Financial Officer
JeffreyB.WilliamsSeniorVicePresidentofRetail
JillA.WilsonSeniorVicePresidentofHuman Resources & Talent Development
PaulFulton2 (Chair)
Non-ExecutiveChairman, Bassett Furniture Industries, Inc.Former President,Sara Lee Corporation
WilliamJ.Montgoris1
Former Chief Operating Officer & Former Chief Financial Officer,The Bear Stearns Companies, Inc.
DavidPulver1 (Chair)
President,Cornerstone Capital, Inc.Former Chairman & Co-ChiefExecutiveOfficer,The Children’s Place, Inc.
JohnR.Welch2,3 (Chair)
Former President,MastIndustries(FarEast)Ltd.
ThomasE.Whiddon*1,3
FormerExecutiveVicePresident- Logistics & Technology and Former Chief Financial Officer, Lowe’s Companies, Inc.
*Lead Independent Director
Board Committees:1 Audit2 Compensation3NominatingandCorporateGovernance
BoardofDirectors
AmyWoodsBrinkley1
Former Chief Risk Officer &Former President Consumer Products Division,Bank of America Corporation
MichaelD.CaseyChairman of the Board of Directors &ChiefExecutiveOfficer
VanessaJ.Castagna3
FormerExecutiveChairwoman,Mervyns,LLCFormer Chairwoman & ChiefExecutiveOfficer,JCPenney Stores, Catalog & Internet for J. C. Penney Company, Inc.
A.BruceCleverly2,3
FormerPresident,GlobalOralCareDivision,TheProcter&GambleCompany
JevinS.Eagle2
ChiefExecutiveOfficer,DavidsTea Inc.FormerExecutiveVicePresident,MerchandisingandMarketing,Staples, Inc.


248097_OshKosh_CVR_R5.indd 2 4/4/13 11:27 PM

Carter’s, Inc. 2012 A
nnual Report
Carter’s, Inc. 2012 Annual ReportCarter’s, Inc. | 1170 Peachtree Street NE, Suite 900 | Atlanta, Georgia 30309 | 404-745-2700carters.com | oshkoshbgosh.com