carrier or mode? - the dilemma of shippers’ choice in ... · what choice alternatives do shippers...
TRANSCRIPT
Carrier or Mode? - The Dilemma of Shippers’ Choice in Freight Modelling
Nikolaus Fries
Travel Survey Metadata Series 43 July 2013

Travel Survey Metadata Series
Carrier or Mode? - The Dilemma of Shippers’ Choice in Freight Modelling
Nikolaus Fries IVT, ETH Zürich Wolfgang-Pauli-Strasse 15 CH-8093 Zürich
May 2013
Abstract
What choice alternatives do shippers actually have when shipping their products to a customer: do they choose among a number of transport solutions offered to them by transport service providers with certain service characteristics, or is it a choice between physical transport modes (e.g. road, rail, intermodal transport etc.)?
These questions arise regularly in freight demand modelling, when Stated Preference (SP) experiments are carried out to investigate shippers’ behaviour in transport chain organisation. Most research published so far has focussed on transport mode choice, whereas more recent projects have considered choice of transport service provider and service specifications and not transport mode explicitly. Both approaches seem justified depending on the specific research question.
This report describes an SP experiment designed to quantify the impact of environmental aspects on the choice of freight transport services. Since the choice of transport mode has an impact on emissions, a combined approached was selected, which integrates both, transport mode and service criteria (i.e. punctuality, transit time, and emissions) as characteristic choice elements.
Keywords
Freight transportation, Freight demand modelling, Transport mode choice, Stated Preference (SP)
Preferred citation style
Fries, N. (2013) Carrier or Mode? - The Dilemma of Shippers’ Choice in Freight Modelling, Travel Survey Metadata Series, 43, Institute for Transport Planning and Systems (IVT); ETH Zürich, Zürich.

Citation
Title: Carrier or Mode? - The Dilemma of Shippers’ Choice in Freight Modelling
IdentificationNumber: FreightCarrierOrMode
Authoring Entity: Nikolaus Fries (IVT, ETH Zürich)
Date of Production: 2013-02-18
Software used inProduction: Nesstar Publisher

Citation
Title: Carrier or Mode? - The Dilemma of Shippers’ Choice in Freight Modelling
IdentificationNumber: FreightCarrierOrMode
Authoring Entity: Nikolaus Fries (IVT, ETH Zürich)
Date of Production: 2013-02-18
Software used inProduction: Nesstar Publisher
Study Scope
Keywords: Freight transportation , Freight demand modelling , Transport mode choice , Stated Preference (SP)
Abstract:
What choice alternatives do shippers actually have when shipping their products to a customer: do they choose among anumber of transport services offered to them by certain transport providers, or is it a choice between physical transport modes(e.g. road, rail, intermodal transport etc.)? This question arises regularly in freight demand modelling, when Stated Preference(SP) experiments are carried out to investigate shippers’ behaviour in transport chain organisation. Most research published sofar has focussed on transport mode choice, whereas more recent projects have considered choice of transport service providerand not transport mode explicitly. Both approaches appear to be correct depending upon the design context. Researchers,however, often seem to neglect this question, although it is a potentially crucial design factor that must be considered whenplanning an SP experiment. The effect that this design decision has on freight mode choice models is as yet unexplored. Thispaper paves the way towards answering the question of which of these alternatives should be adopted and under whatcircumstances.

File: Freight Modelling - Carrier or Mode.NSDstat
Number of cases: 2716
No. of variables per record: 34
Type of File: NSDstat 200501

VariableGroups
Freight
Freight
Variables within Freight
Observation NumberRespondent NumberChoiceAlternative 1: Mode (Road,Rail or Intermodal)Alternative 1: Price (CHF)Alternative 1: Punctuality (on-time reliability in percent)Alternative 1: Transit TimeAlternative 1: Emission (Greenhouse-gas emissions)Alternative 2: Mode (Road,Rail or Intermodal)Alternative 2: Price (CHF)Alternative 2: Punctuality (on-time reliability in percent)Alternative 2: Transit TimeAlternative 2: Emission (Greenhouse-gas emissions)Alternative 3: Mode (Road,Rail or Intermodal)Alternative 3: Price (CHF)Alternative 3: Punctuality (on-time reliability in percent)Alternative 3: Transit TimeAlternative 3: Emission (Greenhouse-gas emissions)Alternative 1: AvailabilityAlternative 2: AvailabilityAlternative 3: AvailabilityRail AvailabilityOwnLorryOwnRailcarValueWeightPerishableDangerousDistancePunctReqWGChoiceShipperChoiceLSPModeChoice


Variable: Observation Number
Range of Valid Data Values: 1 to 2716
Summary Statistics:
Minimum : 1
Maximum : 2716
Variable Format: numeric

Variable: Respondent Number
Value Label Frequency
1 . 14
3 . 14
4 . 14
5 . 14
6 . 14
7 . 14
8 . 14
9 . 14
10 . 14
11 . 14
12 . 14
13 . 14
14 . 14
15 . 14
16 . 14
17 . 14
18 . 14
19 . 14
20 . 14
21 . 14
22 . 14

23 . 14
24 . 14
25 . 14
26 . 14
27 . 14
28 . 14
29 . 14
30 . 14
31 . 14
32 . 14
33 . 14
34 . 14
35 . 14
36 . 14
37 . 14
38 . 14
39 . 14
40 . 14
41 . 14
42 . 14
43 . 14
44 . 14
45 . 14

46 . 14
47 . 14
48 . 14
49 . 14
50 . 14
51 . 14
52 . 14
53 . 14
54 . 14
55 . 14
56 . 14
57 . 14
58 . 14
59 . 14
60 . 14
61 . 14
62 . 14
63 . 14
64 . 14
65 . 14
66 . 14
67 . 14
68 . 14

69 . 14
70 . 14
71 . 14
72 . 14
73 . 14
74 . 14
75 . 14
76 . 14
77 . 14
78 . 14
79 . 14
80 . 14
81 . 14
82 . 14
83 . 14
84 . 14
85 . 14
86 . 14
87 . 14
88 . 14
89 . 14
90 . 14
91 . 14

92 . 14
93 . 14
94 . 14
95 . 14
97 . 14
98 . 14
99 . 14
100 . 14
101 . 14
102 . 14
104 . 14
105 . 14
106 . 14
107 . 14
108 . 14
109 . 14
110 . 14
111 . 14
112 . 14
113 . 14
114 . 14
115 . 14
116 . 14

117 . 14
118 . 14
119 . 14
120 . 14
121 . 14
122 . 14
123 . 14
124 . 14
125 . 14
126 . 14
127 . 14
128 . 14
129 . 14
130 . 14
131 . 14
132 . 14
133 . 14
134 . 14
135 . 14
136 . 14
138 . 14
139 . 14
140 . 14
141 . 14
142 . 14
143 . 14
144 . 14
145 . 14
146 . 14
147 . 14
148 . 14
149 . 14
150 . 14
151 . 14
152 . 14
153 . 14
154 . 14
155 . 14
156 . 14
157 . 14
158 . 14
159 . 14
160 . 14
161 . 14
162 . 14
163 . 14
164 . 14
165 . 14
166 . 14
167 . 14
168 . 14
169 . 14
170 . 14
171 . 14
172 . 14
173 . 14
174 . 14
175 . 14
176 . 14
177 . 14
178 . 14
179 . 14
180 . 14
181 . 14
182 . 14
183 . 14
184 . 14
185 . 14
186 . 14

187 . 14
188 . 14
189 . 14
190 . 14
191 . 14
192 . 14
193 . 14
194 . 14
195 . 14
196 . 14
197 . 14
198 . 14
Range of Valid Data Values: 1 to 198
Summary Statistics:
Minimum : 1
Maximum : 198
Variable Format: numeric

Variable: Choice
Value Label Frequency
1 . 918
2 . 884
3 . 914
Range of Valid Data Values: 1 to 3
Summary Statistics:
Variable Format: numeric

Variable: Alternative 1: Mode (Road,Rail or Intermodal)
Value Label Frequency
1 . 887
2 . 881
3 . 948
Range of Valid Data Values: 1 to 3
Summary Statistics:
Variable Format: numeric

Variable: Alternative 1: Price (CHF)
Range of Valid Data Values: 32 to 88000
Summary Statistics:
Minimum : 32
Maximum : 88000
Mean : 2830.438
Standard deviation : 8223.77
Variable Format: numeric

Variable: Alternative 1: Punctuality (on-time reliability in percent)
Value Label Frequency
85 . 893
92 . 897
98 . 926
Range of Valid Data Values: 85 to 98
Summary Statistics:
Variable Format: numeric

Variable: Alternative 1: Transit Time
Range of Valid Data Values: 1 to 180
Summary Statistics:
Minimum : 1
Maximum : 180
Mean : 25.04
Standard deviation : 30.648
Variable Format: numeric

Variable: Alternative 1: Emission (Greenhouse-gas emissions)
Value Label Frequency
50 . 887
100 . 897
150 . 932
Range of Valid Data Values: 50 to 150
Summary Statistics:
Minimum : 50
Maximum : 150
Variable Format: numeric

Variable: Alternative 2: Mode (Road,Rail or Intermodal)
Value Label Frequency
1 . 918
2 . 889
3 . 909
Range of Valid Data Values: 1 to 3
Summary Statistics:
Variable Format: numeric

Variable: Alternative 2: Price (CHF)
Range of Valid Data Values: 32 to 88000
Summary Statistics:
Minimum : 32
Maximum : 88000
Mean : 2837.851
Standard deviation : 8206.598
Variable Format: numeric

Variable: Alternative 2: Punctuality (on-time reliability in percent)
Value Label Frequency
85 . 927
92 . 921
98 . 868
Range of Valid Data Values: 85 to 98
Summary Statistics:
Variable Format: numeric

Variable: Alternative 2: Transit Time
Range of Valid Data Values: 1 to 180
Summary Statistics:
Minimum : 1
Maximum : 180
Mean : 25.316
Standard deviation : 30.474
Variable Format: numeric

Variable: Alternative 2: Emission (Greenhouse-gas emissions)
Value Label Frequency
50 . 881
100 . 909
150 . 926
Range of Valid Data Values: 50 to 150
Summary Statistics:
Minimum : 50
Maximum : 150
Variable Format: numeric

Variable: Alternative 3: Mode (Road,Rail or Intermodal)
Value Label Frequency
1 . 911
2 . 946
3 . 859
Range of Valid Data Values: 1 to 3
Summary Statistics:
Variable Format: numeric

Variable: Alternative 3: Price (CHF)
Range of Valid Data Values: 32 to 88000
Summary Statistics:
Minimum : 32
Maximum : 88000
Mean : 2893.681
Standard deviation : 8661.306
Variable Format: numeric

Variable: Alternative 3: Punctuality (on-time reliability in percent)
Value Label Frequency
85 . 896
92 . 898
98 . 922
Range of Valid Data Values: 85 to 98
Summary Statistics:
Variable Format: numeric

Variable: Alternative 3: Transit Time
Range of Valid Data Values: 1 to 180
Summary Statistics:
Minimum : 1
Maximum : 180
Mean : 25.01
Standard deviation : 30.805
Variable Format: numeric

Variable: Alternative 3: Emission (Greenhouse-gas emissions)
Value Label Frequency
50 . 948
100 . 910
150 . 858
Range of Valid Data Values: 50 to 150
Summary Statistics:
Minimum : 50
Maximum : 150
Variable Format: numeric

Variable: Alternative 1: Availability
Value Label Frequency
1 . 2716
Range of Valid Data Values: 1 to 1
Summary Statistics:
Variable Format: numeric

Variable: Alternative 2: Availability
Value Label Frequency
1 . 2716
Range of Valid Data Values: 1 to 1
Summary Statistics:
Variable Format: numeric
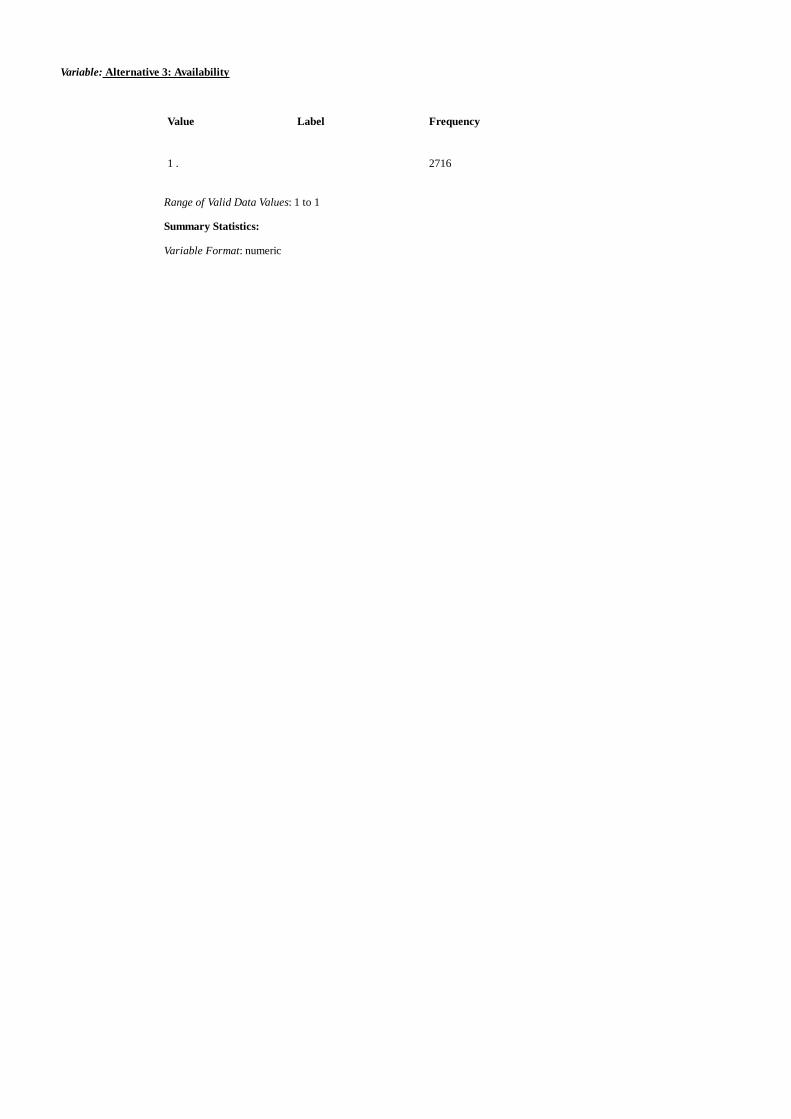
Variable: Alternative 3: Availability
Value Label Frequency
1 . 2716
Range of Valid Data Values: 1 to 1
Summary Statistics:
Variable Format: numeric

Variable: Rail Availability
Value Label Frequency
0 . 1260
1 . 1456
Range of Valid Data Values: 0 to 1
Summary Statistics:
Variable Format: numeric

Variable: OwnLorry
Value Label Frequency
0 . 1694
1 . 994
99 . 28
Range of Valid Data Values: 0 to 99
Summary Statistics:
Minimum : 0
Maximum : 99
Variable Format: numeric

Variable: OwnRailcar
Value Label Frequency
0 . 2366
1 . 322
99 . 28
Range of Valid Data Values: 0 to 99
Summary Statistics:
Minimum : 0
Maximum : 99
Variable Format: numeric

Variable: Value
Value Label Frequency
1.5 . 14
2 . 14
3 . 14
9 . 14
30 . 28
40 . 14
96 . 14
150 . 42
153 . 14
160 . 14
161 . 14
175 . 28
180 . 14
193 . 14
200 . 42
230 . 14
275 . 14
300 . 14
400 . 14
500 . 28
600 . 28

650 . 14
800 . 14
850 . 14
860 . 14
920 . 14
950 . 14
1000 . 168
1080 . 14
1100 . 42
1200 . 42
1250 . 56
1500 . 14
1600 . 28
1730 . 14
1800 . 14
2000 . 28
2200 . 42
2375 . 14
2500 . 70
2545 . 14
2700 . 14
2900 . 14
3000 . 56

3500 . 56
3750 . 14
4000 . 14
4500 . 28
5000 . 84
5500 . 14
6000 . 14
6800 . 28
7000 . 56
8000 . 70
8300 . 14
8400 . 14
8700 . 14
8880 . 14
9000 . 28
10000 . 112
10300 . 14
11400 . 14
13500 . 14
15000 . 56
18000 . 14
20000 . 56
24000 . 14

25000 . 70
30000 . 84
32000 . 14
35000 . 28
40000 . 14
43000 . 14
44000 . 14
45000 . 14
47000 . 14
50000 . 84
80000 . 14
99999 . 266
100000 . 42
120000 . 28
180000 . 14
200000 . 14
210000 . 14
214000 . 14
300000 . 14
400000 . 14
500000 . 28
30000000 . 14
Range of Valid Data Values: 1.5 to 30000000
Summary Statistics:
Minimum : 1.5

Maximum : 30000000
Variable Format: numeric

Variable: Weight
Value Label Frequency
0 . 154
1 . 238
2 . 154
3 . 140
4 . 98
5 . 140
6 . 98
7 . 84
8 . 70
9 . 14
10 . 84
11 . 14
12 . 84
15 . 140
16 . 56
17 . 42
18 . 84
19 . 28
20 . 224
21 . 28
22 . 196

23 . 28
24 . 84
25 . 84
27 . 28
28 . 28
38 . 14
45 . 28
50 . 42
56 . 14
58 . 14
60 . 42
74 . 14
100 . 14
115 . 14
150 . 14
220 . 14
500 . 14
1200 . 14
1300 . 42
Range of Valid Data Values: 0 to 1300
Summary Statistics:
Minimum : 0
Maximum : 1300
Variable Format: numeric

Variable: Perishable
Value Label Frequency
0 . 2338
1 . 378
Range of Valid Data Values: 0 to 1
Summary Statistics:
Variable Format: numeric

Variable: Dangerous
Value Label Frequency
0 . 2464
1 . 252
Range of Valid Data Values: 0 to 1
Summary Statistics:
Variable Format: numeric

Variable: Distance
Value Label Frequency
40 . 14
45 . 14
50 . 140
60 . 42
65 . 14
68 . 14
69 . 14
70 . 14
75 . 28
79 . 14
80 . 28
83 . 28
90 . 28
95 . 14
100 . 28
110 . 28
115 . 14
116 . 14
120 . 56
125 . 14
126 . 14

130 . 56
131 . 14
135 . 14
140 . 28
150 . 84
160 . 42
165 . 14
170 . 28
177 . 14
180 . 42
181 . 14
184 . 14
185 . 14
186 . 14
190 . 56
194 . 14
200 . 70
220 . 14
230 . 14
240 . 42
250 . 14
254 . 14
260 . 28

270 . 14
280 . 14
285 . 14
300 . 70
310 . 14
320 . 14
340 . 14
350 . 56
380 . 14
400 . 70
444 . 14
455 . 14
480 . 28
500 . 84
580 . 42
600 . 42
615 . 14
620 . 14
625 . 14
650 . 14
700 . 280
720 . 28
728 . 14
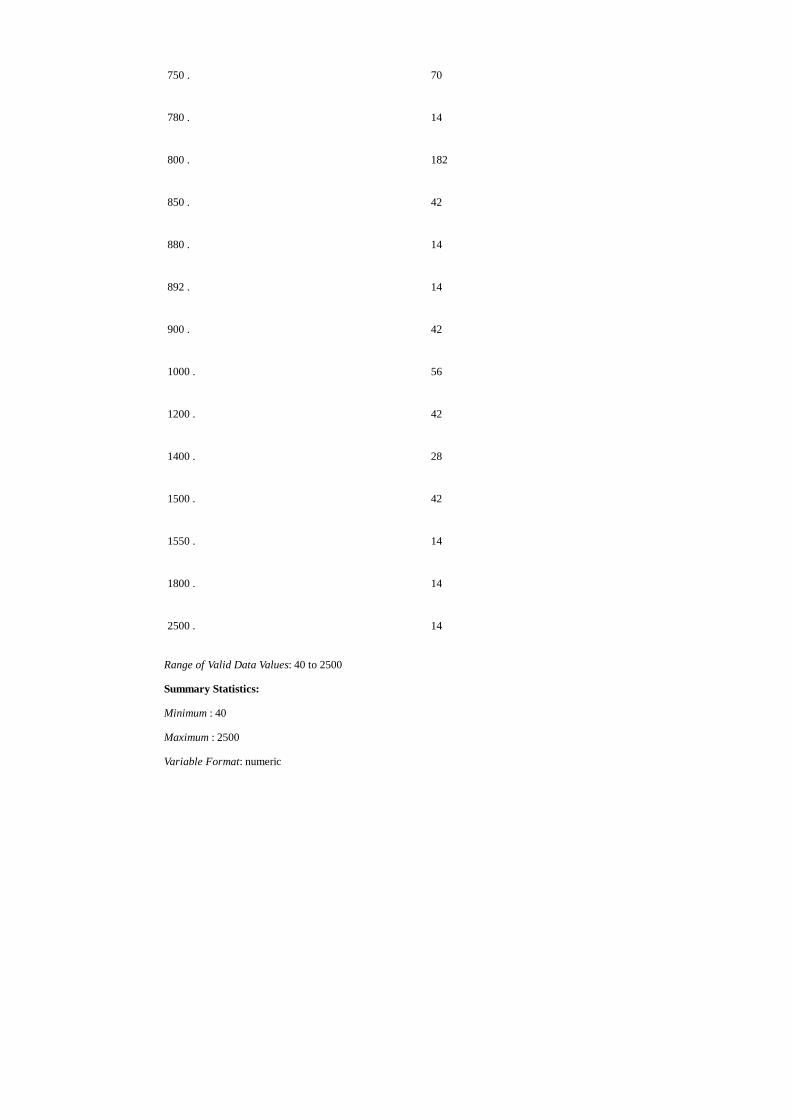
750 . 70
780 . 14
800 . 182
850 . 42
880 . 14
892 . 14
900 . 42
1000 . 56
1200 . 42
1400 . 28
1500 . 42
1550 . 14
1800 . 14
2500 . 14
Range of Valid Data Values: 40 to 2500
Summary Statistics:
Minimum : 40
Maximum : 2500
Variable Format: numeric

Variable: PunctReq
Value Label Frequency
0 . 42
1 . 392
2 . 280
3 . 98
4 . 252
5 . 98
6 . 168
7 . 14
8 . 266
9 . 14
12 . 196
24 . 518
36 . 14
48 . 224
70 . 14
72 . 98
96 . 28
Range of Valid Data Values: 0 to 96
Summary Statistics:
Minimum : 0
Maximum : 96
Variable Format: numeric

Variable: WG
Value Label Frequency
1 . 84
2 . 546
3 . 476
4 . 252
5 . 196
6 . 1162
Range of Valid Data Values: 1 to 6
Summary Statistics:
Variable Format: numeric

Variable: ChoiceShipper
Value Label Frequency
0 . 812
1 . 1904
Range of Valid Data Values: 0 to 1
Summary Statistics:
Variable Format: numeric

Variable: ChoiceLSP
Value Label Frequency
0 . 1988
1 . 728
Range of Valid Data Values: 0 to 1
Summary Statistics:
Variable Format: numeric

Variable: ModeChoice
Value Label Frequency
Sysmiss . 2716
Summary Statistics:
Variable Format: numeric
Label: Dissertation Fries
Text: See section 5.1.4 (ff)