cargo-oriented development (cod)
TRANSCRIPT

Analysis and Implementation
Cargo-Oriented Development (COD)
Job creation and environmental benefits through the coordination of freight transportation, land use, and economic development

PREPARED BY
THE CENTER FOR NEIGHBORHOOD TECHNOLOGY
SEPTEMBER 2013Cover Photo Credit: Chr istopher and Amy Cate v ia Flickr/CC
© 2 0 1 2 CE N TE R F O R N E I G H B O R H O O D TECH N O LO GY 1
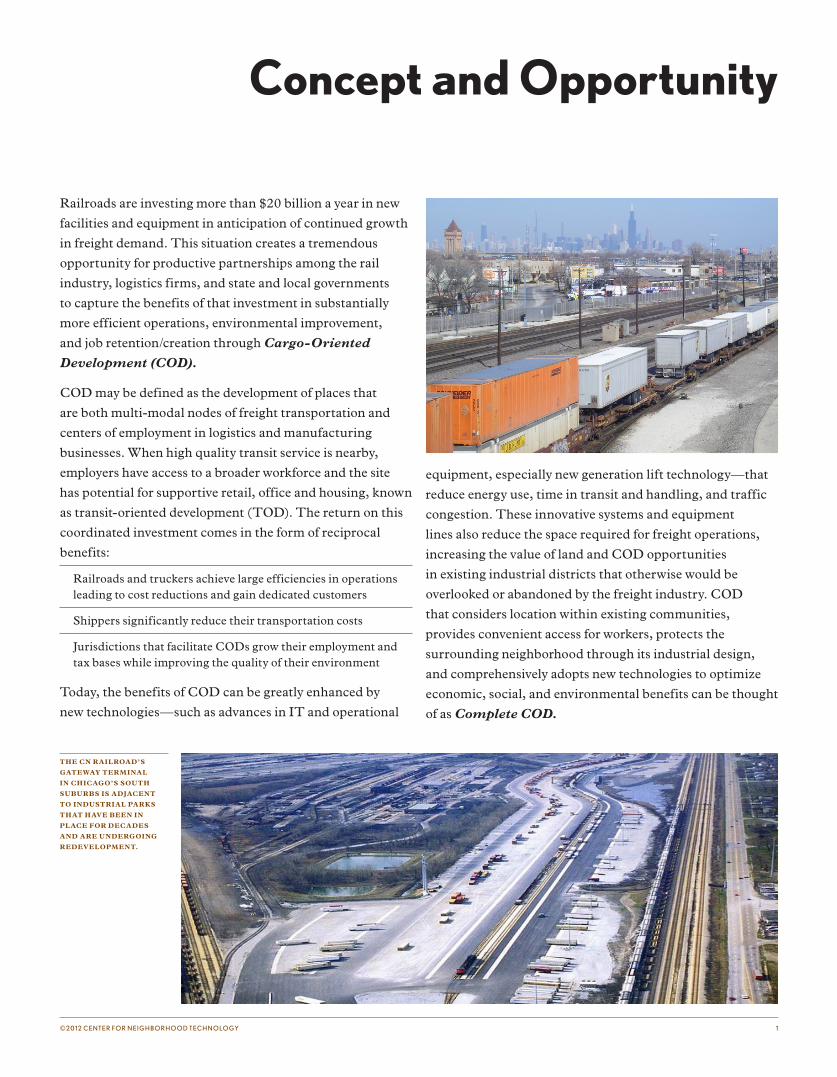
Railroads are investing more than $20 billion a year in new
facilities and equipment in anticipation of continued growth
in freight demand. This situation creates a tremendous
opportunity for productive partnerships among the rail
industry, logistics firms, and state and local governments
to capture the benefits of that investment in substantially
more efficient operations, environmental improvement,
and job retention/creation through Cargo-Oriented
Development (COD).
COD may be defined as the development of places that
are both multi-modal nodes of freight transportation and
centers of employment in logistics and manufacturing
businesses. When high quality transit service is nearby,
employers have access to a broader workforce and the site
has potential for supportive retail, office and housing, known
as transit-oriented development (TOD). The return on this
coordinated investment comes in the form of reciprocal
benefits:
Railroads and truckers achieve large efficiencies in operations leading to cost reductions and gain dedicated customers
Shippers significantly reduce their transportation costs
Jurisdictions that facilitate CODs grow their employment and tax bases while improving the quality of their environment
Today, the benefits of COD can be greatly enhanced by
new technologies—such as advances in IT and operational
equipment, especially new generation lift technology—that
reduce energy use, time in transit and handling, and traffic
congestion. These innovative systems and equipment
lines also reduce the space required for freight operations,
increasing the value of land and COD opportunities
in existing industrial districts that otherwise would be
overlooked or abandoned by the freight industry. COD
that considers location within existing communities,
provides convenient access for workers, protects the
surrounding neighborhood through its industrial design,
and comprehensively adopts new technologies to optimize
economic, social, and environmental benefits can be thought
of as Complete COD.
Concept and Opportunity
THE CN RAILROAD’S
GATEWAY TERMINAL
IN CHICAGO’S SOUTH
SUBURBS IS ADJACENT
TO INDUSTRIAL PARKS
THAT HAVE BEEN IN
PLACE FOR DECADES
AND ARE UNDERGOING
REDEVELOPMENT.
2 CO D : A N A LYS I S A N D I M P L E M E N TATI O N
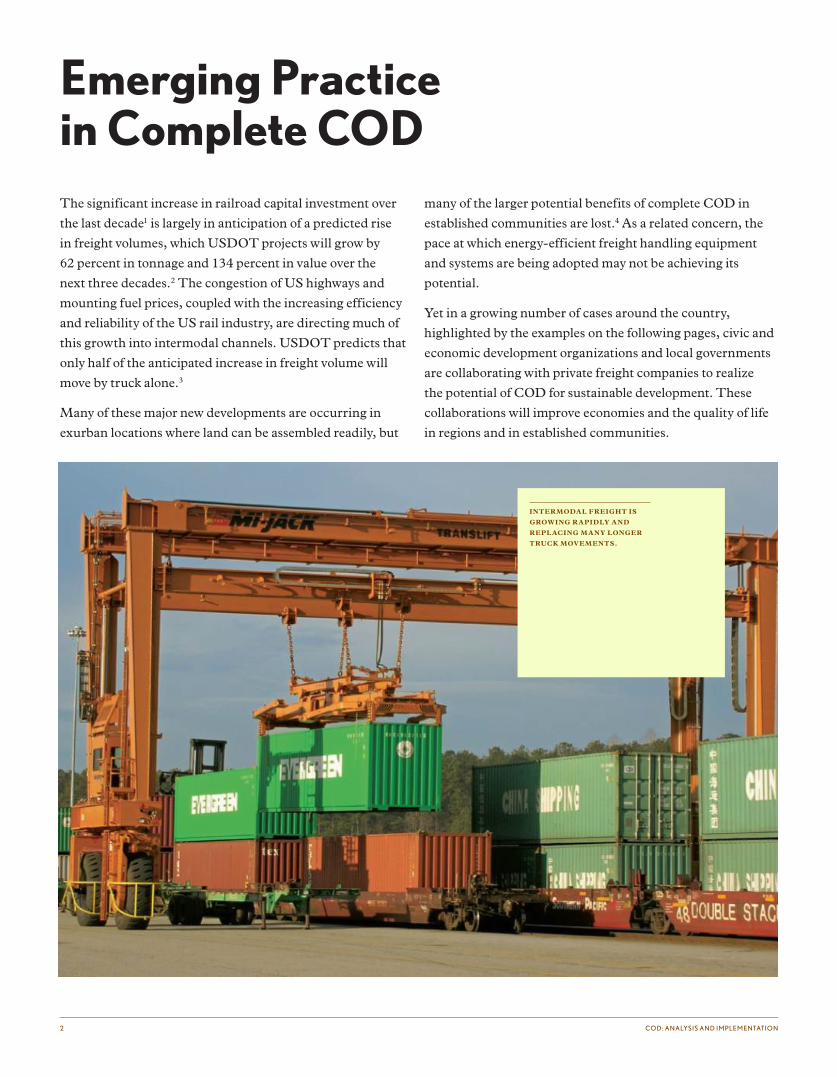
Emerging Practice in Complete CODThe significant increase in railroad capital investment over
the last decade1 is largely in anticipation of a predicted rise
in freight volumes, which USDOT projects will grow by
62 percent in tonnage and 134 percent in value over the
next three decades.2 The congestion of US highways and
mounting fuel prices, coupled with the increasing efficiency
and reliability of the US rail industry, are directing much of
this growth into intermodal channels. USDOT predicts that
only half of the anticipated increase in freight volume will
move by truck alone.3
Many of these major new developments are occurring in
exurban locations where land can be assembled readily, but
many of the larger potential benefits of complete COD in
established communities are lost.4 As a related concern, the
pace at which energy-efficient freight handling equipment
and systems are being adopted may not be achieving its
potential.
Yet in a growing number of cases around the country,
highlighted by the examples on the following pages, civic and
economic development organizations and local governments
are collaborating with private freight companies to realize
the potential of COD for sustainable development. These
collaborations will improve economies and the quality of life
in regions and in established communities.
INTERMODAL FREIGHT IS
GROWING RAPIDLY AND
REPLACING MANY LONGER
TRUCK MOVEMENTS.
© 2 0 1 2 CE N TE R F O R N E I G H B O R H O O D TECH N O LO GY 3
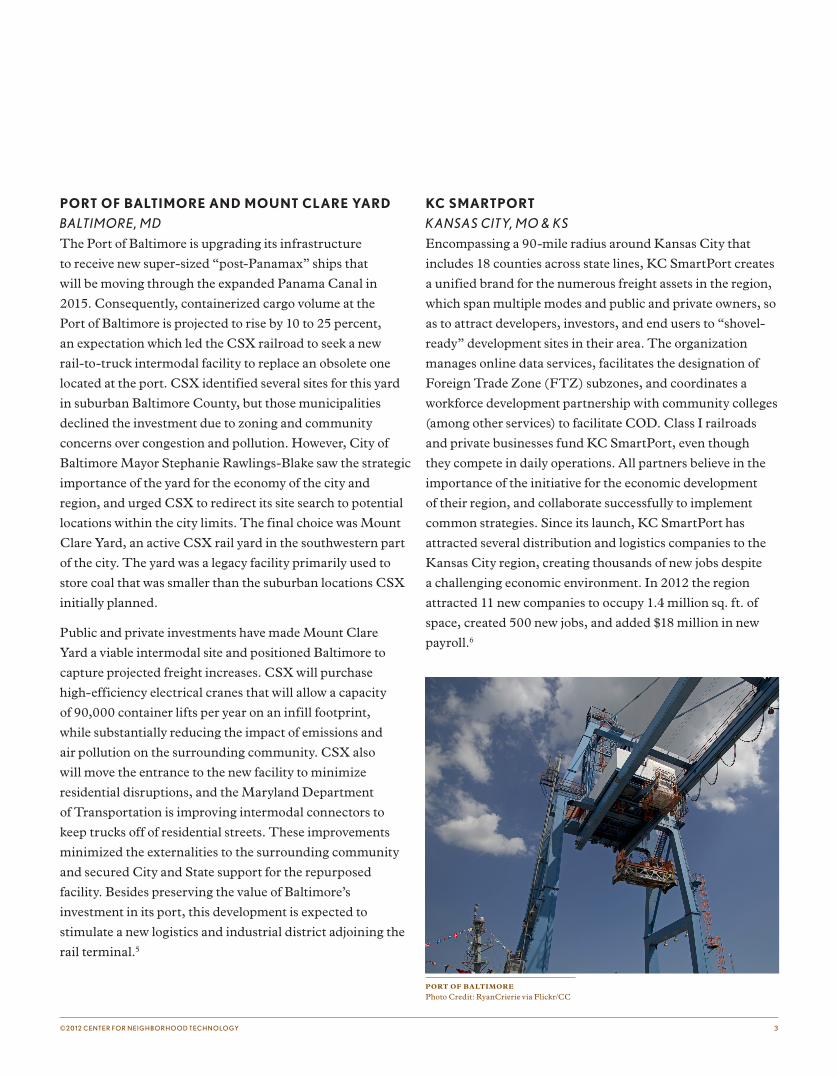
PORT OF BALTIMORE AND MOUNT CLARE YARD
BALTI MORE , M D
The Port of Baltimore is upgrading its infrastructure
to receive new super-sized “post-Panamax” ships that
will be moving through the expanded Panama Canal in
2015. Consequently, containerized cargo volume at the
Port of Baltimore is projected to rise by 10 to 25 percent,
an expectation which led the CSX railroad to seek a new
rail-to-truck intermodal facility to replace an obsolete one
located at the port. CSX identified several sites for this yard
in suburban Baltimore County, but those municipalities
declined the investment due to zoning and community
concerns over congestion and pollution. However, City of
Baltimore Mayor Stephanie Rawlings-Blake saw the strategic
importance of the yard for the economy of the city and
region, and urged CSX to redirect its site search to potential
locations within the city limits. The final choice was Mount
Clare Yard, an active CSX rail yard in the southwestern part
of the city. The yard was a legacy facility primarily used to
store coal that was smaller than the suburban locations CSX
initially planned.
Public and private investments have made Mount Clare
Yard a viable intermodal site and positioned Baltimore to
capture projected freight increases. CSX will purchase
high-efficiency electrical cranes that will allow a capacity
of 90,000 container lifts per year on an infill footprint,
while substantially reducing the impact of emissions and
air pollution on the surrounding community. CSX also
will move the entrance to the new facility to minimize
residential disruptions, and the Maryland Department
of Transportation is improving intermodal connectors to
keep trucks off of residential streets. These improvements
minimized the externalities to the surrounding community
and secured City and State support for the repurposed
facility. Besides preserving the value of Baltimore’s
investment in its port, this development is expected to
stimulate a new logistics and industrial district adjoining the
rail terminal.5
KC SMARTPORT
K ANSAS CIT Y, MO & KS
Encompassing a 90-mile radius around Kansas City that
includes 18 counties across state lines, KC SmartPort creates
a unified brand for the numerous freight assets in the region,
which span multiple modes and public and private owners, so
as to attract developers, investors, and end users to “shovel-
ready” development sites in their area. The organization
manages online data services, facilitates the designation of
Foreign Trade Zone (FTZ) subzones, and coordinates a
workforce development partnership with community colleges
(among other services) to facilitate COD. Class I railroads
and private businesses fund KC SmartPort, even though
they compete in daily operations. All partners believe in the
importance of the initiative for the economic development
of their region, and collaborate successfully to implement
common strategies. Since its launch, KC SmartPort has
attracted several distribution and logistics companies to the
Kansas City region, creating thousands of new jobs despite
a challenging economic environment. In 2012 the region
attracted 11 new companies to occupy 1.4 million sq. ft. of
space, created 500 new jobs, and added $18 million in new
payroll.6
PORT OF BALTIMORE
Photo Credit: RyanCrierie via Flickr/CC

4 CO D : A N A LYS I S A N D I M P L E M E N TATI O N
THE CENTER FOR NEIGHBORHOOD TECHNOLOGY
(CNT) AND THE CHICAGO SOUTH SUBURBAN
GREEN TIME ZONE
CH ICAGO, I L
Since 2005, the Center for Neighborhood Technology
(CNT), in partnership with the local governments and
community organizations of Chicago’s 42 south suburbs,
has carried out a pilot program to implement a strategy
of linked COD and TOD.7 Initially, CNT conducted a
GIS-based analysis of the south suburbs that identified over
3,000 acres of vacant industrial land in large blocks with
high COD potential, and analyzed 33 active and 9 planned
transit stations in the same towns to identify a range of viable
TOD opportunities.8 To model the potential redevelopment,
CNT partnered with Blue Island and Harvey, IL, two
economically distressed southern suburbs with strong COD
and TOD potential. CNT conducted a bottom-up planning
process with the municipal governments and residents of
these towns and created economic development plans to
capitalize on their TOD and COD assets.9
Encouraged by some initial successes resulting from these
plans, CNT entered into a partnership with the South
Suburban Mayors and Managers Association (SSMMA),
the council of governments organization for Chicago’s
south suburban region, to pursue linked COD and TOD
as the primary redevelopment strategy for the area. The
overarching campaign is named the Southland Green TIME
Zone (in which TIME stands for Transit, Intermodal,
Manufacturing, Environment). To date this strategy has
led to public and philanthropic investments of over $20
million in information management systems, brownfields
remediation, and infrastructure improvements that have
prepared sites for new businesses and homes, as well as the
preservation of workforce housing and worker training for
new manufacturing and logistics jobs. Federal agencies,
including the Environmental Protection Agency (EPA), the
Department of Transportation (DOT), the Department of
Housing and Urban Development (HUD), the Economic
Development Administration (EDA), the Department
of Labor (DOL) and the inter-agency Sustainable
Communities Challenge Grant program, are contributing
to this initiative. Early private sector investments of over
$25 million have more than matched public funding, and
will soon dwarf public dollars as new businesses are built
on upgraded sites.10 To accelerate this leverage of private
investments, the program created a structured fund and
lenders consortium, and an act of the Illinois General
Assembly permits the next $21 million of state income tax
revenue from new industrial jobs in the Green TIME Zone to
reimburse COD investments.11
CNT shares its COD experience in presentations at national
transportation and urban planning conferences, and provides
technical assistance regarding COD to HUD and USEPA
grant recipients.12 CNT also works as a COD consultant
in multiple regions around the country, identifying
appropriate technologies for greater efficiency gains, solving
redevelopment problems or creating long-term plans for
sustainable redevelopment.13
COD COMMUNITY VISION
DEVELOPMENT

6 CO D : A N A LYS I S A N D I M P L E M E N TATI O N
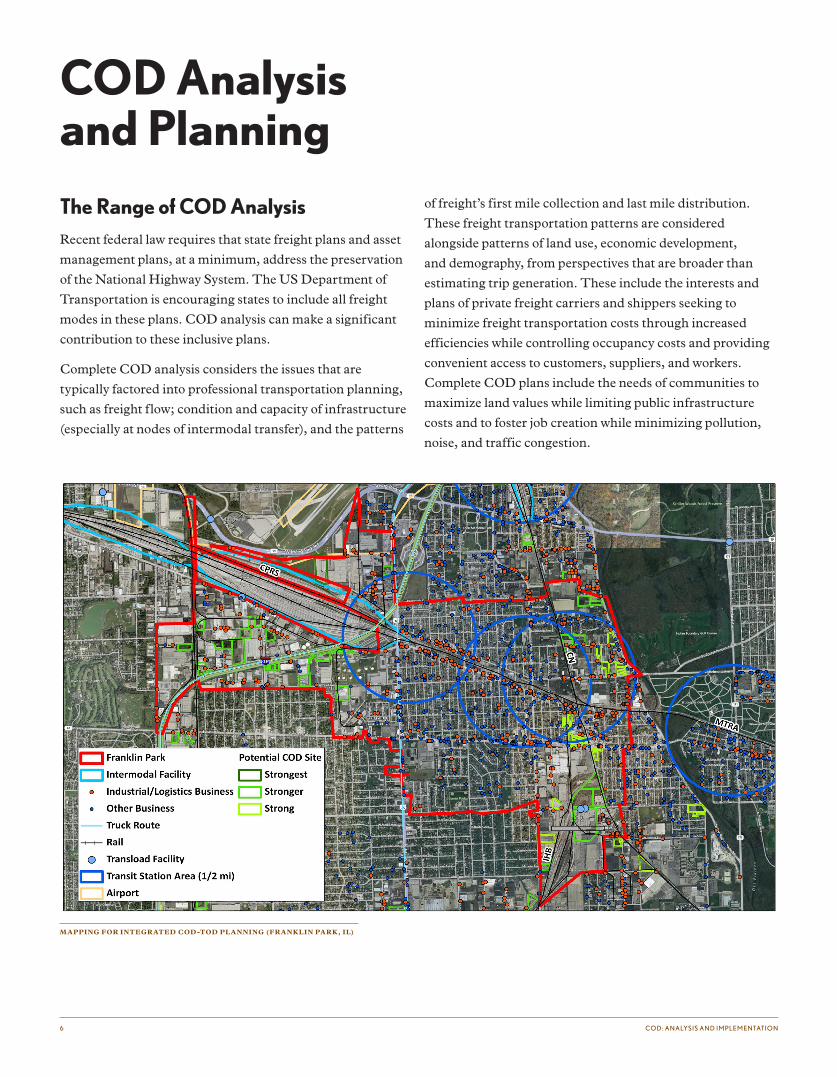
COD Analysis and Planning
The Range of COD Analysis Recent federal law requires that state freight plans and asset
management plans, at a minimum, address the preservation
of the National Highway System. The US Department of
Transportation is encouraging states to include all freight
modes in these plans. COD analysis can make a significant
contribution to these inclusive plans.
Complete COD analysis considers the issues that are
typically factored into professional transportation planning,
such as freight flow; condition and capacity of infrastructure
(especially at nodes of intermodal transfer), and the patterns
of freight’s first mile collection and last mile distribution.
These freight transportation patterns are considered
alongside patterns of land use, economic development,
and demography, from perspectives that are broader than
estimating trip generation. These include the interests and
plans of private freight carriers and shippers seeking to
minimize freight transportation costs through increased
efficiencies while controlling occupancy costs and providing
convenient access to customers, suppliers, and workers.
Complete COD plans include the needs of communities to
maximize land values while limiting public infrastructure
costs and to foster job creation while minimizing pollution,
noise, and traffic congestion.
MAPPING FOR INTEGRATED COD-TOD PLANNING (FRANKLIN PARK, IL)

© 2 0 1 2 CE N TE R F O R N E I G H B O R H O O D TECH N O LO GY 7
At an individual project level, decision makers may be
concerned with identifying the optimal location for an
industrial park or business or the investment of scarce
public funds that will produce the greatest job creation or
environmental improvement. Appropriate zoning is often
a challenge to redevelopment, due to the way communities
grew up around railheads and yards, but the growing
application by local governments of form-based codes
provides a way of regulating transitions from the hard
industrial activities of freight movement and interchange to
related activities of light manufacturing, offices, and sales
that are more compatible with residential uses.
Project plans must recognize that pollution generated by
freight movements has been scientifically linked to negative
health outcomes, including death. This fact, as well as noise
and other side effects that degrade the quality of life, make
the adoption of systems and equipment that dramatically
reduce these hazards a key public benefit that should be
required in any public-private partnership or public subsidy.
Among these systems are industrial designs that control
stormwater with green infrastructure, ensure energy
efficiency in buildings, and buffer negative side effects of
freight movements from neighboring communities. Linked
technologies include numerous information technology
innovations that have been developed in the American
Association of Railroads (AAR) testing facility in Pueblo,
Colorado; the USEPA Tier III and Tier IV locomotive
standards; and new lift equipment and terminal management
software that greatly reduces intermodal yard space
requirements and truck movements (from reduced cargo
handling) and related noise and energy use. Complete
COD planning makes optimal use of these energy-
conserving systems and technologies.
HIGH PERFORMANCE COD—
TRANSPORT AND LOCATION
EFFICIENCY FEATURES
8 CO D : A N A LYS I S A N D I M P L E M E N TATI O N
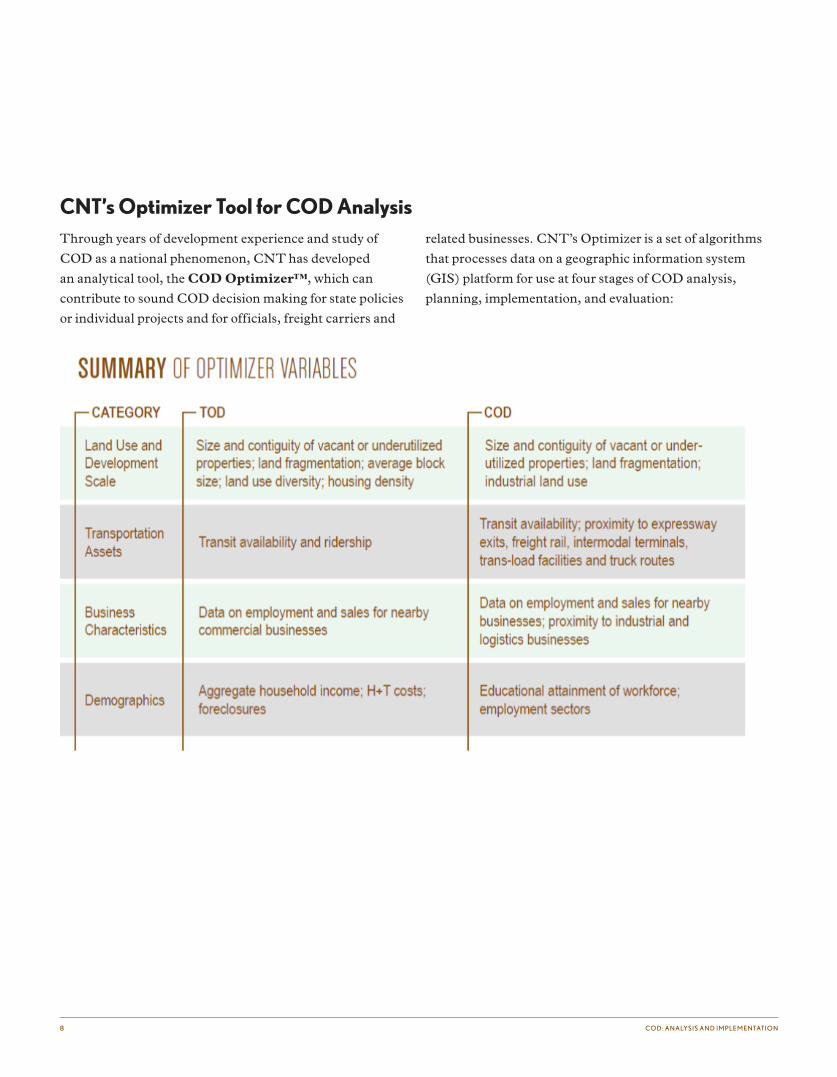
CNT’s Optimizer Tool for COD Analysis Through years of development experience and study of
COD as a national phenomenon, CNT has developed
an analytical tool, the COD Optimizer™, which can
contribute to sound COD decision making for state policies
or individual projects and for officials, freight carriers and
related businesses. CNT’s Optimizer is a set of algorithms
that processes data on a geographic information system
(GIS) platform for use at four stages of COD analysis,
planning, implementation, and evaluation:
© 2 0 1 2 CE N TE R F O R N E I G H B O R H O O D TECH N O LO GY 9
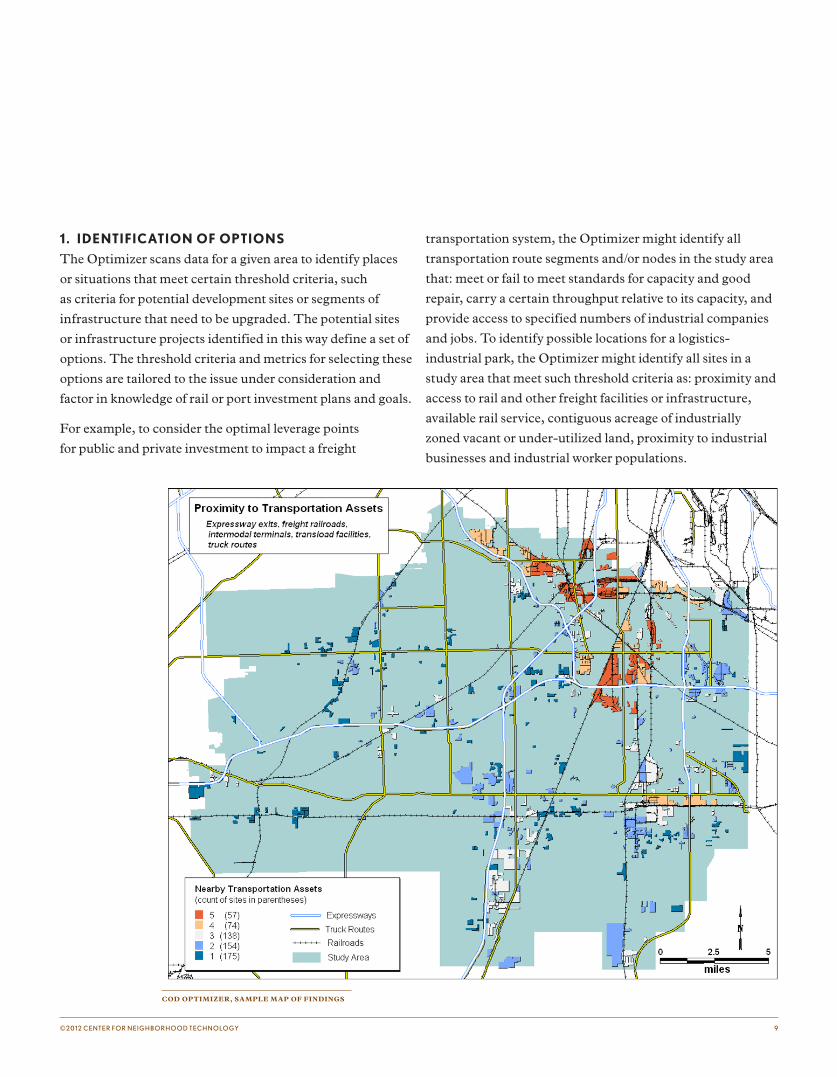
1. IDENTIFICATION OF OPTIONS
The Optimizer scans data for a given area to identify places
or situations that meet certain threshold criteria, such
as criteria for potential development sites or segments of
infrastructure that need to be upgraded. The potential sites
or infrastructure projects identified in this way define a set of
options. The threshold criteria and metrics for selecting these
options are tailored to the issue under consideration and
factor in knowledge of rail or port investment plans and goals.
For example, to consider the optimal leverage points
for public and private investment to impact a freight
transportation system, the Optimizer might identify all
transportation route segments and/or nodes in the study area
that: meet or fail to meet standards for capacity and good
repair, carry a certain throughput relative to its capacity, and
provide access to specified numbers of industrial companies
and jobs. To identify possible locations for a logistics-
industrial park, the Optimizer might identify all sites in a
study area that meet such threshold criteria as: proximity and
access to rail and other freight facilities or infrastructure,
available rail service, contiguous acreage of industrially
zoned vacant or under-utilized land, proximity to industrial
businesses and industrial worker populations.
COD OPTIMIZER, SAMPLE MAP OF FINDINGS
1 0 CO D : A N A LYS I S A N D I M P L E M E N TATI O N
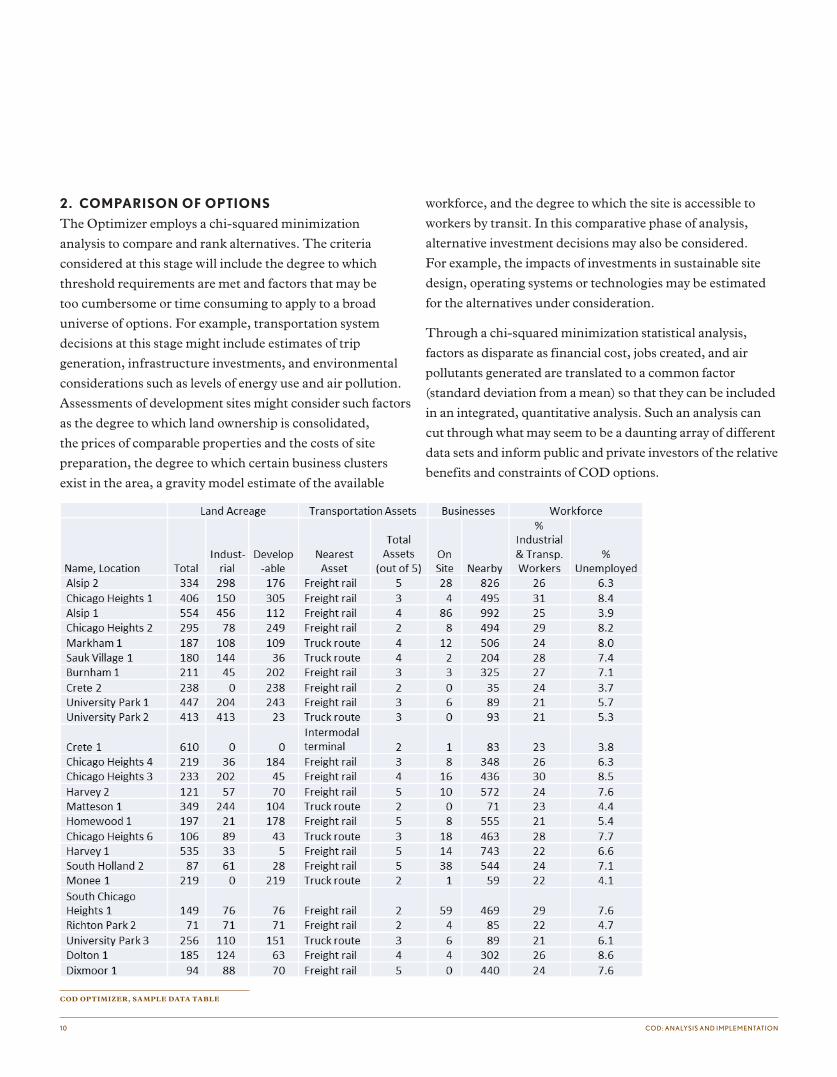
2. COMPARISON OF OPTIONS
The Optimizer employs a chi-squared minimization
analysis to compare and rank alternatives. The criteria
considered at this stage will include the degree to which
threshold requirements are met and factors that may be
too cumbersome or time consuming to apply to a broad
universe of options. For example, transportation system
decisions at this stage might include estimates of trip
generation, infrastructure investments, and environmental
considerations such as levels of energy use and air pollution.
Assessments of development sites might consider such factors
as the degree to which land ownership is consolidated,
the prices of comparable properties and the costs of site
preparation, the degree to which certain business clusters
exist in the area, a gravity model estimate of the available
workforce, and the degree to which the site is accessible to
workers by transit. In this comparative phase of analysis,
alternative investment decisions may also be considered.
For example, the impacts of investments in sustainable site
design, operating systems or technologies may be estimated
for the alternatives under consideration.
Through a chi-squared minimization statistical analysis,
factors as disparate as financial cost, jobs created, and air
pollutants generated are translated to a common factor
(standard deviation from a mean) so that they can be included
in an integrated, quantitative analysis. Such an analysis can
cut through what may seem to be a daunting array of different
data sets and inform public and private investors of the relative
benefits and constraints of COD options.
COD OPTIMIZER, SAMPLE DATA TABLE
© 2 0 1 2 CE N TE R F O R N E I G H B O R H O O D TECH N O LO GY 1 1
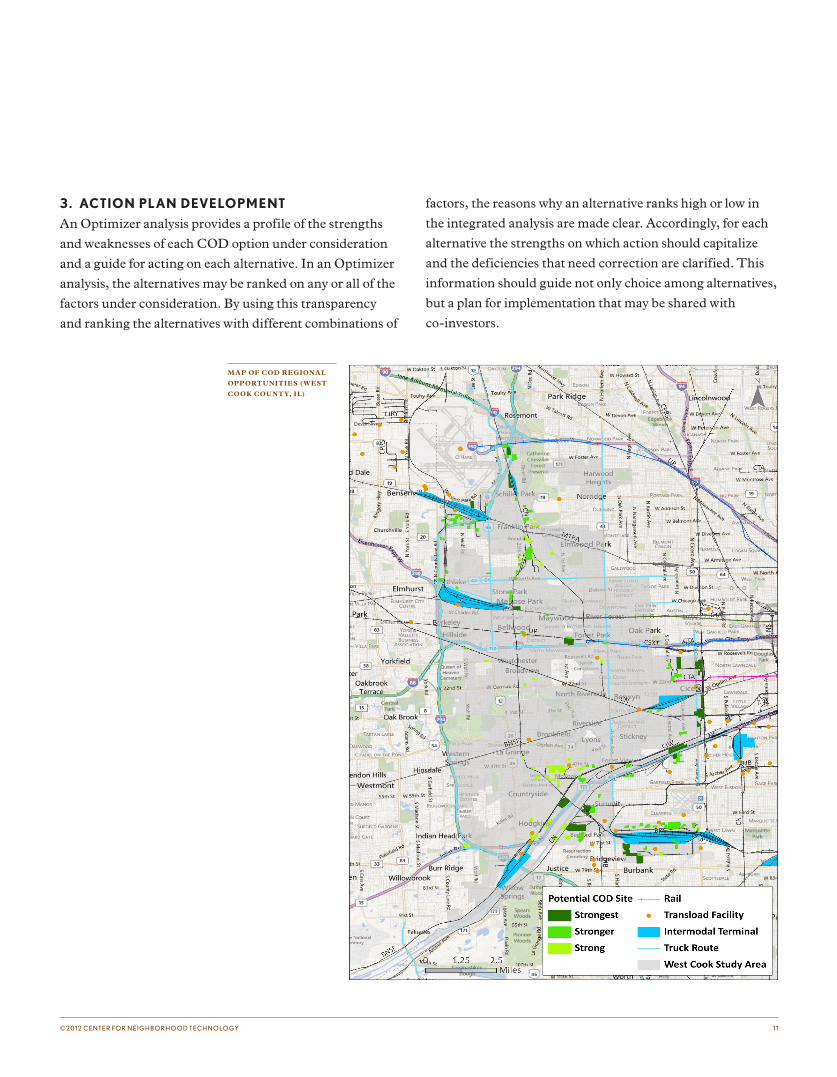
3. ACTION PLAN DEVELOPMENT
An Optimizer analysis provides a profile of the strengths
and weaknesses of each COD option under consideration
and a guide for acting on each alternative. In an Optimizer
analysis, the alternatives may be ranked on any or all of the
factors under consideration. By using this transparency
and ranking the alternatives with different combinations of
factors, the reasons why an alternative ranks high or low in
the integrated analysis are made clear. Accordingly, for each
alternative the strengths on which action should capitalize
and the deficiencies that need correction are clarified. This
information should guide not only choice among alternatives,
but a plan for implementation that may be shared with
co-investors.
MAP OF COD REGIONAL
OPPORTUNITIES (WEST
COOK COUNTY, IL)

1 2 CO D : A N A LYS I S A N D I M P L E M E N TATI O N
4. PERFORMANCE MEASUREMENT AND
EVALUATION
While COD Optimizer analyses are tailored to the
requirements of each application, there is a standard set of
performance metrics used in all Optimizer analyses. In the
creation and evaluation of COD plans consistently used
metrics include:
Proximity to rail infrastructure and service for a shipper business, e.g., truck route distance to an intermodal terminal gate or distance from an active rail line that would justify spur development for car load service
Proximity to highway infrastructure for a shipper business, e.g., truck route distance to an expressway ramp
A number of the metrics used in COD Optimizer planning
may also serve as performance measures for the evaluation of
implemented projects as data becomes available:
Reductions in truck VMT in relation to the volume of cargo moved and subsequent generation of air pollution
Reduction in time requirements for first/last mile delivery of freight
Increased reliability of freight delivery
Efficiency in terminal operations: reduced energy use, noise
Proximity to populations with an appropriate level of education for entry level logistics or manufacturing employment (a HS diploma or AA degree, but not a BA or advanced degree)
Proximity to complementary logistics and industrial businesses, creating the potential for clustering
Proximity to good transit service (no set standard, but an oft-cited example is within a half-mile of transit service that is at least every 30 minutes, and lesser headway at peak periods)
Availability of re-developable lands for freight facilities within two miles of an intermodal freight facility or one mile of an active rail line – making a rail spur practical
Appropriate zoning for the freight network and the types of uses anticipated, including the use of form-based codes that could allow an appropriate mix of uses involved in freight
levels, space required per container, and time in yard
Acres of brownfields remediated
Acres of vacant land restored to productive use
Increased jobs in the COD area at AMI and above, and total jobs
Increased workers in the COD area with accredited certifications of competence for logistics or manufacturing occupations
Reduced unemployment in the COD area
OLDER US COMMUNITIES
WERE OFTEN BUILT
AROUND RAIL LINES
THAT SERVE BOTH
FREIGHT AND PASSENGER
TRANSPORTATION.
© 2 0 1 2 CE N TE R F O R N E I G H B O R H O O D TECH N O LO GY 1 3
�
�
© C e n t e r f o r N e i g h b o r h o o d T e c h n o l o g y
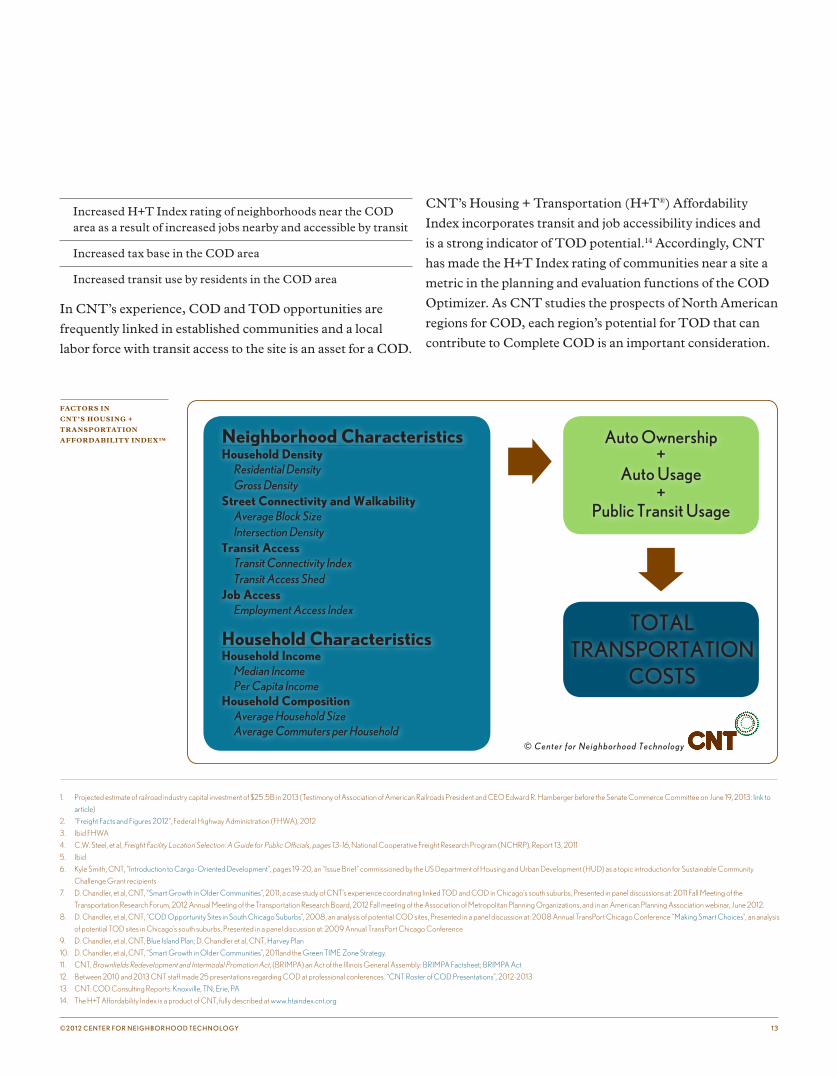
TOTAL TRANSPORTATION
COSTS
Neighborhood CharacteristicsHousehold Density Residential Density Gross DensityStreet Connectivity and Walkability Average Block Size Intersection DensityTransit Access Transit Connectivity Index Transit Access ShedJob Access Employment Access Index
Household CharacteristicsHousehold Income Median Income Per Capita IncomeHousehold Composition Average Household Size Average Commuters per Household
Auto Ownership+
Auto Usage+
Public Transit Usage
Increased H+T Index rating of neighborhoods near the COD area as a result of increased jobs nearby and accessible by transit
Increased tax base in the COD area
Increased transit use by residents in the COD area
In CNT’s experience, COD and TOD opportunities are
frequently linked in established communities and a local
labor force with transit access to the site is an asset for a COD.
CNT’s Housing + Transportation (H+T®) Affordability
Index incorporates transit and job accessibility indices and
is a strong indicator of TOD potential.14 Accordingly, CNT
has made the H+T Index rating of communities near a site a
metric in the planning and evaluation functions of the COD
Optimizer. As CNT studies the prospects of North American
regions for COD, each region’s potential for TOD that can
contribute to Complete COD is an important consideration.
FACTORS IN
CNT’S HOUSING +
TRANSPORTATION
AFFORDABILITY INDEX™
1. Projected estimate of railroad industry capital investment of $25.5B in 2013 (Testimony of Association of American Railroads President and CEO Edward R. Hamberger before the Senate Commerce Committee on June 19, 2013: link to
article)
2. “Freight Facts and Figures 2012”, Federal Highway Administration (FHWA), 2012
3. Ibid FHWA
4. C.W. Steel, et al, Freight Facility Location Selection: A Guide for Public Officials, pages 13-16, National Cooperative Freight Research Program (NCHRP), Report 13, 2011
5. Ibid
6. Kyle Smith, CNT, “Introduction to Cargo-Oriented Development”, pages 19-20, an “Issue Brief” commissioned by the US Department of Housing and Urban Development (HUD) as a topic introduction for Sustainable Community
Challenge Grant recipients
7. D. Chandler, et al, CNT, “Smart Growth in Older Communities”, 2011, a case study of CNT’s experience coordinating linked TOD and COD in Chicago’s south suburbs, Presented in panel discussions at: 2011 Fall Meeting of the
Transportation Research Forum, 2012 Annual Meeting of the Transportation Research Board, 2012 Fall meeting of the Association of Metropolitan Planning Organizations, and in an American Planning Association webinar, June 2012.
8. D. Chandler, et al, CNT, “COD Opportunity Sites in South Chicago Suburbs”, 2008, an analysis of potential COD sites, Presented in a panel discussion at: 2008 Annual TransPort Chicago Conference “Making Smart Choices”, an analysis
of potential TOD sites in Chicago’s south suburbs, Presented in a panel discussion at: 2009 Annual TransPort Chicago Conference
9. D. Chandler, et al, CNT, Blue Island Plan; D. Chandler et al, CNT, Harvey Plan
10. D. Chandler, et al, CNT, “Smart Growth in Older Communities”, 2011and the Green TIME Zone Strategy.
11. CNT, Brownfields Redevelopment and Intermodal Promotion Act, (BRIMPA) an Act of the Illinois General Assembly: BRIMPA Factsheet; BRIMPA Act
12. Between 2010 and 2013 CNT staff made 25 presentations regarding COD at professional conferences. “CNT Roster of COD Presentations”, 2012-2013
13. CNT: COD Consulting Reports: Knoxville, TN; Erie, PA
14. The H+T Affordability Index is a product of CNT, fully described at www.htaindex.cnt.org
ABOUT THE CENTER FOR NEIGHBORHOOD TECHNOLOGY
The Center for Neighborhood Technology (CNT) is an award-winning innovations laboratory for urban sustainability. Since 1978, CNT has shown urban communities in Chicago and across the country how to develop more sustainably. CNT promotes the better and more efficient use of the undervalued resources and inherent advantages of the built and natural systems that comprise the urban environment.
As a creative think-and-do tank, CNT researches, promotes, and implements innovative solutions to improve the economy and the environment; make good use of existing resources and community assets; restore the health of natural systems and increase the wealth and well-being of people—now and in the future. CNT’s unique approach combines cutting edge research and analysis, public policy advocacy, the creation of web-based information tools for transparency and accountability, and the advancement of economic development social ventures to address those problems in innovative ways.
CNT works in four areas: transportation and community development, water, energy, and climate. CNT has two affiliates, CNT Energy and Alternative Transportation of Chicagoland.
CNT is a recipient of the 2009 MacArthur Award for Creative and Effective Institutions.
More information about CNT is available at www.cnt.org