career technical education: surviving and thriving through turbulent times
TRANSCRIPT

Career Technical Education:Career Technical Education:Surviving and Thriving Surviving and Thriving
through Turbulent Timesthrough Turbulent Times

CTE Threats
& Opportunities

Opportunities• Economic crisis and
openness to new thinking about college, skills and workforce
• Stubborn dropout rates for high school and college programs
• Awareness of Middle Skill jobs and Multiple Pathways
Threats
• Debt, deficit and budget cuts at all levels
• CTE seen an elective, non-essential
• “College-for-all” mythology
• Relevance gap to key innovation sectors
• Relevance to Common Core/academic preparation

Today’s conversation
• Build a deeper understanding of the “innovation eco-system”
• Review key workforce skills• Understand and apply Common
Core standards• Review Action Steps for Surviving
and Thriving
What doesn’t kill you only makes you stronger.

Connecting to the Innovation Eco-System

The Innovation Eco-SystemThe Innovation Eco-System•Regulations•Taxes/Incentives•Laws (e.g. Bankruptcy)
•Economy•Big companies•Other companies
•Universities•Corporate R&D•Open innovation
•Debt•Equity•Full range of options
•Physical•Services
•Labor pool•Education•Network
•Individualistic•Celebrate•Failure
© William K. Aulet, 2008, MIT Center for Entrepreneurship

The impact of Start-up Job CreationThe impact of Start-up Job Creation
• Start-up companies account for 3 percent of U.S. jobs, but almost 20 percent of overall job creation.
• All net new job growth in the U.S. since 1977, in fact, is due to start-ups.
• Start-up rate relatively flat at 500,000 per year in U.S..
Sources: Kauffman Foundation survey on job creation, 2009. John Haltiwanger, University of Maryland.

Start-ups and Job Creation
• Job growth at Venture Capital (VC)-backed firms is 2.6 percent vs. 0.2 percent at non-VC-based firms.
• VC-backed firms are about 8 times more productive in creating jobs.– Source: The National Venture Capital
Association (NVCA) • Another estimate says that “VC-
backed firms are 150 times more likely than average start-ups to create jobs.”
• 92 percent of a company’s job creation occurs AFTER its IPO (Initial Public Offering).
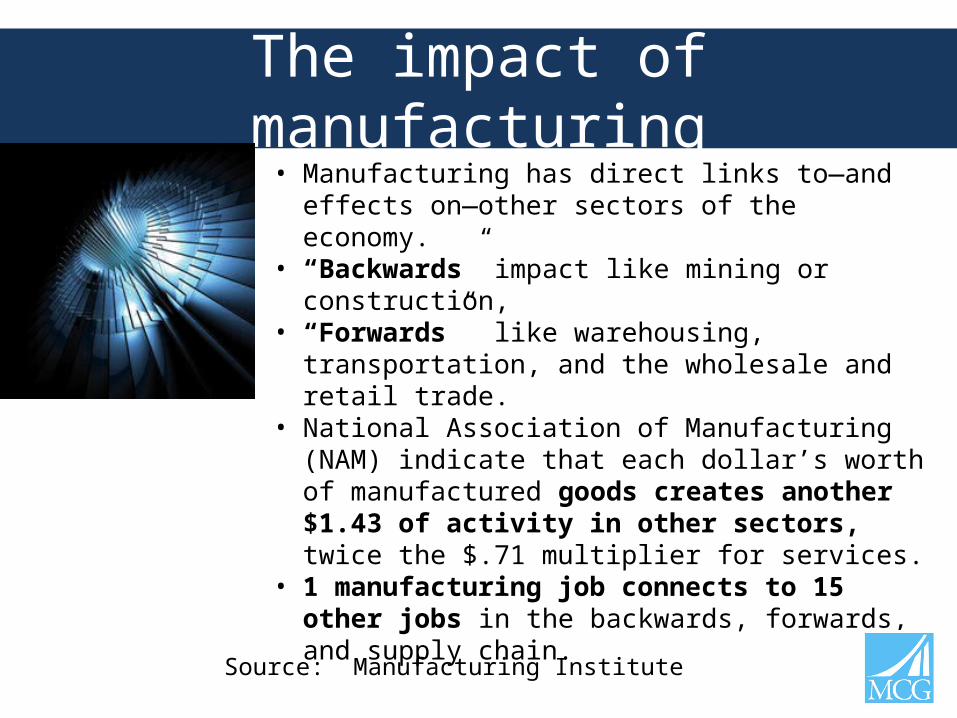
The impact of manufacturing• Manufacturing has direct links to—and effects
on—other sectors of the economy. • “Backwards” impact like mining or construction,• “Forwards” like warehousing, transportation,
and the wholesale and retail trade.• National Association of Manufacturing (NAM)
indicate that each dollar’s worth of manufactured goods creates another $1.43 of activity in other sectors, twice the $.71 multiplier for services.
• 1 manufacturing job connects to 15 other jobs in the backwards, forwards, and supply chain.
Source: Manufacturing Institute

Losing our “Industrial Commons”Losing our “Industrial Commons”
Lost capabilities in –• desktop, notebook and netbook PCS, low-
end servers, • hard disk drives, • consumer-networking gear such as routers,
access points, and home set-top boxes.
At-risk of losing –• blade servers, • midrange servers, • mobile handsets, • optical-communication components, and• core network equipment.
“Restoring American Competitiveness,” Gary Pisano and Willy Shih, Harvard Business Review, July-August 2009

“buzz” vs. real jobs
• Sony (electronics, entertainment)– Market value: $35 billion– Number of employees: 170,000
• Boeing (aerospace)– Market value: $50 billion– Number of employees: 157,000
• Facebook (social media)– 500 million users– Market value: $50 billion est.– Number of employees: 1,700

2000’s, Failed Promise of Innovation
There’s growing evidence that the There’s growing evidence that the innovation shortfall of the past innovation shortfall of the past decade is not only real but may decade is not only real but may also have contributed to today’s also have contributed to today’s financial crisis.”financial crisis.”
-- -- Michael MandelMichael Mandel
Technologies that failed to performTechnologies that failed to perform• MEMS (microelectromechanical MEMS (microelectromechanical
systems) systems) • Gene TherapiesGene Therapies

U.S. Slipping in Innovation Capacity and Growth
Rank Country Overall Score 2009
1 Singapore 73.4
2 Sweden 71.0
3 Luxembourg 66.2
4 Denmark 64.5
5 S. Korea 64.2
6 U.S. 63.9
… …. …
38 Brazil 30.1
39 Mexico 26.0
40 India 21.6
Rank Country Overall Score 2009
1 China 19.5
2 Singapore 19.0
3 Lithuania 14.8
4 Estonia 18.1
5 Denmark 17.4
6 Luxembourg 16.9
… …. …
38 Greece 5.1
39 Brazil 3.7
40 U.S. 2.7
Overall Score Change Score 1999-2009
Source: Information Technology & Innovation Foundation, February 2009

Great Again: Revitalizing America's
Entrepreneurial Leadership
by Henry Nothhaft and David Kline

Great Again: Key policy recommendations
• Provide $1 billion infusion to handle patent backlog
• Reduce corporate tax rate• Create tax incentives for U.S.-based
manufacturing• Offer permanent 20% R&D tax credit• Regulate small start-ups differently than
large established public corporations• Adequately fund basic research• Encourage immigration of proven
entrepreneurial engineers and scientists
The Need for Leadership
“The American people always do the right thing—after they’ve tried every other alternative.”
Winston Churchill

Changing International Dynamics“Onshoring/Reshoring” of some jobs back to the
U.S. because of:– Wage differential is tightening
• Cost of Chinese Labor is rising: 12% average annual increase in mfg wages 2000 to 2009.
• By 2015, China’s average wage will be 69% of the average U.S. wage
– Shipping costs are increasing with fuel prices– Intellectual property not enforced– Quality control abroad is inconsistent– Re-connecting engineering with production improves
product quality and troubleshooting– Managing production across multiple time-zones take
a toll on U.S. management
Source: Paul Davidson, “Some manufacturing heads back to USA,” USA Today, August 6, 2010,Bill Powel, “The End of Cheap Labor in China,” Time Magazine, June 27, 2011

Onshoring-Reshoring• General Electric moving energy-efficient
water heater production from China to the U.S. (400 jobs).
• Ford Motor Co brought 2000 jobs back to U.S. from suppliers in Japan, Mexico and India.
• NCR created 260 jobs in Columbus, Georgia to manufacturer ATMs, consolidating jobs from China, India and Hungary.
Source: Paul Davidson, “Some manufacturing heads back to USA,” USA Today, August 6, 2010

Emerging Epicenters of U.S. Innovation
WIRED Magazine, June 2011

WIRED Magazine, June 2011
Provo-Orem, UT, Software Development
Fort Collins, CO. Green Technology
Waco, TX. Maintenance, Avionics, and Dispatch
Bloomington, IN. Medical Devices
Spartanburg, SC. Polymers
Reading, PA. Batteries.
U.S. Innovation in Plastics, Chemicals, Automotive, Aerospace, Information Technology, Biopharma, Metal Mfg, Communication tech,
Medical technology, Analytical Instruments, Electrical Equipment

AMD/Global Foundries “Fab 2” in Malta, New York
• 1,250 jobs• $650 million in tax credits,
both on property taxes and on employee credits
• $500 million for tooling and building infrastructure,
• $150 million for research and development at Luther Forest, Albany’s Nanotech Institute, and at IBM’s facility in East Fishkill.
R
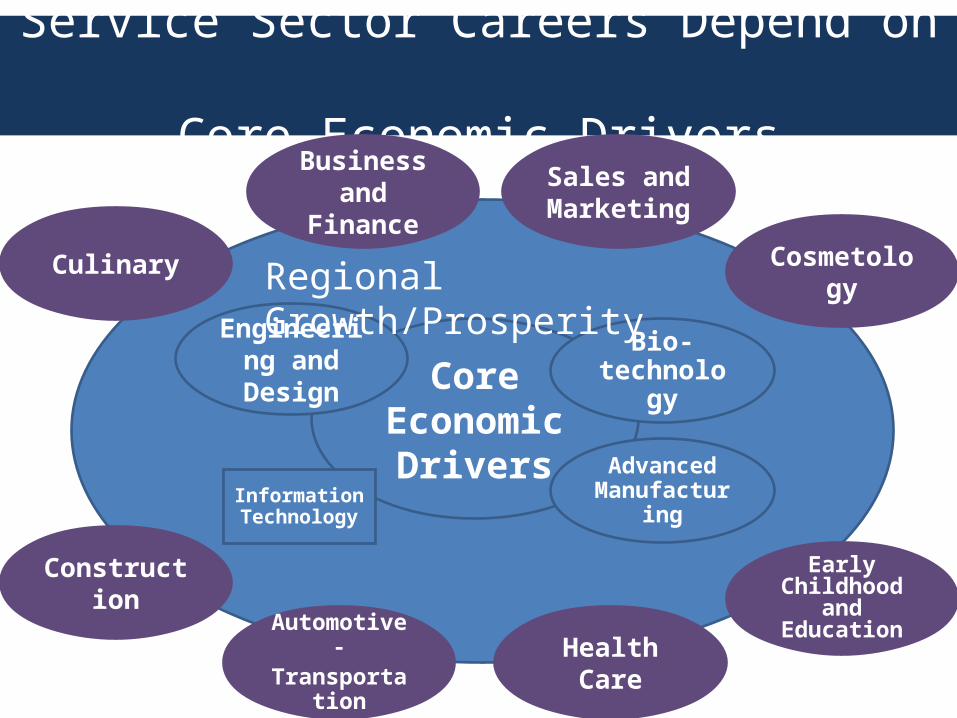
Service Sector Careers Depend on Core Economic Drivers
Core Economic
DriversInformation Technology
Engineering and Design
Bio-technology
Advanced Manufacturin
g
Culinary
Construction
Automotive-Transportation Health Care
Sales and Marketing
Business and Finance
Early Childhood and
Education
CosmetologyRegional Growth/Prosperity

The Innovation Eco-System creates jobs, when managed and supported
Young businesses with innovation technologies and processes are the drivers of job growth.
CTE Programs should address a mix of core economic drivers and support sectors.
Innovation EconomyInnovation EconomyRe-CapRe-Cap

Trends in the U.S. Workforce


By 2018, 63 percent of job openings will require workers with at least some college education
Source: “Help Wanted” Projections of Jobs and Education Requirements Through 2018,Georgetown University Center on Education and the Workforce
New and replacement demand(46.8 million by 2018)
36%
30%33%

In 2018 the economy will need:In 2018 the economy will need:
• 22 million more Associate’s, Bachelor’s and Graduate Degrees
• 4.7 million postsecondary certificates
• Continued undersupply will lead to a 3 million degree shortfall.

In general, learning impacts earning…In general, learning impacts earning…
Source: “Help Wanted” Projections of Jobs and Education Requirements Through 2018,Georgetown University Center on Education and the Workforce

But, occupation matters...But, occupation matters...
• 27% of young workers with Licenses and Certificates earn more than those with a Bachelor’s degree.
• 31% of young workers with Associate’s degrees earn more than those with a Bachelor’s degree.

The changing relationship of The changing relationship of workers and companiesworkers and companies
• There has been a major shift toward very small, solo, and micro-businesses. – 16.5 million soloists, – 3.5 million temps, and – 13 million micro-businesses.
• Estimated total of 33 million “free agents”
Source: Daniel Pink, “Free Agent Nation”

Postsecondary education needed for most workers.
A wide variety of postsecondary options exist for education, training and apprenticeship.
A large percentages of the workforce already works in small teams and self-directed settings.
CTE educators can help communicate these perspective to students, parents, business partners, and other educators.
Innovation EconomyInnovation EconomyRe-CapRe-Cap

Skills and Knowledge for Skills and Knowledge for the Innovation Economy the Innovation Economy

The Skills Mismatch
“During the recession, domestic manufacturers appear to have accelerated the long-term move toward greater automation, laying off more of their lowest-skilled workers and replacing them with cheaper labor abroad. Now they are looking to hire people who can operate sophisticated computerized machinery, follow complex blueprints and demonstrate higher math proficiency than was previous required of the typical assembly line worker.”
--- New York Times, July 1, 2010

Skills MismatchSkills MismatchSome jobs still difficult to fillSome jobs still difficult to fill
1. Skilled Trades2. Sales Representatives3. Nurses4. Technicians5. Drivers6. Restaurant & hotel Staff7. Management/Executives8. Engineers9. Doctors & other Non-Nursing
Professionals10. customer Service
Representatives & customer Support Staff
52% of employers indicate difficulty filling positions in
2011, compared with 14% in 2010.
Source; Manpower, Inc., 2011 Talent Shortage Survey Results
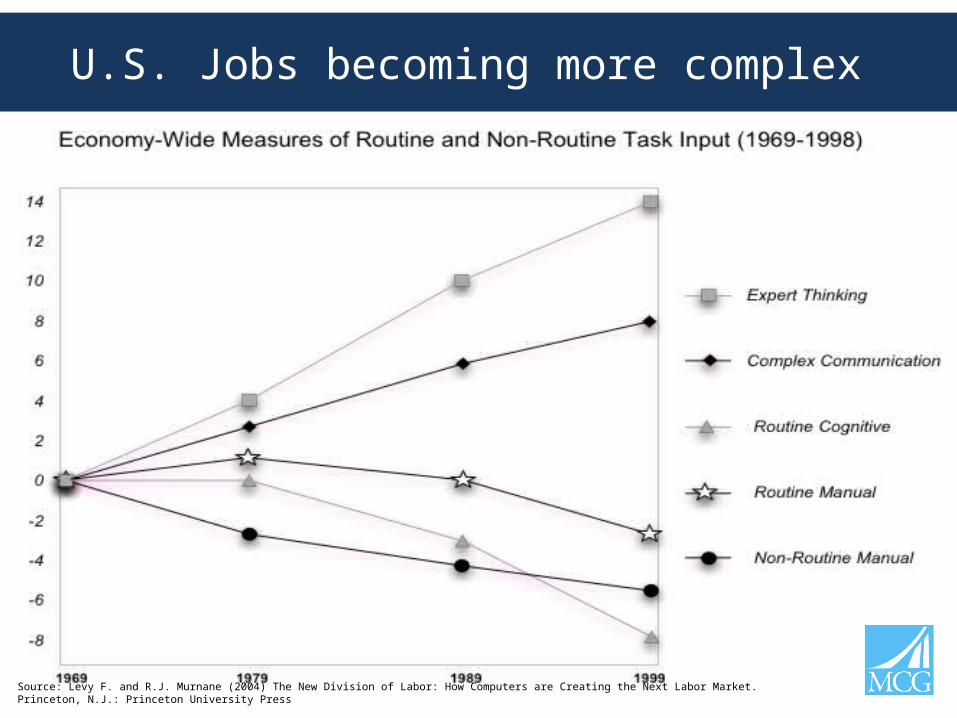
Source: Levy F. and R.J. Murnane (2004) The New Division of Labor: How Computers are Creating the Next Labor Market. Princeton, N.J.: Princeton University Press
U.S. Jobs becoming more complex

The requirements of the workforce
are changing
Why are 21Why are 21stst century skills so important century skills so important??

What employers really want…Top skills for workers
with high school diploma
• Professionalism/Work Ethic (80.3%)
• Teamwork/ Collaboration (74.7%)
• Oral Communications (70.3%)
• Ethics/Social Responsibility (63.4%)
• Reading Comprehension (62.5%)
Top skills for workers with 2-year degrees
• Professionalism/ Work Ethic (83.4%)
• Teamwork/ Collaboration (82.7%)
• Oral Communications (82.0%)
• Critical Thinking/ Problem Solving (72.7%)
• Reading Comprehension (71.6%)
• Oral Communications (95.4%)
• Teamwork/ Collaboration (94.4%)
• Professionalism/ Work Ethic (93.8%)
• Written Communications (93.1%)
• Critical Thinking/ Problem Solving (92.1%)
Top skills for workers with four year degrees
“Are They Really Ready to Work?”

What is ‘Adaptive Expertise’?
“Adaptive experts on the other hand are assumed to possess both the core efficiencies of routine experts and the willingness and ability to develop effective responses and solutions to novel situations.”
Source: Creating Environments for Continuous Learning: Adaptive Organizations & Adaptive Expertise, Kieran O’Mahony, Timothy (et al), 2008

Source: Creating Environments for Continuous Learning: Adaptive Organizations & Adaptive Expertise, Kieran O’Mahony, Timothy (et al), 2008
Adaptive Expertise Starts with Teaching and Learning

Source: Creating Environments for Continuous Learning: Adaptive Organizations & Adaptive Expertise, Kieran O’Mahony, Timothy (et al), 2008
Results from Challenge-Based Instruction
• Deeper understanding of complex content (demonstrated on standardized tests against comparison group learning with traditional lecture-based approach)
• Building a Community of Practice – building relationships with experts that can be called upon inside the organization
• Effective Problem Solving – developing the habits of finding knowledge and applying it to specific challenges

Students need more than literacy, numeracy skills, and career-specific technical skills for true college and career success.
They need 21st century employability skills, with an understanding of the entrepreneurial, start-up environment.
They need to learn “adaptive” thinking.
Education programs need to seriously address development of ALL these skill sets.
Skills and Skills and KnowledgeKnowledge
Re-CapRe-Cap

Understanding the Common Core State Standards
June 2010

The Common Core State Standards Initiative
44
Beginning in the spring of 2009, Governors and state commissioners of education from 48 states, 2
territories and the District of Columbia committed to developing a common core of state K-12 English-language arts (ELA) and mathematics standards.
The Common Core State Standards Initiative (CCSSI) is a state-led effort coordinated by the National Governors Association (NGA) and the
Council of Chief State School Officers (CCSSO). www.corestandards.org

Why Common Core State Standards?
45
Preparation: The standards are college- and career-ready. They will help prepare students with the knowledge and skills they need to succeed in education and training after high school.
Competition: The standards are internationally benchmarked. Common standards will help ensure our students are globally competitive.
Equity: Expectations are consistent for all – and not dependent on a student’s zip code.
Clarity: The standards are focused, coherent, and clear. Clearer standards help students (and parents and teachers) understand what is expected of them.
Collaboration: The standards create a foundation to work collaboratively across states and districts, pooling resources and expertise, to create curricular tools, professional development, common assessments and other materials.

Common Core State Standards Evidence Base
46
•For example: Standards from individual high-performing countries and provinces were used to inform content, structure, and language. Writing teams looked for examples of rigor, coherence, and progression.
Mathematics
1.Belgium (Flemish)2.Canada (Alberta)3.China4.Chinese Taipei5.England6.Finland7.Hong Kong8.India9.Ireland10.Japan11.Korea12.Singapore
English language arts
1.Australia• New South Wales• Victoria
2.Canada• Alberta• British Columbia• Ontario
3.England4.Finland5.Hong Kong6.Ireland7.Singapore

Common Core State Standards for Mathematics

49
Overview of Overview of High SchoolHigh School Mathematics StandardsMathematics Standards
The high school mathematics standards:
–Call on students to practice applying mathematical ways of thinking to real world issues and challenges
–Require students to develop a depth of understanding and ability to apply mathematics to novel situations, as college students and employees regularly are called to do
–Emphasize mathematical modeling, the use of mathematics and statistics to analyze empirical situations, understand them better, and improve decisions
–Identify the mathematics that all students should study in order to be college and career ready.

Common Core State Standards for English
Language Arts and Literacy in History/ Social Studies,
Science, and Technical Subjects

52
Overview of Reading Strand
Reading
Progressive development of reading comprehension; students gain more from what they read
Emphasize the importance of grade-level texts that are of appropriate difficulty and are increasingly sophisticated Standards for Reading Foundational Skills (K-5)
Reading Standards for Literature (K-12)
Reading Standards for Informational Text (K-12)
Reading Standards for Literacy in History/Social Studies (6-12)
Reading Standards for Literacy in Science and Technical Subjects (6-12)

56
Overview of Writing Strand
Writing– Expect students to compose arguments and opinions,
informative/explanatory pieces, and narrative texts– Focus on the use of reason and evidence to substantiate an
argument or claim– Emphasize ability to conduct research – short projects and
sustained inquiry– Require students to incorporate technology as they create,
refine, and collaborate on writing– Include student writing samples that illustrate the criteria
required to meet the standards (See standards’ appendices for writing samples)

58
Overview of Standards for History/Social Studies, Science, and
Technical Subjects
Reading Standards for History/Social Studies, Science, and Technical Reading Standards for History/Social Studies, Science, and Technical SubjectsSubjects– Knowledge of domain-specific vocabulary – Analyze, evaluate, and differentiate primary and secondary sources – Synthesize quantitative and technical information, including facts
presented in maps, timelines, flowcharts, or diagrams
Writing Standards for History/Social Studies, Science, and Technical Writing Standards for History/Social Studies, Science, and Technical SubjectsSubjects– Write arguments on discipline-specific content and
informative/explanatory texts– Use of data, evidence, and reason to support arguments and claims – Use of domain-specific vocabulary

Understanding the Common Core State Standards
June 2010


Integration of Integration of Technical and Technical and Learning SkillsLearning Skills

The Pennsylvania CTE Best Practices Initiative is documenting the promising practices that Pennsylvania Career and Technical
Education administrators and teachers are utilizing as they work to improve program quality and student results.


Collaborative CTE/academic integrationErie County CTC (all sites use similar strategies)
Goal: Embed literacy and numeracy strategies across the schoolOverview: Establish standing committees for literacy and numeracy in 2008-2009
and hired literacy CoachFormal Literacy Plan
• Create a literacy-rich culture in each CTE program• Increase writing skills• Increase reading skills and content literacy (equivalent of 12.5 books/year)• Practice speaking and listening skills• Train all staff members to use differentiated teaching strategies and
incorporate Higher Order Thinking (H.O.T.) skills into lessons• Incorporate assessment/progress monitoring
Literacy initiatives on a weekly basis• Sustained Silent Reading• Reader Response Days• SAT vocabulary development

Valuing CTE/academic integrationReading Muhlenberg CTC
• “You can’t integrate academics if you just turn on the lights and go to work. You have to teach.” (School Director Gerald Witmer)
• “We have to integrate literacy and numeracy. It’s within our trades and it’s very important for them (students) to understand that.” (CTE teacher)
• One welding instructor observed that as he began to spend more lesson time on literacy and numeracy strategies, his students became more proficient and independent in learning their technical skills. As a result, when students participated in their applied work in the lab (or "shop"), they had fewer questions for the instructor.

Pavement Time

Creating the Connections

Creating the Connections

Creating the Connections

Creating the Connections
Education-Innovation Economy
Alignment

R
Service Sector Careers Depend on Core Economic Drivers Creating Regional Prosperity
Core Economic
DriversInformation Technology
Engineering and Design
Bio-technology
Advanced Manufacturin
g
Culinary
Construction
Automotive-Transportation Health Care
Sales and Marketing
Business and Finance
Early Childhood and
Education
CosmetologyRegional Growth/Prosperity

Career Academy Fusion of the 3 R’sCareer Academy Fusion of the 3 R’s
Academic Academic Learning Learning
SkillsSkills
Technical Technical SkillsSkills
EmployabilityEmployability-Workplace -Workplace
SkillsSkills
True College and Career Readiness

Out of my controlOut of my control
Within my sphere Within my sphere of influenceof influence
Your sphere of influence/responsibilityYour sphere of influence/responsibility
WithinWithinmy controlmy control
• What do I What do I control?control?
• What can I What can I influence?influence?
• What concerns What concerns me but I can’t me but I can’t control?control?
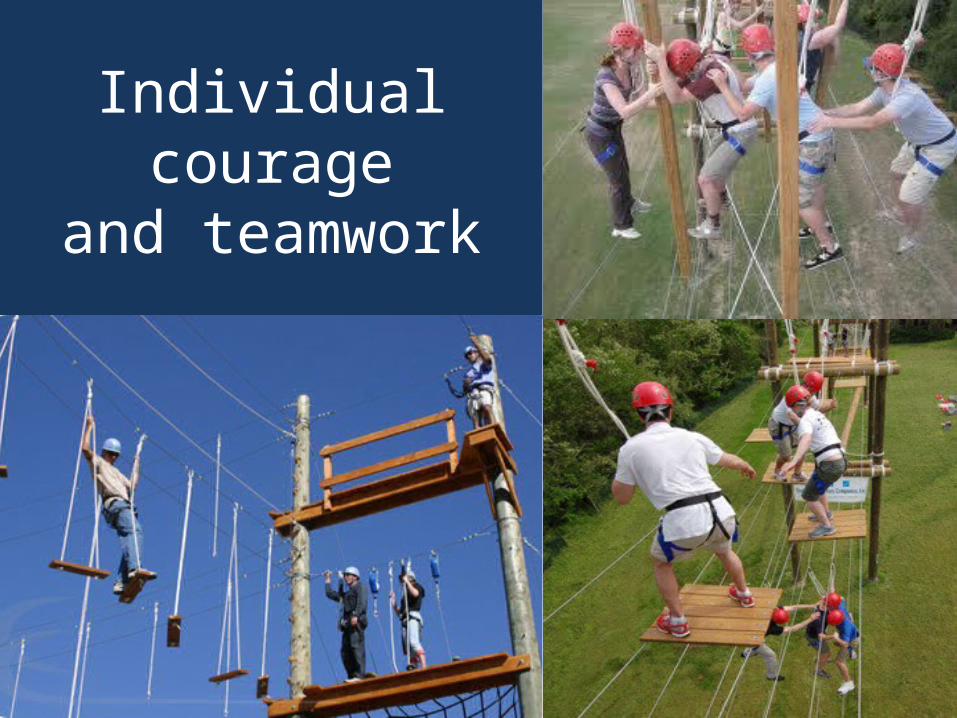
Individual courageand teamwork

Align CTE programs to key economic sectors that drive regional job growth.
Ensure that all CTE programs address 21st employability skills.
Actively integrate reading comprehension, communication , mathematical reasoning into CTE.
Build excellent programs AND stand together as ONE Career and Technical Education Community.
Action Steps to Action Steps to Survive and Survive and
ThriveThrive

Question and Comments

Career Technical Education:Career Technical Education:Surviving and Thriving Surviving and Thriving
through Turbulent Timesthrough Turbulent Times

[email protected]@MeederConsulting.com
Blog: MeederMindWorks.wordpress.comBlog: MeederMindWorks.wordpress.com
Web: MeederConsulting.comWeb: MeederConsulting.com
Career Technical EducationCareer Technical Education::Surviving and Thriving Surviving and Thriving
through Turbulent Timesthrough Turbulent Times