care presentation
DESCRIPTION
A presentation by CARETRANSCRIPT
Q2 & H1 FY2014 Results Presentation
Q2 & H1 FY14 Results Presentation
Disclaimer
2
Certain statements in this document may be forward-looking statements. Such
forward-looking statements are subject to certain risks and uncertainties like
government actions, economic developments, and many other factors that could
cause the Company’s actual results to differ materially from those contemplated by
the relevant forward-looking statements. Credit Analysis and Research Ltd. will not be
in any way responsible for any action taken based on such statements and
undertakes no obligation to publicly update these forward-looking statements to
reflect subsequent events or circumstances.

Quarterly & Half yearly Performance

Q2 & H1 FY14 Results Presentation
Economic backdrop (April-September)
4
CARE's performance should be viewed against backdrop of overall economic conditions and capital market activity
GDP growth in Q1 slows down to 4.4%
Industrial growth of 0.4% during April-September
Interest rates increased by RBI by 25 bps in Q2: inflation a major concern
Several other measures to control exchange rate volatility: reversed in October
While bank credit growth picks up, debt market offerings lower
Limited progress in infrastructure growth
Q2 & H1 FY14 Results Presentation
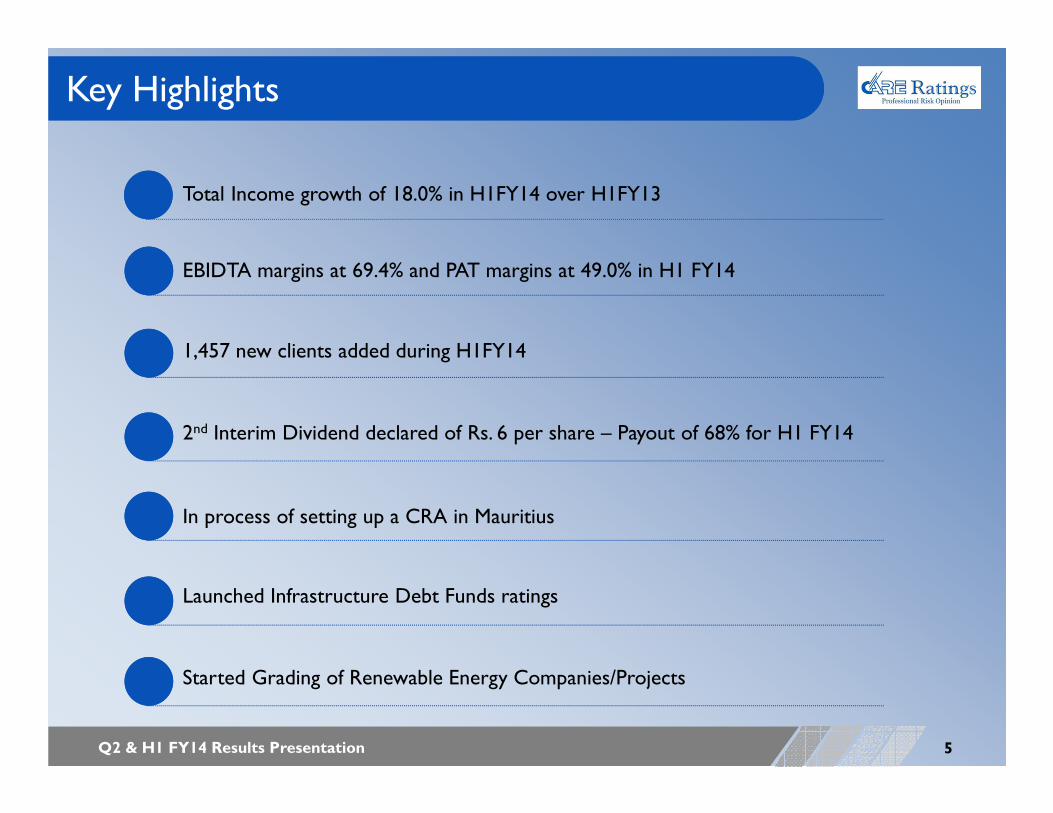
Key Highlights
Total Income growth of 18.0% in H1FY14 over H1FY13
5
EBIDTA margins at 69.4% and PAT margins at 49.0% in H1 FY14
1,457 new clients added during H1FY14
2nd Interim Dividend declared of Rs. 6 per share – Payout of 68% for H1 FY14
In process of setting up a CRA in Mauritius
Launched Infrastructure Debt Funds ratings
Started Grading of Renewable Energy Companies/Projects

Q2 & H1 FY14 Results Presentation
MD and CEO’s Message
6
Commenting on the results and performance for Q2 & H1 FY14, Mr. D.R. Dogra, Managing Director and CEO of CARE Ratings said:
“Given the rather subdued performance of the Indian economy, volatility in forex markets necessitatingaffirmative action from the policy makers and resulting subdued credit and debt markets, our performance hasbeen fairly stable with steady growth in income and maintenance of growth in profit and profit margins. We doexpect conditions to improve in the economy in the coming months, based on a revival in consumer andinvestment demand, which should hopefully help us scale up our business lines. Meanwhile we continue to focuson all the three targets segments: debt, bank loans and SMEs, to remain ahead of the curve.
As a Company, we are always looking to introduce new services to our portfolio that add value to themarketplace we operate in. During the quarter, we launched ratings for Infrastructure Debt Funds, which arebecoming progressively more vibrant in the market and grading of renewable energy companies/projects. Weremain focussed on the SME segment which is part of our strategy of growing business.
In Q2 FY2014, we continued to create value for our shareholders. I am pleased to share that the Board has declared an interim dividend of Rs. 6 per share. This amounts to a total dividend of Rs. 12 per share for H1 FY2014, translating to a strong payout ratio of 68%.
Our superior business model, growing brand equity, human capital efficiencies, expansive distribution networkand strong financial position has placed us on a firm footing to capture emerging sector prospects. We willcontinue to work through the economic challenges. We do hope that the economic environment improves withthe credit offtake picking and debt markets improving. ”

Q2 & H1 FY14 Results Presentation
Financial Performance – Q2 & H1 FY14
Rs. crore Q2 FY14 Q2 FY13Growth (%)
H1 FY14 H1 FY13Growth (%)
Rating Revenue 65.07 62.34 4.37 99.52 89.82 10.80
Other Revenue 0.21 0.02 950 0.44 0.07 528.57
Total revenue 65.28 62.36 4.68 99.96 89.89 11.20
Other income 5.45 4.19 30.07 21.05 12.64 66.53
Total income 70.73 66.55 6.28 121.01 102.53 18.02
Employee cost 11.71 11.66 (0.43) 26.87 23.62 13.76
Other expenses 5.98 4.32 38.43 10.18 7.07 43.99
Depreciation 0.79 1.15 (31.30) 1.32 1.60 (17.50)
Total Expenses 18.48 17.13 7.88 38.37 32.29 18.83
EBITDA 53.03 50.57 4.87 83.97 71.84 16.88
PBT 52.24 49.42 5.71 82.65 70.24 17.67
PAT 35.05 33.09 5.92 59.35 49.89 18.96
7
Q2 & H1 FY14 Results Presentation
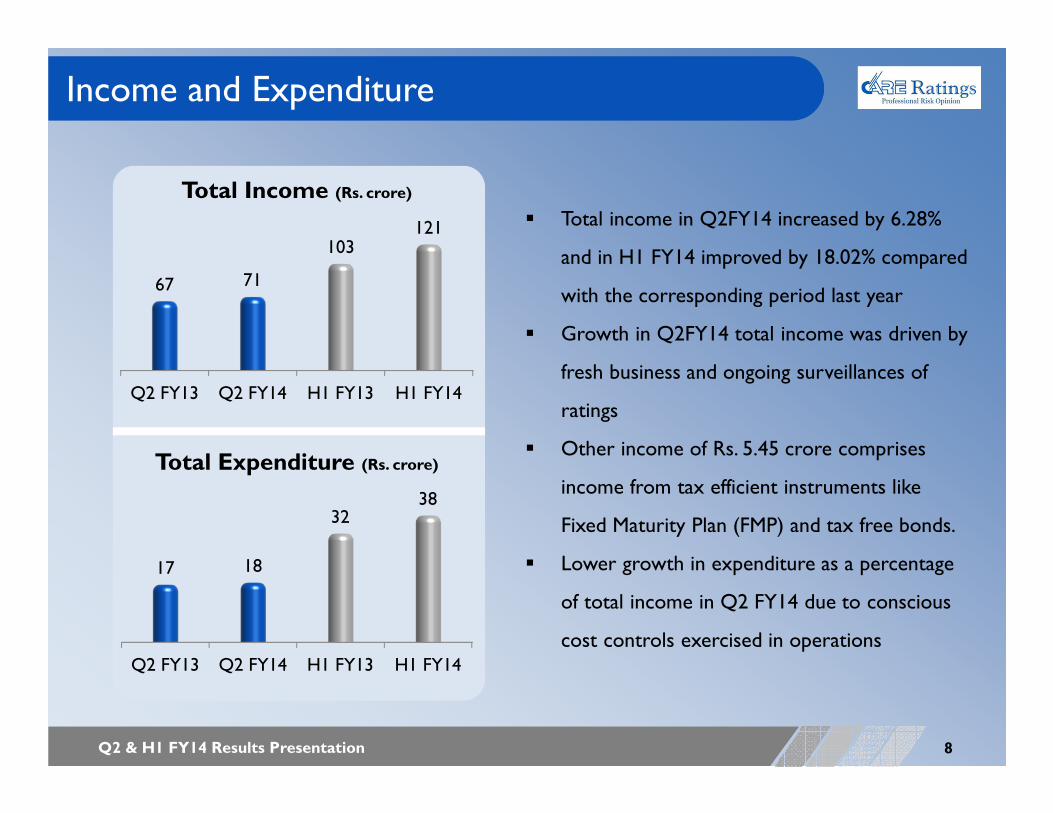
Income and Expenditure
8
� Total income in Q2FY14 increased by 6.28%
and in H1 FY14 improved by 18.02% compared
with the corresponding period last year
� Growth in Q2FY14 total income was driven by
fresh business and ongoing surveillances of
ratings
� Other income of Rs. 5.45 crore comprises
income from tax efficient instruments like
Fixed Maturity Plan (FMP) and tax free bonds.
� Lower growth in expenditure as a percentage
of total income in Q2 FY14 due to conscious
cost controls exercised in operationsQ2 FY13 Q2 FY14 H1 FY13 H1 FY14
17 18
3238
Total Expenditure (Rs. crore)
Q2 FY13 Q2 FY14 H1 FY13 H1 FY14
67 71
103121
Total Income (Rs. crore)

Q2 & H1 FY14 Results Presentation
Profitability
9
Q2 FY13 Q2 FY14 H1 FY13 H1 FY14
51 5372
84
EBITDA (Rs. crore)
76% 75%Margins� EBITDA augments by 4.87% in
Q2FY14 and by 16.88% in H1
FY14
� Higher total income along with
lower expenditure enabled the
Company to deliver growth in
EBIDTA and PAT
� PAT better by 5.92% in Q2 FY14
and by 18.96% in H1 FY14
70% 69%
Q2 FY13 Q2 FY14 H1 FY13 H1 FY14
33 3550
59
PAT (Rs. crore)
50% 50%Margins 49% 49%

Q2 & H1 FY14 Results Presentation
Number of Assignments
10
1,494
638
311
Q2 FY13
� Total number of assignments grew by 16.6% to 2,188 in Q2 FY14 as against 1,876 in Q2 FY13
� No. of bank Facilities rated saw an increase of 24.7% while the number of debentures rated
increased by 14.3%
2,575
120 18
524
H1 FY13
3,066
134 28 444
H1 FY14
1,863
7213 240
Q2 FY14

Q2 & H1 FY14 Results Presentation
Volume of Debt Rated
11
� In Q2FY14, volume of bank facilities and debenture/bond segments remained stable
resulting from a subdued economic environment
Q2 FY13 Q2 FY14 H1 FY13 H1 FY14
144,433
111,658
201,198
194,614
69,708
63,155
146,137
202,982
6,590
8,610
9,785
21,720
220,731
183,423
357,120
419,316
Rs. crore
Bank Facilities Debentures / Bonds Others Total
5 year Performance Snapshot

Q2 & H1 FY14 Results Presentation
Strong Financial Position and Profitability
13
FY09 FY10 FY11 FY12 FY13 H1FY14
5587 91
108 113
59
Profit After Tax (Rs. crore)
FY09 FY10 FY11 FY12 FY13 H1FY14
4 5 710
20
12
Dividend per share of Rs. 10
55% 57% 51% 52% 50% 6% 6% 8% 30% 58%Payout Ratio
Margins
60% Interim dividend declared for Q2 FY14
FY09 FY10 FY11 FY12 FY13 H1FY14
103
154177
206227
121
Total Income (Rs. crore)
FY09 FY10 FY11 FY12 FY13 H1FY14
83
126 136151 163
84
EBIDTA (Rs. crore)
49% 68%
CAGR (FY09-13): 20%
CAGR (FY09-13): 22% CAGR (FY09-13): 18%
Q2 & H1 FY14 Results Presentation
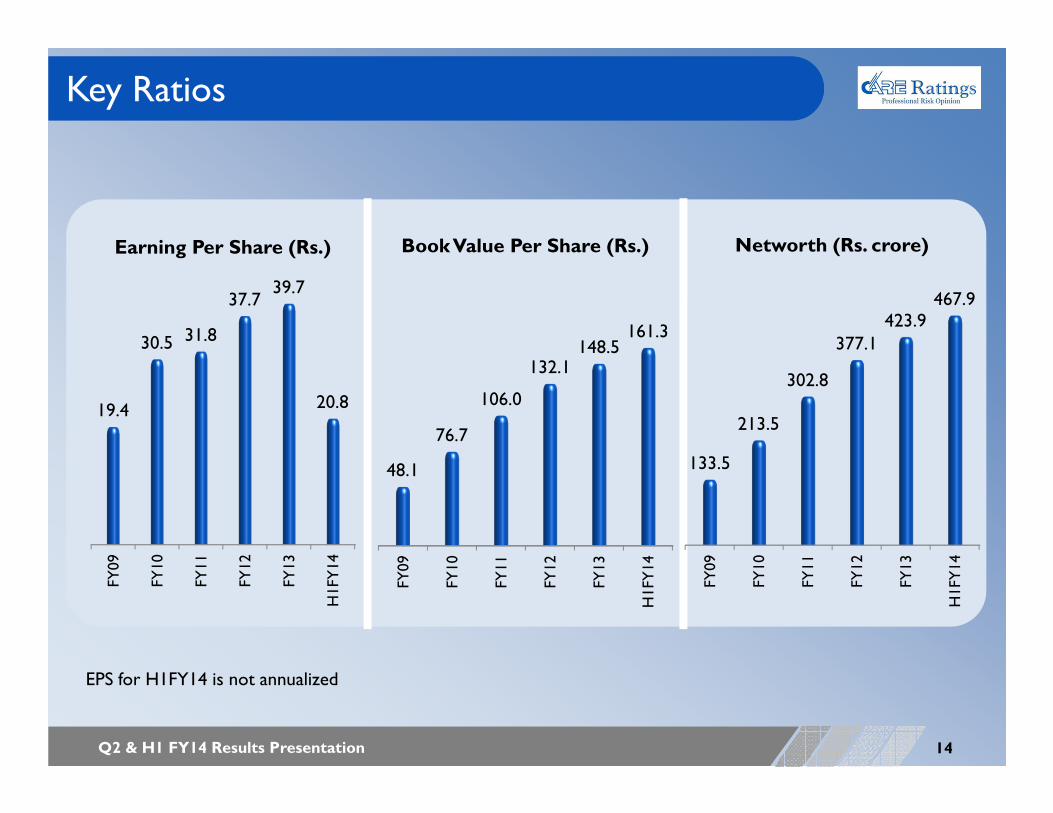
Key Ratios
14
FY09
FY10
FY11
FY12
FY13
H1FY
14
48.1
76.7
106.0
132.1148.5
161.3
Book Value Per Share (Rs.)
FY09
FY10
FY11
FY12
FY13
H1FY
14
19.4
30.5 31.8
37.739.7
20.8
Earning Per Share (Rs.)
FY09
FY10
FY11
FY12
FY13
H1FY
14
133.5
213.5
302.8
377.1
423.9467.9
Networth (Rs. crore)
EPS for H1FY14 is not annualized

Q2 & H1 FY14 Results Presentation
Robust Operational performance
15
FY09 FY10 FY11 FY12 FY13 H1FY14
1,579 1,808 2,187
5,9807,439
3,672
Assignments
FY09 FY10 FY11 FY12 FY13 H1FY14
711 758 1,114
3,900
5,263
6,720Clients
FY09 FY10 FY11 FY12 FY13 H1FY14
1,148 1,250 1,654
4,883
6,074
3,066
Bank Facility
FY09 FY10 FY11 FY12 FY13 H1FY14
189
277238
307 298
134
Debentures/Bonds
Substantial operational growth in varied macroeconomic environment & subdued business sentiment

Economic Backdrop
Q2 & H1 FY14 Results Presentation
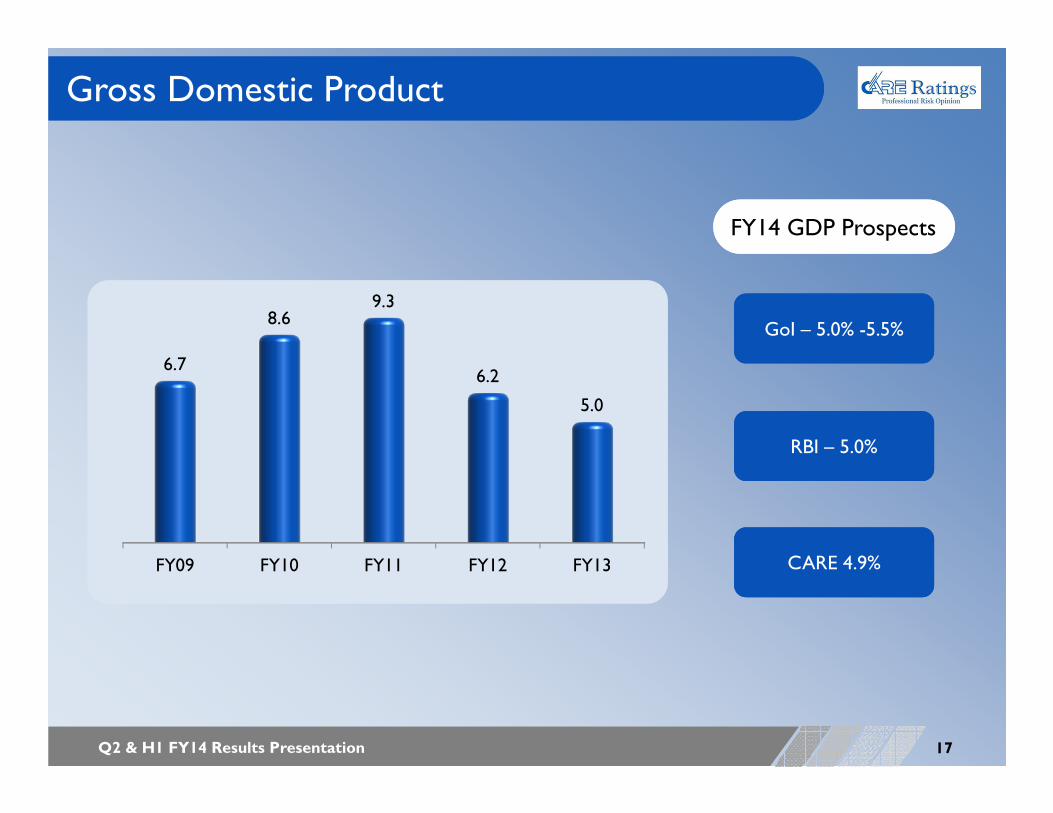
Gross Domestic Product
17
GoI – 5.0% -5.5%
RBI – 5.0%
CARE 4.9%
FY14 GDP Prospects
FY09 FY10 FY11 FY12 FY13
6.7
8.69.3
6.2
5.0

Q2 & H1 FY14 Results Presentation
Economy round up so far - Positives
18
• Bumper harvest crop expected in FY14 based on estimates of higher food grains production in Kharif
• The first advance estimates of Kharif food
grains production shows that output will
be 10.3% higher
• Bumper harvest crop expected in FY14 based on estimates of higher food grains production in Kharif
• The first advance estimates of Kharif food
grains production shows that output will
be 10.3% higher
• Trade deficit improved to $ 90.7 bn (first 7
mths) compared with $ 112 bn last year
• Exchange rate stable at Rs. 60–63/$
• RBI reduced MSF rate to 8.75% in the latest
policy
• Trade deficit improved to $ 90.7 bn (first 7
mths) compared with $ 112 bn last year
• Exchange rate stable at Rs. 60–63/$
• RBI reduced MSF rate to 8.75% in the latest
policy
• Growth in credit picking up: April – Sep 2013 at 6.8% as against
3.3% in the corresponding period
last year
• Growth in credit picking up: April – Sep 2013 at 6.8% as against
3.3% in the corresponding period
last year
• Core sector data shows a revival with growth of 8% in
September• For the cumulative
period of April-September, growth has been 3.2% as against
6.6% last year
• Core sector data shows a revival with growth of 8% in
September• For the cumulative
period of April-September, growth has been 3.2% as against
6.6% last year

Q2 & H1 FY14 Results Presentation
Economy round up so far - Negatives
• Government's fiscal deficit in the first six months of the current fiscal reached 76% (65%) of the
budget estimate
• Government's fiscal deficit in the first six months of the current fiscal reached 76% (65%) of the
budget estimate
• GDP growth at low of 4,4% in Q1• IIP growth stagnant: 0.4%
April – September FY14 (0.1%)
• GDP growth at low of 4,4% in Q1• IIP growth stagnant: 0.4%
April – September FY14 (0.1%)
• RBI maintaining anti-inflationary hawkish policy
stance
• RBI maintaining anti-inflationary hawkish policy
stance
• After moderating in Q1 FY14,
inflation increased in the months of July (5.8%), August
(6.1%) and September (6.5%)
• After moderating in Q1 FY14,
inflation increased in the months of July (5.8%), August
(6.1%) and September (6.5%)
19

Q2 & H1 FY14 Results Presentation
Expectations going ahead
Economic growth though low presently to pick up in H2
• Bank credit likely to maintain momentum
• Debt markets subdued and need to recover fast
Interest rates to come down only after inflation reduces Federal Reserve action on tapering will affect policy
Investment of Rs. 3.84 lakh crore on infrastructure projects as announced by FM
• This can provide boost to the debt market during the second half -implementation of investments remains a key challenge
20

Q2 & H1 FY14 Results Presentation
Sector Outlook
21
Debt Market
• Severely underpenetrated, below 5% to GDP
• To benefit from increased penetration by pension funds and insurance companies
• Multiple initiatives by Government of India to develop bond market
• Performance will depend on
• growth in infrastructure
• how much of the investment in projects cleared by government fructify
• Withdrawal of FIIs from debt market is not a good sign and needs to get reversed. Will depend on Fed action on tapering
Bank Loans
• September 2013 witnessed a pick up in credit in industry and services which will provide support for bank loan portfolio growth
• Ratings coverage of Bank Loans expected to continue growing
• Credit policy growth target of 15% likely to be realized in FY14
• BLR business to be positively affected with a lag
MSME
• Given low level of penetration, scope for growth is high
• Of the 1.5 million functional SME units less than 80,000 have been rated
• “Performance & Credit Rating Scheme” for MSEs, implemented by NSIC, expected to drive ratings
• Good rating enhances the acceptability of the rated unit in the market and also enables it to access cheaper credit, faster
• Ratings to help them procure credit at a time when rates are particularly high for them

Company Overview
Q2 & H1 FY14 Results Presentation
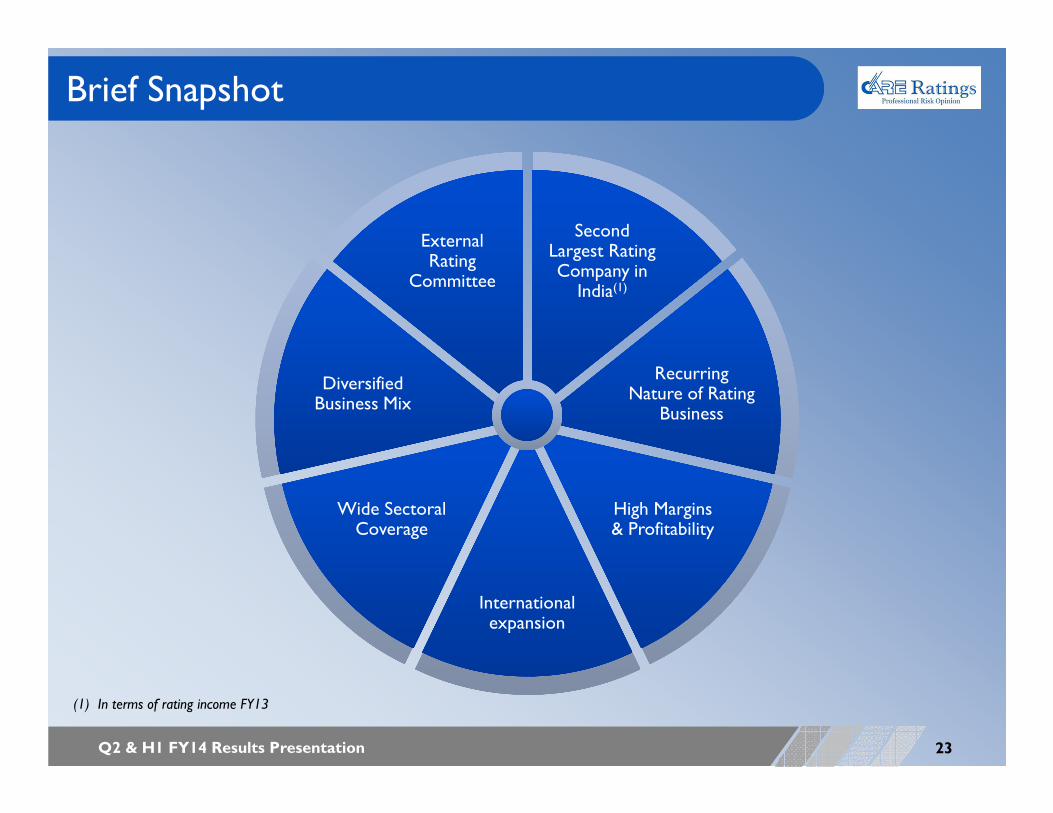
Brief Snapshot
23
Second Largest Rating Company in
India(1)
Second Largest Rating Company in
India(1)
Recurring Nature of Rating
Business
Recurring Nature of Rating
Business
High Margins & ProfitabilityHigh Margins & Profitability
International expansion
International expansion
Wide SectoralCoverage
Wide SectoralCoverage
Diversified Business MixDiversified Business Mix
External Rating
Committee
External Rating
Committee
(1) In terms of rating income FY13

Q2 & H1 FY14 Results Presentation
Diversified Business Mix
24
Ratings
� Manufacturing & Services sector
� Financial sector
� Infrastructure
� Small & Medium Enterprises
� Structured Finance
� Sub Sovereign ratings
Research & Gradings
� Industry & Customized Research reports
� CARE Industry Risk Metrics (CIRM) reports
� Grading services
� Training
� Valuations
International expansion
� Already in Maldives
� JV partner for setting up international rating agency – ARC Ratings
� Exploring markets in neighboring countries
CARE Kalypto
� Risk Solutions for
o Basel II, Credit risks, Operational risks, Fund Transfer Pricing, Asset Liability Management, Value at risk, Capital Adequacy Ratio
� Advisory Services
Investment income
Q2 & H1 FY14 Results Presentation
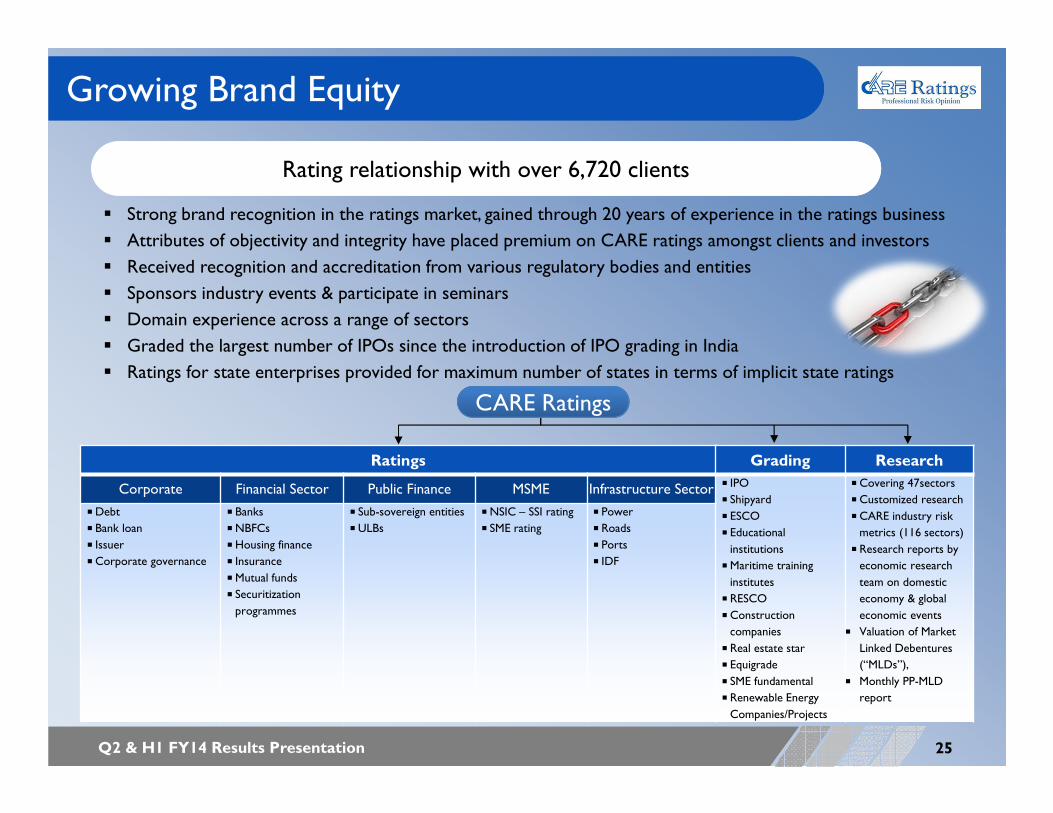
Ratings Grading Research
Corporate Financial Sector Public Finance MSME Infrastructure Sector � IPO
� Shipyard
� ESCO
� Educational
institutions
�Maritime training
institutes
� RESCO
�Construction
companies
� Real estate star
� Equigrade
� SME fundamental
� Renewable Energy
Companies/Projects
�Covering 47sectors
�Customized research
�CARE industry risk
metrics (116 sectors)
� Research reports by
economic research
team on domestic
economy & global
economic events
� Valuation of Market
Linked Debentures
(“MLDs”),
� Monthly PP-MLD
report
�Debt
� Bank loan
� Issuer
�Corporate governance
� Banks
�NBFCs
�Housing finance
� Insurance
�Mutual funds
� Securitization
programmes
� Sub-sovereign entities
�ULBs
�NSIC – SSI rating
� SME rating
� Power
� Roads
� Ports
� IDF
Growing Brand Equity
25
� Strong brand recognition in the ratings market, gained through 20 years of experience in the ratings business
� Attributes of objectivity and integrity have placed premium on CARE ratings amongst clients and investors
� Received recognition and accreditation from various regulatory bodies and entities
� Sponsors industry events & participate in seminars
� Domain experience across a range of sectors
� Graded the largest number of IPOs since the introduction of IPO grading in India
� Ratings for state enterprises provided for maximum number of states in terms of implicit state ratings
Rating relationship with over 6,720 clients
CARE RatingsCARE Ratings

Q2 & H1 FY14 Results Presentation
Strong Rating Credibility - External Rating Committee
26
� Former Managing Partner, S.B. Billimoria & Co.
� Member of Board of Directors of a number of companies and organizations including RBI
Y. H. Malegam(Chairman)
Y. H. Malegam(Chairman)
� Former Managing Director of State Bank of Mysore
� Former Deputy Managing Director and Chief Credit Officer of SBI
P.P. PattanayakP.P. Pattanayak
� Former Deputy Governor, RBI
� Ex-CMD Union Bank
� Former member of Board of Directors of IIBF, NABARD, NHB etc.
V. LeeladharV. Leeladhar
� Former whole time member of SEBI
� Former Chairman and Managing Director of Corporation Bank and SIDBI
V.K. ChopraV.K. Chopra
� Managing Director, CARE
� Member of several committees of various chambers of commerce
D.R. DograD.R. Dogra
� To maintain high standards of professional quality/integrity and address any conflict of interest, CARE has an external ratings committee comprising a majority of independent members
� Have had an external rating committee since inception (1993)
� Ratings ratified by highly qualified committee
Steadfast commitment to veracity and objectivity in the opinions provided

Q2 & H1 FY14 Results Presentation
Strong Rating Credibility - Ratings Process
27
� Established rating procedures
� Separate quality control department
� Continuous criteria development and improvement
� 3 levels of checks & balances
Quality Systems & Risk
Management
Quality Systems & Risk
Management
Information TechnologyInformation Technology
� Implemented integrated information interface for work flow management
� Established CARE Knowledge Centre (CKC)
� Established Online Research Distribution System for subscription of research reports
Principled ratings approach
Principled ratings approach
� Strong policies in place to drive merit based ratings
� Compensation terms insulated from rating assigned
� In-line with SEBI, RBI compliance CARE publishes an annual Default and Transition study of CARE rated issuers
� CARE’s issued rating exhibit high level of stability – cumulative default rates and transition rates in line with industry average and peers
Industry analogous default rates
Industry analogous default rates
Robust ProcessesPrincipled approach, strong & transparent disclosures
� Full initial rating fee is to be paid upfront – prior to rating assigned
� Issuers are liable to pay rating fees, regardless of whether they accept CARE's rating or not
Compensation terms insulated from rating assigned
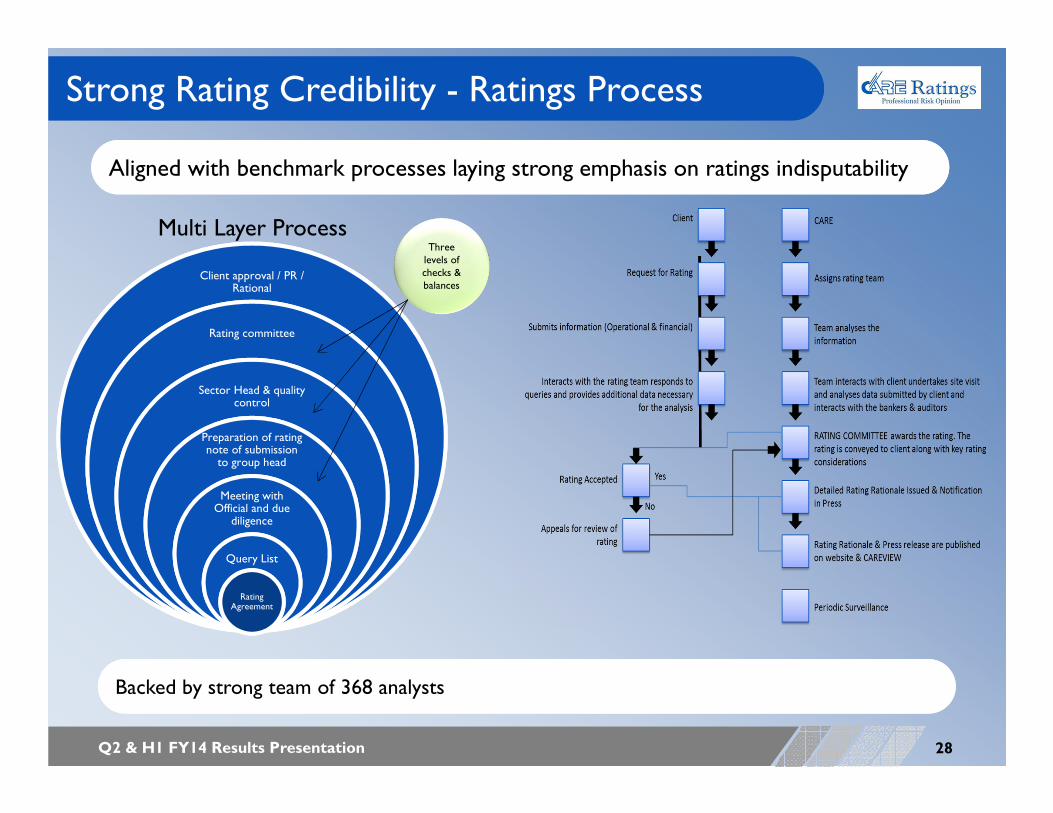
Q2 & H1 FY14 Results Presentation
Strong Rating Credibility - Ratings Process
28
Aligned with benchmark processes laying strong emphasis on ratings indisputability
Backed by strong team of 368 analysts
Client approval / PR / Rational
Rating committee
Sector Head & quality control
Preparation of rating Preparation of rating note of submission to group head
Meeting with Official and due
diligence
Query List
Rating Agreement
Multi Layer ProcessThree levels of checks & balances

Q2 & H1 FY14 Results Presentation
� Recognized by the Capital Markets Development Authority, Republic of Maldives
The shareholding agreement for ARC Ratings (a new international credit rating agency) has been signed with 4 other CRAs from Brazil, Portugal, Malaysia and South Africa
Global Footprint
29
Expanding international presence - only leading Indian rating Company with global play
� in process of signing MoU for starting operations in Mauritius
Mauritius
Hong Kong
� Recognized by the Hong Kong Monetary Authority
Brazil
Portugal
Malaysia
South Africa
Maldives
Nigeria
� Signed a MoU for exploring possibilities of providing risk management solutions & training in Nigeria
Ecuador
� Offers technical assistance
Mexico
� Provided technical assistance

Q2 & H1 FY14 Results Presentation
Strong Financial Position and Profitability
30
(Rs. crore)
� Significant annual cash flow generation enabling strong cash on books of Rs. 443 crore
� Substantial accrual to balance sheet augments shareholder worth – creating value each
successive year; 58% payout in FY13 and 68% payout for H1 FY14
� Provides sizeable platform to deliver future growth - evaluating organic and inorganic
opportunities to create value
(Rs. crore)
Strong cash flow generation with low capex intensity supports a cash rich balance sheet
32.7
48.9755.98
81.6 78.16
22.438.9
11.516.6
8.2
5.61.6
0.0
2.0
4.0
6.0
8.0
10.0
12.0
14.0
16.0
18.0
0
10
20
30
40
50
60
70
80
90
FY09 FY10 FY11 FY12 FY13 H1FY14
Free Cash Flow Capex
CAGR (FY09-13): 19.06%
Q2 & H1 FY14 Results Presentation
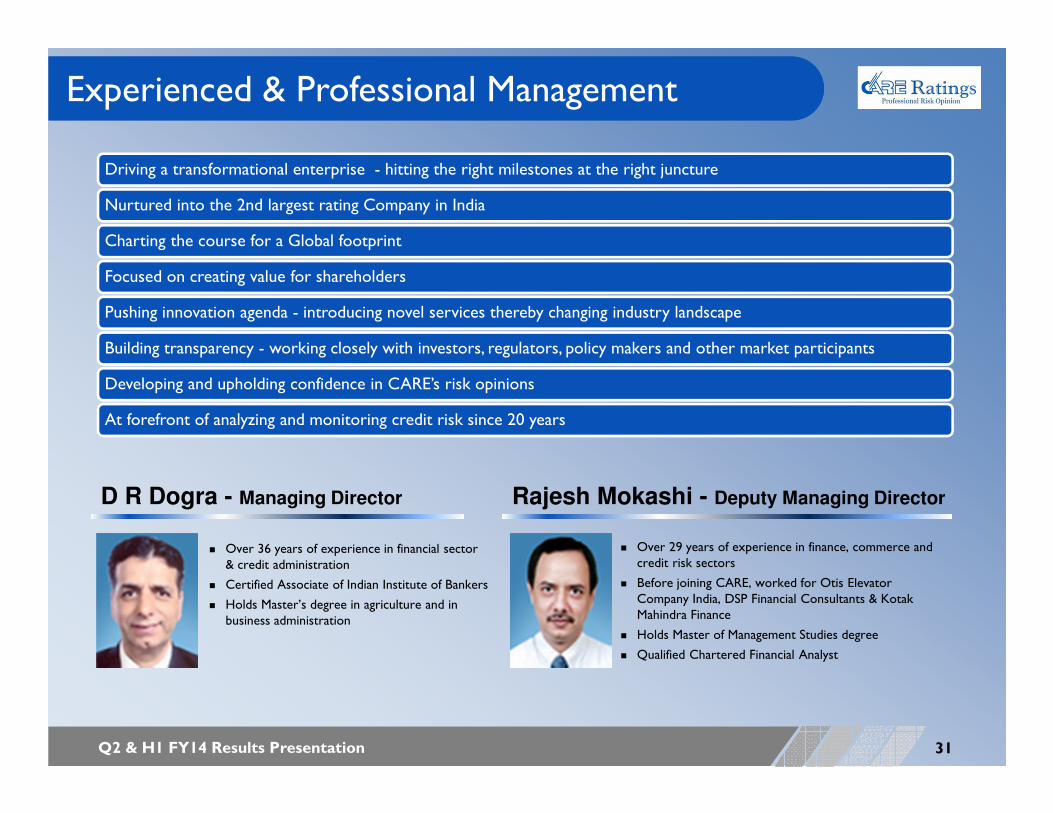
Experienced & Professional Management
31
� Over 36 years of experience in financial sector & credit administration
� Certified Associate of Indian Institute of Bankers
� Holds Master’s degree in agriculture and in business administration
� Over 29 years of experience in finance, commerce and credit risk sectors
� Before joining CARE, worked for Otis Elevator Company India, DSP Financial Consultants & Kotak Mahindra Finance
� Holds Master of Management Studies degree
� Qualified Chartered Financial Analyst
Driving a transformational enterprise - hitting the right milestones at the right juncture
Nurtured into the 2nd largest rating Company in India
Charting the course for a Global footprint
Focused on creating value for shareholders
Pushing innovation agenda - introducing novel services thereby changing industry landscape
Building transparency - working closely with investors, regulators, policy makers and other market participants
Developing and upholding confidence in CARE’s risk opinions
At forefront of analyzing and monitoring credit risk since 20 years
D R Dogra - Managing Director Rajesh Mokashi - Deputy Managing Director

Q2 & H1 FY14 Results Presentation
Experienced & Professional Management
32
T.N. Arun KumarChief General Manager, Ratings
� 25 years of experience in financial services
� PGDM; CFA; FRM
Navin K. JainCompany Secretary & Compliance Officer
� 26 years of experience in accounting services
� Masters degree in financial services management & C.S.
Milind GadkariChief General Manager, Ratings
� 18 years of experience in credit rating, training of new recruits
� Master’s degree in management sciences; CFA
Mehul Pandya Chief General Manager, Business Development
� 18 years of experience in rating services
� MBA; CFA
Swati Agarwal JainChief General Manager, Business Development
� 18 years of experience in credit rating, advisory and consultancy
� PGDM
Revati KastureChief General Manager, Research
� 15 years of experience in credit analysis and research services
� C.A.; Cost Accountant
Madan SabnavisGeneral Manager, Chief Economist
� 27 years of experience in development banking, commercial banking, engineering & commodity markets
� Masters degree in economics
Sanjay Kumar AgarwalGeneral Manager, Business Development
� 20 years of experience in corporate and infrastructure finance, risk management and banking
� C.A.; ICWA
Amod KhanorkarGeneral Manager, Ratings
� 21 years of experience in credit rating, valuations and project appraisal in infrastructure sector
� PGDM
Chandresh ShahChief Financial Officer
� 15 years of experience in finance, accounting, taxation and US GAAP
� C.A.
Umesh IkheChief Technology Officer
� 18 years of experience
� Bachelors Degree in Computer Science; Executive General Management Programmefrom Indian institute of Management
Josey JosephHead of Human Resources
� 19 years of experience in diverse areas within HR
� Maters in Personnel Management
Q2 & H1 FY14 Results Presentation
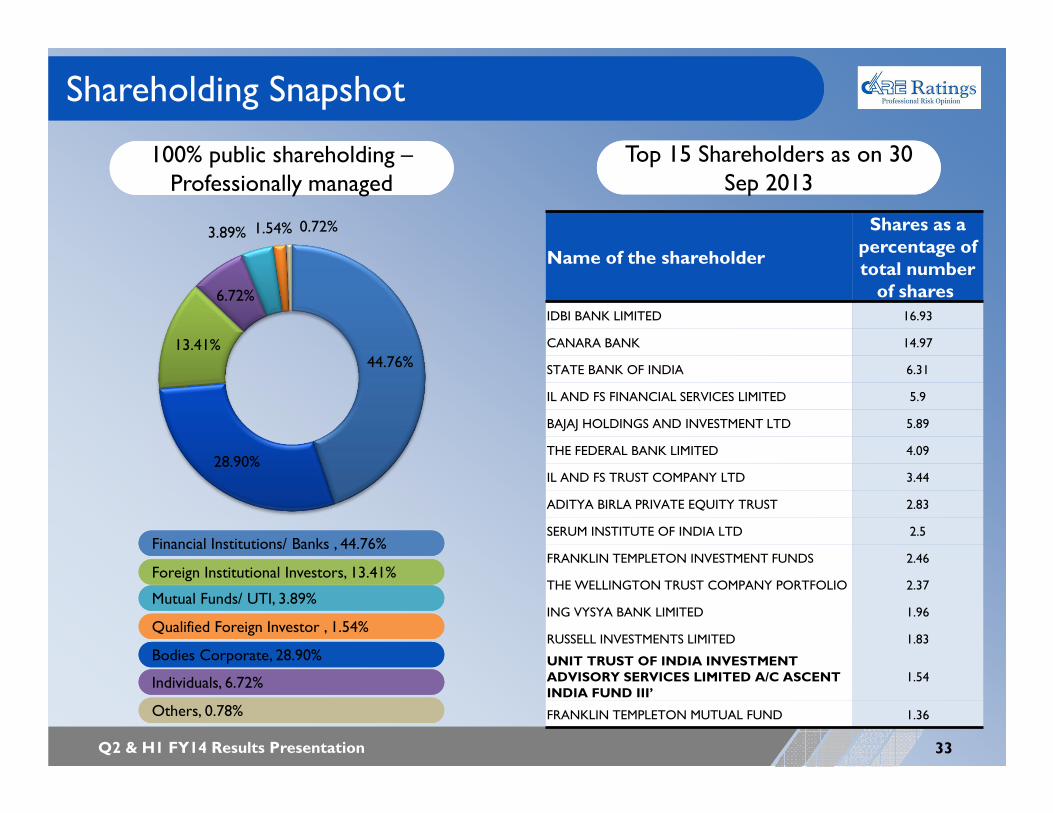
44.76%
28.90%
13.41%
6.72%
3.89% 1.54% 0.72%
Shareholding Snapshot
33
100% public shareholding –Professionally managed
Name of the shareholder
Shares as a percentage of total number of shares
IDBI BANK LIMITED 16.93
CANARA BANK 14.97
STATE BANK OF INDIA 6.31
IL AND FS FINANCIAL SERVICES LIMITED 5.9
BAJAJ HOLDINGS AND INVESTMENT LTD 5.89
THE FEDERAL BANK LIMITED 4.09
IL AND FS TRUST COMPANY LTD 3.44
ADITYA BIRLA PRIVATE EQUITY TRUST 2.83
SERUM INSTITUTE OF INDIA LTD 2.5
FRANKLIN TEMPLETON INVESTMENT FUNDS 2.46
THE WELLINGTON TRUST COMPANY PORTFOLIO 2.37
ING VYSYA BANK LIMITED 1.96
RUSSELL INVESTMENTS LIMITED 1.83
UNIT TRUST OF INDIA INVESTMENT ADVISORY SERVICES LIMITED A/C ASCENT INDIA FUND III’
1.54
FRANKLIN TEMPLETON MUTUAL FUND 1.36
Financial Institutions/ Banks , 44.76%
Bodies Corporate, 28.90%
Foreign Institutional Investors, 13.41%
Individuals, 6.72%
Mutual Funds/ UTI, 3.89%
Qualified Foreign Investor , 1.54%
Others, 0.78%
Top 15 Shareholders as on 30 Sep 2013

Q2 & H1 FY14 Results Presentation
Value drivers
34
Second largest ratings Company in India
� Best-in-class operating model with margin leadership
� Expansive distribution network
� Seasoned management team with superior execution experience
� Parentage of marquee banks
� Strong origination capabilities and relationship management (Rating
relationship with over 6,720 clients)
Driving cost efficiency & productivity
� Strong discipline and governance around capital allocation and expenditure
� Cost efficient business model driven by CARE Knowledge Centre and Ci3
reduced overall employee costs coupled with higher employee productivity
� Owned properties translates to lower operating costs
Strong financial profile
� FY09 – FY13 Rating Revenue CAGR of 19.7%
� FY09 – FY13 EPS CAGR of 19.6%
� FY09 – FY13 Free Cash Flow CAGR of 15.3%
� Strong cash position of Rs. 4.4 bn supports multiple growth opportunities

Q2 & H1 FY14 Results Presentation
Value drivers
35
Committed towards value creation for shareholders
� Dividend friendly track record: Paying dividends since first full year of
operations
� Total dividend for FY13 amounts to Rs. 20 per share, 58% payout ratio
� An interim dividend of Rs. 6 per share for the quarter ended September
2013, 68% payout ratio
Investing in strategic opportunities - to enable robust Long-Term Opportunities for Growth
� Best positioned to capture sector opportunities
� In process of implementing global strategic plan
� To drive penetration in SME segment
� Increase research capabilities
� Leverage brand to nurture risk solutions and advisory business
� Look at organic and inorganic value accretive transactions
Q2 & H1 FY14 Results Presentation
ABOUT US
36
Credit Analysis and Research Limited (CARE Ratings) is the second largest full service rating Company inIndia*. CARE Ratings offers a wide range of rating and grading services across a diverse range ofinstruments and has over 20 years of experience in the rating of debt instruments and related obligationscovering wide range of sectors. The Company’s list of clients includes banks and other financial institutions,private sector companies, central public sector undertakings, sub-sovereign entities, small and mediumenterprises (“SMEs”) and micro-finance institutions, among others. The Company also provides issuerratings and corporate governance ratings and has rated innovative debt instruments, such as perpetualbonds.CARE Ratings is recognized for being knowledge based Company and has continued to work towardsdeepening the base. The Company provides industry research and economic research where 47 industriesare covered under its research services and 116 sectors under CARE Industry Risk Metrics (CIRM).Furthering the knowledge initiatives, the Company has tied up with Knowledge Academy, Ahmedabad toconduct a co-branded certification programme in credit risk assessment. Furthermore, the Company alsoprovides Risk Solutions and Advisory Services through its subsidiary CARE Kalypto.To enhance its scope of business CARE Ratings has been nurturing global opportunities and made forays indifferent forms: has a branch in Maldives and MoUs with CRAs in other countries. The Company has alsoentered into a JV to form a new international credit rating agency ‘ARC Ratings’ with 4 other CRAs fromBrazil, Portugal, Malaysia and South Africa.The Company has its registered office in Mumbai, and branches in New Delhi, Bengaluru, Chandigarh,Chennai, Hyderabad, Kolkata, Pune,Ahmedabad, Jaipur, Maldives.* In terms of rating income FY13

Vikram Rajput
CDR India
+91 22 6645 1223 vikramr@cdr-india
For further information, please contact:
D.R. Dogra, MD & CEO
CARE Ratings
Tel: +91 22 6754 3434Fax: +91 22 6754 3457
4th Floor, Godrej Coliseum, Somaiya Hospital Road, Off Eastern Express Highway, Sion (East), Mumbai 400 022
www.careratings.com
Anoop Poojari
CDR India
+91 22 6645 1211 [email protected]

Thank you