cardiovascular response to intermittent high intensity...
TRANSCRIPT

i
Cardiovascular response to intermittent high intensity double- and
single-legged cycling
Miss Nicole Gordon
2013

ii
This thesis is submitted as partial fulfilment of the requirements for the degree of
Bachelor of Exercise Physiology (Honours) at Murdoch University, Perth, Western
Australia.
I declare that this thesis is my own account of my research and contains as its main
content work which has not previously been submitted for a degree at any tertiary
education institution.
(Miss Nicole Gordon)

iii
I acknowledge that a copy of this thesis will be held at the Murdoch University
Library.
I understand that, under the provisions of s51.2 of the Copyright Act 1968, all or
part of this thesis may be copied without infringement of copyright where such a
reproduction is for the purposes of study and research.
This statement does not signal any transfer of copyright away from the author.
Signed:
Full name of degree: Bachelors of Exercise Physiology with Honours
Thesis title: Cardiovascular response to intermittent high intensity double- and
single-legged cycling.
Author: Miss Nicole Gordon
Year: 2013

iv
Acknowledgements
Special thanks to my supervisor Dr Jeremiah Peiffer for his support,
encouragement and patience throughout my honours year. Without him, this study
would not be what it is today and I am eternally thankful. A special thanks to my co-
supervisor Dr Chris Abbiss for his time and effort into helping me make the most out
of my study. For the loan of the counter-weight device used during the single-
legged cycling and his participation in the study.
To Emma Zadow, many thanks for her support and assistance throughout
the entire year. Her help in the laboratory and keeping me focussed has made this
year possible and couldn't imagine having done it any other way.
I would also like to thank the staff at Murdoch University for their ongoing
support and participation in the study.
Finally, I would like to thank my friends and family for all their support and
patience throughout this year. Their encouragement and understanding has been
next to none and is greatly appreciated.

v
Table of Contents
TABLE OF FIGURES ......................................................................................................vii
TABLE OF TABLES ....................................................................................................... viii
ABTRACT ....................................................................................................................... 1
CHAPTER ONE: INTRODUCTION ................................................................................... 4
1.1 BACKGROUND TO STUDY ................................................................................... 4
1.2 PURPOSE STATEMENT ........................................................................................ 7
1.3 RESEARCH QUESTIONS ....................................................................................... 7
1.4 HYPOTHESES ....................................................................................................... 8
1.5 LIMITATIONS/DELIMITATIONS ........................................................................... 8
CHAPTER TWO: CRITICAL REVIEW OF LITERATURE ................................................... 10
2.1 OVERVIEW ........................................................................................................ 10
2.2 CARDIOVASCULAR DISEASE AND PHYSICAL ACTIVITY ...................................... 11
2.3 MODERATE-INTENSITY CONTINUOUS EXERCISE .............................................. 13
2.3.1 American College of Sports Medicine exercise guidelines ........................ 13
2.3.3 Physiological adaptations to moderate-intensity exercise ....................... 13
2.3.4. Changes in cardiovascular disease risk factors associated with moderate-
intensity exercise ................................................................................................ 17
2.4 HIGH-INTENSITY INTERVAL TRAINING .............................................................. 18
2.4.1 Immerging use of high-intensity interval training ..................................... 18
2.4.2 Changes in VO2max associated with high-intensity exercise ...................... 18
2.4.3 Physiological adaptations to high-intensity interval training .................... 19
2.4.4 Influence of interval training on cardiovascular risk factors ..................... 24
2.4.5 Cardiac stress associated with interval training ........................................ 25
2.5 SINGLE-LEGGED CYCLE TRAINING .................................................................... 26
2.5.1. Changes in VO2max associated with single-legged cycling ......................... 27

vi
2.5.2 Physiological adaptations to single-legged cycling .................................... 27
2.5.3. Perceptual responses ................................................................................ 28
2.6 SUMMARY ......................................................................................................... 31
CHAPTER THREE: METHODS ....................................................................................... 32
3.1 STUDY DESIGN .................................................................................................. 32
3.2 SAMPLING METHODOLOGY.............................................................................. 32
3.3 PROCEDURES .................................................................................................... 33
3.4 PHYSIOLOGICAL MEASURES ............................................................................. 36
3.4.1 Venous Blood Sampling and analysis ......................................................... 36
3.4.2 Ultrasound Ventricular Measures .............................................................. 36
3.4.3 Heart Rate Analysis .................................................................................... 37
3.4.4 Expired Ventilation..................................................................................... 37
3.5 DATA PROCESSING............................................................................................ 37
3.6 STATISTICAL ANALYSIS ...................................................................................... 38
CHAPTER FOUR: RESULTS ........................................................................................... 40
CHAPTER FIVE: DISCUSSION ....................................................................................... 49
REFERENCES ............................................................................................................... 56
APPENDIX ONE ........................................................................................................... 64
APPENDIX TWO .......................................................................................................... 66
APPENDIX THREE ........................................................................................................ 69
vii
TABLE OF FIGURES
Figure 1. An outline of the study experimental design. ............................................. 36
Figure 2. Power output measured during the double- ( ■ ) and single-legged ( ▲ )
cycling conditions.. ..................................................................................................... 40
Figure 3. Mean VO2 (top), ventilation (middle) and RR (bottom) measured pre-
exercise and during each interval in double- ( ■ ) and single-legged ( ▲ ) cycling
conditions. .................................................................................................................. 41
Figure 4. Heart rate measured pre-exercise and during each interval in double- ( ■ )
and single-legged ( ▲ ) cycling conditions. ............................................................... 43
Figure 5. Systolic (top), diastolic (middle) and mean arterial pressure (bottom)
measured pre-exercise, following each interval and 10 minutes post-exercise in the
double- ( ■ ) and single-legged ( ▲ ) cycling conditions. .......................................... 45

viii
TABLE OF TABLES
Table 1. Literature examining cardio-respiratory adaptations resulting from
moderate-intensity continuous training in non-elite, healthy and unhealthy
individuals................................................................................................................... 15
Table 2. Literature examining cardio-respiratory adaptations resulting from high-
intensity interval training in non-elite, healthy and unhealthy individuals. .............. 21
Table 3. Literature examining cardio-respiratory adaptations resulting from single-
legged training in non-elite, healthy and unhealthy individuals. .............................. 29
Table 4. Brain natriuertic peptide (BNP) and left ventricular ejection fraction (%)
measured pre-exercise and post-exercise in the double- and single-legged cycling
conditions. .................................................................................................................. 44
Table 5. Ratings of perceived exertion, pain and effort measured following each
interval in double- and single-legged cycling conditions. .......................................... 47

1
ABTRACT
Although the benefits of high-intensity interval training can be similar or
superior to moderate- or low-intensity continuous training, it is possible that not all
individuals should undertake such exercise. While high-intensity interval training is
currently accepted practice within the cardiovascular rehabilitation setting, some
individuals may not be suited to this type of exercise due to their decreased
exercise tolerance and diminished cardiovascular function. The use of smaller
muscle mass training (e.g. single-legged cycling) can allow localised high-intensity
muscle training but avoid cardiac limitations associated with high blood flow
demands when training using a large muscle mass. Purpose: To examine the
differences in cardiovascular stress imposed by double- and single-legged high-
intensity interval cycling in order to better understand the physiological responses
of such exercise and assist in future training prescription. Methods: In a randomised
crossover design, ten young, healthy individuals (23 ± 5 years of age, 180 ± 7 cm
height, 74 ± 13 kg body weight, 51 ± 9 mL.kg-1.min-1) performed six 1-minute
double-legged 'all out' efforts interspersed with 1-minute active recovery and
twelve 1-minute single-legged (six with each leg) 'all out' efforts interspersed with
1-minute active recovery in two experimental sessions. Power output, oxygen
consumption and heart rate were measured throughout the interval sessions. Blood
pressure, oxygen saturation, ratings of perceived exertion, pain in the quadriceps
and effort were measured at baseline and immediately following each interval. All
self-perceived measures were taken on a 0 - 10 scale, with 0 = no perception and 10
= maximum perception. While brain natriuretic peptide (BNP) and left ventricular
function were measured pre- and post-exercise. Results: Significantly greater power

2
output (trial average: 340 ± 77 versus 301 ± 101 W, p<0.01) and workload (trial
average: 916 ± 73 versus 743 ± 122 kJ, p<0.01) was observed during combined right
and left single-legged cycling, when compared with double-legged cycling. Double-
legged cycling resulted in greater physiological stress compared with single-legged
cycling as shown by increased oxygen consumption (2.81 ± 0.69 versus 1.84 ± 0.43
L.min-1, respectively; p<0.01). Additionally, greater cardiac stress was observed
during and resulting from double-legged cycling when compared with single-legged
cycling as shown by increased inter-interval heart rate (161 ± 7 versus 142 ± 7 bpm,
respectively, p<0.01) and systolic blood pressure (180 ± 17 versus 166 ± 21 mmHg,
respectively, p<0.01) as well as lower end-session left ventricular ejection fraction
(pre-post change: 11.5 ± 1.8 versus 2.6 ± 1.3 %, respectively; p<0.05). BNP increased
pre- to post-exercise (24 ± 8 versus 27 ± 8 pg.mL-1), however, no differences were
observed between conditions. Overall sessional perceived exertion was lower
during single-legged, compared with double-legged cycling (7.2 ± 1.8 and 8.9 ± 0.7
units, respectively; p<0.02), even though inter-interval perceptions of exertion, pain
and effort were similar between conditions. Conclusion: Single-legged cycling
allows individuals to exercise at a greater overall power output; however, under
reduced cardiovascular and physiological stress when compared with traditional
double-legged cycling. Furthermore, single-legged cycling is perceived as easier,
which could benefit compliance if used as a training stimulus. With increased
attention placed on the use of high-intensity interval training in diseased
populations, results of the present study indicate that single-legged cycling could
provide an alternative approach to normal double-legged cycling giving

3
practitioners a method to quickly enhance metabolic function while allowing
individual to exercise with less risk of experiencing an adverse cardiac event.
4
CHAPTER ONE: INTRODUCTION
1.1 BACKGROUND TO STUDY
Cardiovascular disease is a major world health issue accounting for an
estimated 30% of deaths globally [1]. In Australia, cardiovascular disease affects
18% of the population and is responsible for 25% ($AU372 million) of the health
care costs associated with physical inactivity ($AU1.5 billion) [2, 3]. The risk of
developing cardiovascular disease is drastically increased among individuals who
are sedentary or undertake low levels of exercise (i.e. less than the recommended
level of physical activity; <500 MET-min/week) [4]. Indeed, improving physical
fitness through exercise has been shown to reduce the risk of developing numerous
chronic diseases, including cardiovascular disease and diabetes [5-8].
Continuous low- to moderate-intensity exercise has traditionally been
prescribed in order to improve aerobic capacity [4, 8]. The American College of
Sports Medicine (ACSM) recommends the general population perform a minimum
of 30 minutes of moderate-intensity exercise on most, but preferably all, days of
the week. While these exercise recommendations have been shown to be effective
in improving aerobic capacity and cardiorespiratory fitness [9, 10], the time
required to complete such exercise is substantial. Indeed, many individuals fail to
adhere to these guidelines with the primary reason being 'lack of time' [11]. Recent
evidence indicates that high-intensity interval training, which involves completing
high intensity efforts interspersed with periods of low intensity rest between
efforts, may be as effective and a more time-efficient method of improving general
health and well-being [5, 11-18]. For example, Gibala et al. [11] observed similar
improvements in peak oxygen consumption (VO2peak), exercise performance and

5
skeletal muscle metabolic adaptations in young, healthy men and women following
six weeks of low-volume high-intensity interval training (i.e. four to six bouts of 30
seconds 'all out' efforts, with 4.5 minutes rest between, three times per week),
compared to continuous moderate-intensity training (i.e. 40-60 minutes at 65%
VO2peak, five times per week). It is interesting to note that within this study, the time
commitment (~67%) and training volume (~90%) of high-intensity interval training
was lower than continuous exercise, which is likely to improve exercise program
adherence. Indeed, compared with continuous moderate-intensity exercise, high-
intensity exercise has also been shown to be more motivating for participants [10]
and have a higher rate of adherence [19]. As a result of improved adherence and
the clear health benefits of high-intensity interval training, such training is beginning
to be prescribed to high-risk individuals such as patients with cardiovascular and
chronic diseases [11-15, 18].
Although the benefits of high-intensity training can be similar or superior to
moderate- or low-intensity prolonged exercise [5, 11-18], it is possible that not all
individuals should undertake such exercise. While high-intensity interval training is
currently accepted practice within the cardiovascular rehabilitation setting [11-15,
18], some individuals may not be suited to this type of exercise due to their
decreased exercise tolerance and diminished cardiovascular function [18].
Compared with low- or moderate-intensity exercise, high-intensity exercise results
in increased oxygen demand, an up regulation of sympathetic neural output,
increased cardiac output [20], and as a consequence greater strain on the central
cardiovascular system [21]. With such high demand placed on the heart during high-
intensity intervals, individuals with cardiac insufficiency may be at greater risk of

6
cardiac injury. For instance, a decrease in left ventricular function which persisted
30 minutes post session has been observed following a high-intensity interval
session (14x1-minute efforts with two minutes recovery) in non-endurance trained
individuals [17]. Such reductions in left ventricular function have been associated
with the presence of the cardiac damage marker brain natriuretic peptide (BNP)
[22]. Post-exercise elevations in BNP [23, 24] highlight the severe cardiac stress that
can result from such unaccustomed exercise.
Although high-intensity interval training offers a viable method of exercise
prescription with well documented benefits [5, 11-18, 22], the possibility to induce
cardiac damage [17, 22] highlights the need for alternative methods of exercise
delivery. The use of smaller muscle mass training (e.g. single-limb exercise) can
allow localised high-intensity muscle training but avoid cardiac limitations
associated with high blood flow demands when training using a large muscle mass
[20]. Despite single-legged cycling resulting in lower cardiac output and heart rate,
blood flow, muscle perfusion and oxygen extraction may be greater than normal
double-legged cycling [25, 26]. Such enhanced muscle blood flow, oxygen delivery
and oxygen extraction are believed to be responsible for the greater work capacity
and training adaptation observed during single-legged, compared with double-
legged cycling [27]. Indeed, Abbiss et al. [27] reported greater improvements in the
metabolic (i.e. GLUT4 protein and AS160 protein) and mitochondrial oxidative (i.e.
COX-II and IV) capacity of peripheral musculature following three weeks of single-
legged, compared with double-legged cycle training. In addition to the beneficial
peripheral adaptations associated with single-legged cycling [22, 25, 27], this
training modality is likely to have greater adherence than high-intensity double-

7
legged cycling as individuals typically report lower whole body perceived exertion
[26, 27], and experience similar quadriceps pain during single-legged, compared
with double-legged cycling [26, 27]. To date however, there have been no studies
that have investigated the effect of single-legged cycling on cardiovascular stress
and function.
1.2 PURPOSE STATEMENT
Chronic cardiopulmonary diseases severely affect an individual’s quality of
life and life expectancy and as a result these diseases have significant social,
economic and health impacts. High-intensity interval exercise has been shown to
improve cardiovascular function to a greater extent than moderate-intensity
continuous exercise and is increasingly being used in cardiac rehabilitation centres.
Nevertheless, high-intensity exercise with a large muscle mass places significant
stress on the cardiovascular system; thus, increasing the likelihood of an adverse
event. Evidence is emerging to suggest that small muscle mass high-intensity
interval exercise such as single-legged cycling can provide improvements to aerobic
fitness with the possibility of reduced cardiac stress. Therefore, the purpose of this
study was to examine the differences in cardiovascular stress imposed by double-
and single-legged high-intensity interval cycling in order to better understand the
physiological responses of such exercise and assist in future training prescription.
1.3 RESEARCH QUESTIONS
The research questions that will be addressed during this study are:
1. What are the differences in oxygen consumption, blood pressure and heart
rate during maximal self-paced single-legged and double-legged cycling
intervals?
8
2. Will double-legged maximal self-paced interval cycling reduce left
ventricular ejection fraction to a greater extent than single-legged cycling?
3. Will a difference in the cardiac damage marker, BNP, exist following maximal
self-paced single-legged and double-legged cycling intervals?
4. What are the differences in power output and total workload during
maximal self-paced single-legged and double-legged cycling intervals?
1.4 HYPOTHESES
1. During maximal self-paced intervals, oxygen consumption, blood pressure
and heart rate will be higher in double-legged cycling, compared with single-
legged cycling.
2. Following a bout of maximal self-paced intervals, left ventricular ejection
fraction will be decreased to a greater extent in double-legged, compared
with single-legged cycling.
3. The cardiac damage marker, BNP, will increase to a greater extent following
maximal self-paced double-legged, compared with single-legged cycling
intervals.
4. During maximal self-paced intervals, combined single-legged power and
workload will be greater than during double-legged cycling.
1.5 LIMITATIONS/DELIMITATIONS
The researcher acknowledges this research has limitations as follows:
1. All subjects were asked to give maximal effort during all intervals in all
testing sessions; however, this cannot be guaranteed.

9
2. Left ventricular ejection fraction was not measured directly, instead the area
calculated at end-systole and end-diastole during echocardiography was
used to indirectly measure left ventricular ejection fraction.
The researcher acknowledges the following delimitations:
1. The findings are only applicable to young (age range: 19-34), healthy adults.

10
CHAPTER TWO: CRITICAL REVIEW OF LITERATURE
2.1 OVERVIEW The incidence of cardiovascular disease is increasing within most developed
countries and has become a major health epidemic, with significant social and
economic impacts [2, 3, 5, 28]. Among other factors (e.g. diet, genetics, and
smoking), physical inactivity and a subsequent lack of cardiovascular fitness is a
major risk factor for cardiovascular disease. As such, it is suggested that the general
population and cardiovascular disease patients perform regular aerobic exercise
[10-14, 18, 29-31]. Traditionally, moderate-intensity continuous training (60 – 75%
aerobic capacity) is used to improve cardiovascular fitness [4, 8], however, with
'lack of time' being the most commonly cited barrier to exercise [11, 32-34]
alternative methods are being explored. High-intensity interval training is an
effective method of improving cardiovascular health, requiring a much shorter time
commitment, compared with traditional aerobic-based exercise programs [5, 10-16,
30, 31, 35-37]. As such, high-intensity interval training provides an alternative
method of inducing favourable training adaptations.
Although the benefits of high-intensity training can be similar or superior to
moderate- or low-intensity prolonged exercise [5, 11-18], it is possible that such
exercise may place certain individuals at risk. Indeed, while high-intensity interval
training is gaining acceptance within the cardiovascular rehabilitation setting [11-
15, 18], a decreased exercise tolerance and diminished cardiovascular function may
indicate some of these patients may not be suited to this type of exercise [18]. The
possibility of high-intensity interval training to induce cardiac damage [17, 22]
highlights the need for alternative methods of high-intensity interval delivery.

11
Indeed, while the benefits of high-intensity interval training may outweigh the risks
[11-15, 18], it is possible that alternate strategies of exercise delivery may provide
safer methods to improve physical function. The use of smaller muscle mass
training (e.g. single-limb exercise) can localise high-intensity muscle training but
avoid cardiac stress imposed by central limitations (e.g. cardiac output) and high
blood flow demands [20]. Indeed, it has been suggested that despite lower cardiac
output and heart rate, blood flow, muscle perfusion and oxygen extraction are
higher in active tissue during single-legged cycling, compared with double-legged
cycling [25, 26]. Such improvements in tissue oxygen delivery and utilisation are
believed to be responsible for the greater work capacity and training adaptation
observed during single-legged, compared with double-legged cycling [27].
Despite the increasing use of high-intensity interval training in clinical
settings and the possible benefits of reduced muscle mass aerobic interval training,
little is known on the cardiovascular stress induced by these exercise modalities.
Reduced muscle mass aerobic exercise delivery (i.e. single-legged cycling) may allow
for the significant peripheral adaptations induced by high-intensity interval training,
without causing excessive stress to the cardiovascular system. The purpose of this
literature review will be to examine areas of aerobic exercise delivery, highlighting
moderate-intensity continuous training, high-intensity interval training and small
muscle mass training (i.e. single-legged cycling) and to propose the best possible
method of exercise delivery especially with regards to cardiovascular rehabilitation.
2.2 CARDIOVASCULAR DISEASE AND PHYSICAL ACTIVITY Cardiovascular disease, presents a burden on society [2, 3, 7, 28] accounting
for 30% of deaths worldwide [1]. In Australia, cardiovascular disease affects 18% of
12
the population and accounts for 25% of the health care costs associated with a
sedentary lifestyle [2, 3]. Although a genetic component exists for the risk of
developing cardiovascular disease [8], several other risk factors have been
identified, and include; low cardiorespiratory fitness (i.e. VO2max) [4, 5, 7], elevated
body mass index [7], high blood pressure [8], elevated low-density lipoprotein [5, 8,
28] and high-sensitivity C-reactive protein levels [7, 28], as well as decreased high-
density lipoprotein concentrations [5, 7, 8, 28]. The majority of these risk factors are
directly influenced by diet and exercise [5, 7, 28]. Indeed, an improvement in
cardiorespiratory fitness (i.e. VO2max) is associated with beneficial changes in the
majority of established risk factors (e.g. lipids, blood glucose, obesity) [7, 8] and
thus commonly used to determine the health benefits from exercise intervention [5,
7, 10, 12]. For instance, O'Donovan et al. [5], observed a significant increase in
VO2max and beneficial decreases in body fat, total cholesterol, low-density
lipoprotein cholesterol and non-high-density lipoprotein cholesterol in 42 previously
sedentary men, following 24 weeks of aerobic cycle training (3x400-kcal per week at
60-80% VO2max).
Maximal aerobic capacity is positively influenced by exercise training,
regardless of age, sex, race or initial cardiovascular fitness levels [5-8, 15, 31, 38].
Indeed, Wilmore et al. [8] observed increases in VO2max and associated beneficial
changes in lipid and lipoprotein profile and body composition following 20 weeks of
exercise training in 502 healthy previously sedentary men and women of varying
age (17 to 65 years) and race [8]. In addition to reducing the risk of cardiovascular
disease, exercise training may also benefit individuals already diagnosed with
cardiovascular disease. For instance, a 46% increase in VO2max, a 40% reduction in

13
pro-brain natriuretic peptide (prohormone linked to cardiac damage) levels, reverse
left ventricular remodelling, as well as improvements in endothelial function have
been observed in 27 elderly (75±11 years) post-infarction heart failure patients
following 12 weeks of high-intensity interval training (4x4 minutes walking at 90-
95% HRpeak, interspersed with 3 minutes active rest) [17]. While improving
cardiovascular fitness through exercise can drastically reduce the risk of
cardiovascular disease, conjecture exists as to the most appropriate exercise
regimes to increase VO2max and thus overall cardiovascular disease risk [5, 9, 10, 12,
35].
2.3 MODERATE-INTENSITY CONTINUOUS EXERCISE
2.3.1 American College of Sports Medicine exercise guidelines
The American College of Sports Medicine recommends the general
population perform a minimum of 30 minutes of moderate-intensity exercise on
most, but preferably all, days of the week. These recommendations have shown to
be effective at improving aerobic capacity and cardiorespiratory fitness with
relatively low sensations of fatigue and exertion [9, 10]. Regardless, the time
required to complete such exercise is substantial and therefore can be difficult,
especially for those not accustomed to regular physical activity. Indeed, many
individuals fail to adhere to these guidelines with the primary reason being 'lack of
time' [11, 32-34].
2.3.3 Physiological adaptations to moderate-intensity exercise
The improved health and fitness associated with moderate-intensity
continuous exercise is the result of both central (i.e. cardiac function and
hemodynamic responses) [30, 39] and peripheral (i.e. skeletal muscle adaptations)

14
[8, 38] adaptations (as seen in Table 1) [30, 39]. For example, in female rats, Kemi et
al. [30] observed a 28% improvement in VO2max, cardiomyocyte function and
capacity (as shown by improvements in fractional shortening: +23%, and Ca2+
sensitivity: +30%) as well as endothelial function following 10 weeks of moderate-
intensity running. Furthermore, in humans the use of moderate-intensity training
has resulted in similar central improvements [10, 39] as well as observed increases
in septal wall thickness (+7.4%) and left ventricular mass (+14%) in [39].

15
Table 1. Literature examining cardio-respiratory adaptations resulting from moderate- and high-intensity training in non-elite, healthy and unhealthy individuals.
Reference N Age (y)
Mode Frequency Weeks Duration Intensity Results
Freyssin et al. [12]
26M&F chronic
heart failure pts
54±12 Cycling C: 6d/wk I: 3d/wk
8 C: 61min I: 71min
C: HR at VT1 I: 50% then 80% max PO
(12x 30sec, with 60sec PR)
C: ↑time at VT1, distance in 6MWT
I: ↑VO2peak, exercise test duration, oxygen pulse, VO2 at VT1, distance in 6MWT
Hottenrott et al. [35]
34M&F recreational endurance
runners
43±7 Running C: 2d/wk I: 4d/wk
12 C: 2.5h total
I: 30min each
C: 75-85% VLT I: all out (10x30sec, with 90sec running at 85% VLT
C: ↑VO2peak, ↑VLT, ↓visceral fat
I: ↑VO2peak, ↑VLT, ↓visceral fat
Kemi et al. [30]
24F Sprague-
Dawley rats
80-90days
Running 5d/wk 10 1h/day
M: 5x8min at 65-70% VO2max, with 2min at 50-
60% VO2max H: 5x8min at 85-90%
VO2max, with 2min at 50-60% VO2max
↑VO2max, cardiomyocyte hypertrophy and function,
Ca2+ sensitivity, carotid artery endothelial function
King et al. [19]
149M& 120F
sedentary 56±4
Walking- jogging
M: 5d/wk H: 3d/wk
104 M: 30min H: 40min
M: 60-73% peak treadmill HR
H: 73-88% peak treadmill HR
M: ↑HDL-C, ↓WHR ratio H: ↑VO2max, test duration
O'Donovan et al. [5]
42M previously sedentary
healthy
41±4 Cycling 3d/wk 24 400kcal M: 60% VO2max H: 80% VO2max
M: ↑VO2max, ↓body fat H: as above + ↓waist girth,
total cholesterol, LDL-C, non-HDL-C

16
Reference N Age (y)
Mode Frequency Weeks Duration Intensity Results
Rodrigues et al. [39]
23M previously sedentary
31±3.5 Running 3d/wk 26 60min HR associated with VT1 to 10% below HR associated
with VT2
↑VO2peak, septal wall thickness, LV mass and mass
index, ↓HR
Skinner et al. [38]
633M&F sedentary
healthy 17-65 Cycling 3d/wk 20
30min/session, increased to
50min/session
55% VO2max increased to 75% VO2max
↑VO2max, fat-free mass
Wilmore et al. [8]
250M& 252F
sedentary healthy
17-65 Cycling 3d/wk 20 30min/session,
increased to 50min/session
55% VO2max increased to 75% VO2max
↑VO2max, ↓HR response at 50W, fat-free mass, ↑HDL-C
Wisloff et al. [10]
20M& 7F stable
post-infarction
heart failure patients
75±11 Walking 3d/wk 12 C: 47min I: 38min
C: 70-75% peak HR I: 4x4min at 90-95% peak HR, 3min at 50-70% peak
HR
C: ↑VO2peak (14%), ↑relative anaerobic
threshold, ↑quality of life I: ↑VO2peak (46%), ↑PGC-1α, ↑SERCA, reverse LV remodelling, ↓proBNP, ↑endothelial function,
↑quality of life (C = moderate-intensity training; I= high-intensity training; M= male; F= female; 6MWT= 6 minute walk test; VT1= first ventilatory threshold; VLT= velocity at lactate
threshold; HDL-C= high-density lipoprotein cholesterol; WHR= waist to hip ratio; LDL-C= low-density lipoprotein cholesterol; LV= left ventricular; PGC-1α= peroxisome
proliferative activated receptor- coactivator-1α; SERCA= sarcoplasmic reticulum Ca2+
ATPase; proBNP= pro-brain natriuretic peptide)

17
In addition to the previously mentioned central adaptations, peripheral adaptations
including increased mitochondrial content [36, 40], capillary density [36, 40] and
muscle respiratory capacity [36, 41] are common with moderate-intensity training
(Table 1) [36]. Furthermore, inclusion of training below the first ventilatory
threshold can contribute to a significantly greater skeletal muscle energy profile
including increased calcium-calmodulin kinase leading to increases in peroxisome
proliferator-activated receptor gamma coactivator-1-alpha (PGC-1α) which is a
regulator of mitochondrial biogenesis [36]. These adaptations increase the ability to
perform higher muscular power outputs for longer periods as well as improve
recovery from high-intensity exercise [36].
2.3.4. Changes in cardiovascular disease risk factors associated with moderate-intensity exercise
Improvements in blood pressure [8] and lipoprotein profile [5, 8, 19] have
been observed following moderate-intensity continuous training. Indeed, Wilmore
et al. [8] observed significant improvements in lipid and lipoprotein profile after 26
weeks of moderate-intensity training in previously sedentary participants.
Furthermore, in this study significant relationships between improvements in
aerobic function (i.e. VO2max and power output at 60% VO2max) and changes in
percent body fat (-3.4%), fat mass (-3.4%) and fat-free mass (+0.9%) were observed
[8]. In a similar cohort (sedentary individuals age: 56±4 years), greater increases in
high-density lipoprotein levels were observed following two years of moderate-
intensity training (five days a week; walking at 60-73% peak heart rate for 30
minutes per session), indicating frequent moderate-intensity exercise training for
longer periods of time may be required to induce changes in lipoprotein profile [19].

18
2.4 HIGH-INTENSITY INTERVAL TRAINING
2.4.1 Immerging use of high-intensity interval training
The use of high-intensity interval training to enhance fitness and
performance is common in athletic populations [35-37]. More recently, the use of
high-intensity interval training has increased in non-athletic/diseased populations
[11-15, 18] with evidence indicating high-intensity interval training is as effective
and a more time-efficient method of improving general health and well-being when
compared to moderate-intensity continuous training [5, 10-16, 30, 31, 35-37] (Table
2). High-intensity interval training is associated with greater cardiac benefits [5, 10-
12, 14, 19, 29, 31, 42], as well as greater improvements in VO2peak/max [5, 10, 12, 14,
15, 19, 29-31, 37], exercise performance [11, 35-37] and skeletal muscle metabolic
profile [10, 11, 15, 29, 35-37, 43, 44] (Table 2). The advantage of high-intensity
interval training over traditional moderate-intensity exercise is that the short
recovery periods allow participants to maximise the time spent at or near VO2max
[37, 43]. Furthermore, compared with continuous moderate-intensity exercise,
high-intensity exercise is more motivating for participants [10] resulting in a higher
rate of adherence [19]. Regardless, due to the relatively novel use of high-intensity
interval training in a non-athletic population there is a need for increased research
in this area.
2.4.2 Changes in VO2max associated with high-intensity exercise
A plethora of research indicates that high-intensity interval training may
result in greater improvements in VO2max, compared with moderate-intensity
continuous training [5, 9, 10, 12, 30, 35]. In sedentary individuals, vigorous exercise
(>80% maximal aerobic power or >90% VO2max) can dramatically increase

19
cardiorespiratory fitness (VO2max) [12, 15], which is associated with a decrease risk
of cardiovascular disease [5, 6, 8]. For instance, Hottenrott et al. [35] compared
high-intensity interval training to moderate-intensity continuous training and
observed greater improvements in VO2peak (high-intensity +6.8±2.0 mL.min-1.kg-1;
moderate-intensity +2.7±1.0 mL.min-1.kg-1) with high-intensity interval training [35].
While improvements have been observed in healthy individuals, high-intensity
interval training has also proven safe and effective in cardiovascular disease
patients with greater improvements in VO2peak (+27% versus +2%), %VO2max at the
first ventilatory threshold (+22% versus +2%) and exercise capacity at the first
ventilatory threshold (+111% versus +45%) observed after high-intensity interval
training, compared with moderate-intensity training [12].
2.4.3 Physiological adaptations to high-intensity interval training
Similar to moderate-intensity exercise, high-intensity interval training is
associated with significant central and peripheral adaptations [9, 10, 30, 43-45].
High-intensity interval training has been shown to improve cardiac function as
highlighted by improving cardiomyocyte size and function [30] as well as reversing
left ventricular remodelling [10]. Indeed, when compared with moderate-intensity
training, high-intensity interval training in rats resulted in greater cardiomyocyte
hypertrophy (+14% versus +5%), improved fractional shortening time (+45% versus
+23%) and Ca2+ sensitivity (+40% versus +30%) [30]. In addition, central adaptations
have also been observed in humans. For instance, in 27 stable post-infarction
patients (age 75±11 years), reverse left ventricular remodelling was observed
following 12 weeks of high-intensity interval training an improvement which was
not observed following moderate-intensity continuous training [10]. Furthermore,

20
in previously sedentary individuals high-intensity interval training is associated with
increased stroke volume (+15.4%), ejection fraction (+7.9%), left ventricular mass
(+8.4%) and left ventricular end-diastolic volume (+7.6%) [46].

21
Table 2. Literature examining cardio-respiratory adaptations resulting from high-intensity interval training in non-elite, healthy and unhealthy individuals.
Reference n Age (y) Mode Frequency Weeks Duration Intensity Results
Burgomaster et al. [9]
20M&F active
untrained 23±1 Cycling
I: 3d/wk C: 5d/wk
6 I: 20-30min
C: 40-60min
I: 'all out' (4-6x30sec, with 4.5min rest-
50rpm, 30W) C: 65% VO2peak
↑VO2peak, PPO, mean PO, PGC-1α, CS, β-HAD, PDH, muscle
glycogen, muscle PCR; ↓RER. No group differences
Cox et al. [46] 9M & 7F
previously sedentary
25±2 Cycling
and running
6d/wk 7
Cycling: 40min
Running: 50min
Alternated cycling (40min at 85-90%
VO2peak) and running (5x5min running at 100% VO2max, 5min
jogging), progressing weekly (~11W/wk and
~27m/wk)
↑septal wall thickness, stroke volume, ejection fraction, left
ventricular mass, left ventricular end-diastolic volume, VO2max, ↓
heart rate
Freyssin et al. [12]
26M&F chronic heart
failure patients
54±12 Cycling I: 3d/wk C: 6d/wk
8 I: 71min C: 61min
I: 50-80% max PO (12x 30sec, with 60sec PR)
C: HR at VT1
I: ↑VO2peak, exercise test duration, O2 consumption at
VT1, O2 pulse, 6MWT distance C: time at VT1, 6MWT distance
Gibala et al. [43]
16M active 21±1 Cycling 3d/wk 2 I: 20-30min
C: 90-120min
I: 4-6x30sec 'all out', with 4min rest C: 65% VO2peak
↑COX II and IV, muscle buffering capacity, glycogen
content and exercise performance
Hottenrott et al. [35]
34M&F recreational endurance
runners
43±7 Running I: 4d/wk C: 2d/wk
12
I: 30min each
C: 2.5h total
I: all out (10x30sec, with 90sec running at
85% VLT
C: 75-85% VLT
I: ↑VO2peak, ↑VLT, ↓visceral fat C: ↑VO2peak, ↑VLT, ↓visceral fat

22
Reference n Age (y) Mode Frequency Weeks Duration Intensity Results
Kemi et al. [30]
24F Sprague-Dawley rats
80-90days
Running 5d/wk 10 60min
H: 5x8min at 85-90% VO2max, with 2min at
50-60% VO2max
M: 5x8min at 65-70% VO2max, with 2min at
50-60% VO2max
↑VO2max, cardiomyocyte hypertrophy and function, Ca2+
sensitivity, carotid artery endothelial function (greater
improvements with high intensity)
Mandroukas et al. [16]
15M physical education students
22±3 Running
AR: 32min PR: 32min
CR: til exhaustion
AR: 4x4min 12kph, 4min 8kph
PR: 4x4min 12kph, 4min complete rest
CR: 12kph til exhaustion
HR and VO2 higher in CR during bouts 2-4. BLa higher during PR
than AR. BLa during passive recovery time was higher
following CR than PR or AR.
Moholdt et al. [45]
74M & 15F post-
myocardial infarction patients
57±10 Treadmill 2d/wk 12 I: 38min C: 60min
I: 4x4min 85-95% HRmax, with 3min at
70% HRmax C: aerobic exercise to music, encouraged to
exert themselves
I: ↑VO2peak, haemoglobin, HDL-C, endothelial function, QoL,
adiponectin; ↓ferritin, resting HR
C: endothelial function, QoL, adiponectin; ↓ferritin, resting
HR
O'Donovan et al. [5]
42M previously sedentary
healthy
41±4 Cycling 3d/wk 24 400kcal H: 80% VO2max M: 60% VO2max
H: ↑VO2max, ↓body fat, ↓waist girth, total cholesterol, LDL-C,
non-HDL-C M: ↑VO2max, ↓body fat
Perry et al. [44]
5M & 3F untrained,
recreationally active
24±1 Cycling 3d/wk 6 60min 10x4min 90% VO2peak,
with 2min rest
↑VO2peak, max activities of mitochondrial enzymes, content
of transport proteins for fatty acids, glucose and lactate,
muscle glycogen

23
Reference n Age (y) Mode Frequency Weeks Duration Intensity Results
Trilk et al. [47]
28F sedentary
overweight/ obese
31±6 Cycling 3d/wk 4 ~20-35min
4-7x30s sprints (5% body mass as
resistance), 4min active recovery
↑VO2max, stroke volume, ↓ heart rate
Wisloff et al. [10]
20M& 7F stable
post-infarction
heart failure patients
75±11 Walking 3d/wk 12 I: 38min C: 47min
I: 4x4min at 90-95% peak HR, 3min at 50-
70% peak HR C: 70-75% peak HR
I: ↑VO2peak (46%), ↑PGC-1α, ↑SERCA, reverse LV
remodelling, ↓proBNP, ↑endothelial function,
↑quality of life C: ↑VO2peak (14%), ↑relative
anaerobic threshold, ↑quality of life
(I: high-intensity interval training; C= moderate-intensity continuous training; M= male; F= female; PPO= peak power output; PGC-1α= peroxisome proliferative activated
receptor- coactivator-1α; SERCA= sarcoplasmic reticulum Ca2+
ATPase; proBNP= pro-brain natriuretic peptide; CS= citrate synthase; β-HAD= 3-hydroxyacyl CoA dehydrogenase; PDH= pyruvate dehydrogenase; PCR= phosphocreatinine; RER= respiratory exchange ratio; O2= oxygen; 6MWT= 6 minute walk test; COX= cytochrome c oxidase; VLT=
velocity at lactate threshold; LV= left ventricular; BLa= blood lactate; HDL-C= high-density lipoprotein cholesterol; QoL= quality of life; LDL-C= low-density lipoprotein cholesterol)

24
Greater increases in adaptations of various peripheral metabolic indices (e.g.
muscle buffering capacity, mitochondrial capacity and muscle glycogen content)
have been observed following high-intensity interval training, when compared with
moderate-intensity continuous training [9, 43, 44]. For instance increased maximal
activity of mitochondrial enzymes (+18-29%), increased content of transport
proteins for glucose, fatty acids and lactate (+14-30%) as well as increased muscle
glycogen (+59%) have all been observed after high-intensity interval training in
healthy adults [44]. Similarly, Gibala et al. [43] observed improvements in markers
associated with mitochondrial biogenesis (i.e. COX II and IV protein content), muscle
buffering capacity and glycogen content following 2 weeks of high-intensity interval
training compared with moderate-intensity continuous training. Importantly, the
participants of the high-intensity group had a training volume ~90% less than the
moderate-intensity group, demonstrating that high-intensity interval training is a
time-efficient strategy to rapidly improve skeletal muscle metabolic profile while
having comparable effects with moderate-intensity continuous training [43]. It is
proposed that the superior adaptations associated with high-intensity interval
training are due to the increased stimulus to PGC-1α activation, which leads to an
up regulation in mitochondrial biogenesis [11].
2.4.4 Influence of interval training on cardiovascular risk factors
2.4.4.1 Body fat
Body fat (in particular, visceral fat) is an independent risk factor for
cardiovascular disease [8, 35] which can be modified through high-intensity interval
training [5, 8, 35]. Indeed, reductions in percent body fat and waist girth have been
observed after high-intensity interval training [5]. Additionally, Hottenrott et al. [35]
25
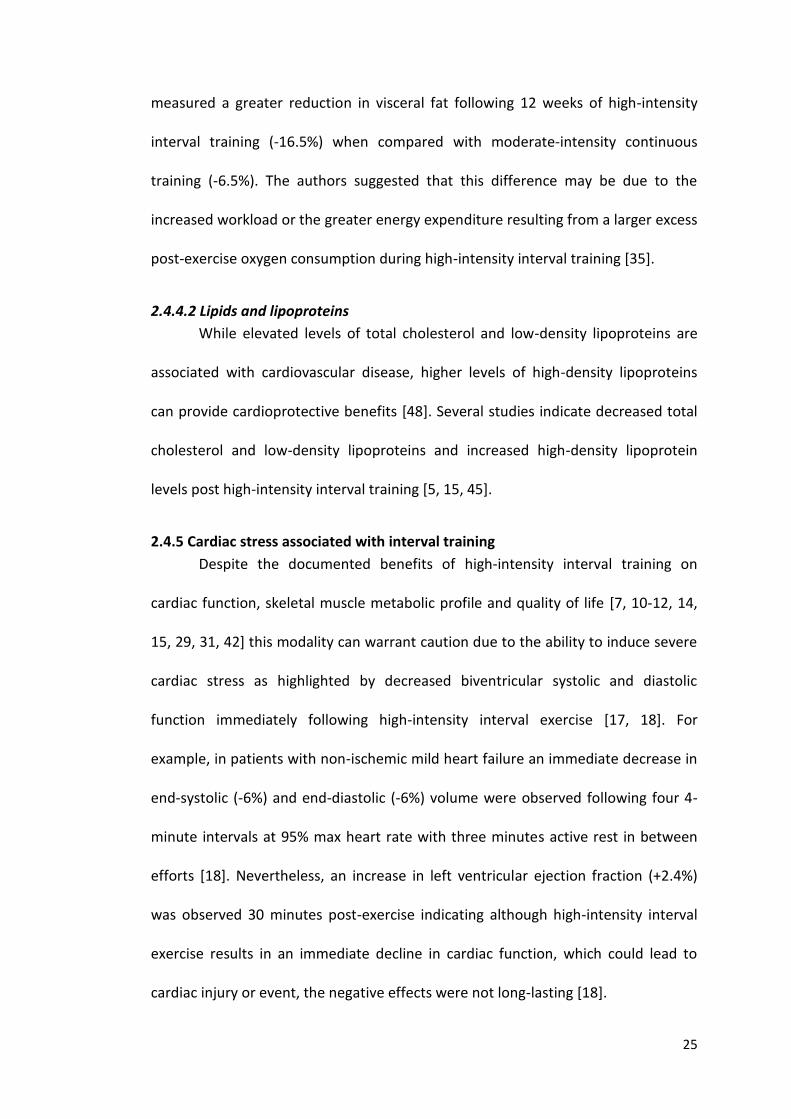
measured a greater reduction in visceral fat following 12 weeks of high-intensity
interval training (-16.5%) when compared with moderate-intensity continuous
training (-6.5%). The authors suggested that this difference may be due to the
increased workload or the greater energy expenditure resulting from a larger excess
post-exercise oxygen consumption during high-intensity interval training [35].
2.4.4.2 Lipids and lipoproteins
While elevated levels of total cholesterol and low-density lipoproteins are
associated with cardiovascular disease, higher levels of high-density lipoproteins
can provide cardioprotective benefits [48]. Several studies indicate decreased total
cholesterol and low-density lipoproteins and increased high-density lipoprotein
levels post high-intensity interval training [5, 15, 45].
2.4.5 Cardiac stress associated with interval training
Despite the documented benefits of high-intensity interval training on
cardiac function, skeletal muscle metabolic profile and quality of life [7, 10-12, 14,
15, 29, 31, 42] this modality can warrant caution due to the ability to induce severe
cardiac stress as highlighted by decreased biventricular systolic and diastolic
function immediately following high-intensity interval exercise [17, 18]. For
example, in patients with non-ischemic mild heart failure an immediate decrease in
end-systolic (-6%) and end-diastolic (-6%) volume were observed following four 4-
minute intervals at 95% max heart rate with three minutes active rest in between
efforts [18]. Nevertheless, an increase in left ventricular ejection fraction (+2.4%)
was observed 30 minutes post-exercise indicating although high-intensity interval
exercise results in an immediate decline in cardiac function, which could lead to
cardiac injury or event, the negative effects were not long-lasting [18].

26
Brain natriuretic peptide (BNP) is a hormone released predominantly from
the ventricles following damage or dysfunction and is increased in individuals who
present with myocardial ischemia, whether it be exercise or disease-induced [23,
24]. In a study conducted by van der Zee et al. [23], NT-proBNP (BNP prohormone)
was shown to increase (113-118%) following symptom-limiting exercise in patients
referred for evaluation of presence or absence of inducible myocardial ischemia.
Interesting to note, BNP levels increased following intense exercise in both healthy
[23, 49] and unhealthy [24] individuals suggesting that ventricular wall stress,
particularly that caused by intense exercise, was likely responsible for increased
levels of BNP observed by van der Zee et al. [23]. Consequently, the cardiac damage
associated with high-intensity interval training should be acknowledged and of
concern especially in individuals with cardiovascular disease or those with multiple
risk factors.
2.5 SINGLE-LEGGED CYCLE TRAINING
Although high intensity interval training offers a viable method of exercise
prescription with well documented benefits [5, 11-18, 22], the possibility to induce
cardiac damage [17, 22] highlights the need for alternative methods of this type of
exercise delivery. The use of smaller muscle mass training (e.g. single limb exercise)
can allow localised high-intensity muscle training but avoid cardiac limitations
associated with high blood flow demands when training using a large muscle mass
(Table 3) [20]. During normal bilateral cycling, oxygen delivery to the active muscle
may be a limiting factor in the amount of work achievable [20, 25, 26, 50, 51] as
documented by Knight et al. [50], who observed an increase in leg VO2max and
maximal oxygen delivery following incremental exercise in hyperoxic conditions

27
suggesting that leg VO2max is limited by oxygen delivery during normoxic conditions.
Single-legged cycling can offset this limitation by removing the blood flow demands
of bilateral cycling and thus lowering the cardiac stress (e.g. high heart rates)
associated with traditional high-intensity interval training [26, 51]. By removing the
cardiac demands of a second limb it is possible that blood flow, muscle perfusion
and muscle oxygen extraction will be improved in the exercising limb [20, 25, 26, 51,
52]. Such improvements are believed to be responsible for the greater work
capacity and training adaptations observed during single-legged cycling [20, 25, 27,
51, 52].
2.5.1. Changes in VO2max associated with single-legged cycling Previous research has examined the influence of single-legged cycling on
VO2max with several reporting this modality can improve aerobic capacity [20, 27,
51, 53] likely through peripheral focused adoptions [20, 25, 27]. For instance, seven
week of single-legged high-intensity interval training has been shown to improve
VO2max by approximately 5% [53]. Furthermore, when compared to traditional
double-legged interval training, single-legged high-intensity interval training has
been documented to provide similar improvements (+0.5±6.6% and -1.2±10.2%;
respectively) to VO2max. The changes have been suggested to be due to
improvements in oxidative capacity and blood flow associated with single-legged
training [20, 27]. Such findings suggest that single-legged cycling may be as effective
at improving VO2max as double-legged cycling.
2.5.2 Physiological adaptations to single-legged cycling Several studies have examined the peripheral benefits of single-legged
cycling [20, 25, 50, 51], with improvement in mitochondrial oxidative capacity and

28
oxygen utilisation (as shown by increases in maximal citrate synthase activity) [25].
To date; however, no studies to the authors’ knowledge have examined the
influence of single-legged cycle training on central adaptations know to improve
fitness and functional capacity.
2.5.3. Perceptual responses
Single-legged cycling [20, 27, 51, 52] as a training modality is likely to have
greater adherence than high-intensity double-legged cycling as individuals typically
report lower whole body perceived exertion [26, 27], while experiencing similar
quadriceps pain during single-legged, compared with double-legged cycling [26, 27].
Indeed, Abbiss et al. [27] observed lower ratings of perceived exertion following six
single-legged maximal self-paced 4-minute intervals, with 6 minutes active recovery
(50W), when compared with three double-legged maximal self-paced 4-minute
intervals, with 6 minutes active recovery (100W). The authors also noted similar
ratings of perceived pain and effort between interventions [27].

29
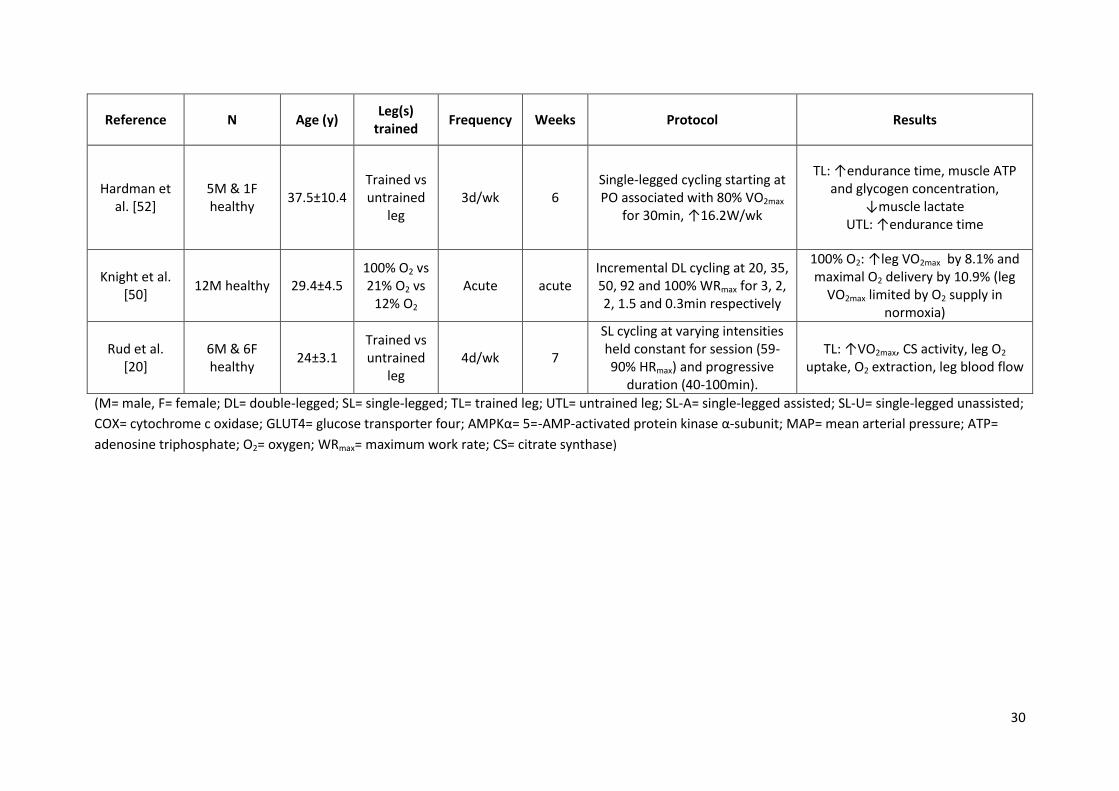
Table 3. Literature examining cardio-respiratory adaptations resulting from single-legged training in non-elite, healthy and unhealthy individuals.
Reference N Age (y) Leg(s)
trained Frequency Weeks Protocol Results
Abbiss et al. [27]
9 trained cyclists
34±5 Single vs
double leg 2d/wk 3
S: 6x4min 'all out', 6min AR D: 3x4min 'all out', 6min AR
S: ↑COX II & IV, GLUT4 protein, AMPKα, VO2max (DL), time trial
performance D: ↑AMPKα, VO2max (DL), time trial
performance
Barker et al. [26]
11M recreationally
trained cyclists
SL-assisted vs SL-
unassisted vs DL
Acute Acute
S: start 50W ↑25W/5min til exhaustion
D: start 100W ↑50W/5min til exhaustion
SL-A: highest peak power SL-U: higher submax blood lactate,
RPE, quad pain DL: lowest submax VO2, higher peak
and submax HR Mean MAP similar between
conditions
Bell et al. [25] 5M healthy 77±7 Trained vs untrained
leg 4d/wk 9
Single-legged knee extension exercise for 40min at 75-85%
VO2peak
Accelerated VO2 kinetics, ↑maximal CS activity in trained leg
Bell et al. [53] 8M & 1F
active 26±3
Trained vs untrained
leg 4d/wk 7
15-20x20sec 150% PO associated with single-leg
VO2max, 60sec rest
↑VO2max (SL and DL), no significant differences between legs
Gleser et al. [51]
6M healthy 21±1 Trained vs untrained
leg 2d/wk 4
Single-legged cycling (standing with partner on other pedal) at
75% VO2max til exhaustion
↑VO2max and cardiac output, ↓vascular resistance
30
Reference N Age (y) Leg(s)
trained Frequency Weeks Protocol Results
Hardman et al. [52]
5M & 1F healthy
37.5±10.4 Trained vs untrained
leg 3d/wk 6
Single-legged cycling starting at PO associated with 80% VO2max
for 30min, ↑16.2W/wk
TL: ↑endurance time, muscle ATP and glycogen concentration,
↓muscle lactate UTL: ↑endurance time
Knight et al. [50]
12M healthy 29.4±4.5 100% O2 vs 21% O2 vs
12% O2 Acute acute
Incremental DL cycling at 20, 35, 50, 92 and 100% WRmax for 3, 2, 2, 1.5 and 0.3min respectively
100% O2: ↑leg VO2max by 8.1% and maximal O2 delivery by 10.9% (leg
VO2max limited by O2 supply in normoxia)
Rud et al. [20]
6M & 6F healthy
24±3.1 Trained vs untrained
leg 4d/wk 7
SL cycling at varying intensities held constant for session (59-90% HRmax) and progressive
duration (40-100min).
TL: ↑VO2max, CS activity, leg O2 uptake, O2 extraction, leg blood flow
(M= male, F= female; DL= double-legged; SL= single-legged; TL= trained leg; UTL= untrained leg; SL-A= single-legged assisted; SL-U= single-legged unassisted;
COX= cytochrome c oxidase; GLUT4= glucose transporter four; AMPKα= 5=-AMP-activated protein kinase α-subunit; MAP= mean arterial pressure; ATP=
adenosine triphosphate; O2= oxygen; WRmax= maximum work rate; CS= citrate synthase)

31
2.6 SUMMARY
While high-intensity interval training is currently gaining acceptance in
cardiovascular rehabilitation settings, the high demands placed on the heart
indicate the need to provide alternative methods of high-intensity exercise delivery.
The use of single-legged cycling can induce greater peripheral adaptations while
avoiding large demands on the cardiovascular system. Regardless, no studies to
date have examined the central demands and cardiac stress induced by single-
legged cycling. For this reason, greater research in this area is warranted with
results likely providing necessary information for the use of this modality in clinical
settings.
32
CHAPTER THREE: METHODS
3.1 STUDY DESIGN
A randomised/counterbalanced cross-over design was used for the study
with subjects acting as their own controls. Participants were required to attend the
Murdoch University laboratory on four separate occasions with no less than five
and no greater than 10 days between testing sessions. The study consisted of a
maximal exercise test, a familiarisation session and two experimental sessions.
Participants were asked to maintain a similar diet (food and fluid) and avoid
strenuous physical activity the day before and the day of testing. All testing was
completed at a similar time of day to control for circadian rhythm.
3.2 SAMPLING METHODOLOGY
Nine males (age: 24 ± 5 years; height: 181 ± 5 cm; mass: 76 ± 11 kg; VO2max:
52.6 ± 8.5 mL.kg-1.min-1) and one female (age: 19 years; height: 167 cm; mass: 55
kg; VO2max: 38.8 mL.kg-1.min-1) volunteered for participation in this study. The
sample size was selected based on a power analysis using unpublished heart rate
data (Turner; Master’s Thesis University of Birmingham; 2010) collected during
double- (146 ± 6 bpm) and single-legged (120 ± 16 bpm) cycling intervals (α=0.05;
power=0.80). All participants were be between 18 and 50 years of age and regarded
as of low risk for exercise based on the Exercise & Sports Science Australia risk
stratification questionnaire. All risks and benefits associated with inclusion in this
study were provided to the participants in writing and informed consent was
obtained prior to data collection. Ethical clearance was obtained from the Murdoch
University Human Ethics Department prior to the start of this study.

33
3.3 PROCEDURES
During the initial testing session, participants were asked to complete a
graded exercise test using a Velotron cycle ergometer (RacerMate; USA). The test
started at a resistance of 70 W with 25 W∙minute-1 increase for males, while
females started at a resistance of 50 W with 20 W∙minute-1 increase in resistance
until the participant reached volitional fatigue. Maximal oxygen consumption was
measured using a Parvo TrueOne metabolic cart (ParvoMedics, USA). Prior to the
test, the metabolic cart was calibrated using gases of know concentration (4.0%
CO2 and 16.0% O2) and through a range of flow rates using a Hans Rudolph 3L
syringe. Data collected from the graded exercise test was used for descriptive
purposes (i.e. fitness level) and to calculate a power output (50% aerobic threshold)
used during active recovery portions of the remaining sessions.
The second testing session was used as a familiarisation session. During this
session, participants were required to complete six 1-minute cycling intervals. Prior
to the interval session, participants completed a standardised 15-minute warm up
cycling at 30% and 40% (5 min at 30% and 10 min at 40%) of the maximal power
output measured during the graded exercise test. Participants were then instructed
to cycle at their predetermined recovery power output for five minutes after which
they performed two 1-minute efforts at their highest sustainable power output
using normal double-legged bilateral cycling. Immediately after completing each
effort, participants cycled for 1 minute at their individualised recovery intensity.
Following these initial two intervals, four additional efforts were conducted in a
single-legged manner. During single-legged cycling participants cycled with only one
leg. A specially designed counterweight was used to compensate for the missing

34
limb and allow a fluid cycling motion. Participants were instructed to completed
two 1-minute maximal efforts with 1 minute active recovery between efforts after
which participants cycled for five minutes at half the recovery power output used
during the double-legged efforts. The cycle ergometer was then adjusted to allow
the participant to complete the same procedure with the opposite leg.
The remaining two experimental sessions were conducted in a randomised
and counterbalanced order. During experimental sessions participants completed
either six maximal 1-minute double-legged efforts with 1 minute recovery (88 ± 16
W) between efforts, or twelve (six with each leg) maximal 1-minute single-legged
efforts with 1 minute recovery (44± 8 W) between each effort. Prior to exercise,
participants were required to rest in a supine position for 10 minutes during which
heart rate was collected beat-to-beat using a personal heart rate monitor (Polar
810i; Finland). Ultrasound measures of the left ventricle were collected during
systole and diastole and a venous blood sample was obtained. Additionally, resting
expired ventilation was measured via metabolic cart and measures of blood
pressure and oxygen saturation (Prince-100B Fingertip Oximeter, Heal Force Bio-
Meditech Holdings Limited; China) were obtained. Irrespective of interval type (i.e.
double or single-legged) participants completed a 15-minute standardised (five
minutes at 30% of the first ventilatory threshold, ten minutes at 40% of the first
ventilatory threshold) double-legged warm-up. In the double-legged conditions,
participants then cycled for an additional five minutes at 50% of the first ventilatory
threshold measured during the maximal exercise test. This was immediately
followed by the interval session.

35
Following the standardised warm-up during the single legged-condition,
participants cycled for five minutes at 25% of the first ventilatory threshold, after
which the interval session was started. Upon completion of the first set of single-
legged intervals, the counterweight was transferred to the other pedal (~5 minutes)
to allow the participant to complete the single-legged session (i.e. five minute lead
in and six interval efforts) with the opposite leg. During this study the starting leg
for the single-legged session was randomised and counterbalanced.
During each interval session, expired ventilation was continuously
measured, and heart rate was recorded at a frequency of 1Hz. Power output was
recorded at a frequency of 1 Hz via the Velotron cycle ergometer software. Blood
pressure and oxygen saturation were measured immediately after each interval.
Additionally, immediately after each interval, and at the completion of each testing
session (20 minutes post completion) participants were asked to rate their
perceived exertion, effort, and pain using visual analog scales (0 = none; 10 =
maximal). At the completion of the final interval, participants were asked to lay
supine for 10 minutes during which heart rate, blood pressure and oxygen
saturation were recorded. Following this, ultrasound measures were performed and
a second venous blood sample was obtained (Figure 1).

36
Figure 1. An outline of the study experimental design.
3.4 PHYSIOLOGICAL MEASURES
3.4.1 Venous Blood Sampling and analysis
Venous blood samples were obtained pre- and post-interval session using
standard venipuncture techniques. All samples were obtained by a trained and
certified phlebotomist from the anti-cubital vein using a 21 gauge needle and 8.0ml
EDTA and SST tubes. After collection, blood samples were centrifuged and
supernate was removed and stored at -80oC in individual 1.0mL samples. Plasma
samples were analysed for brain natriuretic peptide (BNP) following standard
commercial procedures (Western Diagnostic; Perth).
3.4.2 Ultrasound Ventricular Measures
Ultrasonic measures of left ventricular volume were measured using a hand-
held portable ultrasound device (SonoSite Plus; SonoSite Inc.; USA) with a cardiac
37
specific ultrasound probe. A standard four-chamber apical view was used to obtain
end-diastolic and end-systolic images of the left ventricle. Images were assessed for
chamber volume using National Institute of Health freeware (ImageJ; NIH; USA).
The difference in left ventricular area measures between end-diastole and end-
systole were used to represent ejection fraction and thus ventricular function.
3.4.3 Heart Rate Analysis
Heart rate data collected during each 10 minute rest period, pre- and post-
exercise, were analysed to determine the heart rate variability. Mean time domain
(ms) was calculated from beat-by-beat data for the final 2 minutes of each
measurement period using Polar internal software. The standard deviation in beat-
by-beat measures as well as the root mean squared RMSS was calculated and used
to represent sympathetic (lower standard deviation) and parasympathetic (greater
standard deviation) output. Mean heart rate was calculated for each interval and
session for later analysis.
3.4.4 Expired Ventilation
Expired ventilation collected during rest and intervals sessions was used to
calculate the volume of oxygen consumed (VO2) during each measurement point.
Measurements obtained during the 10 minute pre-exercise rest period were used
as the participant’s basal VO2 and these values were removed from measurements
recorded during exercise to provide an accurate indication of the metabolic
demands associated with each effort.
3.5 DATA PROCESSING
Consistent with previous research [27], single-legged power output data was
compared with double-legged data using the sum of power output from the right

38
and left leg. Furthermore, work-load during each interval session (only during
efforts) was calculated from the mean power recorded during the double-legged
and calculated from the single-legged efforts. Workload was calculated as the mean
power during each effort multiplied by the time in seconds (60 seconds)
corresponding to the interval. A similar methodology was used to calculate
workload during recovery. Total workload was calculated as the sum of both the
interval efforts and their corresponding rest periods.
In order to compare measures of oxygen consumption, oxygen saturation,
ventilation, respiratory rate, heart rate, blood pressure and perceptions of exertion,
pain and effort between double- and single-legged cycling, a mean value was
calculated for each variable between the right and left leg. This technique has
previously been used in research examining oxygen consumption during single-
legged and double-legged cycling [26].
3.6 STATISTICAL ANALYSIS
Differences between conditions for mean heart rate variability, blood
pressure, ventricular function, BNP, and perceived exertion obtained pre- and post-
interval session were analysed using a two-way analysis of variance with repeated
measures (ANOVA; condition x time). Mean VO2, blood pressure, oxygen saturation,
heart rate and perceived exertion, pain, and effort during each interval were also
analysed for differences between conditions (double-legged, single-legged) using a
two-way ANOVA with repeated measurements. Significant main effects or
interactions were examined using a Tukey’s HSD post hoc analysis. Statistical
analyses were conducted using Statistica statistical analysis software (Version 7;

39
StatSoft; USA) with significance set at p≤0.05. All data are presented as mean ±
standard deviations unless noted otherwise.

40
CHAPTER FOUR: RESULTS
Figure 2. Power output measured during the double- ( ■ ) and single-legged ( ▲ )
cycling conditions. * Single-legged greater than double-legged.
A significant interaction (F(5, 40)= 5.7411, p<0.01) was observed for power,
with greater power measured during intervals two to six in the combined (i.e. sum
of right and left leg) single-legged when compared with double-legged condition.
Furthermore, a significant interaction (F(5, 40)= 7.4060, p<0.01) was observed for
total workload, with greater total workload measured following intervals two to six
in the combined single-legged when compared with the double-legged condition.
A main effect for condition (F(1, 8)= 201.39, p<0.01) was observed for session
workload, with greater external workloads measured during single-legged,
compared with double-legged cycling (743 ± 122 kJ versus 916 ± 73 kJ).

41
Figure 3. Mean VO2 (top), ventilation (middle) and RR (bottom) measured pre-exercise and during each interval in double- ( ■ ) and single-legged ( ▲ ) cycling conditions. * Double-legged greater than single-legged cycling. ** Double-legged greater than single-legged condition. # Pre-exercise and interval 1 less than intervals 2-6.
A significant (F(6, 54)= 21.373, p<0.01) interaction was observed for VO2, with
greater VO2 measured during all intervals during double-legged compared with
single-legged (i.e. mean of right and left leg) cycling. A significant interaction (F(6, 54)=

42
9.7177, p<0.01) was observed for ventilation (VE), with greater VE measured during
all double-legged intervals, compared with the single-legged (i.e. mean of right and
left leg) condition. A main effect for condition (F(1, 9)= 6.9183, p<0.05) was observed
for respiration rate (RR), with greater RR measured during double-legged when
compared with the single-legged (i.e. mean of right and left leg) condition. In
addition, a main effect for time (F(6, 54)= 70.976, p<0.01) was observed for RR, with a
lower RR observed pre-exercise and during interval one when compared with
intervals two through six.
A main effect for condition (F(1, 6)= 9.3352, p<0.05) was observed for oxygen
saturation, with greater oxygen saturation measured in the single-legged (i.e. mean
of right and left leg; 97% ± 1%) when compared with the double-legged (96% ± 2%)
condition. In addition, a main effect for time (F(7, 42)= 5.0820, p<0.01) was observed
for oxygen saturation, with greater oxygen saturation measured pre-exercise and
during intervals one, two, four and five when compared with post-exercise values.
Furthermore, oxygen saturation was greater in both conditions after interval one
compared with interval six.

43
Figure 4. Heart rate measured pre-exercise and during each interval in double- ( ■
) and single-legged ( ▲ ) cycling conditions. * Double-legged significantly greater
than single-legged.
A significant interaction (F(6, 54)= 8.1881, p<0.01) was observed for heart rate,
with greater heart rate measured following all intervals in double-legged when
compared with the single-legged (i.e. mean of right and left leg) condition.
Furthermore, a main effect for time was observed for heart rate variability with
greater standard deviation (SD1) and RMSSD measured pre- (49 ± 33 ms and 69 ± 46
ms; respectively), compared with post-trial (7 ± 4 ms and 10 ± 6 ms; respectively).

44
Table 4. Brain natriuertic peptide (BNP) and left ventricular ejection fraction (%) measured pre-exercise and post-exercise in the double- and single-legged cycling conditions.
Double-legged Single-legged
Pre Post** Pre Post**
BNP (pg/mL) * 29.9±13.3 32.9±12.0 18.9±3.1 20.3±3.8
Ejection fraction (%) 49.4±6.8 37.9±5.0 48.7±3.3 46.1±4.6+
* Double-legged greater than single-legged condition. ** Post-exercise greater than pre-
exercise measures. + Single-legged greater than double-legged.
Differences in pre- and post-exercise measurements of BNP and ejection
fraction for double- and single-legged conditions are displayed in table 4. A main
effect for condition was observed for BNP, with greater values measured in the
double-legged when compared with single-legged condition. In addition, a
significant main effect for time was observed for BNP, with greater values measured
post-exercise when compared with pre-exercise. A significant interaction was
observed for left ventricular ejection fraction, with a greater ejection fraction
measured post-exercise in single-legged when compared with double-legged
cycling.

45
Figure 5. Systolic (top), diastolic (middle) and mean arterial pressure (bottom)
measured pre-exercise, following each interval and 10 minutes post-exercise in
the double- ( ■ ) and single-legged ( ▲ ) cycling conditions. * Significant difference
between double-legged and single-legged conditions. ** Pre-exercise measures
less than all intervals. ^ Pre- and post-exercise measures less than all intervals. #
Single-legged greater than double-legged. + Intervals 1 and 2 greater than interval
6.
46
A significant interaction (F(8, 72)= 6.0587, p<0.01) was observed for systolic
blood pressure, with greater systolic blood pressure measured at the end of
intervals one to four in double-legged when compared with the single-legged (i.e.
mean of right and left leg) condition. A main effect for condition (F(1, 9)= 7.8975,
p<0.05) was observed for diastolic blood pressure, with greater mean diastolic
blood pressure measured in the single-legged (i.e. mean of right and left leg; 72 ± 10
mmHg) when compared with double-legged condition (68 ± 11 mmHg). In addition,
a main effect for time (F(8, 72)= 11.544, p<0.01) was observed for diastolic blood
pressure, with greater diastolic blood pressure observed following all intervals
when compared with pre-exercise measures. A main effect for time (F(8, 72)=89.348,
p<0.01) was observed for mean arterial pressure, with greater values observed
following all intervals when compared with pre- and post-exercise values, however
no significant differences were observed between pre- and post-exercise values. In
addition, measures of mean arterial pressure obtained after intervals one and two
were significantly greater compared with interval six.

47
Table 5. Ratings of perceived exertion, pain and effort measured following each interval in double- and single-legged cycling conditions.
Interval 1 Interval 2 Interval 3 Interval 4 Interval 5 Interval 6
RPE*
Double-leg 7.0±2.3 7.7±2.0 8.4±2.1 8.7±1.6 9.2±0.8 9.7±0.7
Single-Leg 6.4±2.0 6.8±1.9 7.2±2.1 7.7±2.2 7.8±2.1 8.0±1.8
Pain**
Double-leg 6.6±1.4 7.6±1.0 8.8±1.0 9.1±0.9 9.4±0.7 9.6±0.5
Single-Leg 6.7±1.7 8.0±1.3 8.7±0.9 9.3±0.5 9.6±0.5 9.7±0.5
Effort+
Double-leg 8.9±1.4 9.4±0.7 9.6±0.5 9.8±0.4 9.9±0.3 9.9±0.3
Single-Leg 9.0±0.9 9.2±0.8 9.3±0.6 9.5±0.5 9.5±0.5 9.7±0.5
* Interval 1 less than intervals 3-6, interval 2 less than intervals 5 and 6, interval 3 less than
interval 6. ** Interval 1 less than intervals 2-6, interval 2 less than 4-6. + Interval 1 less than
intervals 4-6.
A main effect for time (F(5, 45)= 11.341, p<0.01) was observed for RPE, with
lower reported RPE after interval one when compared with intervals three to six.
Furthermore, lower reported RPE was observed after interval two when compared
with intervals five and six and lower RPE was measured after interval three when
compared with interval six. A main effect for time (F(5, 45)= 5.7133, p<0.01) was
observed for perceived effort, with lower perceived effort reported after interval

48
one when compared with intervals four, five and six. A main effect for time (F(5, 45)=
26.101, p<0.01) was observed for perceived pain, with lower perceived pain
measured after interval one when compared with intervals two through six.
Additionally, lower perceived pain was measured after interval two when compared
with intervals four, five and six. No interactions observed for RPE, perceived effort
or perceived pain.
Sessional RPE displayed a main effect for condition (F(1, 9)= 8.6412, p<0.02) with
greater sessional RPE measured following double-legged when compared with the
single legged condition (8.9 ± 0.7 versus 7.2 ± 1.8).

49
CHAPTER FIVE: DISCUSSION
The purpose of the current study was to investigate the influence of double-
and single-legged cycling intervals on performance, as well as physiological and
cardiac stress in young healthy adults. The main findings from the study were; 1)
accumulated power output and workload were greater during combined (i.e. sum of
right and left legs) single-legged when compared with double-legged cycling, 2)
greater metabolic/physiological stress was observed during double-legged cycling,
as measured by oxygen consumption, 3) greater cardiac stress was observed during
double-legged cycling, as shown by greater inter-interval heart rate and lower end-
session left ventricular function, and 4) single-legged cycling was perceived easier,
as indicated by measures of sessional ratings of perceived exertion, even though
inter-interval perceptions of effort and pain were similar between conditions.
In the current study we observed 12% greater power output measured
during single-legged (i.e. sum of right and left leg) when compared with double-
legged cycling (Figure 2). Our findings are consistent with Abbiss et al. [27] who
observed similar differences (13%) when comparing the accumulated power output
from single-legged with double-legged cycling during a 4-minute sustained effort. It
is suggested the ability to maintain higher power outputs during single-legged
cycling is due to an increased ability to deliver oxygen to the smaller active muscle
mass; thus, limiting the influence of insufficient oxygen delivery which has been
hypothesised to reduce double-legged cycling capacity [20, 50, 54]. This improved
ability to produce greater power outputs during single-legged cycling has been
associated with greater skeletal muscle metabolic adaptations [20, 25, 27, 52]. As

50
such, improvements in mitochondrial oxidative capacity [20, 25, 27, 52] as well as
improvements in substrate storage [52] have been observed following single-legged
cycle training.
Although accumulated workload was less during double-legged compared
with single-legged cycling, our findings indicated double-legged cycling resulted in
increased physiological stress as shown by a 34% ± 0.6% greater oxygen
consumption measured during double-legged when compared with single-legged
(i.e. mean of right and left leg) cycling (Figure 3). Based on the available literature,
we believe this difference is due to the reduced size of active muscle mass during
single-legged cycling [26] which would limit the muscles ability to consume oxygen
[26, 55]. Previously, Barker et al. [26] have observed ~20% greater peak oxygen
consumption during double-legged when compared with single-legged incremental
cycling. We believe, although highlighting a similar phenomena, the difference
between our data and Barker et al. [26] was due to the supramaximal nature of the
intervals in our study which would have resulted in a large oxygen deficit and,
hence, larger oxygen debt during double-legged cycling [56]. For instance, during
double-legged cycling a large anaerobic contribution would be needed during the
initial stages of each effort (i.e. first 15 to 20 seconds of each interval) as blood
delivery is unlikely to meet the metabolic demand [57]. However, during single-
legged cycling adequate oxygen delivery [20, 25, 27, 54] would have resulted in a
lower anaerobic contribution to this activity. The large anaerobic contribution
during the initial stages of the double-legged cycling efforts would have resulted in
an increased oxygen debt [57] with elevated compensatory oxygen consumption
throughout the remaining effort [56-58].

51
The benefits of high intensity interval training are well documented [5, 11,
13-16, 42, 43]; however, in certain populations (i.e. post myocardial infarction,
chronic heart failure, diabetes mellitus and obese patients) the cardiovascular stress
associated with traditional high-intensity interval training may be contraindicated
[18]. Heart rate in our study was 11.8% ± 7.0% greater during double-legged
compared with single-legged (i.e. mean of right and left leg) cycling (Figure 4),
indicating a greater level of cardiovascular stress [10, 14, 16-18, 26, 30, 31, 59]. To
further explore this, we examined change in left ventricular ejection fraction pre-
and post-interval session and observed a greater decline in ejection fraction after
double-legged cycling (Table 4). Indeed, an 11% decrease in left ventricular ejection
fraction was observed after double-legged cycling, compared with a 2.5% decrease
after single-legged cycling. Conversely, Scott et al. [17] have previously observed
~5% decrease in left ventricular ejection fraction following 14x1-minute double-
legged cycling intervals at ~99% peak power output interspersed with two minutes
recovery. The divergent response between our double-legged findings and those by
Scott et al. [17] are possibly due to the supramaximal nature of our intervals (>99%
peak power) accompanied by decreased recovery time (i.e. Scott et al. = 1:2 work to
rest; current study = 1:1 work to rest) resulting in greater cardiac work during the
efforts as well as increased work to compensate for oxygen deficit during the
recovery [56-58]. The difference observed between double-legged and single-
legged cycling in this study can be explained by the increased cardiac stress during
double-legged cycling due to increase blood flow demands [20, 25, 27, 54].
Although we did not measure left ventricular ejection fraction during the
interval session, a decrease in systolic blood pressure during the final two intervals

52
in the double-legged condition may indicate the decline in left ventricular ejection
fraction began early during the exercise bout (Figure 5). As diastolic blood pressure
and heart rate were consistent throughout each effort, a decline in systolic blood
pressure is likely to indicate a change in stroke volume and thus a decline in left
ventricular function [18, 21, 60]. This finding is of particular concern for individuals
with cardiovascular disease, as this decline in stroke volume while intensity remains
consistent could compromise cardiac blood flow leading to myocardial ischemia [61,
62]. Nevertheless, ultrastructural cardiomyocyte changes associated with exercise-
induced myocardial ischemia are reversible once normal blood flow is returned [62].
In addition to monitoring cardiac stress through heart rate and changes in
left ventricular function, brain natriuretic peptide (BNP) was measured as this
cardiac metabolite is recognised as an important marker of cardiac damage in
clinical populations [22-24, 49]. In the present study, both conditions resulted in
increased BNP regardless of interval type (Table 4). Our findings support Krupicka et
al. [49] who observed an increase in BNP levels immediately following symptom-
limiting exercise. Regardless, our measures did not present with a similar level of
stability as those of Krupicka et al. [49] as significant differences were recorded in
baseline measures between conditions (Table 4). While BNP provides an indicator of
damage, our data indicates the use of BNP to differentiate between modalities of
exercise is limited by variability of the measure. Indeed, large variation in NT-
proBNP measurements has previously been reported [23].
Compliance to any exercise program is influenced by participant perception
of the exercise [63-65]. During both single- and double-legged efforts perceptions of

53
exertion, pain and effort were similar (Table 5), however, session RPE was greater
following double-legged when compared with single-legged cycling. Session RPE is a
subjective measure which has been shown to provide an indication of internal
training load (i.e. the relative physiological stress imposed) during high-intensity,
intermittent training [66]. High ventilation rates during physical activity are
associated with greater perceptions of effort [67]. It is possible, the higher
ventilation rates measured during double-legged cycling together with the above
mentioned increase in cardiovascular stress resulted in an overall greater sense of
effort and thus a higher session RPE compared with single-legged cycling. Indeed,
anecdotally, subjects reported that it was ‘harder to breath’ and ‘harder on the
heart’ during the double-legged cycling session. The lower session RPE observed
following single-legged cycling, as well as subject reports, indicate that compliance
rates may be higher for this modality if used as a training stimulus.
While findings from the current study add to the growing body of knowledge
in this area, we do acknowledge limitations in data collection and interpretation
which may have impacted our findings. Firstly, workload during single-legged
cycling was presented as an accumulation of legs when comparing against double-
legged cycling. To do this an assumption that each leg contributes equally to power
production is necessary. It is possible to measure differences in individual leg power
contribution using a specially designed power measuring pedal interface.
Regardless, without access to such equipment we feel our methodology is valid as
other researchers have utilised a similar approach within the available literature
[26, 27]. Leg blood flow was not measured during this study; therefore, presenting a
limitation to the interpretation of our data as we can only hypothesise differences

54
in blood flow between conditions. Although the measure of blood flow would have
provided valuable insight into muscle oxygenation differences between conditions
we feel data from previous studies investigating blood flow during smaller muscle
mass training [20, 25, 54, 68] provide the necessary evidence to support our
findings and discussion.
In conclusion, single-legged cycling allows individuals to exercise at a greater
overall power output; however, under less cardiovascular and physiological stress,
compared with traditional double-legged cycling. Importantly, double-legged cycling
resulted in a greater decline in left ventricular function following this modality.
These findings should be of particular interest to cardiovascular disease populations
at increased risk of cardiovascular episodes. Furthermore, our findings of greater
session RPE during double-legged cycling indicate single-legged interval efforts
could prove to be advantageous as higher compliance rates are likely with this
modality. With increased attention to the use of high-intensity interval training in
diseased populations, the results of this study indicate that single-legged cycling
could provide an alternative approach to normal double-legged cycling giving
practitioners a method to quickly enhance metabolic function without increasing
cardiac risk. Regardless, further research is needed to determine the overall
effectiveness of high-intensity single-legged cycling in diseased populations.
Practical recommendations and future directions
From previously observed superior skeletal muscle metabolic adaptations
[20, 25, 27, 52] and the present observations of decreased cardiovascular and
physiological stress resulting from high-intensity single-legged interval cycling, we

55
suggest such method of exercise delivery would be safe and effective for diseased
populations. Furthermore, the inclusion of high-intensity single-legged cycling into
cardiovascular rehabilitation programs could prove advantageous to compliance
rates as well as increase motivation. To date however, there have been no studies
investigating the cardiovascular adaptations to single-legged cycle training.
Future research involving long-term (e.g. months to years) interventions in a
variety of clinical populations (e.g. individuals with cardiovascular disease, diabetes
and obesity) is needed to better understand the peripheral (skeletal muscle) and
central (cardiovascular) adaptations associated with single-legged cycling.
Furthermore, future research should examine varying intensities and durations to
assist in optimal exercise prescription.

56
REFERENCES
1. WHO, The Global Burden of Disease: 2004 Update, D.o.H.S.a. Informatics,
Editor 2004, WHO Press: Switzerland.
2. ABS, Cardiovascular Disease in Australia: A Snapshot, 2004-05, A.B.o.
Statistics, Editor 2006.
3. ABS, Physical Activity in Australia: A Snapshot, 2007-08, A.B.o. Statistics,
Editor 2011.
4. Lee, D.C., et al., Comparisons of leisure-time physical activity and
cardiorespiratory fitness as predictors of all-cause mortality in men and
women. Br J Sports Med, 2011. 45(6): p. 504-10.
5. O'Donovan, G., et al., Changes in cardiorespiratory fitness and coronary
heart disease risk factors following 24 wk of moderate- or high-intensity
exercise of equal energy cost. J Appl Physiol, 2005. 98(5): p. 1619-25.
6. Nokes, N., Relationship between physical activity and aerobic fitness. J Sports
Med Phys Fitness, 2009. 49(2): p. 136-41.
7. Balducci, S., et al., Changes in physical fitness predict improvements in
modifiable cardiovascular risk factors independently of body weight loss in
subjects with type 2 diabetes participating in the Italian Diabetes and
Exercise Study (IDES). Diabetes Care, 2012. 35(6): p. 1347-54.
8. Wilmore, J.H., et al., Relationship of changes in maximal and submaximal
aerobic fitness to changes in cardiovascular disease and non-insulin-
dependent diabetes mellitus risk factors with endurance training: the
HERITAGE Family Study. Metabolism, 2001. 50(11): p. 1255-63.
57
9. Burgomaster, K.A., et al., Similar metabolic adaptations during exercise after
low volume sprint interval and traditional endurance training in humans. J
Physiol, 2008. 586(1): p. 151-60.
10. Wisloff, U., et al., Superior cardiovascular effect of aerobic interval training
versus moderate continuous training in heart failure patients: a randomized
study. Circulation, 2007. 115(24): p. 3086-94.
11. Gibala, M.J., et al., Physiological adaptations to low-volume, high-intensity
interval training in health and disease. J Physiol, 2012. 590(Pt 5): p. 1077-84.
12. Freyssin, C., et al., Cardiac Rehabilitation in Chronic Heart Failure: Effect of
an 8-Week, High-Intensity Interval Training Versus Continuous Training. Arch
Phys Med Rehabil, 2012.
13. Guiraud, T., et al., Optimization of high intensity interval exercise in coronary
heart disease. Eur J Appl Physiol, 2010. 108(4): p. 733-40.
14. Guiraud, T., et al., High-intensity interval training in cardiac rehabilitation.
Sports Med, 2012. 42(7): p. 587-605.
15. Kessler, H.S., S.B. Sisson, and K.R. Short, The potential for high-intensity
interval training to reduce cardiometabolic disease risk. Sports Med, 2012.
42(6): p. 489-509.
16. Mandroukas, A., et al., Cardiorespiratory and metabolic alterations during
exercise and passive recovery after three modes of exercise. J Strength Cond
Res, 2011. 25(6): p. 1664-72.
17. Scott, J.M., et al., Effects of high intensity exercise on biventricular function
assessed by cardiac magnetic resonance imaging in endurance trained and
normally active individuals. Am J Cardiol, 2010. 106(2): p. 278-83.
58
18. Tomczak, C.R., et al., Effect of acute high-intensity interval exercise on
postexercise biventricular function in mild heart failure. J Appl Physiol, 2011.
110(2): p. 398-406.
19. King, A.C., et al., Long-term effects of varying intensities and formats of
physical activity on participation rates, fitness, and lipoproteins in men and
women aged 50 to 65 years. Circulation, 1995. 91(10): p. 2596-604.
20. Rud, B., et al., One-legged endurance training: leg blood flow and oxygen
extraction during cycling exercise. Acta Physiol (Oxf), 2012. 205(1): p. 177-
85.
21. Trinity, J.D., et al., Attenuated relationship between cardiac output and
oxygen uptake during high-intensity exercise. Acta Physiol (Oxf), 2012.
204(3): p. 362-70.
22. Vourvouri, E.C., et al., Screening for left ventricular dysfunction using a hand-
carried cardiac ultrasound device. Eur J Heart Fail, 2003. 5(6): p. 767-74.
23. van der Zee, P.M., et al., Relation of N-terminal pro B-type natriuretic
peptide levels after symptom-limited exercise to baseline and ischemia
levels. Am J Cardiol, 2009. 103(5): p. 604-10.
24. Legaz-Arrese, A., et al., The impact of exercise intensity on the release of
cardiac biomarkers in marathon runners. Eur J Appl Physiol, 2011. 111(12):
p. 2961-7.
25. Bell, C., et al., Determinants of oxygen uptake kinetics in older humans
following single-limb endurance exercise training. Exp Physiol, 2001. 86(5): p.
659-65.
59
26. Barker, M., Comparison of unassisted single-leg, assisted single-leg and two-
legged cycling., 2010, ECU.
27. Abbiss, C.R., et al., Single-leg cycle training is superior to double-leg cycling in
improving the oxidative potential and metabolic profile of trained skeletal
muscle. J Appl Physiol, 2011. 110(5): p. 1248-55.
28. Garelnabi, M., et al., Physical inactivity and cardiovascular risk: baseline
observations from men and premenopausal women. J Clin Lab Anal, 2010.
24(2): p. 100-5.
29. Arena, R., Myers, J., Forman, D.E., Should high-intensity-aerobic interval
training become the clinical standard in heart failure? Heart Fail Rev, 2012.
30. Kemi, O.J., et al., Moderate vs. high exercise intensity: differential effects on
aerobic fitness, cardiomyocyte contractility, and endothelial function.
Cardiovasc Res, 2005. 67(1): p. 161-72.
31. Kemi, O.J. and U. Wisloff, High-intensity aerobic exercise training improves
the heart in health and disease. J Cardiopulm Rehabil Prev, 2010. 30(1): p. 2-
11.
32. Kimm, S.Y., et al., Self-perceived barriers to activity participation among
sedentary adolescent girls. Med Sci Sports Exerc, 2006. 38(3): p. 534-40.
33. Reichert, F.F., Barros, A.J.D., Domingues, M.R., Hallal, P.C., The role of
perceived personal barriers to engagement in leisure-time physical activity.
Am J Public Health, 2007. 97(3): p. 551-519.
34. Trost, S.G., et al., Correlates of adults' participation in physical activity:
review and update. Med Sci Sports Exerc, 2002. 34(12): p. 1996-2001.

60
35. Hottenrott, K., Ludyga, S., Schulze, S., Effects of high intensity training and
continuous endurance training on aerobic capacity and body composition in
recreationally active runners. J Sports Sci, 2012. 11: p. 483-488.
36. Laursen, P.B., Training for intense exercise performance: high-intensity or
high-volume training? Scand J Med Sci Sports, 2010. 20 Suppl 2: p. 1-10.
37. Laursen, P.B. and D.G. Jenkins, The scientific basis for high-intensity interval
training: optimising training programmes and maximising performance in
highly trained endurance athletes. Sports Med, 2002. 32(1): p. 53-73.
38. Skinner, J.S., et al., Age, sex, race, initial fitness, and response to training: the
HERITAGE Family Study. J Appl Physiol, 2001. 90(5): p. 1770-6.
39. Rodrigues, A.C., et al., Left ventricular function after exercise training in
young men. Am J Cardiol, 2006. 97(7): p. 1089-92.
40. Hawley, J.A. and F.J. Spargo, Metabolic adaptations to marathon training
and racing. Sports Med, 2007. 37(4-5): p. 328-31.
41. Yeo, W.K., et al., Skeletal muscle adaptation and performance responses to
once a day versus twice every second day endurance training regimens. J
Appl Physiol, 2008. 105(5): p. 1462-70.
42. Guiraud, T., et al., Acute Responses to High-Intensity Intermittent Exercise in
CHD Patients. Med Sci Sports Exerc, 2011. 43(2): p. 211-7.
43. Gibala, M.J., et al., Short-term sprint interval versus traditional endurance
training: similar initial adaptations in human skeletal muscle and exercise
performance. J Physiol, 2006. 575(Pt 3): p. 901-11.

61
44. Perry, C.G., et al., High-intensity aerobic interval training increases fat and
carbohydrate metabolic capacities in human skeletal muscle. Appl Physiol
Nutr Metab, 2008. 33(6): p. 1112-23.
45. Moholdt, T., et al., Aerobic interval training increases peak oxygen uptake
more than usual care exercise training in myocardial infarction patients: a
randomized controlled study. Clin Rehabil, 2012. 26(1): p. 33-44.
46. Cox, M.L., J.B. Bennett, 3rd, and G.A. Dudley, Exercise training-induced
alterations of cardiac morphology. J Appl Physiol, 1986. 61(3): p. 926-31.
47. Trilk, J.L., et al., Effect of sprint interval training on circulatory function
during exercise in sedentary, overweight/obese women. Eur J Appl Physiol,
2011. 111(8): p. 1591-7.
48. Zhao, Q.H., et al., Serum high-density lipoprotein cholesterol levels as a
prognostic indicator in patients with idiopathic pulmonary arterial
hypertension. Am J Cardiol, 2012. 110(3): p. 433-9.
49. Krupicka, J., Janota, T., Kasalova, Z., Hradec, J., Effect of short-term maximal
exercise on BNP plasma levels in healthy individals. Physiol Res, 2010. 59(4):
p. 625-628.
50. Knight, D.R., et al., Effects of hyperoxia on maximal leg O2 supply and
utilization in men. J Appl Physiol, 1993. 75(6): p. 2586-94.
51. Gleser, M.A., Effects of hypoxia and physical training on hemodynamic
adjustments to one-legged exercise. J Appl Physiol, 1973. 34(5): p. 655-9.
52. Hardman, A.E.W., C.; Boobis, L.H., Influence of single leg training on muscle
metabolism and endurance during exercise with the trained and untrained
limb. J Sports Sci, 1987. 5: p. 105-116.

62
53. Bell, G., Neary, P., Wenger, H.A. , The influence of one-legged training on
cardiorespiratory fitness. J Orthop Sport Phys, 1988. 10(1): p. 8-11.
54. Calbet, J.A., et al., On the mechanisms that limit oxygen uptake during
exercise in acute and chronic hypoxia: role of muscle mass. J Physiol, 2009.
587(Pt 2): p. 477-90.
55. Reybrouck, T.H., G.F.; Faulkner, J.A., Limitations to maximal oxygen uptake
in arms, legs and combined arm-leg ergometry. J Appl Physiol, 1975. 38: p.
774-779.
56. Scott, C.B., Estimating energy expenditure for brief bouts of exercise with
acute recovery. Appl Physiol Nutr Metab, 2006. 31(2): p. 144-9.
57. Bangsbo, J., et al., Anaerobic energy production and O2 deficit-debt
relationship during exhaustive exercise in humans. J Physiol, 1990. 422: p.
539-59.
58. Mohler, J.G. and B.W. Armstrong, The oxygen deficit and debt for normal
and non-athletic men. Respir Physiol, 1973. 17(2): p. 248-62.
59. Heydari, M., Y.N. Boutcher, and S.H. Boutcher, High-intensity intermittent
exercise and cardiovascular and autonomic function. Clin Auton Res, 2013.
23(1): p. 57-65.
60. Stohr, E.J., J. Gonzalez-Alonso, and R. Shave, Left ventricular mechanical
limitations to stroke volume in healthy humans during incremental exercise.
Am J Physiol Heart Circ Physiol, 2011. 301(2): p. H478-87.
61. Scott, J.M. and D.E. Warburton, Mechanisms underpinning exercise-induced
changes in left ventricular function. Med Sci Sports Exerc, 2008. 40(8): p.
1400-7.
63
62. Braunwald, E. and R.A. Kloner, The stunned myocardium: prolonged,
postischemic ventricular dysfunction. Circulation, 1982. 66(6): p. 1146-9.
63. Coquart, J.B., et al., Intermittent versus continuous exercise: effects of
perceptually lower exercise in obese women. Med Sci Sports Exerc, 2008.
40(8): p. 1546-53.
64. Besson, D., et al., Eccentric training in chronic heart failure: feasibility and
functional effects. Results of a comparative study. Ann Phys Rehabil Med,
2013. 56(1): p. 30-40.
65. Ekkekakis, P. and E. Lind, Exercise does not feel the same when you are
overweight: the impact of self-selected and imposed intensity on affect and
exertion. Int J Obes (Lond), 2006. 30(4): p. 652-60.
66. Wallace, L.K., K.M. Slattery, and A.J. Coutts, The ecological validity and
application of the session-RPE method for quantifying training loads in
swimming. J Strength Cond Res, 2009. 23(1): p. 33-8.
67. Grippo, A., et al., Effect of limb muscle fatigue on perception of respiratory
effort in healthy subjects. J Appl Physiol, 2010. 109(2): p. 367-76.
68. Andersen, P. and B. Saltin, Maximal perfusion of skeletal muscle in man. J
Physiol, 1985. 366: p. 233-49.

64
APPENDIX ONE

65

66
APPENDIX TWO

67

68
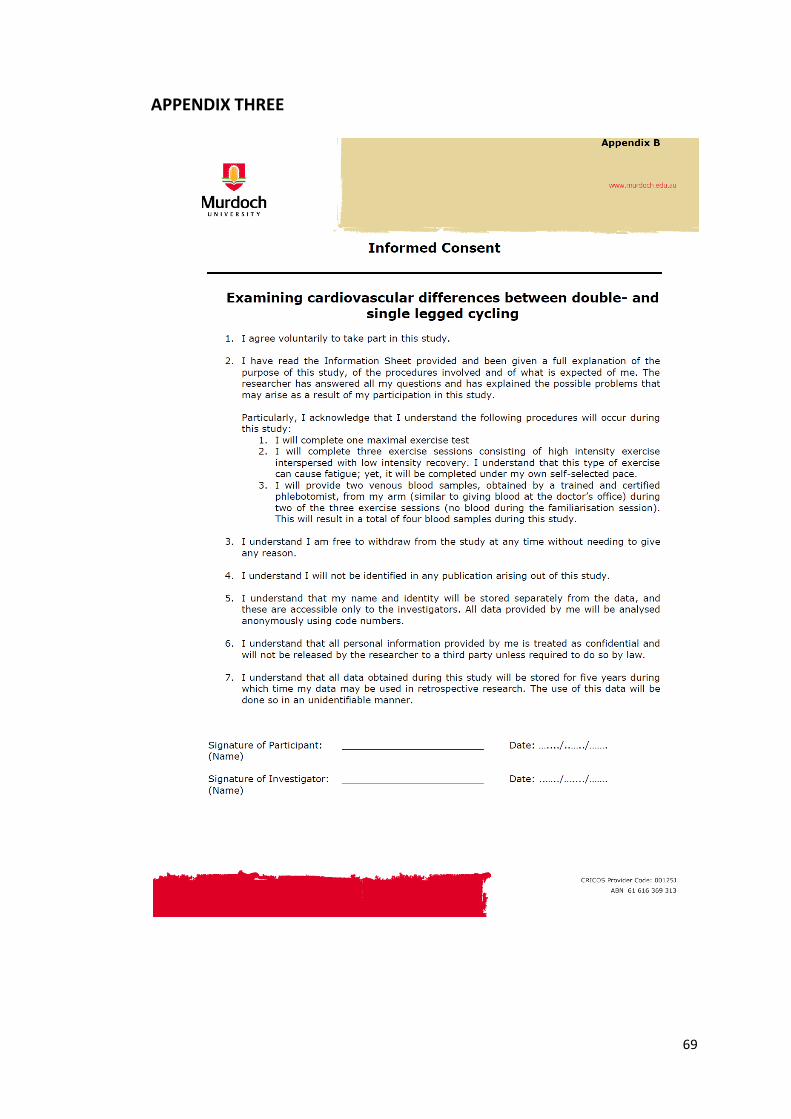
69
APPENDIX THREE