cardiac rhythm interpretation - nursing411.orgnursing411.org/army/md0571b.pdfhave a systematic...
TRANSCRIPT
U.S. ARMY MEDICAL DEPARTMENT CENTER AND SCHOOL FORT SAM HOUSTON, TEXAS 78234-6100
CARDIAC RHYTHM INTERPRETATION
SUBCOURSE MD0571 EDITION 200

DEVELOPMENT
This subcourse is approved for resident and correspondence course instruction. It reflects the current thought of the Academy of Health Sciences and conforms to printed Department of the Army doctrine as closely as currently possible. Development and progress render such doctrine continuously subject to change.
ADMINISTRATION
For comments or questions regarding enrollment, student records, or shipments, contact the Nonresident Instruction Section at DSN 471-5877, commercial (210) 221-5877, toll-free 1-800-344-2380; fax: 210-221-4012 or DSN 471-4012, e-mail [email protected], or write to: COMMANDER AMEDDC&S ATTN MCCS HSN 2105 11TH STREET SUITE 4192 FORT SAM HOUSTON TX 78234-5064 Approved students whose enrollments remain in good standing may apply to the Nonresident Instruction Section for subsequent courses by telephone, letter, or e-mail. Be sure your social security number is on all correspondence sent to the Academy of Health Sciences.
CLARIFICATION OF TRAINING LITERATURE TERMINOLOGY When used in this publication, words such as "he," "him," "his," and "men" are intended to include both the masculine and feminine genders, unless specifically stated otherwise or when obvious in context. .
USE OF PROPRIETARY NAMES
The initial letters of the names of some products are capitalized in this subcourse. Such names are proprietary names, that is, brand names or trademarks. Proprietary names have been used in this subcourse only to make it a more effective learning aid. The use of any name, proprietary or otherwise, should not be interpreted as an endorsement, deprecation, or criticism of a product; nor should such use be considered to interpret the validity of proprietary rights in a name, whether it is registered or not. .

MD0571 i
TABLE OF CONTENTS Lesson Paragraphs INTRODUCTION 1 DYSRHYTHMIA RECOGNITION Section I. Dysrhythmia ............................................................... 1-1--1-2 Section II. Electrophysiology....................................................... 1-3--1-5 Section III. Rhythms/Heart Blocks................................................ 1-6--1-12 Exercises

MD0571 ii
CORRESPONDENCE COURSE OF THE UNITED STATES ARMY MEDICAL DEPARTMENT CENTER AND SCHOOL
SUBCOURSE MD0571
CARDIAC RHYTHM INTERPRETATION
INTRODUCTION
In this subcourse, you will study recognition of cardiac dysrhythmias. This information will aid you in maintaining and improving the health of soldiers. In that pursuit, do your best to achieve the objectives of this subcourse. Subcourse Components: This subcourse consists of one lesson:
Lesson 1, Dysrhythmia Recognition. Study Suggestions: --Read and study the lesson carefully. --Complete the subcourse lesson, then work the exercises at the end of the lesson. --After completing the lesson exercises, compare your answers with those on the solution sheet that follows the exercises. If you have answered an exercise incorrectly, check the reference cited after the answer on the solution sheet to determine why your response was not the correct one. Credit Awarded: To receive credit hours, you must be officially enrolled and complete an examination furnished by the Nonresident Instruction Section at Fort Sam Houston, Texas. Upon successful completion of the examination for this subcourse, you will be awarded 5 credit hours. You can enroll by going to the web site http://atrrs.army.mil and enrolling under "Self Development" (School Code 555). A listing of correspondence courses and subcourses available through the Nonresident Instruction Section is found in Chapter 4 of DA Pamphlet 350-59, Army Correspondence Course Program Catalog. The DA PAM is available at the following website: http://www.usapa.army.mil/pdffiles/p350-59.pdf.

MD0571 1-1
LESSON ASSIGNMENT LESSON 1 Dysrhythmia Recognition. LESSON ASSIGNMENT Paragraphs 1-1 through 1-12. LESSON OBJECTIVES After completing this lesson, you should be able to: 1-1. Identify electrocardiogram rhythms. 1-2. Identify normal sinus rhythm. 1-3. Identify the following cardiac dysrhythmias: Sinus bradycardia. Sinus tachycardia. Wandering pacemaker. Premature atrial contractions. Atrial tachycardia. Atrial flutter. Atrial fibrillation. Premature junctional contraction. First-degree heart block. Wenckebach heart block. Classical second-degree heart block. Complete heart block. Premature ventricular contractions. Ventricular tachycardia. Ventricular fibrillation. Idioventricular rhythm. Asystole. SUGGESTION After completing the assignment, complete the exercises at the end of this lesson. These exercises will help you to achieve the lesson objectives.

MD0571 1-2
LESSON 1
DYSRHYTHMIA RECOGNITION
Section I. DYSRHYTHMIA 1-1. INTRODUCTION a. Dysrhythmia is a disturbance in cardiac rhythm. Ninety percent of patients with acute myocardial infarction (heart attack) will experience a form of cardiac dysrhythmia during the first couple of weeks after their attack. Half of these will be life threatening and will lead to cardiac arrest (sudden stoppage of adequate cardiac output) unless properly treated. In order to analyze and treat a dysrhythmia correctly, you must have a systematic approach to the electrocardiogram (EKG). Only after this process has been completed can you make sound judgments as to which cardiac drug to administer and when to defibrillate or use cardioversion. b. When monitoring a patient's EKG, remember that you are monitoring electrical activity of a heart, not mechanical activity. A pulse is always taken to assure you of the heart's pumping action. Information learned from the EKG will be used to help determine the treatment of the dysrhythmia. Dysrhythmia treatment could be defibrillation, cardioversion, intravenous cardiac drugs, and/or cardiopulmonary resuscitation (CPR).
DYSRHYTHMIA = a disturbance in cardiac rhythm ELECTROCARDIOGRAM = monitors electrical activity of the heart
1-2. DYSRHYTHMIA CAUSES/SIGNIFICANCE a. Causes of Dysrhythmia. Dysrhythmias develop for various reasons, including acute myocardial infarction (heart attack), trauma, and drug reactions. Drowning, near drowning, asphyxiation, and the patient's underlying medical conditions can also cause dysrhythmias. b. Significance of Dysrhythmia. There are several reasons why cardiac dysrhythmias may be clinically significant. Heart rates below 40 to 50 beats per minute lead to inadequate cardiac output and often precede electric instability of the heart. If the sinus rate falls below 60 beats per minute, another conduction system may take over. The atrial-ventricular junction (AV junction) has an inherent rate of 40 to 60 beats a minute. The ventricle has an inherent rate of 20 to 40 beats a minute. This may lead to premature ventricular contractions and ventricular dysrhythmias. If a heart rate is

MD0571 1-3
over 120 to 140 beats per minute, the heart must work harder. This causes further myocardial ischemia (diminished blood flow). Tachycardia may be linked with a drop in cardiac output which is secondary to decreased stroke volume, this lowered volume being caused by the ventricles having less time to fill between heartbeats. Finally, ectopic beats (beats located away from the normal position) could be a sign of electric instability of the ventricles. Such heartbeats are an important sign since they may indicate that more serious dysrhythmias, such as ventricular tachycardia or ventricular fibrillation, may develop.
Section II. ELECTROPHYSIOLOGY 1-3. GENERAL a. Heart Cells. Two types of cells are found in the heart -- electrical cells and mechanical cells (see figure 1-1). The heart's conduction system is made up of electrical cells. These cells have the ability to begin and transmit electrical activity in the heart. Myocardial cells (the mechanical cells) make up the bulk musculature of the heart. When an electrical stimuli reaches these cells, the cells contract. An electrical impulse stimulates the mechanical action of the heart causing the heart to pump effectively. If the electrical system of the heart does not function properly, arrhythmias (a mechanical activity) may occur.
Figure 1-1. Electrical cells and mechanical cells.

MD0571 1-4
b. Electrical Activity In The Heart. The heart's electrical activity begins in the sinoatrial (SA) node and flows toward the ventricles (see figure 1-2). The SA node is the heart's pacemaker. All the areas of this conduction system initiate impulses, become irritable, and respond to an impulse. Impulses are initiated in each area of the conduction system as shown below. SA Node...........60-100 per minute AV Junction......40-60 per minute Ventricle ...........20-40 per minute
Figure 1-2. Electrical conduction system of the heart. c. The Pacemaker Site. The common pacemaker site is the SA node because it initiates electrical impulses at a faster rate than the junction or ventricle. An impulse from the AV junction can take over if the SA node should fail. If the AV junction also fails, the ventricle can take over. This is a protective backup system, a system which helps the heart maintain electrical efficiency. Sometimes the junction or the ventricle becomes irritable and starts impulses at a faster than normal rate which overrides the SA node. When this happens, the pacemaker site that is the fastest dominates and takes over control of the heart.
MD0571 1-5
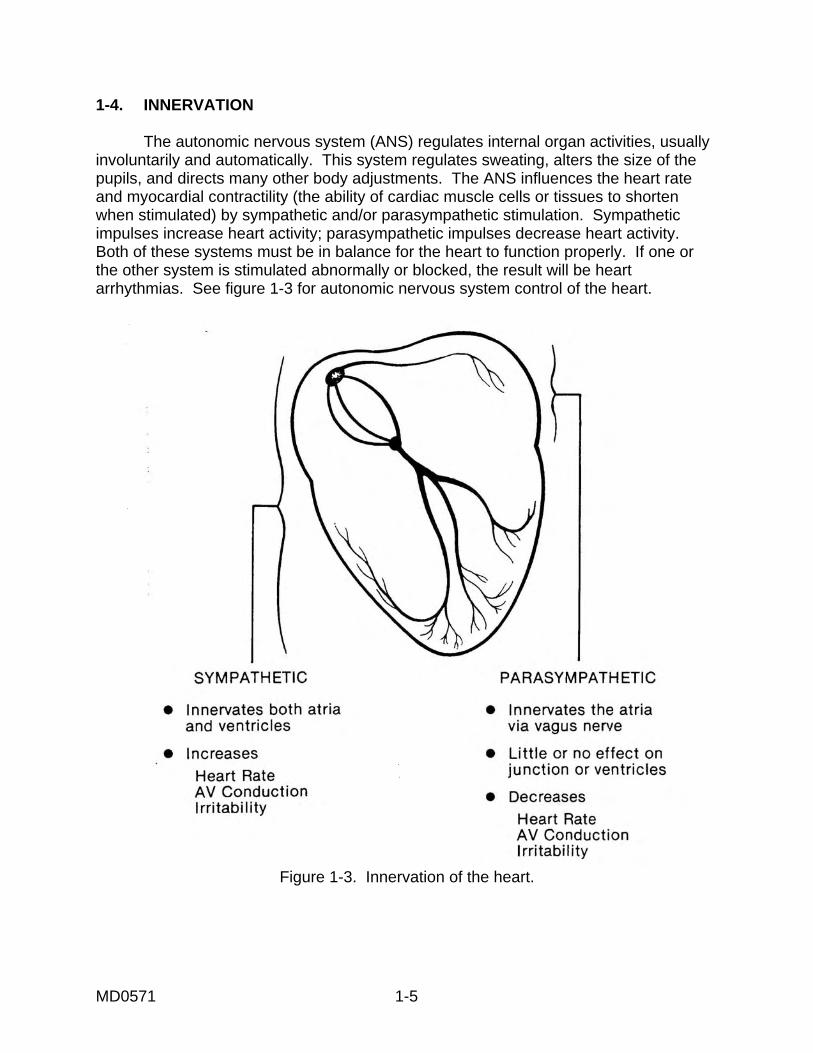
1-4. INNERVATION The autonomic nervous system (ANS) regulates internal organ activities, usually involuntarily and automatically. This system regulates sweating, alters the size of the pupils, and directs many other body adjustments. The ANS influences the heart rate and myocardial contractility (the ability of cardiac muscle cells or tissues to shorten when stimulated) by sympathetic and/or parasympathetic stimulation. Sympathetic impulses increase heart activity; parasympathetic impulses decrease heart activity. Both of these systems must be in balance for the heart to function properly. If one or the other system is stimulated abnormally or blocked, the result will be heart arrhythmias. See figure 1-3 for autonomic nervous system control of the heart.
Figure 1-3. Innervation of the heart.
MD0571 1-6
1-5. GRAPHIC DISPLAY OF ELECTROCARDIOGRAM a. Heart Electrical Forces. During the cardiac cycle (one contraction of the heart plus the relaxation period that follows), electrical changes take place in the heart. These changes can be visualized and recorded. (1) Detection of electrical forces in the heart. Electrical forces in the heart can be detected on the body's surface. Therefore, electrodes attached to the patient's skin can detect electrical forces in the heart. (2) Recording of electrical forces in the heart. The recording of the electrical changes during the cardiac cycle is called an electrocardiogram (ECG or EKG). The instrument used to record these changes is an electrocardiograph. b. Electrocardiogram Graph Paper and Machines. Electrocardiogram graph paper and the speed of the EKG machines are standard and uniform. Lines on the graph paper are horizontal and vertical with four light lines between two heavy lines. The horizontal lines indicate voltage. The electrical voltage of the heart impulse is measured in millivolts and determined by the magnitude of deflection (the power of a wave). (1) Determination of electrical impulse strength. Compare the height of a wave spike to the horizontal lines to determine the strength of the electrical impulse. (2) Vertical lines. Vertical lines indicate the speed of the electrical current traveling within the heart. The distance in time between two heavy vertical lines is 0.20 seconds and between two light vertical lines or across one small square is 0.04 seconds. (3) Heavy lines. Heavy lines are necessary to determine rates, rules, and normal values. Light lines are composed of five small columns between two heavy vertical lines. (4) Squares. There are 25 squares in each large square. (5) Standard rate of EKG paper. The standard rate of EKG paper travels past the stylus at a rate of millimeters per second. (6) Graph paper markings. The markings on the graph paper can be examined and compared to normal markings to give the reader an idea of the electrical activity of the patient's heart. See figure 1-4 for an example of standard EKG graph paper measurements.
MD0571 1-7
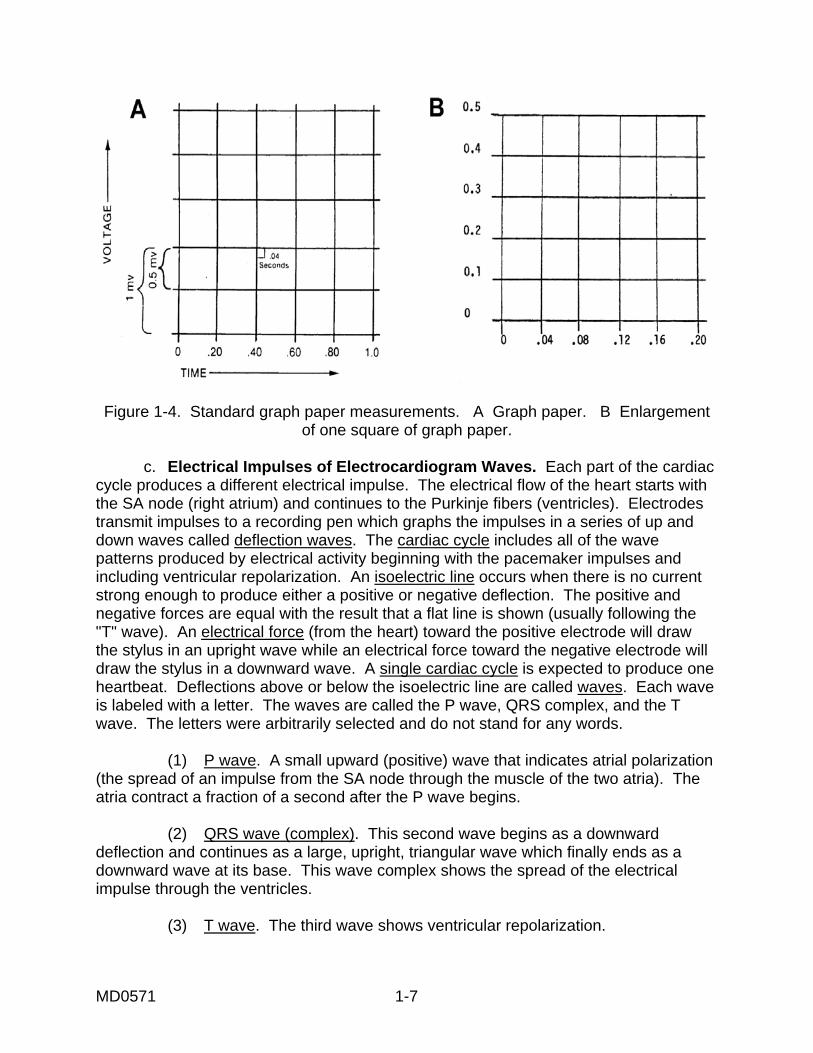
Figure 1-4. Standard graph paper measurements. A Graph paper. B Enlargement
of one square of graph paper. c. Electrical Impulses of Electrocardiogram Waves. Each part of the cardiac cycle produces a different electrical impulse. The electrical flow of the heart starts with the SA node (right atrium) and continues to the Purkinje fibers (ventricles). Electrodes transmit impulses to a recording pen which graphs the impulses in a series of up and down waves called deflection waves. The cardiac cycle includes all of the wave patterns produced by electrical activity beginning with the pacemaker impulses and including ventricular repolarization. An isoelectric line occurs when there is no current strong enough to produce either a positive or negative deflection. The positive and negative forces are equal with the result that a flat line is shown (usually following the "T" wave). An electrical force (from the heart) toward the positive electrode will draw the stylus in an upright wave while an electrical force toward the negative electrode will draw the stylus in a downward wave. A single cardiac cycle is expected to produce one heartbeat. Deflections above or below the isoelectric line are called waves. Each wave is labeled with a letter. The waves are called the P wave, QRS complex, and the T wave. The letters were arbitrarily selected and do not stand for any words. (1) P wave. A small upward (positive) wave that indicates atrial polarization (the spread of an impulse from the SA node through the muscle of the two atria). The atria contract a fraction of a second after the P wave begins. (2) QRS wave (complex). This second wave begins as a downward deflection and continues as a large, upright, triangular wave which finally ends as a downward wave at its base. This wave complex shows the spread of the electrical impulse through the ventricles. (3) T wave. The third wave shows ventricular repolarization.

MD0571 1-8
NOTE: There is no deflection to show atrial repolarization because the stronger QRS wave masks this event. NOTE: Figure 1-5 shows EKG wave patterns produced by the electrical activity of the heart.
Figure 1-5. Electrocardiogram wave patterns produced by electrical activity in the heart.

MD0571 1-9
d. Size and Time Intervals of EKG Waves. The size of the deflection waves and particular time intervals are important when you are reading an electrocardiogram. For example, the duration of a normal "P" wave is between 0.06 and 0.1 seconds, the time it takes for depolarization current to pass through the atrial musculature. An increased width of "P" wave may indicate left atrial abnormality or right atrial hypertrophy (enlargement). The deflection of a normal "P" wave is small due to the thin walled structure of the atria. A "P" wave is usually no more than 3 mm high. A taller "P" wave may indicate that atrial enlargement has occurred due to hypertension, coronary pulmonade, or congenital heart disease. (1) P-R interval. Measured from the beginning of the P wave to the beginning of the R wave, this wave pattern represents the conduction time from the beginning of atrial excitation to the beginning of ventricular excitation. This is the time it takes for an electrical impulse to travel through the atria and atrioventricular node to the remaining conducting tissues. A medical condition that disrupts this electrical impulse will display itself as a P-R interval that is longer than 0.2 seconds due to the increased time it takes to travel the conducting tissues. The normal P-R interval is between 0.12 and 0.20 seconds. (2) Q wave. The Q wave is defined as the first down (negative) deflection following the P wave but coming before the R wave. (3) QRS complex. This complex is made up of three waves: the Q, the R, and the S waves. The QRS complex represents ventricular depolarization. A normal QRS measurement is less than 0.12 seconds. The QRS complex is larger than the P wave on an EKG because ventricular depolarization involves a greater muscle mass than atrial depolarization. (4) R wave. The R wave is the first upward (positive) deflection that follows the Q wave. (5) S-T segment. Beginning at the end of the S wave ending at the beginning of the T wave, this wave represents the time between the end of the spread of the heart's electrical impulse through the ventricles and repolarization of the ventricles. When a patient has acute myocardial infarction, the S-T segment is elevated. When the heart muscle does not receive enough oxygen, the S-T segment is depressed. (6) T wave. Representing repolarization of the ventricular cells, the T wave is flat when the heart muscle does not receive enough oxygen; for example, in atherosclerotic heart disease. When the body's potassium level is increased, the T wave may be elevated. This wave occurs after the QRS complex. NOTE: Refer to figure 1-6 to see these waves.

MD0571 1-10
Figure 1-6. EKG wave, segment, and internal definitions. (7) The refractory period. During this period, cell charges are depolarized and have not returned to their polarized state. A cell that is electrically "refractory" cannot receive another impulse until it is repolarized. The refractory period on an EKG includes the QRS complex and the T wave. The absolute refractory period includes the QRS and the upslope of the T wave and is NOT a dangerous period. The relative refractory period may allow depolarization of ventricles. This period occurs on the downslope of the T wave; it is dangerous if an impulse occurs at this time.

MD0571 1-11
e. Electrocardiogram Uses. The EKG has a variety of uses; for example, abnormal cardiac rhythms and conduction patterns and following the course of recovery from a heart attack. Some people carry a Holter monitor to monitor heart electrical activity. This machine can be carried around by the patient while he goes about his everyday routines. The Holter monitor is especially useful in detecting rhythm disorders in the conduction system. It is also useful in correlating rhythm disorders and symptoms and then following the effectiveness of drugs in dealing with these disorders.
Section III. RHYTHMS/HEART BLOCKS 1-6. ANALYSIS OF EKG RHYTHM STRIPS a. Regularity. (1) Determine regularity (also called rhythm) by looking at the R to R interval (RRI). This interval can be regular or irregular. (2) The R-R interval is constant for regular rhythm, which means the distance between the beats, is the same. See figure 1-7 for an example of regular rhythm.
Figure 1-7. Regular rhythm. (3) If the R to R interval (RRI) is inconsistent and the rhythm is irregular, the heartbeats are premature. A basically regular rhythm occurs when a heartbeat or two interrupt a regular rhythm; for example, ectopic (heartbeats originating from an abnormal place; that is, from somewhere other than the S-A node) or grouped heartbeats. A regularly irregular rhythm is a pattern of irregularity. A totally irregular rhythm has no pattern at all. See figure 1-8 for an example of irregular rhythm.

MD0571 1-12
Figure 1-8. Irregular rhythm. b. Rate. (1) Rate for regular heartbeat rhythms can be calculated in two ways. (a) Method I. The most accurate method is to count the number of small squares between the two R waves and divide that number into 1500. (b) Method II. The faster method is to count the number of large squares between R waves and divide that number into 300. This method is useful during an emergency. This method does not require a 6-second strip. Also, it allows rapid rate calculation using simple memorization of rate for large boxes. (2) The heartbeat rate for irregular heartbeat rhythm is based on the 6-second strip method. The minimum amount of time needed to determine cardiac rhythm is 6 seconds. The method described here is the quickest and easiest method although it is not as accurate as the "box" method. The vertical notches in the upper margin of the paper are 3 seconds apart. (a) Count the number of QRS complexes in a 6-second strip. See figure 1-9. (b) Multiply by 10 to get the heart rate for one minute.

MD0571 1-13
Figure 1-9. Calculation of heartbeat rate. c. P Waves. P waves are small positive deflections that occur on the oscilloscope. These waves represent atrial depolarization. Normally, the P waves are rounded, uniform, and upright and come before the QRS complex. These waves are either regular or irregular. Measured distances between all P waves should be constant. Determine whether there is a P wave for every QRS complex. Determine whether the P wave is in front of the QRS complex and see if there are more P waves than QRS complexes. Check to see if all the P waves look alike. See if there are irregular P waves associated with ectopic or irregular beats. d. P-R Intervals. All P-R intervals should be constant. Measure the P-R intervals to determine if the intervals are normal or abnormal. A normal P-R interval is from 0.12 to 0.20 seconds. If the P-R interval varies, notice if there is a pattern to the changing measurements. e. QRS Complexes. These complexes represent ventricular depolarization. The QRS complexes should be of equal duration. (1) An QRS example is shown in figure 1-10. An analysis of the parts of the QRS complex is given below. (a) Q waves are a negative deflection on the oscilloscope. They follow the P waves. (b) R waves are a positive deflection on the oscilloscope, and they follow the Q waves. (c) S waves are a negative deflection on the oscilloscope following the R waves.

MD0571 1-14
Figure 1-10. Electrocardiograph waves, segments, and intervals. (2) Check the measurement of the QRS complex. The complex should be less than 0.12 seconds. See if the measurement is within normal limits. See if all the QRS complexes look alike. If there are any unusual QRS complexes, determine if they are associated with ectopic beats (abnormal heartbeats). Figure 1-11 shows an example of an abnormal QRS.
Figure 1-11. QRS complexes. NOTE: For instructional purposes, the lines on the figures showing heartbeats are sometimes heavier than normal.

MD0571 1-15
1-7. CARDIAC RHYTHMS a. Normal Sinus Rhythm (NSR). (1) Normal sinus rhythm originates in the SA node (pacemaker) and travels through the normal conduction pathways. It is not an arrhythmia (abnormality in the normal cardiac rhythm) or dysrhythmia (a disturbance in cardiac rhythm) because it is a normal pattern. See figure 1-12. (2) Normal sinus rhythm is analyzed in this manner: (a) When the R-R intervals and the P-P intervals are constant, the rhythm is considered regular. (b) The atrial and ventricular rates equal 60 to 100 heartbeats per minute with no added or lost P, QRS, or T waves. (c) The P wave has a uniform configuration with one P wave in front of every QRS. (d) The P-R interval is constant between 0.12 and 0.20 seconds. (e) The QRS complex measures less than 0.12 seconds.
Figure 1-12. Normal sinus rhythm.

MD0571 1-16
b. Sinus Bradycardia. The analysis of sinus bradycardia is given below and an example shown in figure 1-13. (1) The rhythm is regular with the R-R intervals constant and the P-P intervals constant. (2) The atrial and ventricular rates are less than 60 beats per minute. (3) The P wave is normal and upright with one P wave in front of every QRS complex. (4) The P-R interval is constant between 0.12 and 0.20 seconds. (5) The QRS complex measures less than 0.12 seconds. (6) A heart rate of less than 60 beats per minute may indicate good physical conditioning if the individual is young and healthy. (7) If the person is suffering from acute myocardial infarction (AMI), this heartbeat rate may indicate any one of the following: conduction system damage, increased parasympathetic tone, or possible toxic levels of certain cardiac drugs (digitalis, quinidine). If the heartbeat rate decreases to less than 50 beats per minute, the heart may not be able to pump enough fluid through the body's vital organs. Additionally, bradycardia leads to electrical instability in the ventricles, possibly resulting in ventricular arrhythmias. NOTE: Males normally have a slower heart rate than females. Cardiovascularly healthy people may normally have a slow (less than 60 beats per minute) heart rate which also normally slows during sleep and rest. A slow heart rate is significant only if it is associated with MI or cardiovascular compromise.
Figure 1-13. Sinus bradycardia.
MD0571 1-17
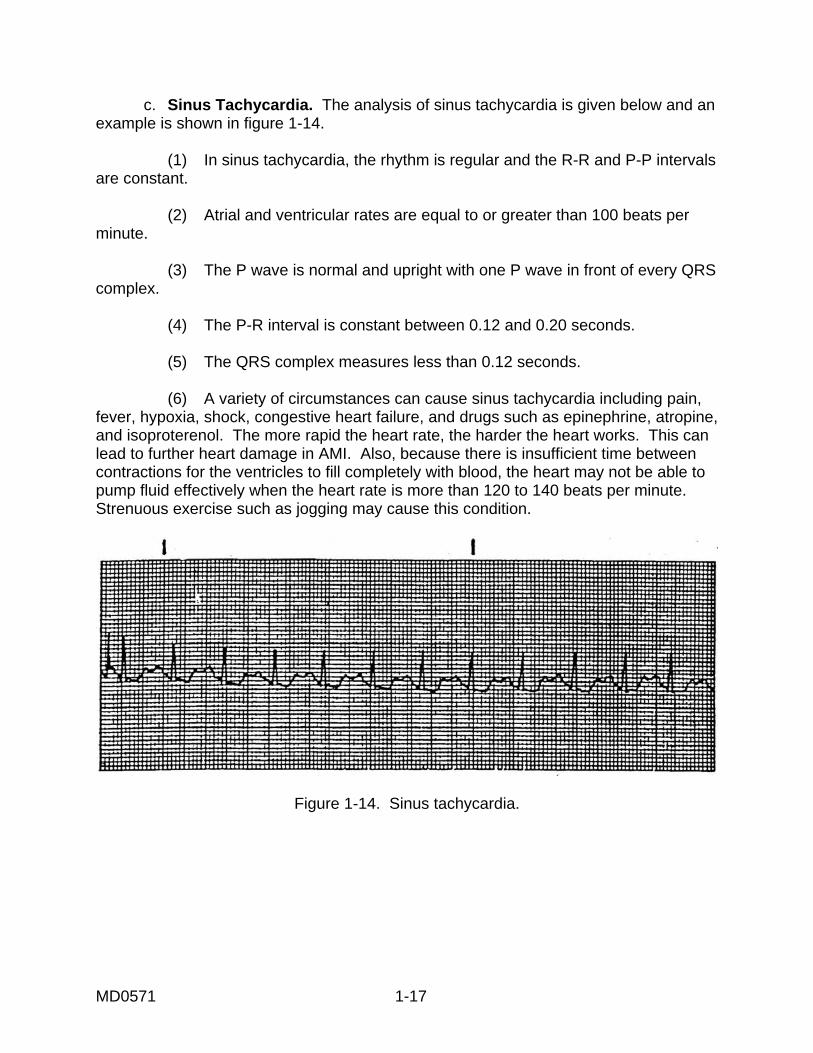
c. Sinus Tachycardia. The analysis of sinus tachycardia is given below and an example is shown in figure 1-14. (1) In sinus tachycardia, the rhythm is regular and the R-R and P-P intervals are constant. (2) Atrial and ventricular rates are equal to or greater than 100 beats per minute. (3) The P wave is normal and upright with one P wave in front of every QRS complex. (4) The P-R interval is constant between 0.12 and 0.20 seconds. (5) The QRS complex measures less than 0.12 seconds. (6) A variety of circumstances can cause sinus tachycardia including pain, fever, hypoxia, shock, congestive heart failure, and drugs such as epinephrine, atropine, and isoproterenol. The more rapid the heart rate, the harder the heart works. This can lead to further heart damage in AMI. Also, because there is insufficient time between contractions for the ventricles to fill completely with blood, the heart may not be able to pump fluid effectively when the heart rate is more than 120 to 140 beats per minute. Strenuous exercise such as jogging may cause this condition.
Figure 1-14. Sinus tachycardia.

MD0571 1-18
1-8. ATRIAL RHYTHMS a. Identification. The sinus node loses its pacemaking role, and the site with the fastest rate becomes the pacemaker. In this case, the atria is the fastest pacemaker and takes over the pacemaking role. The P wave configuration of atrial rhythms may be flattened, notched, peaked, sawtoothed, diphasic, or upright. The QRS complexes are narrow. Atrial arrhythmia may be caused by irritability of the heart or escape mechanisms of the heart. NOTE: An escape mechanism is defined as an impulse from somewhere along the
conduction pathway that "escapes" to emit an electrical impulse of its own. This electrical impulse stimulates an otherwise electrically quiet heart.
b. Wandering Pacemaker. Analysis of wandering pacemaker is given below and an example is shown in figure 1-15. The rhythm is slightly irregular with a normal heartbeat rate of from sixty to one hundred beats per minute. The P wave may change from heartbeat to heartbeat. The PR interval is less than 0.20 of a second and may vary. The QRS is less than 0.12 of a second. If the cardiac output falls, sympathomimetic or parasympatholytic drugs can be given.
Figure 1-15. Wandering pacemaker.
MD0571 1-19
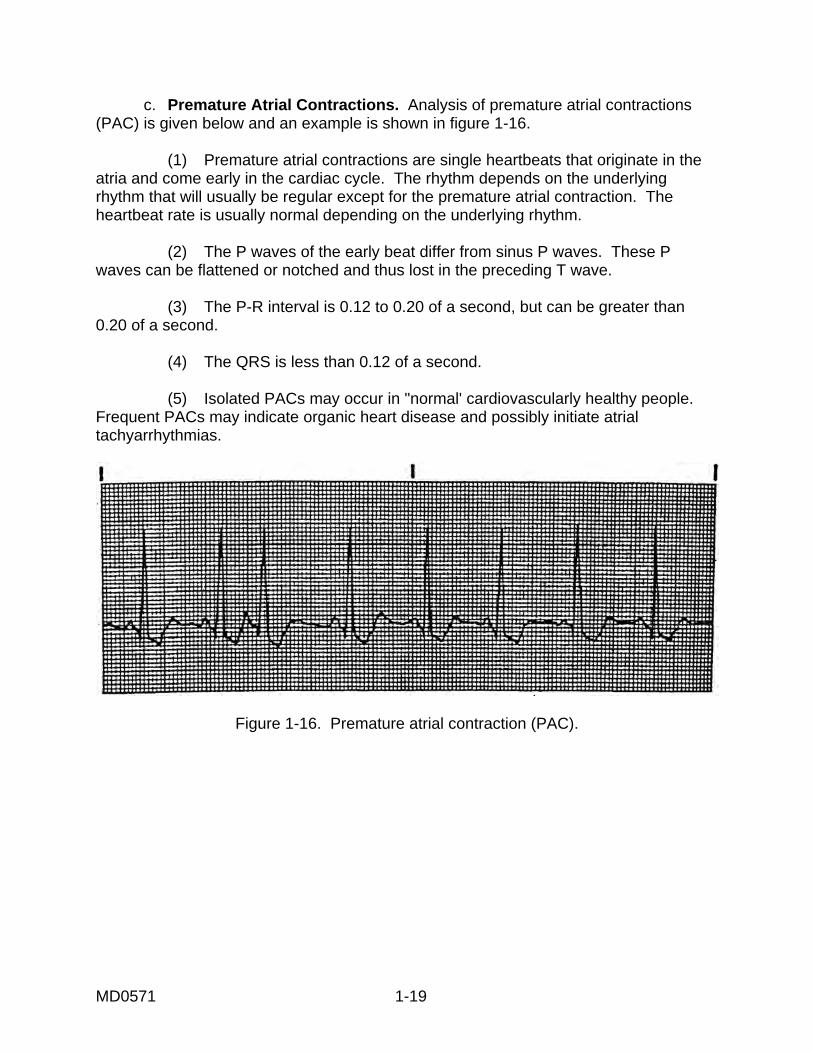
c. Premature Atrial Contractions. Analysis of premature atrial contractions (PAC) is given below and an example is shown in figure 1-16. (1) Premature atrial contractions are single heartbeats that originate in the atria and come early in the cardiac cycle. The rhythm depends on the underlying rhythm that will usually be regular except for the premature atrial contraction. The heartbeat rate is usually normal depending on the underlying rhythm. (2) The P waves of the early beat differ from sinus P waves. These P waves can be flattened or notched and thus lost in the preceding T wave. (3) The P-R interval is 0.12 to 0.20 of a second, but can be greater than 0.20 of a second. (4) The QRS is less than 0.12 of a second. (5) Isolated PACs may occur in "normal' cardiovascularly healthy people. Frequent PACs may indicate organic heart disease and possibly initiate atrial tachyarrhythmias.
Figure 1-16. Premature atrial contraction (PAC).

MD0571 1-20
d. Atrial Tachycardia. Analysis of atrial tachycardia (AT) is given below and an example is shown in figure 1-17. (1) Atrial tachycardia (AT) is caused when a single focus in the atria fires very rapidly and overrides the SA node. (2) The rhythm is regular and the heartbeat rate is 150 to 250 beats per minute. (3) The atrial P wave differs from the sinus P wave and can be lost in the preceding T wave. (4) The PR interval is 0.12 to 0.20 of a second with the QRS less than 0.12 of a second. (5) There are two forms of clinical atrial tachycardia: paroxysmal AT/supraventricular tachycardia (PAT/PSVT) and nonparoxysmal AT. (a) Paroxysmal AT/supraventricular tachycardia is characterized by repeated episodes of atrial tachycardia. The episodes may begin abruptly and last from a few seconds to many hours. (b) Nonparoxysmal atrial tachycardia is an abnormal heart problem that is secondary to some other problem.
Figure 1-17. Atrial tachycardia.

MD0571 1-21
e. Atrial Flutter. Analysis of atrial flutter is given below and an example is shown in figure 1-18. (1) Atrial rhythm is regular if the PP intervals are constant. (2) The ventricular rhythm is regular if the AV node conducts impulses in a constant pattern. The ventricular rhythm is irregular if the AV node varies the pattern. (3) In regard to the heartbeat rate, the atrial rate is 250 to 350 heartbeats per minute. The ventricular heartbeat rate depends on the ratio of impulses conducted to the ventricles. (4) The P waves have well defined "flutter" waves and a sawtooth appearance. (5) The P-R interval is not measured (impossible to determine). (6) The QRS complex is less than 0.12 seconds.
Figure 1-18. Atrial flutter. f. Atrial Fibrillation. Analysis of atrial fibrillation is given below and examples are shown in figures 1-19 and 1-20. (1) In atrial fibrillation, the rhythm is irregularly irregular. (2) The atrial rhythm is unmeasurable and the R-R interval is irregularly irregular (ventricular). In regard to the heartbeat rate, the atrial rate is unmeasurable. (3) If the ventricular rate is less than 100 beats per minute, it is controlled. If the ventricular rate is greater than 100 beats per minute, it has a rapid ventricular response that is uncontrolled. (4) There is either no P wave or there are fibrillatory P waves in which case there is no depolarization of atria, and the waves at the baseline have chaotic undulations.

MD0571 1-22
(5) The P-R interval cannot be measured. (6) The QRS complex is less than 0.12 seconds. (7) Atrial fibrillation is usually the result of underlying heart disease. Occasionally, this problem may occur in a normal patient or in patients with MI, especially if SA node infarction occurs. Rapid ventricular response reduces ventricular filling decreasing the stroke volume.
Figure 1-19. Atrial fibrillation (slow).
Figure 1-20. Atrial fibrillation (rapid). 1-9. JUNCTIONAL RHYTHMS a. General Information. Junctional arrhythmias create an inverted P wave because the atria are depolarized by the retrograde conduction. These abnormal conditions will depolarize the ventricles in the normal manner (normal QRS). An inverted P wave can occur before, during, or after the QRS complex. All junctional rhythms will create an inverted P wave, but some low atrial impulses can also cause inverted P waves.

MD0571 1-23
b. Premature Junctional Contraction. Analysis of premature junctional contraction (PJC) is given below and an example is shown in figure 1-21. (1) Premature junctional contraction is another form of heart abnormality. This condition occurs when a small region of the heart becomes more excitable than normal. This causes an occasional abnormal impulse to be generated between the normal impulses. The abnormal impulse is generated from the region of the heart called the ectopic focus. A wave of depolarization spreads out from the ectopic focus and causes a premature contraction. The regularity depends on the regularity of the underlying rhythm and the rate depends on the rate of the underlying rhythm. (2) P waves will be inverted and can fall before, during, or after the QRS complex. (3) The PR interval can only be measured if the P wave precedes the QRS Complex. (4) The QRS complex lasts less than 0.12 of a second. What happens is that the AV node takes over the pacemaking function. NOTE: The normal inherent rate of atrial ventricular junction is 40 to 60 beats per minute. If higher pacemaker sites fail, a junctional escape pacemaker might take control of the heart. The rhythm would then be called a junctional escape rhythm. Inherent rates are as follows: atria--75 beats/minute; AV node -- 60 beats/minute; ventricles--40 to 60 beats per minute; and normal heart rate -- 60 to 100 beats per minute.
Figure 1-21. Premature junctional contractions (PJC).

MD0571 1-24
1-10. HEART BLOCKS a. General Information. Heart blocks are arrhythmias caused by conduction disturbances at the AV node. b. First-Degree (Incomplete) Heart Block. The first-degree heart block takes place where there is an incomplete block. Analysis of first degree heart block is given below and an example is shown in figure 1-22. (1) The regularity and rate depend on the underlying rhythm of the heart. (2) The P waves are upright and uniform and followed by the QRS complex. (3) The PR interval is constant and greater than 0.20 seconds. (4) The QRS complex is less than 0.12 seconds.
Figure 1-22. First degree (incomplete) heart block. c. Wenckebach (Second-Degree Heart Block/Mobitz Type I). This condition is a less serious type of second-degree heart block. It is, however, still quite common in patients with acute myocardial infarction. The condition may be produced by digitalis. Analysis of second degree heart block (Mobitz Type I) is given below and an example is shown in figure 1-23. (1) The rhythm is irregular, and the R-R interval gets progressively shorter as the P-R intervals get longer. (2) Grouped beating is characteristic. (3) The heartbeat rate is usually slightly slower than normal. (4) P waves are upright and uniform, but some P waves are not followed by QRS complexes.

MD0571 1-25
(5) The P-R interval progressively lengthens until one P wave is not conducted. (6) The QRS complex lasts less than 0.12 of a second.
Figure 1-23. Wenckebach (second-degree heart block/Mobitz Type I). d. Classical Second-Degree Heart Block (Mobitz Type II). Analysis of second degree heart block (Mobitz Type II) is given below and an example is shown in figure 1-23. (1) The rhythm is regular if the conduction ratio is constant; however, the rhythm is irregular if the conduction ratio varies. (2) The rate for atrial is usually normal and the ventricular rate is usually bradycardia. (3) P waves are upright and uniform with more P waves than QRS complexes (usually a ratio of 2:1, 3:1, and so forth.). (4) The P-R interval is constant on conducted beats, but it may be longer than normal.
Figure 1-24. Classical second-degree heart block (Mobitz Type II).

MD0571 1-26
e. Complete Heart Block (Third-Degree). Analysis of third degree heart block is given below and an example is shown in figure 1-25. (1) The rhythm is regular with PP and RR intervals constant. (2) The atrial rate is normal, but the ventrical response rate varies in this way. The junction focus has a rate of 40 to 60 beats per minute. The ventrical focus has a rate of 20 to 40 beats per minute. (3) P waves are upright and uniform with more P waves than QRS complexes. (4) There are no PR intervals because the P waves have no relationship to QRS complexes. Occasionally, a P wave is superimposed on a QRS complex. (5) The QRS complex is less than 0.12 seconds at the junctional focus and greater than 0.12 seconds at the ventricular focus. (6) Cardiac output may be greatly diminished if the heart rate is below 35 to 50 beats per minute. Additionally, in third-degree heart block, the atria and ventricles are no longer synchronized; therefore, the ventricles do not fill completely before each contraction, causing cardiac output to be even further reduced. The ventricular rate may be so slow that circulation cannot be maintained and syncope (congestive heart failure) or angina may occur.
Figure 1-25. Complete heart block.

MD0571 1-27
1-11. VENTRICULAR ARRHYTHMIAS. a. General. Ventricular arrhythmias are the most serious arrhythmias. The definition of arrhythmia is an abnormality in the rate, rhythm, or conduction of the heartbeat. A heartbeat irregularity may be an indication of some disease or a normal response to the body's activity. Arrhythmias are classified on the basis of the site of origin of the arrhythmia: SA node, atria, AV node, or ventricle. As with some heart blocks, the QRS complex measurement is equal to or greater than 0.12 seconds. A QRS of less than 0.12 seconds indicates a supraventricular pacemaker. If the QRS is 0.12 seconds or greater, the problem could be ventricular or supraventricular with ventricular conduction defect. All ventricular arrhythmias will have a QRS complex of 0.12 seconds or greater. The reason that ventricular rhythms are the most serious arrhythmias is that the heart is less effective than usual and is functioning on its last level of backup support. Four types of ventricular arrhythmias will be covered here -- premature ventricular contractions, ventricular tachycardia, ventricular fibrillation, and idioventricular rhythm. b. Premature Ventricular Contractions. Examples are shown in figures 1-26 through 1-30. (1) Analysis. A premature ventricular contraction (PVC) is a single ectopic (heartbeat arising from a place other than the SA node) caused by irritable focus in the ventricles. The heartbeat comes earlier than expected and interrupts the regularity of the underlying rhythm of the heart. The heartbeat rate is determined by the underlying heartbeat rhythm, PVCs not being included in the rate. P waves will not come before an ectopic heartbeat; however, P waves may be seen near a premature ventricular contraction. Since the heartbeat comes from a lower focus, there will be no P-R interval. The QRS complex will be wide and bizarre (at least 0.12 or more of a second). The T wave is usually in the opposite direction from the R wave. Premature ventricular contractions may be quite serious, particularly in certain combinations and in the wake of acute myocardial infarction. Dangerous signs include frequent PVCs, runs of PVCs, multifocal PVCs, and the R-on-T phenomenon. In a perfectly healthy person, PVCs may not always be considered an abnormality; however, if the casualty is experiencing acute myocardial infarction, PVCs must be treated instantly. (2) Characteristics. The following are characteristic of premature ventricular contractions. (a) A compensatory pause usually follows a PVC. The distance between the R wave of complex preceding the PVC and the R wave of complex following the PVC is exactly twice the R-R interval of underlying rhythm. (b) The PVC does not have to have a compensatory pause. The beat can be "interpolated" between two sinus beats without interrupting the underlying rhythm.

MD0571 1-28
(c) Premature ventricular contractions indicate myocardial irritability. The frequency of PVCs suggests the degree of myocardial irritability. (d) Premature ventricular contractions are considered unifocal if they all originate from a single ventricular focus and have similar configurations. (e) Premature ventricular contractions are considered multifocal if they original from many different points and have different configurations. (f) If a PVC occurs during a vulnerable (relative refractory) phase of the cardiac cycle, the PVC can produce lethal, repetitive arrhythmias. A PVC that falls on the downslope of a T wave is referred to as "R-on-T" phenomenon and is considered very dangerous. (g) With increasing irritability, PVCs can occur in pairs called couplets or in runs of three or more consecutive ectopics (ectopic heartbeat originating from a place other than the SA node). (h) Premature ventricular contractions frequently occur in patterns such as the following: 1 Bigeminy--a PVC every other heartbeat. 2 Trigeminy--a PVC every third beat. 3 Quadrigeminy--a PVC every fourth beat. NOTE: Bigeminy, trigeminy, and quadrigeminy can also describe patterns of premature atrial contractions (PACS) and premature junctional contractions (PJCs).

MD0571 1-29
Figure 1-26. Frequent premature ventricular contractions.
Figure 1-27. Runs of premature ventricular contractions.
Figure 1-28. Multifocal premature ventricular contractions.

MD0571 1-30
Figure 1-29. Runs of premature ventricular contractions with short run of ventricular tachycardia.
Figure 1-30. R-on-T phenomenon ending in ventricular fibrillation. c. Ventricular Tachycardia. Analysis of ventricular tachycardia (VT) is given below and an example is shown in figure 1-31. Ventricular tachycardia is serious and dangerous. It may be the precursor of ventricular fibrillation. If VT persists, there may be a marked reduction in cardiac output. (1) The rhythm of the heart is usually regular, but the rhythm can be slightly irregular. (2) The heartbeat rate is from 150 to 250 beats per minute. The rate can exceed 250 beats per minute of the heart rhythm progressing to ventricular flutter. Occasionally, the rate may be slower than 150 beats per minute; the condition is then termed slow ventricular tachycardia (VT). (3) P waves are not normally seen; however, dissociated waves may be seen. The focus is in the ventricles, and there will be no PR interval.

MD0571 1-31
(4) The QRS complex is wide and bizarre. The complex may be 0.12 of a second or greater. (5) The T wave is usually in the opposite direction from the R wave.
Figure 1-31. Ventricular tachycardia. d. Ventricular Fibrillation. Analysis of ventricular fibrillation is given below and examples are shown in figures 1-32 and 1-33. (1) The rhythm, rate, P waves, P-R interval, and QRS complex are totally chaotic with no discernible waves or complete complexes in this abnormality. (2) The ventricles fire in a totally disorganized fashion and, instead of beating, the ventricular muscle quivers. Consequently, there is no cardiac output and the ventricular fibrillation is the same as death. The casualty is clinically dead. Normal heart rhythm must be restored within a few minutes or biologic death follows. (3) When you see a rhythm on the monitor that resembles ventricular fibrillation, check quickly to be sure this pattern is not caused by muscle tremor, loose leads, or patient movement artifact.
Figure 1-32. Ventricular fibrillation (fine).

MD0571 1-32
Figure 1-33. Ventricular fibrillation (coarse). e. Idioventricular Rhythm. Analysis of idioventricular rhythm is given below and an example is shown in figure 1-34. (1) The rhythm is usually regular, but can be unreliable, since the rhythm of the heart is at such a low site. (2) There is no P wave nor P-R interval. (3) The QRS complex is wide and bizarre and 0.12 second or greater. The escape rhythm has taken over the pacemaking responsibility.
Figure 1-34. Idioventricular rhythm.

MD0571 1-33
1-12. ASYSTOLE a. Analysis. A straight line on the electrocardiogram indicates an absence of electrical activity by the heart: no regularity, rate, P waves, P-R interval, or QRS complex. The casualty is clinically dead. He has no effective cardiac output. Normal rhythm must be restored within a few minutes by appropriate treatment. b. Example. An example of asystole (cardiac standstill) is shown in figure 1-35.
Figure 1-35. Asystole (cardiac standstill).
Continue with Exercises
MD0571 1-34
EXERCISES, LESSON 1 INSTRUCTIONS: The following exercises are to be answered by writing the answer in the space provided. After you have completed all the exercises, turn to "Solutions to Exercises" at the end of the lesson and check your answers. 1. When you are calculating regular rhythms, the most accurate method is to count the number of small squares between _____________________ and divide that number into 1500. 2. The rate for irregular rhythm is based on the ______________ strip method. 3. In atrial polarization, the P waves seen on the oscilloscope indicate ___________________________________ deflections. (small or large) (positive or negative) 4. Q waves occurring on the oscilloscope are ____________________ deflections. 5. The rhythm for sinus bradycardia is __________________ with the PR intervals ___________________ and the PP intervals _________________________. 6. The casualty's heartbeat rhythm is regular (RRI and PPI are constant). The atrial and ventricular waves are equal to or greater than 100 beats per minute. The P wave is uniform with one P wave appearing in front of every QRS complex. The P-R interval is constant between 0.12 and 0.20 seconds. The QRS measures less than 0.12 seconds. Which cardiac dysrhythmia is the casualty suffering from? _______________________________________________ 7. In the case of atrial rhythms, the sinus node loses its pacemaking role, and the site with the ________________________________ becomes the pacemaker.

MD0571 1-35
8. A single focus in the atria fires very rapidly and overrides the SA node. The name of this atrial rhythm is _________________________________. 9. Premature junctional contraction (PJC) occurs when a small region of the heart becomes _____________________________________. 10. What is the general cause of heart blocks? ______________________________ 11. A premature ventricular contraction (PVC) is a single ectopic heartbeat which comes earlier than expected and _________________________ the regularity of the underlying rhythm of the heart. 12. A characteristic of ventricular fibrillation (VF) is that the ventricles of the heart fire in a ______________ instead of beating, the ventricular muscle _____________. 13. Another name for cardiac standstill is _______________________________. 14. List five atrial rhythms dealt with in this lesson. a. _______________________________________. b. _______________________________________. c. _______________________________________. d. _______________________________________. e. _______________________________________.
Check Your Answers on Next Page

MD0571 1-36
SOLUTIONS TO EXERCISES, LESSON 1 1. Two R waves. (para 1-6b(l)(a)) 2. Six second. (para 1-6b(2)) 3. Small. Positive. (para 1-5c(l)) 4. Negative. (para 1-5d(2)) 5. Regular. Constant. Constant. (para 1-7b(l)) 6. Sinus tachycardia. (para 1-7c) 7. Fastest rate. (para 1-8a) 8. Atrial tachycardia (AT). (para 1-8d) 9. More excitable than normal. (para 1-9b(1)) 10. Conduction disturbances at the AV node. (para 1-10a) 11. Interrupts. (para 1-11b(1) 12. Totally disorganized. Quivers. (para 1-11d(2)) 13. Asystole. (para 1-12b) 14. Wandering pacemaker. Premature atrial contractions (PACs). Atrial tachycardia. Atrial flutter. Atrial fibrillation. (paras 1-8b through f)
End of Lesson 1