carbonaceous particulate matter in the alveolar macrophage and … · 2017. 6. 20. · reginaldo....
TRANSCRIPT

Michele Galhardoni Padovan
Carbonaceous particulate matter in the alveolar macrophage and lung
surface tissue compartments of residents from São Paulo, Brazil
Thesis presented to the
Faculty of Medicine, University of São Paulo
Department of Pathology
Advisor: Raymundo Soares de Azevedo Neto
São Paulo
2017

Michele Galhardoni Padovan
Material particulado de carbono nos compartimentos de tecidos de
macrófagos alveolares e de superfície pulmonar de residentes de São
Paulo, Brasil
Tese apresentada à Faculdade de Medicina
da Universidade de São Paulo para
obtenção do título de Doutor em Ciências
Programa de Patologia
Orientador: Prof. Dr.Raymundo Soares de Azevedo Neto
São Paulo
2017
Dados Internacionais de Catalogação na Publicação (CIP)
Preparada pela Biblioteca da Faculdade de Medicina da Universidade de São Paulo
©reprodução autorizada pelo autor
Padovan, Michele Galhardoni Material particulado de carbono nos compartimentos de tecido de macrófagos alveolares e de superfície pulmonar de residentes de São Paulo, Brasil / Michele Galhardoni Padovan. -- São Paulo, 2017.
Tese(doutorado)--Faculdade de Medicina da Universidade de São Paulo. Programa de Patologia.
Orientador: Raymundo Soares de Azevedo Neto.
Descritores: 1.Poluição do ar 2. Macrófagos alveolares 3. Poluição por
fumaça de tabaco 4.Material particulado 5.Fuligem 6.Antracose
USP/FM/DBD-036/17

Acknowledgments
Thank you,
To the Department of Pathology, Professor Luiz Fernando Ferraz da Silva, Professor
Thais Mauad, Professor Paulo Hilario do Nascimento Saldiva and all the research team,
for valuable contribution and availability.
A special thank you to my supervisor, Prof. Dr.Raymundo Soares de Azevedo Neto
who adopted me after the project has started, for the confidence, encouragement,
patience and support.
To the members of my qualification exam - Prof. Dr. Fabiola Bernardi, Prof Dr. Lucia
Garcia and Prof. Dr Fatima Mitiko Tengan.
Big thank you to my dearest friends from FMUSP for all encouragement, for sharing
moments of daily life and for the restless laughter: Cristiane Centrone, Rodrigo Pessoa,
Clara Felix, Renata Moscolini, and Sabri.
To the amazing people from The Department of Pathology and Experimental
Air Pollution Laboratory, Prof. Regiani Carvalho de Oliveira, Profa. Dolores Helena
Rodriguez Ferreira, Prof .Dr. Alfésio Luís Ferreira Braga, Mariana Veras e Luis
Fernando Amato.
To Prof. Dr. Carlos Augusto Gonçalves Pasqualucci, to give us permission to work
along with São Paulo Autopsy Centre - SVOC, and all the amazing staff out there,

technicians and pathologists for the help with collecting samples, official reports and all
the hard working routine, which they do under admirable ethics and respect .
To Prof. Dr. Nelson Gouveia and Mateus Habermann for the huge contribution on the
traffic methods, giving their valuable time geocoding all my population data.
To the staff of the Museum at the Faculty of Medicine for all support. Ana, Carlos and
Reginaldo. Special thank you to the member of the secretary of the Department of
Pathology, Thiago Rezende for all help and intermediation whenever I needed. To the
people who, directly or indirectly, contributed to the development of this work, and with
my scientific and intellectual development, my sincere gratitude.
A huge thanks for Professor Jonathan Grigg, to receive me in his laboratory at the
Blizard Institute, Queen Mary University of London, where I spent a year learning his
techniques. It was an honour. Thank you to all his amazing team who became friends,
Kate Harris, Gioia Mosler, Reetika Suri, Lisa Miyashita, Abigail Whitehouse, Norrice
Liu and Lizette Ahenda. All members of staff always supportive. Shirley, Jaya and
Julia. And friends I made there, Shirleny Cardoso, Hemanth and Kaveh.
To CAPES for the scholarship awarded. To my dearest friends Danielle Coelho, Rafaela
Marins, Thaisa Imamura, Rafinha Silva, who, from near or far, are extremely important
to my life and always give me all the support I need!
To a very special person, Adam Waite, who is completing a year since he came into my
life, and I do not want to let him go anymore! Thank you for the restless support and

patience, hours shared by my side working, training, or simply being silent with me – I
love you.
To my family, all of them! Especially my dear cousins Gilberto, Benazir, Thiago and
Viviane, for friendship and companionship. To my uncle Gilberto to always be there.
A special thanks to my mother Vera, who I admire so much and is the basis of my life,
for all the support, affection and unconditional love. I have being learning so much from
you my whole life, and words are not enough to thank you. To my father Luiz, and my
step brothers, that even living far are in my heart.
And finally, I want to thank God – for life, and to make all the impossible things
possible to me.

“If you can't fly then run, if you can't run then walk, if you can't walk then crawl, but
whatever you do you have to keep moving forward.”
Martin Luther King Jr.

This thesis has been done according to the following standards at the time of this
publication:
References: Adapted from International Committee of Medical Journals Editors
(Vancouver).
University of São Paulo. Faculty of Medicine. Division of Library and Documentation.
Guide presentation of dissertations, theses and monographs. Prepared by Anneliese
Carneiro da Cunha, Maria Julia L. A. Freddi, Maria F. Crestana Marinalva de Souza
Aragon, Suely Campos Cardoso, Valeria Vilhena. 3rd ed. São Paulo: Library and
Documentation Division; 2011.
Abbreviations of journal titles according to List of Journals Indexed in Index Medicus.

Table of Contents
1. Introduction .................................................................................................................. 1
1.1 Background ......................................................................................................................... 1
1.2 Rationale ............................................................................................................................. 3
1.3 Exposure Assessment .......................................................................................................... 6
1.3.1 Particulate Matter ......................................................................................................... 6
1.3.2 Health Effects Associated with Particles...................................................................... 7
1.3.3 Road and Traffic Emissions ....................................................................................... 11
1.3.4 Cigarette Smoking Exposure ...................................................................................... 12
1.3.5 Health Effects Associated With CSE ......................................................................... 13
1.4 Synopsis of the study design ............................................................................................. 15
1.4.1 Structure outline ............................................................................................................. 15
2. Aims and Objectives ................................................................................................... 17
3. Methods ...................................................................................................................... 18
3.1 Study population ............................................................................................................... 18
3.1.1 Target Cohort and Recruitment .................................................................................. 18
3.1.2 Subject selection ......................................................................................................... 19
3.1.3 Gaining Consent ......................................................................................................... 19
3.2 Analysis of carbon ............................................................................................................. 20
3.2.1 Lung surface carbon ................................................................................................... 20
3.2.2 Alveolar macrophage carbon ..................................................................................... 23
3.3 Cigarette smoking ............................................................................................................. 27
3.4 Measured environmental PM exposure ............................................................................. 27
3.5 Exposure to local traffic .................................................................................................... 27
3.6 Traffic Methods ................................................................................................................. 28

3.6.1 Road and traffic data .................................................................................................. 28
3.7 Evaluation of the exposure: ............................................................................................... 29
3.7.1 Distance from roads with heavy traffic flows ............................................................ 29
3.7.2 Traffic density by census tract ................................................................................... 29
3.7.3 Distance-weighted traffic density ............................................................................... 30
3.8 Histopathology .................................................................................................................. 32
3.9 Statistical analysis ............................................................................................................. 32
4. Results ........................................................................................................................ 33
4.1 Demographics and Cause of Deaths .................................................................................. 33
4.2 Lung Surface Carbon ........................................................................................................ 35
4.4 Measured PM Exposure .................................................................................................... 42
4.5 Road and Traffic Exposure ............................................................................................... 43
4.6 Additional Histopathology Analysis ................................................................................. 47
5. Discussion ................................................................................................................... 49
5.1 Particulate matter and health effects ................................................................................. 52
5.2 Histopathology and Prevalence of the Black Spots ........................................................... 54
5.3 Limitations ........................................................................................................................ 56
5.3.1 General limitations ..................................................................................................... 56
5.3.2 Method Limitations .................................................................................................... 57
5.4 Future Applications and Outlook ...................................................................................... 61
6. Conclusion .................................................................................................................. 63
Attachments .................................................................................................................... 64
References ...................................................................................................................... 66

List of Figures
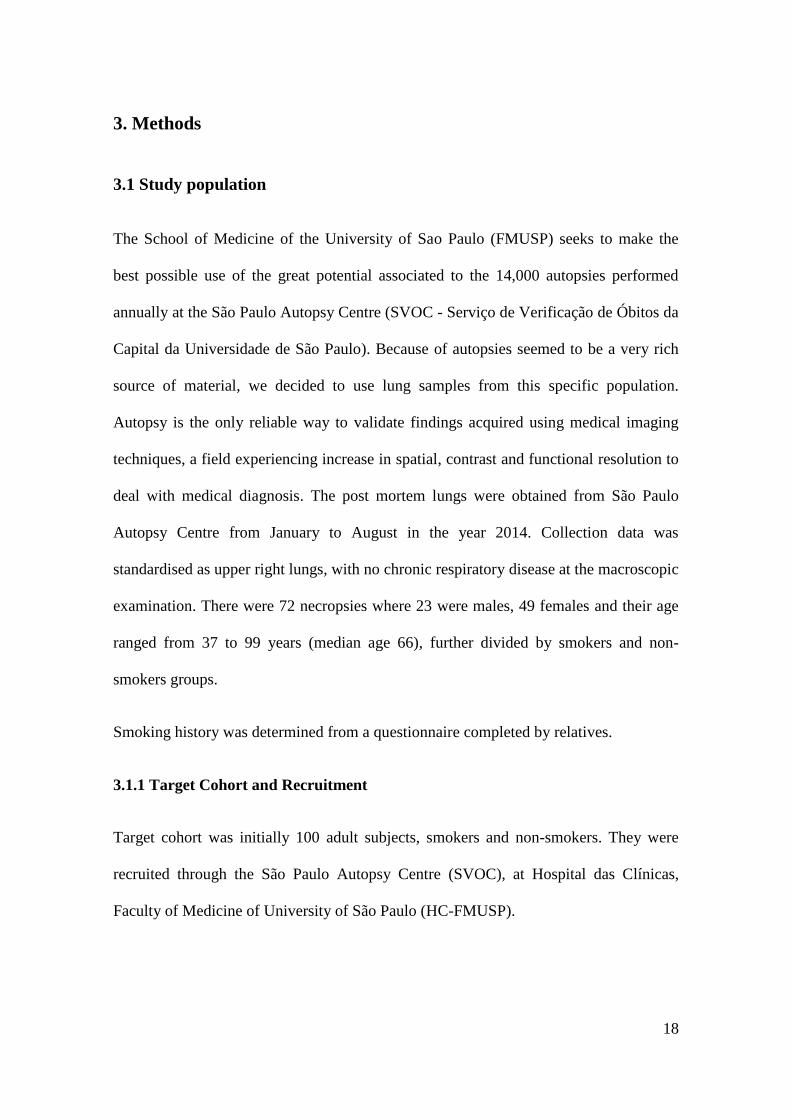
Figure 1: Upper right lung collected at SVOC after the Pathologist evaluation. Digital
picture taken using a Nikon digital camera (Nikon D-3300) in a professional light box
with blue background. For all lung specimens we used same camera distance and same
light. ................................................................................................................................ 21
Figure 2: A: Image crop of lung surface carbon (LSurC) specimen measuring 7 x 7 cm.
B: The same image with carbonaceous areas identified using the threshold command
(yellow borders) from Image J software adjusted to maximise identification of black
carbon and minimise identification of areas without carbon. The area of lung surface
carbon is 9.37 cm2 black carbon PM area/49cm2 lung surface. ..................................... 22
Figure 3: Pannoramic 250 slide scanner (3DHISTECH Ltd., Hungary) used to scan the
cytology slides, using a magnification of 40x Zeiss Plan-Apochromat objective. Scanner
A is a 250 slides capacity and scanner B 150 slides capacity/time scan. ....................... 25
Figure 4: Digital images of lung macrophages obtained by pressing a microscope slide
to the cut surface of the right upper lobe. Cells were stained by haematoxylin and
imaged under oil immersion (x100 magnification). There is marked heterogeneity of
lung macrophage loading; (a) no black carbon, and (b, c, d) increased levels of
phagocytosed carbon. ..................................................................................................... 25
Figure 5: Software calibration using a range of the obtained macrophage images.
Calibration was based on the colour tones of the images and calibrated to be sensitive to
the black intensity relative to the black carbon spots on the cytoplasm. ........................ 26

Figure 6: Screen shot of analysed AMC using the software Image Pro Plus (The Proven
Solution, Media Cybernetics Inc., USA). Picture shows how the software command
captures the black areas on the macrophages. ................................................................ 26
Figure 7: Dot plot of lung surface carbon in smokers and non-smokers. Lung surface
carbon was assessed using image analyses and expressed as cm2/49 cm2 lung surface.
There is significant difference between groups by Mann Whitney test. Bar represents
median. ........................................................................................................................... 35
Figure 8: Image of the lung surface. Standard crops using Image J software. In
clockwise order: 1. Non-smoker, female, 85 years old; 2. Smoker, male, 70 years old; 3.
Non-smoker subject, female, 76 years old; 4. Smoker, female, 47 years old.4.3 Alveolar
Macrophage Carbon ....................................................................................................... 36
Figure 9: Dot plot of alveolar macrophage carbon in smokers and non-smokers. Airway
macrophage carbon was assessed using image analyses and expressed as µm2. There is
significant difference between groups by Mann Whitney test. (103.4 (29.44 to 226.3)
vs. 9.27 (3.1 to 85.13) µm2, P<0.001). Bar represents median....................................... 38
Figure 10: Lung section from a male smoker aged 59 showing; (A) carbon in alveolar
macrophages (arrow), and (B) carbon in lung tissue (arrow) (Original magnification
20x) ................................................................................................................................. 48
Figure 11: Additional hystological analysis. Right upper lung, randomly selected. The
presented subject was a smoker, male, 59 years old. We can observe accumulation of
anthracotic pigment deposition along the lung tissue. .................................................... 48

Figure 12: Represents image analysis of alveolar macrophages (AM) for cytoplasmic
carbon using Image J (Kulkarni et al., 2006). (A) Digital image of AM obtained under
oil immersion light microscopy (x1000). The black material in the cytoplasm is
phagocytosed carbon. The AM nucleus has been cut using the image analysis
programme. (B) Areas of carbon particles detected by the Scion image analysis
software. ......................................................................................................................... 58
Figure 13: Image analysis accessing alveolar macrophages (AM) for cytoplasmic carbon
using Image Pro Plus. Digital image of AM obtained using Pannoramic Viewer (x100).
The black material in the cytoplasm is phagocytosed carbon. ....................................... 59
Figure 14: A Spearman correlation was performed in order to compare the discrepancy
between the two methods in 4 (subjects) who presented high AMC results, (R= 0.600;
P= NS). ........................................................................................................................... 60

List of Tables
Table 1: Effects of increased particle exposure. Main source: World Health
Organisation Europe (2004), 1 (International Agency for Cancer Research 2013), 2
Delfino et al. (1998; 2002) ............................................................................................... 8
Table 2: Demographic table, smoker and non-smoker groups, showing age at death in
each group; gender; main cause of death; PM10, particulate matter with aerodynamic
diameter ≤ 10 μm (μg/m3) for the years 2011, 2012, 2013 and 24 hour before death.
Data are presented as mean (standard deviation) for continuous variables, or n (%) for
categorical variable. ........................................................................................................ 34
Table 3: Full results of smokers subjects group for Lung surface carbon (LSurC) and
alveolar macrophage carbon (AMC). Data are expressed as µm2. ................................. 39
Table 4: Full results of non-smokers subjects group for Lung surface carbon (LSurC)
and alveolar macrophage carbon (AMC). Data are expressed as µm2. .......................... 41
Table 5: Air quality levels that are recommended by the WHO and that all countries
should aim for. For particulate matter, average levels are recommended over 1 year and
for 24 hours, because both short- and long-term effects occur. It is thought that no
guideline will ever provide complete protection, but health effects can be reduced. ..... 42
Table 6: Correlations done by Spearman Rank test. All correlations are non-significant.
Table representing correlations between exposure to air pollution and pre-mortem

exposure values between LSurC and AMC. PM10, particulate matter with aerodynamic
diameter ≤ 10 μm (μg/m3). ............................................................................................. 43
Table 7: Full results of Smokers subjects group. In this table we presented the results for
PM exposure represented in mean and the traffic exposure results for density by census
tract (m), distance-weighted traffic density (in vehicles/hour) and distance from roads
with heavy traffic flows (dist. perc 95%; 150m). ........................................................... 44
Table 8: Full results of non-smokers subjects group. In this table we presented the
results for PM exposure represented in mean and the traffic exposure results for density
by census tract (m), distance-weighted traffic density (in vehicles/hour) and distance
from roads with heavy traffic flows (distance percentile 95%; 150m). ......................... 47

List of Abbreviations, Acronyms and Symbols
AM: alveolar macrophage
SVOC: São Paulo Autopsy Centre
IQR: interquartile range
µm2: square micrometer
μm3: cubic micrometer
vs: versus
μm/m3: micrometer per cubic meter
P= p value
MA: macrófagos alveolares
Km2: square kilometres
WHO: World Health Organization
PM: particulate matter
e.g.: exempli gratia
nm: nanometer
CS: cigarette smoke
CSE: cigarette smoke exposure
UK: United Kingdom
%: percentage
CETESB: São Paulo Environmental Agency
μm: micrometer
LSurC: Lung surface carbon
AMC: Alveolar macrophage carbon
FMUSP: Faculty of Medicine of University of São Paulo
HC-FMUSP: Hospital das Clínicas, Faculty of Medicine of University of São Paulo
CAP Pesq: Research Ethics Committee of the Faculty of Medicine, University of São
Paulo
cm2: square centimetre
H&E: haematoxylin and eosin
LM: lung macrophage
h: hours
m: meters
DWTD: distance-weighted traffic density

CET: São Paulo Municipal Traffic Engineering Company
TDi: traffic density
i: each region (local streets)
∑: sum
SLR: segments of local roads
T: traffic for each local street segment
≥: greater than or equal to
AMDL: annual mean daily traffic
VPH: vehicles per hour
L: length of the street segment
Ai: area of the census tract
D: distance
Y: weighting factor
Π: Pi value
exp: exponential function
<: less than
Rs: Spearman rank test
NS: non-significant
EPA: Environmental Protection Agency
PMF: progressive massive fibrosis
>: greater than

Summary
Carbonaceous Particulate Matter in the Alveolar Macrophage and
Lung Surface Tissue Compartments of Residents from Sao Paulo,
Brazil
Rationale
Smokers inhale large amounts of carbonaceous particulate matter, which may contribute
to pulmonary and systemic adverse effects. It is clear that alveolar macrophages (AM)
play a critically important role in the recognition and processing of any inhaled foreign
material and are the predominant cells that process and remove inhaled particulate
matter from the lung. There is also long-term surface deposition of carbon seen in the
lungs of smokers at post-mortem. At present the distribution and retention of cigarette
smoke-derived particulate matter when the person is also exposed to high levels of
background air pollution is unclear. Therefore we sought to assess both AM carbon
loading and lung surface deposition in a population exposed to high background air
pollution (São Paulo) in both smokers and non-smokers.
Methods
A cohort of 72 post-mortem subjects was obtained from São Paulo Autopsy Centre
(SVOC). Images of lung surfaces were obtained under standard conditions and small
fragments of lung tissue were collected for macrophage analysis using smear technique.
The total surface black carbon was analysed using Image J (National Institute of Health,

MD, USA), blinded to smoking status. Internal AM carbon uptake was measured using
Image Pro Plus (The Proven Solution, Media Cybernetics Inc., USA). Ethical approval
was obtained. Mean macrophage black carbon in both smokers and non-smokers was
analysed using Mann Whitney and expressed as median (IQR).
Results
Smokers have a significantly higher level of mean macrophage black carbon (103.4
(IQR 29.44 to 226.3) vs. 9.27 (IQR 3.1 to 85.13) µm2, P<0.001)103.4µm2. There was no
significant difference between the mean area of surface deposition of carbon in the
lungs of smokers and non-smokers 6.74 cm2 (IQR 3.47 to 10.02) versus 5.20cm2 (IQR
2.29 to 7.54) P=NS.
Conclusion
AM carbon content is clearly much higher in the smokers than the non-smokers.
However the lung surface analysis showed no significant difference. This could indicate
that in an area of high air pollution the main contributing factor to long term lung
carbon deposition is pollution exposure with limited effects from cigarette smoke
exposure. AM black carbon still appears significantly influenced by cigarette smoke
exposure.

Resumo
Material particulado de carbono nos compartimentos de tecidos de
macrófagos alveolares e de superfície pulmonar de residentes de São
Paulo, Brasil
Introdução
Os fumantes inalam grandes quantidades de partículas de carbono, o que pode
contribuir para efeitos adversos pulmonares e sistêmicos. É sabido que os macrófagos
alveolares (MA) desempenham um papel extremamente importante no reconhecimento
e processamento de qualquer material estranho inalado e são as células predominantes
que processam e removem partículas inaladas. Existe também a deposição superficial a
longo prazo do carbono observado nos pulmões de fumantes em autópsias. Atualmente,
a distribuição e retenção de partículas de fumo derivadas de cigarros quando a pessoa
também está exposta a níveis elevados de poluição do ar ainda não é clara. Portanto,
procurou-se avaliar a carga de carbono nos MA e a deposição de superfície pulmonar
em uma população exposta a alta poluição atmosférica (São Paulo), tanto em fumantes
como não-fumantes.
Métodos
Uma coorte de 72 sujeitos post mortem foi obtida do Serviço de Verificação de Óbitos
da Capital da Universidade de São Paulo (SVOC). As imagens das superfícies
pulmonares foram obtidas sob condições padrão e pequenos fragmentos de tecido

pulmonar foram coletados para análise de macrófagos usando a técnica de esfregaço. A
superfície total de negro de carbono foi analisada utilizando o programa Imagem J
(National Institute of Health, MD, EUA), teste cego ao fumo. A absorção interna de
carbono nos MA foi medida utilizando o programa Image Pro Plus (The Proven
Solution, Media Cybernetics Inc., EUA). A aprovação ética foi obtida. A média de
negro de carbono de macrófagos tanto em fumantes como em não-fumantes foi
analisada utilizando teste de Mann Whitney e expressa como intervalo interquartil
(IQR).
Resultados
Os fumantes têm um nível significativamente mais elevado de negro de carbono nos
macrófagos alveolares (103.4 (IQR 29.44 to 226.3) vs. 9.27 (IQR 3.1 to 85.13) µm2,
P<0.001)103.4µm2. Não houve diferença significativa entre a área média de deposição
superficial de carbono nos pulmões de fumantes e não fumantes de 6, 74 cm2 (IQR 3,
47 a 10, 02) versus 5, 20 cm2 (IQR 2, 29 a 7, 54) P=NS.
Conclusão
O teor de carbono nos MA é claramente muito maior nos fumantes do que os não-
fumantes. No entanto, a análise da superfície pulmonar não mostrou diferença
significativa. Isso pode indicar que, em uma área de alta poluição do ar, o principal fator
que contribui para a deposição de carbono no pulmão a longo prazo é a exposição à
poluição com efeitos limitados da exposição à fumaça de cigarro. O preto de carbono

nos MA ainda aparece significativamente influenciado pela exposição à fumaça de
cigarro.

1
1. Introduction
1.1 Background
In 2012 the Global Burden of Disease study stated that outdoor air pollution was the
ninth leading cause and indoor air the fourth leading cause of morbidity and mortality
worldwide; estimating that over 3.5million deaths worldwide each year can be attributed
to indoor and outdoor pollution (Lim et al, 2012). Air pollution is associated with a
myriad of health problems including respiratory diseases such as emphysema, bronchitis
and asthma, impaired lung development in children, premature births and low birth
weight, lung cancer and heart disease.
São Paulo has a population that exceeds 11.5 million people living in an area of 1,509
km2. This information about the large population of São Paulo points to a significant
potential to explore the role of several urban conditions in the conduction of effective
studies on health effects and urbanity. The use of autopsies to explore urban health is
innovative since it stems from a multivariate population from a big city like São Paulo.
More than 80% of people living in urban areas that monitor air pollution are exposed to
air quality levels that exceed the World Health Organization (WHO) limits, and São
Paulo is one of the top highest polluted cities in world (WHO, 2016).
Smokers inhale large amounts of carbonaceous particulate matter, which may contribute
to pulmonary and systemic adverse effects (Pinkerton et al., 2000). It is clear that
alveolar macrophages play a critically important role in the recognition and processing
of any inhaled foreign material and are the predominant cells that process and remove
inhaled particulate matter from the lung (Hiraiwa and van Eeden, 2013). Most particles

2
inhaled are readily removed by mucociliary clearance aided by macrophage
phagocytosis.
To date, little is known about the amount of PM retained in lung tissue and exposure to
fossil fuel- and CS-derived PM. This is, in part, because measuring the amount of
carbonaceous PM in lung tissue is very difficult to achieve in vivo. By contrast,
assessment of the amount of carbon in airway macrophages (AM) is straightforward
since AM may be sampled non-invasively by sputum induction. Analysis of AM
obtained by induced sputum is a practical way of quantifying natural exposure of the
lower airway to carbonaceous particles from the burning of biomass fuel. Previously,
researches have reported a weak association between modelled exposure to fossil-fuel
derived PM at the home address and airway macrophage carbon loading in children
(Kulkarni et al., 2005), and recently Belli et al (Belli et al., 2016) reported that both
smoking and exposure to environmental PM2.5 is associated with accumulation of
carbonaceous PM in airway macrophages.
Tobacco smoking is linked to a long and growing (Barnes, 2014; Carter et al., 2015) list
of fatal illnesses (e.g., emphysema, cancer, and stroke) and is the major preventable
cause of human death. Cigarette smoking for many years caused damages in the lungs
and leads to emphysema. There are thousands of chemicals in cigarette smoke and many
of them have been linked to the development of lung cancer, although it has been
difficult to point those that are responsible for smoking-related emphysema. Moreover,
cigarette smoke also contains large numbers of small particles and relatively little is
known about the role played by these particles in smoking-related disease (You et al,
2015).

3
Recently, there has been renewed interest in study the causes of lung blackening and
particles deposition in lung surface. Previously, little was known about the composition
of the substance that causes this blackening, or its significance in the development of
emphysema. Now, by studying lung tissue taken from smokers with emphysema, You et
al. have shown that this black substance is made of nano-sized particles of a material
called carbon black (which is also known as elemental carbon). These nanoparticles are
produced by the incomplete combustion of the cigarettes, but the effect of carbon black
in smokers and non-smokers is less known.
1.2 Rationale
Retention of inhaled carbonaceous particulate matter (PM) in the lung is associated with
a wide range of adverse health effects. The association between accumulation of
carbonaceous PM in the lung and chronic lung injury was first described over 100 years
ago in miners (Arnold C A, 2015). By contrast, evidence for the long-term adverse
effects of environmental carbonaceous PM, mainly from fossil-fuel combustion in urban
areas, has emerged recently. For example, a 2016 report by the Royal College of
Physicians (UK), concluded that long-term exposure to carbonaceous fossil-fuel derived
PM less than 10 micrometres in aerodynamic diameter (PM10) is associated with a wide
range of long-term effects including reduced lung function growth in children,
accelerated lung function decline in adults, lung cancer, and new onset asthma (Every
Breath We Take). In adults, an additional source of carbonaceous PM exposure is
cigarette smoke (CS) (Geber et al., 2015).
Assessment of the amount of carbon in airway macrophages (AM) is straightforward
since AM may be sampled non-invasively by sputum induction. Using induced sputum

4
in children, we found a weak association between modelled exposures to fossil-fuel
derived PM at the home address and AM carbon loading (Kulkarni et al., 2005), and
more recently, Belli et al (Belli et al., 2016) reported that both smoking and exposure to
environmental PM2.5 is associated with accumulation of carbonaceous PM in AM. By
contrast, little is known about the amount of PM retained in lung tissue after exposure to
fossil fuel- and CS-derived PM, in part because measuring carbonaceous PM in lung
tissue is difficult to do in vivo. Although one of the hallmarks of long-term smoking is
considered to be blackening of the lung tissue surface (Tour et al., 2015), no studies to
date have compared surface carbonaceous PM loading in smokers and non-smoking
adults. However, recently, You et al (2015) performed high resolution transmission
electron microscopy of the residual black material after complete proteolytic digestion
of human emphysematous lung from smokers and found 20–50nm spheroids aggregates
compatible with carbon black, and found a signature for nanoparticulate carbon black in
dendritic cells from the same lungs. You et al (2015) also found that exposure of mice
to CS, increased black staining both at the lung surface and within dendritic cells.
However, this study did not compare lungs from non-smokers, and whether smoking is
the major determinant of lung tissue carbon in adults living in areas of high
environmental PM therefore remains unclear.
Existing studies have only looked at the association between environmental exposure on
the same day or during the previous few days before death and the severity of illness.
To avoid variables and confounding bias in the air pollution data, residential addresses
were successfully geocoded to better demonstrate the estimation of exposure across the
city. Additionally, exposure to traffic related air pollution was based on annual means of
traffic counts that might not reflect seasonal, monthly or either temporal variations in

5
vehicle traffic data. This premise confirm the effectiveness of this study accessing PM
exposure with accurate spatial variability, once air pollution levels can vary
considerably across different areas of the city and how close subjects are from busy
roads. Traffic density was weighted for the distance from the busy road to the home
address using Gaussian distribution to approximate the decay of PM emissions into the
surrounding streets previously described by Pearson (Pearson et al., 2000).
To date, little is known about the amount of PM retained in lung tissue and exposure to
fossil fuel- and CS-derived PM. This is, in part, because measuring the amount of
carbonaceous PM in lung tissue is very difficult to achieve in vivo. By contrast, carbon
PM loading in the airway macrophages is relatively straightforward using non-invasive
sampling by sputum induction. Indeed in children, we have reported a weak association
between modelled exposure to fossil-fuel derived PM at the home address and airway
macrophage carbon loading (Kulkarni et al., 2005), and recently Belli et al (Belli et al.,
2016) reported that both smoking and exposure to environmental PM2.5 is associated
with accumulation of carbonaceous PM in airway macrophages.

6
1.3 Exposure Assessment
1.3.1 Particulate Matter
Ambient particulate matter (PM) is formed by a mixture of solid and liquid suspended
particles, with three portions based on their aerodynamic diameter: coarse, fine and
ultrafine (Lippmann et al., 1980). Short and long-term exposure to particulate matter
causes respiratory and cardiovascular disease, atherosclerosis, adverse birth outcomes,
impacts on children’s development of the brain and nervous system, diabetes, and can
result in death. PM is also linked to respiratory infections and asthma in young children.
Retention of inhaled carbonaceous particulate matter (PM) in the lung is associated with
a wide range of adverse health effects. While the association between the inhalation of
non-combustion derived carbon PM by miners and chronic lung injury was first
described over 100 years (Arnold et al, 2015), evidence for the long-term adverse
effects of environmental carbonaceous PM (mainly from fossil-fuel combustion in
urban areas) has emerged more recently. For example, a 2016 report by the Royal
College of Physicians (UK) in reviewing the recent evidence, concluded that long-term
exposure to carbonaceous fossil-fuel derived PM less than 10 micrometres in
aerodynamic diameter (PM10 ) is associated with a wide range of effects including
reduced lung function growth in children, accelerated lung function decline in adults,
lung cancer, and new onset asthma according to the report from Royal College of
Physicians, Every Breath We Take (2016). In adults, fossil-fuel combustion is not the
only source of carbonaceous PM since cigarette smoke (CS) contains high
concentrations of carbonaceous PM (Gerber et al., 2015).

7
1.3.2 Health Effects Associated with Particles
Air pollution was positively associated with mortality due to lung cancer and
cardiopulmonary disease but not with mortality from all other causes (Dockery et al.,
1993). Human exposure to PM has been linked to a number of different adverse health
effects, increased numbers of emergency room visits, hospital admissions, and increased
mortality where a large scale of cases in the literature has been demonstrating the
association between carbonaceous particles in the air and daily mortality and morbidity.
Previous studies reported that the level of PM10 is associated with the rate of death from
all causes and from cardiovascular and respiratory illnesses. Associations of a range of
different respiratory health effects have been found, such as reduction in lung function.
Additionally there is evidence for severe effects on the cardiovascular system, such as
increases in myocardial infarction (World Health Organisation Europe 2004)

8
Short-term Effects Long-term Effects
• Lung inflammatory reactions • Increase in lower respiratory symptoms
• Respiratory symptoms (including Asthma
episodes2)
• Reduction in lung function in children
• Adverse effects on the cardiovascular
system
• Increase in chronic obstructive pulmonary
disease
• Increase in medication usage • Reduction in lung function in adults
• Increase in hospital admissions • Reduction in life expectancy, owing
mainly to cardiopulmonary mortality and
lung cancer
• Increase in mortality • Increase in lung cancer1
Table 1: Effects of increased particle exposure. Main source: World Health Organisation
Europe (2004), 1 (International Agency for Cancer Research 2013), 2 Delfino et al. (1998;
2002)

9
Health effects associated with PM have been studied on the last years trying to predict
short and long-term PM exposure. One main objective of this study is to determine a
model which can predict long-term individual exposure. Long-term health effects are
therefore of particular interest to this study (see summary in Table 1 above). A number
of studies have shown an association between daily changes in air pollution levels and
adverse health effects to the cardiovascular and respiratory system (Peters et al. 2001;
Maynard et al. 2007; Törnqvist et al. 2007; Wellenius et al. 2012; Pope III & Dockery
2006).
In a specific study leaded in Massachusetts researches found an estimated increase in
the relative rate of death from all causes in 0.51% for each increase in the PM10 level of
10ug per cubic meter and the estimated increase in the relative rate of death from
cardiovascular and respiratory causes of 0.68% for each increase in the PM10 level of
10ug per cubic meter (Samet et al 2000). Another study by Schwartz, Dockery, & Neas
(1996) calculated from data collected for the Harvard six cities study showed that an
increase of 10μg/m3 in PM2.5 was associated with a 1.5% increase in total daily
mortality whilst a study conducted by the World Health Organisation Europe (2013)
reviewed dose-response relationships for PM10 from the literature and derived a relative
risk for mortality of 1.026 for each 10μg/m3 increase for an adult population.
The evidence that air pollution may promote permanent obstructive defects received
support from population-based studies (Abbey et al., 1998), histologic studies in
humans (Souza et al., 1998), and panel studies in children (Kulkarni et al., 2006).
Moreover, evidence of particle trapping into the lungs was observed in individuals
living in areas with high pollution concentrations (Saieg et al., 2011).
10
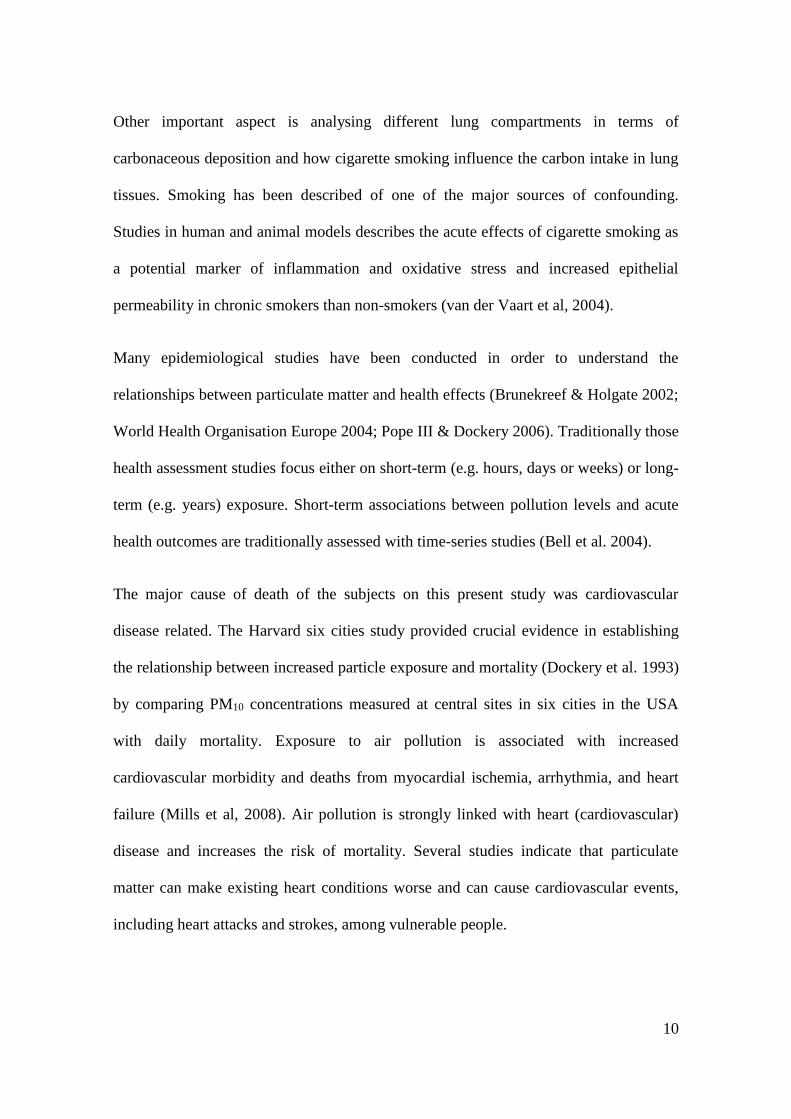
Other important aspect is analysing different lung compartments in terms of
carbonaceous deposition and how cigarette smoking influence the carbon intake in lung
tissues. Smoking has been described of one of the major sources of confounding.
Studies in human and animal models describes the acute effects of cigarette smoking as
a potential marker of inflammation and oxidative stress and increased epithelial
permeability in chronic smokers than non-smokers (van der Vaart et al, 2004).
Many epidemiological studies have been conducted in order to understand the
relationships between particulate matter and health effects (Brunekreef & Holgate 2002;
World Health Organisation Europe 2004; Pope III & Dockery 2006). Traditionally those
health assessment studies focus either on short-term (e.g. hours, days or weeks) or long-
term (e.g. years) exposure. Short-term associations between pollution levels and acute
health outcomes are traditionally assessed with time-series studies (Bell et al. 2004).
The major cause of death of the subjects on this present study was cardiovascular
disease related. The Harvard six cities study provided crucial evidence in establishing
the relationship between increased particle exposure and mortality (Dockery et al. 1993)
by comparing PM10 concentrations measured at central sites in six cities in the USA
with daily mortality. Exposure to air pollution is associated with increased
cardiovascular morbidity and deaths from myocardial ischemia, arrhythmia, and heart
failure (Mills et al, 2008). Air pollution is strongly linked with heart (cardiovascular)
disease and increases the risk of mortality. Several studies indicate that particulate
matter can make existing heart conditions worse and can cause cardiovascular events,
including heart attacks and strokes, among vulnerable people.

11
The relationship of long-term health in a given population or population group to air
pollution is usually assessed by looking at geographical differences in cohort studies
(World Health Organisation Europe 2004). Cohort studies in this context refer to studies
which compare differences in pollution concentrations at an individual’s homes to
differences in health between individuals of a population cohort. The World Health
Organization estimates that a quarter of the world’s population is exposed to unhealthy
concentrations of air pollutants. The American Heart Association recently issued a
scientific statement highlighting the increased cardiovascular risk associated with
exposure to air pollution and emphasized the importance of establishing a mechanistic
link to explain these epidemiological observations. Changes in the mortality rates
associated with short-term changes in PM have been observed in studies across the U.S,
Europe and other parts of the world. The elevated risk of death associated with air
pollution is primarily caused by elevated respiratory and cardiovascular mortality (EPA
1996; Pope et al., 1999).
These studies have proven to be useful tools to assess the health risk of a population.
But being more critical, most time-series studies neglect geographical variation and
cohort studies neglect variation over time. In addition, temporal variability of some
people’s exposure during their daily routine may be poorly reflected in the short-term
variability at a nearby monitoring site. More refined models for personal exposure have
therefore been developed.
1.3.3 Road and Traffic Emissions
Air pollution is a serious problem in the world’s major cities owing to the combustion
of fossil fuels such as diesel oil. In particular, there has been recent interest in the

12
consistent association between increased levels of air pollution and cardiovascular
morbidity and mortality.
Particularly in the city of Sao Paulo, the automotive fleet shows up as the most
significant contributor to emissions of pollutants into the atmosphere. There are also
fixed sources of pollution, represented by two thousand large industries. São Paulo
Environmental Agency (CETESB) maintains an ongoing effort to manage and expand
its monitoring network and to better characterize the emissions inventory of pollutants.
In the literature, studies suggested that urban dwellers have particle deposition and
retention in the lungs, which are associated with areas of bronchiolar fibrosis and mucus
hyperplasia (Souza et al., 1998; Churg et al., 2003). The rapid urbanization associated
with the industrial revolution increased traffic exposure and as a result an increase in
tobacco smoking (which will be more detailed on the section below), the widespread
use of internal combustion engines, and the introduction of new industrial sources of air
pollution. Several important epidemiologic studies have associated urban air pollution
with adverse health effects (de Kok et al., 2006), specifically respiratory morbidity and
mortality (Schuwartz J., 1995; Dockery et al., 1993).
1.3.4 Cigarette Smoking Exposure
In contrast to the white or pink appearance of normal lungs, the lungs of heavy smokers
are typically dark brown or black (Churg et al., 2005).
In the past few years, little was known about the composition of the substance that
causes this blackening, or its significance in the development of emphysema. Now, by
studying lung tissue taken from smokers with emphysema, You et al. have shown that
this black substance is made of nano-sized particles of a material called carbon black

13
(which is also known as elemental carbon), these nanoparticles are produced by the
incomplete combustion of the cigarettes. Researchers have previously demonstrated
vascular dysfunction in cigarette smokers.
Another thing to consider is that the particle deposition in the lungs depends on its size.
The size of particles in the smoke inhaled directly from a cigarette has been studied in a
variety of systems. Some studies shown that the mass median aerodynamic diameter of
particles is 0.3 to 0.4 μm (Martonen 1992; Bernstein 2004). Particles of this size
penetrate to and are deposited in the deep lung. Large particles (e.g., pollen and road
dust) are removed in the upper airway, largely by impaction (USDHHS 1984). Small
particles, with a mean aerodynamic diameter less than about 2.5 μm, reach the lungs,
where they deposit in airways and alveoli by impaction, sedimentation, or diffusion.
About 60 percent of the particles inhaled in cigarette smoke are deposited. Although
these particles are subject to handling by the mucociliary apparatus and alveolar
macrophages, removal is not complete because of their very high numbers in the lungs
of long-term smokers, which show evidence of a substantial burden of retained particles
(Cohen et al. 1979; USDHHS 1984).
1.3.5 Health Effects Associated With CSE
One of the indicators of long-term smoking is the blackening of the lung tissue that
persists even if the person stops smoking. Tobacco smoking is linked to a long and
growing (Barnes, 2014; Carter et al., 2015) list of fatal illnesses (e.g., emphysema,
cancer, and stroke) chronic inflammatory diseases (e.g. chronic bronchitis, and chronic
obstructive pulmonary disease (COPD)) (USDHHS 1984) and is the major preventable
cause of human death.

14
Despite public awareness of the harmful effects of smoking, in many large developing
countries the prevalence of smoking is growing (Eriksen et al., 2014). You et al. also
confirmed that the nanoparticles of carbon black can cause emphysema in mice, and
because the nanoparticles cannot be cleared, they are released into the lung when cells
die, which perpetuates lung inflammation and damage (You et al, 2015).
Tobacco smoke contains many noxious chemicals (e.g., carbon monoxide, sulfur,
nitrogen dioxide, nitric oxide, and methane), aromatics (e.g., benzene, toluene, and
xylene) and chlorinated (e.g., methyl chloride, chloroethene, and chloroform) volatile
organic compounds, as well as particulate matter (Wang et al., 2012; Perfetti and
Rodgman, 2013; Salvi, 2014). One or more of these agents is thought to underlie the
carcinogenic potential of smoke, involving at least eight different cancers; accordingly,
the role of volatile carcinogens found in smoke has been studied extensively (Pope et
al., 2011). Far less is known about the pathogenic effects of particulate matter that is
suspended in smoke and which includes nanoparticulate carbon. Histopathological
analysis of the lungs of heavy smokers invariably reveals dark-staining anthracotic
pigment often attributed to poorly soluble material found in tobacco smoke (Mitchev et
al., 2002). Anthracotic pigment is also found in the lymph nodes of smokers (Churg et
al., 2005). Anthracotic pigment can also appear in the upper lungs as a dense masses of
fibrous tissue, more than 1cm in diameter causing a progressive massive fibrosis, or
black lung disease, although more common from miners smoke (Black Lung in
Appalachia, 2016).
There is strong evidences in the literature that cigarette smoking exposure is associated
with mortality risks. At the Harvard Six Cities Study, researchers previously reported
the adverse health effects of air pollution and fine particles in smokers. Mortality rates

15
were more strongly associated with cigarette smoking. After adjusting for smoking and
other risk factors, they observed statistically significant ad robust associations between
air pollution and mortality (Dockery et al., 1993).
1.4 Synopsis of the study design
Data for this study were collected on São Paulo Autopsy Centre from January to August
in the year 2014, under the supervision of the responsible pathologist. The present
research uses a retrospective cohort study to access carbon in both lung surface and lung
macrophages aiming to indicate significant correlation between particulate matter and
carbon deposition in lungs of smokers and non-smokers living in a high polluted city.
Understanding the link between air pollution and carbon deposition in lungs, we will
provide new insights to health effects associated with air pollution and cigarette smoke
exposure. This is the first study to undertake a linear analysis of carbon loading over
lung surface carbon and airway macrophage carbon and its effects under long-term
residents of São Paulo.
Although, few limitations were faced due confounding bias such as lack of information
accessing subject’s occupational history and other sources of exposure such indoor
exposure and passive smoking.
1.4.1 Structure outline
Chapter 1 gives an introduction on the literature on exposure assessment to particulate
air pollution, health effects associated with PM, and retention of inhaled carbonaceous
particulate matter in the lung.

16
Chapter 3 will describe the methods implemented to assess carbonaceous particles
intake through different lung compartments in long-term residents of São Paulo. For the
first time, a study used image analysis to measure the amount of carbonaceous PM at
the lung surface of long-term residents of São Paulo, and reproducing a successfully
implemented method, we were able to assess environmental PM also in the lung
macrophages. Estimating carbon intake in the lungs in smokers and non-smokers
subjects living in a large urban area the present study aimed to find the major
determinant of long-term air pollution health effects, and stablish a causal association
between smoke and air pollution exposure.
After a meticulous literature research, and based on evidences that autopsies are a very
rich source of material, we defined the target population of post-mortem long-term
residents of São Paulo metropolitan area. The analysis of carbon was divided in lung
surface carbon (LSurC) through digital imaging and alveolar macrophage carbon
(AMC) obtained from a small lung fragment and stained to future microscopical
analysis. To determine environmental and ambient exposure we evaluate smoking
status, measured particulate matter exposure and exposure to local traffic.
Another important part of this study will be found in section 3.8 and 4.6, where we
evaluated the distribution of particles in the lung using an additional histological
sample.
Finally, Chapter 4 summarises results from this thesis and reflects about on the
implications of the findings in the wider context of particle intake and environmental
exposure assessment, which will be discussed further on Chapter 5 as well as the
limitations on Chapter 6.

17
2. Aims and Objectives
In this study, we sought to identify the determinants of lung surface carbon (LSurC) and
alveolar macrophage carbon (AMC) in long-term residents of São Paulo, with high
levels of cigarette smoking and exposure to environmental PM using measured PM10 or
markers of exposure to traffic at the home address.
The present study aims to prove an association between carbonaceous particulate matter
and long-term health effects in the two different compartments (LSurC and AMC), and
analyse the pathways between smokers and non-smokers.
18
3. Methods
3.1 Study population
The School of Medicine of the University of Sao Paulo (FMUSP) seeks to make the
best possible use of the great potential associated to the 14,000 autopsies performed
annually at the São Paulo Autopsy Centre (SVOC - Serviço de Verificação de Óbitos da
Capital da Universidade de São Paulo). Because of autopsies seemed to be a very rich
source of material, we decided to use lung samples from this specific population.
Autopsy is the only reliable way to validate findings acquired using medical imaging
techniques, a field experiencing increase in spatial, contrast and functional resolution to
deal with medical diagnosis. The post mortem lungs were obtained from São Paulo
Autopsy Centre from January to August in the year 2014. Collection data was
standardised as upper right lungs, with no chronic respiratory disease at the macroscopic
examination. There were 72 necropsies where 23 were males, 49 females and their age
ranged from 37 to 99 years (median age 66), further divided by smokers and non-
smokers groups.
Smoking history was determined from a questionnaire completed by relatives.
3.1.1 Target Cohort and Recruitment
Target cohort was initially 100 adult subjects, smokers and non-smokers. They were
recruited through the São Paulo Autopsy Centre (SVOC), at Hospital das Clínicas,
Faculty of Medicine of University of São Paulo (HC-FMUSP).

19
3.1.2 Subject selection
Inclusion criteria
Adults aged over 18 (eighteen) years old, of both genders living within the city
limits of São Paulo for at least 10 years;
Absence of lung chronic disease at the gross examination;
Family willing to give written informed consent.
Exclusion criteria
Subjects were seeing by the responsible pathologist of each shift. Subjects
showing any macroscopic alterations at the time of examination, due to chronic
or inflammatory pulmonary diseases (such as emboli, bronchitis, pneumonia,
tuberculosis, emphysema), or pulmonary impairment due to systemic diseases
(as bronchiectasis, lymphangitis carcinomatosis, collagen diseases or infectious
diseases).
3.1.3 Gaining Consent
The initial approach to the families was made by a member of the Autopsy Centre. They
were then informed in order to obtain written in order to use official data from death
reports and described lung tissue samples in this study.
The study was approved by the Research Ethics Committee of the Faculty of Medicine,
University of São Paulo (Research Protocol CAP Pesq.11621; 05/11/2013; certificate
showing on the attachments).

20
3.2 Analysis of carbon
3.2.1 Lung surface carbon
To access lung surface carbon (LSurC), a digital image was obtained from the whole
surface of the right upper lobe from each specimen. Images were taken using a Nikon
digital camera (Nikon D-3300) in a professional light box with blue background, as
showing in Figure 1. A 7 x 7 cm cropped image from the right upper lobe was then
obtained from the area with the least surface indentations. Lung surface carbon was
analysed using Image J (National Institute of Health, MD, USA), with the operator
blinded to the information about the deceased. By comparing to the original colour
digital image, an operator adjusted the “threshold” command in Image J, to best capture
black areas. Lung surface carbon was expressed as cm2 black carbon /49 cm2 lung
surface (Figure 2)
21
Figure 1: Upper right lung collected at SVOC after the Pathologist evaluation. Digital picture
taken using a Nikon digital camera (Nikon D-3300) in a professional light box with blue
background. For all lung specimens we used same camera distance and same light.

22
Figure 2: A: Image crop of lung surface carbon (LSurC) specimen measuring 7 x 7 cm. B: The
same image with carbonaceous areas identified using the threshold command (yellow borders)
from Image J software adjusted to maximise identification of black carbon and minimise
identification of areas without carbon. The area of lung surface carbon is 9.37 cm2 black carbon
PM area/49cm2 lung surface.

23
3.2.2 Alveolar macrophage carbon
Alveolar macrophages were obtained by first performing a 2 cm cut at right angles to
the lung surface, then pressing a microscope slide onto the cut face from smear and
fixed with alcohol (70% concentration) until the slides be processed. Slides were
processed and stained at the Cytology laboratory at the Faculty of Medicine (FMUSP)
using stain technique with haematoxylin and eosin (H&E) previously described by
Weigert’s Resorcin-Fuchsin (Weigert C, 1898).
After staining process, images of all AM were obtained in a predetermined scan of each
slide using Pannoramic 250 slide scanner (3DHISTECH Ltd., Hungary) (Figure 3)
Carbon uptake by AM was indefinable as black areas within the AM cytoplasm (Figure
4) and was quantified using image analysis as previously reported by Kulkarni et al:
digital colour images of 50 randomly chosen AM per subject with an intact cell wall
were obtained using a Pannoramic Viewer (3DHISTECH Ltd., Hungary) slide scanner,
with 50x magnification. Kulkarni and colleagues had previously ascertained that 50
cells produced a reliable estimate of the median surface area of carbon.
Briefly, this study selected digital images of 50 AM per lung specimen obtained using
Pannoramic Viewer (3DHISTECH Ltd., Hungary) slide scanner, previously described
above and showed at the representative picture below (Figure 4).
The images were analysed for AMC using the software Image Pro Plus (The Proven
Solution, Media Cybernetics Inc., USA).
Previously, the software was calibrated using a range of the obtained macrophage
images (Figure 5). A macro was recorded in order to precisely catch only the black

24
carbon area inside the macrophages. For this, a range of pictures samples was selected
to record a sensitive macro for these measurements. Based on the shades and colours of
a small sample of the pictures previously taken, the threshold command was adjusted to
obtain the “best fit” for carbon that was visible on the colour image. A very sensitive
macro was successfully recorded in order to the software do not select nonblack areas
(e.g. darker areas as the nucleus or haemoglobins).
The median area of carbon per AM per subject (the primary measure), and the
percentage of AM containing one or more area of carbon per subject were calculated
from 50 cells.
To determine AMC, the nucleus of each AM was cut using the software and a line
drawn surrounding the cytoplasm. By comparing to the original colour digital image, an
operator adjusted the “threshold” command in Image J, to best capture black areas in the
cytoplasm as done for LSurC (above). Airway macrophage carbon was expressed as
mean area carbon (μm2) per cell per specimen.

25
a. b. c. d
Figure 4: Digital images of lung macrophages obtained by pressing a microscope slide to the
cut surface of the right upper lobe. Cells were stained by haematoxylin and imaged under oil
immersion (x100 magnification). There is marked heterogeneity of lung macrophage loading;
(a) no black carbon, and (b, c, d) increased levels of phagocytosed carbon.
Figure 3: Pannoramic 250 slide scanner (3DHISTECH Ltd., Hungary) used to scan the
cytology slides, using a magnification of 40x Zeiss Plan-Apochromat objective. Scanner A is a
250 slides capacity and scanner B 150 slides capacity/time scan.

26
Figure 6: Screen shot of analysed AMC using the software Image Pro Plus (The Proven
Solution, Media Cybernetics Inc., USA). Picture shows how the software command captures the
black areas on the macrophages.
Figure 5: Software calibration using a range of the obtained macrophage images. Calibration was based on the
colour tones of the images and calibrated to be sensitive to the black intensity relative to the black carbon spots
on the cytoplasm.
27
3.3 Cigarette smoking
Smoking status was determined from the questionnaire of relatives used by the São
Paulo Autopsy Centre (SVOC). In this questionnaire, relatives are asked if the subjects
were current smokers or non-smokers. Personal information and cause of death was
obtained from the official medical records.
3.4 Measured environmental PM exposure
We obtained measurements of environmental PM10 using data from monitoring stations
across São Paulo metropolitan area, which was supplied by the São Paulo
Environmental Agency (CETESB, 2010). Monitoring stations are situated throughout
the São Paulo metropolitan area, and the whole population therefore lives within 10 km
of a station. For each subject, PM10 measurements was obtained from the nearest
monitoring station based on their home addresses. Data was recorded 24 hours before
death, and mean annual exposures at the home address for 2013, 2012, and 2011
respectively. For PM10 model units were expressed by micrograms per cubic meter
(μg/m3).
3.5 Exposure to local traffic
Road and traffic emissions near to the home address was assessed using a method
previous described by Habermann and Gouveia (Habermann and Gouveia, 2014).
Exposure to local traffic was determined using the distance from home to heavy traffic
roads (m), and the distance-weighted traffic density (m).
28
3.6 Traffic Methods
Using distance from home to heavy traffic roads, distance-weighted traffic density
(DWTD) and levels of particulate matter 10 as indicators, it is assumed that the
dispersion of emissions produced by vehicles on roads approximates to a Gaussian
(normal) distribution, and that 96% of the pollutants spreads within a distance of up to
500 feet (150 m) from the centre of the road as the model developed and applied by
Pearson et al. (2000).
Most dispersion models use a combination of pollution, meteorological and
topographical data. The major advantage of dispersion models compared to most other
modelling techniques of ambient air pollution concentrations is that they not only
include spatial, but also temporal variations, which makes them some of the most
widely applied models for air pollution predictions (Hoek, Beelen, et al. 2008; Baklanov
et al. 2007; Daly & Zannetti 2007).
3.6.1 Road and traffic data
Data from 2007 on the road system, such as traffic counts and simulation on the main
streets and roads (thoroughfares, cross streets, and rapid transit) were provided by the
São Paulo Municipal Traffic Engineering Company (CET), including tables, the street
grid, and the number of vehicles per hour. For stretches that lacked traffic statistics
(5.8% of the total), the study assigned a mean value based on the respective street’s
overall classification.
Local street traffic was estimated by the CET in 926 regions demarcated by the public
traffic and transportation-planning department (origin-destination zones). The sum of

29
traffic in each of these regions was divided by the total length of all the local streets
contained in them. The traffic density (TDi) (vehicles per meter of local streets) was
then obtained for each region (i). This measure was then multiplied by length of the
segments of local roads (SLR), in meters, contained in the respective regions, thus
obtaining the traffic for each local street segment (T).
SLRlength
trafficT
i
i
(1)
3.7 Evaluation of the exposure:
3.7.1 Distance from roads with heavy traffic flows
We defined roads with heavy traffic flow those with vehicle traffic volumes greater than
the 95th percentile (≥1,876 vehicles/hour) of the distribution. This included most of the
rapid transit, arterial and collector roads. The shortest distance between the subject’s
home address and these roads were then estimated.
3.7.2 Traffic density by census tract
This indirect indicator of exposure to pollutants generated by motor vehicle traffic was
constructed for each census tract. Since the census tracts vary considerably in size,
many of them represent only one block or building each, and therefore do not contain
any stretch of street and could have a null traffic value. This question was solved using
the same approach as Gunier et al. (2003) and Reynolds et al. (2002) , where the limits
30
of each tract were extended with a 200 m surrounding buffer. This 200 m distance also
represents the dispersal of air pollutants from a street (Chacraborty et al. 1999,
Reynolds et al. 2002, Gunier et al. 2003). Traffic density consists of multiplying the
vehicle volume by the length of the street segments, followed by dividing by the area of
the census tract (with the 200 m buffer).
i
i
A
LAMDLTDi
(2)
Where TDi is the traffic density in each census tract +200 (i), AMDT is the annual mean
daily traffic (vehicles/hour - VPH), L is the length of the street segment (km), and A is
the area of the census tract (in km²) with the 200 m buffer. The unit is expressed as
VPH/km². For the purposes of this study, census tracts + 200 m are referred to
generically as tracts.
We then computed exposure to traffic according the census tract where the subject
homes addresses were contained.
3.7.3 Distance-weighted traffic density
In the DWTD indicator, it is assumed that the dispersion of emissions produced by
vehicles on roads approximates to a Gaussian (normal) distribution and that 96% of the
pollutants spreads within a distance of up to 500 feet (150 m) from the center of the
road as the model developed and applied by Pearson et al. (2000).

31
For each subject studied, the shortest distances to roads within a radius of 750 feet
(228.6 m) around the subject’s residential address was calculated. For each distance (D),
the value Y was calculated as a weighting factor for vehicle flows obtained for each
road within the area.
2
2
0.51 500
exp0.4 2 0.4
D
Y
(3)
The Y was used to weigh the products of the traffic intensities of all road segments
within the buffer. The weighted values were summed for each subject to obtain the
DWTD.

32
3.8 Histopathology
To assess the distribution of carbon in the lung, an additional right lung specimen was
randomly selected at the Autopsy Centre after the pathologist’s final evaluation. The
lung was infused with 10% neutral buffered formalin with a non-specific pressure and
fixed for 48 hr. A set of transverse sections was performed after that in order to observe
the deep layers and the carbon intake. Sections were stained with haematoxylin and
imaged with a Nikon D-3300 camera.
3.9 Statistical analysis
Data are summarized as median (IQR). Comparisons between groups of smokers and
non-smokers in both LSurC and AMC were done by Mann Whitney test. Correlations
were done by Spearman rank test. A P value <0.005 was considered significant.
Statistical analysis was done using SPSS version 24 for Windows software (SPSS Inc.,
Chicago, IL, USA).

33
4. Results
4.1 Demographics and Cause of Deaths
LSurC and AMC was assessed in all 72 specimens analysed. From the entire
population, 18 subjects were formal smokers and 54 were non-smokers, with median
age of 66 years (Table 1).
Cause of death was assessed through formal questionnaire provided by São Paulo
Autopsy Centre. At the Smokers group, we observed that 72% of the causes were
cardiovascular diseases, 6% classified as neurological diseases and 22% from other
causes, whereas at the non-smokers group 85% of the causes of death were
cardiovascular diseases, 4% neurological cause and 11% caused by any other reason.
Our demographic data showed an interesting but not surprising statistic about the main
causes of death between the subjects on the present study. According to the recent
report submitted to the Royal College of Physicians, exposure to air pollution is
associated with increased cardiovascular morbidity and deaths from myocardial
ischemia, arrhythmia, and heart failure. Also, fine particulate matter derived from the
combustion of fossil fuels is thought to be the most potent component of the air
pollution composition. Particulate matter upregulates systemic proinflammatory and
oxidative pathways, either through direct translocation into the circulation or via
secondary pulmonary-derived mediators. The physicians also found out that exposure to
particulate matter has the potential to impair vascular reactivity, accelerate
atherogenesis, and precipitate acute adverse thrombotic events, which supports the
higher number of deaths by cardiovascular causes. In patients with coronary heart

34
disease, exposure to combustion-derived particulate can exacerbate exercise-induced
myocardial ischemia.
Characteristic Smoker
n = 18
Non-Smoker
n = 54
Age at death (in years/average)
58 (39-84)
69 (37-99)
Gender (n= %)
Female 10 (55%) 39 (72%)
Male 08 (45%) 15 (28%)
Cause of Death (n= %)
Cardiorespiratory 13 (72%) 46 (85%)
Neurological 01 (6%) 02 (4%)
Other 04 (22%) 06 (11%)
Table 2: Demographic table, smoker and non-smoker groups, showing age at death in each
group; gender; main cause of death; PM10, particulate matter with aerodynamic diameter ≤ 10
μm (μg/m3) for the years 2011, 2012, 2013 and 24 hour before death. Data are presented as
mean (standard deviation) for continuous variables, or n (%) for categorical variable.

35
4.2 Lung Surface Carbon
There was no association between age and LSurC (Rs= -0.018; P= NS), and there was
no difference in LSurC between males and females (4.24cm2 (1.9 to 8.45) vs. 6.18cm2
(4.69 to 9.95) P=NS). There was no difference in LSurC between smokers and non-
smokers 6.74 cm2 (3.47 to 10.02) versus 5.20cm2 (2.29 to 7.54) (Figure 7). There was
no association between LSurC and exposure to environmental PM at the nearest
monitoring station to the home address (Table 6). There was no difference in LSurC and
distance from road, either when expressed as a continuous variable (m), or categorised
by <150 m and > 150m (4.26cm2 (1.69 to 6.77) vs. 6.11cm2 (3.5 to 9.55) P=0.058).
Figure 7: Dot plot of lung surface carbon in smokers and non-smokers. Lung surface carbon
was assessed using image analyses and expressed as cm2/49 cm2 lung surface. There is
significant difference between groups by Mann Whitney test. Bar represents median.

36
There was a marked heterogeneity of LSurC between individuals. In some specimens,
the surface was predominately pink with the fissures relatively free of carbonaceous
PM, in other specimens, large amounts of carbonaceous PM had accumulated both in
fissures with and across whole lung surface (Figure 8).
Figure 8: Image of the lung surface. Standard crops using Image J software. In clockwise order:
1. Non-smoker, female, 85 years old; 2. Smoker, male, 70 years old; 3. Non-smoker subject,
female, 76 years old; 4. Smoker, female, 47 years old.

37
4.3 Alveolar Macrophage Carbon
Alveolar macrophage carbon, showed marked heterogeneity within and between
specimens. There was no association between age and AMC (Rs= -0.197; P= NS), and
there was no difference in AMC between males and females (26.66 (5.5-122.29) vs 28.5
(3.20-99.8) P=NS).
Smokers had increased AMC compared with non-smokers (103.4 (29.44-226.3) vs. 9.27
(3.1-85.13) µm2, P< 0.001, Figure 9). Overall, there was no association between AMC
and any markers of exposure to environmental air pollution. (Table 6).
There was no difference in AMC and distance from road, either when expressed as a
continuous variable (m), or categorised by <150 m and > 150m 33.39 µm2 (5.05 to
107.8) vs. 16.27 µm2 (3.13 to 103.5) P=0.26).
Furthermore, there was no association between AMC and estimates of environmental
PM pollution when the analysis was limited to non-smokers (Table 6).

38
Figure 9: Dot plot of alveolar macrophage carbon in smokers and non-smokers. Airway
macrophage carbon was assessed using image analyses and expressed as µm2. There is
significant difference between groups by Mann Whitney test. (103.4 (29.44 to 226.3) vs. 9.27
(3.1 to 85.13) µm2, P<0.001). Bar represents median.

39
Subject LSurC AMC
01 No data 29.44
02 1.59 226.28
03 6.02 242.92
04 28.85 390.35
05 1 260
06 5.1 103.71
07 3.62 154.24
08 9.07 57.66
09 5.28 281.48
10 13.81 103.42
11 7.23 3.66
12 8.58 1.22
13 9.27 32.38
14 9.83 14.44
15 2.94 32.52
16 10.58 15.66
17 6.26 145.3
18 3.03 35.9
Table 3: Full results of smokers subjects group for Lung surface carbon (LSurC) and alveolar
macrophage carbon (AMC). Data are expressed as µm2.

40
Subject LSurC AMC
2737 0.7 10.57
2781 0.42 9
3722 No data 3.05
3990 5.68 236.82
4000 1.01 85.13
4417 3.46 16.87
7553 8.72 65.62
7554 3.54 251.48
7555 17.49 3.26
7559 2.18 149.12
7588 10.58 4.12
7806 6.15 169.1
7819 10.61 37.15
7824 8.55 100.5
7826 7.25 34.25
7827 5.06 116.59
8108 6.1 207.75
8551 0.75 34.8
8553 0.03 215.5
8648 2.33 119.92
8652 3.55 99.1
8653 3.46 5.6
8658 0.94 1.62
8661 5.7 7.62
8663 12.95 5.48
8698 7.17 29.76
8719 2.77 0.97

41
8722 4.24 124.43
8732 4.05 5.97
8735 8.36 9.27
8799 5.57 2.87
8804 4.28 3.53
8808 0.26 2.82
8811 1.85 3.25
8813 10.24 2.7
8815 1.68 91.14
8817 16.3 2.87
8818 0.19 9.31
8885 6.34 26.66
8902 1.95 0.28
8908 11.66 32.88
8940 3.27 5.55
8957 10.31 1
8975 6.33 40.2
8977 7.26 3.33
8980 5.58 5.4
8982 2.32 3.08
8983 9.37 3.1
8985 11.01 2.95
8988 5.35 0.48
9060 0.11 28.5
9061 4.91 18.5
9063 5.94 3.16
9064 3.09 2.58
Table 4: Full results of non-smokers subjects group for Lung surface carbon (LSurC) and
alveolar macrophage carbon (AMC). Data are expressed as µm2.

42
4.4 Measured PM Exposure
PM10 measurements were represented by annual mean through the years 2012 to 2014.
Air quality levels recommended by the WHO are showing on table 5. The official report
of PM10 from CETESB is showing on tables 7 and 8, where the maximum annual mean
reached 50 μg/m3 and the minimum 27 μg/m3 with average annual mean exposure of
34μg/m3 in both groups, smokers and non-smokers. Correlations between exposure to
environmental PM10 and pre-mortem exposure between LSurC and AMC were done by
Spearman Rank test, where all correlations are non-significant, and we can see the
correlations represented on table 6.
Averaging times Air quality guidelines
PM10 1 year 2 μg/m3
24 hours 50 μg/m3
Table 5: Air quality levels that are recommended by the WHO and that all countries should aim
for. For particulate matter, average levels are recommended over 1 year and for 24 hours,
because both short- and long-term effects occur. It is thought that no guideline will ever provide
complete protection, but health effects can be reduced.

43
4.5 Road and Traffic Exposure
24 hour
before
death
Annual
mean
2013
Annual
mean 2012
Annual
mean
2011
DWTD
vehicles/ho
ur
Home to
major road
(150m)
LSurC
P=0.077
Rs= -0.201
P=0.06
Rs= -0.21
P=0.49
Rs= 0.078
P=0.563
Rs= 0.066
P=0.376
Rs= 0.10
P=0.16
Rs= 0.15
AMC
P=0.454
Rs= -0.088
P=0.066
Rs= -0.215
P=0.009
Rs= -0.303
P=0.572
Rs= -0.067
P=0.092
Rs= -0.197
P=0.655
Rs=0.053
Table 6: Correlations done by Spearman Rank test. All correlations are non-significant. Table
representing correlations between exposure to air pollution and pre-mortem exposure values
between LSurC and AMC. PM10, particulate matter with aerodynamic diameter ≤ 10 μm
(μg/m3).
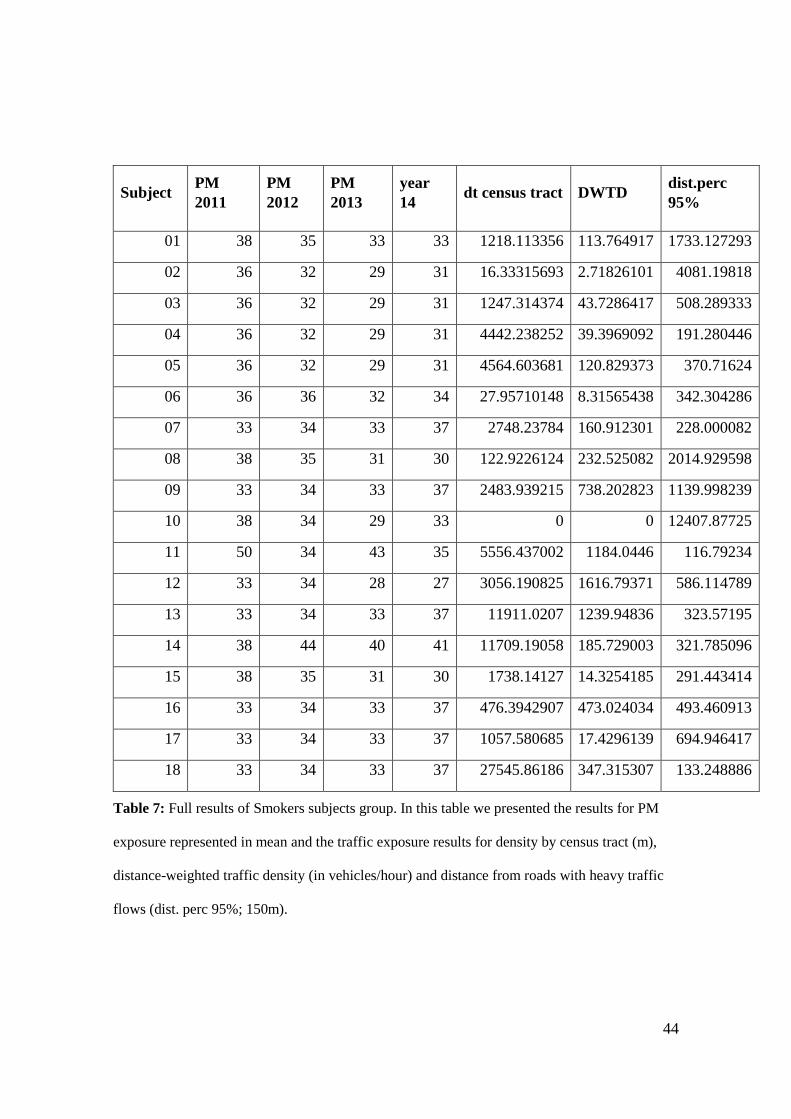
44
Subject PM
2011
PM
2012
PM
2013
year
14 dt census tract DWTD
dist.perc
95%
01 38 35 33 33 1218.113356 113.764917 1733.127293
02 36 32 29 31 16.33315693 2.71826101 4081.19818
03 36 32 29 31 1247.314374 43.7286417 508.289333
04 36 32 29 31 4442.238252 39.3969092 191.280446
05 36 32 29 31 4564.603681 120.829373 370.71624
06 36 36 32 34 27.95710148 8.31565438 342.304286
07 33 34 33 37 2748.23784 160.912301 228.000082
08 38 35 31 30 122.9226124 232.525082 2014.929598
09 33 34 33 37 2483.939215 738.202823 1139.998239
10 38 34 29 33 0 0 12407.87725
11 50 34 43 35 5556.437002 1184.0446 116.79234
12 33 34 28 27 3056.190825 1616.79371 586.114789
13 33 34 33 37 11911.0207 1239.94836 323.57195
14 38 44 40 41 11709.19058 185.729003 321.785096
15 38 35 31 30 1738.14127 14.3254185 291.443414
16 33 34 33 37 476.3942907 473.024034 493.460913
17 33 34 33 37 1057.580685 17.4296139 694.946417
18 33 34 33 37 27545.86186 347.315307 133.248886
Table 7: Full results of Smokers subjects group. In this table we presented the results for PM
exposure represented in mean and the traffic exposure results for density by census tract (m),
distance-weighted traffic density (in vehicles/hour) and distance from roads with heavy traffic
flows (dist. perc 95%; 150m).

45
Subject PM 2011 PM
2012 PM 2013
PM
2014
dt census
tract DWTD
dist perc
95%
19 33 34 33 37 417.19667 31.902546 900.180999
20 33 34 33 37 1927.2101 66.926784 574.836206
21 38 44 40 41 54217.84 307.23542 419.457679
22 38 34 29 33 6941.4141 305.47061 316.654364
23 33 34 33 37 264.57256 46.839034 2409.829895
24 38 35 30 29 1467.622 468.04402 261.03288
25 36 32 29 31 670.54906 68.08986 703.129122
26 36 32 29 31 5791.0775 1137.2145 601.104465
27 33 34 33 37 820.17571 156.11067 192.899033
28 36 32 29 31 4364.7762 432.28354 3047.739395
29 33 34 28 27 24983.783 1120.7029 187.135381
30 38 35 31 30 8012.7161 207.54166 144.402894
31 38 35 31 30 10453.321 268.69932 174.067176
32 39 36 33 40 7203.6609 582.50161 103.163568
33 38 34 29 33 2896.2637 496.36727 548.702711
34 33 34 33 37 3459.3393 9.9534528 778.002254
35 39 36 33 40 11961.59 42.287725 220.933752
36 39 36 33 40 529.06544 14.475292 496.51336
37 33 34 33 37 3593.4593 910.80063 1377.037191
38 36 32 29 31 54.220405 16.227002 446.159755
39 36 36 32 34 662.29307 442.82122 557.737363
40 38 44 40 41 35.654851 12.119176 1852.552685
41 39 36 33 40 4491.5642 355.34097 128.971068
42 33 34 33 37 356.69114 578.09978 10655.69596
43 33 34 28 27 2522.7504 419.24157 574.124275

46
44 33 34 28 27 31703.729 1160.432 111.342181
45 36 32 29 31 6939.4851 383.2052 1709.764827
46 33 34 33 33 348.43565 84.450663 1891.924254
47 36 36 32 34 0 0 2260.083106
48 36 36 32 34 2377.7246 1190.8131 352.857339
49 33 34 33 37 645.18344 10.713737 1283.473748
50 36 33 32 33 456.97197 12.08723 725.620095
51 33 34 33 37 914.22295 13.259389 805.33413
52 39 36 33 40 1495.0677 2062.2728 49.703972
53 38 34 29 33 9028.6488 628.85179 468.776588
54 33 34 33 37 3810.1155 19.14178 189.177402
55 36 32 29 31 3005.8103 856.16282 543.199669
56 32 33 32 37 1249.7841 1020.6238 114.388035
57 39 36 33 40 15457.026 2366.8204 7.039245
58 39 36 33 40 1603.4047 511.60753 719.081207
59 36 36 32 34 511.58629 1167.4326 398.19598
60 38 35 33 33 0 0 988.096095
61 33 34 33 37 1336.8815 33.636092 582.740091
62 33 34 33 37 531.18069 271.98547 950.834747
63 38 34 29 33 7.0201754 1.5086765 610.444609
64 37 34 28 27 2121.4108 468.62684 543.228599
65 38 35 31 30 1894.5368 31.966746 399.889248
66 39 36 33 40 410.57036 37.841663 293.266366
67 39 36 33 40 15992.254 1279.8031 119.34043
68 38 35 30 29 23430.629 4362.5181 42.713184
69 36 32 29 31 14.972393 6.735237 447.094924
70 36 36 32 34 9272.3053 1574.6586 47.772368
71 33 34 28 27 5563.3247 156.78749 181.943003
72 33 34 33 37 1960.9006 1302.6436 2297.56582

47
Table 8: Full results of non-smokers subjects group. In this table we presented the results for
PM exposure represented in mean and the traffic exposure results for density by census tract
(m), distance-weighted traffic density (in vehicles/hour) and distance from roads with heavy
traffic flows (distance percentile 95%; 150m).
4.6 Additional Histopathology Analysis
Histological analysis of a lung specimen showed the presence of carbonaceous PM both
in AM, and under lung surface and deep within the lung tissue compartment. (Figures
10 A and B).
The lung randomly selected for histological analysis was from a smoker. Carbonaceous
PM was present in AM, in tissue at the lung surface, and in non-surface lung tissue
(Figure 11).
As we could observe on the picture (Figure 11), the black pigments in lung surface may
be intracellular or extracellular. The anthracotic spots in the lung surface presented a
rounded or irregular shape, ranging from hardly distinguishable (<1 mm in diameter) to
>50 mm (Figure 10 A and B) (Mitchev et al., 2002). According to the study conducted
by Mitchev and colleagues, the highest prevalence of black spots are throughout the
pleura. This indicates that the process is very common at least in urban dwellers.
Based on these evidences, we could conclude that black spots are present in the lung
surface (LSur) of the vast majority of the urban population and they are more common
in the elderly people.

48
Figure 10: Lung section from a male smoker aged 59 showing; (A) carbon in alveolar
macrophages (arrow), and (B) carbon in lung tissue (arrow) (Original magnification 20x)
Figure 11: Additional hystological analysis. Right upper lung, randomly selected. The
presented subject was a smoker, male, 59 years old. We can observe accumulation of
anthracotic pigment deposition along the lung tissue.

49
5. Discussion
In this study we, for the first time, used image analysis to measure the amount of
carbonaceous PM on the lung surface of long-term residents of São Paulo. Since Saxena
and colleagues (Saxena et al, 2011) reported high levels of extracted elemental carbon
deposits in autopsied lungs of smokers, we hypothesised that smoking is the major
determinant of carbonaceous PM at both the lung surface and in lung macrophages. But,
despite significant LSurC in many lung specimens, we found no difference in LSurC
between smokers and non-smokers. By contrast, and compatible with previous reports
(You et al, 2015), we found smoking was associated with AMC compared with non-
smokers.
Since we found no difference in LSurC between smokers and non-smokers, our
hypothesis that smoking is the major determinant of black staining at the lung surface is
not supported. However, our AM findings provide clear evidence that smoking does
increase the carbon PM burden. Why this is not reflected by increased translocation of
PM to the lung surface is to date unclear. A putative explanation is that in residents of
São Paulo, the contribution of smoking is overwhelmed by chronic inhalation of very
high levels of ambient PM (Kulkarni et al., 2006; CETESB, 2009; Habermann et al.,
2014).
Indeed, previous studies suggest that environmental PM is a major driver of
accumulation of carbonaceous PM within lung tissue. For example, Saxena et al
(Saxena et al., 2011) reported extracted elemental carbon PM from the lungs of non-
smokers, and Pinkerton et al (Pinkerton et al., 2000), reported carbonaceous PM in
lymphatics in the subpleural interlobular septa of non-smoking Californian residents.
50
Furthermore, animal models suggest an association between LSurC and inhaled dose of
environmental PM. First, in cats exposed to 20h diesel exhaust PM for 28 days, Pepelko
et al (Pepelko et al., 1980) reported increased charcoal grey staining of the lung surface
compared control animals exposed to air. Second, in rats, Kato et al (Kato et al., 2003)
reported that exposure for 24 to 60 weeks to urban roadside filtered air, resulted in a
dose-dependent increase in carbonaceous staining of the lung surface. Third, in rats with
repeated inhalation of biodiesel PM for 13 weeks, Finch et al (Finch et al., 2002)
reported that increased inhaled dose resulted in increased grey discoloration of the lung
surface. Although our study is the first to quantify the amount of carbon at the lung
surface of human smokers and non-smokers, evidence of a major role of environmental
PM on black staining is provided by the 1971 study of Pratt and Kilburn (Pratt PC and
Kilburn KH, 1971), who in an analysis of 250 non-emphysematous adults lungs,
concluded that pigmentation may be an indicator of exposure to environmental PM.
Although we found that smoking is not a major determinant of LSurC, and that the most
likely source of LSurC is therefore environmental PM air, we were not able to establish
a causal association. Specifically, we found no association between LSurC and markers
of environmental PM - either mean annual PM10 at the nearest monitoring station to the
home address, or distance-weighted traffic density, or distance of home to the nearest
heavily used road. Although these exposure variables are reported to be associated with
adverse health effects in urban populations (Jacobs et al., 2011; Bunn et al., 2001; Bai et
al., 2015; Pearson et al., 2000), we speculate that either these markers do not accurately
reflect exposure to environmental PM or there was misclassification with the exposure
data. Indeed, a detailed address history was not routinely recorded by the standard

51
autopsy questionnaire completed by relatives (which was used by us to obtain exposure
data).
By contrast, increased AMC found in smokers strongly suggests that relative-reported
smoking status is accurate, and is compatible with a previous study (Niewoehner et al.,
1974).
The role of accumulation of carbonaceous PM at the lung surface in mediating lung
injury was not determined by the present study. However, pathological abnormalities in
the lung are found in areas adjacent to carbon PM aggregates. For example, Pinkerton et
al (Pinkerton et al., 2000) reported an association between retained tissue carbon and
fibrosis in adjacent respiratory bronchioles. Although we did not assess fibrosis, we did
confirm in a randomly selected lung (which by chance was from a smoker), that LSurC
results from significant accumulation of interstitial carbon at the pleural surface. The
effect of leaching of toxins from retained PM on inflammatory signalling pathways
should therefore be a focus of future studies.
Another important thing to be considered, is the mechanism of deposition and
pulmonary clearance of inhaled particles. According to Stuart (Stuart, 1976),
macrophage removal is accepted to be a major clearance mechanism within the
pulmonary region of the lung. At this study, Stuart found that macrophage migration is
thought to occur either up the tracheobronchial tree or perhaps via regional lymph
nodes. In addition, particle bearing macrophages may migrate to subpleural and
paraseptal positions, to perivascular sites, or to peribronchial positions where long-term
storage in the lung may occur, as discussed in another study by Green (Green GM,
1973).

52
5.1 Particulate matter and health effects
The adverse health effects of air pollution on cardiovascular health have been
established in a series of major epidemiologic and observational studies (Dockery at al.,
1993; Hoek G, 2002)
Supporting the findings that in large urban areas, air pollution emissions are the major
determinant of an increase in morbidity and daily mortality risk, Mills and colleagues
demonstrated for the first time that inhalation of diesel exhaust, a common urban air
pollutant, can impair vascular function in humans. Using a double-blind, randomized,
cross-over study design, they have assessed the effects of diesel exhaust inhalation on
two important and complementary aspects of vascular function: the regulation of
vascular tone and endogenous fibrinolysis. After that, Mills et al, were able to
demonstrate that both are impaired and plausibly related to the well-documented
adverse cardiovascular effects of air pollution. These important findings provide a
plausible mechanism that links air pollution to the pathogenesis of atherothrombosis and
acute myocardial infarction (Mills et al, 2007)
There is consistent evidence that the levels of particulate matter in the air are associated
with the risk of death from all causes and from cardiovascular and respiratory illnesses.
Likewise our demographic data, a study done by Samet and colleague sin 20 of the
largest cities and metropolitan areas in the United States from 1987 to 1994, researches
finding that the association between PM10 levels and the risk of death was strongest for
cardiovascular and respiratory causes of death is consistent with the hypothesis that
persons made frail by advanced heart and lung disease are more susceptible to the
adverse effects of air pollution. They find that the estimated increase in the relative rate

53
of death from all causes was 0.51 percent (95 percent posterior interval, 0.07 to 0.93
percent) for each increase in the PM10 level of 10μg per cubic meter (Samet et al.,
2000).
Other findings from several epidemiologic studies of the longer-term effects of air
pollution on the risk of death suggest that exposure to air pollution may do more than
simply shorten life by a few days (Pope et al., 1995), as it was demonstrated in the
Harvard Six Cities Study that the residents in the cities with the lowest PM levels had a
survival rate roughly 2 years longer than those individuals living in cities with the
highest PM levels (Dockery et al., 1993), while these studies have only examined the
association between air pollution exposures on the same day of death of in the last few
days our study correlated the last 4 years of exposure assessment of each subject.
Despite particulate air pollution was being previously described as a predictor of
mortality (Pope et al., 1995), our study found no association between PM10 and alveolar
macrophage or between PM10 and lung surface tissue compartment.
Although we cannot identify the exact mechanisms involved in short and long-term
carbon deposition in lung tissues, our data suggest that carbonaceous deposition in the
AM may be a factor in long-term PM-related outcomes. Previous described data
suggested that difference in the composition of particles is associated with
intercompartmental clearance. In the London archival autopsies in lung tissues from the
smog episode found that intercompartmental differences in PM content should largely
be related to the duration of retention in the lung (Hunt et al, 2003). Not less important,
an epidemiologic study accessing the carbon content of airway macrophages in children
as a marker of individual exposure to particulate matter derived from fossil fuel, sought

54
direct evidence of this association.
In addition to that, a study conducted in mice determined that the mechanisms of
distribution and retention of carbonaceous deposition could be affected by
agglomeration and inflammation caused by inhalation of particles (Ryman-Rasmussen
et al, 2009).
On the other hand another study observed an estimation between air pollution and
cigarette smoke risk factor showed that mortality risk when the data were separated by
smoking status and gender, the risk was as high for never-smokers as it was for ever-
smokers and as high for woman as it was for men (Pope et al., 1995).
There is limited evidence to support the effectiveness of lung surface and alveolar
macrophage black carbon area to predict PM exposure in smokers and non-smokers
populations.
5.2 Histopathology and Prevalence of the Black Spots
As we could observe on figures 8 and 11, the black spots deposits on the lung
compartment may be intracellular or extracellular. Particle deposits are often a
heterogeneous mixture of types and sizes and this suggests that the variation in the
particle burden might provoke a different biologic response on the lung tissue (Mitchev
et al., 2002). The anthracotic spots in the lung surface presented a rounded or irregular
shape, confluent or not, ranging from hardly distinguishable (<1 mm in diameter) to >50
mm (Figure 10 A and B).

55
Based on the data obtained in this study, we could conclude that black spots are present
in the lung surface (LSur) of the vast majority of the urban population and they are more
common in men and in the elderly population.
In the Black Lungs study in Appalachia, we could observe a marked deposition of
particles in lung surface, where a section of lung showed the ravages of progressive
massive fibrosis (PMF). In that study, researchers represented the disease characterizing
by a large, and dense masses of fibrous tissue that often appear in the upper lungs more
than 1 cm in diameter, which often appear in the upper lungs. The lung itself often
appears blackened, and they could observe a presence of fibrosis which impairs the
ability of the lungs to bring oxygen to the blood, which leaves sufferers chronically
short of breath and may result in death. The lung section itself published in their article
showed the black deposition due to the slow build-up of coal dust particles over the
years. Aside that, on a histological sample, highly reactive particles of coal mine dust
can infiltrate the deepest reaches of the lung, and these inhaled particles create a chronic
inflammatory response that damages the lung and ultimately scars the lungs (EHP –
Appalachia, 2016). In some studies, cigarette smoke is also an evidence of black
pigmentation in lungs. In contrast to the white or pink appearance of normal lungs, the
lungs of heavy smokers are typically dark brown or black (Churg et al., 2005). In the
study conducted from You and colleagues, they found that the same anthracotic
pigmentation observed in the lung cells from smokers, were not present in the same
cells isolated from non-smokers, suggesting lacked the pigment (You et al., 2015).
Therefore, the lack of information about the occupation of the subjects does not allow
further interpretation of the work related determinants of black spots, and it will be
discussed in more details on the section below.

56
5.3 Limitations
5.3.1 General limitations
We recognize that there are some limitations to this work.
For example, on the data collection, we have initially reached the target population but
some samples had to be reject after further microscopically analysis. In some cases due
to severe embolism or further confirmed diagnosis of pneumonia the quality of the slide
was compromised. In other cases we had to reject the case subject after poor processing
of the slides technique during the cytology staining process or during the scanning
process when the quality of the images or quality of the slides compromised the final
results on the image analysis.
We also find some limitations collecting demographic data and subject history with the
relatives. The lack of a specialised nurse or professional interviewer exclusively to our
research team at the São Paulo Autopsy Centre (SVOC), limited us on the possibility of
applying a more detailed questionnaire. In this case, missing bias in exposure history
was the main limitation in the study population.
Confounding bias such as indoor exposure or pack of cigarettes per year could not be
accessed.
An exploration of how much “history” is needed in terms of interpretation and
predictive power is also required: it may be that in this domain, only the past n years of
observation are required.

57
5.3.2 Method Limitations
The main limitation in the present study were accessing lung macrophage carbon.
We have performed our analysis using a different software analysis (Image pro Plus,
The Proven Solution, Media Cybernetics Inc., USA) than the original method developed
by Kulkarni et al, 2006 (Image J, National Institute of Health, MD, USA).
In the method performed by Kulkarni et al. (Kulkarni et al., 2006), digital colour images
of 50 randomly chosen AM per subject with an intact cell wall were obtained using a
light microscope, at 1000x (times) magnification under oil immersion. They had
previously ascertained that 50 cells produced a reliable estimate of the median surface
area of carbon. An image of a stage micrometre graticule was obtained at the same time
using the same magnification. Analysis for cytoplasmic carbon was performed blinded.
The analysis steps are illustrated in Figure 12 A and B, showing below. Each AM image
was initially processed doing the following: first, the nucleus was removed from the
image since the stained nucleus was identified as a large aggregate by the image
analysis software. Second, Scion image software (Scion image, Scion, USA) was used
to calculate carbonaceous particle area. The individual areas of carbon were added
together to produce the total two-dimensional surface area of carbon for each AM. The
median area of carbon per AM per subject (the primary measure), and the percentage of
AM containing one or more area of carbon per subject were calculated from 50 cells.

58
Figure 12: Represents image analysis of alveolar macrophages (AM) for cytoplasmic carbon
using Image J (Kulkarni et al., 2006). (A) Digital image of AM obtained under oil immersion
light microscopy (x1000). The black material in the cytoplasm is phagocytosed carbon. The AM
nucleus has been cut using the image analysis programme. (B) Areas of carbon particles
detected by the Scion image analysis software.
Following the same principles and following the method applied in Kulkarni’s research,
we performed our AM carbon (Figure 13) analysis with the method described on the
Methods section above (section 3.2.2). Briefly, we selected digital images of 50 LM per
lung specimen obtained using Pannoramic Viewer (3DHISTECH Ltd., Hungary) slide
scanner, previously described above and showed at the representative picture (Figure 7),
after that the images were analysed for AMC using the software Image Pro Plus
Software (The Proven Solution, Media Cybernetics Inc., USA) scaling was calibrated
using a sample of images. The intensity command was adjusted to obtain the best fit for
carbon that was visible on the colour image. If the software selected nonblack areas

59
(usually areas of intense blue staining), these were automatically excluded from the
analysis.
Figure 13: Image analysis accessing alveolar macrophages (AM) for cytoplasmic carbon using
Image Pro Plus. Digital image of AM obtained using Pannoramic Viewer (x100). The black
material in the cytoplasm is phagocytosed carbon.
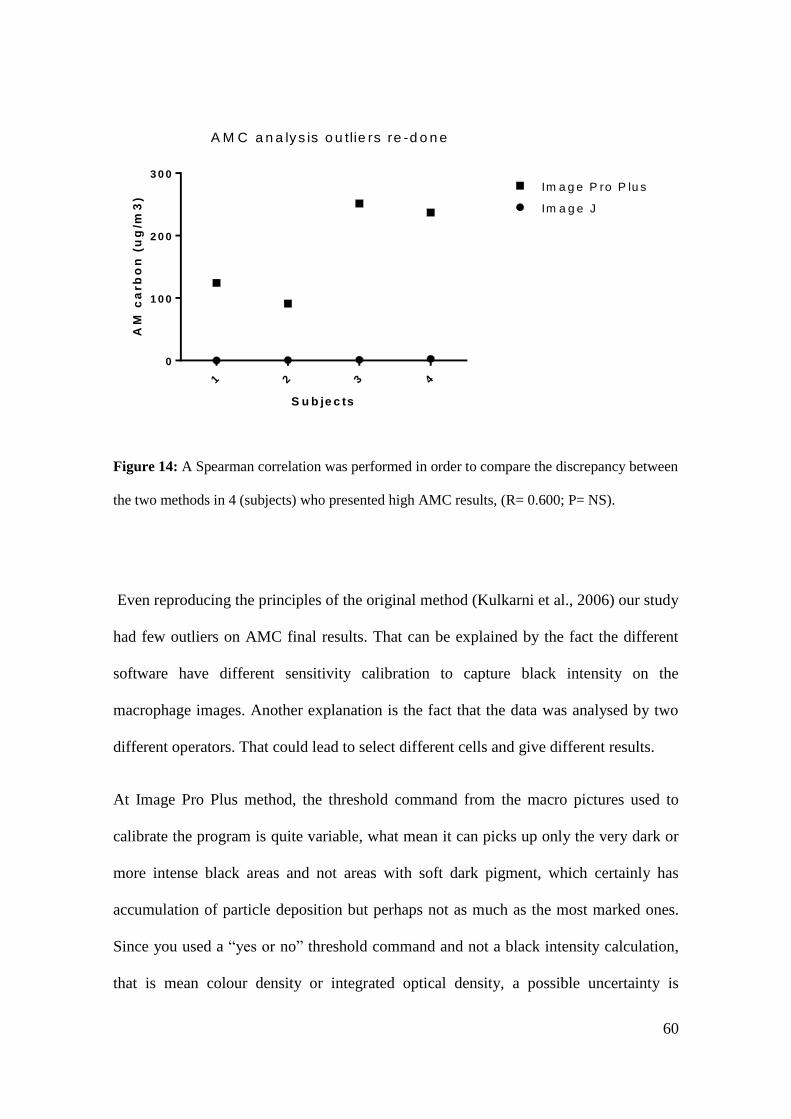
60
1 2 3 4
0
1 0 0
2 0 0
3 0 0
S u b je c ts
AM
ca
rb
on
(u
g/m
3)
Im a g e J
Im a g e P ro P lu s
A M C a n a ly s is o u tlie rs re -d o n e
Figure 14: A Spearman correlation was performed in order to compare the discrepancy between
the two methods in 4 (subjects) who presented high AMC results, (R= 0.600; P= NS).
Even reproducing the principles of the original method (Kulkarni et al., 2006) our study
had few outliers on AMC final results. That can be explained by the fact the different
software have different sensitivity calibration to capture black intensity on the
macrophage images. Another explanation is the fact that the data was analysed by two
different operators. That could lead to select different cells and give different results.
At Image Pro Plus method, the threshold command from the macro pictures used to
calibrate the program is quite variable, what mean it can picks up only the very dark or
more intense black areas and not areas with soft dark pigment, which certainly has
accumulation of particle deposition but perhaps not as much as the most marked ones.
Since you used a “yes or no” threshold command and not a black intensity calculation,
that is mean colour density or integrated optical density, a possible uncertainty is

61
whether this cannot interfere on the final results. In theory, the clearer AMC that have
been picked up at the threshold command and the ones presenting more darker areas
should both have no difference on the final data, but perhaps, if evaluated the intensity
of the colour, and maybe they can influence on the discrepancy at the final results that
we could observe on the outliers.
This is a possible explanation for the lack of differentiation between the groups of
smokers and non-smokers. And also could explain the differences between final AM
areas, where the difference could not be the area occupied by black pigment, but the
intensity of black areas captured.
Based on the evidences, we concluded that the most appropriated method is the method
defined by Kulkarni and colleagues, using Image J as main tool.
5.4 Future Applications and Outlook
A large body of research has been undertaken which falls in the category of potential
applications of large-scale epidemiological studies. These studies include both cohort
and time-series studies that would be too large for the collection of individual scale
information on time-activities and more detailed personal information that should be
collected using validated questionnaires.
For long-term exposure a large range of health effects was for example studied by
previous studies, including cerebrovascular events, and natural-cause mortality
(Stafoggia et al. 2014; Beelen, Raaschou-Nielsen, et al. 2014).
Large studies have as well been undertaken for short-term health effects, such as for
ischemic stroke and mortality (Maynard et al. 2007; Wellenius et al. 2012; Pope III &

62
Dockery 2006). Long-term exposure is to some extent the average of repeated
exposures during a daily routine, and we should also take in consideration that for some
health effects, caused by wholelife exposure can be important. It would be very difficult
to reconstruct time-activity profiles of a population for such extended time periods,
especially in a retrospective study using post-mortem individuals where we face some
obstacles that can lead to missing data and bias interviewing relatives.

63
6. Conclusion
This study found that image analysis quantifies accumulation of PM carbon at
the lung surface. We disproved our hypothesis that smoking is a major
determinant of LSurC.
Although the most likely source of LSurC is environmental PM, we could not
identify an association with markers of exposure.
In summary, we have shown that a combination of quantitative analysis of
carbon on the lung surface (LSurC), histology, and assessment of carbon on
alveolar macrophages (AMC) is a valid approach for evaluating the effects of
airborne particles on the human lung to summarise and bring together the main
areas covered in the writing, in a retrospective way, on the attempt to determine
long-term effects of air pollution in the human lungs.

64
Attachments

65
Attachment A. Official report of the Research Ethics Committee of the Faculty of Medicine,
University of São Paulo signed and approved

66
References
A Scourge Returns Black Lung in Appalachia. https://ehp.niehs.nih.gov/124-A13/
Abbey DE, Burchette RJ, Knutsen SF, McDonnell WF, Lebowitz MD, Enright PL.
Longterm particulate and other air pollutants and lung function in nonsmokers. Am J
Respir Crit Care Med. 158(1):289-98. 1998.
Arnold C. A scourge returns. Black lung in Appalachia. Environ Health Perspect;
124:A13–8. 2015.
Bai Y, Brugha RE, Jacobs L, Grigg J, nawrot T, Nemery B. Carbon loading in airway
macrophages as a biomarker for individual exposure to particulate matter air pollution –
A critical review. Environ Int; (74): 32-41. 2015.
Barnes PJ; 372s:631-640. Cellular and molecular mechanisms of chronic obstructive
pulmonary disease. Clinics in Chest Medicine 35:71–86. doi:
10.1016/j.ccm.2013.10.004, 2014.
Belli JA, Bose S, Aggarwal N, DaSilva C, Thapa S, Grammer L, Paulin LM, Hansel
NN. Indoor particulate matter exposure is associated with increased black carbon
content in airway macrophages of former smokers with COPD. Environ Research; 150:
398-402. 2016.
Bernstein JA, Alexis N, Barnes C, Bernstein IL, Bernstein JA, Nel A, Peden D, Diaz-
Sanchez D, Tarlo SM, Williams PB. Health effects of air pollution. J Allergy Clin
Immunol. 2004.
Brunekreef & Holgate. Air pollution and health. Lancet, 2002.
67
Bunn HJ, Dinsdale D, Smith T, Grigg J. Ultrafine particles in alveolar macrophages
from normal children. Thorax 2001; 56 (12): 932-4.
Carter BD, Abnet CC, Feskanich D, Freedman ND, Hartge P, Lewis CE, Ockene JK,
Prentice RL, Speizer FE, Thun MJ, Jacobs EJ. Smoking and mortality—beyond
established causes. New England Journal of Medicine; 372s:631–640. 2015
CETESB (São Paulo Environmental Agency) (2010) Report of air quality in the State of
Sao Paulo 2009 [in Portuguese]. Sao Paulo: CETESB. 290 p.
Chacraborty J, Schweitzer LA, Forkenbrock DJ. Using GIS to assess the Environmental
Justice consequences of transportation system changes. Transactions GIS 1999; 3:239-
58.
Churg A, Myers JL, Tazelaar H, Wright JL.. Thurlbeck’s pathology of the lung. 3rd
edition, New York, NY: Thieme. 2005.
de Kok TM, Driece HA, Hogervorst JG, Briedé JJ. Toxicological assessment of ambient
and traffi c-related particulate matter: a review of recent studies . Mutat Res . 2006;
613( 2-3): 103- 122.
Delfino RJ, Zeiger RS, Seltzer JM, Street DH. Symptoms in pediatric asthmatics and air
pollution: differences in effects by symptom severity, anti-inflammatory medication use
and particulate averaging time. Environ Health Perspect. 1998
Delfino RJ. Epidemiologic evidence for asthma and exposure to air toxics: linkages
between occupational, indoor, and community air pollution research. Environ Health
Perspect. 2002

68
Dockery DW , Pope CA III , Xu X , et al . An association between air pollution and
mortality in six U.S. cities . N Engl J Med . 1993 ; 329 ( 24 ): 1753 - 1759 .
EPA, 1996. https://www3.epa.gov/scram001/guidance/guide/policymem33d.pdf
Every Breath We Take. Evidence submitted to the Royal College of Physicians
https://www.rcplondon.ac.uk/projects/outputs/every-breath-we-take-lifelong-impact-air
pollution 2016.
Finch GL, Hobbs CH, Blair LF, Barr EB, Hahn FF, Jaramilllo RJ, et al. Effects of
subchronic inhalation exposure of rats to emissions from a diesel engine burning
soybean oil-derived biodiesel fuel. Inhal Toxicol 2002; 14 (10): 1017-48.
Gerber A, Hofen-Hohloch A V, Schulze J, Groneberg D A, Tobacco smoke particles
and indoor air quality (ToPIQ-II) – a modified study protocol and first results. Journal
of Occupational Medicine and Toxicology, 2015; 10:5.
Green, G. M. Alveolobronchiolar transport mechanisms. Arch. Intern. Med. 131: 109.
1973
Gunier RB, Hertz A, Von-Behren J, Reynolds P. Traffic density in California:
socioeconomic and ethnic differences among potentially exposed children J Expo Anal
Environ Epidemiol 2003; 13:240-6.
Habermann M., Gouveia N. Socioeconomic Position and Low Birth Weight among
Mothers Exposed to Traffic-Related Air Pollution. Plos One 9(11); 2014.

69
Hiraiwa, K. & Van Eeden, S. F. 2013. Contribution of lung macrophages to the
inflammatory responses induced by exposure to air pollutants. Mediators Inflamm,
2013, 619523.
Hoek G. Association between mortality and indicators of traffic-related air pollution in
the Netherlands: a cohort study. Lancet, 2002.
How Tobacco Smoke Causes Disease: The Biology and Behavioral Basis for Smoking-
Attributable Disease: A Report of the Surgeon General. Centers for Disease Control and
Prevention (US); National Center for Chronic Disease Prevention and Health Promotion
(US); Office on Smoking and Health (US). Atlanta (GA): Centers for Disease Control
and Prevention (US); 2010.
IBGE, Brazilian Institute of Geography and Statistics.
http://www.ibge.gov.br/english/estatistica/populacao/censo2010/default.shtm
International Agency for Cancer Research, 2013. http://www.iarc.fr/en/media-
centre/pr/2013/pdfs/pr223_E.pdf
Jacobs L, Emmerechts J, Hoylaerts MF, Mathiew C, Hoet PH, Nemery B, Nawrot TS.
Traffic air pollution and oxidized LDL. Plos One 2011; 6(1): e1620.
James Nanoparticulate carbon black in cigarette smoke induces DNA cleavage and
Th17-mediated emphysema. E life Sciences, 2015.
Kato A, Kagawa J. Morphological effects in rat lungs exposed to urban roadside air. .
Inhal Toxicol. 2003; (8):799-818.

70
Kulkarni NS, Prudon B, Pandotti SL, Abebe Y, Grigg J. Carbon loading of alveolar
macrophages in adults and children exposed to biomass smoke particles. Sci Total
Environment 2005; 45 (1-3):23-30.
Kulkarni N., Pierse N., Rushton L,, Grigg J. Carbon in Airway Macrophages and Lung
Function in Children. New England Journal of Medicine; 2006. Vol 355:21-30.
Lim S et al. (2012) „A comparative risk assessment of burden of disease and injury
attributable to 67 risk factors and risk factor clusters in 21 regions, 1990-2010): a
systematic analysis of the Global Burden of Disease Study 2010.‟ The Lancet 380:
2224-60. 2010
Martonen TB, Bell KA, Phalen RF, Wilson AF, Ho A. Growth rate measurements and
deposition modelling of hygroscopic aerosols in human tracheobronchial models. Ann
Occup Hyg. 1982
Matter and Tissue Remodeling in Human Lung. Environmental Health Perspectives,
November, 2000. Vol. 108 n. 11.
Maynard D, Coull BA, Gryparis A, Schwartz J. Mortality risk associated with short-
term exposure to traffic particles and sulfates. Environ Health Perspect. 2007
Mills NL, Törnqvist H, Robinson SD, Gonzalez MC, Söderberg S, Sandström T,
Blomberg A, Newby DE, Donaldson K. Air pollution and atherothrombosis. Inhal
Toxicol; 1:81-9. 2007.
Niewoehner DE, Kleinerman J, Rice DB. Pathologic changes in the peripheral airways
of young cigarette smokers. N Engl J Med. 1974; 291(15):755-8.

71
Nwokoro C, Ewin C, Harrison C, Ibrahim M, Dundas I, Dickison I, Mushtaq N, Grigg
J. Cycling to work in London and inhaled dose of black carbon. Eur Respir J 2012; 40
(5): 1091-7.
Pearson RL, Wachtel H, Ebi KL. Distance-weighted traffic density in proximity to a
home is a risk factor for leukemia and other childhood cancers. J Air Waste Manag
Assoc 2000; 50:175–180.
Pepelko WE, Mattox JK, Yang YY, Moore W Jr. Pulmonary function and pathology in
cats exposed 28 days to diesel exhaust. J Environ Pathol Toxicol., 1980. (2-3):449-57.
Perfetti TA, Rodgman A. 2013. The chemical components of tobacco and tobacco
smoke. 2nd edition, Boca Raton, FL: CRC Press.2013
Pinkerton, K. E., Green, F. H. Y., Saiki, C., Vallyathan, V., Plopper, C. G., Gopal, V.,
Hung, D., Bahne, E. B., Lin, S. S., M??Nache, M. G. & Schenker, M. B. 2000.
Distribution of particulate matter and tissue remodeling in the human lung.
Environmental Health Perspectives.
Pope, C. A., Thun, M. J., Namboodiri, M. M., Dockery, D. W., Evans, J. S., Speizer, F.
E. & Heath, C. W. 1995. Particulate air pollution as a predictor of mortality in a
prospective study of US adults. American Journal of Respiratory and Critical Care
Medicine, 151, 669-674.
Pope CA III, Burnett RT, Turner MC, Cohen A, Krewski D, Jerrett M, Gapstur SM,
Thun MJ. Lung cancer and cardiovascular disease mortality associated with ambient air
pollution and cigarette smoke: shape of the exposure-response relationships.
Environmental Health Perspectives 119:1616–1621. 2011.

72
Pope CA III, Dockery DW. Health effects of fine particulate air pollution: lines that
connect. J Air Waste Manag Assoc 2006;56:709-42.
Pratt, P C and Kilburn, K H. extend of pigmentation in autopsied human lungs as an
indicator of particulate environmental air pollution. Chest 1971; 59, Suppl: 39S+
Reynolds P, Behren JV, Gunier RB, Goldberg DE, Hertz A, Smith D. Traffic patterns
and childhood cancer incidence rates in California, United States. Cancer Causes
Control 2002; 13:665-73.
Robert D. Brook et al. Particulate Matter Air Pollution and Cardiovascular Disease: An
Update to the Scientific Statement from the American Heart Association. Circulation.
2010;121:2331-2378. 10th May 2010.
Ryman-Rasmussen, Jessica P, Cesta, Mark F, Brody, Arnold R, Shipley-, Jeanette K,
Everitt, Jeffrey,, Tewksbury, Earl W , Moss, Owen R ,Wong, Brian a , Darol, E ,
Andersen, Melvin E, Bonner, James C. Inhaled Carbon Nanotubes Reach the Sub-
Pleural Tissue in Mice. NIH Public Access; 747-751, 2010.
Saieg MA, Cury PM, Godleski JJ, Stearns R, Duarte LG, D'Agostino L, Kahn H, Pinto
EM, Mauad T, Saldiva PH, Bernardi FD. Differential elemental distribution of retained
particles along the respiratory tract. Inhal Toxicol. 2011 Jul; 23(8):459-67.
Salvi S. Tobacco smoking and environmental risk factors for chronic obstructive
pulmonary disease. Clinics in Chest Medicine 35:17–27. 2014.
Saxena RK, McClure ME, Hays MD, Green FH, McPhee LJ, Vallyathan V, Gilmour
MI. Quantitative assessment of elemental carbon in the lungs of never smokers,
cigarette smokers, and coal miners. J Toxicol Environ Health A., 2011. 74(11):706-15.

73
Scarborough P, Bhatnagar P, Wickramasinghe K et al. The economic burden of ill
health due to diet, physical inactivity, smoking, alcohol and obesity in the UK: an
update to 2006–07 NHs costs. Journal of Public Health, May 2011.
Schwartz J . Short term fl uctuations in air pollution and hospital admissions of the
elderly for respiratory disease . Thorax . 1995 ; 50 ( 5 ): 531 - 538 .
Souza MB, Saldiva PH, Pope CA 3rd, Capelozzi VL. Respiratory changes due to long-
term exposure to urban levels of air pollution: a histopathologic study in humans. Chest.
1998 May; 113(5):1312-8)
Stafoggia M, Cesaroni G, Peters A, Andersen ZJ, Badaloni C, Beelen R, Caracciolo B,
Cyrys J, de Faire U, de Hoogh K, Eriksen KT, Fratiglioni L, Galassi C, Gigante B,
Havulinna AS, Hennig F, Hilding A, Hoek G, Hoffmann B, Houthuijs D, Korek M,
Lanki T, Leander K, Magnusson PK, Meisinger C, Migliore E, Overvad K, Ostenson
CG, Pedersen NL, Pekkanen J, Penell J, Pershagen G, Pundt N, Pyko A, Raaschou-
Nielsen O, Ranzi A, Ricceri F, Sacerdote C, Swart WJ, Turunen AW, Vineis P, Weimar
C, Weinmayr G, Wolf K, Brunekreef B, Forastiere F. Long-term exposure to ambient
air pollution and incidence of cerebrovascular events: results from 11 European cohorts
within the ESCAPE project. Environ Health Perspect. 2014
Tour M David B Corry Farrah Kheradmand. Nanoparticulate carbon black in cigarette
smoke induces DNA cleavage and Th17-mediated emphysema. eLife 2015;4:e09623.
U.S. Department of Health and Human Services, Public Health Service, The Health
Consequences of Smoking; A Public Health Service Review: 1967

74
Wang B, Ho SSH, Ho KF, Huang Y, Chan CS, Feng NSY. An environmental Chamber
study of the characteristics of air Pollutants released from environmental tobacco
smoke. Aerosol and Air Quality Research. 2012.
Weigert C (1898) Über eine Methode zur Färbung elastischer Fasern. Zentralbl. Allg.
Pathol. 9, 289-292.ing and Health; 1984. DHHS Publication No. (PHS) 84-50205.
Weinmayr GC, Wolf K, Brunekreef B, Forastiere F. Long-term exposure to ambient air
pollution and incidence of cerebrovascular events: results from 11 European cohorts
within the ESCAPE project. Environ Health Perspect. 2014
World Health Organisation 2016
http://www.who.int/gho/publications/world_health_statistics/2016/EN_WHS2016_Cha
pter3.pdf?ua=1
World Health Organisation 2014 http://www.who.int/mediacentre/factsheets/fs310/en/
World Health Organisation 2013. http://www.who.int/whr/2013/report/en/
World Health Organisation: Air Quality Guidelines - Global Update 2005
www.who.int/phe/health_topics/outdoorair/outdoorair_aqg
Wellenius GA, Burger MR, Coull BA, Schwartz J, Suh HH, Koutrakis P, Schlaug G,
Gold DR, Mittleman MA. Ambient air pollution and the risk of acute ischemic stroke.
Arch Intern Med. 2012
You R, Wen Lu Ming Shan Jacob M Berlin Errol LG Samuel Daniela C Marcano
Zhengzong Sun William KA Sikkema Xiaoyi Yuan Lizhen Song Amanda Y Hendrix