carbon steel wire rod and round wire: · pdf fileunited states tariff commission carbon steel...
TRANSCRIPT
UNITED STATES TARIFF COMMISSION
CARBON STEEL wmE ROD AND ROUND WIRE: WORKERS OF THE MONESSEN, PENNSYLVANIA
PLANT OF WHEELING-PITTSBURGH STEEL CORPORATION
Report to the President on Investigation No. TEA-W-181
Under Section 301(c) (2) of the Trade Expansion Act of 1962
TC Publication 566 Washington, D. C.
April 1973
UNITED ST ATES TARIFF COMMISSION
Catherine Bedell, Chairman
Joseph 0. Parker, Vice Chairman
Will E. Leonard, Jr.
George M. Moore
J. Banks Young
Italo H. Ablondi
Kenneth R. Mason, Searetazy
Address all communications to
United States Tariff Commission
Washington, D. C. 20436
C 0 N T E N T S
Report to the President--------~------------------------------Findings of the Commis~ion--~-----------------------------Views of Chairman Bedell, Vice Chairman Parker, and
Commissioners Leonard and Young-------------------------Dissenting views of Commissioners Moore and Ablondi-------
Information obtained in the investigation: Description and uses:
Wire rod----------------------------------------------Wire---------------------------------------------------
U.S. tariff treatment: Wire rod----------------------------------------------Wire-------------------------------------------------
U.S. producers--------------------------------------------U.S. consumption:
Wire rod---------------------------------------------Wire--------------------------------------------------
U.S. production, shipments, and exports: Wire rod---------------------------------------------Wire--------------------------------------------------
U.S. imports: Wire rod------------~--------------------------------Wire--------------------------------------------------
Voluntary restraint agreements with the EEC and Japan----Foreign labor costs related to U.S. imports--------------Wheeling-Pittsburgh Steel Corp.:
The corporation--------------------------------------The Monessen Plant----~-------------------------------
Production---------------------------------------Shipments----------------------------------------Employment---------------------------------------Prices--------------------------------------------
J ohnson Steel & Wire Co.-----------------------------Monessen/Johnson Steel & Wire Co. Comparison---------
Appendix A. Statistical appendix------------------------Appendix B. Texts of voluntary restraint agreements with
the European Economic Community and Japan--Appendix C. Relative labor costs in the iron and steel
industries of five countries, 1964-71-------Appendix D. Statements made by representatives of th·e
steel industry before the House Committee on Education and Labor in connection with bill H.R. 478 to amend the Fair Labor Standards act of 1938 (Sept. 13, 1967)------
1 2
3 7
A-1 A-2
A-4 A-7 A-9
A-11 A-11
A-12 A-13
A-14 A-16 A-17 A-18
A-19 A-20
* * * * * * * * * * * * * * * * * * A-35
A-46
A-49
A-52
ii
CONTENTS
Appendix Tables
l, Carbon-Steel wire rod: U.S. production, imports for consumption, exports of domestic merchandise, and apparent consumption, 1965-72-~---------------------------- A-36
1-A Carbon-steel wire rod: Shipments by U.S. producers and apparent open-market U.S. consumption, 1965-72----- A-36
2. Carbon-steel round wire: U.S. production, imports for consumption, exports of domestic merchandise, and apparent consumption, 1965~72--------------------------------------- A-37
2~A Carbon-steel round wire: Shipments by U.S. producers and apparent open-market U.S. consumption, 1965-72----- A-37
3. Carbon-steel wire rod: U.S. exports of domestic mer-chandise, by principal markets, 1966-72-------------------- A-38
4. Carbon-steel wire rod: U.S. imports for consumption and ad valorem equivalents for years following reductions in rate of duty, 1930-72----------------------------------- A-39
5. Carbon-steel wire rod: U.S. imports for consumption, by _principal sources, 1966-72--------------------------------- A-40
6. Carbon-steel round wire: U.S. imports for consumption, by principal sources, 1966-72--------------------------------- A-41
7. Carbon-steel round wire: U.S. imports for consumption and ad valorem equivalents for years following reductions in rate of duty, 1931-72----------------------------------- A-42
8. Monessen plant, Wheeling-Pittsburgh Steel Corporation: Shipments of all steel products. of carbon-steel wire rod and wire, 1968-72---------------~---------------------- * * *
9.
10.
Monessen plant, Wheeling-Pittsburgh Steel Corporation: Average number of employees and of production and related workers, and total man-hours worked by the latter, 1968-72-~-----------------------------------------
Comparison of average unit values of wire rod purchased and round wire shipped, and man-hours per ton of round wire produced by the Monessen plant and Johnson Steel and Wire Company, 1968-72--------------------------------------
* * *
* * *
Report to the President
To the President:
U.S. Tariff Commission, April 6, 1973
In accordance with section 301 (f) (1) of the Trade Expansion Act
of 1962 (76 Stat. 885), the U.S. Tariff Commission herein reports the
findings of an investigation, made under section 301 (c)(2) of the Act,
in response to a petition filed on behalf of a group of workers.
On February 5, 1973, the Tariff Commission received a petition from
the United Steelworkers of America on behalf of the workers and former
workers of the Monessen, Pennsylvania, plant of the Wheeling-Pittsburgh
Steel Corporation, Pittsburgh, Pennsylvania, filed for a determination
of their eligibility to apply for adjustment assistance. The Commission
instituted an investigation (TEA-W-181) on February 14, 1973, to determine
whether, as a result in major part of concessions granted under trade
agreements, articles like or directly competitive with the carbon-steel a
wire rod and round wire (of the types provided for in items 608.70 to
608.75, inclusive, and 609.40 to 609.43, inclusive, of the Tariff
Schedules of the United States) that are produced by the Wheeling-
Pittsburgh Steel Corporation at Monessen, Pennsylvania, are being imported
into the United States in such increased quantities as to cause, or
threaten to cause, the unemployment or underemployment of a significant
number or proportion of the workers of such firm, or an appropriate
subdivision thereof.
Public notice of thelilvestigation was given by posting copies of
the notice at the office of the Commission in Washington, D.C., at
the New York office, and by publication in the Federal Register of
February 20, 1973 (38 F.R. 4695). No public hearing was requested and
none was held.
2
The information in this report was obtained from the United
Steelworkers ·of America and its District No. 15; from the Wheeling
Pittsburgh Steel Corporation, and other producers of wire rod and wire;
'from trade associations; and from the Commission's files.
Finding of the Commission
On the basis of its investigation, the Commission finds (Commis
sioners Moore and Ablondi dissenting) that articles like or directly
competitive with wire rods and round wire produced by the Wheeling
Pittsburgh Steel Corp., are not, as a result in major part of conces
sions granted under trade agreements, being imported in the United
States in such increased quantities as to cause, or threaten to cause,
the unemployment or underemployment of a significant number or propor
tion of the work~rs of the firm, or an appropriate subdivision thereof.
3
Views of Chairman Bedell, Vice Chairman Parker, and Commissioners Leonard and Young
On February 5, 1973, the United Steelworkers of America filed a
petition for adjustment assistance under section 30l(a)(2) of the
Trade Expansion Act of 1962 on behalf of workers and former workers
who had produced or are producing carbon-steel wire rod and round wire
at the Monessen, Pa., plant of Wheeling-Pittsburgh Steel Corp,,
Pittsburgh, Pa. In December 1972 the wire rod operation was terminated;
the production of round wire is scheduled to be terminated in June 1973.
A subsidiary of Wheeling-Pittsburgh. (Johnson Steel and Wire Co.) has
been producing and will continue to produce carbon-steel round wire
in its three plants in Worcester, Mass., Akron, Ohio, and Los Angeles,
Calif.
The Tariff Commission has frequently stated that the Trade Expan-
sion Act of 1962 establishes four criteria to be met in order for an
affirmative determination to be made. Those criteria are as follows:
(1) An article like or directly competitive with an article produced by the workers concerned must be imported in increased quantities;
(2) The increased imports must be a result in major part of concessions granted under trade agreements;
(3) A significant number or proportion of the workers concerned must be unemployed or underemployed, or threatened with unemployment or underemployment; and
(4) The increased imports resulting in major part from trade-agreement concessions must be the major factor in causing or threatening to cause the unemployment or underemployment·.
4
If any one of the above criteria is not satisfied in a given case,
the Commission must make a negative determination. It is our judgment
that the fourth criterion has not been met in the case at hand, and,
therefore, we have made a negative determination. Under the circum
stances, the Commission has not been required to reach a conclusion
respecting the first three criteria, and it has not done so.
The Wheeling Steel Corp. merged with the Pittsburgh Steel Co.
in 1968 forming the present corporation. It is the ninth largest in
tegrated steel producer in the United States. Its output consists
primarily of flat-rolled products; during 1968-71, its shipments of
wire rod and wire accounted for * * * to * * * percent of its total
shipments.
Prior to the merger, the Monessen plant was part of the Pittsburgh
Steel Co. It is now a major steel-producing unit of the new corporation;
the rod and wire divisions of the plant.have accounted for less than***
percent of the plant's total employment. The decision and announcement
to eventually close the rod-1 'and wire-producing divisions was made by
Pittsburgh Steel in 1966, prior to the merger with Wheeling Steel Corp.
Wire rod
Prior to 1966, wire rod production at the Moness~n plant utilized
two steam-powered rod mills--one built in 1909 and the other in 1919.
The mills processed raw steel (made at the plant) for intracompany and
customer consumption. By the late 19SO's, the rod mills had become
obsolete largely because their output was limited to a maximum coil

5
size of 300 pounds which also limits the length of a continuous coil.
This limitation effectively restricted their competitiveness with new
large domestic--as well as foreign--rod mills which can produce rod
coils of 3,000 pounds or more. The rod mill built in 1909 was closed
in 1966 after the firm's low-carbon-steel merchant wire production was
discontinued. After 1966, the remaining rod mill produced * * *
wire rod for use by the firm's wire-producing subsidiary and for sale
to Page Wire Division of the American Chain and Cable Co., the plant
of which was adjacent to Wheeling-Pittsburgh's Monessen plant. * * *
In late 1971, Page closed down its wire
making operations, and Wheeling-Pittsburgh, confronted with the loss of
its principal rod customer, closed its second obsolete rod mill (built
in 1919) in December 1972. * * *
Round wire
Since 1966, the round-wire-drawing operations at the Monessen
plant--as well as at the three plants of the Johnson Steel Wire Co.-
were confined to * * * steel wire for specialty products. * * *
6
* * * The Monessen wire operation is
scheduled to terminate in June 1973. * * *
· the Johnson Steel and Wire Co. sub
sidiary of Wheeling-Pittsburgh, which, with its two .other wire plants,
will remain in operation * * *
* * *
Five of the largest cus
tomers have indicated that they intend to purchase virtually all of
their wire requirements from other domestic producers after the
Monessen plant has closed.
Conclusion
Based on the foregoing, it is our view that increased imports
resulting from trade-agreement concessions were not the major factor
in causing, or threatening to cause, the unemployment or underemploy
ment of workers of the Wheeling-Pittsburgh Corp. producing carbon
steel wire rod and round wire.
7
Dissenting Views of Commissioners Moore and Ablondi
We have made an affirmative determination with respect to the
workers of Wheeling-Pittsburgh Steel Corporation producing carbon
steel round wire, because the four criteria imposed by the Trade
Expansion Act of 1962 ar~ clearly met:
(1) U.S. imports of carbon-steel round wire have increased from 133,000 short tons in 1958 to 481,000 short tons in 1972.
(2) Such increased imports resulted in major part from reductions in the rates of duty from an average of 23.5 percent ad valorem equivalent in 1930 to an average of 6.2 percent ad·valorem equivalent in 1972.
(3) Although no regular full-time employees at the Monessen~. Pa., plant of Wheeling-Pittsburgh Steel Corporation have yet been terminated, officials of the firm have indicated that the wire-producing facilities will be permanently shut down in June 1973 * * *·
Therefore there is threatened unem-ployment.
(4) Such threatened unemployment is directly attributable to the inability of Wheeling-Pittsburgh Corporation to meet the competition of concession-generated increased imports of round wire which have captured a substantial portion of the U.S. market. Thus, Wheeling-Pittsburgh Corporation decided to close its Monessen, Pa., plant in June 1973.

A-1
INFORMATION OBTAINED IN THE INVESTIGATION
Description of Products and Uses
The Monessen plant of the Wheeling-Pittsburgh Steel Corporation
is an integrated plant that produces pig iron, coke, and steel ingots.
The plant also makes steel billets, bars, and wire, and produced wire
rods until December 1972. This investigation pertains to the now
discontinued production of wire rods and the production of wire which
will be discontinued after June 1973.
Wire rod
For tariff purposes, wire rod is a "coiled, semifinished, hot
rolled product of solid cross section, approximately round in cross
section, not under 0.20 inch nor over 0.74 inch in diameter." Wire
rod is produced from billets that have been heated to the appropri
ate rolling temperature and then passed through a series of reducing
and forming rolls until the desired diameter is reached--usually from
about 0.2187 inch to about 0.734 inch. The rod is laid in coils as
it leaves the last stand of rolls. Substantial tonnages are shipped
in the "as rolled" condition; some are pickled and lime coated, or
oiled, to prevent or retard corrosion in transit and/or to facilitate
drawing. Some wire rod is subjected to metallurgical treatments to
improve the properties or appearance of the metal or to protect it
against rusting, corrosion, or other deterioration. These treatments
include annealing, tempering, rough coating, polishing, and burnishing.
Wire rod is used primarily for the drawing of wire; it has a
few other uses, the most significant of which is for reinforcing concrete.
A-2 The bulk of the steel rods used in the United States is of carbon steel
(i.e., other than alloy steel) with a low or medium-low carbon content.
The low-carbon rod (by weight up to 0.25 percent carbon)--the more
important in terms of volume--is used in the production of wire for
nails, barbed wire, various types of fencing and netting, and building
mesh for reinforcing concrete. The low- and medium-low-carbon grades
of rod, as well as the higher carbon and alloy grades are used to make
fine and specialty wire for springs, strand, rope ar.id cable, and
other wire products requiring special properties. Since 1966, the
Monessen plant of Wheeling-Pittsburgh Steel Corporation has produced
* * * rod •
. Wire
The term "wire," as it applies to steel, is defined in headnote 3(i)
to part 2B of schedule 6 of the Tariff Schedule~ of the United States
(TSUS) as "a finished, drawn, non-tubular product, of any cross-sectional
configuration, in coils or cut to length, and not over 0.703 inch in
maximum cross-sectional dimension." The term "wire" also includes a
product of "solid rectangular cross section, in coils or cut to length,
with a cold-rolled finish, and not over 0.25 inch thick and not over
0.50 inch wide." Round wire, that with a circular cross section, is
by far the principal type of wire produced and the only type produced
at the establishment involved in this investigation.
The wire here considered is produced by cold-drawing carbon-steel
wire rod which was previously cleaned with acid, rinsed, and coated with
lime, borax, or other suitable material. The coating material neutralizes
A-3
any remaining acid and aids in the lubrication of the wire rod as it is
drawn through one die, or continuously through a series of dies, each
designed to further reduce the cross-sectional dimension of the w~re.
The cold reduction of steel by drawing increases its hardness and tensile
strength but reduces its ductility. Accordingly, most wire cannot be
drawn through a long series of dies without intermediate heat treatment
to relieve the stresses induced by the cold working and to restore
ductility. By altering the dr~wing and heat-treating operations, wire
of various mechanical properties can be made from wire rod of the same
chemical composition. The most widely used heat-treating process used
in wiredrawing is annealing, which renders the metal· less brittle. Harden
ing and tempering treatments are widely used to obtain the characteristics
necessary to avoid permanent deformations in wire used in springs and
other products where it is subjected to great stress.
The applications of carbon-steel wire are many. Low-carbon steel
wire may be used for the manufacture of such articles as welded wire mesh,
nails, welding rod.S, garment hangers and wire fencing. Medium-carbon
steel wire is, among other uses,.utilized in the manufacture of auto seat
and furniture-spring structures.
Medium- to high-carbon steel wire is o~en used in certain types of
high voltage electrical transmission lines and steel cables. High-carbon
steel wire is used for p:i,ano wire, spring wire, and in beading_ for pneu
matic tires. Since 1966, the Monessen plant of Wheeling-Pittsburgh has
produced mainly * * * wire.
A-4
U.S. Tariff Treatment
Wire rod
The provisions in the Tariff Act of 1930 for carbon-steel wire rod,
originally classified under paragraph 315 of that act, were not
significantly changed with the adoption of the Tariff Schedules of the
United States in 1963. The separate tariff classifications are based
on whether or not the rod has been tempered, treated, or partly manu
factured and on unit values. The current rates provided for carbon
steel wire rod in schedule 6 of the TSUS reflect concessions granted by
the United States under the General Agreement on Tariffs and Trade
(GATT); the rates in items 608.70 and 608.73--0.1 cent and 0.2 cent
per pound, respectively--have been in effect since July 1, 1963, and
those in items 608.71 and 608.75-~0.25 cent and 0.375 cent per pound,
respectively--since June 30, 1958, as shown in the table on the following
page.
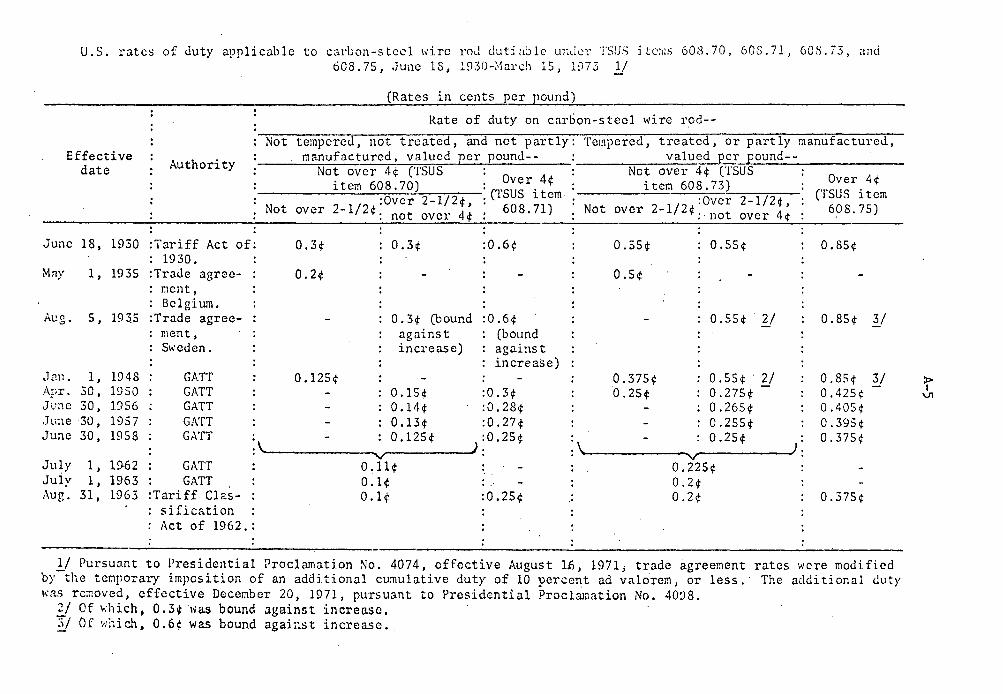
The ad valorem equivalents of the specific rates of duty applicable
to carbon-steel wire rod in 1931 and 1972, computed on the basis of
imports in those years are shown in the table on the page following the
table showing rates of duty.
U.S. rates of Juty applicable to carbon-steel wire roe! dutja:.ilc UEdcr ·;·su.:; itc:i;s 608.70, 608.71, 60.S.73, and 608. 75, .June 18, 1.930-March 15, 1073 y
(Rates in cents per pound)
Rate of duty on carbon-steel wire rod--
Not tempcrcCI~TTreaTccf,ru1crnotpar-fly: Ter!pc-rcd-,-trc-atcd, or partly- nianufactured, Effective
date Authority manufactured, valued per pound-- : valu~cr~p=-o_u_n_d_-_-______ _
Not over 4¢ (TSUS : 0 4
: Net over 4¢ (TSUS item 608.70) : (TS~~r. ¢ . : item 608.73)
I :Over 2-1/2¢, : item : I :Over 2-1/2¢,
Not over 2-1 2¢: not over 4¢ : 608. 71) : Not over 2-1 2¢: not over 4¢
June 18, 1930 :Tariff Act of: 0.3¢
0.2¢
0.3¢ :0.6¢ 0.55¢ 0.55¢ : 1930.
M:?)' 1, 1935 :Tra<le agree-: ment, : Belgium.
Aug. s, 1935 : Trade agree-ment, Sweden.
J<>.n. 1, 1948 : GATT Apr. 30, 1950 : GATT JL1i1C 30, 1956 : GATT .June 30, 1957 : GATT June 30, 1958 : GATT
July 1, 19-62 : GATT Juiy 1, 1963 : GATT Aug. 31, 1963 :Tariff Clas-
sification
0.125¢
0. 3¢ (bound against increase)
:0.6¢ (bound against increase)
0.15¢ :0.3¢ 0.14¢ :0.28¢ 0.13¢ :0.27¢
:\ - : 0.125¢ :0.25¢ . ) . . v . 0 .11¢ 0.1¢ 0.1¢ :0.25¢
: Act of 1962. :
0.5¢
0.375¢ 0.25¢
0.55¢ y
0.55¢'2/ 0.275¢ -0.265¢ 0.255¢
: - : 0.25¢ : : :
0.225¢ 0.2¢ 0.2¢
Over 4¢ (TSUS item
608.75)
0.85¢
0.85¢ 3/
0.8S¢ 3/ 0.425¢ 0.405¢ 0.395¢ 0.375¢
0.375¢
1/ Pursuant to Presidential Proclamation No. 4074, effective August 1.6, 1971; trade agreement rates were modified by-the tcmpo..-ary imposition of an additional cumulative duty of 10 percent ad valorem, or less.· The additional <luty 1·;as rc;::oved, effective December 20, 1971, pursuant to Presidential Proclamation No. 40'.)8.
2i Of i.;hich, 0. 3¢ ·was bound against increa.se, "IJ Of w:~ich, 0.6¢ was bound agaiast increase.
:x> I
V1
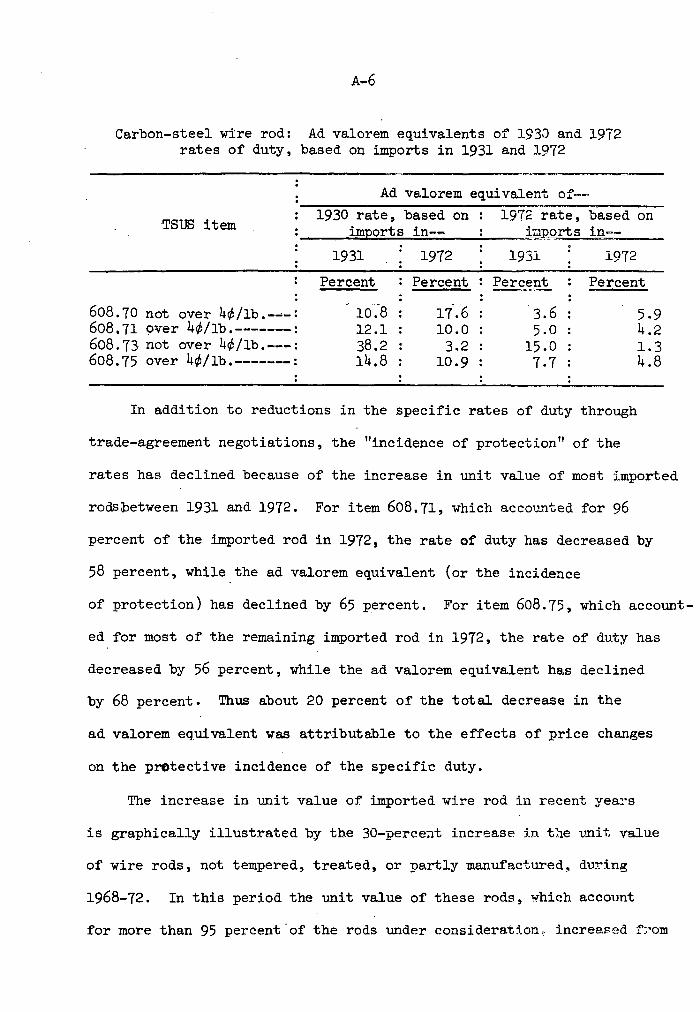
A-6
Carbon-steel wire rod: Ad valorem equivalents of 1930 and 1972 rates of duty, based on imports in 1931 and 1972
Ad valorem equivalent of~~
TSUS item 1930 rate, based on 1972 rate, based on
____ i_m.._p .... o_r_t_s_i_n_-------~.i~_:Rqrts in--
1931 1972 1931 1972
Percent Percent Percent Percent
608. 70 not over 4¢/lb.----= 10.-8 17-.6 3.6 608.71 over 4¢/lb.-------: 12.1 10.0 5.0 608.73 not over 4¢/lb.---: 38.2 3.2 15.0 608.75 over 4¢/lb.-------: 14.8 10.9 7.7
In addition to reductions in the specific rates of duty through
trade-agreement negotiations, the "incidence of protection" of the
5.9 4.2 1.3 4.8
rates has declined because of the increase in unit value of most imported
rodsbetween 1931 and 1972. For item 608.71, which accounted for 96
percent of the imported rod in 1972, the rate of duty has decreased by
58 percent, while the ad valorem equivalent (or the incidence
of protection) has declined by 65 percent. For item 608.75, which account-
ed for most of the remaining imported rod in 1972, the rate of duty has
decreased by 56 percent, while the ad valorem equivalent has declined
by 68 percent. Thus about 20 percent of the total decrease in the
ad valorem equivalent was attributable to the effects of price changes
on the protective incidence of the specific duty.
The increase in unit value of imported wire rod in recent years
·is graphically illustrated by the 30-percetlt increase in the 1.-.mit value
of wire rods, not tempered, treated, or partly manufactured, during
1968-72. In this period the unit value of these rods, ¥hich account
for more than 95 percent.of the rods under consideration~ increased f?om
A-7
4.2 to 6.0 cents per pound. In 1968, 71.5 percent of imported rods, not
tempered, treated, or partly manufactured, were those valued not over
4 cents per pound (TSUS item 608.70); in 1972. 99.4 percent of imported
rods, not tempered, treated, or partly manufactured, were those valued
over 4 cents per pound (TSUS item 608.71).
Wire
Carbon-steel round wire was originally classified under paragraphs
316{a) and 317 of the Tariff Act of 1930 and was dutiable at various
rates, depending on wire diameter, value per pound, finish, and end
use. Additional duties were also provided for wire of the type classified
under paragraph 316(a) which had been galvanized or coated with metal.
When the TSUS was implemented on August 31, 1963, the many competing
tariff provisions were consolidated into.two provisions (items 609.40
and 609.42), based solely on wire diameter and with rates developed from
estimated weighted averages of the existing trade-agreement rates. The
adoption of the TSUS eliminated the additional duty for round wire that
was coated and also eliminated all considerations of end use. For round
wire 0.060 inches or more in diameter and containing over 0.25 percent
by weight of carbon (in 609.42), the estimated weighted average of the
pre-TSUS rates resulted unintentionally in a substantial rate reduction.
Accordingly, effective December 7, 1965, the TSUS was amended by the
Tariff Schedules Technical Amendments Act of 1965 (Public Law 89-241),
which established items 609.41 and 609.43 to replace item 609.42; item
609.40 was not changed. No changes in rates of duty resulted from the
Kennedy Round of trade-agreement concessions. The history of rates
applicable to round wire of carbon steel are shown in the following table.
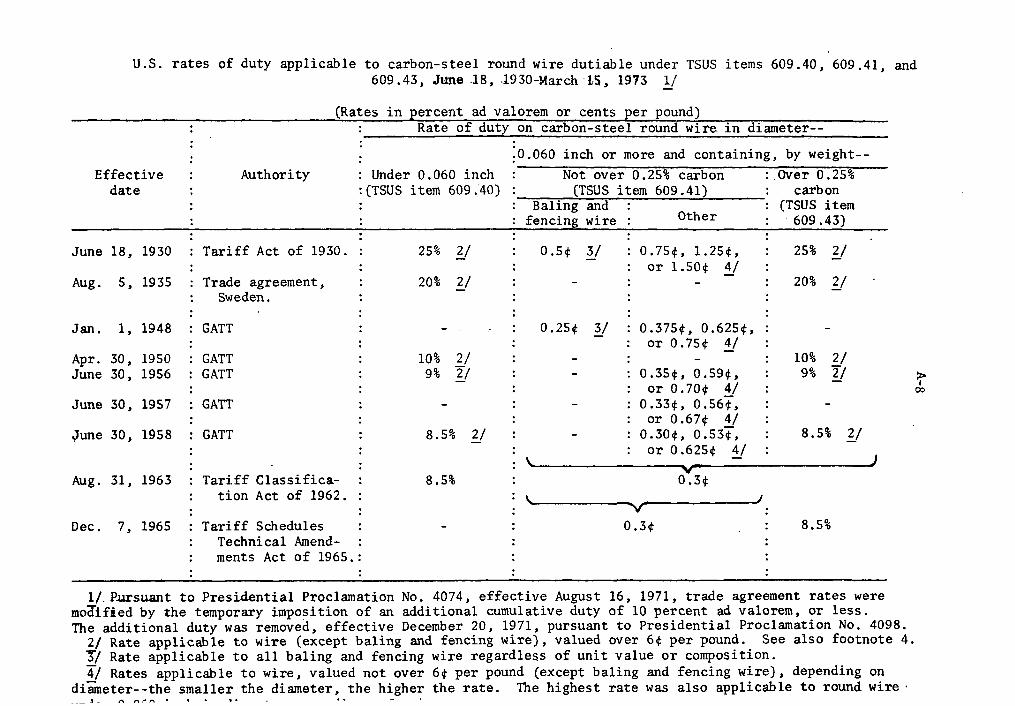
U.S. rates of duty applicable to carbon-steel round wire dutiable under TSUS items 609.40, 609.41, and 609.43, June .18, .1930-March 15, 1973 y
Effective date
June 18, 1930
Aug. 5, 1935
Jan. 1, 1948
Apr. 30, 1950 June 30, 1956
(Rates in E_ercen-~__a~ valorelll_ OJ,'_ cents _per _pound)
Authority
: Tariff Act of 1930. : : Trade agreement,
Sweden. : : GATT : : GATT : GATT
Rate of duty on--carbon~ste-elrou-nd wire in diameter--
Under 0.060 inch : (TSUS item 609 040)
25% y
20% y
10% 2/ 9% y
;o.060 inch or more and containing, by weight--Not over 0.25% carbon :.over 0.25%
(TSUS item 609.41) : carbon Baling and : : (TSUS item
fencing wire : Other : · 609.43)
0.5¢ y
0.25¢ y
0.75¢, 1.25¢, or 1.50¢ Y
0.375¢, 0.625¢, or 0.75¢ y
25% y 20% y
10% 2/ 9% y :r
: 0.35¢, 0.59¢, or 0.70¢ 4/
0.33¢, 0.56°i, 00
June 30, 1957 : GATT or 0.67¢ 4/
June 30, 1958 : GATT :
8.5% y 0.30¢, 0.53¢", : 8.5% 2/ : or 0 .625¢ y : -
: Aug. 31, 1963 : Tariff Classifica- 8.5% 0 .3¢
tion Act of 1962.
Dec. 7, 1965 : Tariff Schedules 0.3¢ : 8.5% Technical Amend-ments Act of 1965.:
1/. P.ursuant to Presidential Proclamation No. 4074, effective August 16, 1971, trade agreement rates were moifified by the temporary imposition of an additional cumulative duty of 10 percent ad valorem, or less. The additional duty was removed, effective December 20, 1971, pursuant to Presidential Proclamation No. 4098.
2/ Rate applicable to wire (except baling and fencing wire), valued over 6¢ per pound. See also footnote 4. "'J/ Rate applicable to all baling and fencing wire regardless of unit value or composition. 4/ Rates applicable to wire, valued not over 6¢ per pound (except baling and fencing wire), depending on
diameter--the smaller the diameter, the higher the rate. The highest rate was also applicable to round wire· --~ ~ - -
I"\ ,...,,-,...
A-9
The ad valorem equivalent of the various 1930 rates applicable
to carbon-steel round wire based on imports in 1931 ranged from about
15 to 57 percent and averaged 23.5 percent (weighted by imports at
each rate). The ad valorem equivalent of the specific rate (0.3 cent·
per pound) in effect in 1972, based on imports in 1972, was 3.3 percent;
the weighted ad valorem eq~ivalent of the various rates of duty of
carbon~steel round wire in 1972 was 6.2 percent ad valorem. While trade
agreement concessions undoubtly accounted for the greater part of the dif
ference between the average 1930 rate (23.5 percent) and the average
1972 rate (6.2 percent), other factors that influenced the difference
(either negatively or positively) were (1) elimination of additional
duty for coating, (2) consolidation of the applicable provisions,
(3) increased unit value of imports, and (4) changes in product mix.
U.S. Producers
Two general types of U.S. producers are operating in the steel-wire
based industrial segment covered in this investigation: (1) Integrated
and semi-integrated steel concerns that produce wire rod and wire, from
steel produced within their own firm; and (2) the so-called independent
wire drawing firms that produce wire from rod (or, less frequently,
billets) purchased from other firms--either domestic or foreign.
Roughly 30 concerns operate facilities for rolling wire rod; three
integrated steel producers probably account for more than half of the
domestic capacity.
A-10
According to the U.S. Department of Commerce, there were 240 carbon
steel .. wire-drawing establishments in the United States in 1967, up from
200 firms in 1963. Approximately 50 of the 240 were operated by either
integrated or semi-integrated steel producers. Industry spokesmen indicate
that the total number of carbon-steel wire-drawing firms probably has not
changed significantly since 1967.
A-11
U.S. Consumption
Wire rod
Apparent consumption of wire rod in the United States declined
from 6.5 million tons in 1968 to 6.0 million tons in 1970, then
increased to 7.0 million tons in 1972 (table 1). Over the eight year
period from 1965 to 1972, apparent consumption has shown a general,
though small, increase and averages 6.1 million tons per year in 1965-68
and 6.5 million tons in 1969-72. Consumption data for 1968 are somewhat
inflated because of an inventory buildup by consumers in anticipation
of a strike in the basic steel industry. For the same reason, consumption
for 1969 may be somewhat understated owing to consumers' return to
normal inventories. Decreased supply, and, hence apparent consumption in
1969-70, largely as the result of smaller imports, was probably
caused by an unusually high demand for steel in other free world
nations, particularly those of Europe.
Wire
Apparent annual U.S. consumption of carbon-steel round wire, like
wire rod, has shown a general, though small, increase during 1965-72
(table 2); the greatest annual consumption--5.6 million tons-
occurred in 1972. Average annual usage during 1969-72 was 5,3 million
tons compared with about 5.0 million tons during 1965-68.
A-12
· U.s.· Production, Shipments, and Exports
Wire rod
Average annual production of carbon-steel wire rod in the United
States from 1965 to 1972 ranged between 4.7 million tons in 1967 and
5.8 million tons in 1972 (table 1). Annual production was somewhat
higher in the second half (1969-72) of the period than in the first half
(1965-68). The largest production during the second half o.f the period
coincides with the beginning of "voluntary restraints" adopted by Japan
and the European Economic Community (EEC) on exports of steel products
to the United States; moreover, the years 1969 and 1970 were years of
unusually high demand for steel in other free world nations.
Because of the integrated nature of all (or virtually all) of the pro
ducers of wire rod, normally less than one-third of annual domestic
production is sold to others (table 1-A); the remainder is consumed
by the producer in the production of wire and wire products. Table
1-A reveals a significant increase in producers' shi:Pments in 1969-72,
both in terms of quantity and in relation to total output. It also
indicates that beginning in 1969 the domestic industry regained a sub
stantial part of the open market consumption of rods. The· decline in
shipments in 1971 was due, in pa.rt, to a strike threat which induced
buyers to import increased quantities. To buy foreign steel as pro
tection against a strike, domestic buyers are usually required to
place continuing orders for a year or longer.
A-13
Exports have been a Jninor factor in the wire rod market (tables 1
and 3). Due to the same conditions affecting production, exports
increased from 9 ,000 tons in 1968 to 92 ,000 tons in 1969, to a high
of 137,000 tons in 1970, then dropped to 61,000 tons in 1971, before
increasing to 121,000 tons in 1972.
Annual estimated production of carbon-steel round wire has increased
from 4.6 million tons in 1965 to 5.1 million tons in 1972 (table 2),
with year-to-year fluctuations in evidence.
U.S. producers' shipments of wire, like those of wire rod, are
substantially less than output because of "in-house" consumption for
the production of such articles as nails; welded wire mesh; barbed wire;
all types of wire fencing, netting, and screening; garment hangers; bale
ties; and welding wire. Table 2-A shows a generally declining level in
annual open market shipments of round wire, both in terms of quantity
and in relation to total output. The data also indicate a generally
increasing penetration of the open market by imports.
Exports fluctuated markedly from 1965 to 1972 (table 2) and ranged
from three-to six-tenths of a percent of domestic production, averaging
20,000 tons per year for the period. The major export markets for
domestic carbon-steel wire have been Canada and South Vietnam.
UJ ~
1500
A-14
U.S. Imports
Wire rod
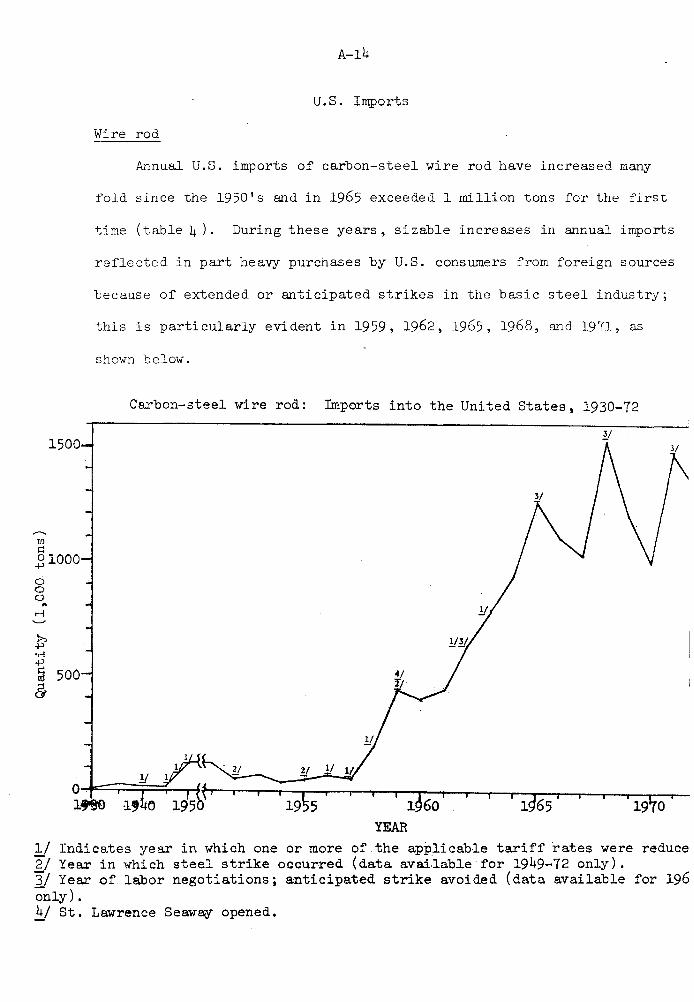
Annual U.S. imports of carbon-steel wire rod have increased many
fold since the 1950' s and in 1965 exceeded 1 million tons for the first
time (table 4). During these years, sizable increases in annual imports
reflected in part heavy purchases by U.S. consumers from foreign sources
because of extended or anticipated strikes in the basic steel industry;
this is particularly evident in 1959, 1962, 1965, 1968, and 1971, as
shown below.
Carbon-steel wire rod: Imports into the United States, 1930-72
.B 1000 0 0 0 .. rl
y 1/ y
o-.t==:::;:::=r=~rf f.,-,r-i~~---,---,--,-..,--r-..,.-r-ir-1'-r--r~-,----.------1~ ~' 0 '19~5 I i36o I I ig65. I 19'io I
YEAR
1/ Indicates year in which one or more of the applicable ta.riff rates were reduce 2/ Year in which steel strike occurred (data ava.i,lable·for 1949-72 only). 3! Year of labor negotiations; anticipated strike avoided (data available for 196 only). 4/ St. Lawrence Seaway opened.
A-15
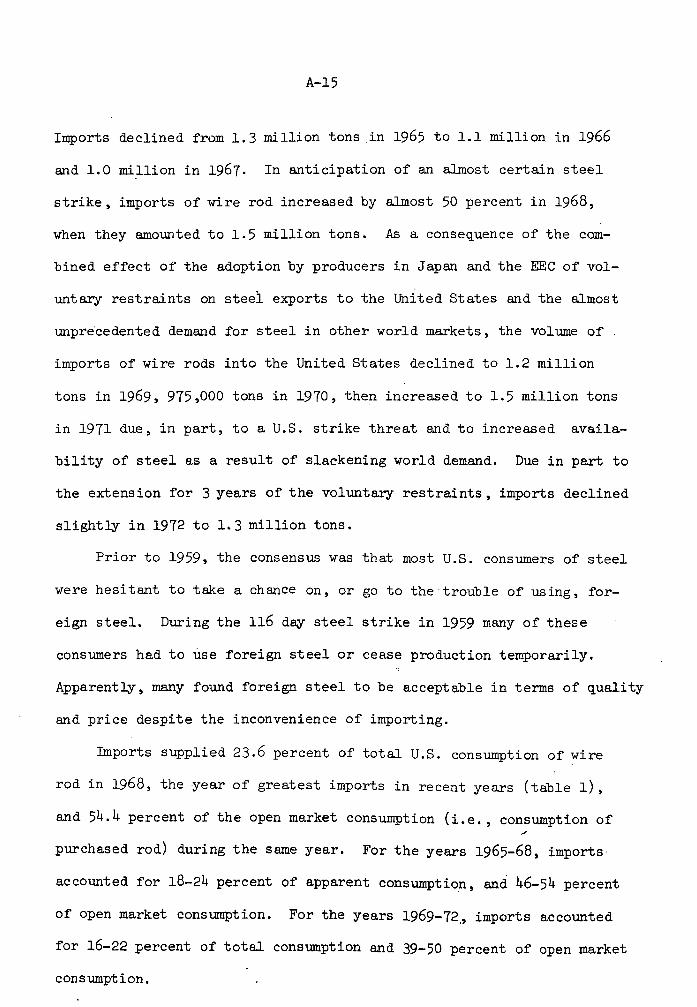
Imports declined from 1.3 million tons in 1965 to 1.1 million in 1966
and 1.0 million in 1967. In anticipation of an almost certain steel
strike, imports of wire rod increased by almost 50 percent in 1968,
when they amounted to 1.5 million tons. As a consequence of the com
bined effect of the adoption by producers in Japan and the EEC of vol
untary restraints on steel exports to the United States and the almost
unpre·cedented demand for steel in other world markets, the volume of
imports of wire rods into the United States declined to 1.2 million
tons in 1969, 975,000 tons in 1970, then increased to 1.5 million tons
in 1971 due, in part, to a U.S. strike threat and to increased availa
bility of steel as a result of slackening world demand. Due in part to
the extension for 3 years of the voluntary restraints, imports declined
slightly in 1972 to 1.3 million tons.
Prior to 1959, the consensus was that most U.S. consumers of steel
were hesitant to take a cha.nee on, or go to the trouble of using, for
eign steel. During the 116 day steel strike in 1959 many of these
consumers had to use foreign steel or cease production temporarily.
Apparently, many found foreign steel to be acceptable in terms of quality
and price despite the inconvenience of importing.
Imports supplied 23.6 percent of total U.S. consumption of wire
rod in 1968, the year of greatest imports in recent years (table 1),
and 54.4 percent of the open market consumption (i.e., consumption of
purchased rod) during the same year. For the years 1965-68, imports
accounted for 18-24 percent of apparent consumptio_n, and 46-54 percent
of open market consumption. For the years 1969-72., imports accounted
for 16-22 percent of total consumption and 39-50 percent of open market
consumption.
A-16 '•
Japan has been the principal foreign source of imports of wire rod
for many yea:rs. However, in 1972, shipments from France exceeded those
. from Japan. West Germany, Belgium, and the United K;ingdom are also sig-
nifi9ant suppliers (table 5).
Wire .
U.S. imports for consumption of carbon-steel round wire increased
from 398,000 tons in 1965 to 538,000 tons in 1968; declined to 461,000
tons in 1970; increased to 497,000' tons in 1971; and declined again to
481,000 tons in 1972 (table 2). The ratio of annual imports to consump-
tion averaged 9.4 percent during the 8 year period and was 8.6 percent
in 1972. Like imports of wire rod, imports of wire supplied a somewhat
larger share of open market consumption in the United States; this ratio
increased from 13.6 percent in 1965 to 20.6 percent in 1971, and was
19.3 percent in 1972. Japan is the major supplier of imports of carbon-
steel wire to the United States, with Belgium the second largest supplier
(table 6).
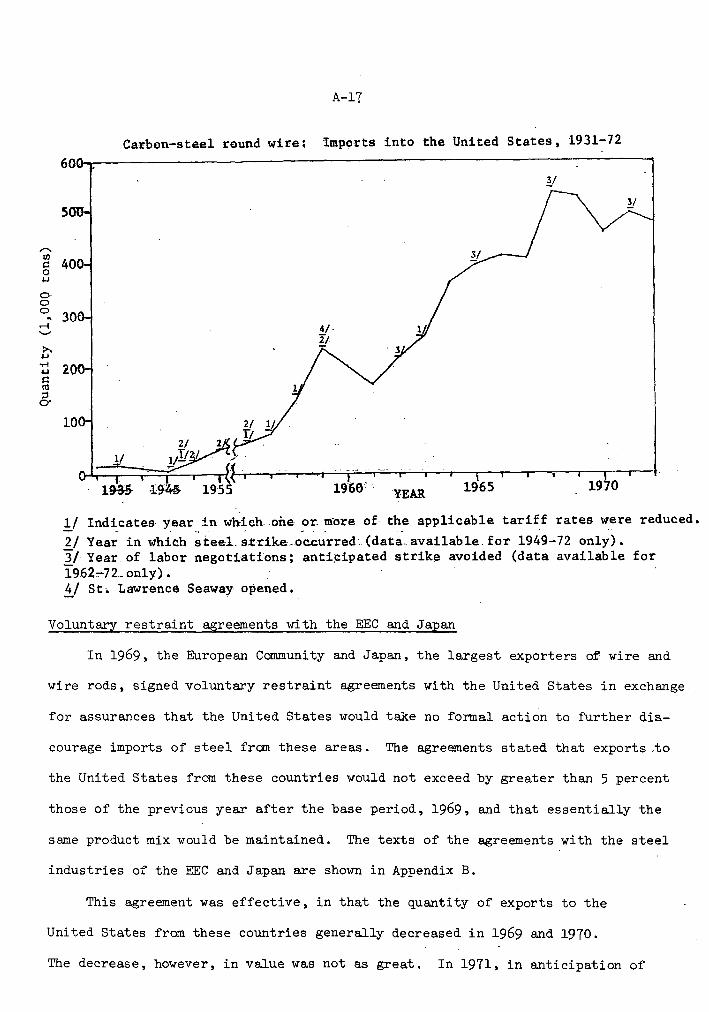
The long-term trend of imports, as shown in the following chart, of
carbon-steel wire since 1954 has been generally upward (table 7). In
1958, annual imports first exceeded 100,000 tons; in 1959, 200,000
tons; in 1964, 300,000-tons; and in 1966, 400,000 tons. In 1968,
imports reached the record high of 538,000 tons. Like imports of
carbon-steel wire rod, imports of wire increased by over 75 percent
in the strike year of 1959·
,...... II)
i:: 0 .µ
O· 0 0 -.-l '-'
>. .µ ·.-! .µ
i:: ctl :I Cf
A-17
Ca~bon-steel round wire; Imp9~ts into the United States, 1931-72
400
30
20
"};./ Indicates year. in which one or. m·ore of th_e applicable tariff rates were reduced.
2/ Year in which steel. s.trike-occurred (data .. available. for 1949-72 only). 3! Year. of labor negotiations; anti~ipated strike avoided (data available for l962,,...72 .. only) • !!._/ St • Lawrence Seaway opened •
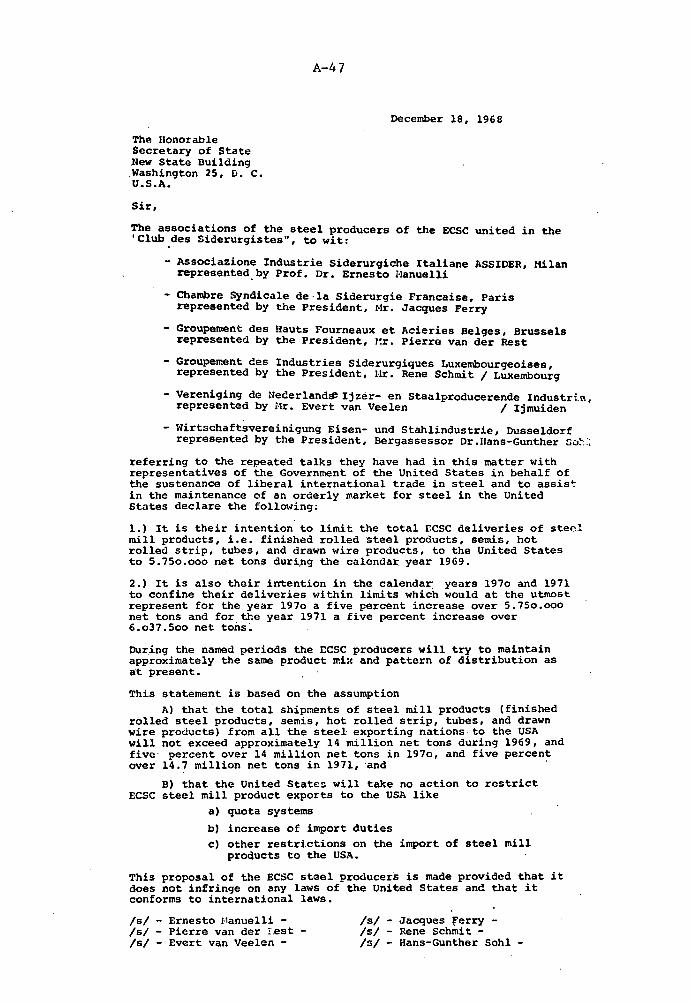
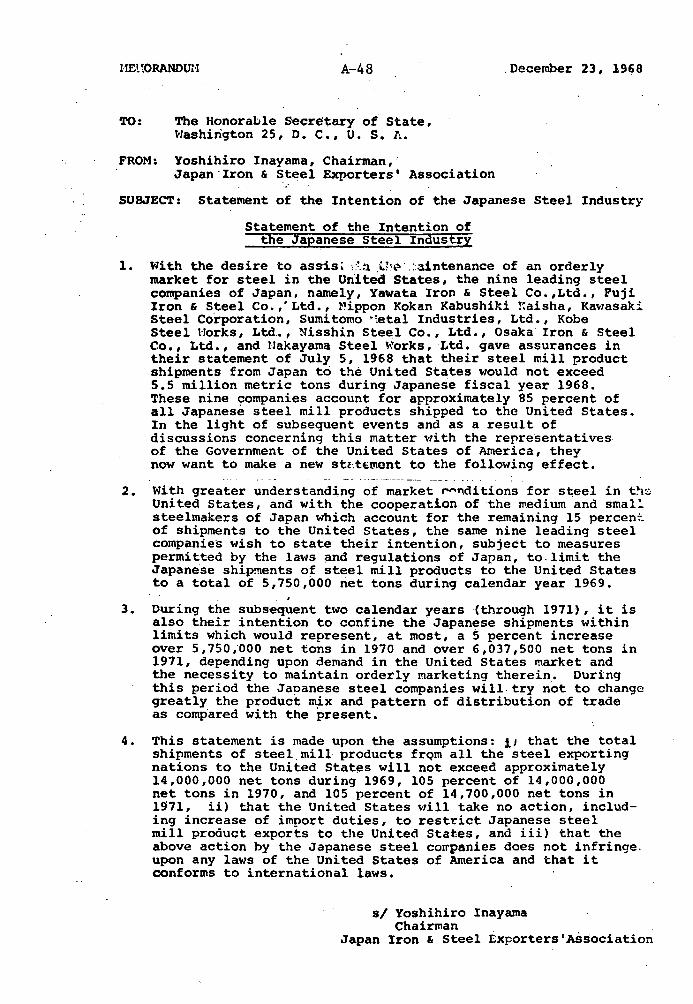
Voluntary restraint agreements with the EEC and Japan
In 1969, the European Community and Japan, the largest exporters of wire and
wire rods, signed voluntary restraint agreements with the United States in exchange
for assurances that the United States would take no formal action to further dia-
courage imports of steel from these areas. The agreements stated that exports .to
the United States from these countries would not exceed by greater than 5 percent
those of the previous year after the base period, 1969, and that essentially the
same product mix would be maintained. The texts of the agreements with the steel
industries of the EEC and Japan are shown in Appendix B.
This agreement was effective, in that the quantity of exports to the
United States from these countries generally decreased in 1969 and 1970.
The decrease, however, in value was not as great. In 1971, in anticipation of
A-18
a possible steel strike, these countries began exporting steel to the United
States in increased quantities. Sources in the trade indicate that the
intention was to decrease these exports drastically in the latter part of 1971
to remain in compliance with the agreements. However, the 10 percent sur
charge was added at about this time, and was interpreted by forcing parties
to the agreement to nullify the 1969 agreements; therefore, imports were
generally above the limitations for that year.
In early 1972, substantially the same agreement was again reached with
the EEC and Japan, and imports of wire rod and wire again decreased. 1his
decrease in wire rod was greater for Japan than for France; hence, France
became the leading exporter of steel rods to the United States.
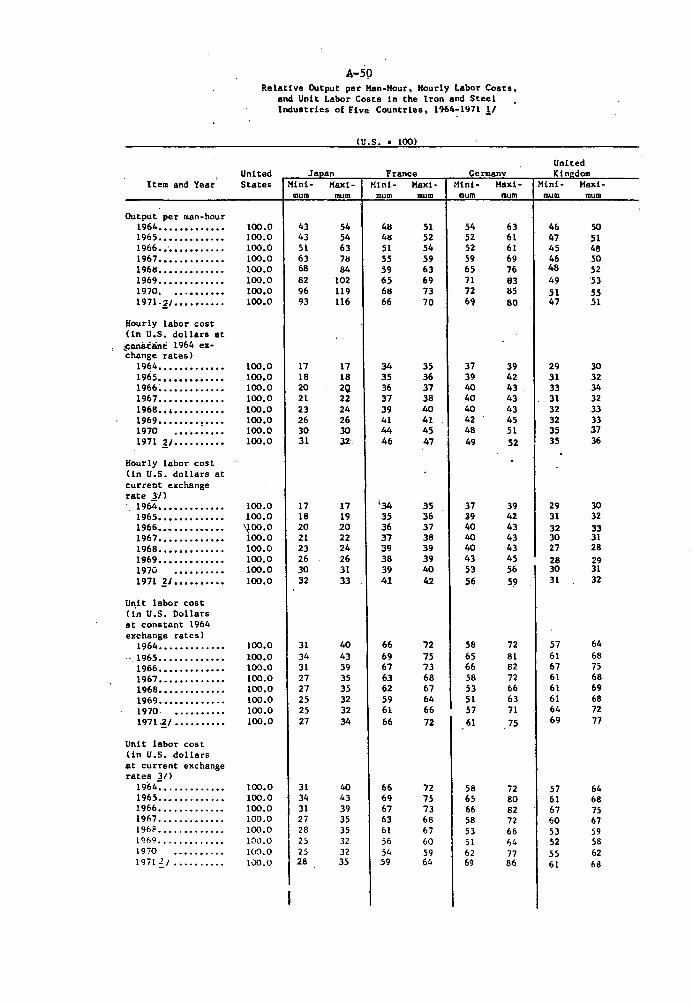
Foreign labor costs related to U.S. imports
The factor that allows foreign competitors the ability to compete in
U.S. steel markets, even though freight and insurances costs are additional,
appears to be the disparity in labor costs of production.
As shown by the table in Appendix C, output per man-hour in Japanese
steel mills has reached, and possibly exceeded, that of the United States
steel mills. Labor costs, on the other hand, appear to be only a third or
less.
Unit labor costs of France, Germany, and the United Kingdom are only
60 to 70 percent of comparable costs in the United States.
Hourly labor costs have increased at a higher rate in the four countries
covered than those of the United States, since 1964; however, productivity per
man-hour has also increased so that unit labor costs have increased little since
1964 and, in Japan and France have actually declined, relative to the United State
It should be noted that the 1964 data found in Appendix C were based on
estimates obtained from each country. 1965-71 data are estimated obtained by
applying trend indexes for each country.
A-19
Wheeling-Pittsburgh Steel Corporation
The corporation
Wheeling Steel Corporation was incorporated in· Delaware on
June 21, 1920, when it acquired control of Wheeling Steel and Iron·
Company (incorporated in 1892) as well as other companies. The name
was changed to that of the present corporation on December 5, 1968,
when: it merged with the Pittsburgh Steel Company. The corporation,
with headquarters at Pittsburgh, Pa., is the ninth largest integrated
steel producer in the Unit~d States. Its output consists primarily
of flat rolled products, including hot and cold rolled sheet and strip,
galvanized sheet and roofing, and coated and lithographed black and tin
plate. Among other products produced ai:e butt-weld and seamless pipe,
rods and wire, and semi finished steel.
The corporation operates two basic iron and steel producing plants,
several finishing and product manufacturing plants, and other subsidi
aries , including iron and coal mining companies and a railway system in
the vicinity of their Monessen plant. Pig iron and steel ingots are
produced both at the Steubenville, Ohio, plant, with a capacity of 2 .6
million tons of raw steel annually and at the Monessen, Pa., plant, with
a capacity of 1.7 million tons of raw steel annually. Finishing plants
are situated at Allenport, Pa.; Warren and Yorkville, Ohio; and Benwood,
W. Va. The principal manufacturing plants are situated at Beech Bottom,
W. Va., and Martins Ferry, Ohio.
In 1971, the corporation employed more than 17,000 persons. Net
sales for the corporation amounted to $528 million in 1971, an increase
A-20
of 4 percent over 1969, the first year af'ter merger. Income
during this period, however, decreased from $63 million to $45 million.
Wire-making operations of the corporation are carried on at the
· Monessen plant and at three plants of Wheeling-Pittsburgh's subsidiary,
Johnson Steel and Wire Company. Wire rods were produced only at the
Monessen plant until December 1972, when production was discontinued.
During 1969-70, shipments of rod and wire accounted for 2 percent of
total shipments by the corporation; in 1971, they accounted for only
1 percent.
The Monessen plant
The Monessen plant of Wheeling-Pittsburgh Steel Corporation is an
integrated steel mill occupying 155 acres of land on the Monongahela
River about 30 miles south of Pi ttsburcgh, Pa., the location of the cor
poration's headquarters. The Monessen plant began initial operations
in the early 1900 's as a wire and fence producer. Subsequently, steel--·
making facilities, including blast furnaces, a coke plant, and open
hearth steelmaking furnaces, were added and the Monessen plant served
as the steel-producing unit for the Pittsburgh Steel Company. In 1964,
the open-hearth furnaces were replaced by a basic oxygen furnace
(B.O.F.) installation and the plant eventually became a major steel pro
ducing unit of the Wheeling-Pittsburgh Steel Corporation. In 1972, the
plant produced over 1.4 million tons of raw steel, primarily for the
Allenport plant, a steel sheet- and tube-producing facility. The
Monessen plant at this time had a net book value of nearly $50 million
and employed over 2,800 people.
The rod and wire divisions of the Monessen plant accounted for less
than* * * percent of the plant's total employment. Two steam-powered rod
A-21
mills--one built in 1909 and the other in 1919--processed raw steel made
on the premises for intracompany and customer consumption. By the late
1950's, the rod mills had become obsolescent largely because their output
was limited to a maximum bundle size of 300 pounds. This limitation
effectively restricted their competitiveness with new large rod mills * * *
which can produce
rod bundles of 3,000 pounds or more. * * *
A-22 through A-34
* * * * *
A-35
APPENDIX A
Statistical. Appendix
A-36
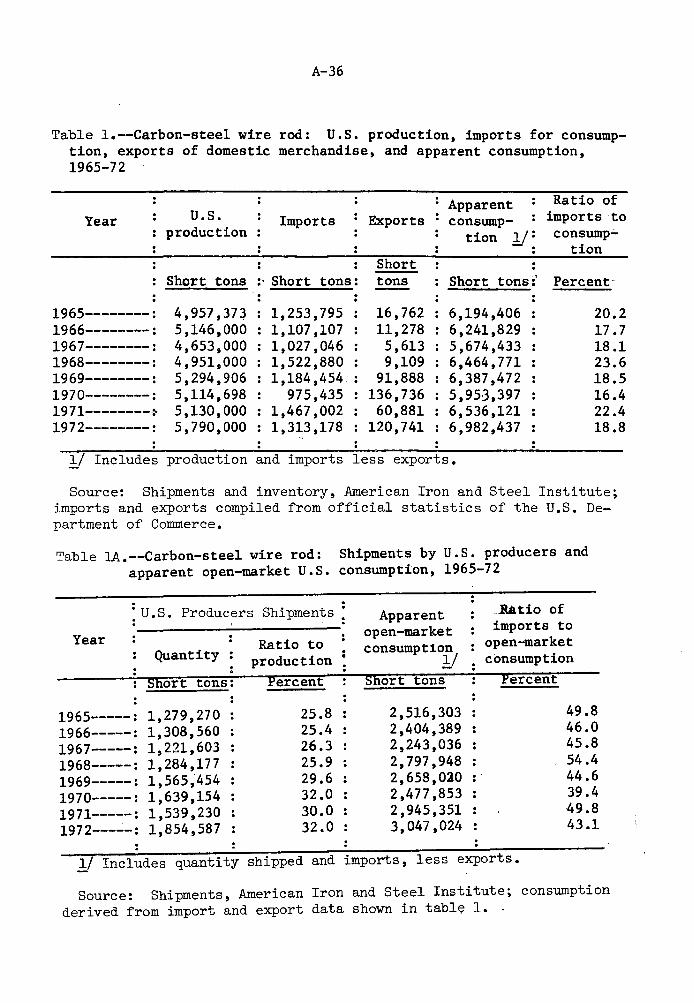
Table l.~Carbon-steel wire rod: U.S. production, imports for consumption, exports of domestic merchandise, and apparent consumption, 1965-72
Apparent Ratio of Year U.S. Imports Exports con sump- imports to
production tion 1.1: con sump.;.. ti on
Short Short tons :· Short tons: tons Short tons:' Percent·
1965--------: 4,957,373 1,253,795 16,762 6,194,406 20.2 1966--------: 5,146,000 1,107,107 11,278 6,241,829 17.7 1967--------: 4,653,000 1,027,046 5,613 5,674,433 18.1 1968--------: 4,951,000 1,522,880 9,109 6,464,771 23.6 1969--------: 5,294,906 1,184,454 91,888 6,387,472 18.5 1970--------: 5,114,698 975,435 136,736 5,95:3,397 16.4 1971--------:- 5,130,000 1,467,002 60,881 6,536,121 22.4 1972--------: 5,790,000 1,313,178 120,741 6,982,437 18.8
1) Includes production and imports less exports.
Source: Shipments and inventory, American Iron and Steel Institute; imports and exports compiled from official statistics of the U.S. Department of Commerce.
Table lA.--Carbon-steel wire rod: Shipments by U.S. producers and apparent open-market U.S. consumption, 1965-72
. . .Ratio of : u. s. Producers Shipments : Apparent . imports to
Year open-market open-market Ratio to consumption Quantity production 1/ consumption . .
Percent Short tons: Percent Snort tons
1965-----: 1,279,270 25.8 2,516,303 49.8
1966-----: 1,308,560 25.4 2,404,389 46.0
1967-----: 1,221,603 26.3 2,243,036 45.8
1968-----: 1,284,177 25.9 2,797,948 54.4
1969-----: 1,565~454 29.6 2,658,0lO 44.6
1970-----: 1,639,154 32.0 2,477,853 39.4
1971-----: 1,539,230 30.0 2,945,351 49.8
1972---..:-: 1,854,587 32.0 3,047,024 43.1
1/ Includes quantity shipped and imports, less exports.
Source: Shipments, American Iron and Steel Institute; consumption derived from import and export data shown in tabl~ 1. ·
A-37
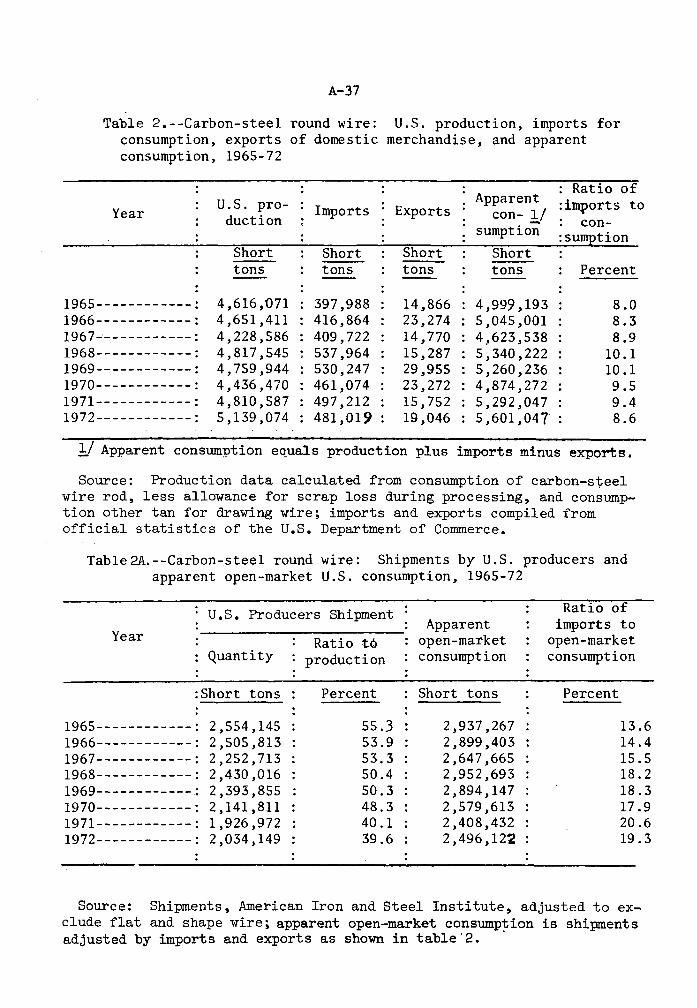
Table 2.--Carbon-steel round wire: U.S. production, imports for consumption, exports of domestic merchandise, and apparent consumption, 1965-72
Year
1965------------: 1966------------: 1967~-----------:
1968------------: 1969------------: 1970------------: 1971------------: 1972------------:
U.S. production
Short tons
4 ,616 ,071 4 ,651,411 4,228,586 4,817,545 4,759,944 4,436,470 4,810,587 5,139,074
Imports
Short tons
397,988 416,864 409 '722 537,964 530,247 461,074 497,212 481,019
Exports
Short tons
14,866 23,274 14,770 15,287 29,955 23,272 15,752 19,046
Apparent con- 1/
sumption
Short tons
4,999'193 5,045,001 4,623,538 5,340,222 5,260,236 4,874,272 5,292,047 5 ,601,04 7'
Ratio of :imports to
con-: sumption
Percent
8.0 8.3 8.9
10.1 10 .1 9.5 9.4 8.6
1/ Apparent consumption equals production plus imports minus exports.
Source: Production data calculated from consumption of carbon-steel wire rod, less allowance for scrap loss during processing, and consumption other tan for drawing wire; imports and exports compiled from official statistics of the U.S. Department of Commerce.
Table2A.--Carbon-steel round wire: Shipments by U.S. producers and apparent open-market U.S. consumption, 1965-72
u.s. Producers Shipment Ratio of Apparent imports to
Year Ratio t6 open-market open-market Quantity production consumption consumption
:Short tons Percent Short tons Percent
1965------------: 2,554,145 55.3 2,937,267 13.6 1966------------: 2,505,813 53.9 2,899,403 14.4 1967------------: 2,252,713 53.3 2,647,665 15.5 1968------------: 2,430,016 50.4 2,952,693 18.2 1969------------= 2,393,855 50.3 2,894,147 18.3 1970------------: 2,141,811 48.3 2,579,613 17.9 1971------------: 1,926 ,972 40.1 2,408,432 20.6 1972------------: 2,034,149 39.6 2,496,122 19 .3
Source: Shipments, American Iron and Steel Institute, adjusted to exclude flat and shape wire; apparent open-market consumption is shipments adjusted by imports and exports as shown in tab1e·2. ·
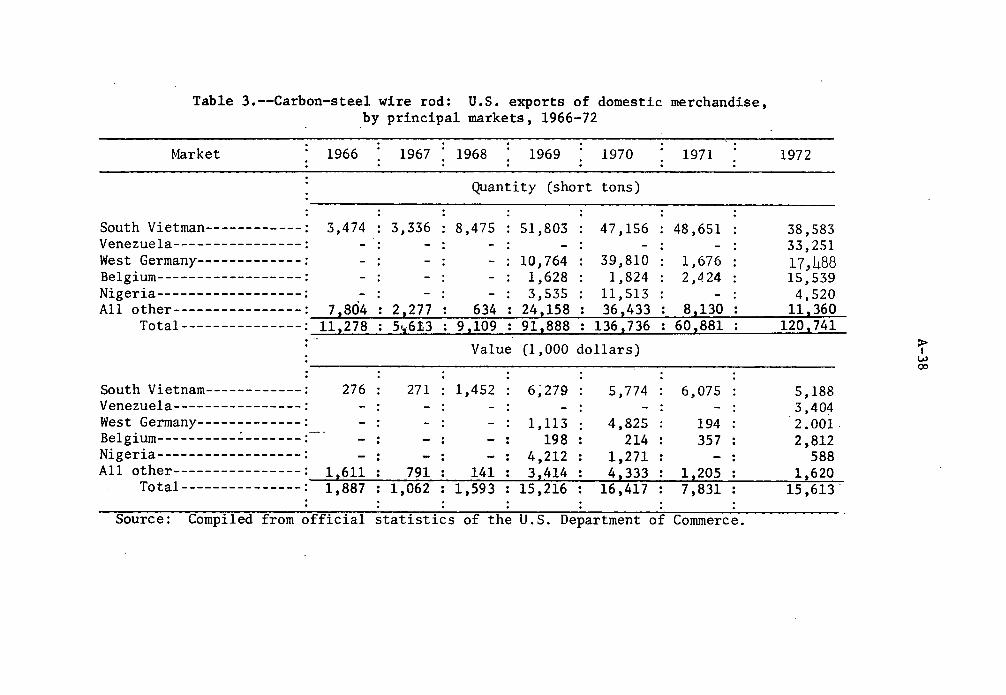
Table 3.--Carbon-steel wire rod: U.S. exports of domestic merchandise, by principal markets, 1966-72
Market 1966 1967 1968 1969 1970 1971 1972
Quantity (short tons)
South Vietman------------: 3,474 : 3,336 : 8,475 : 51,803 : 47,156 : 48,651 : 38,583 Venezuela----------------: 33,251 West Germany-------------: 10,764 : 39,810 : 1,676 : 17,488 Belgium------------------: 1,628 : 1,824 : 2,424 : 15,539 Nigeria------------------: All other----------------:
: - : - : 3,535 : 11,513 : - : 4,520 7,804 : 2,277 : 634 : 24,158 : 36,433 : 8,130 : 11,360
Total---------------: 11,278 : 5~6t3 : 9,109 : 91,888 : 136,736 : 60,881 : 120,741
Value (1,000 dollars)
South Vietnam------------: 276 : 271 : 1,452 : 6~279 : 5,774 : 6,075 : 5,188 Venezuela----------------: - : - : - : - : - : - : 3,404 West Germany-------------: - : - : - : 1,113 : 4,825 : 194 : 2.001. Belgium----------~-------=--- - : - : - : 198 : 214 : 357 : 2,812 Nigeria------------------: - : - : - : 4,212 : 1,271 : - : 588 All other----------------: 1,611 : 791 : 141 : 3,414 : 4,333 : 1,205 : 1,620
Total---------------: 1,887 : 1,062 : 1,593 : 15,216 : 16,417 : 7,831 : 15,613.
Source: Compiled from official statistics of the U.S. Department of Commerce.
~ w 00
A-39
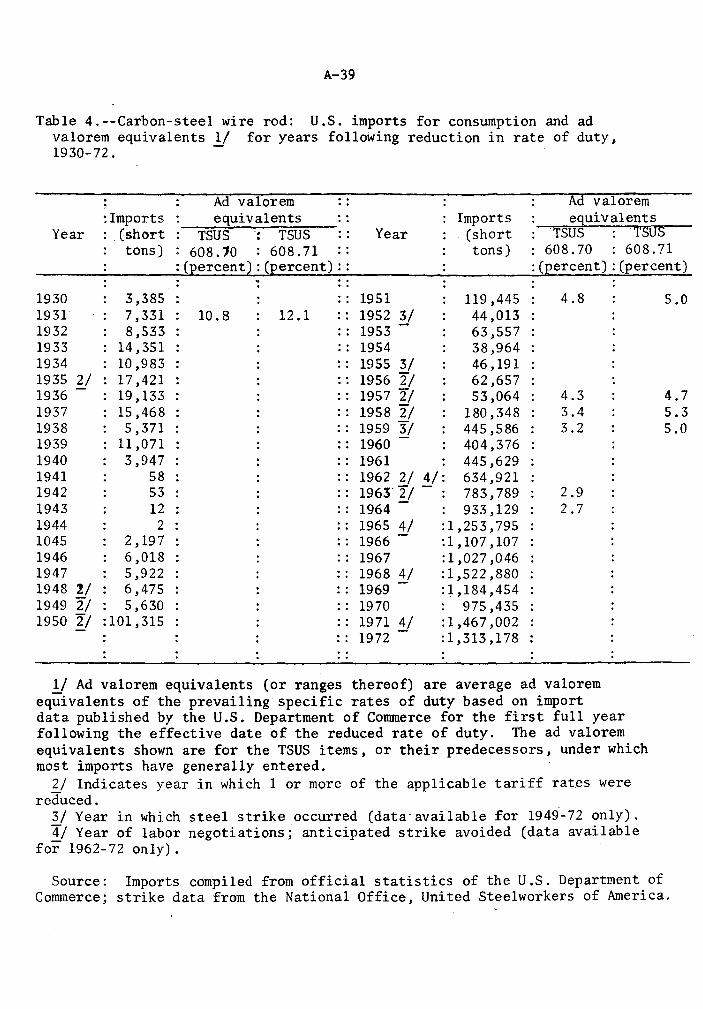
Table 4.--Carbon-steel wire rod: U.S. imports for consumption and ad valorem equivalents 'J:..! for years following reduction in rate of duty, 1930-72.
Year :Imports
. (short tons)
Ad valorem equivalents
TSUS } TSUS 608.10 : 608.71
:(percent) :(percent)::
Year Imports . (short
tons)
Ad valorem equivalents
·rsus TSUS 608.70 : 608.71
:(percent) :(percent)
1930 1931 1932 1933 1934 1935 2/ 1936 1937 1938 1939 1940 1941 1942 1943 1944 1045 1946 1947 1948 '1./ 1949 2/ 1950 2/
3,385 7,331 8,533
14,351 10 J 9 83 17,421 19,133 15,468 5,371
11 ,071 3,947
58 53 12
2 2J197 6,018 5,922 6,475 5,630
:101,315
10. 8 12.1 1951 1952 3/ 1953 1954 1955 3/ 1956 2/ 1957 2/ 1958 2/ 1959 3/
.. 1960 -1961
119 ,445 44 ,013 63,557 38,964 46J191 62,657 53,064
180 ,348 445 ,586 404,376 445,629 634,921 783,789
.. 1962 2/ 4/: 1963' 2/ 1964 - 933,129
:1,253,795 :1,107,107 : 1,027 ,046 :l,522,880 :1,184,454
1965 4/ 1966 -1967 1968 4/ 1969 1970 1971 y 1972
975,435 :1,467,002 :l,313,178
4.8
4.3 3.4 3.2
2.9 2.7
1/ Ad valorem equivalents (or ranges thereof) are average ad valorem equivalents of the prevailing specific rates of duty based on import data published by the U.S. Department of Commerce for the first full year following the effective date of the reduced rate of duty. The ad valorem equivalents shown are for the TSUS items, or their predecessors, under which most imports have generally entered.
2/ Indicates year in which 1 or more of the applicable tariff rat.es were reduced.
3/ Year in which steel strike occurred (data- available for 1949-72 only). 4/ Year of labor negotiations; anticipated strike avoided (data available
for 1962-72 only).
5.0
4.7 5.3 5.0
Source: Imports compiled from official statistics of the U.S. Depart~ent of Commerce; strike data from the National Office, United Steelworkers of America.
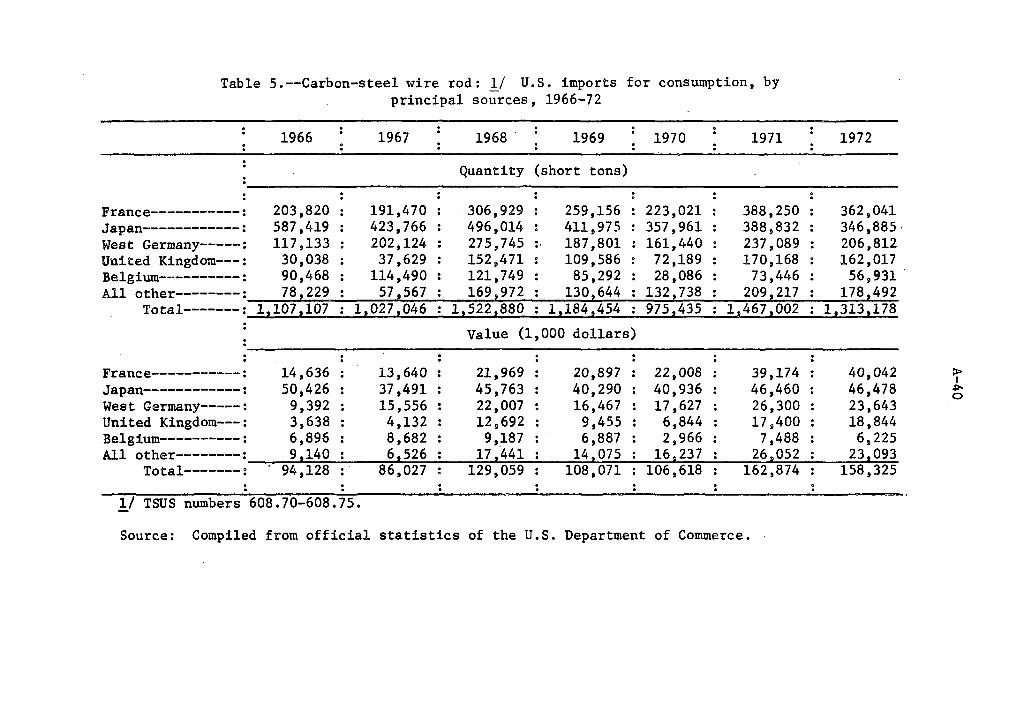
Table 5.--Carbon-steel wire rod:±./ U.S. imports for consumption, by principal sources, 1966-72
1966 1967 1968. 1969 1970 1971
Quantity (short tons)
1972
France-----------: 203,820 : 191,470 : 306,929 : 259,156 : 223,021 : 388,250 : 362,041 Japan------------: 587,419 : 423,766 : 496,014 : 411,975 : 357,961 : 388,832 : 346,885· West Germany-----: 117,133 : 202,124 : 275,745 :. 187,801 : 161,440 : 237,089 : 206,812 United Kingdom---: 30,038 : 37,629 : 152,471 : 109,586 : 72,189 : 170,168 : 162,017 Belgium----------: 90,468 : 114,490 : 121,749 : 85,292 : 28,086 : 73,446 : 56,931 · All other--------: 78,229 : 57,567 : 169,972 : 130,644 : 132,738 : 209,217 : 178,492
Total-------: 1,107,107 : 1,027,046 : 1,522,880 : 1,184,454 : 975,435 : 1,467,002 : 1 2313,178 I
Value (1,000 dollars)
France-----------: 14,636 : 13,640 : 21,969 : 20,897 : 22,008 : 39,174 : 40,042 Japan------------: 50,426 : 37,491 : 45,763 : 40,290 : 40,936 : 46,460 : 46,478 West Germany-----: 9,392 : 15,556 : 22,007 : 16,467 : 17,627 : 26,300 : 23,643 United Kingdom---: 3,638 : 4,132 : 12,692 : 9,455 : 6,844 : 17,400 : 18,844 Belgium----------: 6,896 : 8,682 : 9,187 : 6,887 : 2,966 : 7 ,488 : 6,225 All other--------: 9 9140 : 6,526 : 17 ,·441 : 14,075 : 16 2 237 : 26,052 : 23,093
Total-------~ 94,128 : 86,027 : 129,059 : 108,071 : 106,618 : 162,874 : 158,325
l/ TSUS numbers 608.70-608.75.
Source: Compiled from official statistics of the U.S. Department of Commerce.
~ +"-0

. Table ~.--Carbon-steel round wire 1_/: U.S. imports for consumption by principal sources, 1966-72
Source 1966 1967 1968 1969 1970 1971 1972
~uantity (short tons)
Japan----------------: 218,851 : 207,808 : 250,982 : 285,299 : 266,923 : 311,240 : 272,446 Belgium--------------: 114,082 : 109.271 : 122,725 : 120,357 : 95,106 : 80,661 : 90,887 United Kingdom-------: West Germany---------: Canada---------------:
19,650 : 23 594 : 41,482 : 38,389 : 25,538 : 20,151 : 22,805 23,667 : 24:678 : 38,349 : 21,774 : 23,092 : 25,085 : 20,312 4,348 : 4,712 : 12,024 : 11,758 : 15,968 : 26,375 : 34,866
All other------------: Total-----------:
36,266 : 39,6t9 : 72,402 : 52,670 : 34,447 : 33,700 : 39,703 416,864 : 409,722 : 537,964 : 530,247 : 461,074 : 497,212 : 481,019·
Value (1,000 dollars)
Japan----------------: 32,171 : 31,029 : 36,527 : 43,706 : 46,383 : 55,298 : 53,003 Belgium--------------: 19,447 : 18,456 : 21,145 : 21,105 : 22,519 : 20,803 : 26,019 United Kingdom-------: 5,042 : 5,465 : 8,365 : 8,318 : 6,627 : 5,268 : 7,090 West Germany---------: 5,010 : 4,715 : 7,174 : 4,770 : 5,381 : 5,821 : 5,352 Canada---------------: 884 : 943 : 2,507 : 2,441 : 3,423 : 5,708 : 8,207 All other------------: 6,635 : 7.207 : 12,886 : 8,966 : 7,450 : 7,502 : 3,683
Total-----------: 69,189 : 67,815 : 88,604 : 89,306 : 91,783 : ioo,4oo : 103,354 . . . . . . . . . . . . . . 1/ TSUS numbers 609,40-609.43.
Source: Compiled from official statistics of the U.S. Department of Commerce.
1: ~
A-42
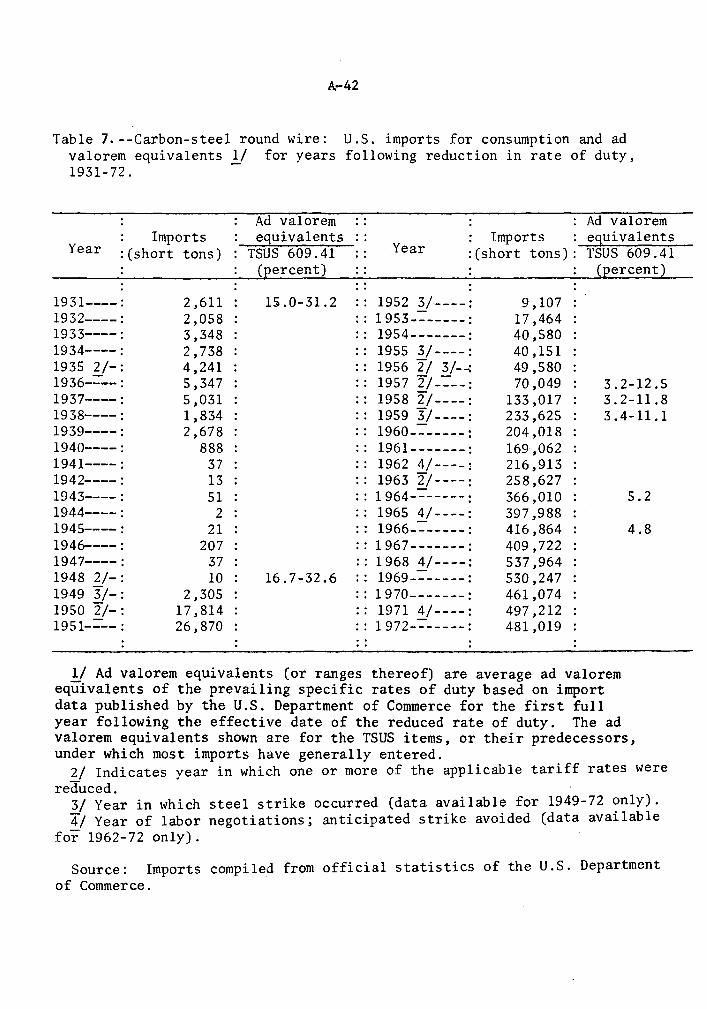
Table 7.--Carbon-steel round wire: U.S. imports for consumption and ad valorem equivalents'};_/ for years following reduction in rate of duty, 1931-72.
Ad valorem Ad valorem
Year Imports equivalents
Year Imports equivalents
:(short tons) TSUS 609.41 : (short tons): TSUS 609.41 (percent) (percent)
1931----: 2 ,611 15.0-31.2 1952 3/.----: 9,107 1932----: 2,058 1953--=------: 17,464 1933---~: 3,348 1954-------: 40,580 1934----: 2,738 1955 3/----: 40,151 1935 2/-: 4,241 1956 2/ 3/-..:. 49,580 1936-=---: 5,347 1957 2/--=---: 70,049 3.2-12.5 1937----: 5,031 1958 2/----: 133 ,017 3.2-11.8 1938----: 1,834 1959 3/----: 233,625 3. 4-11.1 1939----: 2,678 1960--=------: 204,018 1940----: 888 1961-------: 169,062 1941----: 37 1962 4/----: 216,913 1942----: 13 1963 2/----: 258,627 1943----: 51 1964--=------: 366,010 5.2 1944----: 2 1965 4/----: 397 ,988 1945----: 21 1966--=------: 416,864 4.8 1946----: 207 1967-------: 409 J 722 1947----: 37 1968 4/----: 537,964 1948 2/-: 10 16.7-32.6 1969--=------: 530,247 1949 3/-: 2,305 1970-------: 461,074 1950 2/-: 17,814 1971 4/----: 497,212 1951-=---: 26,870 1972--=------: 481,019
1/ Ad valorem equivalents (or ranges thereof) are average ad valorem equivalents of the prevailing specific rates of duty based on import data published by the U.S. Department of Commerce for the first full year following the effective date of the reduced rate of duty. The ad valorem equivalents shown are for the TSUS items, or their predecessors, under which most imports have generally entered.
2/ Indicates year in which one or more of the applicable tariff rates were reduced.
3/ Year in which steel strike occurred (data available for 1949-72 only). 4/ Year of labor negotiations; anticipated strike avoided (data available
for 1962-72 only).
Source: Imports compiled from official statistics of the U.S. Department of Commerce.
A-43 through A-45
* * * * * * *

4-46
APPENDIX B
TEXTS OF VOLUNURY RESTRAINT AGREEMENTS
WITH THE EEC AND JAPAN
A-47
December 18, 1968
The Honorable Secretary of State New State Building .Washington 25, D. C. U.S.A.
Sir,
The associations of the steel producers of the ECSC united in the 'Club des Siderurgistes", to wit:
- Associazione Industrie Siderurgiche Italiane ASSIDER, Milan represented.by Prof. Dr. Ernesto Hanuelli
- Chambre Syndicale de-la Siderurgie Francaise, Paris represented by the President, Mr. Jacques Ferry
- Groupement des Hauts Fourneaux et Acieries Belges, Brussels represented by the President,· t!r. Pierre van der Rest
- Groupement des Industries Siderurgiques Luxembourgeoises, represented by the President, Hr. Rene Schmit / Luxembourg
- Vereniging de Nederland~ Ijzer- en Staalproducerende Industr~.n, represented by Mr. Evert van Veelen / Ijmuiden
- Wirtschaftsvereinigung Eisen- und Stahlindustrie, Dusseldorf represented by the President, Bergassessor Dr.Hans-Gunther :::o~::.
referring to the repeated talks they have had in this matter with representatives of the Government of the United States in behalf of the sustenance of liberal international trade in steel and to assis~ in the maintenance of an orderly market for steel in the United States declare the following:
1.) It is their intention to limit the total ECSC deliveries of steel mill products, i.e. finished rolled steel products, semis, hot rolled strip, tubes, and drawn wire products, to the United States to 5. 750.000 net tons duri.ng the calendar, year 1969.
2.) It is also their intention in the calenda~ years 1970 and 1971 to confine their deliveries within limits which would at the utmost represent for the year 1970 a five percent increase over 5.750.000 net tons and for the year 1971 a five percent increase over 6.037.Soo net tons~
Dur.ing the named periods the ECSC producers will try to maintain approximately the same product mile and pattern of distribution as at present.
This statement is based on the assumption A) that the total shipments of steel mill products (finished
rolled steel products, semis, hot rolled strip, tubes, and drawn wire products) from all the steel exporting nations.to the USA will not exceed approximately 14 million net tons during 1969, and five· oercent over 14 million net tons in 1970, and five percent over 14. 7 million net tons in 1971, and ·
B) that the United State~ will take no action to restrict ECSC steel mill product exports to the USA like
a) quota systems
b) increase of import duties c) other restrictions on the import of steel mill
products to the USA.
This proposal of the ECSC steel producers is made provided that it does not infringe on any laws of the United States and that it conforms to international laws.
/s/ - Ernesto !•1anuelli -/s/ - Pierre van der Lest -/s/ - Evert van Veelen -
/s/ - Jacques ferry -/s/ - Rene Schmit -/s/ - Hans-Gunther Sohl -
HE~ tORANDUM A-48
'l'O: The Honorable Secr~tary of State, Washington 25, o. c., u. s. r~.
FROM~ Yoshihiro Inayama, Chairman,·· Japan·Iron & Steel Exporters' Association
.December 23, 19~8
SUBJECT: Statement of the Intention of the Japanese Steel Industry
Statement of the Intention of the Japanese Steel Industry
1. With the desire to ass-is; ;:~.:.1 :i.h"'".:·aintenance of an orderly market for steel in the Un'ited States, the nine leading steel companies of Japan, namely, Yawata Iron & Steel Co.,Ltd., Fuji Iron & Steel Co. , ' Ltd. , ~~ippon Kokan Kabushiki I~aisha, Kawasaki Steel Corporation, Sumitomo •tetal Industries, Ltd., Kobe Steel Horks, Ltd .• , Nisshin Ste~l Co., Ltd., Osaka Iron & Steel Co. , Ltd. , and Nakayama Steel Works, Ltd. gave assurances in their statement of July 5, 1968 that their steel mill product shipments from Japan to the United States would not exceed 5.5 million metric tons during Japanese fiscal year 1968. These nine companies account for approximately 85 percent of all Japanese steel mill products shipped to the United States. In the light of subsequent events and as a result of discussions concerning this matter with the representatives of the Government of the United States of America, they now want to make a new stl-.t€t11ont to the following effect.
2. With greater understanding of market ,..,...~ditions for steel in t~~ United States, and with the cooperation of the medium and smal!. steelmakers of Japan which account for the remaining 15 percen~ of shipments to the United States, the same nine leading steel companies wish to state their intention, subject to measures permitted by the laws and regulations of Japan, to-limit the Japanese shipments of steel mill products to the United States to a total of 5,750,000 net tons during calendar year 1969.
3. During the subsequent two cale·ndar years (through 1971), it is also their intention to confine the Japanese shipments within limits which would represent, at most, a 5 percent increase over 5,750,000 net tons in 1970 and over 6,037,500 net tons in 1971, depending upon demand in the United States market and the necessity to maintain orderly marketing therein. During this period the Ja~anese steel companies will.try not to change greatly the product m~x and pattern of distribution of trade as compared with the present.
4. This statement is made upon the assumptions: ii that the total shipments of steel.mill products frqm all the steel exporting nations to the United States will not exceed approximately 14,000,000 net tons during 1969, 105 percent of 14,000,000 net tons in 1970, and 105 percent of 14,700,000 net tons in 1971, ii) that the United States will take no action, including increase of import duties, to restrict Japanese steel mill product exports to the United States, and iii) that the above action by the Japanese steel corrpanies does not infringe. upon any laws of the United States of America and that it conforms to international laws.
s/ Yoshihiro Inayarna Chairman
Japan Iron & Steel Exporters•J\Ssociation
A-49
APPENDIX C
RELATIVE LABOR COSTS IN THE IRON AND
STEEL INDUSTRIES OF FIVE COUNTRIES
Item and Year
Output per man-hour 1964 ••••••••••••• 1965 ••••••••••••• 1966 •• ~ •••••••••• 1967 ••••••••••••• 1968 •••••••••.••• 1969 ••••••••••••• 1970. .......... 1971-!/ ••••••••••
Hourly labor cost (in U.S. dollars at
,.;onaiant:' 1964 ex• change rates)
1964 ••••••••••••• 1965 ••••••••••••• 1966; •••••••••••• 1967 ••••••••••••• 1968 ••••••••••••• 1969 •••••••• , •••• 1970 ... · ....... 1971 l'· ... . · .....
Hourly labor cost (ln U.S. dollars at current exchange rate 3ll
1964 ••••••••••••• 1965 ••••••••••••• 1966 ••••••••••••• 1967 ••••••••••••• 1968 ••••••••••••• 1969 ••••••••••••• 19i0 .......... 1971 'l_J ••••••••••
Unit labor cost (ln U.S. Dollars at constant 1964 exchange rates)
1964 ••••••••••••• .. 1965 •••••••••••••
1966 ••••••••••••• 1967 ••••••••••••• 1968 ••••••••••••• 1969 ••••••••••••• 1970· .......... 1971 ~/ ••••••••••
Unit labor cost (in U.S. dollars at current exchange rates 3/l
1964: .•.•••••••••• 1965 ••••••••••••• 1966 •••••.••••••• 1967 •••••.••••••• 1968 ••••.••.••.•• 1969 •..•.•••••.•• 1970 ........... 1971 ~/ •••.•.••••
A-50 Relative Output per Han-Hour, Hourly Labor Costs,
and Unit Labor Costs in the Iron and Steel Industries of Five Countries, 1'164-1971 !I
(U.S. • 100)
United Japan France Cennanv States Mini· Maxi- Mini· Maxi- Mini· Maxi-
mum mum mum mum mum mum
100.0 43 54 48 51 54 63 100.0 43 54 48 52 52 61 100.0 51 63 51 54 52 61 100.0 63 78 55 59 59 69 1.00.0 68 84 59 63 65 76 100.0 82 102 65 69 71 83 100.0 96 119 611 73 72 115 100.0 93 116 66 70 6'.! 80
..
100.0 17 17 .34 35 37 39 100.0 18 18 35 36 39 42 100.0 20 2Q 36 37 40 l+3 100.0 21 22 37 38 40 43 100.0 23 24 39 40 40 43 100.0 26 26 41 41 42 45 100.0 30 30 44 45 I 48 51 100.0 31 32·: 46 47 49 52
100.0 17 17 '.34 35 37 39 100.0 18 19 35 36 l9 42 ~oo.o 20 20 36 37 40 43 100.0 21 22 37 38 40 43 100.0 23 24 39 39 40 43 100.0 26 26 38 39 43 45 100.0 30 31 39 40 53 56 100.0 32 33 41 42 56 SC}
100.0 31 40 66 72 58 72 100.0 34 43 69 75 65 81 100.0 31 39 67 73 66 82 100.0 27 35 63 68 58 72 100.0 27 35 62 67 53 66 100.0 25 32 59 64 51 63 100.0 25 32 61 66 57 71 100.0 27 34 66 72 61 75
100.0 31 40 66 72 58 72 100.0 34 43 69 75 65 80 100.0 31 39 67 73 66 82 100.0 2i 35 63 68 58 72 100.0 28 35 61 67 53 66 100.0 25 32 56 60 51 64 lCIO.O 25 32 54 59 62 77 100.0 28 35 59 64 69 86
I
United Kin2dom
.Mini· Maxi-mum mum
46 50 47 51 45 48 46 so 48 52 49 ·53 51 55 47 51
29 30 31 32 33 34 31 32 32 33 32 33 35 37
I 35 36
29 30 31 32 32 33 30 31 27 28 28 29 30 31 31 32
57 64 61 68 67 75 61 68 61 69 61 68 64 72 69 77
57 64 61 68 67 75 60 67 53 59 52 58 55 62 61 6i!
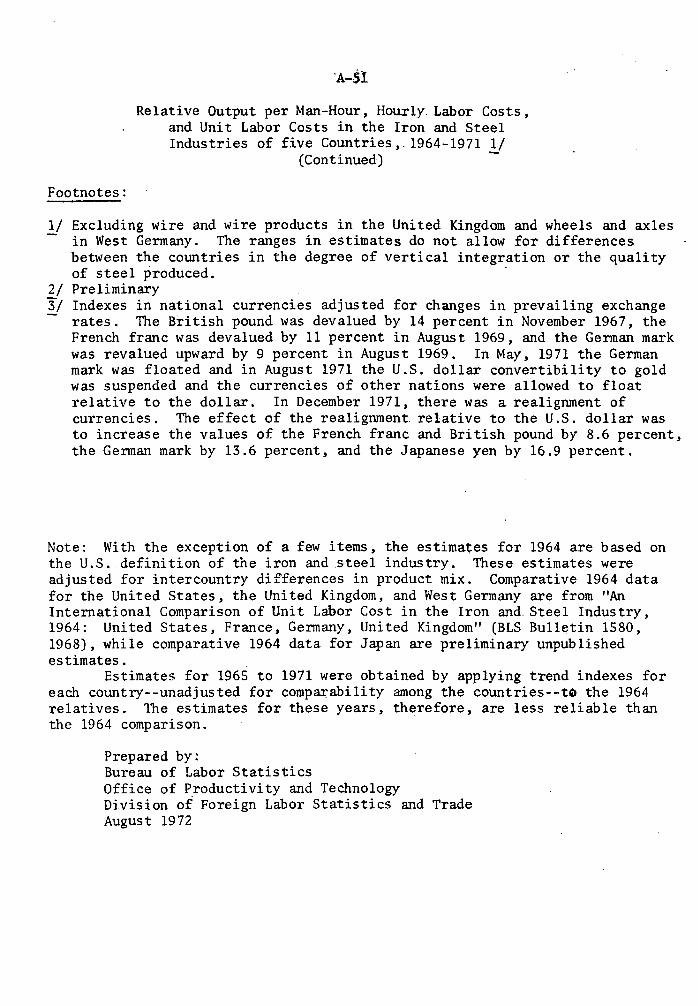
Footnotes:
Relative Output per Man-Hour, Hourly. Labor Costs, and Unit Labor Costs in the Iron and Steel Industries of five Countries,. 1964-1971 1/
(Continued) -
lf Excluding wire and wire products in the United Kingdom and wheels and axles in West Germany. The ranges in estimates do not allow for differences between the countries in the degree of vertical integration or the quality of steel produced.
2/ Preliminary 3/ Indexes in national currencies adjusted for changes in prevailing exchange
rates. The British pound was devalued by 14 percent in November 1967, the French franc was devalued by 11 percent in August 1969, and the German mark was revalued upward by 9 percent in August 1969. In May, 1971 the German mark was floated and in August 1971 the U.S. dollar convertibility to gold was suspended and the currencies of other nations were allowed to float relative to the dollar. In December 1971, there was a realignment of currencies. The effect of the realignment relative to the U.S. dollar was to increase the values of the French franc and British pound by 8.6 percent, the German mark by 13.6 percent, and the Japanese yen by 16.9 percent.
Note: With the exception of a few items, the estimates for 1964 are based on the U.S. definition of the iron and .steel industry. These estimates were adjusted for intercountry differences in product mix. Comparative 1964 data for the United States, the United Kingdom, and West Germany are from "An International Comparison of Unit Labor Cost in the Iron and. Steel Industry, 1964: United States, France, Germany, United Kingdom" (BLS Bulletin 1580, 1968), while comparative 1964 data for Japan are preliminary unpublished estimates.
Estimates for 1965 to 1971 were obtained by applying trend indexes for each country--unadjusted for comparability among the countries--to the 1964 relatives. The estimates for these years, therefore, are less reliable than the 1964 comparison.
Prepared by: Bureau of Labor Statistics Office of Productivity and Technology Division of Foreign Labor Statistics and Trade August 1972
A-~2
APPENDIX D
Statements Made by Representatives of the Steel Industry
Before the House Committee on Education and Labor in Connection with
Bill H.R. 478 to Amend the Fair Labor Standards Act of 1938 (Sept. 13, 1967)
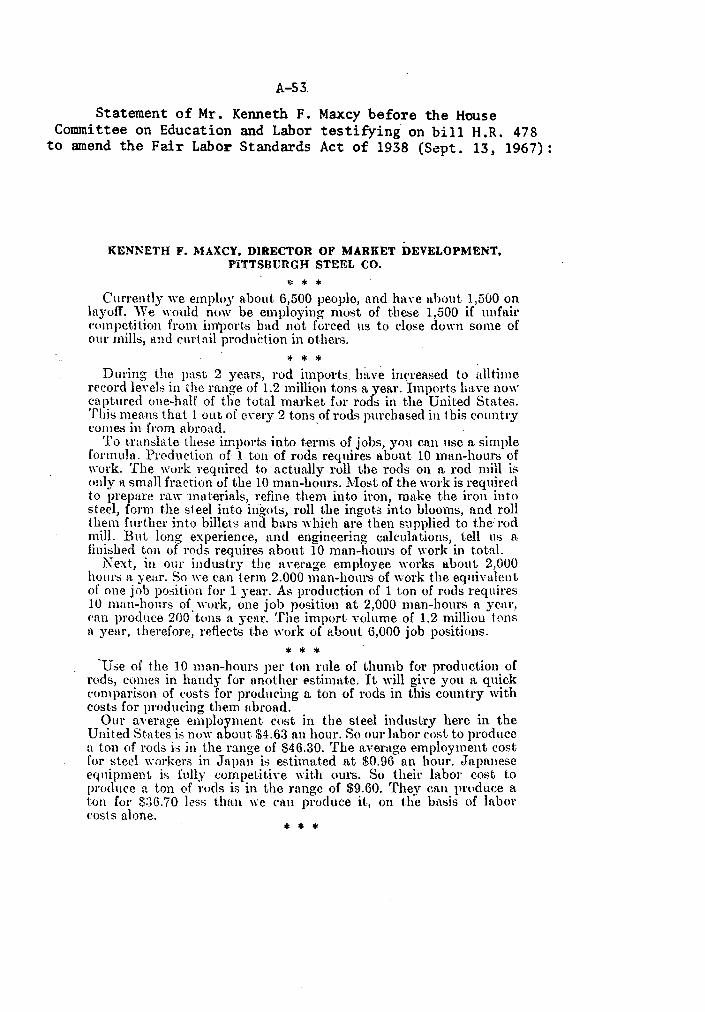
A-53.
Statement of Mr. Kenneth F. Maxcy before the House Committee on Education and Labor testifying on bill H.R. 478
to amend the Fair Labor Standards Act of 1938 (Sept. 13, 1967):
KENNETH F. MAXCY. DIRECTOR OF MARKET DEVELOPMENT. PITTSBURGH STEEL CO.
* * * Currently we employ ft.bout 6,500 people, and haYe ahout 1,500 on
layoff. \Ve would now be employing must of the::;e 1,500 if unfair eompetition from im'ports had not forced us to close down some of our mills, and curtnil prodtfrtion in others.
* * * Dming the past 2 years, rod imports have in(·reased to alltirne
record le,·els in the range of 1.2 million tons a year. Imports have now captured one-half of the total market for rods in the United States. This means that 1 out of e\-et·y 2 tons. of rods purchased in this country comes iu from abrO<l<l. ,
To translate these imports into ternis of jobs, yott can use a simple formula. Produeiion of 1 ton of rods requires about 10 mnn-hours of work. The work required to acttially roll the rods on ft rod mill is
. only a small fraction of the 10 man-hours. l\fost of the work is required to prepare raw materials, refine them into iron, make the iron into steel, form the steel into irigots, roll t.he ingots into blooms, and roll them fmther into billets and bars whieh are then supplied to the rod mill. But long experience, and engineering calculations, tell us a fillished ton of rods requires about 10 man-hours of work in total.
Next, in our industry the :weruge employee works about 2,000 hour::; a year. So \\"e can term 2.000 man-honrs of work the eq11iYale11t of one job position for 1 year. As production of 1 ton of rods requires 10 man-honrs of_ \rnrk, one job position at 2,000 man-honrs a yenr, <·an produce 200 tons a year. The import volume of 1.2 million tons a year, t.herefore, reflects the \\·ork of itbout 6,000 job positions.
* * * ·use of the 10 man-hours per ton rule of 1.humb for production of
rods, comes in handy for another estimate. It will gi,·e you a quick eomparison of eosts for producing n. ton of rods in this country with costs for producing them abroad.
Our avernge employment c·ost in the steel induslry here in the United States is now about $4.63 an hour. So our labor eost to produce a ton of rods is in the range of $46.30. The iwernge employment cost for 8teel workers in Japan is estimnted at $0.96 an hour. Japm1ese eq11ipment is fully competit.i\"e with ours. So their labor cost to produce a ton of r11ds is in the rnnge of $9.60. They can produce a ton for s:rn.70 less than we can produce it, on the bn:sis of labor costs alone.
* * *
A.-54
Statement of Mr. J.R. McAlpin before the House Conunittee on Education and Labor testifying on bill H.R. 478
to amend the Fair Labor Standards Act of 1938 (Sept. 13, 1967):
J. R. McALPIN, ASSISTANT TO THJo~ VICE PRESIDENT, COl\E\IERCIAJ, . ARMCO STEEL CORP.
* * * \Vi1·e ·and wire proclnrts nffer a pnrtiC'ularly good iliustmtivn of
t.he dama;;ing clfec't,s of forei~n competition on employment :1t. our Houslon Works. At the peuk in 1955, this mill pr.,d ueed 99.000 tons of basic "·ire, field fence, barbed "·ire, 1wib, st 11 ple,-, g:a h-.rnized wire, baling wire, nnd mesh. By 1966, output of tlte:;e pruduet;; had dwindled to only 25,000 ton-;. The basic eirnse of thi:; drn,;t ir de<·line is qHite ob,·ions "·hen \Ye see that imports of the:::e ;.;nme prodll('t:; through gulf coast. ports rose from n little o\·er 51.000 tuas in 19.'i5 to 180,000 in ] 066 .
.As a result of this tukeO\·er of the "·ire and ,,·ire prodnth Jllilrket in the South \\·est by foreign steel prod Heers, Armco relul't irnt I!- decided in Hl63 to discontinue barbed wire and fenee prodnttion at Houston. Some of t,he barbed wire equipment has been remo,·ecl fr(lm the plam and the rest de1lct.i vat.eel, nnd our fcnee m:tchine::i and :::ome zah·1rnizin}!; equipment. are ,-irtually "rnothbitlled." A corollary deYelt;prnent ,rn·s that employment in the wire nnd wire prodneh dep1u·tmPnt fell from 250 in Hl55 to 37 last ycitr.
Nor does t.his tell t h2 \\·hole story. If the 129,000-ton in1-rea.::;e in imports bet,rnen 1955 and 1966 had been supplied fnnu dome:;tie production, employment in onr wire operntions at Houston \\'O!tld not onlv have been maintained at the 250 le,·el, but \1·ould lu:n-e expandec!" considerably beyond that. Th us, the loss of job opportunities due to imports is even greater than indictlted by the rednl'lio11 from 2.50 to :37 employees. It is significant to note that the produets we were foreed to ahandon at Honston take o\·er three tin!es ns rnnnv mm1-honrs per ton t.o fabrirate as doe:-> the plain wire whieh \Ye stiil make there.
:VIoreover, foreign rompetition has siphoned off much oft he employment grnwt.h pot.entinl inherent in ot.lrnr products made 11 t our H Oll:>t.on pln.nt. In the fast 5 years, imports of snch produns thruugh the gulf co11.st have grown 157 percent to 1.2 million ttin:;, <•ran :n-er:.ge rnt.e of 20.8 percent 1umu11lly. By prod net c11tegories, the gai!ls \\·ere as follows: 125 percent for wire rods to 237,000 ton:;; lSl pr:Tent in
:-:lrnctnrals to 227,000 tons; 2.726 percent in plates to 297,000 tons; (i2 percent. in bnrs nnd bnr shapes to 435,000 tons. In just tbese produets alone, imports hn \·e risen by nearly three-q Hart.er million tons in the past 5 yeitrs. In terms of employment., tbe:,;e ndditionnl t.ons of foreign st.eel repre~ent an estimated loss of 13 million man-hours of 'rnrk lo American steelworkers in 1966, or t.he e4nintlent of 3,000 foll-time jobs.
* * *