stainless steel wire rod from brazil, france, and india
TRANSCRIPT

STAINLESS STEEL WIRE ROD FROM BRAZIL, FRANCE, AND INDIA
Determinations of the Commission in Investigations Nos. 731-TA-636-638 (Preliminary) Under the Tariff Act of 1930, Together With the Information Obtained in the Investigations
USITC PUBLICATION 2599
FEBRUARY 1993
United States International Trade Commission Washington, DC 20436
UNITED STATES INTERNATIONAL TRADE COMMISSION
COMMISSIONERS
Don E. Newquist, Chairman
Peter S. Watson, Vice Chairman
David B. Rohr
Anne E. Brunsdale
Carol T. Crawford Janet A. Nuzum
Robert A. Rogowsky, Director of Operations
Staff assigned:
Larry Reavis, Investigator
Charles Yost, Commodity-Industry Analyst
Michael Anderson, Economist
Jim Stewart, Accountant
Cynthia Johnson, Attorney
Bob Eninger, Supervisory Investigator
Address all communications to Secretary to the Commission
United States International Trade Commission Washington, DC 20436

CONTENTS.
Determinations and views of the Commission ............................. . Determinations ....................................................... . Views of the Commission .............................................. .
Information obtained in the investigations ............................. . Introduction ......................................................... . Prior investigations and voluntary restraint agreements .............. . Nature and extent of the alleged LTFV sales .......................... . The product .......................................................... .
Description and uses ............................................... . Industry specifications .......................................... . Manufacturing process ............................................ .
Melt stage ..................................................... . Casting stage .................................................. . Rolling stage ................................................... . Finishing stage ........ , ....................................... .
Uses .............................................................. . Imported and domestic product comparison ......................... . Substitute products .............................................. .
U.S. tariff treatment .............................................. . U.S. producers ....................................................... . U.S. importers ....................................................... . U.S. market and channels of distribution ............................. . Consideration of the alleged material injury ......................... .
U.S. production, capacity, capacity utilization, shipments, inventories, and employment ...................................... .
Financial experience of U.S. producers ............................. . Overall establishment operations ................................. . Operations on stainless steel wire rod ........................... . Unusual and nonrecurring expenses ................................ . Ca pi t:al expenditures ............................................. . Investment in productive facilities .............................. . Research and development expenses ................................ . Impact of imports on capital and investment ...................... .
Consideration of the alleged threat of material injury ............... . Consideration of the causal relationship between the alleged LTFV
imports and the alleged material injury .......................... . Imports ............................................... .- ............ . U.S. consumption and market penetration ............................ . Prices ............................................................. .
Market characteristics ........................................... . Questionnaire price data ......................................... .
U.S. producers' prices ......................................... . Brazilian wire rod ............................................. . French wire rod ................................................ . Indian wire rod ................................................ .
Lost sales and lost revenues ....................................... . Exchange rates ..................................................... .
Appendix A. Federal Register notices .................................. . Appendix B. Calendar of public conference ............................. . Appendix C. Stainless and heat-resisting steels ....................... .
1 3 5
I-1 I-3 I-3 I-5 I-6 I-6 I-8 I-8 I-9 I-9
I-10 I-11 I-11 I-13 I-13 I-14 I-14 I-14 I-15 I-16
I-16 I-18 I-19 I-19 I-26 I-27 I-27 I-27 I-27 I-29
I-34 I-34 I-34 I-38 I-38 I-39 I-44 I-44 I-45 I-45 I-45 I-46 A-1 B-1 C-1

ii
CONTENTS
Appendix D. Selected data related to the alleged material injury and the causal relationship between the alleged LTFV imports and the alleged material injury .... ·.· ......................................... D-1
Appendix E. Income -and- loss da,ta on the to_ll operations of Talley Metals Technology, Inc ....................... , . . . . . . . . . . . . . . . . . . . . . . . . E-1
Appendix F. Comments received from U.S. producers on the impact of imports of stainless steel wire rod from Japan, France, and India on their growth, investment, ability to raise capital, and/or existing development and production efforts .................................... F-1
Tables
1. Stainless steel wire rod: U.S. producers, plant locations, and respective shares of domestic production (by quantity), by firms, January 1989-September 1992 .............................. I-15
2. Stainless steel wire rod: U.S. production, average practical capacity, capacity utilization, company transfers, domestic shipments, exports, and end-of-period inventories, 1989-91, January-September 1991, and January-September 1992 .............. I-17
3. Stainless steel wire rod: Average nUll\ber of U.S. production and related workers and hours worked by and compensation paid to such workers, 1989-91, January-September 1991, and January-September 1992 .................................................. I-18
4. Income-and-loss experience of U.S. producers' establishments in which stainle.ss steel wire rod is produced, accounting years 1989-91, January-September 1991, and January-September 1992 ..... I-20
5. Income-and-loss experience of U.S. producers' stainless steel wire rod operations, accounting years 1989-91, January-September 1991, and January-September 1992 ................................ I-21
6. Income-and-loss experience of U.S. producers' stainless steel wire rod operations, by firms, accounting years 1989-91, January-September 1991, and January-September 1992 .............. I-23
7. Income-and-loss experience (on a per-short-ton basis) of U.S. producers' stainless steel wire rod operat1ons, accounting years 1989-91, January-September 1991, .and January-September 1992 ..... I-24
8. Income-and-loss experience of U.S. producers' stainless steel wire rod operations, adjusted to trade only, accounting years 1989-91, January-September 1991, and January-September 1992 ..... I-25
Ba. Income-and-loss experience of U.S. producers' stainless steel wire rod operations, adjusted to trade sales only, by firms, accounting years 1989-91, January-September 1991, andJanuary-September 1992 .................................................. I-26
9. Capital expenditures by U.S. producers on overall establishment and stainless steel wire rod operations, accounting years 1989-91, January-September 1991, and January-September 1992 ..... I-27
10. Value of assets of U.S. producers on overall establishment and stainless steel wire rod operations, accounting years 1989-91 ... I-28
11. Research and development expenses of U.S. producers on overall establishment and stainless steel wire rod operations, accounting years 1989-91, January-September 1991, and January-September 1992 .......................................... I-28

iii
CONTENTS
Tables--Continued
12. Stainless steel wire rod: Acos Finos' (Brazil) production, capacity, and shipments, 1989-91, January-September 1991, and January-September 1992 .......................................... I-31
13. Stainless steel wire rod: Imphy's and Ugine-Savoie's (France) production, capacity, and shipments, 1989-91, January-September 1991, and January-September 1992 ................................ I-32
14. Stainless steel wire rod: Mukand's (India) production, capacity, and shipments, 1989-91, January-September 1991, and January-September 1992 ............................ · ...................... I-33
15. Stainless steel wire rod: U.S. imports, by sources, 1989-91, ·January-September 1991, and January-September 1992 ...... : . ...... I-35
16. Stainless steel wire rod: Apparent U.S. consumption and ratio of imports to consumption, 1989-91, January-September 1991, and January-September 1992 .......................................... I-36
17. Stainless steel wire rod: Apparent U.S. open-market consumption and ratio of imports to open-market consumption, 1989-91, January-September 1991, and January-September 1992 .............. I-37
18. Product 1: Weighted-average net f.o.b. prices for sales reported by U.S. producers and importers and margins of under/ (over)selling, by quarters, January 1989-September 1992 ........ I-40
19. Product 2: Weighted-average net f.o.b. prices for sales reported by U.S. producers and importers and margins of under/ (over)selling, by quarters, January 1989-September 1992 ........ I-41
20. Product 3: Weighted-average net f.o.b. prices for sales reported by U.S. producers and importers and margins of under/ (over)selling, by quarters, January 1989-September 1992 ........ I-42
21. Product 4: Weighted-average net f.o.b. prices for sales reported by U.S. producers and importers and margins of under/ (over)selling, by quarters, January 1989-September 1992 ........ I-43
22. Exchange rates: Indexes of nominal and real exchange rates of selected currencies, and indexes of producer prices in those countries, by quarters, January 1989-September 1992 ............ I-46
D-1. Stainless steel wire rod: Summary data concerning the U.S. market, 1989-91, January-September 1991, and January-September 1992 ................................................. D-3
E-1. Income-and-loss experience of Talley on its stainless steel wire rod toll operations, accounting years 1989-91, January-September 1991, and January-September 1992 ..................... E-3
Note.--Information that would reveal confidential operations of individual concerns may not be published and therefore has been deleted from this report. Such deletions are indicated by asterisks.

'i 1• !tJ

... ··,· .:
1
DETERMINATIONS AND VIEWS OF THE COMMISSION


3
UNITED STATES INTERNATIONAL TRADE COMMISSION
Investigations Nos. 731-TA-636-38 (Preliminary)
STAINLESS STEEL WIRE ROD FROM BRAZIL, FRANCE, AND INDIA
Determinations
On the basis of the record1 developed in the subject investigations, the
Commission determines, pursuant to section 733(a) of the-Tariff Act of 1930
(19 U.S.C. § 1673b(a)), that there is a reasonable indication that an industry
in the United States is materially injured by reason of imports from Brazil,
France, and India of stainless steel wire rod, provided for in heading
7221.00.00 of the Harmonized Tariff Schedule of the United States, that are
alleged to be sold in the United States at less than fair value (LTFV).
Background
On December 30, 1992, a petition was filed with the Commission and the
Department of Commerce by Al Tech Specialty Steel Corp., Dunkirk, NY; Armco
Stainless & Alloy Products, Inc., Baltimore, MD; Carpenter Technology Corp.,
Reading, PA; Republic Engineered Steels, Inc., Massillon, OH; Talley Metals
Technology, Inc., Hartsville, SC; and the United Steelworkers of America, AFL-
CIO/CLC, alleging that an industry in the United States is materially injured
and threatened with material injury by reason of LTFV imports of the subject
product from Brazil, France, and India. Accordingly, effective December 30,
1992, the Commission instituted antidumping investigations Nos. 731-TA-636-
638 (Preliminary).
Notice of the institution of the Commission's investigations and of a
1 The record is defined in sec. 207.2(f) of the Commission's Rules of Practice and Procedure (19 CFR § 207 .2(f)).
4
public conference to be held in connection therewith was given by posting
copies of the notice in the Office of the Secretary, U.S. International Trade
Commission, Washington, DC, and by publishing the notice in the Federal
Register of January 12, 1993 (58 F.R. 3966). The conference was held in
Wash~ngton, DC, on January 22, 1993, and ~11 persons who requested the
opportunity were permitted to appear in person or by counsel.

5
VIEWS OF THE COMMISSION
Based on the record in these preliminary investigations, we unanimously
determine that there is a reasonable indication that an industry in the United
States is materially injured by reason of imports of stainless steel wire rod
from Brazil, France, and India that are alleged to be sold at less than fair
value (LTFV) . 1
I . LEGAL STANDARD IN PRELIMINARY INVESTIGATIONS ,
The legal standard in preliminary antidumping investigations· requires
the Commission to determine whether, based on the best information available,
there is a reasonable indication of material injury or threat thereof to a
domestic industry by reason of the subject imports. 2 In these investigations,
the Commission considered whether: "(l) the record as a whole contains clear
and convincing evidence that there is no material injury or threat of material
injury; and (2) no likeliho~d exists that contrary evidence will arise in a final investigation." 3 The U.S. Court of Appeals for the Federal Circuit.has
held that this interpretation of the standard "accords with clearly
discernible legislative intent and is sufficiently reasonable." 4
II. LIKE PRODUCT AND DOMESTIC INDUSTRY
A. Background and Products Subject to Investigation
To determine whether a domestiC industry.is materially injured or
threatened with material injury by reason of the subject imports, the
Commission must first define the "like product" and.the "industry". Section
771(4)(A) of the Tariff Act of 1930 (the "Act") defines the relevant domestic
1 Material retardation of the establishment of an industry is not an issue in these investigations and will not be discussed further. 2 19 U.S.C. § 167lb(a). American Lamb v. United States, 785 F.2d 994, 1001 (Fed. Cir. 1986). 3 American Lamb, 785 F.2d at 1001 (Fed. Cir. 1986). 4 Id. at 1004.

6
industry as "the domestic producers as a whole of a like product, or those
producers whose collective output of the like product constitutes a major
proportion of the total domestic production of that product . . . 115 In
turn, section 771(10) defines like product as "a product which is like, or in
the absence of like, most similar in characteristics and uses with, the
article subject to investigation n6
The Department of Commercehas:defined the imported product subject to
these investigations as:
hot.,.rolled or hot-rolled annealed and pickled rounds, squares, octagons, hexago~s or other shapes, in coils, for subsequent colddrawing or cold-rplling. ·. [Stainless steel wire rods (SS'WR)] are made of alloy steels containing, by weight, 1.2 percent or less of carbon and 10. 5 p.ercent or more of chromium, with or without other elements. Thes~ products are only manufactured by hot-rolling and are always sold in coiled form, and are of solid cross-section. The majority of SSWR sold in the United States are round in crosssectional shape, annealed and pi¢kled, and later cold-drawn into stainless steel wire. The most common size is 5.5 millimeters in diameter.
The American Iron and Steel Institute (AISI) lists a number of grades
for the subject product and the acceptable ranges of main chemical
constituents. Other standards-writing·organizations, such as the American
Society of Testing and Materials (ASTM) and the Society of Automotive
Engineers (SAE), identify specific metallurgical, physical, performance, or
testing procedures for these and other grades of stainless steel. 7 The bulk
of U.S. consumption consists of certain "commodity grades." A generally more
expensive and limited range of non-commodity ("specialty") stainless steel
wire rod is available to customers with more specific requirements.
5 19 U.S.C. § 1677(4)(A). 6 19 U.S.C. § 1677(10)r 7 Preliminary Report at I-8.

7
B. Discussion
Two like product issues have been presented by the parties in these
investigations: (1) whether the like product should include stainless steel
bar; and (2) whether commodity and specialty grade stainless steel rod
constitute separate like products. Petitioners urge the Commission to find
the like product to be stainless steel wire rod, regardles·s of grade.
Respondents argue that the Commission should define the like·product to
include both stainless steel bar and rod, but then urge the Commission to
divide the like product into two categories: commodity stainless steel rod
and bar and non-commodity stainless steel wire rod and bar. 8
1.' Whether stainless steel bar should be'included 'in the like product
Stainless steel wire rod is distinguished from stainless steel bar by
the fact that rod is manufactured in coiled form and used as a semifinished
product, whereas bar is manufactured in straight lengths and may be used
either· as a semifinished product or as a finished product. Stainless steel
wire··rod is a hot-rolled product which is nearly always subjected.to
subsequent cold-'drawing or cold-rolling~ By contrast, bars can be hot-
rolled, forged, extruded, turned, cold drawn, or grotind. 9 Stainless steel
wire rod is chiefly used to produce wire. 10 Because of these differences in
intended further processing, size tolerances for bar are expressed to greater
precision than those for rod. 11 It does not appear.that bar and rod are
interchangeable, nor do customers perceive them to be the sq.me product. In
8 See, .!L..&.:..· Preliminary conference transcript at 141-143. 9 Report at I-6. 10 Stainless steel wire rod is also used to a lesser extent in the production of stainless steel bar and as a raw material in the manufacture of fasteners and medical and dental instruments. Report at I-11, I-15. 11 Report at I-6.

8
terms of production processes 1 the initial production steps of melting and
casting bar and rod are simil~r, and the two products ar~ usually rolled on
the same lines by _most P,roducers. Following hot-roll.ing,, however, the bar
pl='oduct may be cut to length and channeled to a .. cooling table, . while the rod
pi.-oduct is channeled to a c.oiler. Bar may be further finished by cold.
i:olling. Rod is generally annealed (heat tr:eated), pickled in an acid or
caustic solutio~ •. and coate~ t;o .aid in ~ubsequent cold di:awing operations.12 ·
Further, rod is generally rolled to smal1er sizes than bar . . ·~ . . . .
In summary, although stainless steel bar and rod share some common .. ~ . . .
production facilities an~,productio~ proces~es, they differ in physical
~aracterist;ics and uses, are not interchangeabl~, _and cus_tomer perceptions
~re different. Accordingly, we are not including stainless steel bar in the
lik!:l product.
2~ · Whether coniiD.odity and spet:ialty stainless steel rod constitute separate like products ' ' '
At the outset,_ we note that there is little informatio~ on the record
:r;egard:j.ng the difference.s between specialtY: and. commodity stainless steel wire
rod. With regard t_o pro<iuction processes and production employees, the
limited info~ation available suggest~ that all grades of stainless steel rod
·are produced by melting, casting, hot-rolling, and finishing on similar, if
not the same, manufacturing equipment and by the same prod~ction employees.13
The production differences between different grades appear to be generally in
the control of the alloy concentrations and final working steps. Specialty
fOd generally has stricter chemical or physical specifications,
All grades of stainless steel rod appear to be s~ld to independent wire
12 Report at I-11. 13 Report at I-8.

9
redrawers and cold bar finishers, with smaller quantities sold to
manufacturers of fasteners and medical and dental equipment. 14 Thus, the
channels of distribution and the overall end use applications appear to be
similar for all stainless steel rod.
Purchasing decisions regarding stainless steel rod appear to be
primarily dependent on end-use application. The companies that purchase
stainless steel wire rod first identify the necessary mechanical properties,
corrosion resistance, and hardening capability, and then select a grade of
stainless steel that meets those criteria. 15 Thus, for a particular end use
application, there does not appear to be interchangeability between commodity
and specialty grades of stainless steel rod.
Similarly, for a particular end use, there does not appear to be
interchangeability within the various types of commodity stainless steel rod,
or within the various types of specialty stainless steel rod. Moreover, while
specialty stainless steel rod tends to have tighter chemical and/or physical
specifications, there may be variations, including tighter specifications,
within a commodity grade depending on specific customer requirements. 16 Thus,
there do not appear to be clear dividing lines among the various grades of
stainless steel wire rod.
In light of the overall similarities in characteristics and uses of all
grades, the similarities in their production processes, the overlap in their
channels of distribution, and the consequent lack of any clear dividing line
between specialty and commodity grade stainless steel rod, we decline for
purposes of these preliminary investigations to define separate like products
14 Report at I-15-16. 15 Report at I-11. 16 Preliminary conference transcript at 58-59, 65.

10
based on commodity grades versus specialty grades of stainless steel wire
rod. 17
Conclusion
The Commission has conducted investigations of steel wire rod in the
past. 18 In each of those investigations, the like product was defined as
stainless steel wire rod. While we are not bound to follow previous
determinations, we are not persuaded by this record to characterize the like
product differently in these preliminary investigations. We therefore define
the like product to be stainless steel wire rod, regardless of grade.
Accordingly, we find that there is one domestic industry: all producers of
stainless steel wire rod.
III. CONDITION OF THE INDUSTRY
In assessing whether there is a reasonable indication of material injury
to a domestic industry by reason of allegedly dumped imports, the Commission
is instructed to consider "all relevant economic factors which have a bearing
on the state of the industry in the United States 1119 These include
output, sales, inventories, capacity utilization, market share, employment,
wages, productivity, profits, cash flow, return on investments, ability to
raise capital, and research and development. 20 No single factor is
determinative, and the Commission considers all relevant factors "within the
business cycle and conditions of competition distinctive to the affected
17 Vice Chairman Watson and Commissioner Rohr may reexamine this issue in any final investigations. · 18 See, Hot-Rolled Stainless Steel Bar, Cold-Formed Stainless Steel Bar and Stainless Steel Wire Rod from Spain, Inv. No. 701-TA-176-178, USITC Pub. 1333 (Dec. 1982); Hot-Rolled Stainless Steel Bar, Cold-Formed Stainless Steel Bar and Stainless Steel Wire Rod from Brazil, Inv. No. 701-TA-179-181, USITC Pub. 1398 (June 1983). 19 19 U.S.C. § 1677(7)(C)(iii). zo Id.
11
industry. "21
One condition of competition relevant to this industry is the
interrelationship between the production of stainless steel rod and stainless
steel bar. 'This relationship includes, in many instances, the use of shared
production equipment. We intend to explore in greater detail in any final
investigation the interrelationship between bar and rod production, including
the impact of stainless steel bar production on the production of stainless
steel rod. 22
Another relevant condition of competition ·is the. fact 't:hat· ~b~ut 64
percent of ti. s. -produced stainless steel wite rod is internally b'on~umed by
U.S. producers in the manufacture of wire and bar. Thus, the bulk of domestic' .. ··
production of stainless steel wire rod is not traded on the open.market. We
recognize that import competition may not affect open-market and captive
production in the same way. 23
In the light of these conditions of competition, we have examined the ' . .
various indicators of the domestic industry's performance. Apparent U.S.
consumption of stainless steel wire rod declined from 1989 to 1990, but then
21 Id. 22 In any final investigations, we are interested in the allocation of. resources and costs common to the production of both stainless steel bar and stainless steel rod, and the effects of these allocations on the operating performance and financial condition of the domestic industry. 23 Although petitioners argue that the Commission should not include their captive production in the definition of the domestic industry, we note again that the statutory definitfon of domestic industry directs the Commission to include all domestic production, and provides no basis for excluding captive production. 19 U.S.C. § 1677(7)(C)(iii). We have consistently found that there is no basis for excluding captive production from the industry. See, ... ~. Polyethylene Terephthalate Film, Sheet, and Strip from Japan, the · . Republic of Korea, and Taiwan, Invs. Nos. 731-TA-458-460 (Preliminary), USITG. Pub. 2292 (June 1990); Industrial Phosphoric Acid from Belgium and Israel, Inv. Nos. 701-TA-285-286 and 731-TA-365-366 (Final), USITC Pub. 2000 (August 1987).
12
increa~ed in 1991 and again from January-September 1991 to January-September
1992 (interim periods). Specifically, apparent U.S. consumption decreased
from 127,885 s~ort tons in 1989 to 117,590 short tons in 1990, and then
increased to 123,496 short tons in 1991. Apparent U.S. consumption increased
from 88,915 short tons to 98,596 short tons in the interim periods. 24 U.S.
producers' market share in terms of quantity declined by nearly 10 percentage
points during the period of investigation. 25 Domestic production of stainless
~teel wire rod decreased from 100,937 short tons in 1989 to 91,199 short tons
in 1990 and declined further to 89,053 sh~rt tons in 1991. Production
ipcreased fro~ 67,137 short tons to 69,415 short tons in the interim
periods. 26 l '
Capacity for stainless steel rod production varied somewhat during the
period of investigation, decreasing from 1989 to 1990, then increasing in
1991. Capacity remained constant from interim 1991 to interim 1992. 27
Capacity' utilization decreased from 38.9 percent tp 33.8 percent from 1989 to
1991. Capacity utilization increased from 33.9 percent to 35.3 percent from
interim 1991 to interim 19~2. 28
Domestic shipments decreased from 39,284 short tons to 34,584 short tons
from 1989 to 1990, and then increased slightly to 34,875 short tons in 1991.
24 Report at I-36. 25 Report at I-34, 36. 26 Report at I-17. 27 U.S. producers' plant and equipment is not dedicated solely to the production of stainless steel wire rod, although specific equipments' ability to manufacture other products varies from firm to firm. The capacity for stainless steel wire rod production reported by U.S. producers represents an allocation based on the weight of the products shipped, normal product mix, or in the case of one producer, the maximum.capacity of its pickling equipment-which is dedicated to the production of stainless steel wire rod. The capacity calculations for the subject product therefore represent little more than an index for annual comparison p~rposes. Report at I-16. 28 Report at I-17.

13
U.S. producers' domestic shipments again decreased in the 1992 interim period·
to 23,281 short tons from 26,679 short tons in interim 1991. 29 U.S.
producers' transfer shipments decreased from 64,674 short tons to 58,663 short
tons from 1989 to 1990, and then increased to 62,390 short tons in 1991. U.S.
producers' transfer shipments increased from 44,532 short tons in interim 1991
to 46,021 short tons in interim 1992. End-of-period inventories declined
throughout the period of investigation. Specifically, inventories decreased
from 15,889 short tons to 10,~65 short tons from 1989 to 1991, and from 10,341
short tons to 9,773 short tons in the interim periods. 30
With respect to employment, the number of production and related workers
decreased from 1,280 workers in 1989 to 1,208 workers in 1990, and then
increased to 1,248 workers in 1991. The number of production and related
workers increased from 1, 276 to l, 345 in the interim periods. 31 Total
compensation paid to production and related workers and hours worked followed
the same trends as the number of production and related workers. 32
Productivity remained essentially constant throughout the period of
investigation. 33
Capital expenditures for the stainless steel wire rod industry increased
throughout the period. Specifically, capital expenditures increased from
$11.2 million in 1989 to $17.6 million in 1991, and similarly increased from
$12.1 million to $12.9 million in the interim periods. 34 Research and
development expenses also increased throughout the period of investigation,
29 Report at I-17. 30 Report at I-17. 31 Report at I-18. 32 Report at I-18. 33 Report at I-18. 34 Report at I-27.

14
from $4.3 million in 1989 to $4.9 million in 1991 and from $3.5 million to
$3.7 million in the interim periods. 35
Much of the financial information concerning the domestic industry is
confidential, and therefore, our discussion concerning that information is
general in nature. U.S. producers' open-market sales decreased in each
comparative period. Intercompany transfers decreased from 1989 to 1990 and
then increased in 1991. Transfers increased in interim 1992 compared with
interim 1991. Total net sales of wire. rod declined from $299.3 million in
1989 to $252.8 million in 1990, and declined again to $249.6 million in 1991.
Net sales of $191.7 million.for the 1992 interim period were essentially
unchanged from the interim 1991 period. The domestic industry realized annual
operating income of $24.5 million i-q 1989 and $316,000 in 1990; however, it
incurred an operating loss of $7.8 million inl991. Operating income (loss)
margins were 8.2 percent in 1989, 0.1 percent in 1990, and (3.1) percent in
1991. The operating loss was $15.6 million in the 1992 interim period
compared with $6.2 million in interim 1991. The operating loss margin as a
percent of sales was 3.2 percent in interim 1991 and 8.1 percent in interim
1992. 36 37
IV. CUMUIATION
In determining whether there is material injury by reason of the LTFV
imports, the Commission is required to assess cumulatively the volume and
effects of imports from two or more countries of like products subject to
35 Report at I-28. 36 Report at I-19-22. 37 Based on their analysis of the information in the record, Chairman Newquist and Commissioner Rohr conclude that there is a reasonable indication that the domestic stainless steel wire rod industry is currently experiencing material injury.

··:· ·.·: ··:.····.
15
investigation if such imports are reasonably coincident with one another and
compete with one another and with the domestic like product in the United
States market, unless imports from a subject country are negligible and have
no discernible adverse impact on the domestic industry. 38 39
In assessing whether imports compete with each other and with the
domestic like product, the Commission has generally considered four factors,
including: .. ,
(1) the degree of fungibility between the imports from different countries and between imports and the domestic like product, including consideration of specific customer requirements and other quality related questions;
(2) the presence of sales or offers to sell in the same . geographical markets of imports from different countries and the
domestic like product;
(3) the existence of comm.on or similar channels of distribution for imports from different countries and the domestic like product; and
(4) whether the imports are simultaneously present in the market. 40
While no single factor is determinative, and the list of factors is not
exclusive, these factors are intended to provide the Commission with a
framework for determining whether the imports compete with each other and with
the domestic like product. 41 Further, only a "reasonable overlap" of
38 19 U.S.C. § 1677(7)(C)(iv); Chaparral Steel Co. v. United States, 901 F.2d 1097, 1105 (Fed. Cir. 1990). 39 19 U.S.C. § 1677(7)(C)(v). The negligible imports exclusion is not an issue in these investigations. 40 See Certain Cast-Iron Pipe Fittings from Brazil, the Republic of Korea, and Taiwan, Inv. Nos. 731-TA-278-280 (Final), USITC Pub. 1845 (May 1986), aff'd, Fundicao Tupy. S.A. v. United States, 678 F. Supp. 898 (CIT 1988) aff'd, 859 F.2d 915 (Fed. Cir. 1988). 41 See Wieland Werke, AG v. United States, 718 F.Supp. 50 (CIT 1989); Granges Metallverken AB v. United States, 716 F.Supp. 17 (CIT 1989); Florex v. United States, 705 F.Supp. 582 (CIT 1989).

16
competition is required. 42
In applying the competition factors, the record indicates that the
imported and domestic products are fungible to some degree. All are sold to
AISI specification. We note that the French respondents argued that they are
the only importers of specialty grade stainless steel rod, and hence do not
compete with the other imports. In this regard, we note that there is
evidence in the record that there are also imports of specialty g~ade
stainless steel rod from Brazil. Moreover, we note that the French respondent
also imports commodity grade stainless steel rod of the same AISI
specification as is imported by the other importer-respondents. Thus, the
French products appear to be interchangeable at least to some extent with the
other imports and with the domestic like product. Respondents also argue that
the Indian products and, to a lesser extent, the Brazilian products are of
lower quality than the domestic or the French product. While there is some
evidence that the Indian product may be of lower quality, 43 and therefore only
useful in less demanding applications, it would appear that there is
competition between the Indian stainless steel wire rod and the other subject
imports and between such rod and the domestic like product for use in these
less demanding applications.
The record indicates that subject imports from India, France, and Brazil
are present in the same geographical markets as is the domestic like product.
42 See Wieland Werke, AG, 718 F. Supp at 52 (Completely overlapping markets are not required."); Granges Metallverken AB, 716 F.Supp. at 21-22 ("The Commission need not track each sale of individual sub.:.products and their counterparts to show that all imports compete with all other imports and all domestic like products . . . the Commission need only find evidence of reasonable overlap in competition"); Florex, 705 F.Supp. at 592 ("completely overlapping markets is [sic) not required.") · 43 Report at I-38-39.

17
For example, imports from all countries are sold through importers located in
the same mid-Atlantic area, as well as in other locations nationally. 44 Some
of the domestic product is produced in the same mid-Atlantic area. 45
The record evidence indicates that subject imports from France, India,
and Brazil have been simultaneously present in the U.S. market during most of
the period of investigation. 46
Finally, the record indicates that open-market stainless steel wire rod
is sold directly to independent wire and bar redrawers. Similarly, the
imported product has been imported by wire redrawers for the manufacture of
wire or by independent steel service centers and sold to the same general
clientele that U.S. producers serve. 47 Therefore, subject imports and the
domestic product appear to have similar channels of distribution.
For purposes of these preliminary investigations, we find sufficient
overlap of competition to satisfy the competition requirement for cumulation.
We will, however, revisit the issue of the extent to which the imports from
India, Brazil, and France compete with each other and with the domestic like
product in any final investigations.
V. REASONABLE INDICATION OF MATERIAL INJURY BY REASON OF ALLEGED LTFV IMPORTS
In determining whether there is a reasonable indication that the
domestic industry is materially injured by reason of the imports under
investigation, the statute directs the Commission to consider:
(I) the volume of imports of the merchandise which is the subject of the investigation,
44 Report at I-14-15. 45 Report at I-15. 46 Imports from India did not begin until 1990. 47 Report at I-16.
18
(II) the effect of imports of that merchandise on prices in the United States for like products, and.
(III) the impact of imports of such merchandise on domestic producers of like products, but only in the context of production operations in the United States. 48
In making this determination, the Commission may consider "such other
economic factors as are relevant to the determination . . . . "49 Although we
may consider information that indicates that injury to the industry is caused
by factors other than LTFV imports, we do not weigh causes. 50 51 52
48 19 U.S.C. § 1667(7)(B)(i). 49 19 U.S.C. § 1677(7)(B)(ii). 5° Chairman Newquist, Commissioner Rohr, and Commissioner Nuzum note that the Commission need not determine that imports are "the principal, a substantial or a significant cause of material injury." S. Rep. No. 249, 96th Cong., 1st Sess. 57 and 74 (1979). Rather, a finding that imports are a. cause of material injury is sufficient. See, ~, Metallverken Nederland, B.V. v. United States, 728 F. Supp. 730, 741 (CIT 1989); Citrosuco Paulista S.A. v. United States, 704 F. Supp. 1075, 1101 (CIT 1988). 51 Vice Chairman Watson notes that the courts .have interpreted .the statutory requirement that the Commission consider whether there is material injury "by reason of" the subject imports in a number of different ways. Compare, ~. United Engineering &. Forging v. United States, 779 F. Supp. 1375, 1391 (CIT 1989)("rather it must determine whether unfairly-traded imports are contributing to such injury to the domestic industry. Such imports, therefore need not be the only cause of harm to the domestic industry" (citations omitted)); Metallverken Nederland B.V. v. United States, 728 F. Supp. 730, 741 (Ct. Int' Trade 1989)(affirming a determination by two Commissioners that "the imports were a cause of material injury"); USX Corporation v. United States, 682 F. Supp. 60, 67 (Ct. Int'l Trade 1988)("any causation analysis must have at its core, the issue of whether the imports at issue cause, in a non de minimis manner, the material injury to the industry ... ")
Accordingly, Vice Chairman Watson has decided to adhere to the standard articulated by Congress in the legislative_ history of the pertinent provisions, which states that the Commission must satisfy itself that, in light of all the information presented, there is a "sufficient causal link between the less-than-fair-value imports and the requisite injury." S. Rep. No. 249, 96th Cong., 1st Sess. 75 (1979). 52 Commissioner Brunsdale and Commissioner Crawford note that the statute requires that the Commission determine whether a domestic industry is "materially injured by reason of" the allegedly LTFV imports. Many, if not most, domestic industries are subject to injury from more than one economic factor. Of these factors, there may be more than one that independently is causing material injury to the domestic industry. It is assumed in the legislative history that the "ITC will consider information which indicates
(continued ... )

19
The imports from Brazil, France, and India cumulatively accounted for
6.0 percent of total apparent U.S. consumption in 1989, 5.7 percent in 1990,
and 7.3 percent in 1991. Significantly, imports from France, Brazil, and
India dramatically increased from 5.2 percent of U.S. consumption in the
period January-September 1991 to 13.0 percent in the period January-September
1992. 53 54 In this regard, it is significant that the subject imports' share
of apparent U.S. consumption increased throughout most of the period of
investigation, while the market share of U.S. producers declined
commensurately. 55
The Commission requested price and quant~ty data from U.S. producers and
importers of the subject products for their sales of four types of stainless
steel wire rod. In general, U.S. producers' weighted-average prices for all
products showed increasing trends during 1989, then declining trends through
the remainder of the period. Available im~orted product prices showed similar
52 ( ••• continued) that harm is caused by factors other than the less-than-fair-value imports." S. Rep. No. 249 at 75. However, the legislative history makes it clear that the Commission is not to weigh or prioritize the factors that are independently causing material injury. Id. at 74: H.R. Rep. No. 317 at 47. The Commission is not to determine if the allegedly LTFV imports are "the princip.il, a substantial or a significant cause of material injury." S. Rep. No. 249 at 74. Rather, it is to determine whether any injury "by reason of" the allegedly LTFV imports is material. That is, the Commission must determine if the subject imports are causing material injury to the domestic industry. "When determining the effect of imports on the domestic industry, the Commission must consider all relevant factors that can demonstrate if unfairly traded imports are materially injuring the domestic industry." S. Rep. No. 71, lOOth Cong., 1st Sess. 116 (1987) (emphasis supplied). 53 We note that the open market consumption figures which exclude intercompany transfer shipments are confidential. Report at I-37. 54 Commissioner Nuzum also considered market penetration in terms of U.S. open-market consumption. She notes that the subject imports include intercompany transfers that were internally consumed. The imports from Brazil, France, and India cumulatively accounted for 12.1 percent of apparent U.S. open-market consumption in 1989, 11.4 percent in 1990, 14.6 percent in 1991, 10.6 percent in interim 1991, and 24.4 percent in interim 1992. 55 Report at I- 36.
··.,··.· .. ........ ·:.·.

20
trends. 56
Price comparisons were mixed, with both under- and over-selling by
imports reported. Most of the underselling observed was by the imports from
Brazil and India. In 5 of the 7 quarters for which price comparisons were
available, the Brazilian products were priced lower than the domestic product,
by margins ranging from 3.6 to 20.8 percent. There were only two instances of
overselling by the Brazilian product, by margins of 1.5 and 3.9 percent. 57
The Indian product was priced Qelow the domestic product in all 10 price
comparisons available, by margins ranging from 4.9 to 28.0 percent.~8
Conversely, in 19 of the 26 avai~able occurrences, the French product was
priced higher than the domestic product, by margins ranging from 0.5 to 32.9
percent. 59 In 6 instances, the French wire rod undersold the domestic product
by margins ranging from 0.8 to 5.3 percent. Domestic and French products were
priced the same in one instance. 60 61 62
56 Report at I-39-45. 57 Report at I-40. 58 Report at I-45·. 59 Commissioner Nuzum will reconsider, in any final investigation, the extent to which evidence of overselling or underselling, particularly by French wire rod, supports a conclusion of significant price depression or·suppression. She notes that information obtained from purchasers may be helpful in this regard. 60 Report at I-45. 61 Commissioner Brunsdale finds the data on underselling and ove~selling to be of particularly questionable value in these investigations. There is considerable evidence on the record inqicating that Indian imports are of lower quality than the domestic product. (See, e.g., Report at I-38 - I-39 and Post-Conference Brief of Gulf & Northern Trading Company and Mukand, Ltd.) There is also evidence that at least some of the imports from Brazil may be of lower quality than the U.S. product, while imports of "specialty" grades from France and Brazil may be of higher quality. (Staff Report at I-38 - I-39) While the issue of quality differences will need to be further investigated in any final investigations, it is not surprising that lower quality products should sell for a lower price than -- i.e., undersell -- the domestic product or that higher quality products should sell for a higher price than -- i.e., oversell -- the domestic product. Whether the lower prices of the Indian and
(continued ... )

21
We find that the increasing volume of imports of stainless steel wire
rod from the subject countries, which have accounted for an increasing share
of apparent U.S. consumption, provide a reasonable indication that the
domestic industry is materially injured by reason of the imports from Brazil,
France, and India. 63 This is consistent with the deteriorating financial
condition, declining sales, and declining prices experienced by the domestic
industry.
For all the reasons set forth above, and in light of the applicable
statutory standard for a preliminary investigation, we determine that there is
a reasonable indication that the domestic industry producing stainless steel
wire rod is materially injured by reason of the subject imports from Brazil,
France, and India.
61 ( •.• continued) Brazilian imports are causing price depression and thereby injuring the domestic industry can only be determined by a full economic analysis of the market. Similarly, a full analysis may show that the French imports are depressing prices even though they are selling for a higher price as a result of their higher quality. Simply noting that the price of one product is higher or lower than that of another tells us little, if anything, about whether price depression has been occurring. 62 Commissioner Crawford notes that interpretation of the underselling data may be complicated by the differences in quality between the domestic product and subject imports. Without further understanding of the importance of these quality differences, she finds the underselling data to be of limited value in these preliminary investigations. 63 Commissioner Brunsdale also notes that dumping margins are alleged to be between 29.6 percent and 34.2 percent for Brazil, between 17.8 percent and 25.5 percent for France, and between 41.l percent and 48.8 percent for India. (Report at I-5) While these margins are little more than petitioners' claims, they are the best information currently available concerning the level of the dumping; and they suggest that if the subject imports were sold at a fair price their sales could be considerably reduced, particularly for products for which domestic producers make good substitutes.

1-1
INFORMATION OBTAINED IN THE INVESTIGATIONS

·~ . '. .
I-3
INTRODUCTION
On December 30, 1992, a petition was filed with the U.S. International Trade Commission and the U.S. Department of Commerce by Al Tech Specialty Steel Corp., Dunkirk, NY; Armco Stainless & Alloy Products, Inc., Baltimore, MD; Carpenter Technology Corp., Reading, PA; Republic Engineered Steels, Inc., Massillon, OH; Talley Metals Technology, Inc., Hartsville, SC; and the United Steelworkers of America, AFL-CIO/CLC, alleging that imports of stainless steel wire rod from Brazil, France, and India are being sold in the United States at less than fair value (LTFV) and that an industry in the United States is materially injured and threatened with material injury by reason of such imports. Accordingly, effective December 30, 1992, the Commission instituted antidurnping investigations Nos. 731-TA-636-638 (Preliminary) under section 733(a) of the Tariff Act of 1930 (19 U.S.C. 1673b(a)) to determine whether there is a reasonable indication that an industry in the United States is materially injured or threatened with material injury, or the establishment of an industry in the United States is materially retarded, by reason of such imports.
Notice of the institution of the Commission's investigations and of a public conference to be held in connection therewith was posted in the Office of the Secretary, U.S. International Trade Commission, Washington, DC, and published in the Federal Register on January 12, 1993 (58 F.R. 3966). 1 The public conference was held in Washington, DC, on January 22, 1993, 2 and the vote was held on Febru?ry 9.
PRIOR INVESTIGATIONS AND VOLUNTARY RESTRAINT AGREEMENTS
Stainless steel wire rod has been the subject, or included in the subject, of several previous investigations. In July 1975 the domestic specialty-steel industry filed a petition with the Commission under section 201 of the Trade Act of 1974 for relief from imports of certain stainless and alloy tool steel products, including stainless steel wire rod. Following an affirmative determination (Stainless Steel and Alloy Tool Steel, Inv. No. TA-201-S, TJSITC Pub. 756, 1976), President Ford established a 3-year import restraint program for specialty steel effective June 14, 1976. Near the end of the program, the industry petitioned for an extension under section 203(i) of the Trade Act of 1974. Although the Commission found in favor of an extension (Stainless Steel and Alloy Tool Steel, Inv. No. TA-203-5, USITC Pub. 968, 1979), the President chose to phase out the import restraints over an 8-month period ending in February 1980.
In December 1982 the Commission instituted a second section 201 investigation on specialty steel products in response to a Presidential recommendation. (Earlier that year the United States Trade Representative (USTR) had been petitioned by the specialty-steel industry under section 30l(a)(2)(A) of the Trade Act of 1974 and found that the governments of
1 C~pies of the Commission's and Commerce's notices of institution are shown i.n app. A.
2 A list of participants at the conference is presented in app. B.
I-4
several European countries had subsidized the production of stainless and alloy tool steel in a manner inconsistent with their obligations under the Subsidies Code of the General Agreement on Tariffs and Trade (GATT)). Again the Commission determined affirmatively (Stainless Steel and Alloy Tool Steel, Inv. No. TA-201-48, USITC Pub. 1377, 1983), and, in July 1983, the President proclaimed import relief in the form of 4 years of global quotas for certain specialty steel products (including stainless steel wire rod) to expand at an annual rate of 3 percent. Under the relief, quotas were placed on imports of stainless steel bars, stainless steel wire rods, and certain alloy tool steel products; increased duties were imposed on stainless steel plates and stainless steel sheets and strip. On July 16, 1987, the President announced his decision to extend the import relief in the form then in effect for a period from July 20, 1987, through September 30, 1989.
Relief to the specialty steel industry was further extended for 2-1/2 years, until March 31, 1992, and the program was largely incorporated into the system of Voluntary Restraint Agreements (VRAs) that covered imports of carbon steel and certain alloy steel products. 3 Existing quotas on specialty steel were unaffected by their incorporation into the VRAs for all countries. The European Community (EC) negotiated limits on rods, bars, and alloy tool steel as part of its VRA; Brazil, whose VRA included the specialty steel products subject to quotas, was unaffected by the slight alteration in the program. India was not subject to either program (imports of stainless steel wire rod from India apparently started only recently).
In terms of the period for which data were gathered for these investigations, January-September 1989 comes under the section 203 action, while the VRA-based quota system is divided into two periods- -October l, 1989', through December 31, 1990, and January 1, 1991, through March 31, 1992. Stainless steel wire rod comprised a category in both agreements, although it was combined with stainless steel wire in the case of Brazil (exports of both items were limited to 3.704 percent of apparent U.S. consumption as calculated by Data Resources, Inc.). Although stainless steel rod was a separate category, it is difficult to judge how binding tl1e VRA with France was because that country's quota was part of the EC's total quota, 13.16 percent of
3 When the VRAs were extended in 1989, the United States sought to address the causes of unfair trade and to eliminate subsidies to and overcapacity 5.n the steel industry. These agreements sought to include commitments by countries to prohibit export and production subsidies specifically for steel products, to reduce tariffs and non-tariff barriers to steel trade, and to incorporate a binding arbitration mechanism; the bilateral consensus agreements were to be multilateralized within GATT through incorporation in the Uruguay Round of negotiations. (Press Release of USTR, Dec. 12, 1989, «rir'I
accompanying STEEL TRADE LIBERALIZATION PROGRAM (Fact Sheet).) As envis"i.ur•.ed; negotiations were to be completed by December 1990 with the new agreemer:t · called the Multilateral Steel Agreement (MSA). On Mar. 31, 1992, negotiation'> on the MSA were suspended without agreement, although considerable p:r:og:<.e;,;. had been made. Negotiators have reportedly agreed to continue to meet bilaterally and multilaterally, but no specific time schedule has been set.

I-5
apparent U.S. consumption. 4 Information on the restraint levels is shown below (in metric tons): 5
Jan. -Sept. Oct. 1989- Jan. 1, 1991-1989 Dec. 31, 1990 Mar. 31. 1992
Brazil ........... 778 2,783 778 EC ............... 4,191 5,790 2, 775
Prior to and concurrent with the foregoing actions, the Commission conducted three antidumping/countervailing duty investigations on the subject product. An investigation of Stainless Steel Wire Rod from France (Inv. No. AA 1921-110, TC Pub. 596, July 1973) led to an affirmative finding of injury and the imposition of an antidumping duty order. The order was terminated in 1986 in connection with the inclusion of the subject product in the VRAs negotiated with the EC. An investigation of Hot-Rolled Stainless Steel Bar. Cold-Formed Stainless Steel Bar, and Stainless Steel Wire Rod from Spain (Invs. Nos. 701-TA-176-178 (Final), USITC Pub. 1333, pecember 1982) led to a countervailing duty order which continues to be in effect. Another investigation of the same products from Brazil (Hot-Rolled Stainless Steel Bar. Cold-Formed Stainless Steel Bar. and Stainless Steel Wire Rod from Brazil, Invs. Nos. 701-TA-179-181 (Final), USITC Pub. 1398, June 1983) resulted in an affirmative determination and the establishment of a suspension agreement. The agreement, however, was terminated in 1988.
NATURE AND EXTENT OF THE ALLEGED LTFV SALES
There is .no information relating to the nature and extent of the alleged LTFV sales other than the allegations of the petitioners. The petitioners identified three producers in Brazil (Acos Finos Piratini SA, Acos Villares SA, and Electrometal SA--Metals Especials), two producers in France (Imphy SA and Ugine-Savoie), and four producers in India \Mukand Ltd., Ferro-Alloys Corp. Ltd., Grand Foundry Ltd., and MKJ Enterprises) that produced and exported the subject product to the United States. All are alleged to be selling at LTFV; however, petitioners provided LTFV information for only five of these firms: Acos Finos, which accounts for the bulk of imports from Brazil; Imphy and Ugine-Savoie, which account for virtually all imports from France; and Mukand and Ferro Alloys, which account for the bulk of imports from India. On the basis of actual 1992 home-market sales by these firms and sales to unrelated purchasers in the United States, the petitioners calculated dumping margins of 29.6 to 34.2 percent for Brazil, 17.8 to 25.5 percent for France, and 41.1 to 48.8 percent for India.
4 The restraint limits are more accurately defined as export limits, as the countries under agreement (the EC Commission and Eurofer, the European steel producers association, allocated the quota in the case of EC exports) controlled their shipments of exports in lieu of U.S. import quotas.
5 As compiled from the Commission's Quarterly Report on the Status of the Steel Industry.
I-6
THE PRODUCT
Description and Uses
The products subject to petitioners' complaint are "stainless steel wire rods" of all grades of stainless steel and all sizes and shapes. 6 Rods are semifinished, hot-rolled or hot-rolled, pickled, and annealed products of solid cross-section (including circles, rectangles, octagons, hexagons, triangles, and other shapes) in irregularly wound coils, for subsequent colddrawing or cold-rolling. Based on testimony presented at the staff conference, the term "wire rod" is used interchangeably with "rod."7
Responses to the Commission's questionnaires indicate that the bulk of the product produced domestically and imported from the subject countries consists of wire rod of a circular (round) cross-section with a diameter below 14 millimeters (0.55 inch), and a significant proportion is wire rod of 5.5 mm (0.217 inch) in diameter. Bar and wire are excluded from the scope of the petition. Also excluded is stainless steel concrete reinforcing bar; 8 there is little or no production of this product in the United States, according to petitioners. 9
Stainless steel wire rod is distinguished from stainless steel bar by the fact that rod is a coiled semifinished product (i.e., used in the manufacture of other products of stainless steel) whereas bar is a stainless steel product in straight lengths that may be utilized as either a semifinished or finished product. Although stainless steel bar may be produced by hot-rolling and subsequent cold-finishing (extruded, turned, colddrawn, or ground), rod is nearly always subjected to cold-drawing or coldrolling and chiefly used to produce wire . 10 Because of this difference in intended processing, size tolerances for bar are expressed to greater precision than those for rod. Otherwise, there is some overlap in size, shape, and grade classifications, and bar is often produced by decoiling, cold-finishing, and cutting rod to straight lengths. Rod is also
6 See app. A for Commerce's Federal Register notice, which contains a description of the merchandise subject to its investigations.
7 Transcript of the conference (TR), testimony of Mr. Pendleton, p. 63. 8 This product would be produced on a rod mill, but not subjected to
further cold-drawing or cold-rolling. 9 Petition, p. 8. See also, Iron and Steel Society, Steel Products Manual:
Stainless and Heat Resisting Steels, November 1990, p. 7. 1° Compare "Bars. Straight lengths either: hot rolled, forged, extruded,
turned, cold drawn or ground." with "Rods. Hot rolled or hot rolled annealed and pickled ... shapes in coils, for subsequent cold drawing or cold rolling." (emphasis added). Iron and Steel Society, Steel Products Manual: Stainless and Heat Resisting Steels, Nov. 1990, p. 7. According to testimony at the staff conference, cold heading (which accounts for a significant percentage of the consumption of rod and bar) is a drawing process. TR, p. 63, testimony of Mr. Pendleton.
... :···
I-7
distinguished from "wire," which is always described as the. downs.tream product drawn from rod. 11
Stainless steels are distinguished from carbon and lower alloy steels chiefly by stainless steel's superior resistance to corrosion or oxidation at atmospheric or elevated temperatures. This superior corrosion resistance is primarily brought about by the addition of chromium to alloys of iron and carbon; although other elements such as copper, aluminum, silicon, nickel, and molybdenum also increase the corrosion resistance of steel, they are limited in their usefulness in the absence of chromium. 12 According to industry specifications, stainless steel possesses a minimum chromium content of· 10 percent. 13 Stainless steels, including those that comprise wire rods, are generally subdivided according to whether or not they are hardenable by heat treatment (martensitic and ferritic, respectively), by cold work (austenitic), or by solution treatment and aging (precipitation hardening). There are numerous grades with different chemistries (the relative amounts of nickel, chromium, molybdenum, copper, and other alloying agents vary, for example), physical and mechanical properties, and end uses within each of these broad. subdivisions, and it is common to refer to a particular grade by its 3-digit type number (or 5-digit'code in the unified numbering system), which generally indicates the alloy's chemistry. This type number is sometimes modified by a letter suffix to indica.te chemical differences between the two grades. For example, type 316L differs from 316 with respect to its lower carbon content. Appendix C lists standard types.
According to the petitioners, the predominant grades of stainless steel wire rod sold in the United States are 304, 316, 302 spring, 302 HQ (heading quality), and 430; 14 the 300-series are nonhardenable, austenitic, and nonmagnetic chromium-nickel stainless steels, while the 400-series are nonhardenable, ferritic, and magnetic chromium steels. These essential characteristics influence how the steel is melted, its ladle treatment, hot rolling, .and heat treatment, as described below.
Petitioners indicated that imports of grades 304 and 316 account for the majcrity of imports from Brazil and India. Respondents have not disputed that statement, although a witness for Metalimphy Alloys Corp., the only importer of the subject wire rod from France, distinguished between "commodity products.," indicated as AISI (American Iron and Steel Institute) grades 302, 304, 316, and 430, and "specialty products" (such as· grades 302 HQ and A286 for cold-heading applications fabricating fasteners, 308 and 312 for welding wire applications, and 330 and 330 CB for heat treating applications) . 15 This
11 Stainless steel wire is defined as a "round or shaped cold reduced product in coils only produced by cold finishing coiled rod." (emphasis in original). Steel Products Manual: Stainless and Heat Resisting Steels, p. 7.
12 United States Steel, The Making, Shaping, and Treating of .Steel, 1985 (10th Edition), p. 1333.
13 Note l(e) to Chapter 72 of the HTS defines stainless steel as alloy steels containing, by weight, 10.5 percent or more of chromium and 1.2 percent or less of carbon, with or without other elements.
14 Petition, p. 9. 15 TR, p. 115, testimony of Mr. McKeithan.
I-8
same witness stated that his firm's imports of "specialty" grades accounted for *** percent of its total imports in 1992; 16 he further stated that imports of these "specialty" grades compete with the production of only one of the domestic companies. 17 Counsel representing one producer in India distinguished their product, $aying it is inferior and of low quality ("junk"), and claimed that it does not compete with either imports from France or Brazil or the domestic product. 18 (See subsequent section entitled "Imported and Domestic Product Comparison.")
INDUSTRY SPECIFICATIONS
Stainless steel wire rod is produced to chemical composition limits, physical properties, and thermal treatments specified by the AISI, the American Society for Testing and Materials (ASTM), and the Society of Automotive Engineers (SAE). Maximum percentages of certain elements are specified in SAE and AISI grades (carbon, manganese, phosphorus, sulphur, silicon, chromium, nickel, molybdenum, and sometimes cobalt, titanium, and copper, for example), ASTM and SAE reference standards specify test procedures and physical properties (including mechanical properties, grain size, microstructure and surface quality--including seam depth, elasticity, electric resistivity, expansion, melting range, and magnetic permeability). According to information presented at the conference, end users sometimes mod~fy the specifications to achieve a particular performance (and other specification-writing bodies may specify standards for specific applications). 19 However, the majority of stainless steel wire rod is sold to typical specifications. 20
MANUFACTURING PROCESS
The manufacturing process leading to the production of stainless steel wire rod is analyzed below; it consists of four different stages: (1) melting, (2) casting, (3) ho.t-rolling, and (4) finishing (annealing, pickling, and coating), and the basic process is common for all grades of wire rod.
16 Post-conference brief on behalf of Imphy, S.A. et al., app. A. In comparison, *** percent of the firm's imports in 1991 were specialty products. The firm explained that ***·
17 TR, p. 116, testimony of Mr. McKeithan. 18 TR, pp. 133-136, testimony of Mr. Horlick. 19 TR, pp. 65-67, testimony of Messrs. Bailey, Hartquist, and Pendleton,
and pp. 118-119, testimony pf Mr. McKeithan 20 TR, pp. 65-67, testimony of Messrs. Bailey, Hartquist, and Pendle~on.
This statement was apparently supported by Mr. McKeithan.
I-9
Melt Stage
Most of the stainless steels produced in the world are melted from scrap in an electric arc furnace (EAF). The scrap charge may consist of stainless steel scrap alone or be combined with high-grad~ carbon steel scrap; additions of alloying agents (including chromium, nickel, and molybdenum) are made to the liquid steel to impart specific properties to finished steel products. The molten steel is poured or tapped from the furnace to a ladle, which is an open-topped, refractory-lined vessel that has an off-center opening in its bottom, ·equipped with a nozzle. Meanwhile, the primary steelmaking vessel (EAF) may be charged with new materials to begin another refining cycle.
Molten stainless steel i~ __ typically ·-passed through a ladle metallurgy station, where its chemistry.is 'refined ·to embody the steel with properties required for specific applications. 21 At the ladle metallurgy, or secondary steelmaking station, the chemical content (particularly that of carbon and sulphur) is adjusted, and alloying agents may be added; the steel may be degassed (the elimination of oxygen and hydrogen) at low pressures; 22 and the temperature of the steel is adjusted for optimum ca~ting. Stainless steelmakers use processes such as argon-oxygen decarburization or vacuum oxygen decarburization.
Casting Stage
Once molten steel with the correct properties has been produced, it is cast into a form that can enter the rolling process. Some stainless steels
21 Ladle metallurgy stations differ.in their sophistication and in their ability to refine the steel.
22 Liquid steel absorbs gases from the atmosphere and from the materials used in the steelmaking process. These gases, chiefly oxygen and hydrogen, cause embrittlement, voids, and nonmetallic inclusions. Low pressure, such as in a vacuum, aids the release of oxygen in gas form without the need for additions of "deoxidizers" such as silicon, aluminum, or titanium, which form nonmetallic inclusions. Additionally, carbon content may be reduced more easil,y at low pressure (because it combines with oxygen to form carbon monoxide and is released in gas form), result~ng in a more ductile steel. Hydrogen gas causes embrittlement, low ductility, and blow holes in steel; vacuri.m treatment enhances the removal of hydrogen from the steel. Hence the use of deoxidizing processes results in a more efficient process and a cleaner steel. United States Steel, The 11aking, Shaping, and Trea't:ing of S't:eel, 1985 (10th Ed.), pp. 671-676.

I-10
are cast into ingots, but continuous (strand) casting of billets23 is the preferred method for the industry producing wire rod.
In ingot casting, the 'ladle is .moved by an overhead crane to a pouring platform where the molten steel is .poured, or ."teemed'; into ingot molds, either through the top of each mold, or, in the preferred method, through a pipe system that filis each mold 'from the bottom. A,.s the steel begins to. solidify, the mold is stripped fro'm the ingot and the ingot is transferred to a soaking pit, a specialized heating furnace that equalizes the temper4ture within the ingot. Following removal from the soaking pit, the ingots a~e hot· rolled on a primary breakdown JJ1ill to bloom and billet sizes.
In strand (conti,nuous) c4sting, tpe ladle containing molten steel is transferred from the. ladle metal1',1rgy station· to the caster, and the .Qlol1:en steel is poured at a controlled rate intp a tundish, which, in turn controls the rate of flow of the moltei:i steel into the caster's mold. The tundish may have a spec.ial design or electromagnetic stirring for the purpose of ensuring homogeneity of the steel. The strand caster is designed to produce billets in the desired cross-sectional dimensions, based on the dimensions of the rod and the number of passes to be made during rolling. ~illets may be charged directly into the rolling mill ("hot-charged") or they may be subjected to one or several conditioning operation~ (heating or annealing, grinding, or turning, for example) that ready them for hot rolling.
Rolling Stage
Billets are usually channeled through a reheat furnace prior to rolling. This increases the malleability of the steel and reduces we~r and energy consumption on the rolling mill. Most modern rolling mills are in-line (or straight line), although cross-country mills are still in use. This discussion focuses on the in-line rolling mill. Exiting the reheat furnace, the billet is initially reduced on a cogging mill, and it may be reheated to maintain optimum rolling temperature prior to being passed through and successively reduced in size in several more stands, termed intermediate rolling. After the last intermediate rolling stand the product may be passed further along the hot-rolling l~ne to the finishing stands, where it is further reduced in size, or it may be directed to a cooling bed and cut to length and sold or used as bar. Upon leaving the finishing stands .the rod is ·channeled to a coiler where it is coiled and may be subjected to blc;>wn-air
23 Billets are mostly square, semifinished steel shapes, of a solid cross section measuring mostly in the range. SO mm by SO mm (2 inches by 2 inGhe~) to 12S mm by 12S mm (S inches by S inches), although the representative of . Carpenter Technology stated that his company produces a 7-inch square biilet. TR, p. 28, ·testimony of Mr. Pendleton. Although billets were disti~guished from blooms (another semifinished shape) by size in the Tariff Schedules ~f the United States, with the break between them occurring at approximately· 36 square inches, these distincti~ns were ~ot carried over into the Barmonized Tariff Sys~em. Billets may be used to produce rods and bars, but are restricted to smaller bar sizes; blooms, which have a larger cross seqtion, are used to produce l~rger size bars.
I-11
cooling or direct water quench cooling. According to testimony at the staff conference, rod producers are able to make and coil rod up to 1-1/4 inches in diameter. 24 The rod will make one or more passes than does a bar through a cross-country mill to reduce it to finished diameter.
Control of the steel's temperature as it passes along the rolling line is the primary determinant of grain structure and scale; there may be heating apparatus between roll stands to restore temperature or in-line cooling boxes as well. Water cooling the rod as it is being coiled reportedly eliminates the need for subsequent annealing (heat treatment).
Finishing Stage
Wire rod is typically annealed and pickled following rolling. 25 The rod may be heat treated (annealed) in an annealing furnace to avoid thermal cracking and improve the steel's surface quality, grain size (internal metallurgical quality), and mechanical properties (many 400-series stainless steels require annealing, and most rod destined for wire drawing is annealed). Pickling (immersion in an acid or chemical bath) or cleaning with shot blast, removes mill scale from the rod's surface. This improves the surface quality and allows the rod to be drawn. Following these procedures, the rod may be coated with a metal such as copper, or lime, borax, or phosphate to neutralize any residual acid and to provide a lubricant to the wire drawing operation.
USES
The primary consumers of stainless steel wire rod are wire drawers (termed, "redrawers") and cold finish bar manufacturers (including captive consumption for bar and wire production). The companies that purchase stainless steel wire rod first identify the necessary mechanical properties (e.g., ductility, strength, and hardness), corrosion resistance, and hardening capability and then select a grade of stainless steel that meets those criteria.
Although there are literally hundreds of grades and size variations of stainless steel wire rod, petitioners and respondents indicate that certain grades account for the bulk of production and shipments. Information on characteristics and end-use applications of these rod grades is presented in the following tabulation: 26
24 TR, p. 55, testimony of Mr. Pendleton. Rod diameter limitations are imposed by the size of the coil and its weight. The rod's diameter is typically determined by its end use: the rod is only capable of being reduced in size by 60 to 65 percent, hence the desired finished wire diameter determines the rod's diameter.
25 TR, p. 56, testimony of Mr. Gugino. Reportedly, Carpenter Technology's coil water quench eliminates the need for annealing for some stainless grades. Husk:men, "World-Class Bar/Rod Mill," p. 5.
26 Adapted from Iron and Steel Society, Steel Products Manual: Stainless and Heat Resisting Steels, Nov. 1990.

AISI Grade
302.
302 HQ
304
308/312
316
330/330CB
430
I-12
Characteristics and Applications
Austenitic, essentially nonmagnetic, and nonhardenable; develops maximum softness, ductility, and corrosion resistance when annealed; used largely in the annealed condition for applications involving beverages, food processing, hospitals, restaurant and laundry equipment, fasteners, tableware, and wire for springs.
Similar to 302, but designed primarily for coldheaded parts that need to be drilled, slotted, or broached (e.g., phillips-head screws)
The most widely used of the stainless steels; its maximum carbon content is lower and its corrosion resistance somewhat higher than type 302. It is used for applications involving beverage, food, pharmaceutical, refinery, power plant, and chemical process industry equipment. Type 304 wire includes bright annealed, annealed, and drawn wires for fasteners and springs.
Austenitic, chromium-nickel stainless steel used primarily for welding wire (i.e., forms the electrode wire in electric-arc welding).
An austenitic, chromium-nickel-molybdenum stainless and heat resisting steel with corrosion resistance superior to most other chromium-nickel steels in many types of chemical corrodents and marine atmospheres. It exhibits superior creep strength at temperatures up to 1,400 degrees F. Its industrial uses include chemical-, pharmaceuticalpulp and paper-, photographic- and textile-industry equipment. Carbon content may be lowered (316L) to increase corrosion resistance following welding or stress relieving. Other chemistry modifications improve machinability, corrosion resistance, and mechanical strength (types 316F, 316N, 316LN).
An austenitic, chromium-nickel, silicon alloy with heat resisting properties and good resistance to oxidation, carburization, and to thermal shock. The alloy possesses less than 50 percent iron and is classed with the nickel based alloys by ASTM. May have columbium (Cb) added to improve heat resistance.
A chromium stainless steel used in the annealed condition for applications including tableware, appliance trim, kitchen equipment, cookware, and architectural-and-chemical process equipment.

AISI Grade
660
I-13
Characteristics and Applications
Austenitic stainless steel with high notch rupture strength and stability at high temperatures up to 1,300 degrees F. Nonmagnetic and precipitation hardenable. Used for jet engine applications, exhaust manifolds, valves, and fasteners. Also termed A286 or Pyromet 286, a Carpenter Technology Co. trademark.
IMPORTED AND DOMESTIC PRODUCT COMPARISON
According to information presented at the conference by petitioners, there is little or no difference in· quality between the domestic product and its imported counterpart, and the imported product may be used interchangeably for wire rod produced in the United States, within certain limits. Witnesses for petitioners indicated that they believe the domestic product and product imported from the countries undet investigation are fungible on the basis of quality, On the other hand, ·counsel for a producer in India and a witness for a domestic importer from that country indicated that the Indian product is inferior in quality, delivery, and packing. A witness for French respondents indicated that most of his· company's imports were equal in quality, but that a significant percentage represents a niche or specialized product that does not compete with the products of the majority of U.S. companies (the niche products do, however, compete with one domestic company) because they are of superior quality and for specific and specialized applications. The Brazilian respondent took no stand on the issue. 27 According to questionnaire responses, there are several differences between the domestic and imported products in the area of customer service: there are significantly longer lead times associated with purchasing from a foreign source; inventories are larger because of larger purchase orders; shipping delays are more frequent; and the domestic industry provides a greater amount of customer and technical service. ,'
According to domestic industry officials, imports of stainless steel ·wire rdd are predominantly in grades 304, 316, 302 spring, 302 HQ (heading quality), and 430, as discussed earlier.
SUBSTITUTE PRODUCTS
With respect to the uses indicated earlier, there do not seem to be acceptable alternatives possessing the same or similar degree of corrosion and heat resistance as stainless steel wire rod, although other steels may possess a greater degree of machinability. The substitution by ceramics, which possess greater heat-resistance capability would be limited by ceramics' limited fracture resistance and lack of ductility or flexibility.
27 However the questionnaire response by Metalimphy stated that ***. Techalloy, another importer, stated that ***
I-14
U.S. Tariff Treatment
The subject product is specifically provided for in subheading 7221.00.00 of the HTS. The column 1-general (most-favored-nation) rate of duty for this subheading, applicable to imports from the countries under investigation, ·is 4. 7 percent.
U.S. PRODUCERS
In addition to the petitioners, two other firms are known to have produced stainless steel wire rod during the period for which data were collected: Crucible Materials Corp. (Specialty Metals Division), Solvay, NY, a relatively small producer which ceased production in 1992; and Inco Alloys Internatio.nal, Inc.,. Huntington, WV, which pro.duces small quantities of an exceptionally high grade material. All of the current producers are large. specialty steel manufacturers that produce a number ·of steel products in addition to stainless steel wire rod. Their respective shares of U.S. stainless steel wire rod production are ~howri in table 1. Three producers.;Al Tech, Armco, and Carpenter--accQunt for•more -than 90 percent of U.S. production (Carpenter alone account:;s for mor~ tpan ***), the bulk t;)f which they consume themselves in the m~nufacture of bar and wire. Armco does not produce a complete product: under the terms of a toll agreement; *** other U.S. firms hot-roll and coil the 'billets it provides. The coils ·are returned to Armco for annealing, pickling, and coating.· Excepting Inco, all prod~ce a wide range of commodity-grade products, and all claim to serve the entire U.S . . market. Non-commodity grades. are provided by Inco (exclusively) and Carpenter.
U.S. IMPORTERS
Two firms--both related to the French producers, Imphy and UgineSavoie--account for the bulk of the imports from Brazil and all of the imports from France: Metalimphy Alloys Corp., Colmar, PA, a steel service center; and Techalloy, Inc., Mahwah, NJ, a wire redrawer. 28 Metalimphy is the only importer of stainless steel wire rod from France; and, since January 1990, when Techalloy became a related company, it has transferred about *** of these imports to Techalloy for the manufacture of wire. The remainder it sells on the open market. Until 1990, Metalimphy also accounted for ~11 of the imports from Brazil. From January 1990 to January-September 1992, about *** p~rcent of the subject product from Brazil was imported by Techalloy for consumption in its wire producing operations.· Most of the remain'ing *** percent was imported by a small steel service center--frecision Metals Services, Inc., Colmar, PA--which imports from Electrometal.
Five firms, all specialty steel ~ervice centers selling on the open market, account for most of the imports from India. Gulf and Northern Trading Co., Voorhees, NJ; Comprador Inoxidable, Inc. San Francisco, CA, which begaq
28 Both firms are owned by Imphy Alloys, Inc. , Mahwah, NJ, which in turn is owned by Imphy *** and Ugine-Savoie ***

I-15
Table 1 Stainless steel wire rod: U.S. producers, plant locations, and respective shares of domestic production (by quantity), by firms, January 1989-September 1992
Firm
Al Tech
Armco
Carpenter
Crucible2
Inco3
Republic
Talley
Plant location(s)
Dunkirk, NY
Baltimore, MD1
Reading, PA. Orangeburg, SC
Syracuse, NY
Huntington, WV
Canton, OH Chicago, IL Massillon, OH
Hartsville, SC
Share (percent) of domestic production
***
***
***
***
***
***
***
1 Billet production and annealing, pickling, and coating. Hot-rolling and coiling are done by *** other U.S. firms under the terms of a toll agreement.
2 ***--ceased production of the subject product in 1992. 3 ***
Source: Compiled from data submitted in response to questionnaires of the U.S. Ir-ternational Trade Commission.
importing in 1991; and ABB Trading Co., Oakland, CA, which imported prior to 1991, account for virtually all of the imports from Mukand. Associated Metal and Minerals Gorp., w"hite Plains, NY, which imports from Ferro Alloys Corp., and TrefilARBED, Inc., New York, NY, which imports from Grand Foundry, account for most of the remaining imports from India.
U.S. MAR.KET AND CHANNELS OF DISTRIBUTION
About 64 percent of U.S.-produced stainless steel wire rod is internally consumed by U.S. producers in the manufacture of wire and bar. The bulk of the remainder is sold directly to independent wire and bar redrawers for the same purpos~s. Lesser quantities are sold to manufacturers of fasteners and medical and dental instruments. Since 1990, *** the imports from France and about **x percent of the imports from Brazil have either been transferred to or directly :i.rrq:iorted by Techalloy for its use in the manufacture of wire. The rest of the exports from the subject countries have been imported by independent steel service centers and sold to the same general clientele that

:; .:-- . .
I-16
U.S. producers serve. Quantities to be shipped are loosely negotiated by p~rties in one quarter for the following quarter. Given the degree of competition and commodity-like nature of most grades of stainless steel wire ro.d sold domestically, sales conditions and prices are not finalized until the time scheduled for shipment. Unlike many sectors of the economy, the consumption of stainless steel wire rod has increased since 1990, reaching levels of over $350 million annually (see the section of this report entitled "U.S. ·consumption and Market Penetration").
CONSIDERATION OF THE ALLEGED MATERIAL INJURY
For the most part, the data in the following sections represent virtually 100 percent of stainless steel wire rod production in the United States from January 1989 to September 1992, 29 the period for which the data were collected and presented. The exception is employment, which does not include Armco. Trends in most of the aggregate data are generally downward for 1989-91; from January-September 1991 to January-September 1992, there is evidence of improvement in production, capacity utilization, and employment. Selected data related to the alleged material injury showing period-by-period percentage changes are summarized in appendix D.
U.S. Production, Capacity, Capacity Utilization, .. Shipments , Inventories, and Employment
Data on aggregate U.S. p.roducers' stainless steel wire rod operations, other than employment and financial performance, are shown iri table 2. U.S. producers' plant and equipment are not specific to stainless steel wire rod, although specific equipment's ability to manufacture other products varies from firm to firm. For the most part, however, firms can readily shift production capability to other specialty and carbon steel products. The capacity for stainless steel wire rod production reported by U.S. producers represents an allocation based on the weight of products shipped, normal product mix, or, in the case of Armco, 39 the maximum capacity of its pickling equipment--which is dedicated to stainless steel wire rod. The result is that capacity calculations for the subject product represent little more than an index for annual comparison purposes. The degree to which producers' plant and equipment may actually be underutilized for the production of the subje~t product is uncertain.
As noted previously, most of the stainless steel wire rod U.S. firms produced between 1989 and January-September 1992 (nearly 64 percent) was internally consumed in the manufacture of bar and wire. Most of the remainder
· 29 Inco, which represents *** percent of U.S. production, is not included in the data for employment and financial performance.
30 On January 26, 1993, Armco publically announced that during 1993 its plant in Baltimore will be restructured and downsized as part of a companywide program to "transform itself into a smaller, more profitable" specialty steel producer. The extent to which this will affect its stainless steel wire rod operations is unknown.

I-17
Table 2 Stainless ~teel wire rod: U.S. production, average practical capacity,. capacity utilization, company transfers, domestic shipments, exports, and endof~period inventories, 1989-91, January-September 1991, and January-September 1992
Jan. -Sept. --Item 1989 1990 1991 1991 '1992
Production (short tons) ! 100,937 91,199 89,053 67,137 69,415 Capaci'ty1 (short tons) 259·, 568 256,624 263,534 197,983 197,973 Ratio of production to
capacity (percent) 38.9 35.5 33.8 33.9 35.3 Transfer shipments: 2
Quantity (short tons) 64,674 58,663 62,390 441532 46,021 Value (1,000 dollars) 225,733 :j.73 ,039 191,510 136,998 136,608
Domestic shipments: Quantity (short tons) 39,~84 34,584 34' 87.5 26,679 23,281 Value3 (l,000 dollars) 128,602 97,203 101, 052 78,501 61,796 Unit value (per pound) $1. 64 $1.41 $1.45 $1.47 $L33
Exports: Quantity (short tons) 229 158 60 58 11 Value3 (1,000 dollars) 807 539 185 179 49
Total shipments: Quantity (short tons) 104,187 93,405 97,325 71,269 69,313 Value (1,000 dollars) ~55,142 270,781 292 '747 215,678 198,453
.Inventories (short tons) 15,889 13' 138 10;~65 10,341 9, 773 Ratio of inventories to total
shipments during the period (percent) 15.3 14.l 10.6 10. 94 10. 64
1 The basis on which individual firms calculated capacity ranged from operating plant facilities 60 hours to 144 hours per week, 48 to 50 weeks per year.
2 Internal consumption for the manufacture of bar and wire. 3 Net sales ·value, i.e., gross value less all discounts, allowances,
rebates, and the value of returned goods. 4 Annualized.
Source: Compiled from data submitted in response to questionnaires of the U.S. International Trade Commission.
was shipped domestically on the open market. Exports quantities were insignificant, as shown irt table 2.
Employment data, shown in table 3, differ.from most other data re1ate4 to producers' performance in showing some improvement from January-SeptemQer 1991 to January-September 1992. Like plant ·and·equipment, workers can Feadily be shifted from product to product. The number of workers shown in table 3 ' reflects the proportionate number of ·hours worked by all workers. on stainless steel wire rod.
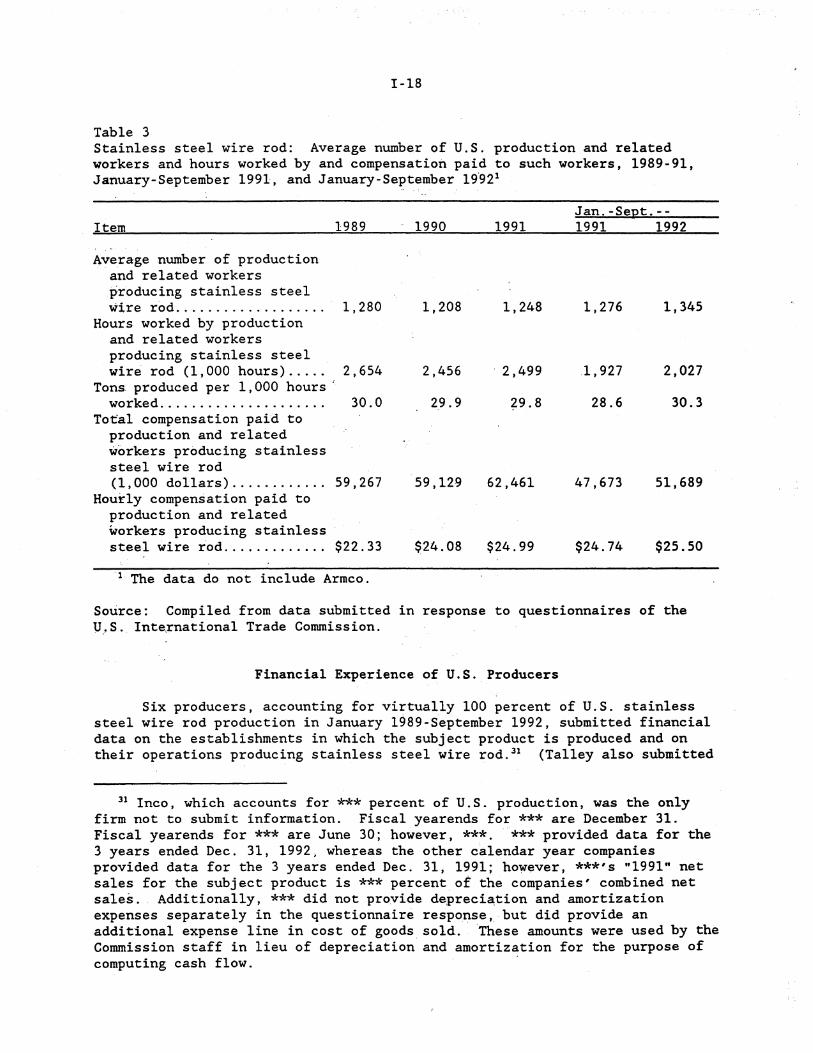
1-18
Table 3 Stainless steel wire rod: Average number of U.S. production and related workers and hours worked by and compensation paid to such workers, 1989-91, January-September 1991, and January-September 19.921
Jan. -Sept. --Item 1989 1990 1991 1991 1992
Average number of production and related workers producing stainless steel wire rod ................... 1,280 1,208 1,248 1,276 1,345
Hours worked by production and related workers producing stainless steel wire rod (1,000 hours) ..... 2,654 2,456 2,499 .1, 927 2,027
Tons produced per 1,000 hours' worked ...................... 30.0 29.9 ?9.8 28.6 30.3
Total compensation paid to production and related workers producing stainless steel wire rod (1,000 dollars) ............ 59,267 59,129 62,461 47,673 51,689
Hourly compensation paid to production and related workeTS producing stainless steel ~ire rod ............. $22.33 $24.08 $24.99 $24.74 $25.50
· 1 The data do not include Armco.
Source: Compiled from data submitted in response to questionnaires of the u .. S. lnte.rnational Trade Commission.
Financial Experience of U.S. Producers
Six producers, accounting for virtually 100 percent of U.S. stainless steel wire rod production in January 1989-September 1992, submitted financial data on the establishments in which the subject product is produced and on their operations producing stainless steel wire rod. 31 (Talley also submitted
31 lnco, which accounts for *** percent of U.S. production, was the only firm not to submit information. Fiscal yearends for *** are December 31. Fiscal yearends for*** are June 30; however, ***· ·***provided data for the 3 years ended Dec. 31, 1992, whereas the other calendar year companies provided data for the 3 years ended Dec. 31, 1991; however, ***'s "1991" net sales for the subject product is *** percent of the companies• combined net sales. Additionally, *** did not pro.vide de,precia,tion and amortization expenses separately in the questionnaire response, but did provide an additional expense line in cost of goods sold. These amounts were used by the Commission staff in lieu of depreciation and amortization for the purpose of computing cash flow.

I-19
income-and-loss data on its toll operations for wire rod, which are presented in appendix E) .
As noted previously, a large portion of U.S.-produced stainless steel wire rod is internally transferred for further processing into wire and bar. The income-and-loss data for stainless steel wire rod are presented with transferred material valued at market value. The purpose is to present the estimated profitability based on the total actual shipments and total actual related costs. This, in effect, is a projection of the profitability of all shipments including transfers. ·
The income-and-loss data based on market sales only are also presented; these data show the profitability from sales exclusive of any revenue or cost from transferred wire rod. These data were also aggregated on a firm by firm basis. The per-unit revenue and costs for each firm are different; and, because the amount of market sales and transferred wire rod is not proportional among the firms, the per-unit profits and profitability ratios differ between (1) all shipments, including transfers and (2) market shipments only.
OVERALL ESTABLISHMENT OPERATIONS
Income-and-loss data on the overall operations of the establishments in which the subject product is produced are shown in table 4. Combined wire rod trade sales were 6.6 percent of combined overall establishment net sales in 1991.
OPERATIONS ON STAINLESS STEEL VIRE ROD
Income-and-loss data for U.S. producers' stainless steel wire rod. operations are shown in table 5. Trade sales decreased in each comparative period while intercompany transfers were more erratic, decreasing from 1989 to 1990 and then increasing from 1990 to 1991. Intercompany transfers increased in interim 1992 compared to interim 1991. Net sales of wire rod decreased 15.5 percent from $299.3 million in 1989 to $252.8 million in 1990, and decreased an additional 1. 3 percent to $249. 6 million in 1991. The companies realized a combined operating income of $24.5 million in 1989 and $316,000 in 1990; however, they incurred an operating loss of $7.8 million in 1991. Operating income (loss) margins were 8.2 percent in 1989, 0.1percent.i~1990, and (3.1) percent in 1991. Net sales of $191.7 million for the 9-month period ended September 30, 1992, were slightly less than the net sales of $192.0 million for the 9-month period ended September 30, 1991. The operating loss was $15. 6 million in the 1992 interim period compared to $6. 2 million in
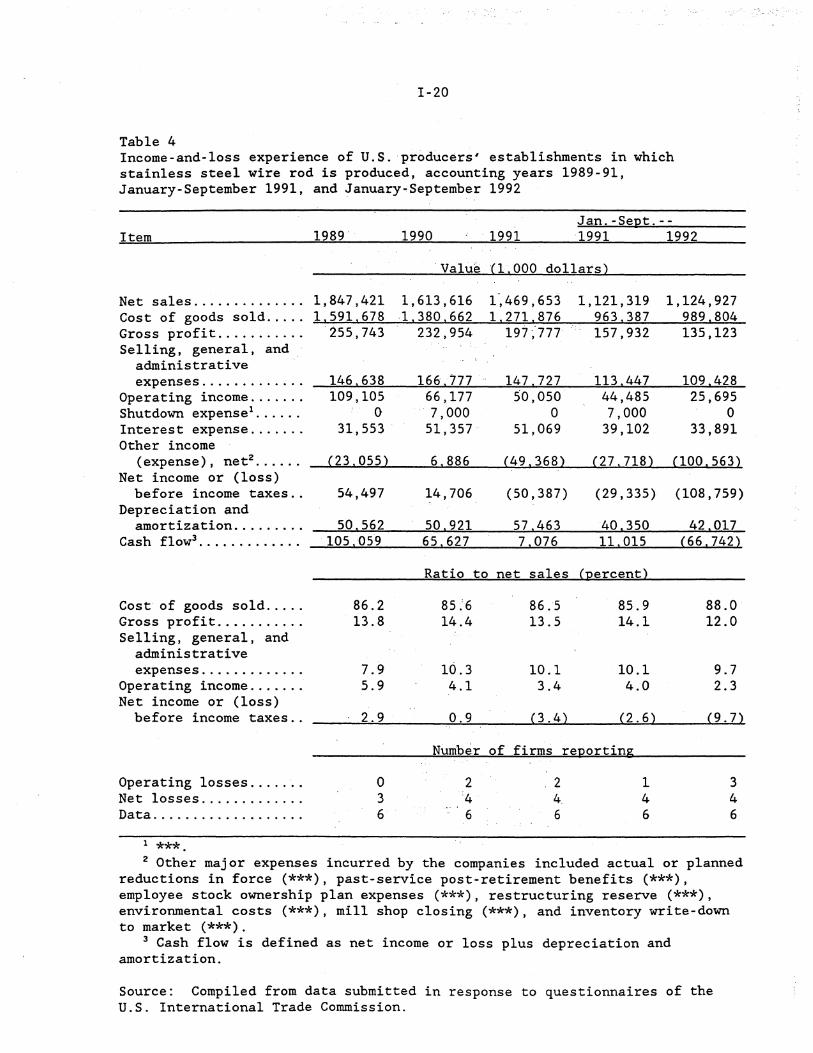
1-20
Table 4 Income-and-loss experience of U.S. producers• establishments in which stainless steel wire rod is produced, accounting years 1989-91, January-September 1991, and January-September 1992
Jan. -Sept. --Item 1989. 1990 . 1991 1991 1992
Net sales ............. . Cost of goods sold .... . Gross profit .......... . Selling, general, and
administrative expenses ............ .
Operating income ...... . Shutdown expense1 ••••••
Interest expense ...... . Other income
(expense), net2 ••••••
Net income or (loss) before income taxes ..
Depreciation and amortization ........ .
Cash flow3 •••••••••••••
Cost of goods sold .... . Gross profit .......... . Selling, general, and
administrative expenses ............ .
Operating income ...... . Net income or (loss)
before income taxes ..
Operating losses ...... . Net losses ............ . Data., ................ .
1 ***
. Value U. 000 dollars)
1,847,421 1,613,616 1.591.678 1.380,662
255,743 232,954
146.638 109,105
0 31,553
(23.055)
54,497
50.562 105.059
166.777 66,177 7,000
51,357
6.886
14,706
50.921 65.627
1~469,653 1,121,319 1.271.876 963.387
197;777 .. 157,932
147. 727 50,050
0 51,069
(49,368)
(50,387)
57.463 7.076
113.447 44,485 7,000
39,102
(27.718)
(29,335)
40.350 11.015
Ratio to net sales (percent)
86.2 13.8
7.9 5.9
2.9
0 3 6 .
85 ~'6 14.4
10.3 4.1
0.9
86.5 13.5
10.1 3.4
(3.4)
85.9 14.1
10.1 4.0
(2.6)
Number of firms reporting
2 :4
6
2 4. 6
1 4 6
1,124,927 989.804 135,123
109.428 25,695
0 33,891
(100. 563)
(108,759)
42.017 (66.742)
88.0 12.0
9.7 2.3
(9.7)
3 4 6
2 Other major expenses incurred by the companies included actual or planned reductions in force (***), past-service post-retirement benefits (***), employee stock ownership plan expenses (***), restructuring reserve (***), environmental costs(***), mill shop closing(***), and inventory write-down to market(***).
3 Cash flow is defined as net income or loss plus depreciation and amortization.
Source: Compiled from data submitted in response to questionnaires of the U.S. International Trade Commission.
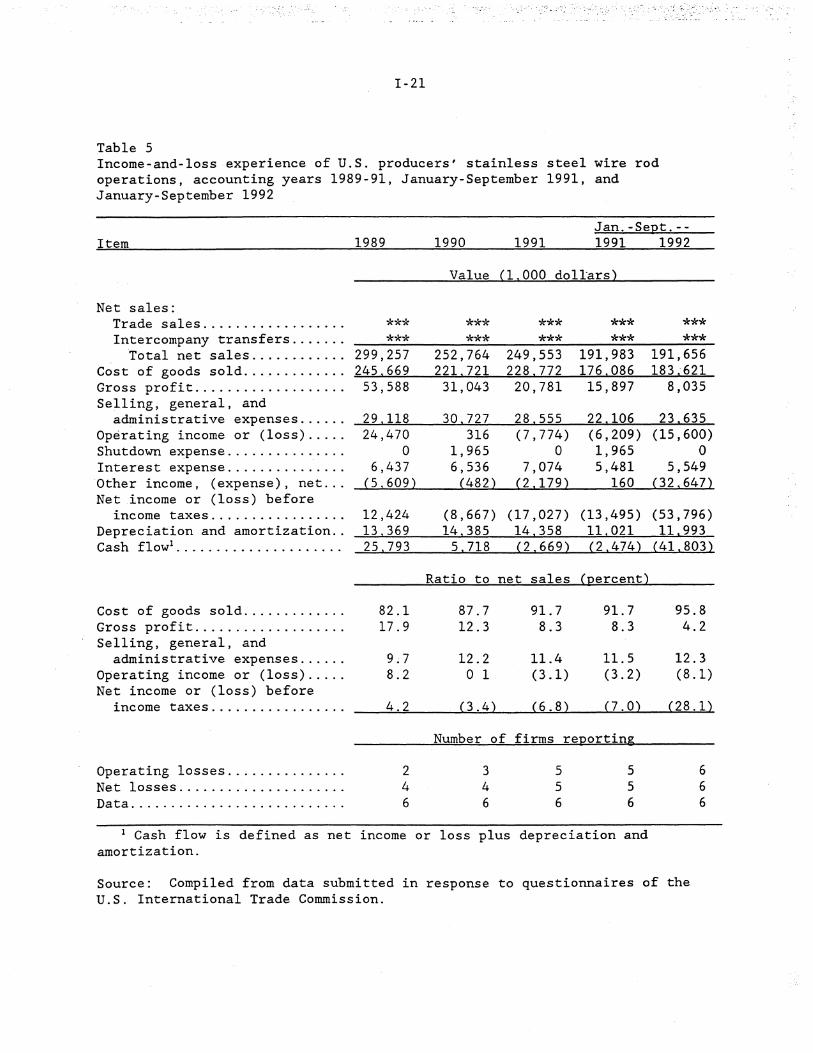
. ·· .. ::.:·· · .... · ... :·., .. ·.: ··._':-. ·:··.-· .. ..
I-21
Table 5 Income-and-loss experience of U.S. producers' stainless steel wire rod operations, accounting years 1989-91, January-September 1991, and January-September 1992
Item 1989
Net sales: Trade sales ................. . ***
1990 1991 Jan. -Sept. --1991 1992
Value Cl. 000 dollars)
*** *** *** *** Intercompany transfers ....... ~~*-*-*~~~~*-*-*~~~-*-*-*~~~-**-*~~~-*-*-*~
Total net sales ............ 299,257 252,764 249,553 191,983 191,656 Cost of goods so 1 d. . . . . . . . . . . . . =2...:..45"'-'-'. 6::..:6:;..::;9_--=2 2=-l=-. ....,7"""2:.::l...._=2=-2 8"'""'-'. 7._,7"""2....__-=l""'-7=6 ..... 0""'8,...,6.__-=1=8=3.._; 6=2=-=l~ Gross profit ................... 53,588 31,043 20,781 15,897 8,035 Selling, general, and
administrative expenses ..... . Operating income or (loss) .... . Shutdown expense .............. . Interest expense .............. . Other income, (expense), net .. . Net income or (loss) before
income taxes ................ . Depreciation and amortization .. Cash flow1 •••••••••••••••••••••
Cost of goods sold ............ . Gross profit .................. . Selling, general, and
administrative expenses ..... . Operating income or (loss) .... . Net income or (loss) before
income taxes ................ .
Operating losses .............. . Net losses .................... . Data .......................... .
29!118 24,470
0 6,437
(5.609)
12,424 13 ! 369 25.793
82.l 17.9
4.2
2 4 6
30 I 727 316
1,965 6,536
(482)
28.555 (7' 774)
0 7,074
(2.179)
22.106 (6,209) 1,965 5,481
160
23.635 (15,600)
0 5,549
(32.647)
(8,667) (17,027) (13,495) (53,796) 14.385 14.358 11.021 11.993
5.718 (2.669) (2.474) (41.803)
Ratio to net sales (percent)
87.7 12.3
12.2 0 1
(3.4)
91. 7 8.3
11.4 (3.1)
(6.8)
91. 7 8.3
11.5 (3.2)
(7.0)
Number of firms reporting
3 4 6
5 5 6
5 5 6
95.8 4.2
12.3 (8.1)
(28.1)
6 6 6
1 Cash flow is defined as net income or loss plus depreciation and amortization.
Source: Compiled from data submitted in response to questionnaires of the U.S. International Trade Commission.
.;···.

I-22
interim 1991. The operating loss margin as a percent of sales was 3.2 percent in interim 1991 and 8.1 percent in interim 1991.
Trade sales, intercompany transfers, total net sales, operating income (loss), and operating income (loss) margins for wire rod are presented in table 6 for each producer separately. *** As indicated previously, Crucible ceased producing stainless steel wire rod in mid-1992.
The income-and-loss experience on an average per-ton basis for stainless steel wire rod is presented in table 7. The sales value decreased 9.8 percent from $3,243 in 1989 to $2,924 in 1990, and increased 1.9 percent t9 $2,981 in 1991. The cost of goods sold decreased by $97 per ton in 1990 compared to 1989, but the average sales price decreased by $319 per ton, which contributed to a reduction of the operating income margin from 8.2 percent in 1989 to 0.1 percent in 1990. The average sales price increased $57 per ton in 1991 compared to 1990; however, the cost of goods sold for the decreasing quantity increased $168 per ton, contributing to a further decline in the operating income to a loss of 3.1 percent in 1991. The operating income (loss) per ton was $265 in 1989, $4 in 1990, and ($93) in 1991. The sales value decreased 5.2 percent from $3,012 in interim 1991 to $2,855 in interim 1992. The companies' average cost of goods sold decreased by $26 per ton from interim 1991 to interim 1992, but the average sales price fell by $157 per ton, contributing to a sharp increase in the operating loss margin from 3.2 percent in interim 1991 to 8.1 percent in interim 1992. The operating loss was $97 per ton in interim 1991 and $232 per ton in interim 1992. Because stainless steel wire rod is sold in a variety of grades, shifts in the product mix may have an effect on any per-ton analysis.
Income-and-loss data for U.S. producers' trade sales only are shown in table 8. The data show a downward trend in each comparative period for wire rod sales and an operating income (loss) margin that fell from *** percent in 1989 to*** percent in interim 1992. Net sales, operating income (loss), and operating income (loss) margins for wire rod trade sales only are presented in table 8a for each producer separately. The operating income (loss) has the same downward trend for trade sales only as for total net sales including company transfers. However, the operating income is less and the operating loss greater for trade sales only when compared to total net sales, because of the mix of trade and company transfers for *** and the greater effect of ***'s data on trade sales only.
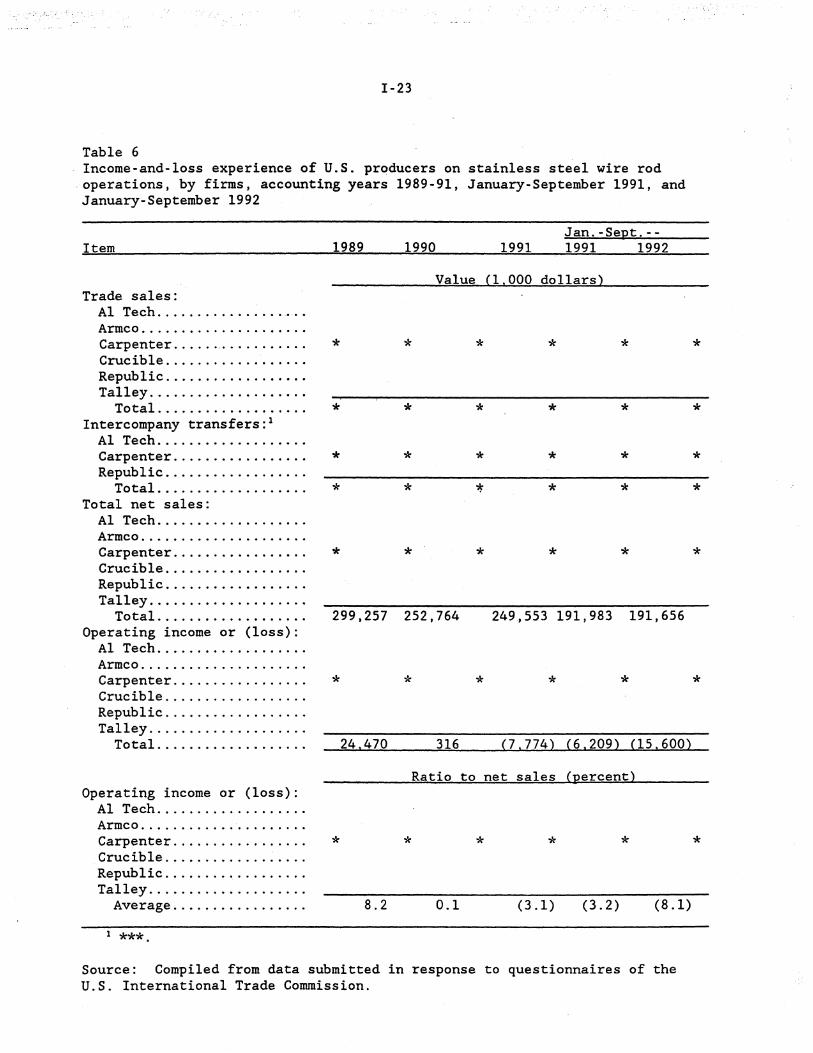
I-23
Table 6 Income-and-loss experience of U.S. producers on stainless steel wire rod operations, by firms, accounting years 1989-91, January-September 1991, and January-September 1992
Jan.-Sept.--Item 1989 1990 1991 1991 1992
Value (1.000 dollars) Trade sales:
Al Tech .................. . Armco .................... . Carpenter ................ . * * * * * Crucible ................. . Republic ................. . Talley ................... .
Total .................. . * * * * * Intercompany transfers: 1
Al Tech .................. . Carpenter ................ . * * * * * Republic ................. .
Total .................. . * * * * Total net sales:
Al Tech .................. . Armco .................... .
*
*
*
*
Carpenter ................ . * * * * * * Crucible ................. . Republic ................. . Talley ................... .
Total .................. . 299,257 252,764 249,553 191,983 191,656 Operating income or (loss):
Al Tech .................. . Armco .................... . Carpenter ................ . * * * * * Crucible ................. . Republic ................. . Talley ................... .
Total .................. . 24,470 316 (7.774) (6,209) (15.600)
Ratio to net sales (percent) Operating income or (loss):
Al Tech .................. . Armco .................... . Carpenter ................ . * * * * * Crucible ................. . Republic ................. . Talley ................... .
Average ................ . 8.2 0.1 (3.1) (3.2) (8.1)
l ***
Source: Compiled from data submitted in response to questionnaires of the U.S. International Trade Commission.
*
*
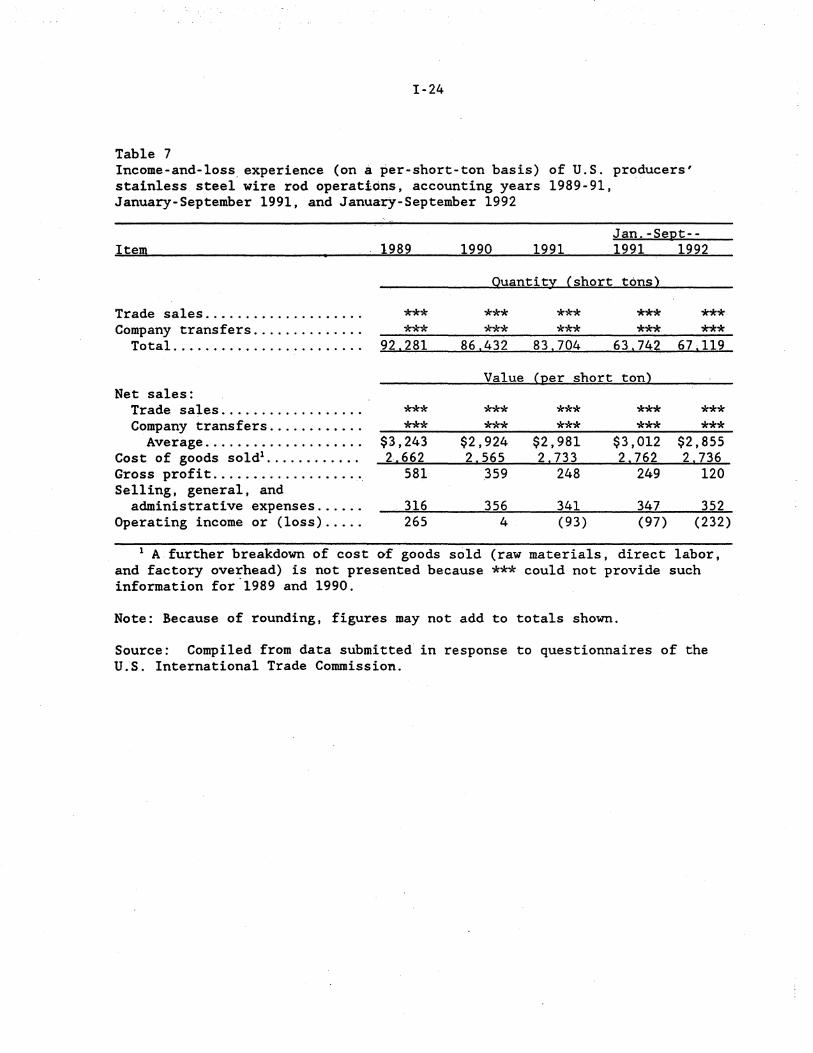
I-24
Table 7 Income-and-loss. experience (on a per-short-ton basis) of U.S. producers' stainless steel wire rod operations, accounting years 1989-91, January-September 1991, and January-September 1992
Jan. -Sept- -Item 1989 1990 1991 1991 1992
Quantity (short tons)
Trade sales.................... *** *** *** *** *** Company transfers .............. ----*-*-*--------*-*-*-------*-*-*--------*-*~*------*-*-*-
Total ........................ ~9~2~.2~8=1.__--'8~6~·~4~3=2~~8=3~·~7~04 __ ~~6=3~.7~4~2.___6~7~.1=1~9-
Net sales: Trade sales ................. . Company transfers ........... .
Average ................... . Cost of goods sold1 ••••••••••••
Gross profit .......... ········~ Selling, general, and
administrative expenses ..... . Operating income or (loss) .... .
*** ***
$3,243 2.662
581
316 265
Value (per short ton)
*** ***
$2,924 2.565
359
356 4
*** ***
$2,981 2.733
248
341 (93)
*** ***
$3,012 2.762
249
347 (97)
*** ***
$2,855 2.736
120
352 (232)
1 A further breakdown of cost of goods sold (raw materials, direct labor, and factory overhead) is not presented because *** could not provide such information for.1989 and 1990.
Note: Because of rounding, figures may not add to totals shown.
Source: Compiled from data submitted in response to questionnaires of the U.S. International Trade Commission.

I-25
Table 8 Income-and-loss experience of U.S. producers' stainless steel wire rod operations, adjusted to trade only, 1 accounting years 1989-91, January-September 1991, and January-September 1992
Item
Trade sales ................... . Cost of goods sold ............ . Gross profit .................. . Selling, general, and
administrative expenses ..... . Operating income or (loss) .... .
Cost of goods sold ............ . Gross profit .................. . Selling, general, and
administrative expenses ..... . Operating income or (loss) .... .
Operating losses .............. . Data .......................... .
1989
*
*
2 6
*
1990 1991 Jan. -Sept. --1991 1992
Value (l,000 dollars)
* * * *
Ratio to net sales (percent)
* * * *
Number of firms reporting
3 6
5 6
5 6
*
6 6
*
*
1 Trade sales shown are as reported in the questionnaire responses. Cost of goods sold and selling, general, and administrative expenses were computed using the same average unit values for costs of trade sales and company transfers.
Source: Compiled from data submitted in response to questionnaires of the U.S. International Trade Commission.

I-26
Table Ba Income-and-loss experience of U.S. producers' stainless steel wire rod operations, adjusted to trade sales only, by firms, accounting years 1989-91, January-September 1991, and January-Septemper 1992
Jan. -Sept. - -Item 1989 1990 1991 1991 1992
Value Cl.000 dollars) Trade sales:
Al Tech .................. . Armcc;:; .................... . Carpenter ................ . Crucible ................. . Republic ................. . Talley ................... .
Total .................. .
* * * * * * Operating income:
Al Tech .................. . Armco .................... . Carpenter ................ . Crucible ................. . Republic ................. . Talley ................... .
Total .................. .
Share of net sales (percent) Operating income:
Al Tech .................. . Armco .................... . Carpenter ................ . Crucible ................. . * * * * * * Republic ................. . Talley ................... .
Average ................ .
Source: Compiled from data submitted in response to questionnaires of the U.S. International Trade Commission.
UNUSUAL AND NONRECURRING EXPENSES
*
*
Many of the companies incurred extensive unusual or nonrecurring expenses during the period for which data were gathered. Such major expenses incurred by the companies included actual or planned reductions in force (***),past-service post-retirement benefits (***), employee stock ownership plan expenses (***), restructuring reserve (***), environmental costs (***), mill shop closing(***), and inventory write-down to market (***). The companies classified many of these items (in their questionnaire responses) as "other expense," thereby not affecting operating income. The Commission staff reclassified other items as stated in the following paragraphs.
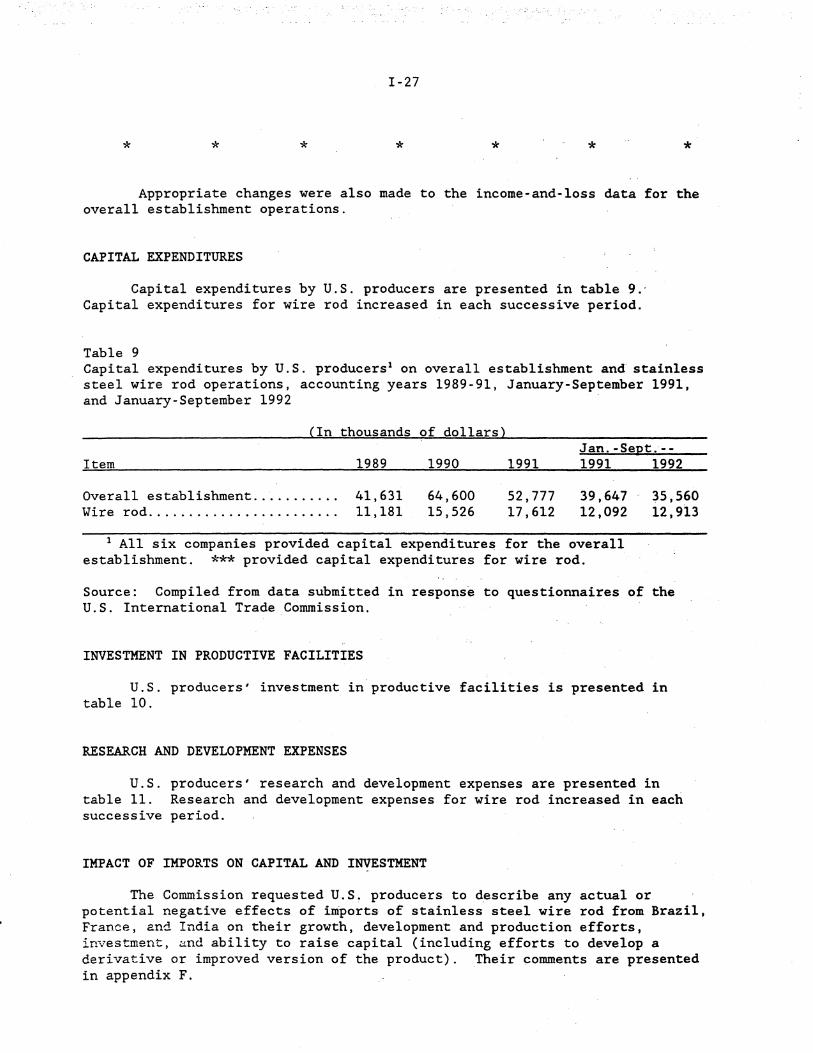
I-27
* * * * * * *
Appropriate changes were also made to the income-and-loss data for the overall establishment operations.
CAPITAL EXPENDITURES
Capital expenditures by U.S. producers are presented in table 9.· Capital expenditures for wire rod increased in each successive period.
Table 9 Capital expenditures by U.S. producers 1 on overall establishment and stainless steel wire rod operations, accounting years 1989-91, January-September 1991, and January-September 1992
(In thousands of dollars} Jan. -SeEt. - -
Item 1989 1990 1991 1991
Overall establishment ........... 41,631 64,600 52,777 39,647 Wire rod ........................ 11,181 15,526 17,612 12,092
1 All six companies provided capital expenditures for the overall establishment. *** provided capital expenditures for wire rod.
1992
35,560 12,913
Source: Compiled from data submitted in response to questionnaires of the U.S. International Trade Commission.
INVESTMENT IN PRODUCTIVE FACILITIES
U.S. producers' investment in productive facilities is presented in table 10.
RESEARCH AND DEVELOPMENT EXPENSES
U.S. producers' research and development expenses are presented in table 11. Research and development expenses for wire rod increased in each successive period.
IMPACT OF IMPORTS ON CAPITAL AND INVESTMENT
The Commission requested U.S, producers to describe any actual or potential negative effects of imports of stainless steel wire rod from Brazil, France, end India on their growth, development and production efforts, investment, und ability to raise capital (including efforts to develop a derivative or improved version of the product). Their comments are presented in appendix F.

I-28
Table 10 Value of assets 1 of U.S. producers on overall establishment and stainless steel wire rod operations, accounting years 1989-91
As of the fiscal year end--Item 1989 1990 1991
Value (l,000 dollars) Overall establishment:
Fixed assets: Original cost .......... . Book value ............. .
Total assets2 ••••••••.••••
Wire rod: Fixed assets:
Original cqst .......... . Book value ............. .
Total assets2 •••••••••••••
1,195,942 657,736
1,169,530
336,033 211, 915 370 861
1,241,245 663,444
1,175,185
341,476 208,194 376 184
1,286,503 662,909
1,096,989
356,669 210,594 370 072
Return on total assets.(percent) 3
Operating income: 4
Overall establishment .... . Wire rod .................. .
Net income: 5
Overall establishment .... . Wire rod ................. .
9.1 6.5
6.5 4. 7
5.9 (0.2)
1. 7 (2.6)
4.9 (2.2)
(4.1) (4.7)
1 *** did not provide total assets. *** did not provide the original cost book value of fixed a.$sets for wire rod.
2 Defined as book value of fixed assets plus current and noricurrent assets. Total establishment assets are apportioned, by firm, to product groups on the basis of the ratios of the respective book values of fixed assets.
3 Computed using data from only those firms supplying both asset and incomeand- loss information, and as such, may not be derivable from data presented.
4 Defined as operating income or loss divided by asset value. 5 Defined as net.income or loss divided by'asset'value.
Source: Compiled from data submitted in response to questionnaires of the U.S. International Trade Commission.
Table ll Research and development expenses of U.S. producers 1 on overall establishment and stainless steel wire rod operations, accounting years 1989-91, January-September 1991, and January-September 1992
(In thousands of dollars} Jan. -Sept. --
Item 1989 1990 1991 1991 1992
Overall establishment ........... 12,578 17,226 21,583 13 '792 16.214 Wire rod ........................ 4,254 4, 621 4,944 3,490 J. I 3/1
1 *** did not provide research and development expenses for wire rod.
Source: Compiled from data submitted in response to questionnaires of the U.S. International Trade Commission.

I-29
CONSIDERATION OF THE ALLEGED THREAT OF MATERIAL INJURY
Section 771(7)(F) (i) of the Tariff Act of 1930 (19 U.S. C. 1677(7)(F)(i)) provides that--
In determining whether an industry in the United States is threatened with material injury by reason of imports (or sales for importation) of the mer,chandise, the Commission shall consider, among other relevant economic factors 32 - -
(I) If a subsidy is involved, such information as may be presented to it by the administering authority as to the nature of the subsidy (particularly as to whether the subsidy is an export subsidy inconsistent with the Agreement),
(II) any increase in production capacity or existing unused capacity in the exporting country likely to result in a significant increase in imports of the merchandise to the United States,
(III) any rapid increase in.United States market penetration and the likelihood that the penetration will increase to an injurious level,
(IV) the probability that imports of the merchandise will enter the United States at prices that, will have-a depressing or suppressing effect on domestic prices of the merchandise,
(V) any substantial increase in inventories of the merchandise in the United States,
(VI) the presence of underutilized capacity for producing the merchandise in the exporting country,
(VII) any other demonstrable adverse trends that indicate the probability that the importation (or sale for importation) of the merchandise (whether or not it is actually being imported at the time) will be the cause of actual injury,
(VIII) the potential for product-shifting if production facilities owned or controlled by the foreign manufacturers, which can be used to produce products subject to investigation(s) under section 701 or 731 or to final orders under section 706 or 736, are also used to produce the merchandise under investigation,
32 Section 771(7)(F)(ii) of the Act (19 U.S.C. 1677(7)(F)(ii)) provides that "Any determination by the Commission under this title that an industry in the United States is threatened with material injury shall be made on the basis of evidence that the threat of material injury is real and that actual injury is imminent. Such a determination may not be made on the basis of mere conjecture or supposition. 1·1

I-30
(IX) in any investigation under this title which involves imports of both a raw agricultural-product (within the meaning of paragraph (4)(E)(iv)) and any product processed from such raw agricultural product, the likelihood that there will be increased imports, by reason of product shifting, if there is an affirmative d·etermination by the Commission under section 705(b)(l) or 735(b)(i) with respect to either the raw.agricultural product or the processed agricultural pro~uct (but not both), and
(X) the actual and potential I\egative effects on the existi~g development and production effQrts o·f the domestic industry, including efforts to develop a derivative or more advanced version of the like product. 33
Available information on the volume, U.S. market penetration, and pricing of imports. of the subject merchandise' (items (III) _and (IV) above) is presented in the section entitled uconsideration· of the Causal Relationship Between the Alleged LTFV Imports and the Alleged Material Injury;" and. information on the effects of imports of the subject merchandise on U.S. producers' existing development and production efforts (item (X)) is presented in appendix F. Availabl.e information on U.S. inventories of the subject product (item (V)); foreign producers' oper~tiOm~, including the poten~ial for "product-shifting" (items (II), . (Vl), and '(VIII) above); and any other threat indicators, if applicable (item (VII) above), is discussed below. ·
End-of-period inventories of stainless steel wire rod imported from Brazil, France, and India are shown in the following tabulation (in short tons). (The data were obtained from firms accounting for virtually all imports from Brazil and Fra~ce and about half those from India).
* * * * "* * *
The data show a noticeable decline in inventories from 1989 to 1990 and a noticeable increase thereafter, reflecting a general increase in impor.ts from the subject countries. As stated previously, . since January 1990, about *** percent of the imports from Brazil and about *** those from France were either transferred to or imported directly by Techalloy for consumption and would, therefore, not be.held in inventory.
Production, capacity, and shipments of Acos Finos (Brazil), Imphy/UgineSavoie (France), and Mukand (India) are shown in tables 12, 13, and 14, respectively. The cumulated capacity reported for these firms is about 60
33 Section 771(7)(F)(iii) of the Act (19 U.S.C. 1677(7)(F)(iii)) further provides that, in antidumping investigations, " ... the Commission shall. consider wheth_er dumping_ in the· markets of foreign 'c·ountrf.es (SrS eviden~ed by dumping findings or antidumping re~edies in other GATT'member marke~s against the same class or kind of merchandise manufactured or exported by the same . · party as under investigation) suggests a threat of material injury to the domestic industry."

I-31
percent of that reported by U.S. producers. Like domestic capacity, it is not exclusive to the subject product and represents a proportion of total plant capacity made available for the production of stainless steel wire rod. During the period for which the data were collected, the utilizatfon of this capacity varied from firm to firm. However, exports constituted an increasing, if not substantial, share of total shipments; and exports to the United States constituted an increasing share of total exports--particularly in January-September 1992. None of the firms .:reported any plans to increase capacity, nor are there any known extant antidumping or countervailing duty orders on their products in other countries. ·
Table 12 Stainless steel wire rod: Acos Finos' (Brazil) production, capacity, and shipments, 1989-91, January-September 1991, and January-September 1992
Item
Production (short tons) ....... . Capacity1 (short tons) ........ . Capacity utilization
(percent) ................... . Shipments:
Home market (short tons) ..... Exports to--
United States (short tons). All others (short tons) ....
Total exports (short tons) .......... .
Total shipments (short tons) .......... .
Ratio of exports to total shipments (percent) ......... .
Share of total exports exported to the United States (percent) ............ .
Jan. -Sept. --1989 1990 199'1 1991 1992
* * '*- * * *·
1 The capacity reported is based on operating 168 hours per week, 52 weeks per year.
Source: Compiled from data submitted in response to questionnaires of the U.S. International Trade Commission.
*
I-32
Table 13 Stainless steel wire rod: Imphy's and Ugine-Savoie's (France) production, capacity, and shipments, 1989-91, January-September 1991, and JanuarySeptember 1992
Item '
Production (short tons) ...... ~. Capacity1 (short tons}, ....... . Capacity utilization
(percent) ...........•........ Shipments: .
Home market (short tons) ..... Exports to--
United States (short tons). All others (short tons)~ ...
Total exports (short tons) ..•........
Total shipments (short tons); ......... .
Ratio of exports to total shipments (percent) •..... · ....
Share of total exportj!I exported to the United States (percent) .. , • , ....... .
Jan. -Sept. --1989 1990 1991 1991 1992
* * * * * *
1 The capacity reported is based on operating 144 hours per week, 46 weeks per year.
Source: Compiled fro~ ~ta submitted in response to questionnaires of the U.S. International Trade Commission.
*

1-33
Table 14 Stainless steel wire rod: Mukand's (India) production, capacity, and shipments, 1989-91, January-September 1991, and January-September 1992
Item
Production (short tons) ....... . Capacity1 (short tons) •........ Capacity utilization
(percent) ................... . Shipments:
Home market (short tons) ..... Exports to--
United States (short tons). All others (short tons) ....
Total exports (short tons) .......... .
Total shipments (short tons) .......... .
Ratio of exports to total shipments (percent) ......... .
Share of total exports exported to the United States (percent) ............ .
jan. -Sept. --1989 1990 1991 1991 1992
* * * * * *
1 The capacity reported is based on operating 144 hours per week, 52 weeks per year.
Source: Compiled from data submitted in respons~ to questionnaires of the U.S. International Trade Commission.
*

I-34
CONSIDERA'rION OF THE CAUSAL RELATIONSHIP BETWEEN THE ALLEGED LTFV · IMPORTS AND. THE ·.ALLEGED MATERIAL. INJURY
Imports
Brazil, France, and India ·account for a large and increasing share of foreign-supplied stainless steel wire rod in the United States (table 15). About 44 percent of the total tonnage of imports in January-September 1992 was supplied by these countries- -up from about 25 percent in January-:.September 1991. Like imports from most sources, total imports from Brazil, France;· an(l India increased more modestly from 1989 to 1991. From January-September 1991 to January-September 1992, however, the total tonnage shipped from these countries to the United State~ nearly tripled. As.total tonnage increased, the average unit value of stainless steel wire rod from these countries declined--falling from $1.83 per pound in 1989 to $1.17 per pound' in .1anuarySeptember 1992. (The relatively higher unit values shown for France reflect the French product's higher proportion of non-commodity grades). The decline
.reflects a general deterioration of price levels throughout the period for which the data were collected. ·
U.S. Consumption and Market Penetration
. . Apparent U.S. consumption of stainless steel wire rod declined from 1989
to 1990, but then ii:creased, albeit modestly, from 1990 to 1991 and again fro~ January-September 1991 to January-September ,1992 (table 16). Imports' share of consumption, at least from the countries under investigation, remained modest until January-September 1992, when it jumped noticeably, as shown in table 16, from the corresponding period of the previous year. During the same time, the U.S. producers' share fell by nearly 10 percentage points (in terms of quantity).
Open-market consumption trended similarly, although at considerqbly lower levels (table 17). While the ratio of imports from Brazil, France, and India to open-market consumption more than doubled from January-September 1991 to January-September 1992, the U.S. producers' share fell from about *** to ***percent. The fall in France's share of open-market shipments in 1990 is due to Imphy's and Ugine-Savoie's purchase of Techalloy, which effectively removed it as an open-market (independent) redrawer of these firms' stainless steel wire rod. Shipments of rod from Imphy and Ugine-Savoie to Techalloy are "transferred" as they would be to any other wire-producing subsidiary.
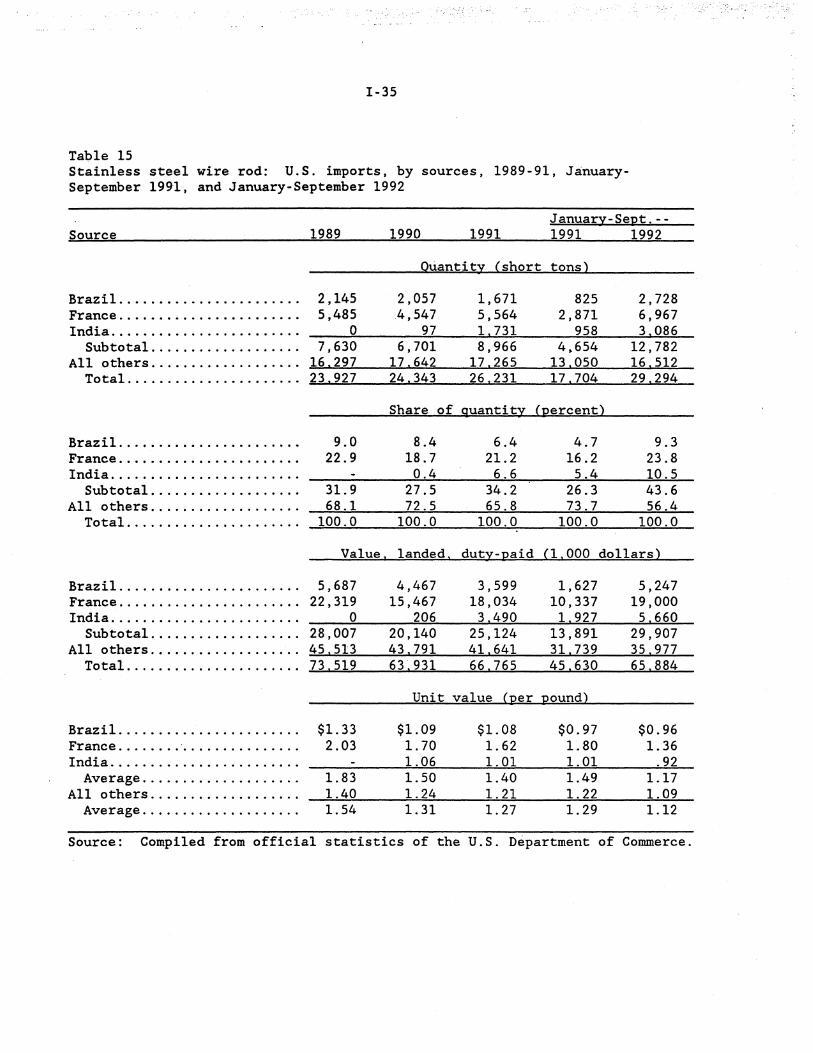
'· · .. :.· .·.·
I-35
Table 15 Stainless steel wire rod: U.S. imports, by sources, 1989-91, JanuarySeptember 1991, and January-September 1992
January-Sept. --Source 1989 1990 1991 1991 1992
Quantity (short tons)
Brazil ....................... 2,145 2,057 1,671 825 2, 728 France ....................... 5,485 4,547 5,564 2,871 6,967 India ........................ 0 97 1 731 958 3 086
Subtotal ................... 7,630 6,701 8,966 4.654 12,782 All others ................... 16.297 17.642 17.265 13.050 16.512
Total ...................... 23.927 24.343 26.231 17.704 29.294
Share of guantity (percent)
Brazil ...•..................• 9.0 8.4 6.4 4.7 9.3 France ....................... 22.9 18.7 21.2 16.2 23.8 India ..........•............. 0.4 6.6 5.4 10.5
Subtotal ................... 31.9 27.5 34.2 26.3 43.6 All others ................... 68.l 72.5 65.8 73.7 56.4
Total ...................... 100.0 100.0 100.0 100.0 100.0
Value. landed. duty-paid (1I000 dollars)
Brazil ....................... 5,687 4,467 3,599 1,627 5,247 France ....................... 22,319 15,467 18,034 10,337 19,000 India ........................ 0 206 3 490 1 927 5 660
Subtotal ................... 28,007 20,140 25,124 13,891 29,907 All others ................... 45.513 43.791 41.641 31. 739 35.977
Total ...................... 73.519 63.931 66.765 45.630 65.884
Unit value (per pound)
Brazil ....................... $1.33 $1.09 $1.08 $0.97 $0.96 France ........ · ............... 2.03 1. 70 1. 62 1.80 1.36 India ........................ 1.06 1.01 1.01 .92
Average .................... 1.83 1.50 1.40 1.49 1.17 All others ................... 1.40 1.24 1.21 1.22 1.09
Average .................... 1.54 1.31 1.27 1.29 1.12
Source: Compiled from official statistics of the U.S. Department of Commerce.

I-36
Table 16 Stainless steel wire rod: Apparent U.S. consumption and ratio of imports to consumption, 1989-91, January-September 1991, and January-September 1992
(Quantity in short tons: value in 1.000 dollars) Ratio (percent) of imports to consumption
Apparent For all U.S. con- For For For other
Period sumption1 Brazil France India Subtotal countries Total
1989 ........ 127,885 1990~ ....... 117,590 1991. . . . . . . . 123 '496 Jan.-Sept.--
1991. .... . 1992 ..... .
88,915 98 596
1989 ........ 427,854 ).990 ........ 334, 173 1991 ........ 359,327 Jan. -Sept. - -
1991. . . . . . 261, 129 1992.; .... 264,288
1. 7 1. 7 1.4
.9 2.8
1.3 1.3 1.0
.6 2.0
4.3 3.9 4.5
3.2 7.1
5.2 4.6 5.0
4.0 7.2
Quantity
0 0.1 1.4
1.1 3.1
Value
0 0.1 1.0
.7 2.1
6.0 5.7 7.3
5.2 13.0
6.5 6.0 7 .. 0
5.3 11.3
12.7 15.0 14.0
14.7 16.7
10.6 13.1 11.6
12.2 13.6
1 Transfer shipments and domestic shipments pl_us imports.
18.7 20.7 21.2
19.9 29.7
17.2 19.l 18.6
17.5 24.9
Source: Compiled from data submitted in response to questionnaires of the U.S. International Trade Commission and from official statistics of the U.S. Department of Commerce.

I-37
Table 17 Stainless steel wire rod: Apparent U.S. open-market consumption and ratio of imports to open-market consumption, 1989-91, January-September 1991, and January-September 1992
(Quantity in short tons: value in 1.000 dollars) Apparent Ratio (percent) of imports to open-market consumption open mar- For all ket con- For For For other
Period sumption1 Brazil France2 India Subtotal countries Total
Quantity
1989 ........ 1990 ........ 1991. ....... * * * * * * * Jan. -Sept. - -
1991. ..... 1992 ......
Value
1989 ........ 1990 ........ 1991. ....... * * * * * * * Jan. -Sept. - -
1991 ...... 1992 ......
1 U.S. producers' domestic shipments and imports less Imphy/Ugine-Savoie's transfers to their subsidiary, Techalloy. Techalloy's transfers - ***·
2 Ratio of imports (less Imphy's and Ugine-Savoie's transfers to their subsidiary, Techalloy) to open-market consumption.
Source: Compiled from data submitted in response to questionnaires of the U.S. International Trade Commission and from official statistics of the U.S. Department of Commerce.

I-38
Prices
MARKET CHARACTERISTICS
The market for stainless steel wire rod includes the U.S. producers and importers which sell product to redrawers, end-use manufacturers, and in some instances stainless steel bar manufacturers. 34 Demand for wire rod depends mainly on the level of demand in end-use industries (such as automotive, medical, marine, and general manufacturing) that utilize the corrosiveresistent properties of stainless steel wire rod. The majority of domestic producers and importers indicated decreasing demand, due in part to the U.S. recession, for their wire rod products during the period for which data were collected in these investigations.
Six domestic producers and five importers provided information relevant to their selling practices for wire rod in the U.S. market. Domestic manufacturers primarily quote prices on an f .o.b. factory or f.o.b. warehouse basis. 35 Importers reported quoting f.o.b. warehouse prices or delivered prices to their customers. U.S. producers and importers generally agree that transportation costs are not an important factor in their customers' sourcing decisions for wire rod. According to questionnaire responses, transportation cost as a percentage of total delivered cost for the subject product range from less than 1 to 4 percent.
Three of six domestic producers returning Commission questionnaires reported publishing price lists for their customers. However, these price lists are reportedly rarely adhered to and generally serve only as a basis for establishing competitive prices. *** No importers reported publishing price lists, although one indicated that it attempts to sell at U.S. manufacturers' price levels. Other importers base their quotes on current market prices and profit goals.
Lead times for delivery by U.S. producers are 6 to 16 weeks from the customer's date of order. For importers, lead times are as short as 1 to 3 days if the product is available in U.S. inventories, but considerably longer, averaging between 2 and 5 months, if the products must be ordered from overseas.
In their questionnaire responses, all six U.S. producers responding to questions about quality reported that quality differences were not a significant factor in competition between domestic and imported wire rod from Brazil and France, but one reported quality differences were a factor in competition between domestic and Indian product. *** reported that the poor quality of Indian wire rod limits its range of uses to only the least demanding applications. Both importers reponding to this question reported quality differences between U.S. and Brazilian wire rod. The reportedly inferior surface quality and smaller coil size of Brazilian wire rod are disadvantages vis-a-vis the domestic product. Conversely, one of the two
34 See "U.S. Market and Channels of Distribution" section of this report. 35 *** ship their products either delivered or f.o.b. plant, depending upon
customer requests.

I-39
responding importers indicated quality differences between U.S. and French wire rod were an advantage for the imported product. *** reported that cold heading wire rod from France is generally regarded as superior to domestic product for *** Three importers responding to the question reported quality differences between the U.S. and Indian product. All three firms reported that Indian wire rod is not suitable for redrawing below 0.125 inch. *** reported that, due to poor quality, the Indian product is only used in lowend applications such as tire and lashing wire.
QUESTIONAIRE PRICE DATA
The Commission requested U.S. producers and importers to report net U.S. f.o.b. selling prices for sales of stainless steel wire rod to unrelated U.S. customers, as well as the total quantity shipped and the total net f.o.b. value shipped in each quarter to all unrelated U.S. customers. The price data were requested for the largest single sale and for total sales of the products specified, by quarters, from January 1989 through September 1992. Importers were also requested to report separately for each of these products imported from Brazil, France, and India. The products for which pricing data were requested are as follows:
Product 1: Grade AISI 302 wire rod, 5.5 mm (0.217 inch), hot-rolled, annealed and pickled
Product 2: Grade AISI 304 wire rod, 5.5 mm (0.217 inch), hot-rolled, annealed and pickled
Product 3: Grade AISI 316 wire rod, 5.5 mm (0.217 inch), hot-rolled, annealed and pickled
Product 4: Grade AISI 304 wire rod, 6.35 mm (0.25 inch), hot-rolled, annealed and pickled
Five domestic producers and four importers provided pricing data for sales of the requested products in the U.S. market, although not necessarily for all products or all quarters over the period examined (tables 18-21). 36
In general, U.S. producers' weighted-average prices for all products showed increasing trends during 1989, then declining trends through the remainder of the period. 37 Importers' reported prices for the specified Brazilian and
36 Crucible Specialty Metals reportedly did not produce any of the specified wire rod products during January 1989-September 1992.
37 Petitioners acknowledged at the conference the usage of surcharges during 1989 and the early part of 1990 for their stainless steel wire rod products to offset rising nickel prices. These surcharges were excluded from the U.S. producers' questionnaire pricing responses. However, increases in the U.S. producers' weighted-average prices for the specified products during the early part of the period examined may in part be due to rising raw material costs prior to and during 1989.

I-40
Table 18 Product 1: 1 Weighted-average net f.o.b. prices for sales reported by U.S. producers and importers and margins of under/(over)selling, by quarters, January 1989-September 1992
U.S. :eroduct Brazilian :eroduct F.o.b. F.o.b.
Period ;er ice Quantity ;erice• Quantity Per.;eound -~ Per ;eound ~
1989: January-March ••....•...•....•.. *** *** (3) (3) April -June •••.....•••.••....••. *** *** (3) (3) July-September •.•••••.•......•. *** *** (3) (3) October-December ...•..•......•. *** *** (3) (3)
1990: January-March .•......•......... *** *** (3) (3) April-June •...••...•..•....•... *** *** (3) (3) July-September ..•.•.•.....••... *** *** (3) (3) October-December ..•.••....••... *** *** (3) (3)
1991: January-March •.••.••.•..•..•••• *** *** (3) (3) April-June •..••••.•.•......•... *** *** (3) (3) July-September ..•..•.•...•....• *** *** (3) (3) October-December ••..•.•..•..••. *** *** (3) (3)
1992: January-March ..•••.•........••• *** *** (3) (3) April-June ••..•••..•.••........ *** *** (3) (3) July-September .•...••..•...•.•. *** *** (3) (3)
French :eroduct Indian :eroduct F.o.b. F.o.b. ;erice5 Quantity Margin price6 Quantity Per :eound ~ Per :eound Percent ~
1989: January-March .••..•.••..•...•.. (3) (3) (4) (3) (3) April-June ....•.....•.•....•.•. (3) (3) (4) (3) (3) July-September ..•...•.......... (3) (3) (4) (3) (3) October-December ...•.........•• *** *** (3.9) (3) (3)
1990: January-March •.....••.•....•... *** *** 0.8 (3) (3) April-June .••.....•••.......... *** *** (11.9) (3) (3) July-September ..•...•.•••...•.• *** *** (0.5) (3) (3) October-December ...••.......... (3) (3) (4) (3) (3)
1991: January-March ••••.........••.•. (3) (3) (4) (3) (3) April-June .•••.••...•........•. (3) (3} (4) (3) (3) July-September .....•.....•..... *** *** (5.3) (3) (3) October-December .•.••........•. *** *** 0.0 (3) (3)
1992: January-March .•......•.•.••.... *** *** 3.8 (3) (3) April-June ...••••.•.•.•••....•• *** ***" Cl. 9) *** *** July-September •••...•.•.•.•.... *** *** (8.3) *** ***
l Grade AISI 302 wire rod, 5.5 am (0.217 inch), hot-rolled, annealed and pickled. 2 No importers reported prices for sales of Brazilian product l during the period examined. 3 Data not reported. 4 Margins not calculated. 5 *** 6 ***·
Margin ~
(4) (4) (4) (4)
(4) (4) (4) (4)
(4) (4) (4) (4)
(4) (4) (4)
Mardn ~
(4) (4) (4) (4)
(4) (4) (4) (4)
(4) (4) (4) (4)
(4) 9.1
23.7
Source: Compiled from data submitted in response to questionnaires of the U.S. International Trade Coamiss1on.

'· ··~ .
I-41
Table 19 Product 2: 1 Weighted-average net f.o.b. prices for sales reported by U.S. producers and importers and margins of under/(over)selling, by quarters, January 1989-September 1992
Period
1989: January-March •••..•.........•... April-June ••....••.........•..• July-September ...•.....•....... October-December .••.•..........
1990: January-March ..•••.......•...•• April-June •.•.•••.........••..• July-September ••.•.......•....• October-December •...•••..••••.•
1991: January-March ..•.......•.••••.. April-June •..•..•..•••....•••.• July-September .••....••..•.•••• October-December ..••..•..•..•••
1992: January-:March .....•..•.......•• April-June ...•••..•.•.....•..•• July-September .•.•..••••.....••
1989: January-March ..•.••••...••...•• April-June .•••...•..•....•..•.. July-September ..••.•••.•••••••• October-December .••.•..•.•.••..
1990: January-March .•.......•...•.•.. April-June •...•.••..•••...••... July-September •••.....•.....•.• October-December .....••...•.... 1991: January-March .....•...•........ April-June ••...••.•.••....••... July-September ••..••........... October-December ....•••........
1992: J anuary-Marcb .........•........ April-June ..•.••.....•....•.... July-September •...•.•.•..••..•.
U.S. product F.o.b. price Per -pound
*** *** *** ***
*** *** *** ***
*** *** *** ***
*** *** ***
Quantity
*** *** *** ***
*** *** *** ***
*** *** *** ***
*** *** ***
French product F.o.b. price• Per pound
(3) (3) (3) (3)
*** *** *** ***
*"* (3)
*** ***
*** "*" ***
Quantity ~
(3) (3) (3) (3)
*** *** *"* *** . ...
(3) *"* "*"
"*" *** ***
Margin
(4) (4) (4) (4)
(6.4) (2.7) ( 1. 8) (0.7)
(7 ;1) (4)
(5.7) (6.5)
(4.6) (3.5) (7. l)
Brazilian product F .. o.b. :erice2 Quantity Per pound ~
(3) (3) (3) (3)
(3) (3) (3) (3)
(3) (3) (3) (3) (3) (3) (3) (3)
(3) (3) (3) (3) (3) (3)
*** ***
*** *** *** *** *** ***
Indian product F.o.b. price• Quantity Per pound ~
(3) (3) (3) (3) (3) (3) (3) (3)
(3) (3) (3) (3) (3) (3) (3) (3)
(3) (3) (3) (3) (3) (3) (3) (3)
*** *** *** ***
(3) (3)
1 Grade AISI 304 wire rod, 5.5 am (0,217 inch), bot-rolled, annealed and pickled. 2 ***· 3 Data not reported. 4 Margins not calculated. 5 *** 6 ***·
Margin Percent
(4) (4) (4) (4)
(4) (4) (4) (4)
(4) (4) (4)
(3.9)
6.9 6.4 6.9
Margin
(4) (4)" (4) (4)
(4) (4) (4) (4)
(4) (4) (4) (4)
15.8 11.8
(4)
Source: Compiled from data submitted in response to questionnaires of the U.S. International Trade COD111ission.
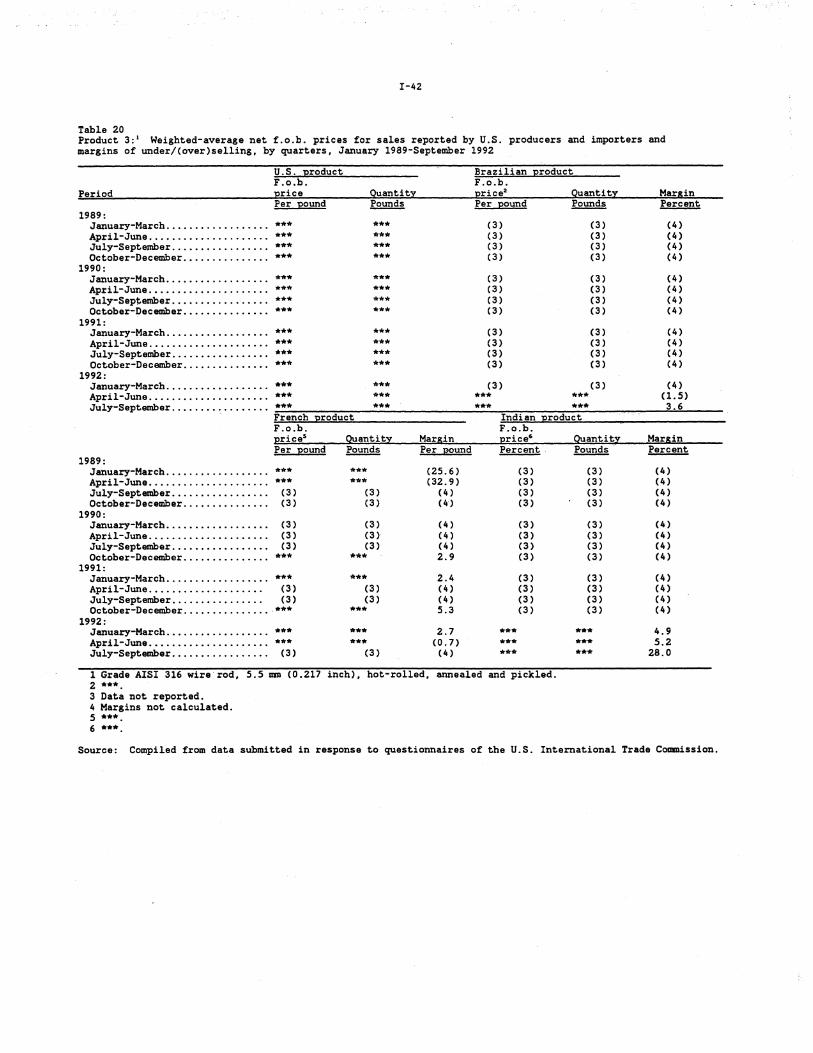
I-42
Table 20 Product 3: 1 Weighted-average net f.o.b. prices for sales reported by U.S. producers and importers and margins of under/(over)selling, by quarters, January 1989-September 1992
Period
1989: January-March ................. . April-June .................... . July-September ....•............ October-December .............. .
1990: January-March ................. . April-June .................... . July-September ................ . October-December .•.............
1991: January-March ...........•...... April-June .....•..•............ July-September ....••........... October-December .............•.
1992: January-March ...............•.. April-June ..•................•. July-September ......•...........
U.S. Ero duct F .o.b. Erice Quantity Per J?Ound ~
*** *** *** *** *** *** *** "**
""* "** **" *** *** *"* *** ***
*** *** *** *** *** *** **" ***
*** *** *** *** *** *** French Eroduct
1989: January-March ................. . April-June .................... . July-September ................ . October-December .............. .
1990: January-March ................. . April-June .................... . July-September ................ . October-December .............. .
1991: January-March ................. .
F.o.b. price• Per pound
*** ***
(3) (3)
(3) (3) (3)
***
*** April-June.................... (3) July-September................ (3) October-December . .............. · ***
1992: January-March .......•.......... April-June ................•.... July-September .....•...........
*** ***
(3)
Quantity
*** ***
(3) (3)
(3) (3) (3)
***
*** (3) (3)
***
*** **"'
(3)
Brazilian Eroduct F.o.b. ::erice2 Quantity Per Eound ~
(3) (3) (3) (3) (3) (3) (3) (3)
(3) (3) (3) (3) (3) (3) (3) (3)
(3) (3) (3) (3) (3) (3) (3) (3)
(3) (3) *"* *** *** ***
Indian Eroduct F.o.b.
Margin price• Quantity Per pound Percent Pounds
(25.6) (3) (3) (32.9) (3) (3)
(4) (3) (3) (4) (3) (3)
( 4) (3) (3) (4) (3) (3) (4) (3) (3) 2.9 (3) (3)
2.4 (3) (3) (4) (3) (3) (4) (3) (3) 5.3 (3) (3)
2.7 *** *** (0.7) *** ***
(4) *"* ***
1 Grade AISI 316 wire rod, 5.5 am (0.217 inch), hot-rolled, annealed and pickled. 2 ***. 3 Data not reported. 4 Margins not calculated. 5 *** 6 ***
Margin ~
(4) (4) (4) (4)
(4) (4) (4) (4)
(4) (4) (4) (4)
(4) (1.5) 3.6
Mardn ~
(4) (4) (4) (4)
(4) (4) (4) (4)
(4) (4) (4) (4)
4.9 5.2
28.0
Source: Compiled from data submitted in response to questionnaires of the U.S. International Trade Coamission.

I-43
Table 21 Product 4: 1 Weighted-average net f.o.b. prices for sales reported by U.S. producers and importers and margins of under/(over)selling, by quarters, January 1989-September 1992
Period
1989: January-March ...•.•.•......••.. April-June •.•.......•....•..•.. July-September ............••... October-December ..............•
1990: January-March ..•....•......••.. April-June •.•...............•.. July-September ............•.... October-December .•..•..•.••....
1991: January-March •...•.•...•.••••.. April-June •••... ; ••.••..••.•..• July-September .••.•.•.•••••.••. October-December ..••..••..••.•.
1992: January-March ••.••.••..•.••••.. April-June •.....•.•••...••••..• July-September ...•.••....•.•...
U.S. product F.o.b. price Per pound
*** *** *** ***
*** *** *** ***
*** *** *** ***
*** *** ***
Quantity
*** *** *** ***
*** *** *** ***
*** *** *** ***
*** *** ***
French product F.o.b. price Per pound
1989: January-March.................. (3) April-June. . . . • . . . . . . . . . . . . . . . . C 3 ) July-September................. (3) October-December. . . . . . . . . . . . . . . ( 3)
1990: January-March.................. (3) April-June..................... (3) July-September. . . . . . • • • . • . . • • . . (3) October-December............... (3)
1991: January-March ..•.....•......... (3) April-June..................... (3) July-September. • • . . . . . • . . . . . • . . (3) October-December ......•....••.. (3)
1992: January-March. . • • . . . . . • . . . . . . . . C 3 ) April-June..................... (3) July-September. . . . • . . . . . • • • . . . . (3)
Quantity
(3) (3) (3) (3)
(3) (3) (3) (3)
(3) (3) (3) (3)
(3) (3) (3)
Margin Per pound
(4) (4) (4) (4)
(4) (4) (4) (4)
(4) (4) (4) (4)
(4) (4) (4)
Brazilian product F.o.b. price• Per pound
(3) (3) (3) (3)
(3) (3) (3) (3)
(3) (3) (3) (3)
*** (3) (3)
Quantity
(3) (3) (3) (3)
(3) (3) (3) (3)
(3) (3) (3) (3)
*** (3) (3)
Indian product F.o.b. price•
(3) (3) (3) (3)
(3) (3) (3) (3)
(3) (3) (3) (3)
*** *** ***
Quantity
(3) (3) (3) (3)
(3) (3) (3) (3)
(3) (3) (3) (3)
*** *** ***
1 Grade AISI 304 wire rod, 6.35 nm (0.25 inch), hot-rolled, annealed and pickled. 2 ***. 3 Data not reported. 4 Margins not calculated. 5 ***·
Mardn Percent
(4) (4) (4) (4)
(4) (4) (4) (4)
(4) (4) (4) (4)
20.8 (4) (4)
Margin
(4) (4) (4) (4)
(4) (4) (4) (4)
(4) (4) (4) (4)
26.9 15.2 16.2
Source: Compiled from data submitted in response to questionnaires of the U.S. International Trade Coamission.

~· .. . . . .. . ..
I-44
Indian products were limited; such imports undersold the comparable U.S. products. Prices for Brazilian product were reported in 7 of the possible 45 quarters for products 2-4. 38 Prices for Indian products 1-4 were reported for 1992 only. 39 Prices of products 1-3 imported from France generally declined over the period and were reported in 26 of the 45 quarters. 40 In the 26 instances in which price comparisons were possible the French product was frequently priced higher than the domestic product.
U.S. producers' prices
U.S. producers' weighted-average prices for grade 302 wire rod, 5.5 mm, (product 1) increased *** percent, from *** to *** per pound during the first 4 quarters examined. During the subsequent quarter, prices declined to nearly the same level as in the first quarter of the period. Between January-March 1990 and July-September 1992 prices declined *** percent, from *** to *** per pound. Prices for grade 304 wire rod, 5.5 mm, (product 2) increased *** percent during the first 4 quarters of 1989, then declined the following quarter to approximately the level at the beginning of the period. Thereafter, prices declined, from*** to*** per pound(*** percent). Prices for grade 316 wire rod, 5.5 mm (product 3) increased from*** to *** per pound during the first 5 quarters; the following quarter the price declined to approximately the same level as at the beginning of the period. During the 10 quarter period, April-June 1990 through July-September 1992, prices declined *** percent on smaller quantities sold. U.S. producers' prices for grade 304 wire rod, 6.35 mm (product 4) similarly increased during the first 5 quarters of the period, but thereafter fell. Overall, prices declined from *** to *** per pound on fluctuating quantities during·the 15 quarters examined.
Brazilian wire rod41
Importers' prices for product 2 from Brazil were reported for the last 4 quarters of the period examined. During October-December 1990 the price was *** per pound on quantities of *** pounds. Prices were lower, *** to ***per pound, during the 3 quarters in 1992 on larger quantities sold. Prices for Brazilian product 3 were *** and *** per pound during the second and third quarters of 1992, respectively. Brazilian product 4 was priced at *** per pound during the first quarter of 1992. In 5 of the 7 quarters for which prices comparisons were possible the Brazilian products were priced lower than the domestic product, by margins ranging from.3.6 to 20.8 percent. The Brazilian product was priced higher than the domestic product in two instances, by margins of 1.5 and 3.9 percent.
38 No prices were reported for product 1 from Brazil. 39 *** 40 No prices were reported for product 4 imported from France. 41 Only one importer, ***, reported prices for products 2-4 imported from
Brazil. No prices were reported for Brazilian product 1.

I-45
French wire rod42
Prices for product 1 imported from France were highest at *** per pound during the fourth quarter of 1989 and the second quarter of 1990, and lowest at *** per pound during the first quarter of 1992. Prices were generally lower on increased quantities sold. Prices for product 2 were not reported for 1989 but generally declined by *** percent from *** to *** per pound between the first quarter of 1990 and the third quarter in 1992. Prices for French product 3 were reported in 7 of the 15 quarters. Prices were *** and ***per pound during the first 2 quarters of 1989. Thereafter, prices generally declined, from *** per pound during the fourth quarter of 1990 to *** per pound during the first 2 quarters of 1992. French wire rod was priced lower than the domestic product in 6 of the 26 possible price comparisons, by margins ranging from 0.8 to 5.3 percent. In 19 of 26 instances the French product was priced higher than the domestic product, by margins ranging from 0.5 to 32.9 percent. Both domestic and French product were priced the same in one instance.
Indian wire rod43
Prices for Indian wire rod were only reported for sales in 1992. Prices for product 1 were *** and *** per pound during the second and third quarters of 1992. During the first 2 quarters of 1992 prices for product 2 were *** and*** per pound, respectively. Prices for Indian product 3 were between*** and *** per pound, declining on increased volumes sold, during the 3 quarters examined in 1992. Prices for product 4 were *** and *** per pound during the first two quarters and third quarter of 1992, repsectively. The Indian product was priced below the domestic product in the 10 possible price comparisons, by margins ranging from 4.9 to 28.0 percent.
Lost Sales and Lost Revenues
All five petitioners in these preliminary investigations alleged lost sales and revenues for wire rod due to imports from the subject countries. 44
Collectively, petitioners alleged lost sales .of*** and lost revenues of*** due to the subject imports. *** alleged the loss of sales and *** alleged lost revenues over the investigation period but could not provide verifiable details for these allegations. 45 *** alleged lost sales of ***, accounting for the majority of lost sales allegations, by value. The following are reports of the conversations between Commission staff and those purchasers who
42 Only one importer, ***, reported prices for products 1-3 imported from France. No prices were reported for French product 4.
43 Yith the exception of one quarter, ***was the only importer reporting prices for sales of the subject Indian product.
44 *** 45 In order to investigate such allegations, the Commission requests
information such as the accepted and rejected price quotes, or the dates and quantities involved in each transaction.

I-46
could b~ reached and were willing to discuss their buying practices in these preliminary investigations.
* * * * * * *
Exchange Rates
Quarterly data reported by the International Monetary Fund indicate that the currencies of the countries subject to these investigations fluctuated in relation to the U.S. dollar over the period January-March 1989 through JulySepte~ber 1992 (table 22). 46 The nominal value of the French currency appreciated by 70.4 percent while the respective values of the Brazilian and Indian currencies depreciated by 99.9 percent and 41.0 percent, respectively. tJhen adj~sted for movements in producer price indexes in the Unite4 States and the specified countries, the real value of the Brazilian and French currencies showed appreciations of 3.1 and 3.5 percent, respectively, during the periods for which data were available. During the period for which data were collected the Indian currency depreciated by 18.7 percent.
Table 22 Exchange rat.es: 1 Indexes of nominal and real exchange rat.es of selected currencies, and indexes of producer prices in those count.ries,2 by quarters, January 1989-Sept.ember 19'92
U.S. Brazil France India pro- Pro- Nominal Real Pro- Nominal Real Pro- Nominal Real ducer ducer . exchange exchange ducer exchange exchange ducer exchange exchange price price rate rate price rate rate price rate rate
Period index index index index3 index index index' index index index
1989: Jan.-Har .. ; •.• 100.0 100.0 100.00 100.0 100.0 100.0 100.0 100.0 100.0 100.0 Apr.-June ..•.. 101.8 130.4 84.3 108.1 100.4 96.0 94.7 103.4 94.9 96.4 July-Sept. •.•.. 101.4 304.3 38.0 114.2 99.6 96.7 95.1 106.7 92.0 96.8 Oct.-Dec ••.••• 101.8 882.6 14.5 126.1 98.9 102.1 99.2 107.9 90.4 95.8
1990: Jan.-Har ••••.• 103.3 4,213.0 3.8 156.2 98.2 109.'1 104.4 108.6 89.7 94.4 Apr.-June ••••• 103.1 8,160.9 1.9 146.5' 98.1 111.5 106.1 112.5 88.1 96.2 July-Sept ••••• 104.9 10,978.3 1.4 142.4 98.2 117.8 110.3 116.2 87.1 96.4 Oct.-Dec •••••• 108.1 16, 421. 7 0.8 118.6 99.4 124.5 114.4 119.3 84.5 93.3
1991: Jan.-Har .•.••. 105.9 26,721.7 0.5 113.9 98.9 120.8 112.9 123.5 81.2 94.8 Apr.-June .••.. 104.8 34,643.5 0.4 116.8 97.4 107.1 99.5 126.3 74.4 89.7 July-Sept ..••• 104.7 48,678.3 0.3 119.9 96.8 106.2 98.2 134.2 59.3 76.1 Oct.-Dec .•••.. 104.8 89,243.5 O.l 108.5 95.8 113.4 103.5 136.2 59.l 76.7
1992: Jan.-Har ••••.• 104.6 172,578.3 O.l 107.0 c•> 114.2 c•> 139.9 59.0 7.8.9 Apr.-June ..•.. 104.8 298,673.9 0.1 103.1 c•> 115.7 c•> 142.l 59.0 79.3 July-Sept •••.• 104.7 c•> 0.0 c•> c• > 170.4 c•> 146.3 59.0 81.3
1 Exchange rates expressed in U.S. dollars per unit of foreign currency. • Producer price indexes--intended to measure final product prices--are based on period-average
quarterly indexes presented in line 63 of the International Financial Statistics. 3 The real exchange rate is derived from the nominal rate adjusted for relative movements in producer
prices in the United St.at.es and the specified countries. • Data not reported.
Note.--January-Harch 1989 • 100. The real exchange rat.es, calculated from precise figures, cannot in all instances be derived accurately from previously rounded nominal exchange rate and price indexes.
Source: International Monetary Fund, International Financial Statistics, July 1992.
46 International Financial Statistics, December 1992.
3

A-1
APPENDIX 'A
FEDERAL REGISTER NOTICES

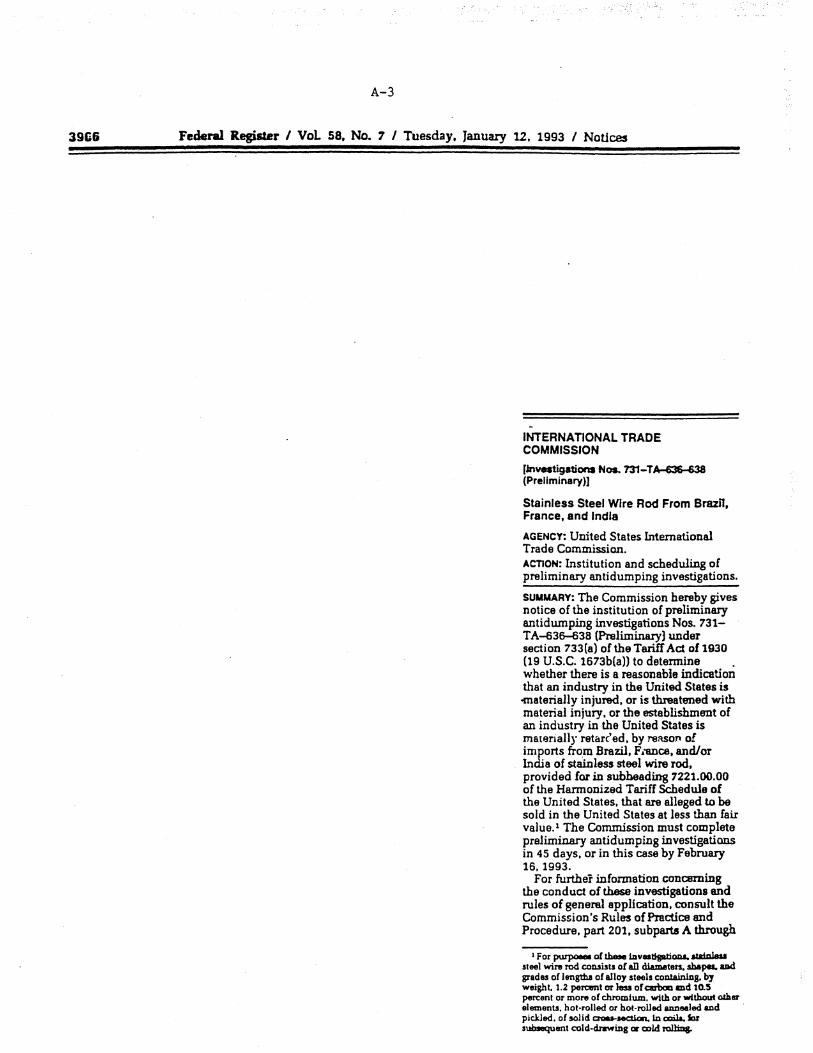
3966
A-3
Federal Register I Vol 58, No. 7 I Tuesday, January 12, 1993 I Notices
INTERNATIONAL TRADE COMMISSION
[Jnvestigationa Nos. 731-T A-636--638 (Preliminary)]
Stainless Steel Wire Rod From Brazn, France, and India
AGENCY: United States International Trade Commission. ACTION: Institution and scheduling of preliminary antidumping investigations.
SUMMARY: The Commission hereby gives notice of the institution of preliminary antidwnping investigations Nos. 731-T A-636-638 (Preliminary) under section 733(a) of the Tariff Act of 1930 (19 U.S.C. 1673b(a)) to determine . whether there is a reasonable indication that an industry in the United States is -materially injured, or is threatened with material injury, or the establishment of an industry in the United States is materially retarc'ed, by reason of imports from Brazil, F;ance, and/or India of stainless steel wire rod, provided for in subheading 7221.00.00 of the Harmonized Tariff Schedule of the United States, that are alleged to be sold in the United States at less than fair value. 1 The Commission must complete preliminary antidumping investigations in 45 days, or in this case by February 16, 1993.
For further information concerning the conduct of these investigations and rules of general application, consult the Commission's Rules of Practice and Procedure, part 201, subparts A through
1 For purpoeM or theM iDvast!ptiOD&. aWDlau Slee} wire rod consists or all diameters, sbepa. and grades of lengtha of alloy steels colllainlng. bJ weight. 1.2 pel'C8nt or less or airl>oa md 10.5 percent or more of chromium, wilh or without o!Aer elemenlS. hol-rolled or hot-rolled annealed and pickled. of solid aou-.-::tlaa. ID coiJa. Sor suinequent cold-dJ'llwing or ex>ld rollmg.

A-4
Federal Register I Vol. 58, No. 1 I Tuesday, January 12, 1993,f .NC>~ces
E (19 CFR part 201), and part 207, subparts A and B (19 CFR part 207).
.. EFFECTIVE DATE: December 30, 1992. . FOR FURTHER INFORMATION CONTACT: Larry Reavis (202)-205-318?), Office of
· Investigations, U.S. International Trade Commission, 500 E Street SW., . Washington, DC 20436. Hearing· impaired persons can obtain . information on this matter by contacting the Commission's TDD terminal on 202-205-1810. Persons with mobility impainnents who will need special assistance in gaining access to the Commission should contact the Office of the Secretary at 202-205-2000.
SUPPLEMENTARY INFORMATION
Background
These investigations are beii:Jg instituted in response to a petition filed on December 30, 1993, by Al Tech Specialty Steel Corp .• Dunkirk, NY: Armco Stainless &: Alloy Products, Inc., Baltimore, MD: Carpenter Technology Corp .• Reading, PA; Republic Engineered Steels, Inc., Massilon, OH: and Talley Metals Technology, Inc., Hartsville, SC: and the United Steelworkers of America, AFL-00/ a.c. Participation in the Investigations and Public Senice List
Persons (other than petitioners) wishing to participate in the investigations as parties must file an entry of appearance with the Secretary to the Commission, as provided in sections 201.11and207.10 of the Commission's rules, not later than seven (7) days after publication of this notice in the Federal Register. The Secretary will prepare a public service list containing the names and addresses of all persons, or their representatives, who are parties.to these investigations upon the expiration of the period for filing entries of appearance.
Limited Disclosure ofBusineu Proprietary Information (BPn Under an Administrative Protective Order (APO) and BPI Senice List .
Pursuant to section 207 .7(a) of the Commission's rules, the Secretary will make BPI gathered in these preliminary investigations available to authorized applicants under the APO issued in the investigations, provided that the application is made not later than seven (7) days after the publication of this notice in the Federal Register. A · separate service list will be maintained by the Secretary for those ·parties · authorized to receive BPI under the APO.
Conference
The Commission's Director of Operations has scheduled a conference in connection with these investigations for 9:30 a.m. on January 22, 1993, at the U.S. International Trade Commission Building, 500 E Street SW., Washington, DC. Parties wishing to participate in the conference should contact Larey Reavis (202-205-3185) not later than January 19, 1993, to arrange for their appearance. Parties in support of the imposition of antidwnping duties in these investigations and parties in opposition to the imposition of such duties will each be collectively allocated one hour within which to make an oral presentation at the conference. A nonparty who has testimony that may aid the Commission's deliberations may request permission to present a short statement at the conference.
Written Submi11ions
As provided in sections 201.8 and 207.15 of the Commission's rules, any person may submit to the Commission on or before January 27, 1993, a written brief containing information and arguments pertinent to the subject matter of the investigations. Parties may file written testimony in connection with their presentation at the conference no later than three"(3) days before the conference. If briefs or written testimony contain BPI, they must conform with the requirements of sections 201.6, 207 .3, and 207 .7 of the Commission's rules.
In accordance with sections 201.16(c) and 207.3 of the rules, each document filed by a party to the investigations must be served on all other parties to the investigations (as identified by either the public or BPI service list), and a certificate of service must be timely filed. The Secretary will not accept a document for filing without a certificate of service.
Authority: These investigations are being conducted under authority of the Tariff Act of1930. title VD. Thia notice ii published pursuant to section 207.12 of the Commission's rules.
Issued: January 5, 1993. By order of the Commission.
Paul L Bardos, At:Ung Secretary. [FR Doc. 93-827 Filed 1-8-93; 4:06 pm} lllUJNG COO! 7ll20-0MI
. 3967

A-5
Federal R.egister I Vol. 58, No. 15 I Tuesday, January 26. 1993 I Notices 6115
[A-351-819, A-427-811, mid~)
lnmatton of Antldumplng Duty lnveatlgatlona: Certain Stalnleaa Steel Wire Roda from Brazil, France and lnd1a
AGa«:Y: Import Administration, International Trade Administrntion, Department o~ Commerce.
EFFECTIVE DATE: January 25, 1993.
FOR FURTHER INFORllATIOH CONTACT:
John Gloninger, Office of Antidumping Investigations, Import Administration, International Trade Administration, U.S. Department of Commerce, 14th Street and Constitution Avenue NW., Washington, DC 20230; telephone (202} 482-2778.
INITIATION OF INVESTIGATIONS:
The Petitiom
On December 30. 1992, we received three petition.a filed in proper form by the Al Tech Specialty Steel Corp., Armco Stainless at Alloy Products. Carpenter Technology Corp .• Republic Engineered Steels. Talley Metals Technology, Inc .• and United Steelworbrs of America, AFL-ClO/CLC (petitio.oors). On January 12, 1993, we received a supplement to the petitions. at the Department's request. In accordance with 19 crR 353.12. the petitioners allege that certain stainless steel ·111:ue rods (SSWR) from Brazil, France and India are being. or are likely to be, sold in the United States at less than fair value within the meaning of section 731 of the Tariff Act of 1930, as amended (the Act}, and that these imports are materially injuring, or throoten material injury to, a U.S. industry.
The petitioners have stated that they have standing to file the petitior..s · because they are interested parties, as defined under section 771(9}{CJ of the Act, and because the petitions were filed on behalf of the U.S. industry producing the product subject to these investigations. If any interested party. as described UDder paragraphs (C), (D). (E), or (Fl of section 771(9) of the Act. wishes to register support for, or opposition to, these petitions, it should file a written notification with the Assistant Secretary fur Import Administration.
Under the Department's regulatiom. any producer or reseller seeking exclusion from a potential antidumping d:L,~~der must submit its request for o ·on within lO days of th.a date of tho publication ·of this notice. The procsdures and requirements a:a contained in 19 CFR 353.14.
Scope of Innstigatiom For purposes of these invMtigsti~s.
certain stainless steel wire rods (SSWR) are products which llJ'9 bot-rolled or
· hot-rolled annealed and pickled rounds, squares, octagons, hexaBODs or other shapes. in coils. for subsequent colddrawing or cold-rolling. SSWR are made
. of alloy st~ls containing, by weight, 1.2 percent or less of carbon and 10.5 percent or more of chromiurIJ,, with or without other elements. These products are only manufactW'9d by hot-rolling and are always sold in coiled form, and are of solid cross-section. The majority of SSWR sold in the United States lll'9
round in cross-sectional shape. annealed and pickled, and la1er cold· drawn into stainless steel wire. The most common siza is 5.5 millimeters in diameter.
The SSWR subject to these investigations are currently classifiable under subheadings 7221.00.0005, 7221.00.0015, 7221.00.0020, 7221.00.0030, 7221.00.0040, 7221.00.0045, 7221.00.0060, 7221.00.0075, 7221.00.0080 of the Hannoni:z:ed Tariff Schedule of the United States {HTSUS). Although the HTSUS subheadings are provided for convenience and customs purposes. our written description of the scope of these investigations is dispositive.
United States Price ud Foreign Market Value
. Braril Petitioners based United States Price
(USP) on information obtained bv a U.S. industry consultant. The consultant provided price quotes for two different grades (304 and 316) of the subject merchandise.. Petitioners calculated USP by subtracting the duty rate. harbor maintenance fee, merchandise processing fee, ocean freight and marine insurance.
Foreign Market Value {FMV) is based · on home market prices obtained by an industry consultant for two grades {304 and 316) of SSWR. The prices were converted to a per pound basis. No con vets.ion. into dollars was necessary since the prices were quoted in U.S. dollars.
Fronce
Petitioners based USP on information obtained through their own business activity. This information included C.I.F. prices for one grade of SSWR from the two known French producers. Petitiontn calculated a net price by maldng deductioDa for the duty rate. ·· ocean freight. marine insutance. harbor maintenance Eae. merchandise·· ·
. Pro<:8SSin8 See. U.S. inlaDd freight and
foreign inland freight. Petitioneni used U.S. import sta~ to estimate OCB8Jl
freight and marine insurance c:harges, while figures for foreign inland freight and insurance charges were supplied by a European steel consultant No adjustments to USP were made for brokerage and handling charges or for any selling expenses .
The European st98l consultant · obtained information on prices for FMV. Petitioners provided C.l.F. prices in French Franca fur the same grade from the two known French producers. Petitioners converted the prices to dollars using the contemporaneous exchange rate found in the Federal Reserve Statistical Release. In addition, the units of weight were converted from dollars per metric ton to dollars per pound. Based on information received from the European steel consultant,
··petitioners deducted amounts for foreign inland freight and insurance charges and made an adjustment for the lower carbon content of the SSWR sold in French as compared to that sold in the United States.
Finally, the home market prices used by petitioners are exclusive of valueadded taxes. In accordance with current Department policy.petitioners calculated the amount of such taxes which would be applicable to sales to the United States and added the resulting amount to both USP and FMV.
India
A consultant was used to obtain information on USP for two grades of SSWR from two producers. These prices were quoted as FOB U.S. dock. Net USP was calculated by subtracting the duty rate, ocean freight. marine insurance, harbor maintenance fee, merchandise processing fee and foreign inlf'nd freight.
For FMV, an industry consultant obtained a range of prices for two grades of SSWR from two producers. These prices were exfactory prices. Tbs petitioners averaged the high and low price for each grade. These average prices were used in the margin calculation after some adjustments were
..made. The prices were eon"81'ted from rupees to dollars using an gxrbange rate from the monthly federal Reserve Statistical Release. Also, adjustments for differences in credit expenses between U.S. and Indian sales were made.
The range of dumping margins of SSWR from Brazil based on a comparisou of USP to FMV alleged by petitiool!n is 23.5% to 26.5~ The range ci dumping margins of SSvtR from Franca ii 17.8% to 25.5%. and the range for India b 41.1 ~ to 48~ •
A-6
6116 Federal Register I Vol. 58, No. 15 I TµQiday, January 26, 1993 I Notices
Critical Circumstances Petitioners also allege that "critical
circumstances" exist, within the · meaning of Section 733(e) of the Act, with respect to imports of the subject merchandise form Brazil and France.
Initiation of Investigations We have examined, the petitions for
SSWR from Brazil, France and India, as amended, and have found that the petitions meet the requirements of · · section 732(b) of the Act. We have studied the information provided in the petitions and for purposes of the initiation we accept petitioners' calculations. Therefore, we are initiating antidumping duty investigations to determine whether imports of SSWR from Brazil, France and India are being, or are likely to be, sold in the United States at less than fair value. If investigations proceed normally, we will make our preliminary detenninations by June 8, 1993.
ITC Notification Section 732(d) of the Act requires us
to notify the International Trade Commission (ITC) of these actions and we have done so.
Preliminaey Determinations by the. ITC The ITC will determine by February ·
16, 1993, whether there is a reasonable indication that imports of SSWR from Brazil. France and India are materially injurying, or threaten material injury to, a U.S. induSby. A negative ITC determination will result in these · investigations being terminated; otherwise, the investigations will proceed according to statutory and regulatory time limits. .
This notice is published pursuant to section 732(c)(2) of the Act and 19 CFR 353.13(b).
Dated: Jenua:y 19, 1993. · AlaM.Dwm, Assistant Secretary for Import Administration. . (FR Doc. 93-1905 Filed 1-25-93; 8:45 am) BIWNG CODE St~.

B-1
APPENDIX B
CALENDAR OF PUBLIC CONFERENCE


- ··:.' .. ·· . :~.:. . ·: ..... . ~ ·: .. "' . . . ·:· ~. . . .:
B-3
CALENDAR OF PUBLIC CONFERENCE
Investigations Nos. 731-TA-635-638 (Preliminary)
Stainless Steel Wire Rod from Brazil, France, and India . . -~ .. ~
Those.listed below appeared at the United States International Trade· Commission's conference held in connection with the subject investigations at 9:30 a.m. on January 22, 1993, in Courtroom B (first floor) of the USITC Building, 500 E Street, SW, Washington, DC.
In support of the imposition of antidumping duties
Collier, Shannon, Rill & Scott--Counsel Washington, DC on behalf of
Al Tech Specialty Steel Corp. Armco Stainless & Alloy Products Carpenter Technology Corp. Republic Engineered Steels Talley Metals Technology, Inc. United Steel Workers of America, AFL-CIO/CLC
Mr. James Gugino, Marketing Manager, Al Tech Specialty Steel Corp. Mr. William J. Pendleton, Director of Corporate Affairs, Carpenter
Technology Corp. Mr. Patrick J. McGrath, Chief Economist, Georgetown Economic Services Mr. Adam K. Lee, Economist, Georgetown Economic Services
David A. Hartquist, Esq.--OF COUNSEL Laurence J. Lasoff, Esq.--OF COUNSEL Robin H. Gilbert, Esq.--OF. COUNSEL Lynn E. Duffy, Esq.--OF COUNSEL
In opposition to the imposition of antidumping duties
Weil, Gotshal & Manges Washington, DC, and New York, NY on behalf of
Imphy S.A. and Ugine-Savoie (producers in France) Metalimphy Alloys Corp. and Techalloy Company, Inc. (related U.S. firms)
Mr. James McKiethan, President, Metalimphy Alloys Corp. Mr. Bruce Malashevich, President, Economic Consulting Services, Inc.
Jeffrey P. Bialos, Esq.--OF COUNSEL Mark F. Friedman, Esq.--OF COUNSEL
B-4
In opposition to the imposition of antidumping duties--Continued
O'Melveny & Myers Washington, DC on behalf of
Mukand, Ltd. (producer in India) and Gulf and Northern Trading Corp.
Mr. Joseph Porcellini, Materials Manager, Maryland Specialty Vire, Inc.
Gary N. Horlick, Esq.--OF COUNSEL
Willkie Farr & Gallagher Washington, DC on behalf of
Acos Fines Piratini S.A. (producer in Brazil)
William H. Barringer, Esq.--OF COUNSEL Daniel L. Porter, Esq.--OF COUNSEL

C-1
APPENDIX C
STAINLESS AND HEAT-RESISTING STEELS
Source: Iron and Steel Society, Steel Products Manual: Stainless and Heat Resisting Steels, Nov. 1990.


Type Number
201
202
203
205
301
302
-··~:... ~ ,. . ···. - .. ,
C-3
Table 2·1
STANDARD TYPES
STAINLESS AND HEAT RESISTING STEELS
Chemical Ranges and Limits of Cast or Heat Analysis
Chemical Composition. Percent .. l\1a::imum unless otheril'i.~f' .•hown.
UNS Number
!N08020l
!N080241
!N08026l
!N08330
!N08366l
!N08367l
!N087001
!N089041
($13800)
($15500)
($157001
c
0.06
0.03
0.03
0.08
0.03
0.03
0.04
0.02
0.05
0.07
0.09
($174001 0.o7
!Sl 7700) 0.09
($18200) 0.08
(S20100) 0.15
!S20200) 0.15
($203001
(S205001
(S209101
0.08
0.12/ 0.25
0.06
($210001 0.10
(S213001 0.25
(S2!9041 0.30
($24100) 0.15
(S282001 0.15
(8301001 0.15
tS30200l 0.15
Mn
2.00
1.00
1.00
2.00
2.00
2.00
2.00
2.00
0.10
1.00
1.00
1.00
1.00
1.251 2.50 5.50/ 7.50
p s 0.035 0.035
0.035 0.035
0.03 0.03
0.040 0.030
0.040 0.030
0.040 0.03
0.04 0.03
0.045 0.035
0.01 0.008
0.040 0.030
0.040 0.030
0.040 0.030
0.040 0.040
Si
1.00
0.50
0.50
0.o75 1.50
1.00
1.00
1.00
1.00
0.10
1.00
1.00
1.00
1.00
0.040 0.15/ 1.00 0.40
0.060 0.030 0.75
7.50/ 0.060 0.030 0.75 10.00
5.00/ 0.040 6.50 14.00/ 0.060 15.50 4.001 0.040 6.00
4.01 7.0
15.01 18.0
0.03
0.05
0.181 0.35
0.030
0.030
0.03
0.5
8.01 0.040 0.030 10.0
11.001 0.060 0.030 14.00
l 7 .00/ 0.040 0.030 19.00
1.00
0.75
1.00
6.00
1.00
1.00
1.00
1.00
2.00 0.045 0.030 0.75
2.00 0.045 0.030 0.75
Cr
19.00/ 21.00 22.5i 25.0 22.00/ 26.00 li.01 20.0 20.01 22.0
20.01 22.0
19.0/ 23.0 19.01 23.0
12.25/ 13.25 14.00/ 15.50
14.00/ 16.00
Ni
32.501 35.00
35.0/ 40.0 33.00, 37.00 34.01 37.0
23.5/ 25.5 23.501 25.50 24.0/ 26.0
23.01 28.0 i.50/ 8.50
3.50/ 5.50 6.50/ 7.i5
15.00/ 3.001 17.50 5.00
16.00/ 6.50/ 18.00 7.75 17.50 19.50 2.50 16.001 3.50/ 18.00 5.50
17.001 4.00/ 19.00 6.00
2.001 3.00
3.50i 5.00 5.00i 6.iO
6.00 7.00
6.001 7.00 4.31 5.0
4.001 5.00 2.001 2.50
2.00/ 3.00
1.50/
16.001 5.00/ 0.50 18.00 6.50 16.501 1.00i 18.00 l.75
20.50/ 11.50· 1.501 23.50 13.50 3.00 18.00/ 16.01 23.00 20.0
16.00/ 3.00 21.00 19.00/ 5.501 21.50 7.50 16.50/ 0.501 19.00 2.50
4.01 6.0 0.50/ 3.0
11.01 0.151 19.0 1.25
16.001 6.00/ 18.00 8.00
11.001 8.001 19.00 10.00
Othf'r Elt'ments
Cu 3.0014.00 Cb 8XC 1.00 Cb 0.1510.35
Cu 2.00/4.00
Cu L .00: Pb 0.005 Sn 0.025
N 0.1810.25 Cu O.i5
......
17
Cb 8XC Miru0.40 Max
Cu l.0012.00
Al 0.9011.3 N 0.010 Cu 2.5014.50 Cb 0.15i0.45 Al 0.i5d.50
Cu 3.00i5.00 Cb 0.15i0.45
Al 0.75!1.50
N 0.25
N 0.25
Cu 1.7512.25
N 0.3:!10.40
N 0.2010.40 Cb 0.1010.30
N 0.15: Cu 2.00
N 0.2010.80 Cu 0.512.0
N O.l5i0.40
N 0.45
N 0.40/0.60
N 0.LO
N 0.10·
Not.e: The analyses listed in this table present the standard Specialty St.eel Industry of the United States !SSIUSl analyses for these grades. Variations from these ranges or limits for some of the elements are governed by the individual product specifications of the various technical societies.

18
Type Number
3028
303
303Se
304
304L
304H
304Cu
304N
304LN
305
308
309
3098
310
310S
316
316L
316H
316F
316N
316LN
3li
317L
321
C-4
Table 2-1 .(Continued)
·chemical Co~position. Percent. Maximum unless otherwise shou·n.
UNS Number
(S302151
(S303001
c
0.15
0.15
IS30323) 0.15
(S30345) 0.15
1830400) 0.08
(S304031 0.030
18304091 0.04/ 0.10
IS30430) 0.08
(S3043ll 0.06
Mn
2.00
2.00
2.00
2.00
2.00
2.00
2.00
2.00
2.00
(S304511 0.08 2.00
!S304531 0.030 2.00
(S30500) 0.12 2.00
(S30800) 0.08 2.00
IS30900) 0.20 2.00
IS309081 0.08 2.00
!S310001 0.25 2.00
(S310081 0.0~ 2.00
1831600) 0.08 2.00
(8316031 0.030 2.00
18316091 0.04/ 2.00 0.10
($316201 0.08 2.00
(S31651) 0.08 2.00
IS31653) . 0.030 2.00
IS3 l 700) 0.08 2.00
IS317031 0.030 2.00
(S317251 0.03 2.00
(S31803) 0.030 2.00
IS32100) 0.08 2.00
p s
0.045 0.030
0.20 0.15 Min
0.20 0.060
Si
2.00/ 3.00
l.00
1.00
0.05 0.11/ 1.00 0.16
0.045 0.030 0.75
0.045 0.030 0.75
0.045 0.030 0.75
0.045 0.030 0.75
0.040 0.14 1.00
0.045 0.030 o. 75
0.045 0.030 0.75
·0.045 0.030 0.75
0.045 0.030 1.00
0.045 0.030 1.00
0.045 0.030 1.00
0.045 0.030 1.50
0.045 0.030 1.50
0.045 0.030 0.75
0.045 0.030 0.75
0.045 0.030 0.75
0.20 0.10 1.00 Min
0.045 0.030 0.75
0.045 0.030 0.75
0.045 0.030 0.75
0.045 0.030 0.75
0.045 0.030 0.75
0.030 0.020 1.00
0.045 0.030 0.75
Cr Ni Mo
17 .OOi 8.00/ 19.00 10.00
17.00/ 8.00/ 19.00 10.00 17.00/ 8.00/ 19.00 10.00 17.00/ 8.001 0.40: 19.00 10.00 0.60 18.00/ 8.00/ 20.00 10.50 18.001 8.001 20.00 12.00
18.00/ 8.00/ 20.00 10.50
17.001 8.001 19.00 10.00 16.00/ 9.0/ 19.00 11.0 18.001 8.001 20.00 10.50 18.001 8.001 20.00 12.00 17.00/ 10.50/
. 19.00 13.00
19.00/ 10.00/ 21.00 12.00 22.00/ 12.001 .24.00 15.00 22.00/ 12.00; 24.00 15.00 24.001 19.00· 26.00 22.00 24.001 19.00i 26.00 22.00 16.001 10.001 2.00·
. 18.00 14.00 3.00
16.001 10.00i 2.001 18.00 14.00 3.00 16.007 10.00/ 2.00 18.00 14.00 3.00 16.001 10.00· l.7.5. l~.00 14.00 2.50 16.00; 10.00· 2.00. 18.00 14.00 :3.00 16.00/ 10.00 2.001 18.00 14.00 J.00 18.001 11.001 J.001 20.00 15.00 -1.00
18.00i 11.001 3.001 20.00 15.00 4.00
18.01 13.50/ 4.01 20.0 li.50 5.0
21.0/ 4.50/ 2.501 23.0 6.50 3.50 17.00/ 9.00/ 19.00 12.00
Other Elements
Se 0.15 Min
Al 0.6011.00
N 0.10
N 0.10
N 0.10
Cu 3.0014.00
Cu l.30/2.40
N 0.1010.16
N 0.1010.16
N 0.10
N 0.10
N O.!O
N 0.10
N 0.1010.16
N 0.1010.16
N 0.10
N 0.10
N 0.10 Cu 0.75
N 0.0810.20
Ti 51C+NI Min 0.70 Max
Note: The analyses listed in this table present the standard Specialty Steel Industry of the United States ISSIUSf analyses ior these grades. Variations from these ranges or limits for some of the elements are governed by the individual product specifications of the various technical societies.

1\·pc' ·.\'11mh1•r
UNS :Vumb<'r c
c-s Table 2-1 CContinued>
Chemical Composition. Percent. MGJCimum unless otheru•ise shou·n.
Mn. p s Si Cr Ni Mo Other 1-:lements
19
--.. ---· ··--·---------------------------------------.1:!111
:l4ili
34tlli
403
405
409
HO
410S
414
416
420
420F
429
430
430F
431
18321091 0.041 0.10
IS3255UI 0.04
15329001 0.0!1
tS329501 0.03
cS34i001
IS347091
15348001
IS348091
IS350001
15355001
0.08
0.08
0.08
0.04i 0.10
0.08
0.04i O.IO o.o;o, 0.11 0.10; 0.15
0.08
18403001 0.15
IS405001 0.08
18409001 0.08
IS410001 0.15
IS410081 0.08
· cSH4001 0.15
15415001 0.05
IS416001 0.15
IS420001 Over 0.15
15420101 0.151 0.30
IS420201 Over 0.15
IS422001 0.201 0.25
IS429001 0.12
18430001 0.12
1$430201 0.12
18431001 0.20
2.00
1.50
:mo
2.00
2.00
LOO
2.00
2.00
2.00
2.00
0.50i L25 0.501 1.25
2.00
LOO
LOO
1.00
LOO
LOO
LOO
0.501 LOO L25
1.00
1.00
1.25
0.50i LOO
1.00
1.00
1.25
LOO
0.045 0.030 0.75
0.040 0.03 1.00
0.040 0.030 0.75
0.035 0.010 0.60
0.040 0.030 0.75
0.040 0.030 0.75
0.030 0.75
0.045 0.030 0.75
0.045 0.030 0.75
0.045 0.030 0.75
0.040 0.030 0.50
0.040 0.030 0.50
0.045 0.030 1.00
0.040 0.030 0.50
0.040 0.030 1.00
0.045 0.045 1.00
0.040 0.030 1.00
0.040 0.030 LOO
0.040 0.030 1.00
0.030 0.030 0.60
0.060 0,15 LOO Min
0.040 0.030 1.00
0.040 0.030 1.00
0.060 0.15 1.00 Min
0.025 . 0.025 0.50
0.040 0.030 1.00
0.040 0.030 1.00
0.060 0.15 1.00 Min
0.040 0.030 LOO
11.001 9.00/ 19.00 12.00 24.0/ 4.501 27.00 6.50
23.00i 2.501 28.00 5.00
26.0/ 29.0
3.50/ 5.20
19.00/ 30.00/ 23.00 34.00
18.00/ 18.00/. 22.00 22.00
17.00/ 19.00 17.001 19.00 17.00/ 19.00 17.00/ 19.00
9.00/ 13.00 9.00/ 13.00 9.00/ 13.00 9.00/ 13.00
2.90. 3.90
LOO• 2.00
1.00: 2.50
16.00i 4.001 2.50. 17.00 5.00 3.25 15.00/ 4.00/ 2.50. 16.00 5.00 3.25
15.00/ li.00/ 17.00 19.00
11.50/ 13.00 11.50/ 0.60 14.50 10.50/ 0.50 11.75 11.50/ 0.75 13.50 11.50/ 0.60 13 50 11.50/ 1.251 13.50 2.50 I I.Si 3.501 14.0 5.50
12.00/ 14.00 12.00/ 14.00
13.51 0.25/ 15.0 1.00
12.001 14.00 11.0/ 0.50/ 12.50 1.00 14.00/ 0.75 16.00 16.001 0.75 18.00 16.00/ 18.00 15.00/ 1.251 17.00 2.50
0.50/ 1.00
0.401 1.00
Ti 41C+NI Min 0.70 Max ?'> 0.IOi0.25 Cu 1.50,2.50
!'; 0.15'0.35
Ti 0.60 Al 0.60
Ti 0.60 Al 0.60
Cb IOXC Min 1.00 Max Cb 8XC ~Jin 1.00 Max Cb+Ta IOXC Min 1.00 Ma~ Ta 0.10 Max Co 0.20 Max Cb+ Ta SXC Min 1.00 Max Ta 0. IO Max Co 0.20 Max :\ O.Oi 0.1 :l
:\ O.oi 0.1 :J
Al 0.10·0.30
Ti 6XC ~tin. O.i5 ~lax
\' O.:!lhl.30 w o.9o u;;
Note: The analyses listed in this table present the standard Specialty Steel lnd1JStry of the United States 1SSIUSI analy~s. for_ these grades. Variations from these ranges or limits for some of the elements are governed by the individual product spec1f1cauons of the various technical societies.

;, ...... 20 C-6
Table 2·1 (Continued)
Chemical Composition. Percent. Maximum unless otherwise shown.
7\·pe UNS Other 1\"um.ber .'\lumber c Mn p s Si Cr Ni Mo Elements
434 tS434001 0.12 1.00 0.040 0.030 1.00 16.001 0.75. 18.00 1.25
436 iS43600i 0.12 1.00 0.040 0.030 1.00 16.00/ 0.7:ii Cb 5XC Mini 18.00 1.25 0.70 Max
439 IS439001 0.07 l.00 0.040 0.030 1.00 17.00/ 0.50 Ti0.20+4 iC+NI Min,1.10 :\lax 19.00 Al 0.15
N 0.04
440A IS440021 0.601 1.00 0.040 0.030 1.00 16.00/ 0.75 Q.75 18.00
4408 IS44003) 0.751 l.00 0.040 0.030 1.00 16.00/ 0.75 0.95 18.00
440C IS44004) 0.951 1.00 0.040 0.030 1.00 16.00/ 0.75 1.20 18.00
IS44020) 0.95/ 1.25 0.040 0.15 l.00 16.001 0.75 0.60 1.20 Min 18.00
442 tS442001 0.20 1.00 0.040 0.030 1.00 18.001 23.00
444 IS44400l 0.025 1.00 0,040 0:030 1.00 17.50/ 1.75, N 0.035 19.50 2.50 Ti+Cb=0.20+41C+M
Min/0.80 Max
446 tS446001 0.20 1.50 0.040 0.030 1.00 23.00/ N 0.25 27.00
tS446271 0.010 0.40 0.020 0.020 0.40 25.0/ 0.50 0.75/ N 0.015; Cu 0.20 27.5 1.50 Cb 0.0510.?0
Ni+Cu 0.50
IS44735) 0.030 1.00 0.040 0.030 1.00 28.0/ 1.00 3.601 N 0.045 30.0 4.20 Ti+Cb 6tC+NI Min.
1.00 Max
. IS44800) 0.010 0.300 0.025 0.020 0.20 28.0i 2.0/ 3.51 N 0.015: Cu 0.15 30.0 2.5 4.2 !C+N) 0.025
IS450001 0.05 l.00 0.030. 0.030 1.00 14.0/ 5.01 0.501 Cu 1.25/1.75 16.0 7.0 1.00 Cb 8XC Min
tS45500l 0.05 0.50 0.040 0.030 0.50 11.0/ 7.50/ 0.50· Cu 1.5012.50 12.5 9.50 Cb 0.1010.50
501 tS501001 0.10 1.00 0.040 0.030 1.00 4.001 0.401 Min 6.00 0.65
502 tS502001 0.10 LOO 0.040 0.030 l.00 4.001 0.401 6.00 0.65
503 !S50300l 0.15 LOO 0.040 0.040 l.00 6.001 0.45/ 8.00 0.65
504 !S50400) 0.15 LOO 0.040 0.040 1.00 8.001 0.901 10.00 1.00
Note: The analyses listed in this table present the standard Specialty Steel Industry of the United States !SS! US) analy·ses for these grades. Variations from these ranges or limits for some of the elements are governed by the individual product specifications of the various technical societies.

Diameter: 114 to 314 in (6.35 to 19.05 mm)
HOT ROLLED RODS"
Square Size: 114 to 314 in (6.35 to 19.05 mm)b
Hexagon Size: 114 to 3/4 in (6.35 to 19.05 mm)0
Octagon Size: 114 to 314 in (6.35 to 19.05 mm)"
NOTE: Hot rolled or hot rolled annealed and pickled rods are produced in coils for subsequent cold drawing or cold rolling
"Square. hexagon and octagon hot rolled rods are produced with rounded corners 0 Measured across flats. or distance between parallel sides
Flat Width: 1116 to under 318 in (1.59 to under 9.53 mm) Thickness: 0.010 to under 3116 in (0.25 to under 4.76 mm)
Round Diameter: 112 in (12.70 mm) and under
"Measured across flats. or distance between parallel sides
COLD FINISHED WIRE
Square Size: 112 in (12.70 mm) and under•
Hexagon Size: 112 in (12.70 mm) and under"
Octagon Size: 112 in (12.70 mm) and under•
Fig. 3 -- Schematic representation of common classification of product by size, shape, condition and finish: hot rolled rods, cold finished wire.
("') I
-....J
..... .....
•'.'
'·
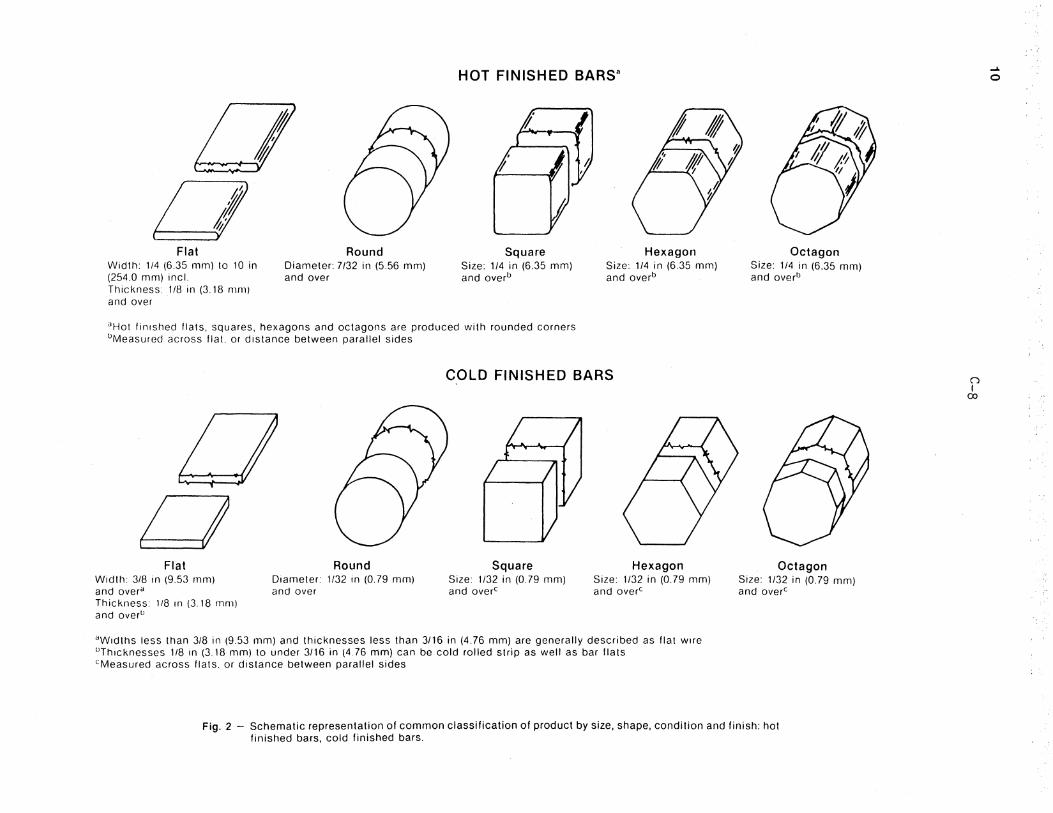
I _4 Flat
Width: 1/4 (6.35 mm) to 10 in (254.0 mm) incl. Thickness: 1/8 in (3.18 mm) and over
Round Diameter: 7/32 in (5.56 mm) and over
HOT FINISHED BARS"
,. f
Square Size: 1/4 in (6.35 mm) and overb
i/
Hexagon Size: 1/4 in (6.35 mm) and overb
"Hot finished flats, squares, hexagons and octagons are produced with rounded corners 0 Measured across flat. or distance between parallel sides
t::J Flat
Width: 3/8 in (9.53 mm) and over" Thickness: 1/8 111 (3.18 mm) and overu
Round Diameter: 1/32 in (0.79 mm) and over
COLD FINISHED BARS
Square Size: 1/32 in (0. 79 mm) and overc
Hexagon Size: 1/32 in (0.79 mm) and overc
"Widths less than 3/8 in (9.53 mm) and thicknesses less than 3/16 in (4.76 mm) are generally described as flat wire uTh1cknesses 1/8 in (3.18 mm) to under 3/16 in (4.76 mm) can be cold rolled strip as well as bar flats cMeasured across flats. or distance between parallel sides
Octagon Size: 1/4 in (6.35 mm) and overb
Octagon Size: 1/32 in (0.79 mm) and overc
Fig. 2 - Schematic representation of common classification of product by size, shape, condition and finish: hot finished bars, cold finished bars.
(") I
CXl
..... 0

D-1
APPENDIX D
SELECTED DATA RELATED TO THE ALLEGED MATERIAL INJURY AND THE CAUSAL RELATIONSHIP BETWEEN THE ALLEGED LTFV IMPORTS
AND THE ALLEGED MATERIAL INJURY


D-3
Table D-1 Stainless steel wire rod: SUlllllary data concerning the U.S. market, 1989-91, January-September 1991, and January-September 1992
(Quantity=short tons, value=l,000 dollars, unit values and unit labor costs are er ound eriod chan es= ercent exce t where noted
erio c anges
Item 1989 1990 1991 Jan. -sept. --1991 1992 1989-91 1989-90 1990-91
U.S. consumption quantity: Amount .................... . Producers' share 1/ ....... .
ImE~~~~f~~ .~~~:~'.~~: ...... . France .................. . India ................... .
Subtotal .............. . Other sources ........... .
Total. ................ . U.S. consumption value:
Amount .................... . Producers' share 1/ ....... .
ImE~~~~f~~.~~~:~'.~~: ...... . France .................. . India ................... .
Subtotal .............. . Other sources ........... .
.Total. ................ . U.S. importers' imports from--
Brazil: Imports quantity ........ . Im~orts value ........... . Unit value .............. .
France: Imports quantity ........ . Im~orts value ........... . Unit value .............. .
India: Imports quantity ........ . Im~orts value ........... . Unit value .............. .
Subject sources: Imports quantity ........ . Im~orts value ........... . Unit value .............. .
Other sources: Imports quantity ........ . Im~orts value ........... . Unit value .............. .
All sources: Imports quantity ........ . Im~orts value ........... . Unit value .............. .
U.S. producers'--Average capacity quantity .. Production c;!'!antity ....... . Capacit~ utilization!/ •... U.S. shipments:
Quantity ................ . Value ................... . Unit value ........ · ...... .
Export shipments: Quantity ................ .
~!1~~~~:~~:~~~~~.~:::::: Unit value ............. ..
Ending inventory quantity .. Inventory/shipments 1/ .... . Production workers .. 7 ..... . Hours worked (l,OOOs) ..... . Total comp. ($1,000) .•..... Hourly total compensation .. Productivity (pounds/hr.) .. Unit labor costs .......... . Net sales value ........... . COGS/sales 1/ ............. . Operating income Closs) ... . Op. income Closs)/sales !/.
127,885 81.3
1. 7 4.3
0 6.o
12.7 18.7
427,854 82.8
1.3 5.2
0 6.3
10.6 17 .2
2,145 5,687 $1.33
5,485 22.1.319
$<:.03
0 0
~/
7,630 28,007
$1. 84
16,297 45,513
$1_.40
23,927 73,519 $1. 54
259,568 100.1.937
,,8,9
103,958 354,335
$1.70
229 0.2 807
$1. 76 15,889
15.3 1,280 2,654
59,267 $22.33
59.9 $0.37
299,257 82.l
24,470 8.2
117.1.590 19.3
1. 7 3.9
.1 3.7
15.0 20.1
334,173 80.9
1. 3 4.6
.1 6.o
13.1 19.1
2,057 4,467 $1.09
4,547 15,467 $1.70
97 206
$1.06
6,701 20,140
$1. 50
17,642 43,791 $1.24
24,343 63,931 $1.31
256,624 91,199
35.5
93,247 270,242
$1.45
158 0.2 539
$1. 71 13,138
14.1 1,208 2,456
59,129 $24.08
59.8 $0.40
252,764 87.7
316 0.1
123.1,496 18.8
1.4 4.5 1.4 7.3
14.0 21.2
359,327 81. 4
1. 0 5.0 1.0 7.0
11.6 18.6
1,671 3,599 $1.08
5,564 18,034 $1.62
1,731 3,490 $1. 01
8,966 25,124 $1. 40
17,265 41,641 $1.21
26,231 66,765 $1.27
263,534 89.1.053
.:)3.8
97,265 292,562
$1.50
60 0.1 185
$1.54 10,365
10.6 1,248 2,499
62,461 $24.99
59.6 $0.42
249,553 91. 7
(7,774) (3.1)
88,915 80.1
0.9 3.2 1.1 3.2
14.7 19.9
261,129 82.5
0.6 4.0
. 7 5.3
12.2 17 .3
825 1,627 $0.99
2,871 10,337 $1.80
958 1,927 $1. 01
4,654 13,891 $1. 49
13,050 31,739 $1.22
17,704 45,630 $1.29
197,983 67,137
33.9
71,211 215,499
$1.51
58 0.1 179
$1.54 10,341
10.9 1,276 1,927
47,673 $24.74
57.1 $0.43
191,983 91. 7
(6,209) (3.2)
98,,596 10.3
2.8 7.1 3.1
13.o 16.7 29.7
264,,288 15.1
2.0 7.2 2.1
11.3 13.6 24.9
2,728 5,247 $0.96
6,967 19,000 $1.36
3,086 5,660 $0.92
12, 782 29,907 $1.17
16,512 35, 977 $1.09
29,294 65,884 $1.12
197' 973 69,415
35.1
69,302 198,404
$1.43
11 6/ 49
$2.23 9, 773
10.6 1,345 2,027
51,689 $25.50
60.6 $0.42
191,656 95.8
(15,600) (8.1)
-3.4 -2.5
-0.3 +0.2 +1.4 +i.3 +1.2 +2.3
-16.0 -1. 4
-0.3 -0.2 +1.0 +o.4 +1.0 +1.4
-22.1 -36.7 -18.7
+1.4 -19.2 -20.3
3/ '3'/ ~/
+17.5 -10 .3 -23.7
+5.9 -8.5
-13.6
+9.6 -9.2
-17.2
+1.5 -11.8 -5.1
-6.4 -17.4 -11.8
-73.8 -0.2
-77 .1 -12.5 -34.8 -4.6 -2.5 -5.8 +5.4
+11.9 -0.5
+12.5 -16.6 +9.6
-131. 8 -11.3
17 'Re~orted data' are in percent and 'period changes' are in percentage-point. 2/ An increase of less than 0.05 percentage points. '3'/ Not applicable. 4/ An increase of 1,000 percent or more. 3/ A decrease of less than 0.05 percent. b/ Positive figure, but less than significant digits displayed. ZI A decrease of 1,000 percent or more.
-8.1 -2.0
+O.l -0.4 +0.1 -o.3 +2.3 +2.0
-21.9 -1.9
2/ -076 +0.1 -o.5 +2.5 +l. 9
-4.1 -21.5 -18.1
-17 .1 -30.7 -16.4
3/ '3'! ~/
-12.2 -28.1 -18.1
+8.3 -3.8
-11.1
+l. 7 -13. 0 -14. 5
-1.1 -9.6 -3.3
-10.3 -23.7 -15.0
-31. 0 -O.l
-33.2 -3.2
-17 .3 -1.2 -5.6 -7.5 -0.2 +7.8 -0.2 +8.0
-15.5 +5.6
-98.7 -8.1
+5.0 -0.5
-0.4 +0.6 +1.3 +1.6 -1. 0 +o.5 +7.5 +0.6
-0.3 +0.4 +0.9 +1.o -1. 5 -o.6
-18.8 -19.4 -0.8
+22.4 +16.6 -4.7
4/ 4/
-479
+33.8 +24.7 -6.8
-2.l -4.9 -2.8
+7.8 +4.4 -3.1
+2.7 -2.4 -1. 7
+4.3 +8.3 +3.8
-62.0 -0.1
-65.7 -9.6
-21.1 -3.4 +3.3 +1.8 +5.6 +3.8 -0.3 +4.1 -1. 3 +4.0
7/ -372
Jan.-Sept. 1991-92
+10.9 -9.8
+1.8 +3.8 +2.1 +7.7 +2.1 +9.8
+1.2 -7.5
+1.4 +3.2 +1.4 +6.o +1.5 +7.3
+230.7 +222.5
-2.5
+142.7 +83.8 -24.3
+222.1 +193.7
-8.8
+174.6 +115.3 -21.6
+26.5 +13.4 -10.4
+65.5 +44.4 -12. 7
5/ +374 +1.2
-2.7 -7.9 -5.4
-81. 0 -0.1
-72.6 +44.3
-5.5 -0.3 +5.4 +5.2 +8.4 +3.1 +6.1 -2.9 -0.2 +4.1
-151.2 -4.9
Note.--Period changes are derived from the unrounded data. Period changes involving negative period data are positive if the amount of the negativity decreases and negative if the amount of the negativity increases. Because of rounding, figures may not add to the totals shown. Unit values and other ratios are calculated using data of firms supplying both numerator and denominator information. Part-year inventory ratios are annualized.
Source: Compiled from data submitted in response to questionnaires of the U.S. International Trade Commission and from official statistics of the U.S. Department of Commerce.

.:·· .. ·

.. ·~:: . . . .....
E-1
APPENDIX E
INCOME-AND-LOSS DATA ON THE TOLL OPERATIONS OF
TALLEY METALS TECHNOLOGY, INC.


E-3
Table E-1 Income-and-loss experience of Talley on its stainless steel wire rod toll operations, accounting years 1989-91, January-September 1991, and January-September 1992
* * * * * * *


F-1
APPENDIX F
COMMENTS RECEIVED FROM U.S. PRODUCERS ON THE IMPACT OF IMPORTS OF STAINLESS STEEL WIRE ROD FROM BRAZIL, FRANCE, AND INDIA
ON THEIR GROWTH, INVESTMENT, ABILITY TO RAISE CAPITAL, AND/OR EXISTING DEVELOPMENT AND PRODUCTION EFFORTS
... _:_,·· . .·-~:·: . . :· . .. . . ·. ' .. -.


F-3
* * * * * * *
