carbon, part 3, • carbon balance of ecosystems • …nature.berkeley.edu/biometlab/espm111/espm...
TRANSCRIPT

4/5/2013
1
ESPM 111 Ecosystem Ecology
Carbon, Part 3,Net Ecosystem Production
• Carbon Balance of Ecosystems
• NEP,NPP, GPP
• Seasonal Dynamics of Ecosystem Carbon Fluxes
• Carbon Flux Partitioning
• ‘Chain-saw’ and ‘Shovel’ Ecology
Dennis BaldocchiESPMUC Berkeley
ESPM 111 Ecosystem Ecology

4/5/2013
2
ESPM 111 Ecosystem Ecology
Law and Ryan, Biogeochemistry, 2005
Carbon Cycle:Above and Below Ground Links
ESPM 111 Ecosystem Ecology
Active Carbon/Water Flux Measurement Sites
www.fluxdata.org

4/5/2013
3
ESPM 111 Ecosystem Ecology
Published Data, April, 2011
GPP (gC m-2 y-1)
0 500 1000 1500 2000 2500 3000 3500 4000
0.00
0.01
0.02
0.03
0.04
0.05
0.06
What is the Range of Gross Primary Productivity?
ESPM 111 Ecosystem Ecology
2
max gg
PAR gC mGPP R LUE fpar
R mole C
7000 * MJ m-2 y-1 * (4.6/2) * 0.02 * 0.9 * 12 = 3477 gC m-2 y-1
Rg: incoming short wave radiationPAR: photosynthetically active radiation, 0.4 to 0.7 micronLUE: light use efficiencyfpar: fraction of absorbed PAR
Upper Limits of GPP

4/5/2013
4
FLUXNET 2007 Database
GPP at 2% efficiency and 365 day Growing Season
Potential and Real Rates of Gross Carbon Uptake by Vegetation:Most Locations Never Reach Upper Potential
tropics
GPP at 2% efficiency and 182.5 day Growing Season
How much Carbon do Ecosystems take up?Probability Distribution of Published NEE Measurements, Integrated Annually
Published Data, April, 2011
NEE (gC m-2 y-1)
-1000 -500 0 500 1000
0.000
0.002
0.004
0.006
0.008
0.010
0.012
0.014
0.016
n = 973mean = -165 +/- 253 gC m-2 y-1
4/5/2013
5
ESPM 111 Ecosystem Ecology
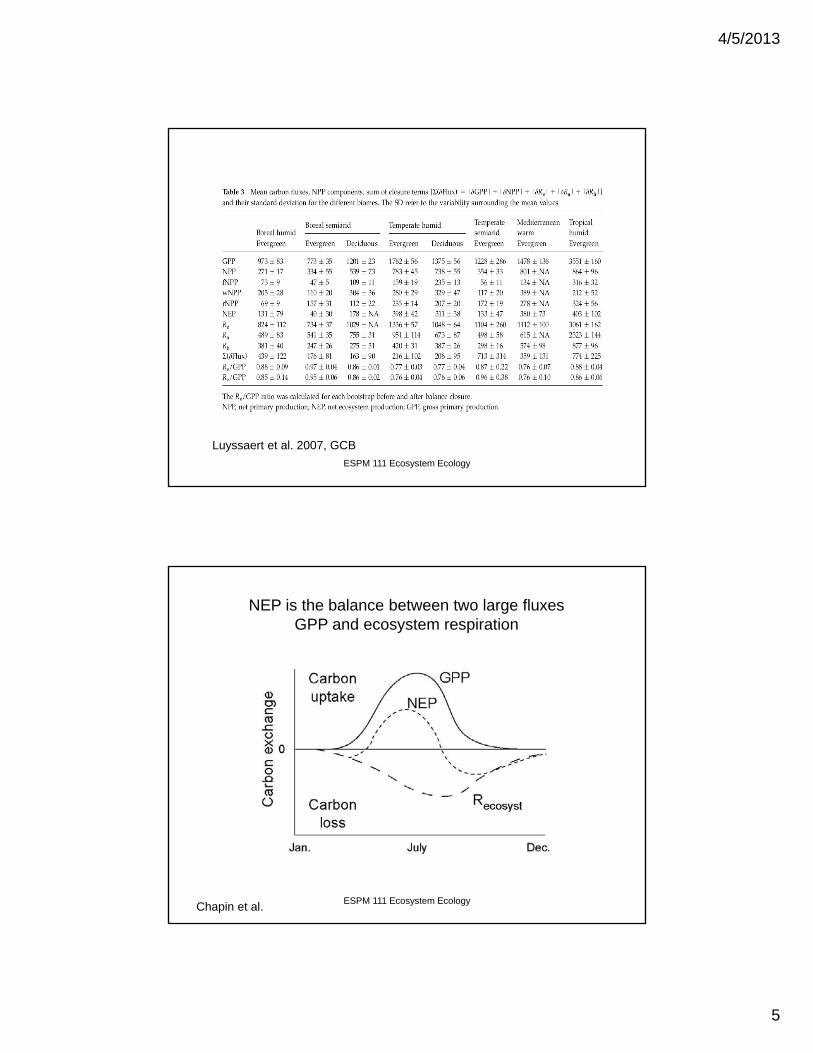
Luyssaert et al. 2007, GCB
ESPM 111 Ecosystem Ecology
NEP is the balance between two large fluxesGPP and ecosystem respiration
Chapin et al.

4/5/2013
6
ESPM 111 Ecosystem Ecology
Harvard Forest: 1991-2000
Day
0 50 100 150 200 250 300 350 400
NE
E (
kg h
a-1 d
-1)
-100
-50
0
50
100
Data of Wofsy et al; Urbanski et al 2007 JGR
Seasonal change in daily NEE for a temperate deciduous forest
ESPM 111 Ecosystem Ecology
d a y
0 5 0 1 0 0 1 5 0 2 0 0 2 5 0 3 0 0 3 5 0 4 0 0
Rec
o (
kgC
ha-1
d-1)
0
2 0
4 0
6 0
8 0
1 0 0
H a r v a r d F o r e s t , 1 9 9 2 - 2 0 0 2
d a y
0 5 0 1 0 0 1 5 0 2 0 0 2 5 0 3 0 0 3 5 0 4 0 0
GP
P (
kgC
ha-1
d-1
)
- 1 4 0
- 1 2 0
- 1 0 0
-8 0
-6 0
-4 0
-2 0
0
Data of Wofsy et al; Urbanski et al. JGR 2008
Season Course in Daily GPP and Reco for a temperate deciduous forest

4/5/2013
7
ESPM 111 Ecosystem Ecology
Day
0 50 100 150 200 250 300 350
FN (
gC
m-2
d-1
)
-8
-6
-4
-2
0
2
4
Deciduous forest Evergreen forest Macchia Perennial grassland Annual grassland Crop (wheat)Tundra
Seasonal Patterns Vary with Plant Functional Type
Length of Growing Season, days
50 100 150 200 250 300 350
FN (
gC
m-2
yr-1
)
-1000
-800
-600
-400
-200
0
200
Temperate and Boreal Deciduous Forests Deciduous and Evergreen Savanna
Baldocchi, Austral J Botany, 2008
Net Ecosystem Carbon Exchange of Deciduous Forests Scales with Length of Growing Season

4/5/2013
8
Baldocchi, Austral J Botany, 2008
Does Net Ecosystem Carbon Exchange Scale with Photosynthesis?
FA (gC m-2 y-1)
0 500 1000 1500 2000 2500 3000 3500 4000
FN (
gC
m-2
y-1
)
-1000
-750
-500
-250
0
250
500
750
1000
Ecosystems with greatest GPP don’t necessarily experience greatest NEE
FA (gC m-2 y-1)
0 500 1000 1500 2000 2500 3000 3500 4000
FR (
gC m
-2 y
-1)
0
500
1000
1500
2000
2500
3000
3500
4000
UndisturbedDisturbed by Logging, Fire, Drainage, Mowing
Baldocchi, Austral J Botany, 2008
Ecosystem Respiration Scales with Ecosystem Photosynthesis,But with an Offset by Disturbance
4/5/2013
9
Interannual Variability in FN
d FA/dt (gC m-2 y-2)
-750 -500 -250 0 250 500 750 1000
d F
R/d
t (g
C m
-2 y
-2)
-750
-500
-250
0
250
500
750
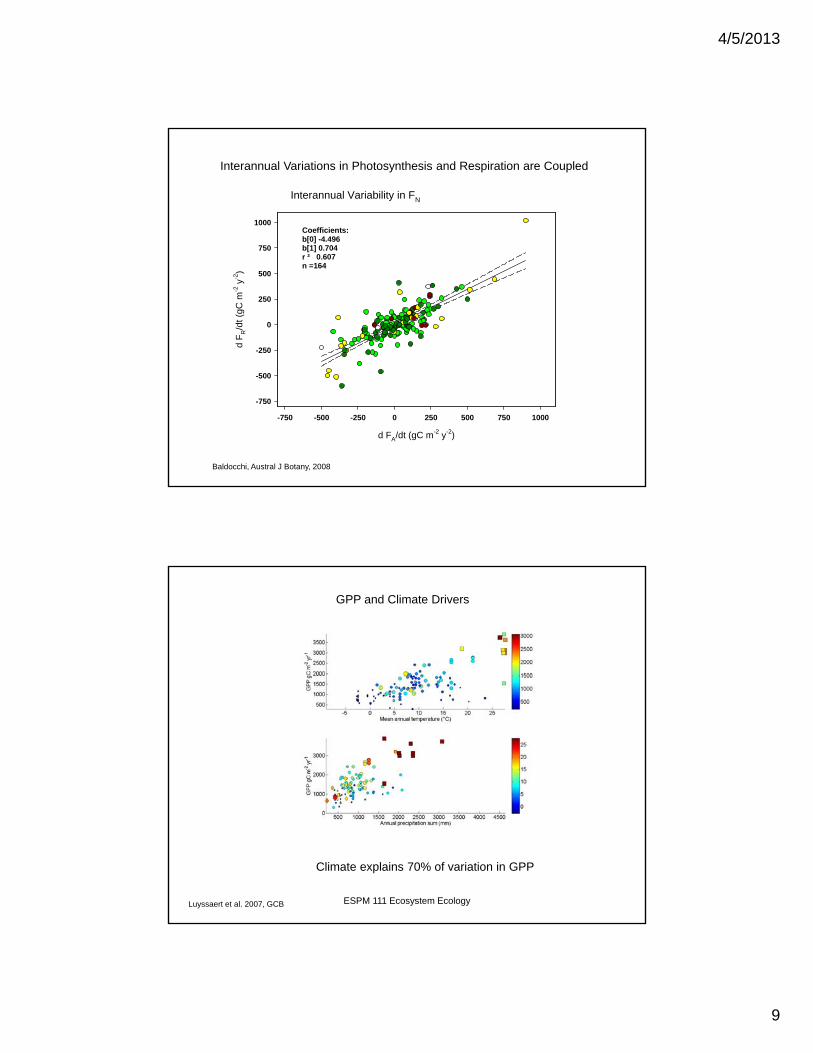
1000Coefficients:b[0] -4.496b[1] 0.704r ² 0.607n =164
Baldocchi, Austral J Botany, 2008
Interannual Variations in Photosynthesis and Respiration are Coupled
ESPM 111 Ecosystem EcologyLuyssaert et al. 2007, GCB
GPP and Climate Drivers
Climate explains 70% of variation in GPP

4/5/2013
10
ESPM 111 Ecosystem Ecology
NPP and Climate Drivers
Luyssaert et al. 2007, GCB
Climate explains 35% of variation in NPP
ESPM 111 Ecosystem Ecology
NEP and Climate Drivers
Luyssaert et al. 2007, GCB
Climate explains 5% of variation in NEP
4/5/2013
11
ESPM 111 Ecosystem Ecology
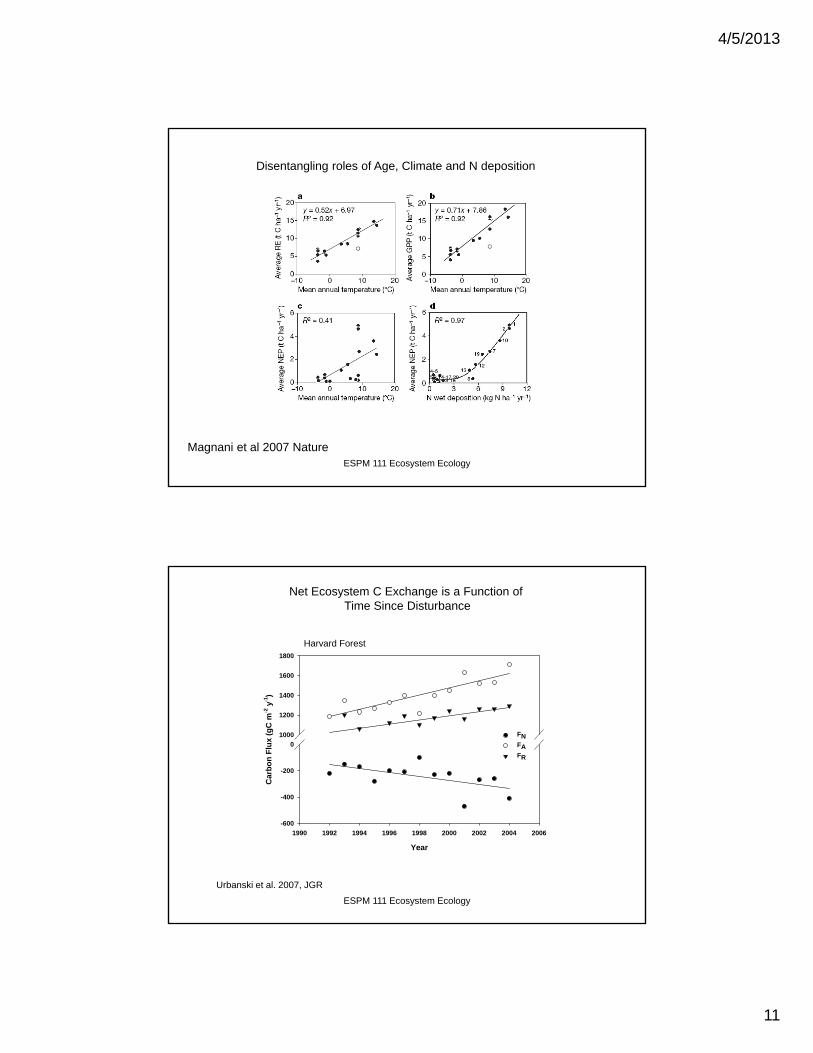
Magnani et al 2007 Nature
Disentangling roles of Age, Climate and N deposition
ESPM 111 Ecosystem Ecology
Harvard Forest
Year
1990 1992 1994 1996 1998 2000 2002 2004 2006
Car
bo
n F
lux
(gC
m-2
y-1
)
-600
-400
-200
0
1000
1200
1400
1600
1800
FNFAFR
Urbanski et al. 2007, JGR
Net Ecosystem C Exchange is a Function ofTime Since Disturbance

4/5/2013
12
ESPM 111 Ecosystem EcologyHe et al. 2012 GBC
Net Primary Production and Stand Age
ESPM 111 Ecosystem Ecology
On to Ecosystem Respiration
4/5/2013
13
ESPM 111 Ecosystem Ecology
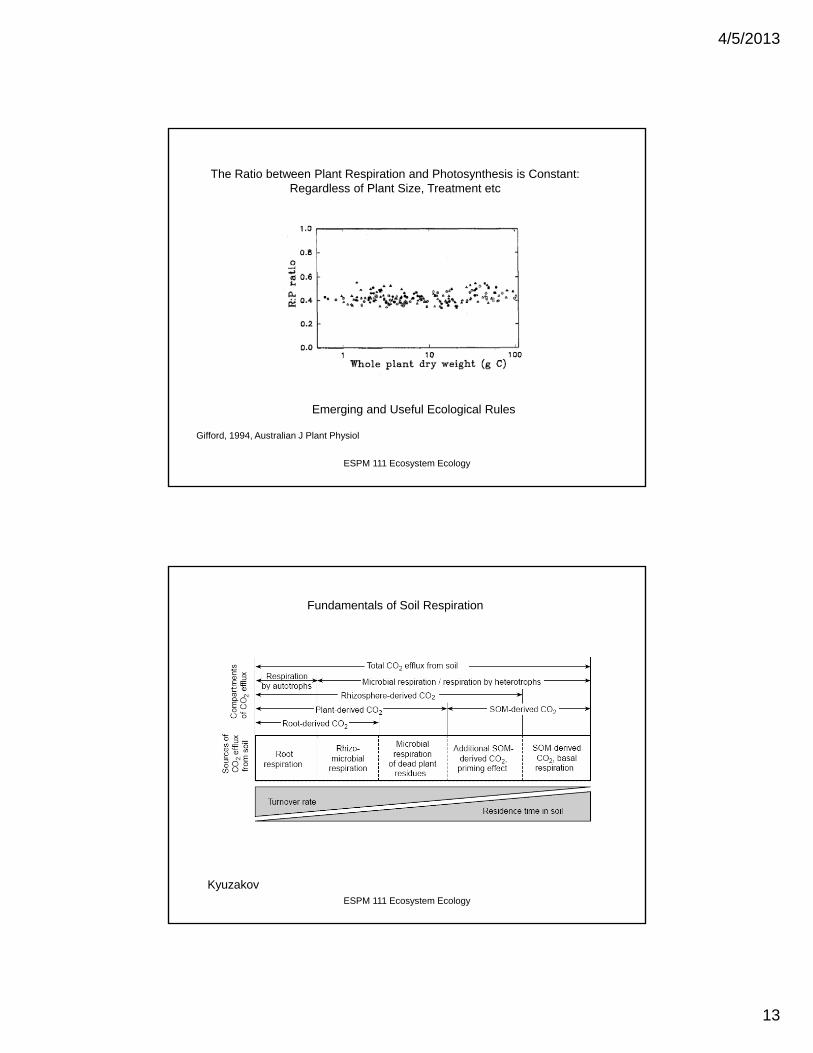
Gifford, 1994, Australian J Plant Physiol
The Ratio between Plant Respiration and Photosynthesis is Constant:Regardless of Plant Size, Treatment etc
Emerging and Useful Ecological Rules
ESPM 111 Ecosystem Ecology
Kyuzakov
Fundamentals of Soil Respiration

4/5/2013
14
ESPM 111 Ecosystem Ecology
deForest et al 2006 IntJ Biomet
Soil Respiration and Temperature
Note how Variance increases with T, especially after Ps starts!
ESPM 111 Ecosystem Ecology
Xu and Qi, 2001, Global Change Biology
Soil Respiration, Temperature and Soil Moisture

4/5/2013
15
ESPM 111 Ecosystem Ecology
Xu and Qi, 2001, Global Change Biology
Soil Respiration and Soil Moisture
ESPM 111 Ecosystem Ecology
Roles of Drought and Temperature on Soil Respiration
Reichstein et al. 2003, GBC

4/5/2013
16
ESPM 111 Ecosystem Ecology
Environmental Controls on Respiration:Temperature, Soil Moisture, Growth/Reproduction, Rain-Induced
Microbial Activity
Soil volumetric water content (m3 m-3)
0.0 0.1 0.2 0.3 0.4
Rec
o/R
ref
0.0
0.5
1.0
1.5
2.0Fast growth period data
Rain pulse
Xu + Baldocchi, 2003 AgForMet
ESPM 111 Ecosystem Ecology
Respiration: Temperature and acclimation
Enquist et al. 2003, Nature
Respiration of a coldBoreal Ecosystem, at 10 C,Is similar to a warm TemperateEcosystem at 20 C

4/5/2013
17
ESPM 111 Ecosystem Ecology
Soil tempreture (oC)
30 35 40 45 50
0.15
0.20
0.25
0.30
0.35
0.40
0.45
0.50
14:50h
6h
Fo=0.037e0.0525T, Q10=1.69, R2=0.95
Tonzi Open areas
Soil temperature (oC)
25 30 35
1.1
1.2
1.3
1.4
1.5
1.6
1.7
Under treesDOY 211
Fu=0.337e0.0479T, Q10=1.61, R2=0.80
20h
6h
12:50h12h
16h
Tonzi Under trees
10h
24h
Tang, Baldocchi, Xu, 2005, GCB
Respiration and Temperature:A role for fast-photosynthesis
ESPM 111 Ecosystem Ecology
Raich 2000 Tellus
On Annual Scales Soil Respiration Scales with Photosynthesis
Janssens et al 2001 GCB

4/5/2013
18
ESPM 111 Ecosystem Ecology
Rain Pulses: Heterotrophic Respiration
Days After Rain Pulse
-10 -5 0 5 10 15 20 25 30
C E
fflux
(gC
m-2
d-1
)
0
1
2
3
4
5
8 mm 12.7 mm61 mm12 mm3 mm
Xu, Baldocchi, Tang, 2004, GBC
Photodegradation
ESPM 111 Ecosystem EcologyAustin et al 2010 PNAS

4/5/2013
19
ESPM 111 Ecosystem Ecology
Concluding Points
GPP scales with Available Sunlightso there are upper Limits to GPP, set by Length of Growing Season,Temperature and Water
Most (80%) Assimilated Carbon is lost byAutotrophic and HeterTrophic Respiration
Net Carbon Fluxes are a Function of Weather, Structure and FunctionAnd Time Since Disturbance
Soil Respiration tied to Temperature and Moisture, and recent Photosynthesis…Rain can Induce Pulses!
ESPM 111 Ecosystem Ecology
‘Chain-Saw’ Carbon Balance, 101
C
tGains Losses
Gains GPP
Losses spiration LitterFall
Herbivory RootTurnover
VOC Emissions Fire Harvest
Re
_ )
C
tWood Soilannual C C| ~

4/5/2013
20
ESPM 111 Ecosystem EcologyLitton et al., 2007
Carbon Allocation of Forests
ESPM 111 Ecosystem Ecology
But Partitioning of Carbon is Poorly related to Biomass
Litton et al., 2007

4/5/2013
21
ESPM 111 Ecosystem Ecology
NPP Biometry
• NPP=GPP-Ra
• NPP=Live mass increment (L) + Detritus (D) + Herbivory (H)
• NEP = (L + D +H)-Rhetero
• Soil Carbon Store=Detritus-Rhetero
• dCarbon = Wood Increment + Soil Carbon Store
• NEP ~ dCarbon– H=0
ESPM 111 Ecosystem Ecology
Caveat Emptor
• Few of the NPP components are measured, or measured well, in practice– Litterfall– Bole Increment– Labile Carbon is not measured in wood increment– ANPP– Convert bole increment to gC– Small diameter trees ignored, < 10 cm diameter– Below ground components often ignored

4/5/2013
22
ESPM 111 Ecosystem Ecology
Gough et al 2008 AgForMet
Biometry and Eddy Covariance NEP converges on Long Time Scales
ESPM 111 Ecosystem Ecology
Curtis et al, 2002, AgForMet
•NEP,ec=GPP-Reco NEP = (L + D +H)-Rhetero
4/5/2013
23
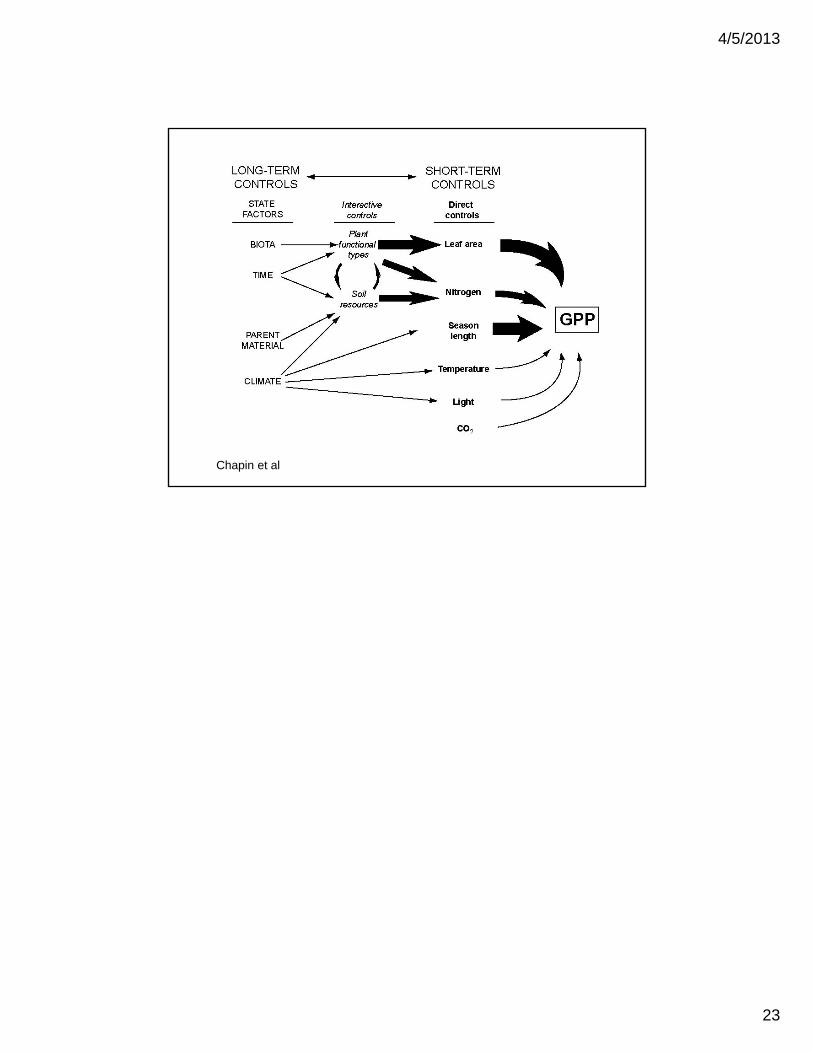
Chapin et al