carbon nanomaterials for energy storage, actuators … · carbon nanomaterials for energy storage,...
TRANSCRIPT

Carbon Nanomaterials for Energy Storage, Actuators
and Environmental Applications
by
Chengwei Wang
A Dissertation Presented in Partial Fulfillment
of the Requirements for the Degree
Doctor of Philosophy
Approved September 2015 by the
Graduate Supervisory Committee:
Candace K. Chan, Chair
Sefaattin Tongay
Qing Hua Wang
Dong Seo
ARIZONA STATE UNIVERSITY
December 2015
i
ABSTRACT
Carbon nanomaterials have caught tremendous attention in the last few decades due to
their unique physical and chemical properties. Tremendous effort has been made to
develop new synthesis techniques for carbon nanomaterials and investigate their
properties for different applications. In this work, carbon nanospheres (CNSs), carbon
foams (CF), and single-walled carbon nanotubes (SWNTs) were studied for various
applications, including water treatment, energy storage, actuators, and sensors.
A facile spray pyrolysis synthesis technique was developed to synthesize individual
CNSs with specific surface area (SSA) up to 1106 m2/g. The hollow CNSs showed
adsorption of up to 300 mg rhodamine B dye per gram carbon, which is more than 15
times higher than that observed for conventional carbon black. They were also evaluated
as adsorbents for removal of arsenate and selenate from water and displayed good
binding to both species, outperforming commercial activated carbons for arsenate
removal in pH > 8. When evaluated as supercapacitor electrode materials, specific
capacitances of up to 112 F/g at a current density of 0.1 A/g were observed. When used
as Li-ion battery anode materials, the CNSs achieved a discharge capacity of 270 mAh/g
at a current density of 372 mA/g (1C), which is 4-fold higher than that of commercial
graphite anode.
Carbon foams were synthesized using direct pyrolysis and had SSA up to 2340 m2/g.
When used as supercapacitor electrode materials, a specific capacitance up to 280 F/g
was achieved at current density of 0.1 A/g and remained as high as 207 F/g, even at a
high current density of 10 A/g.
ii
A printed walking robot was made from common plastic films and coatings of
SWNTs. The solid-state thermal bimorph actuators were multifunctional energy
transducers powered by heat, light, or electricity. The actuators were also investigated for
photo/thermal detection. Electrochemical actuators based on MnO2 were also studied for
potential underwater applications.
SWNTs were also used to fabricate printable electrodes for trace Cr(VI) detection,
which displayed sensitivity up to 500 nA/ppb for Cr(VI). The limit of detection was
shown to be as low as 5 ppb. A flow detection system based on CNT/printed electrodes
was also demonstrated.

iii
ACKNOWLEDGEMENTS
I would like to thank my advisor, Prof. Michael J. O’Connell, for his instruction,
encouragement, and full support. Instead of an advisor, Mike was more like a friend who
always wanted to share generously. Mike’s enthusiasm and patience never decreased when
he taught me knowledge and skills. I really appreciate his encouragement and trust for
letting me keep trying new things. I really value the time working with Mike and his
friendship during the early stage of my graduate career.
I would also like to thank my advisor, Prof. Candace K. Chan, for her guidance and help
during those hard times in the last two years. I really admire Candace’s strong will, which
also kept encouraging me to move forward. Her excellent writing skills have always done
magic to my manuscripts and benefited me a lot in improving my English. I feel very
fortunate to have been one of Candace’s first Ph.D. students. And as a smart and diligent
person, I am sure she will have a great success in her faculty career.
I would like to thank my dissertation committee, Prof. Sefaattin Tongay, Prof. Qing Hua
Wang, and Prof. Don Seo, for their valuable suggestions on my research and their generous
time for my comprehensive exam and dissertation defense.
I would like to thank the Fulton Schools of Engineering, the Salt Research Project
(SRP)/ASU Joint Research Program, and the School for Engineering of Matter, Transport
and Energy University Graduate Fellowship for funding support during my Ph.D.
I would like to thank all the collaborators in my research. Thanks to Prof. Kwai S. Chan
from Southwest Research institute for his help with the calculation in the printed active
origami project. Thanks to Prof. Vilas G. Pol and Dr. Vinodkumar Etacheri from Purdue
University for their help with the Li-ion battery test in CNS for Li-ion battery project. I

iv
would also like to thank Prof. Terry L. Alford and Pai Liu for their assistance with ink jet
printer and Kelsey M. Keberle for her assistance with laser cutting stencils. I would like to
thank Man Li for her work on Se/As removal with CNSs and Ran Zhao for her help with
XPS measurement. I would also like to thank Chengchen Guo for his assistance with
Raman and TGA measurements.
I gratefully acknowledge the use of facilities within the LeRoy Eyring Center for Solid
State Science, the Goldwater Environmental Laboratory at Arizona State University. I
would like to thank Karl Weiss, Dr. Jun Wu, David Wright, Timothy Karcher, Kenneth
Mossman, Sisouk Phrasavath, Thomas Colella, and Sara Ryan for their help with
equipment training and sample tests.
I would like to thank my classmates and group members for their friendship, help, and
support. It has been my pleasure to work with my group members: Takayuki Nosaka, Brett
Yost, Benjamin Zimmerman, Emily D. Sutton, Eric Kincaid, Katelyn Keberle, Rodrigo
Mendez, Sivan Markowitz, Heeman Ham, Jake Graser, Yuan Wang, Sijie Yang, Ting Yang,
Qian Cheng, Ran Zhao, Man Li, and Dr. Ying Li. They helped and taught me a lot for my
research. I would also like to thank my other ASU classmates: Ruohan Zhang, Chengchen
Guo, Shuoxing Jiang, Jie Ding, Shengke Zhang, Evan Chen, Jia Xu, Hongen Xie, Xinhao
Zhao, Jing Lu, Desai Zhang, Yuanyu Ma, Minglu Liu, Lei Ying, and Datong Yuchi, who
helped me a lot and made my four years in ASU memorable.
Finally, I would like to express my most gratitude to my parents for their endless
unconditional love and support. I would also like to thank my sister, Shanyun, for taking
care of our parents when I was absent. Special thanks to Tandy for her love and support.

v
TABLE OF CONTENTS
Page
LIST OF TABLES ............................................................................................................ IX
LIST OF FIGURES ........................................................................................................... X
LIST OF PUBLICATIONS ............................................................................................ XVI
CHAPTER
1 INTRODUCTION .................................................................................................. 1
1.1 Carbon Nanomaterials .............................................................................................. 1
1.2 Introduction to the Applications................................................................................ 5
1.2.1 Dye Adsorption .................................................................................................. 5
1.2.2 Removal of Arsenate and Selenate .................................................................... 5
1.2.3 Supercapacitors .................................................................................................. 6
1.2.4 Lithium-Ion Batteries ....................................................................................... 10
1.2.5 Actuators ...........................................................................................................11
1.2.6 Chromium(VI) Detection ................................................................................. 12
1.3 Materials Characterization ...................................................................................... 13
1.3.1 Electron Microscopy ........................................................................................ 13
1.3.2 X-Ray Diffraction ............................................................................................ 14
1.3.3 X-Ray Photoelectron Spectroscopy ................................................................. 15
1.3.4 Raman Spectroscopy ........................................................................................ 15
1.3.5 Ultraviolet–Visible Spectroscopy .................................................................... 16
1.3.6 Thermal Gravimetric Analysis ......................................................................... 16
vi
CHAPTER Page
1.3.7 Gas Adsorption-Desorption Isotherms for Surface Area and Porosity Analysis
................................................................................................................................... 17
2 SYNTHESIS OF POROUS CARBON NANOSPHERES AND THEIR
APPLICATIONS............................................................................................................... 20
2.1 Introduction to Spray Pyrolysis .............................................................................. 20
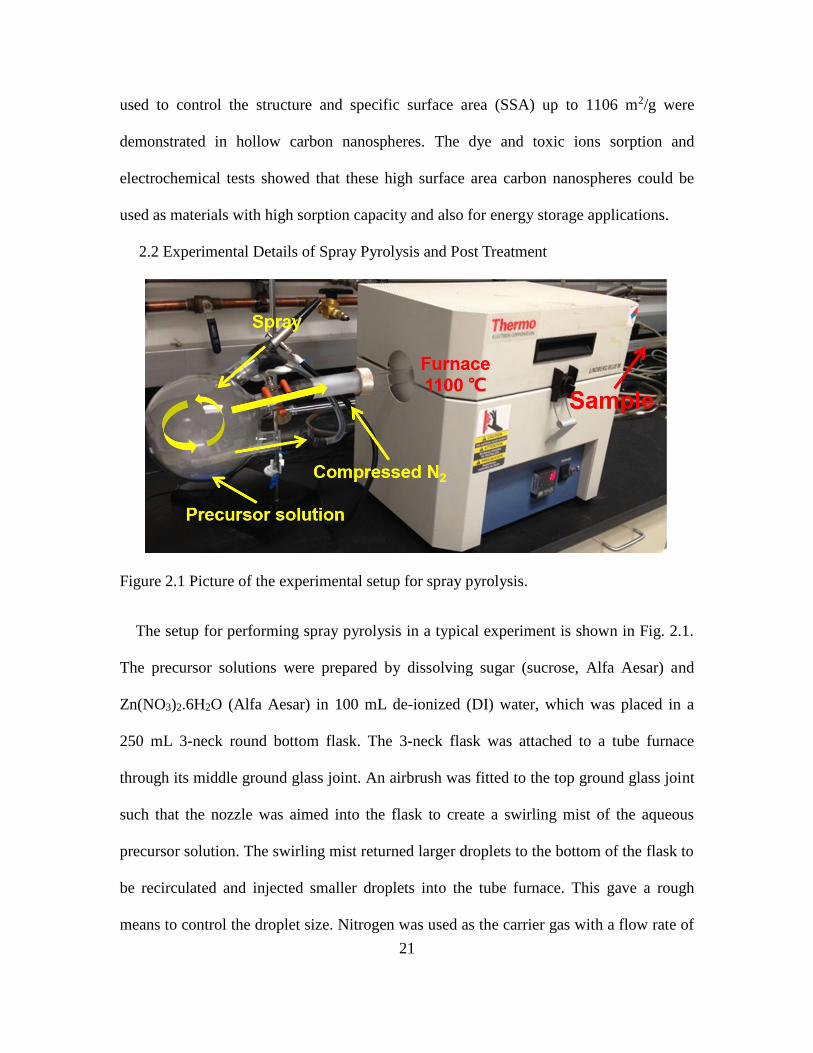
2.2 Experimental Details of Spray Pyrolysis and Post Treatment ................................ 21
2.3 Effect of Precursor Concentration on Particle Size ................................................ 22
2.4 The Role of Metal Salt on Carbon Nanospheres Formation and Morphology ....... 28
2.5 Characterization and Applications of Carbon Nanospheres from Higher Precursor
Concentrations .............................................................................................................. 35
2.5.1 The Characterization of Carbon Nanospheres ................................................. 35
2.5.2 Application of Carbon Nanospheres as an Adsorbent for Dye Removal ......... 38
2.5.3 Application of Carbon Nanospheres as an Adsorbent for Removal of Arsenate
and Selenate from Water ........................................................................................... 40
2.5.4 Application of Carbon Nanospheres for Supercapacitors ................................ 47
2.5.5 Application of Carbon Nanospheres for Lithium Ion Battery ......................... 50
2.6 Conclusions for Studies on Carbon Nanospheres ................................................... 62
3 SYNTHESIS OF POROUS CARBON FOAM AND THEIR APPLICAIONS ... 63
3.1 Introduction to Porous Carbon foam....................................................................... 63
3.2 Experimental Details of Direct Pyrolysis and Post Treatment................................ 64
3.3 The Effect of Precursor Ratio on Morphology and Specific Surface Area of Carbon
Foam ............................................................................................................................. 67

vii
CHAPTER Page
3.4 The Role of ZnO on the Specific Surface Area of Carbon Foam ........................... 71
3.5 The Effect of Annealing on the Specific Surface Area of Carbon Foam ................ 72
3.6 Electrochemical Performance of the Carbon Foams as Supercapacitor Electrodes 76
3.6.1 Electrochemical Measurement Details ............................................................ 76
3.6.2 Electrochemical Performance .......................................................................... 76
3.7 Conclusions ............................................................................................................. 84
4 BIMORPH ACTUATORS .................................................................................... 85
4.1 Introduction to Bimorph Actuators ......................................................................... 85
4.2 Experiment Details of Thermal Bimorph actuators ................................................ 87
4.2.1 Printing Techniques and CNT Ink Preparation ................................................ 87
4.2.1.1 Stencil Mask.............................................................................................. 87
4.2.1.2 Ink-Jet ....................................................................................................... 88
4.2.1.3 Screen Printing .......................................................................................... 88
4.2.2 Plastic Film Selection ...................................................................................... 89
4.3 Characterization of Thermal Bimorph Actuators .................................................... 91
4.3.1 Temperature and Power Relation of Active Beam Calculation ....................... 92
4.3.2 Force of an Active Beam .................................................................................. 97
4.3.3 Force Measurement and Durability Cycling Data ......................................... 100
4.4 The Applications as Printed Active Origami ........................................................ 103
4.5 Applications as Photo/Thermal Detectors ............................................................. 106
4. 6 Electrochemical Actuators .................................................................................... 111
4.7 Conclusions ............................................................................................................115

viii
CHAPTER Page
5 CARBON NANOTUBE ELECTRODES FOR LOW-PPB-LEVEL
CHROMIUM(VI) DETECTION .....................................................................................117
5.1 Introduction to Cr(VI) Detection with Amperometric Technique .........................117
5.2 Experimental Details ..............................................................................................118
5.2.1 Carbon Nanotube Paste ...................................................................................118
5.2.2 Fabrication of Carbon Nanotube Electrodes ...................................................118
5.2.3 Electrochemical Measurements ......................................................................118
5.2.4 Water Samples .................................................................................................119
5.3 Characterization of CNT Electrode for Cr(VI) Detection .................................... 120
5.4 CNT/Filter Paper Flexible Electrodes for Cr(VI) Detection ................................. 124
5.5 CNT Coated Printed Electrodes for Cr(VI) Detection .......................................... 126
5.6 Flow Detection System with CNT/Printed Electrodes and H2O2 Reduction Method
..................................................................................................................................... 130
5. 7 Conclusion ........................................................................................................... 134
6 REFERENCES ................................................................................................... 136

ix
LIST OF TABLES
Table Page
2.1 Specific Surface Area and Pore Volume of Carbon Nanospheres Measured from BET
................................................................................................................................... 38
4.1 Material Parameters for the Temperature-Power Computation .................................. 95
5.1 Descriptions for the Water Samples .......................................................................... 120

x
LIST OF FIGURES
Figure Page
1.1 Number of Articles Published in Different Years About Carbon Nanomaterials.2,3 ..... 1
1.2 Structure of this dissertation. ........................................................................................ 4
1.3 Electrochemical Characteristics of Capacitors.68 .......................................................... 8
1.4 Schematic of Electrochemical Double-Layer Capacitor and Equivalent Circuit. ........ 9
1.5 Types of Physisorption Isotherms.110 .......................................................................... 18
2.1 Picture of the Experimental Setup for Spray Pyrolysis.. ............................................ 21
2.2 SEM Image and Size Distribution of Carbon Nanospheres. ....................................... 23
2.3 Characterization of Carbon Nanospheres from 1g:1g Precursors............................... 25
2.4 HRTEM of Nanodiamond-Derived Carbon Onions and Carbon Nanospheres Annealed
at Same Condition. .................................................................................................... 27
2.5 TEM Images of as-Prepared Carbon Nanospheres ..................................................... 29
2.6 TEM Images of Carbon Nanospheres ......................................................................... 30
2.7 TEM Images of Carbon Nanospheres After HCl Etching. ......................................... 31
2.8 Illustration of the carbon nanospheres formation mechanism. ................................... 32
2.9 SEM Images and XRD of Carbon Nanospheres Synthesized from Different Carbon and
Metal Salt Precursors After HCl Treatment. ............................................................. 34
2.10 SEM Image and XPS of As-Prepared Carbon Nanospheres ..................................... 35
2.11 SEM Images of Carbon Nanospheres. ...................................................................... 35
2.12 N2 Adsorption-Desorption Isotherms and Pore Size Distribution of Different Carbon
Nanospheres. ............................................................................................................. 37

xi
Figure Page
2.13 Photographs of 100 mg/L RB Solution Under Excitation with 405 nm Laser, Carbon
Nanospheres Suspended in the RB Solution, and RB Solution after Carbon
Nanospheres Removed Solution with Excitation by 405 nm Laser. RB Adsorption
Abilities of Different Samples. ................................................................................. 38
2.14 Calibration Curve for Used to Determine Concentration of RB using UV-vis
spectroscopy. Insets Show the Corresponding SEM Images. ................................... 40
2.15 Schematic of Formation Mechanism for Synthesis of Microporous Carbon
Nanospheres. SEM and TEM Images of Carbon Nanospheres. ............................... 42
2.16 XRD, Raman Spectra, N2-Sorption Curve with Pore Size Distribution the Inset, and
Zeta Potential Measurement for PAC Compared with Carbon Nanospheres. .......... 43
2.17 Percentage Removed of 1 ppm As(V) and 1 ppm Se(VI) on Carbon Nanospheres
Compared to PAC and GAC. .................................................................................... 45
2.18 Performance of Carbon Nanosphere Supercapacitors in 6 M KOH Aqueous
Electrolyte. ................................................................................................................ 49
2.19 Cyclic Voltammograms (CVs) and Galvanostatic Charge/Discharge Curves for
Supercapacitor Made of Carbon Nanospheres. ......................................................... 50
2.20 Schematic of the Synthesis of Amorphous and Turbostratic Porous Carbon Spheres
................................................................................................................................... 51
2.21 XRD Patterns and Raman Spectra of Porous Carbon Spheres Annealed at 1200 °C and
2300 oC...................................................................................................................... 52
2.22 SEM, Low Resolution TEM, and High Resolution TEM Images of Porous Carbon
Spheres ...................................................................................................................... 53
xii
Figure Page
2.23 N2 Adsorption-Desorption Isotherm and Pore Size Distribution of Porous Carbon
Spheres ...................................................................................................................... 54
2.24 Cyclic Voltammogram of Porous Carbon Spheres ................................................... 55
2.25 First and Second Cycle Discharge and Charge Voltage Profiles of Porous Carbon
Spheres ...................................................................................................................... 56
2.26 Electrochemical Performances of Porous Carbon Spheres Annealed at 1200 oC, 2300
oC, and Commercial Graphite ................................................................................... 58
2.27 SEM Images and Raman Spectrum of Porous Carbon Spheres Annealed at 2300 oC
before and after 100 Galvanostatic Cycles. .............................................................. 60
3.1 Synthesis Process and Schematic Illustration of Carbon Foam. Typical TEM Image of
Carbon Foam. the Molecular Schematic Illustration for the Corresponding Steps. . 65
3.2 TGA Results for 1g:2g Carbon Foam Annealed in N2 (Red) and Burning in Air (Blue).
................................................................................................................................... 67
3.3 SEM Images of Carbon Foams after Annealing at 1200 oC for 2 h. .......................... 67
3.4 N2 Adsorption-Desorption Isotherms and Pore Size Distributions of Carbon Foam.. 68
3.5 TEM Images at Different Magnifications of Carbon Foams. ..................................... 70
3.6 N2 Adsorption-Desorption Isotherms and the Corresponding Pore Size Distributions
of 1g:2g Carbon Foam Treated with Different Conditions. ...................................... 71
3.7 N2 Adsorption-Desorption Isotherms and the Corresponding Pore Size Distributions
of the 1g:2g Carbon Foam Annealed at Different Temperatures. ............................. 73
3.8 TEM Images of Carbon Foams Annealed at Different Temperatures. ........................ 74
3.9 Raman Spectra of 1g:2g Carbon Foam Annealed with Different Temperatures. ....... 75
xiii
Figure Page
3.10 Performance of Supercapacitors with Carbon Foams Electrodes in 1 M H2SO4
Aqueous Electrolyte. ................................................................................................. 77
3.11 N2 Adsorption-Desorption Isotherms and the Corresponding Pore Size Distributions
of Carbon Foams Made from Different Sugar to Zn(NO3)2.6H2O Ratio and Annealed
at 600 oC for 5 h. ....................................................................................................... 78
3.12 EIS Measurement of Supercapacitors Made of Different Carbon Foams Annealed
with Different Temperatures. .................................................................................... 80
3.13 Cycle Life of Supercapacitor Made with 1g:2g 700 oC Carbon Foam at a Current
Density of 10 A/g. ..................................................................................................... 82
3.14 CV Curves for Supercapacitors Made of Different Carbon Foams. ......................... 82
4.1 The Selection of Polymer Films Was Based on the Expansion Coefficient (α) and the
Modulus. an Actuator Fabricated Using an Acetal Film Substrate, Before and after
Power Is Applied. ...................................................................................................... 90
4.2 Schematic of a Cantilever Composite Beam Comprised of a CNT Layer on a Plastic
Film. .......................................................................................................................... 92
4.3 Comparison of Experimental (Solid) and Calculated (Dashed) Results. .................... 96
4.4 The Durability Test of the Actuator. .......................................................................... 102
4.5 Fabrication Process for PAO. a Printed Robot, a Dragonfly, and a Rotating Acetal
Actuators. ................................................................................................................ 105
4.6 Schematic for the 555 Timer Chip Control Circuit for the Robot. Voltage Divider
Circuit Schematic to Measure the Resistance of the Actuator. ............................... 105
xiv
Figure Page
4.7 The Dependence of Factor k on the Ratio of Thickness, m, and the Ratio of Modulus, n.
................................................................................................................................. 107
4.8 Photos of a Micro-Actuator (~ 1 mm × 200 μm) Responding to a 10 mW 405 nm Laser
Beam. ...................................................................................................................... 108
4.9 Schematic, Photos and Characterization of a Photo/Thermal Sensor. ....................... 111
4.10 Schematic for the fabrication of MnO2/Au/PDMS electrochemical actuator. ........112
4.11 SEM Images of ZnO Nanowires, Au Coated ZnO Nanowires, Porous Au Tubes
Network, and MnO2 Deposited on the Porous Au Tubes Network..........................113
4.12 MnO2/Au/PDMS Actuators. ....................................................................................114
5.1 Sample Sites for SRP Water Tests. .............................................................................119
5.2 SEM Image of CNT on FTO Glass. .......................................................................... 120
5.3 CV Curves of Different Electrodes in Different Concentrations of Cr(VI) Solution.
................................................................................................................................. 121
5.4 Amperometric Response of CNT Electrode at 0.21 V When Different Concentrations
of Cr(VI) Were Add into 0.1 M HCl. ...................................................................... 122
5.5 The Reduction Current of Different Electrodes Versus Cr(VI) Concentrations at
Different Levels. ..................................................................................................... 123
5.6 Amperometric Response and the Picture of CNT on Gold Coated PET Electrode. . 124
5.7 Amperometric Response and the Picture of CNT Coated Filter Paper Electrode (~ 5 cm
x 6 cm). ................................................................................................................... 125
5.8 Standard Addition Measurement of Cr(VI) with CNT/Printed Electrodes. .............. 126
5.9 Amperometric Response of CNT/Printed Electrode at 0.21 V. ................................. 127

xv
Figure Page
5.10 Amperometric Response of CNT/Printed Electrode When Half of the Reduced F Real
Water Was Replaced with Original One and Different Concentrations of Cr(VI) Were
Injected. ................................................................................................................... 129
5.11 Amperometric Response and the Picture of CNT/Printed Electrode at 0.21 V When
Different Concentrations of Cr(VI) or H2O2 Were Injected into 0.1 M HCl with the
Flow System............................................................................................................ 131
5.12 Amperometric Response of CNT/Printed Electrode at 0.21 V When 20 ppb Cr(VI) or
H2O2 Were Injected into 0.1 M HCl F Real Water with the Flow System. ............. 133
5.13 The Summary of the Electrodes Evolution in This Work. ...................................... 134

xvi
LIST OF PUBLICATIONS
CHAPTER 2
(1) Wang, C.; Wang, Y.; Graser, J.; Zhao, R.; Gao, F.; O’Connell, M. J. Solution-Based
Carbohydrate Synthesis of Individual Solid, Hollow, and Porous Carbon Nanospheres
Using Spray Pyrolysis. ACS Nano 2013, 7, 11156–11165.
(2) Li, M.; Wang, C.; O’Connell, M. J.; Chan, C. K. Carbon Nanosphere Adsorbents for
Removal of Arsenate and Selenate from Water. Environ. Sci. Nano 2015, 2, 245–250.
(3) Etacheri, V.; Wang, C.; O’Connell, M. J.; Chan, C. K.; Pol, V. Porous Carbon Sphere
Anodes for Enhanced Lithium-Ion Storage. J. Mater. Chem. A 2015, 3, 9861–9868.
CHAPTER 3
(4) Wang, C.; O’Connell, M. J.; Chan, C. K. Facile One-Pot Synthesis of Highly Porous
Carbon Foams for High-Performance Supercapacitors Using Template-Free Direct
Pyrolysis. ACS Appl. Mater. Interfaces 2015, 7, 8952–8960.
CHAPTER 4
(5) Wang, C.; Nosaka, T.; Yost, B.; Zimmerman, B.; Sutton, E. D.; Kincaid, E.; Keberle,
K.; Iqbal, Q. A.; Mendez, R.; Markowitz, S.; Liu, P.; Alford, T. L.; Chan, C. K.; Chan, K.
S.; O’Connell, M. J. Printed Carbon Nanotubes on Polymer Films for Active Origami.
Mater. Res. Lett. 2012, 1–6.

1
1 INTRODUCTION
1.1 Carbon Nanomaterials
Since fullerenes were discovered by Rick Smalley and coworkers in 1985,1 two more
carbon nanomaterials, carbon nanotubes (CNTs) and graphene, have attracted tremendous
attention from researchers of many fields in the last three decades. Fig. 1.1 gives us a clear
vision regarding the interest in carbon nanomaterials,2,3 which shows that the article
numbers on this topic have increased almost exponentially.
Figure 1.1 Number of articles published in different years about carbon nanomaterials.2,3
Moreover, due to their unique optical, electrical, and other properties, carbon
nanomaterials have multidisciplinary applications throughout biology, chemistry,
physics, materials science, and engineering. The high surface area of carbon
nanostructures such as CNTs and graphene have made them attractive for a variety of
applications such as electrode materials in supercapacitors,4–8 fuel cells,9,10 batteries,11,12
solar-energy conversion,13 catalyst supports,14 sensors15,16 and adsorbents.17,18 For
example, single-walled carbon nanotube (SWNTs) and single layer graphene have
theoretical specific surface areas of 1315 m2/g and 2630 m2/g,19 respectively. However,

2
in many cases, the effective surface area is much smaller once the carbon nanostructures
are deposited onto a substrate due to agglomeration, roping (in the case of nanotubes), or
stacking (in the case of graphene). Currently, it is still difficult and expensive to
synthesize carbon nanotubes and graphene at large-scales.20 Hence, there is still a need
for the development of low-cost and facile synthesis techniques for carbon nanostructures
with highly accessible surface areas. Two promising candidates, carbon nanospheres and
carbon foam (porous carbon with foam-like structure) have caught a lot of attention, since
they can be synthesized cheaply at large scales and their effective specific surface area
(SSA) could easily reach as high as 1000-3000 m2/g.21–26 A great deal of effort has been
made to develop many approaches for their synthesis. Carbon nanospheres and carbon
foam have also been widely used in many fields such as lithium-ion battery electrode
materials,21,27,28 supercapacitors,22,23,29–32 oil removal,17,33 catalyst supports,34,35 and
bio-related applications.36
Carbon nanospheres are carbon nanoparticles that can be designed with mesoporous or
hollow morphologies.17,26,37,38,39 There are a multitude of different methods for
synthesizing carbon nanospheres such as laser ablation,40 high temperature
transformation of nanodiamond,32,41 arc-discharge in water,42 combustion synthesis,43
hydrothermal reaction44,45 and separation from soot.46 Mesoporous and hollow carbon
nanospheres are often synthesized by using templates such as silica26,37,38 or polymer
nanospheres.17,39,44,47 Some template-free methods typically result in hollow structures
that are interconnected with each other,28 which are difficult to suspend in solution for
bio-applications like drug delivery. Many of the aforementioned methods for

3
synthesizing carbon nanospheres still suffer from low product yields, which can limit
their use in these applications.
Carbon foam can be synthesized in large quantities simply by direct pyrolysis of
carbon precursors such as polymers48–50 or sugars.21,29,51 Using direct pyrolysis of sugar
in the presence of inorganic catalysts, the SSA of carbon foams is usually below 1000
m2/g.29,51,52 However, with further activation, the SSA can reach as high as 1500-3000
m2/g.21,48,52 For example, Wang et al.29 used the decomposition of ammonium salt to
generate gas bubbles, which created a blowing effect on melted sugar to form carbon
with a strutted graphene structure and SSA of 1005 m2/g. However, this reaction needed
to be done at a relatively slow heating rate (4 oC/min), making it time consuming. By
using ZnO nanoparticles as hard template and etchant at high temperature, Strubel et al.21
synthesized porous carbon foam with SSA up to 3060 m2/g, which demonstrated very
impressive performance as an electrode in a lithium-sulfur battery. 3D aperiodic
hierarchical porous carbon was also synthesized by carbonization of resin with Ni(OH)2
as catalyst.25 However, these techniques required multiple steps to synthesize the
template or catalyst in advance of the carbon foam synthesis.
Considering the drawbacks in the synthesis techniques mentioned above and the strong
demands from the wide applications, large-scale and easier synthesis methods are still
needed. In this work, new pyrolysis methods were developed for the large-scale synthesis
of both carbon nanospheres and carbon foam with high specific surface area. These
porous carbon materials were also studied for several different applications such as dye
adsorption, the removal of toxic ions from water, supercapacitors, and lithium-ion
batteries. This work will be presented in Chapters 2-3.

4
Benefitting from their outstanding physical and chemical properties, SWNTs were also
studied for applications as actuators and electrochemical sensors in this work.
Specifically, SWNT/polymer composite films were used to develop printed active
origami (PAO) devices that can be powered by electricity, heat, or light to walk, vibrate,
or rotate (Chapter 4). For electrochemical sensors, SWNTs were integrated with multiple
substrates and studied for sensitive trace chromium(VI) (Cr(VI)) detection, which will be
addressed in Chapter 5. Figure 1.2 summarizes the structure of this dissertation.
Figure 1.2 Structure of this dissertation.

5
1.2 Introduction to the Applications
1.2.1 Dye Adsorption
To make products more colorful, dyes have been widely used in many industries,
especially textiles, paper, and food. However, as a side-effect, the environmental
pollution caused by dyes could cause serious damage to the health of human beings and
animals. As the colorful compounds, most dyes have aromatic structures, which are hard
to degrade in normal conditions and could be toxic or carcinogenic to human beings.53,54
Therefore, for environmental and legal reasons, the removal of dyes from wastewater is
necessary. Currently, many techniques are developed to treat dye-polluted water. Among
these methods, the physical adsorption of dyes with porous materials is low cost and
feasibly operational.54–57 To be used as an absorbent, the high specific surface area (SSA)
is a critical property of the material. In this work, high SSA carbon nanospheres were
investigated as adsorbents for the removal of rhodamine B from water and compared to
commercially available carbon black.
1.2.2 Removal of Arsenate and Selenate
It is well known that arsenic has toxic and carcinogenic properties.58 Although arsenate
(As(V)) is less toxic than arsenite (As(III)), it is the predominant form of arsenic in
oxygen rich and oxidizing environments such as drinking and surface waters.59 While
selenium is an essential element, excessive levels can lead to toxicity in humans and
wildlife, particularly in aquatic environments where bioaccumulation can be quite rapid.
For example, only 2 – 5 ppb of waterborne selenium species can cause reproductive
failure in fish.60 Moreover, compared to the lower oxidation state species, selenate
(Se(VI)) is more difficult to remove and there are few effective adsorbents available.

6
Therefore, in order to remove these harmful contaminants from drinking and industrial
waste water, new sorbent materials are greatly needed. As common adsorbents, activated
carbons have been widely used for water treatment applications, including the removal of
harmful organic compounds61,62 and metals,63–65 such as chromium, lead, and mercury.
However, the removal of these harmful species normally requires activated carbon
containing microporous structure as well as suitable surface functional groups for
binding.66,67 This can be challenging to control due to the wide range of preparation
conditions for activated carbon, which can give different structures, porosity, surface
chemistry, and surface area.65 As an easily synthesized and morphology controlled
porous carbon nanomaterial, in this work carbon nanospheres were demonstrated as good
sorbents for the removal of arsenate (As(V)) and selenate (Se(VI)) with batch adsorption
experiments in water spiked with 1 ppm Na2SeO4 and 1 ppm Na2HAsO4·7H2O.
1.2.3 Supercapacitors
Nowadays, with the rapid development of portable electronic devices and electric cars,
the demand for high energy and power density energy storage devices becomes stronger
and stronger. However, the traditional high energy density storage devices, lithium-ion
batteries, suffer from low cycle numbers and long charging times. As a high power
density and high cycle number energy storage device, electrochemical supercapacitors
have gained more and more attention from researchers. A supercapacitor can charge and
discharge in less than 1 second and can also cycle greater than 1 million times, whereas
the state of the art for lithium-ion batteries take at least several minutes to charge and
discharge and can only cycle around 1000 times.68

7
The traditional capacitors consist of two conducting parallel plates separated by a
dielectric layer. Its capacitance can be easily calculated with the equation:
𝐶 =𝜀𝜀0𝐴
𝑑 [1]
where ε is the dielectric constant of the dielectric, 𝜀0 is a constant corresponding to the
permittivity of free space (8.85 pF/m), A is the area of each plate, and d is the separation
distance between the two plates. When a potential difference, V, is applied between the
plates, the amount of charge induced on each plate, Q, can be calculated by:
𝑄 = 𝐶𝑉 [2]
After rearranging, the capacitance can be calculated as:
𝐶 =𝑄
𝑉=
𝐼
(𝑉 𝑡)⁄=𝐼
𝑣 [3]
Where t is time and 𝑣 is the scan rate of the voltage.
So, when the capacitor is charged and discharged at a constant current I, the
capacitance can be easily calculated from the slope of the discharge voltage curve (Fig.
1.3a). In a cyclic voltammetry measurement, where the voltage is scanned at a constant
rate, 𝑣, the capacitance can be determined by obtaining the current from the cyclic
voltammetry curve (Fig. 1.3b), where the ideal capacitor has a constant capacitance so
that the current is constant with potential, while the actual measurement may have
deviation from the ideal case. From the galvanostatic voltage profile, a voltage drop due
to the inner resistance (IR) of the active materials, electrical contact, and electrolyte can
also be observed in the actual measurement.

8
Figure 1.3 Electrochemical characteristics of capacitors. (a) Galvanostatic voltage profile,
(b) Cyclic voltammetry.68
Due to the limited surface area of the plates, traditional electrostatic capacitors can
only achieve from pF to μF of capacitance. The electrochemical double-layer
supercapacitors, however, can have capacitance as high as F to kF, since the spacing d
between the double-layer of the opposite charges forming at the interface between solid
electrodes and liquid electrolyte can be small on the order of nm (Fig. 1.4), while the
specific surface area of electrodes fabricated from porous materials, like activated carbon
black, carbon nanotubes, and graphene, could be on the order of 1000 m2/g. These unique
properties make the supercapacitors have much higher energy density than traditional
electrostatic capacitors and much higher power density than batteries.
9
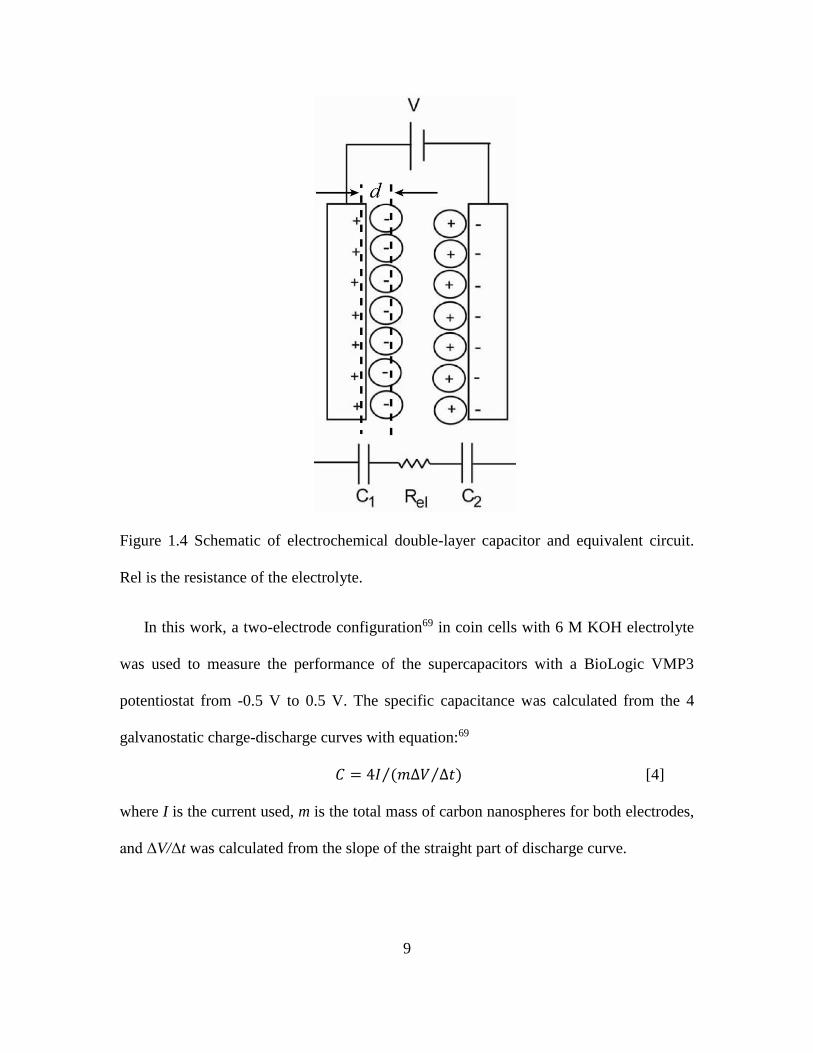
Figure 1.4 Schematic of electrochemical double-layer capacitor and equivalent circuit.
Rel is the resistance of the electrolyte.
In this work, a two-electrode configuration69 in coin cells with 6 M KOH electrolyte
was used to measure the performance of the supercapacitors with a BioLogic VMP3
potentiostat from -0.5 V to 0.5 V. The specific capacitance was calculated from the 4
galvanostatic charge-discharge curves with equation:69
𝐶 = 4𝐼 (𝑚Δ𝑉 Δ𝑡)⁄⁄ [4]
where I is the current used, m is the total mass of carbon nanospheres for both electrodes,
and ΔV/Δt was calculated from the slope of the straight part of discharge curve.

10
1.2.4 Lithium-Ion Batteries
Despite many issues, such as low charge-discharge rate, low cycle times, and safety
problems, Li-ion batteries are still the best energy storage devices for portable electronic
devices. Just like any other batteries, the Li-ion battery works based on the difference in
redox potentials between its two electrodes. As the lightest element having the lowest
standard reduction potential (-3.04 V),68 lithium is one of the best anode materials for
high energy density energy storage devices. However, due to dendrite growth during the
charge-discharge process, lithium metal electrodes could cause serious safety problems,
such as fire and explosion. Fortunately, the layered structure graphite can reversibly
intercalate lithium ions without forming any dendrites. During the lithiation process, a
maximum of one lithium ion can be stored per every six carbon atoms in between the
graphite planes, which gives graphite a theoretical capacity of 372 mAh/g. However, the
rate performance for graphite is not very good. Particularly at high charge-discharge rates
of 1C (372 mA/g), the charge storage capacity of graphite can drop dramatically. With
the increasing demand of portable electronics and electric vehicles, faster charge rates are
more and more desired. Therefore, a lot of new anode materials with better capacity and
rate performance have been investigated for last two decades. Among the new anode
materials, amorphous and turbostratic carbons are promising alternatives for graphite due
to their low volume change during lithiation and better rate performance. In this work, the
electrochemical properties of porous carbon spheres prepared using a novel spray
pyrolysis method70 were studied for Li-ion storage applications and the materials were
found to show very good rate performance.
11
1.2.5 Actuators
Origami-inspired devices are attractive because a single sheet can be folded into the
desired shape, rather than trying to individually fabricate and attach together different
components. With the help of geometric folding algorithms and computational tools to
determine the folding patterns,71,72 complex 3-D structures can be realized from 2-D
forms,73 essentially allowing for robots with any form, dimension, and feature to be
designed. However, in order to make functional robots, or “active origami”, actuation must
be engineered into the origami structures.
Of the many different strategies for actuation, the thermal bimorph actuator is attractive.
Actuators that operate on electrochemical double-layer capacitance74,75 require an
electrolyte, including ionic electroactive polymers (EAPs)76 and molecular switches.77–79
Dielectric elastomers and piezoelectric actuators80 need high electric fields and voltages.
Pneumatically-driven soft robots81 require the use of compressed gas. A thermal bimorph
actuator exploits the differences in thermal expansion coefficients between two materials,
as shown in the classical example of a bimetal thermostat.82 Such electrothermally driven
actuation has been demonstrated in microelectromechanical systems (MEMS),83 carbon
nanotube/polymer composites,84–86 self-folding sheets87 and has recently been used to
impart mobility (e.g. crawling) in a simple worm-like robot through the use of NiTi shape
memory springs.88 However, being able to integrate the actuator with the origami is
advantageous from a cost and fabrication perspective, and can also make it easier to
produce different robot designs to suit each particular need. To this end, in this work, active
origami driven by electrothermal actuation was developed from bilayers comprised of
easily obtained carbon nanotube (CNT) materials printed onto common off-the-shelf

12
plastic. As a potential application, it was demonstrated that a series of inexpensive, all
solid-state, printed active origami (PAO) devices can be powered by electricity, heat, or
light to walk, open/close, or rotate. The micro scale actuators that based on same materials
and mechanism were also demonstrated for photo/thermal detection applications. Using
the electrochemical active material, the electrochemical actuators that can be potentially
used for underwater applications were also studied and fabricated.
1.2.6 Chromium(VI) Detection
Due to the high toxicity (100-1000 times more toxic than Cr(III)),89 the detection of trace
levels of hexavalent chromium, Cr(VI), has attracted much interest in analytical chemistry.
Several sensitive techniques have been developed for the determination of Cr(VI),
including spectroscopic90–93 and electrochemical techniques.94–97 However, due the
influence of Cr(III), which is typically found in much higher concentrations than Cr(VI),
the sensitivity and detection limit for Cr(VI) still needs to be improved. Because of the
different electrochemical reduction potentials for the different oxidation states of
chromium, Cr(VI) can be selectively detected without interference from Cr(III) using
electrochemical methods, with also much better sensitivity and detection limits.
For electrochemical detection of Cr(VI), mercury electrodes have demonstrated high
sensitivity, but the potential toxicity of mercury electrodes limits their practical application.
As another good option, gold has become more and more popular, and gold electrodes have
demonstrated to be more electrochemically reversible and stable than carbon electrodes.89
However, considering the price and fabrication feasibility for gold, carbon electrodes are
still of interest due to the lower price and easy assembly.

13
Recently, Hallam, et al.94 developed graphite screen printed electrodes for the
electrochemical detection of Cr(VI). However, the sensitivity was only ~0.8 nA/ppb, while
the detection range of 100 to 1000 ppb Cr(VI) with detection limit of 19 ppb, are much less
than those of gold electrodes.95,97
In this work, a facile printable carbon nanotube (CNT) based electrode was developed.
The sensitivity is as high as 100 times that of graphite screen printed electrodes,94 and even
more than twice that of some noble metal electrodes97, while the detection limit was
improved to 5 ppb Cr(VI). Moreover, the electrodes are flexible, enabling them to be
integrated inside water tubing or pipes for potential real time monitoring. A flow detection
system based on commercial available printed electrodes was also demonstrated to make
the detection easier and very promising for practical application.
1.3 Materials Characterization
1.3.1 Electron Microscopy
Due to the shorter wavelength of electrons, the electron microscope has much higher
resolution than a light microscope and can be used to characterize the morphology and
structure of materials at the nanoscale. When a high energy electron beam interacts with a
specimen, many secondary signals are generated, which are used in electron microscopy
analysis.98 The electron microscopes used in this work were scanning electron
microscope (SEM) and transmission electron microscope (TEM).
In TEM,98 the image is created by the high voltage electron beam that produced by the
electron gun. After being accelerated by around 200 kV voltage, the electron beam is
focused by electrostatic and electromagnetic lenses and then interacts with the sample,
during which part of electrons transmits through the sample, while part of them is

14
scattered back. By magnifying the electrons that transmit through the sample with the
objective lens system of the microscope, the images containing information about the
structure of the sample can be obtained with a CCD (charge-coupled device) camera.
High-resolution transmission electron microscopy (HRTEM) can have a resolution below
1 angstrom, which makes it possible for imaging the lattice fringes of the crystallographic
planes of the specimen. In this research, the TEM was used for determining the degree of
crystallinity of the carbon after different calcination conditions. The TEM images in this
work were obtained with a Philips CM200 operating at 200 kV.
Unlike the TEM, the image in SEM99 is produced by scanning a focused electron beam
across the sample. When the electron beam interacts with the sample, it will lose energy
and the sample will emit secondary electrons, back scattered electrons, or radiation like
X-rays. By collecting and analyzing the secondary electrons, an image that includes
morphology information and a vision of the three-dimension shape of the sample can be
generated. Due to the different mechanism with TEM, SEM is able to characterize bulk
samples, while TEM requires very thin samples. The SEM images shown in this work
were obtained with FEI NOVA 200 Nanolab or FEI XL30 Environmental FEG.
1.3.2 X-Ray Diffraction
Since the wavelength of X-rays has a similar order of magnitude as the spacing
between the planes of the crystals, the X-ray wave will be scattered and produce
diffraction in specific directions that follow Bragg’s law ( ), where d is
the spacing between diffracting planes, is the incident angle, n is any integer, and λ is
the wavelength of the X-ray beam. Knowing the wavelength of the X-ray (typically Cu
Kα-radiation),100 the crystallographic information of the samples can be deduced by

15
recording the intensity distribution at different angles. Unlike electron diffraction in TEM
which requires ultra-high vacuum, X-ray diffraction (XRD) is usually operated in
atmosphere and the samples could be powder or bulk. A PANalytical X’Pert Pro high
resolution X-ray diffractometer was used to collect the XRD data in this work.
1.3.3 X-Ray Photoelectron Spectroscopy
X-ray photoelectron spectroscopy (XPS)101 is a technique used to analyze the
elemental composition and their chemical state on the sample surface by photoionizing
electrons from the surface with a monochromatic X-ray source. The amount of each
element in the sample can also be calculated from the intensity of the binding energy
peaks. Since the photoexcited electrons from deeper regions will be trapped or recaptured,
only the top 10 nm of the materials can be really sampled. Therefore, XPS is a surface
characterization method. The XPS data in this work were obtained with a VG ESCALAB
220i-XL equipped with Al K-α anode X-ray radiation with 1486.6 eV.
1.3.4 Raman Spectroscopy
When monochromatic light is scattered by molecules, the elastically scattered radiation
is called Rayleigh scattering, while the inelastically scattered radiation is called Raman
scattering, which includes Stokes Raman scattering and anti-Stokes Raman scattering.102
In Stokes Raman scattering, the scattered photon has less energy than the incident photon.
On the contrary, in anti-Stokes Raman scattering the energy of the scattered photon is
higher than that of the incident photon. Because they correspond to the energy difference
between the same vibrational energy states, the Stokes and anti-Stokes Raman frequency
shifts are symmetric around the frequency of the incident photon. Raman spectroscopy
can be used to analyze and identify materials like fingerprints, since it highly depends on

16
the molecular constituents and state. For carbon nanomaterials, Raman spectroscopy is
commonly used to identify sp2 bonds using the G band at ~1588 cm-1 and to characterize
the defect quality with the D band at around 1350 cm-1.103–105 In this work, a homemade
Raman spectrometer with a 532 nm excitation laser and triple-grating monochromator
(SpectraPro 300i, Acton Research) was used. The laser beam was focused with a
Mitutoyo M Plan Apo 50x objective lens onto the sample and the measuring power was
10 mW with exposure time of 30 s.
1.3.5 Ultraviolet–Visible Spectroscopy
Ultraviolet–visible spectroscopy (UV-Vis) is absorption or reflection spectroscopy in
the ultraviolet-visible spectra region. It measures the electron transition from the ground
state to the excited state. According to the Lambert-Beer Law:
𝐴 = log10 (𝐼0 𝐼⁄ ) = 𝜀𝐶𝐿
The technique can be used to quantitatively determine the concentration of the sample
in solution, where A is the measured absorbance, 𝐼0 is the intensity of the incident light at
a given wavelength, I is the transmitted intensity, L the path length through the sample,
and C the concentration of the absorbing species, and ε is a constant known as the
extinction coefficient for each species and wavelength. In this work, UV-Vis
spectroscopy was used to determine the concentration of dye in water with a StellarNet,
BLACK-Comet C-SR-50 spectrometer.
1.3.6 Thermal Gravimetric Analysis
As a thermal analysis method, thermal gravimetric analysis (TGA) can be used to
study chemical phenomena like decomposition, solid-gas reaction, chemisorption, and
dehydration, etc. through measuring the mass change as a function of increasing

17
temperature. By differentiating the mass loss curve with corresponding temperature, a
differential thermogravimetric (DTG) can be obtained to show the rate of mass loss, with
the peaks on the DTG curve normally revealing the reaction happening. The basic
instruments for TGA are simply a precision balance and a programmable furnace, which
makes it very easy to operate and acquire useful data. In this work, a Setaram TG-DTA92
was used to obtain the TGA data, which was used to study the carbothermal reduction of
ZnO by carbon at high temperature.
1.3.7 Gas Adsorption-Desorption Isotherms for Surface Area and Porosity Analysis
Gas adsorption-desorption measurements are widely used for studying the surface area
and pore size distribution (PSD) of porous materials.106 The gas adsorption-desorption
isotherms could be classified into six types by Union of Pure and Applied Chemistry
(IUPAC) in 1985, as Fig. 1.5 shows.107,108 The type I isotherm is normally observed in
microporous solids, where the accessible micropores are occupied at low relative pressure.
The type II isotherm changes from concave to convex to the p/po axis as the relative
pressure increases. It indicates that the adsorption layer changes from a monolayer to
multilayer. The Point B, indicating the beginning of the almost linear middle part, is
normally considered the completion of the monolayer coverage and the starting of the
multilayer adsorption. The type II isotherm is normally obtained in nonporous or
macroporous materials. The type III isotherm is always convex to the p/po axis over the
whole range and has no Point B, which indicates a weak adsorbent-adsorbate interaction.
The type III isotherm is not very common. The Type IV isotherm has a hysteresis loop
associated with the capillary condensation in mesopores. Other than that, Type IV has the
similar initial part with Type II. Like Type III, which is convex to the p/po axis initially,

18
Type V also indicates a weak adsorbent-adsorbate interaction and is very uncommon.
The Type VI isotherm is also very rare and has unique step features, which indicate the
layer-by-layer adsorption on a non-porous uniform surface.
Figure 1.5 Types of physisorption isotherms.106
Based on the physisorption isotherms, much information about the material’s surface
area and pores can be obtained. For the determination of surface area, the Brunauer–
Emmett–Teller (BET) surface area analysis technique, one of the most widely used
procedures, was first developed by Stephen Brunauer, Paul Hugh Emmett, and Edward
Teller in 1938,109 as an extension of Langmuir theory about molecular adsorption. The
measurement is usually conducted at liquid nitrogen temperature, where nitrogen
multilayer adsorption is measured as a function of relative pressure. According to the
theory, the BET plot is applied only in the linear range of 0.05 <P/Po <0.35 (P and Po are

19
the equilibrium and the saturation pressure, respectively, of nitrogen at the temperature of
adsorption), where the specific surface area is calculated from the plot.
For pore size distribution, many methods were proposed based on the Kelvin equation,
which relates the pore size with the equilibrium vapor pressure. By further introducing a
correction cause by the adsorbed film on pore walls, Barrett-Joyner-Halenda (BJH)
method110 was developed for the actual pore size distribution.111 However, BJH method
only works in the mesopore size range. As a more universal method, density functional
theory (DFT) was first used to determine the pore size distribution of porous carbon with
nitrogen adsorption isotherms by Seaton et al. in 1989.112 Since then, many kinds of
calculation methods based on different pore structure models were developed.113 Since
this technique can be used for predicting PSD in different pore geometries over a wide
range of pore sizes (micropores to mesopores),114 it has become more and more popular
for the PSD calculation.
In this work, BET, BJH, and DFT were used to study the SSA and PSD changes in
porous carbon materials treated with different conditions using nitrogen adsorption
isotherms. All of the measurements were conducted with a Micromeritics Tristar II at
liquid nitrogen temperature.

20
2 SYNTHESIS OF POROUS CARBON NANOSPHERES AND THEIR
APPLICATIONS
2.1 Introduction to Spray Pyrolysis
Spray pyrolysis has been used for the continuous synthesis of many different types of
inorganic nanoparticles115–117 and can be easily scaled. In this technique, the precursor
solution was first atomized with sonicator or air brush, then the mist of the precursor was
carried by a carrying gas into the tube furnace and pyrolyzed. Spray pyrolysis was
recently applied to the synthesis of carbon nanomaterials. Sohn et al.17 used spray
pyrolysis to synthesize graphene capsules, but the method still required the use of
polystyrene nanosphere templates. The direct pyrolysis of hydrocarbons118 has been used
to demonstrate the large scale synthesis of carbon spheres. However, this method requires
vapor phase or pre-evaporated hydrocarbon solvents and did not demonstrate good
particle size control.
Here a solution-based, spray pyrolysis synthesis technique was developed to create
individual carbon nanospheres with a high yield and controllable size from precursors
consisting of organic carbon precursors and metal salts. The carbon nanosphere diameter
distribution was changed by varying the concentration of the precursors. The method also
enables the ability to make hollow carbon nanospheres directly without the use of
templates by simply adjusting the ratio of precursors. Furthermore, this technique also
allows for heteroatom doping of the carbon nanospheres by adding different precursors to
the solution. Different metal salts were tested to show the generality for this method and
were found to alter the carbon nanosphere structure. Different annealing processes were
21
used to control the structure and specific surface area (SSA) up to 1106 m2/g were
demonstrated in hollow carbon nanospheres. The dye and toxic ions sorption and
electrochemical tests showed that these high surface area carbon nanospheres could be
used as materials with high sorption capacity and also for energy storage applications.
2.2 Experimental Details of Spray Pyrolysis and Post Treatment
Figure 2.1 Picture of the experimental setup for spray pyrolysis.
The setup for performing spray pyrolysis in a typical experiment is shown in Fig. 2.1.
The precursor solutions were prepared by dissolving sugar (sucrose, Alfa Aesar) and
Zn(NO3)2.6H2O (Alfa Aesar) in 100 mL de-ionized (DI) water, which was placed in a
250 mL 3-neck round bottom flask. The 3-neck flask was attached to a tube furnace
through its middle ground glass joint. An airbrush was fitted to the top ground glass joint
such that the nozzle was aimed into the flask to create a swirling mist of the aqueous
precursor solution. The swirling mist returned larger droplets to the bottom of the flask to
be recirculated and injected smaller droplets into the tube furnace. This gave a rough
means to control the droplet size. Nitrogen was used as the carrier gas with a flow rate of

22
5~8 L/min, while the air brush (Crescendo, Model 175) was adjusted to supply the
feedstock at 10~15 mL/h into the tube furnace. In order to increase the residence time of
the precursors at high temperature, two 1 inch tube furnaces (Lindberg, HTF55322C and
TF55035A-1) were placed in series with a 120 cm long quartz tube connecting the
furnaces. The furnaces were heated to 900 and 1000 oC, respectively. The exit flange was
equipped with a 6.35 mm stainless steel tube that was placed into a 250 mL beaker filled
with DI water to collect the products. The carbon nanospheres were recovered by vacuum
filtration (Millipore FSLP, 0.2 μm filter). Some samples were treated with acid
post-synthesis by placing the powders in 1 M HCl and sonicating for 5 min followed by
vacuum filtration and washing with DI water. Carbon nanospheres were also synthesized
using 3,4-dihydroxybenzaldehyde (Acros), polyethyleneimine (PEI; branched, Mw
~25000, Sigma-Aldrich), manganese (II) nitrate hydrate (Alfa Aesar), ferric chloride
(Spectum), and thiourea (Sigma-Aldrich) as precursors. High temperature annealing
experiments were performed by heating several tens of milligrams of as-prepared carbon
nanospheres at 1000-1200 oC under N2 gas flowing at 150 sccm for 0.5-2 h. For some
samples, a graphite furnace (GT Thermal Technologies Inc, Model: 1050CG) was used to
anneal the samples at 2300 oC for 1 h in Ar.
2.3 Effect of Precursor Concentration on Particle Size
Typical scanning electron microscopy (SEM) images of carbon nanospheres
synthesized from three different concentrations of sugar and Zn(NO3)2 precursors are
shown in Fig. 2.2 (a)-(c). In each case, the sugar to Zn(NO3)2 weight ratio was
maintained at 1:1, corresponding to 0.1 g, 1 g, and 10 g each of sugar and Zn(NO3)2 in
100 mL DI water, respectively. All of the samples showed a wide particle size

23
distribution. However, as the concentration of precursors increased, the size distribution
was shifted towards larger particle sizes, as shown in the histograms in Fig.2.2 (d)-(f). In
the 0.1g:0.1g case, most of the particle sizes were smaller than 100 nm. When the
precursor ratio was changed from 1g:1g, the median particle size shifted from ~30 nm to
~70 nm while the largest particle size was still below 1 μm. When the precursor ratio was
further increased to 10g:10g, the median particle size increased to ~300 nm, and the
largest particle diameter was more than 5 μm. These results show that the carbon
nanosphere size distribution can be adjusted by changing the concentration of reagent
precursors.
Figure 2.2 SEM image and size distribution of carbon nanospheres synthesized using
spray pyrolysis from different ratios of Zn(NO3)2 to sugar in 100 mL DI water. (a), (d)
0.1g : 0.1g; (b),(e) 1g : 1g; (c),(f) 10g : 10g.

24
X-ray diffraction (XRD) measurements were performed on carbon nanospheres
prepared using a precursor ratio of 1g:1g. As shown in Fig. 2.3a, the as prepared sample
only showed a few reflections, which matched to ZnO (PDF 01-079-0208 in the ICDD
database). This suggests that the as-prepared carbon nanospheres have an amorphous
carbon structure and that the Zn(NO3)2 transformed to ZnO during the spray pyrolysis.
The XRD pattern after HCl etching showed that the ZnO peaks were no longer visible,
suggesting that the ZnO was dissolved during the treatment. Annealing the as-made
carbon nanospheres in the tube furnace at 1200 oC for 1 h under Ar(flowing at 100 sccm)
resulted in a featureless XRD pattern, indicating that the carbon remained amorphous.
The ZnO peaks were absent as well. Since it is known that ZnO can be reduced by carbon
at high temperatures,119 it is possible that the ZnO nanoparticles were reduced to Zn and
then evaporated, since the boiling point of Zn is only 907 oC.
25
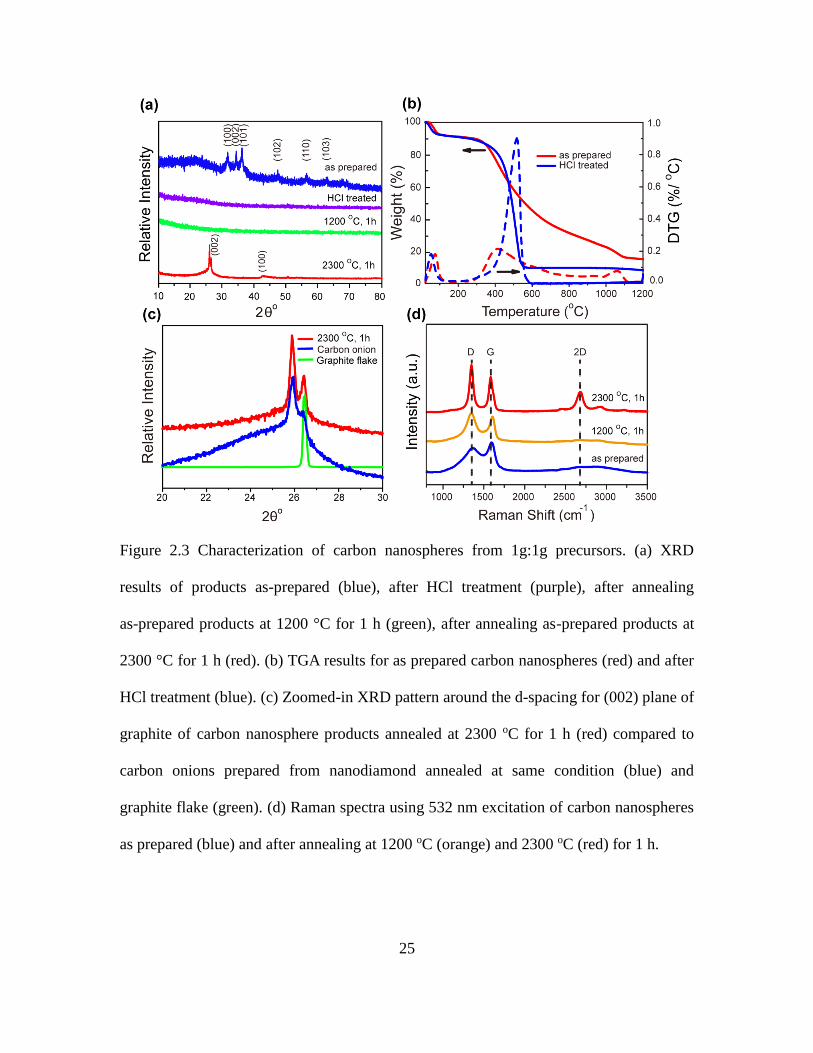
Figure 2.3 Characterization of carbon nanospheres from 1g:1g precursors. (a) XRD
results of products as-prepared (blue), after HCl treatment (purple), after annealing
as-prepared products at 1200 °C for 1 h (green), after annealing as-prepared products at
2300 °C for 1 h (red). (b) TGA results for as prepared carbon nanospheres (red) and after
HCl treatment (blue). (c) Zoomed-in XRD pattern around the d-spacing for (002) plane of
graphite of carbon nanosphere products annealed at 2300 oC for 1 h (red) compared to
carbon onions prepared from nanodiamond annealed at same condition (blue) and
graphite flake (green). (d) Raman spectra using 532 nm excitation of carbon nanospheres
as prepared (blue) and after annealing at 1200 oC (orange) and 2300 oC (red) for 1 h.
26
To better understand these results, thermogravimetric analysis (TGA) (Fig. 2.3b) was
performed on the as-prepared 1g:1g carbon nanospheres (which still contained ZnO
nanoparticles) and samples after HCl etching (ZnO removed). The initial weight loss for
both samples below 200 oC was due to desorption of water and air. The carbon
nanosphere sample treated with HCl lost the most weight between 400-600 oC, likely due
to further carbonization of the remaining organics. For the as-prepared sample, however,
the weight kept decreasing even at 1200 oC, while the derivative thermogravimetric
(DTG) curve showed another weight loss peak at ~1050 oC, likely due to the evaporation
of zinc. Gravimetric measurements performed after annealing ~100 mg of carbon
nanosphere sample showed a ~20 wt% weight loss after heating at 700 oC for 30 min,
attributed to the carbonization reactions. After treating the sample with HCl and drying,
~30% of the mass was further lost. This was attributed to the removal of ZnO. Therefore
about 50-60% of the original mass remained as pure carbon.
After annealing the as-made samples at 2300 oC for 1 h, the amorphous carbon
nanospheres changed to graphitic structures. This structure change was reflected in the
XRD pattern (Fig. 2.3a, c) and confirmed using Raman spectroscopy (Fig. 2.3d). In the
XRD pattern, the peak at 2θ = 43o was indexed to the (100) plane for graphite (PDF
00-041-1487). Two peaks were observed very close together at 2θ = 25.88o and 26.45o,
with the latter being close to the reflection for the (002) plane of graphite (Fig. 2.3c). This
two-peak phenomenon was observed in other literature120 before but without clear
explanation. A peak with the former spacing and a broad shoulder near the (002) plane
was observed in carbon onions derived from high temperature annealed nanodiamond.121
The XRD pattern corresponding to these carbon onions is shown in Fig. 2.3c as

27
comparison. When overlaying the XRD pattern of the carbon nanosphere sample
annealed at 2300 oC with that for nanodiamond-derived carbon onion, as well as pure
natural graphite flake, the relationship of these peaks can be clearly observed. Hence the
peak at 2θ = 25.88o likely corresponds to the high curvature graphitic faces similar to
those found in carbon onions while the peak at 2θ = 26.45o may come from the low
curvature graphitic faces found in graphite. The reason that the (002) peak splits into two
peaks in the carbon nanospheres might correspond to different types of nanoscale
curvature inside the nanospheres. This was confirmed with high resolution transmission
electron microscopy (TEM) on the carbon onions (Fig. 2.4a) and carbon nanospheres (Fig.
2.4b).
Figure 2.4 HRTEM of (a) nanodiamond-derived carbon onions and (b) carbon nanospheres
annealed at same condition, 2300 oC, 1h.
The Raman spectra of the carbon nanospheres with different heat treatments are shown
in Fig. 2.3d. The D band at ~1360 cm-1 is attributed to defect and disorder-induced modes
of disordered or glassy carbon.122 The peak at ~1590 cm-1 is indexed to the G band
28
corresponding to the phonon mode with E2g symmetry of graphite.104 Other than the
sample annealed at 2300 oC for 1 h, none of the samples have the 2D band at ~2680 cm-1,
while D and G bands were broad and weak, indicating the presence of significant
amounts of disordered carbon. For the sample treated at 2300 oC, the ratio of the
intensities of the 2D and G bands (I2D/IG) was equal to 0.57, which reflects a multilayer
graphene structure. This is consistent with the XRD (Fig. 2.3c) and TEM results (Fig.
2.4b) showing graphitization of the carbon nanospheres after annealing at 2300 oC.
2.4 The Role of Metal Salt on Carbon Nanospheres Formation and Morphology
In order to study the role of the Zn(NO3)2 during the formation of the carbon
nanospheres, the weight ratio of Zn(NO3)2 to sugar was varied. In all cases 1 g sugar and
100 mL of DI water were used. Fig. 2.5 shows some typical TEM images of different
as-prepared carbon nanospheres using different amounts of Zn(NO3)2. Fig. 2.6 shows the
high-magnification TEM images of individual carbon nanospheres prepared using
precursor ratios of 1g:1g, 3g:1g, and 10g:1g. Fig. 2.6a shows the high-magnification
TEM image of as-prepared carbon nanospheres using 1g:1g. The particles <10 nm in
diameter on the carbon nanosphere surface correspond to ZnO. As shown in the high
resolution TEM image in Fig. 2.5b, the ZnO nanoparticles were crystalline, with the
measured d-spacing of 0.28 nm matching the ZnO (100) plane while the carbon was
amorphous, consistent with the XRD results. Fig. 2.6b shows a high magnification TEM
image of carbon nanospheres prepared from a precursor solution with 3 g of Zn(NO3)2 to
1 g of sugar (3g:1g). Most of the carbon nanospheres appeared to be covered with larger
particles about 20 nm in diameter. When the Zn(NO3)2 to sugar ratio was increased to
10g:1g, the nanoparticles on the surface of the carbon nanospheres also had large
29
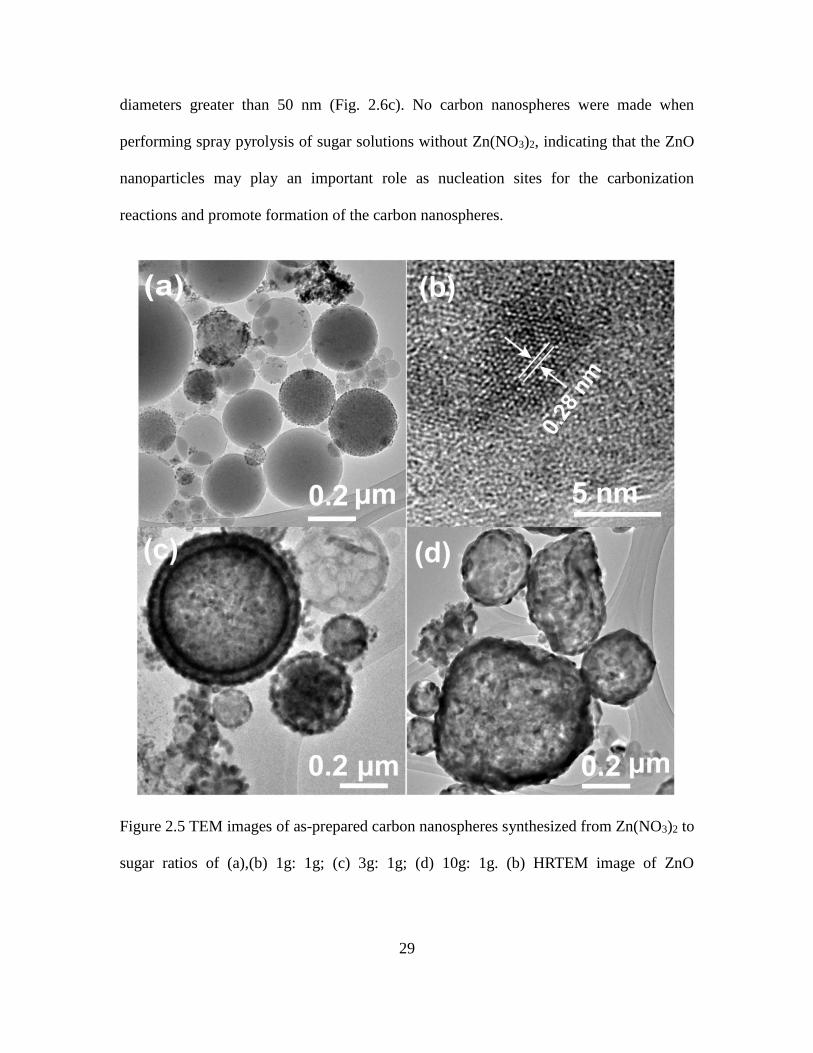
diameters greater than 50 nm (Fig. 2.6c). No carbon nanospheres were made when
performing spray pyrolysis of sugar solutions without Zn(NO3)2, indicating that the ZnO
nanoparticles may play an important role as nucleation sites for the carbonization
reactions and promote formation of the carbon nanospheres.
Figure 2.5 TEM images of as-prepared carbon nanospheres synthesized from Zn(NO3)2 to
sugar ratios of (a),(b) 1g: 1g; (c) 3g: 1g; (d) 10g: 1g. (b) HRTEM image of ZnO

30
nanoparticle inside the carbon nanospheres from 1g:1g sample with d-spacing of 0.28 nm
matching ZnO
Figure 2.6 TEM images of carbon nanospheres from Zn(NO3)2 to sugar ratios of (a) 1g : 1g;
(b) 3g : 1g; (c) 10g : 1g.
TEM images of carbon nanospheres after HCl treatment are shown in Fig. 2.7 for the
different Zn(NO3)2:sugar ratios. The nanoparticles observed in the as-prepared samples
were absent after HCl etching, confirming that they were composed of ZnO (Fig. 2.7a-b).
In contrast, the as-prepared samples annealed at 2300 oC showed a graphitic structure,
consistent with the XRD and Raman results (Fig. 2.3). The ZnO nanoparticles were also
absent, confirming the proposed evaporation at the higher annealing temperature, as
suggested by the TGA data (Fig. 2.3b). As Fig. 2.6a-b show, the 1g:1g dots are mostly
solid. The 3g:1g products after HCl etching (Fig. 2.7d) consisted of some smaller, solid
amorphous carbon nanospheres (Fig. 2.7e) while others appeared to be hollow,
“balloon”-like nanospheres with highly porous structures (Fig. 2.7f). After HCl treatment
of the samples prepared from the 10g:1g precursor solutions, the resulting carbon
nanospheres were highly porous (Fig. 2.7g) and large carbon particles with “balloon”

31
morphology dominated the product (Fig. 2.7i). The smaller carbon nanospheres were also
observed to have a highly porous structure (Fig. 2.7h).
Figure 2.7 TEM images of carbon nanospheres from different Zn(NO3)2 to sugar ratios
after HCl etching. (a)-(c) were prepared using 1g:1g, (a) and (b) are after HCl etching
whereas (c) shows the as-prepared product after annealing at 2300 oC. (d)-(f) are prepared
using 3g:1g. (e) and (f) show the zoomed in images of particles (1) and (2) in (d),
respectively. (g)-(i) were prepared using 10g:1g. (h) and (i) show the zoomed in images of
particles (3) and (4), respectively.

32
Figure 2.8 Illustration of the carbon nanospheres formation mechanism.
From the observed morphology dependence on the Zn(NO3)2 concentration, the
formation mechanism for the carbon nanospheres is proposed as follows. ZnO
nanoparticles formed during heating of Zn(NO3)2 at high temperature act as nucleation
sites for carbonization of sugar to form carbon nanospheres. When high concentrations of
Zn(NO3)2 were used, without much water evaporating from the droplet surface, enough
Zn(NO3)2 will accumulate at the surface and reach the critical concentration, at which
ZnO nanoparticles were made to form a shell, where inside precursors diffuse to and
pyrolysis to form carbon “balloon” (High concentration of Zn(NO3)2 case in Fig. 2.8).
With lower concentration of Zn(NO3)2, however, the droplets have to evaporate and
shrink enough before Zn(NO3)2 reaches the critical concentration to pyrolysis and form
ZnO nuclei, which make the precursors have enough time to diffuse inside and form solid
nanospheres finally (Low concentration of Zn(NO3)2 case in Fig. 2.8). No carbon
nanospheres were made by direct pyrolysis of pure sugar solutions at same conditions,
33
which suggests that the ZnO plays the role seed or nucleus for the formation of carbon
nanospheres. The observed morphology dependence of the carbon nanospheres on the
Zn(NO3)2 concentration offers another way to control the nanosphere features for
different purposes. For instance, high surface area nanomaterials can be produced and
used for water purification and drug delivery, etc.
To better understand the growth mechanism of the carbon nanospheres, different metal
salts and carbon precursors were also investigated. The carbon nanospheres synthesized
using Zn(NO3)2 and 3,4-dihydroxybenzaldehyde (1g:1g) and treated with HCl are shown
in Figure 2.9a and showed similar morphologies as those prepared using sugar. Figure
2.9b-c shows the SEM images of carbon nanospheres prepared using sugar as the carbon
source and manganese (II) nitrate hydrate and ferric chloride, respectively, in place of
Zn(NO3)2. Using the manganese salt resulted in carbon nanospheres with a rough surface
(Fig. 2.9b). The carbon nanospheres prepared with ferric chloride showed large holes on
their surfaces after HCl etching (Fig. 2.9c). XRD of the as-prepared samples showed that
the materials were amorphous, suggesting crystalline iron or manganese oxides did not
form during the pyrolysis but that they may be amorphous oxides (Fig. 2.9d). The broad
reflections observed in the sample prepared with the manganese salt are likely from the
carbon, since they did not match reflections for MnO2. Carbon nanospheres were also
synthesized using Zn(NO3)2 and polyethyleneimine (PEI) (1g:1g). When PEI was used as
the carbon source, the carbon nanospheres showed a deflated shape (Fig. 2.10a). The
ability to use PEI as the carbon source provides the opportunity for preparing nitrogen
doped carbon nanospheres. Thiourea was also added to the precursor solution along with
the PEI. Fig. 2.10b shows the X-ray photoelectron spectroscopy (XPS) wide scan result

34
for as-prepared carbon nanospheres synthesized from 2 g Zn(NO3)2 , 1 g PEI and 1 g
thiourea. The peaks from N 1s and S 2p showed that these species were incorporated into
the carbon nanospheres from the PEI and thiourea, respectively. The composition
determined from XPS was about 55 at% C, 12 at% N, 19 at% S, with the balance being
ZnO. These results show that different carbon sources and salts can be used to make the
carbon nanospheres, but more studies are required to fully understand their formation
mechanism compared to the Zn(NO3)2/sugar case.
Figure 2.9 SEM images and XRD of carbon nanospheres synthesized from different carbon
and metal salt precursors after HCl treatment. (a) Zn(NO3)2 and
3,4-dihydroxybenzaldehyde (1g:1g); (b) Mn(NO3)2 and sugar (1g:1g); (c) FeCl3 and
sugar (0.1g:1g); (d) XRD of as-prepared samples from 0.1g: 1g FeCl3: sugar (blue) and 1g:
1g Mn(NO3)2: sugar (red).

35
Figure 2.10 (a) SEM image of as-prepared carbon nanospheres synthesized from 1g:1g
Zn(NO3)2 and PEI; (b) XPS wide scan and elemental analysis for carbon nanospheres
prepared from 2 g Zn(NO3)2 , 1g PEI and 1g thiourea.
2.5 Characterization and Applications of Carbon Nanospheres from Higher Precursor
Concentrations
2.5.1 The Characterization of Carbon Nanospheres
Figure 2.11 SEM images of carbon nanospheres prepared from precursors with Zn(NO3)2
to sugar ratios of (a) 3g:3g; (b) 6g:3g.

36
N2 adsorption isotherms were used to determine the specific surface area (SSA) of the
carbon nanospheres using the Brunauer–Emmett–Teller (BET) method at 77K. The
adsorption isotherms were used to calculate the pore size distribution via Barrett–Joyner–
Halenda (BJH) method. Higher precursor concentrations of Zn(NO3)2 to sugar were used
to increase the product yield. Figure 2.11 shows the SEM images of samples prepared from
3g:3g and 6g:3g in 100 mL water. Although the diameters of the carbon nanospheres
became larger, the carbon nanosphere structures were similar to those observed in 1g:1g
and 3g:1g samples described above, with the 3g:3g sample displaying predominately solid
carbon nanospheres and the 6g:3g sample displaying many porous hollow carbon
nanospheres. Figure 2.12a shows the N2 adsorption/desorption isotherms and Table 1
shows the SSA and total pore volumes for carbon nanospheres prepared with different
precursor concentrations and subsequent heat treatments. For the sample prepared from 3g:
3g followed by treatment with HCl and annealing at 1000 oC for 1 h, the isotherm is
classified as type I, which indicates that a microporous structure is generated from the
holes when the ZnO nanoparticles were removed with HCl. The SSA of this sample was
920 m2/g. For the sample prepared from 6g: 3g and treated with the same condition, the
SSA was almost the same at 928 m2/g. After annealing both of these samples at 2300 oC for
1 h, the SSAs dropped dramatically to 14 m2/g and 42 m2/g, respectively, indicating
disappearance of the microporous structure during the crystallization at high temperature.
When these two samples were annealed at 1100 oC directly without removing the ZnO with
HCl, the SSA were 1106 m2/g and 1036 m2/g, respectively. This higher SSA compared to
the samples with ZnO removed using HCl etching indicates that the ZnO may be etching
additional carbon during the high temperature annealing, making the pores bigger. The

37
BET curves from samples prepared with higher Zn(NO3)2 concentration have larger slopes
than samples from low Zn(NO3)2 concentrations. This corresponds with the hollow carbon
nanosphere structures observed in the SEM (Fig. 2.11b). Importantly, these SSAs are about
double those obtained for mesoporous carbon nanospheres synthesized using chemical
vapor deposition on polystyrene templates.47 Although, the total pore volume may be
different for different samples, most of the pore sizes were around 2 nm (Fig 2.12b).
Figure 2.12 (a) N2 adsorption-desorption isotherms of different carbon nanospheres. (b)
Pore size distribution curves of different carbon nanospheres.

38
Table 2.1 Specific surface area and pore volume of carbon nanospheres measured from
BET
Zn(NO3)2 to
sugar ratio in
precursor
Post-synthesis
Treatment
SSA (m2/g) Pore volume
(cm3/g)
3g:3g HCl etching then heat
at 1000 oC for 1 h
920 0.30
6g:3g HCl etching then heat
at 1000 oC for 1 h
928 0.28
3g:3g HCl treated then heat
at 2300 oC for 1 h
14 0.06
6g:3g HCl treated then heat
at 2300 oC for 1 h
42 0.13
3g:3g Heat at 1100 oC for 2
h
1106 0.32
6g:3g Heat at 1100 oC for 2
h
1036 0.40
2.5.2 Application of Carbon Nanospheres as an Adsorbent for Dye Removal
Figure 2.13 Photographs of (a) 100 mg/L RB solution under excitation with 405 nm laser,
(b) carbon nanospheres suspended in the RB solution, (c) RB solution after carbon
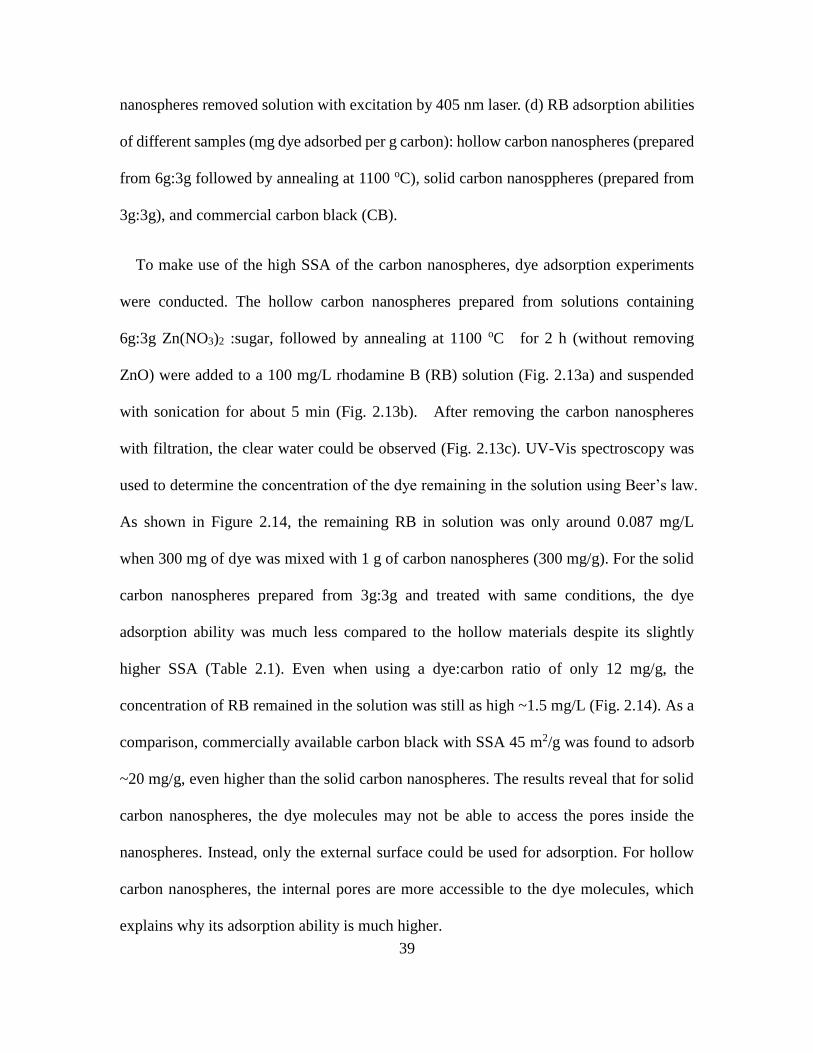
39
nanospheres removed solution with excitation by 405 nm laser. (d) RB adsorption abilities
of different samples (mg dye adsorbed per g carbon): hollow carbon nanospheres (prepared
from 6g:3g followed by annealing at 1100 oC), solid carbon nanosppheres (prepared from
3g:3g), and commercial carbon black (CB).
To make use of the high SSA of the carbon nanospheres, dye adsorption experiments
were conducted. The hollow carbon nanospheres prepared from solutions containing
6g:3g Zn(NO3)2 :sugar, followed by annealing at 1100 oC for 2 h (without removing
ZnO) were added to a 100 mg/L rhodamine B (RB) solution (Fig. 2.13a) and suspended
with sonication for about 5 min (Fig. 2.13b). After removing the carbon nanospheres
with filtration, the clear water could be observed (Fig. 2.13c). UV-Vis spectroscopy was
used to determine the concentration of the dye remaining in the solution using Beer’s law.
As shown in Figure 2.14, the remaining RB in solution was only around 0.087 mg/L
when 300 mg of dye was mixed with 1 g of carbon nanospheres (300 mg/g). For the solid
carbon nanospheres prepared from 3g:3g and treated with same conditions, the dye
adsorption ability was much less compared to the hollow materials despite its slightly
higher SSA (Table 2.1). Even when using a dye:carbon ratio of only 12 mg/g, the
concentration of RB remained in the solution was still as high ~1.5 mg/L (Fig. 2.14). As a
comparison, commercially available carbon black with SSA 45 m2/g was found to adsorb
~20 mg/g, even higher than the solid carbon nanospheres. The results reveal that for solid
carbon nanospheres, the dye molecules may not be able to access the pores inside the
nanospheres. Instead, only the external surface could be used for adsorption. For hollow
carbon nanospheres, the internal pores are more accessible to the dye molecules, which
explains why its adsorption ability is much higher.

40
Figure 2.14 Calibration curve for used to determine concentration of RB using UV-vis
spectroscopy. Black points correspond to the calibration points. Stars correspond to the
concentrations of remaining RB after sorption onto different carbon samples: hollow
carbon nanospheres (300 mg dye per g carbon), solid carbon nanospheres (12 mg/g), and
carbon black (20 mg/g). Insets show the corresponding SEM images.
2.5.3 Application of Carbon Nanospheres as an Adsorbent for Removal of Arsenate
and Selenate from Water
As an effective adsorbent, the adsorption ability of carbon nanospheres was also
studied for removal of arsenate (As(V)) and selenate (Se(VI)). Unlike most toxic metal
ions such as lead and mercury, arsenate and selenate are difficult to remove with common
activated carbon adsorbents, since they are negatively charged species in neutral pH
solutions. For activated carbons, due to the wide range of preparation conditions, they can
have very different porosity, surface functional groups, and specific surface area. Here

41
the adsorption ability of carbon nanospheres and commercially available activated
carbons (Cabot Norit® 20BF powdered activated carbon (PAC, 325 mesh) and GAC-820
granular activated carbon (GAC, 8 x 20 mesh)) was compared for As(V) and Se(VI)
removal. The carbon nanospheres used here were prepared with Mn(NO3)2 as catalyst.
Specifically, 1 g sucrose and 1 g Mn(NO3)2 were dissolved in 100 mL DI water and
sprayed using N2 carrier gas into a tube furnace heated at 1000 oC. High temperature
annealing at 1200 oC for 2 hours under Ar was performed, followed by etching with
concentrated HCl and washing in DI water to form the final product consisting of carbon
nanospheres with a median diameter of ~ 70 nm, with the largest particle size < 1 micron.
Figure 2.15b shows typical scanning electron microscopy (SEM) images of the carbon
nanospheres. Transmission electron microscopy (TEM) of the material after
carbonization showed that the carbon nanospheres contained manganese oxide
nanoparticles 2 – 10 nm in diameter (Fig. 2.15c). After etching, the nanoparticles were
dissolved to reveal empty micropores (Fig. 2.15d). Based on the X-ray diffraction (XRD,
Fig. 2.16a) and Raman spectroscopy (Fig. 2.16b) analysis, the carbon nanospheres
adopted a disordered amorphous structure with predominately carbon sp3 bonding. As
you can see, although Mn(NO3)2 was used as catalyst here, the features of carbon
nanospheres are similar with those prepared with Zn(NO3)2, which is consistent with the
results mentioned above.

42
Figure 2.15 (a) Schematic of formation mechanism for synthesis of microporous carbon
nanospheres. (b) SEM images of synthesized carbon nanospheres. TEM images of carbon
nanospheres (c) after carbonization as a composite with metal oxide nanoparticles (noted
with arrows) and (d) after acid etching to dissolve the metal nanoparticles. Scale bar = 50
nm.

43
Both commercial activated carbons studied (PAC and GAC) are prepared from
bituminous coal. The Raman spectrum for PAC showed a similar disordered structure as
that in the carbon nanospheres (Fig. 2.16b) but the (002) and (100) planes associated with
graphitic carbon can be discerned in the XRD pattern (Fig. 2.16a). Thus, the structure of
PAC is likely a mixture of disordered carbon with some regions of graphitic, sp2 carbon.
Figure 2.16 (a) XRD, (b) Raman spectra, (c) N2-sorption curve with pore size distribution
the inset, and (d) Zeta potential measurement for PAC compared with carbon nanospheres.
The specific surface area for the carbon nanospheres using the Brunauer-Emmett-Teller
(BET) method at 77 K in nitrogen (Micromeritics TriStar II 3020) was around 1000 m2/g
with a pore volume around 0.28 cm3/g. Gas sorption measurements on PAC determined a

44
BET surface area of 864 m2/g and pore volume of 0.22 cm3/g. GAC has been reported
with a BET surface area of 908 m2/g and pore volume of 0.5 cm3/g.123 The
nitrogen-sorption isotherm for the carbon nanospheres and PAC are shown in Figure
2.16c. While PAC shows a type IV isotherm with hysteresis, indicating some
mesoporosity,124 the CNS had a type I isotherm with no hysteresis. This indicates that the
CNS contained mostly micropores < 2 nm and no significant pore volume associated with
mesopores (2 – 50 nm) or macropores (> 50 nm), as shown by the Barrett-Joiner-Halenda
(BJH) derivative pore distribution plot (Fig. 2C, inset). This is consistent with the
formation mechanism of the porous carbon nanospheres and the results mentioned above.
Zeta potential measurements were performed on the PAC and CNS (ZetaPALS,
Brookhaven Instruments). As shown in Fig. 2.16d, the isoelectric point (pH where the
zeta potential is zero) for PAC was around pH 2.5–3, which is typical for coal-derived
activated carbons with acidic surface groups (L-type carbon).125 In contrast, the
isoelectric point for the CNS was around 6.16. The higher isoelectric point in the CNS is
a result of the high temperature annealing temperatures used in the synthesis, which can
remove the oxidised acidic surface groups.126 Basic carbons with anionic exchange
properties (H-type carbons) can be obtained when heating >950 °C in vacuum or inert
atmosphere.125
Batch adsorption experiments were performed using the carbon materials at a
concentration of 0.44 g/L in water spiked with 1 ppm Na2SeO4 and 1 ppm
Na2HAsO4·7H2O. The sorbents were added to the spiked solutions and stirred at a
constant speed with sampling at different time periods. The sorbents were then removed
with filtration and the filtrate was analyzed with inductively coupled plasma atomic
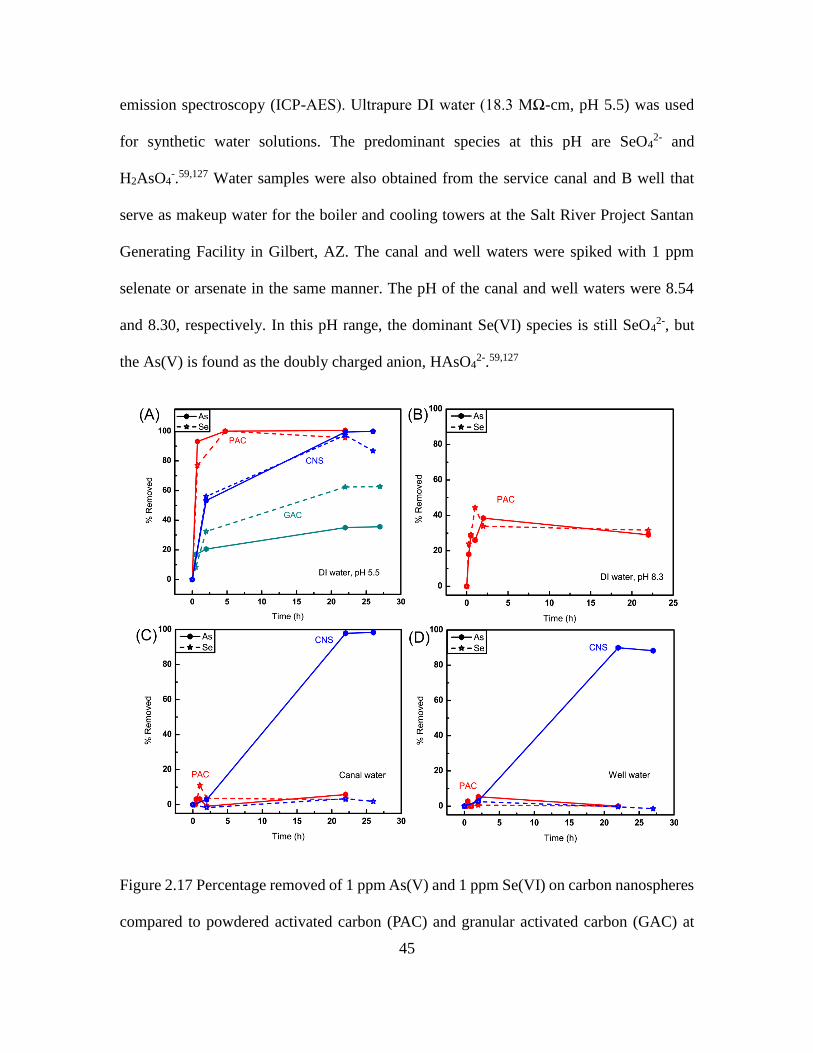
45
emission spectroscopy (ICP-AES). Ultrapure DI water (18.3 MΩ-cm, pH 5.5) was used
for synthetic water solutions. The predominant species at this pH are SeO42- and
H2AsO4-.59,127 Water samples were also obtained from the service canal and B well that
serve as makeup water for the boiler and cooling towers at the Salt River Project Santan
Generating Facility in Gilbert, AZ. The canal and well waters were spiked with 1 ppm
selenate or arsenate in the same manner. The pH of the canal and well waters were 8.54
and 8.30, respectively. In this pH range, the dominant Se(VI) species is still SeO42-, but
the As(V) is found as the doubly charged anion, HAsO42-.59,127
Figure 2.17 Percentage removed of 1 ppm As(V) and 1 ppm Se(VI) on carbon nanospheres
compared to powdered activated carbon (PAC) and granular activated carbon (GAC) at

46
dosage of 0.44 g/L in (a) DI water, pH 5.5, (b) DI water, pH 8.3, (c) canal water, and (d)
well water.
The arsenate and selenate removal over time with carbon sorbents is shown in Fig.
2.17 in the different water samples. As Fig. 2.17a shows, in DI water CNS can remove 53%
arsenate in 2 hours, and almost 100% arsenate in 22 hours. Even in the canal water (Fig.
2.17c) and well waters (Fig. 2.17d), still more than 89% arsenate could be removed in 22
hours, although the initial removal rates were slower, only about 3% removed in first 2
hours. Compared with DI water, the slightly lower removal efficacy for arsenate in the
canal and well waters can be explained by their higher pH. The anionic adsorption
capability of carbons is typically attributed to surface functional groups such as –COOH,
–OH2+, –COO−, –OH, –O−, which become protonated and/or positively charged when
dispersed into aqueous solutions.63,128,129 Typically, the arsenate adsorption capacities of
activated carbons reported in the literature reached maximum at pH 2–5,130,131 where the
carbon surface was positively charged. Here, due to its high isoelectric point, the CNS
displays good arsenate adsorption even at pH > 8, without any surface modification.
Moreover, the canal and well water also contains the competing anion species such as
nitrate (typically 60–130 ppm) and sulfate (700–1000 ppm), which did not seem to have
large effect on the arsenate adsorption.
For selenate removal in DI water, CNS could remove 56% and 97% selenate in 2 and
22 hours, respectively (Fig. 2.17a). When tested in the canal (Fig. 2.17c) and well waters
(Fig. 2.17d), the selenate removal efficacy of the CNS was very low, only about 2–3%,
due to the presence of completing anions. Sulfate has been found to compete with
selenate binding on various sorbents due to its similar anion structure and adsorption

47
behavior.132,133 One way to potentially address this problem is to use a barium salt to
precipitate out the sulfate from the water prior to its exposure to the sorbent.134
As a comparison, PAC and GAC were also used to conduct the adsorption experiment
under the similar conditions. In DI water, PAC could adsorb arsenate and selenate faster
than the CNS, with 93% arsenate and 77% selenate removed in first 45 minutes. Similar
to the CNS, all of the arsenate and selenate could be removed in longer exposure time.
However, GAC could only remove 35% of the arsenate and 62% of the selenate in 22
hours. Due to the poor performance in DI water, GAC was not tested further.
When further tested in the canal and well water, PAC, however, could barely remove
arsenate and selenate anymore. To further investigate whether the low removal efficacy
of PAC in the canal and well waters was due to the higher pH or the presence of
competing ions, the pH of the DI water was adjusted to 8.3 by adding NaOH and the
results are shown in Fig. 2.17b. Comparing with the results obtained in DI water without
pH adjustment (Fig. 2.17a), both arsenate and selenate removal efficiencies of PAC
decreased about half, which means the higher pH of the solution does have a negative
effect on the adsorption properties. This suggests that the worse performance of PAC in
the canal and well waters was mainly due to the decrease in positively charged surface
binding sites as the result of the higher pH.
2.5.4 Application of Carbon Nanospheres for Supercapacitors
To evaluate the performance of the carbon nanospheres as supercapacitor electrode
materials, a two-electrode configuration69 was used in coin cells with 6 M KOH
electrolyte. The cyclic voltammetry (CV) curves from -0.5 V to 0.5 V for supercapacitors
made from hollow and solid carbon nanospheres are shown in Fig. 2.18a and Fig. 2.19a,

48
respectively, while the galvanostatic charge-discharge curves obtained at different current
densities are shown in Fig. 2.18b and Fig. 2.19b. From the IR drop obtained from the
discharge curves, the internal resistance (IR) or equivalent series resistance (ESR) was
around 24 Ω and 30 Ω for the hollow and solid carbon nanospheres, respectively, which
was a little high and might be due to the small contact points between the nanospheres.
Based on the charge-discharge curves, the specific capacitances were 112 F/g and 105
F/g for the hollow and solid carbon nanospheres, respectively, at a current density of 0.1
A/g. Even when the current density increased as high as 10 A/g, the specific capacitances
still remained 88.5 F/g and 79.5 F/g, respectively. Similar with the dye adsorption result,
the hollow nanospheres had better performance than the solid ones. However, since the
electrolyte ion is much smaller than the dye molecule, the difference in performance was
not as significant as in dye adsorption. The specific capacitances observed for the carbon
nanospheres are higher than typical values observed in carbon nanotube electrodes
(50-100 F/g),135 but a little lower than those observed in other mesoporous carbon
nanospheres (~200 F/g)47 and graphene (100-250 F/g).4,5,7,136 The specific capacitance in
supercapacitors prepared from both solid and hollow carbon nanospheres was stable with
very little decrease, with the final capacitance retention of 100.3% and 99.2% after
20,000 cycles for the solid and hollow nanospheres, respectively. In contrast, only 96%
capacitance retention was observed after 10,000 cycles for other mesoporous carbon
nanosphere supercapacitors.47 Since the carbon nanosphere samples were observed to be
somewhat hydrophobic, it is likely that the electrolyte wetting was improved after cycling,
allowing more of the internal micropores to be accessible to the ions. This suggests that
the specific capacitances observed here may be further increased if the carbon

49
nanospheres are modified with surface functionalization to improve electrolyte wetting,
which will be investigated in future studies.
Figure 2.18 Performance of carbon nanosphere supercapacitors in 6 M KOH aqueous
electrolyte. (a) CVs curves obtained using different scan rates for supercapacitor made
from hollow carbon nanospheres. (b) Galvanostatic charge/discharge curves of
supercapacitors made from hollow or solid carbon nanospheres at different current
densities. (c) The specific capacitance at different current densities. (d) Cycle life of
different capacitors at a current density of 10 A/g.

50
Figure 2.19 (a) Cyclic voltammograms (CVs) curves at different scan rates for
supercapacitor made of solid carbon nanospheres in 6 M KOH aqueous electrolyte. (b)
Galvanostatic charge/discharge curves of supercapacitors made from hollow or solid
carbon nanospheres at different current densities.
2.5.5 Application of Carbon Nanospheres for Lithium Ion Battery
The performance of the carbon nanospheres was also evaluated for lithium ion battery
applications. The porous carbon spheres (PCS) investigated here were prepared by
dissolving 3 g sucrose and 3 g Zn(NO3)2 in 100 mL DI water and sprayed using N2
carrier gas into a tube furnace heated at 1000 oC. The product was collected and then
annealed either at 1200 oC (referred to as PCS-1200) or 2300 oC (PCS-2300) for 2 h
under Ar atmosphere.
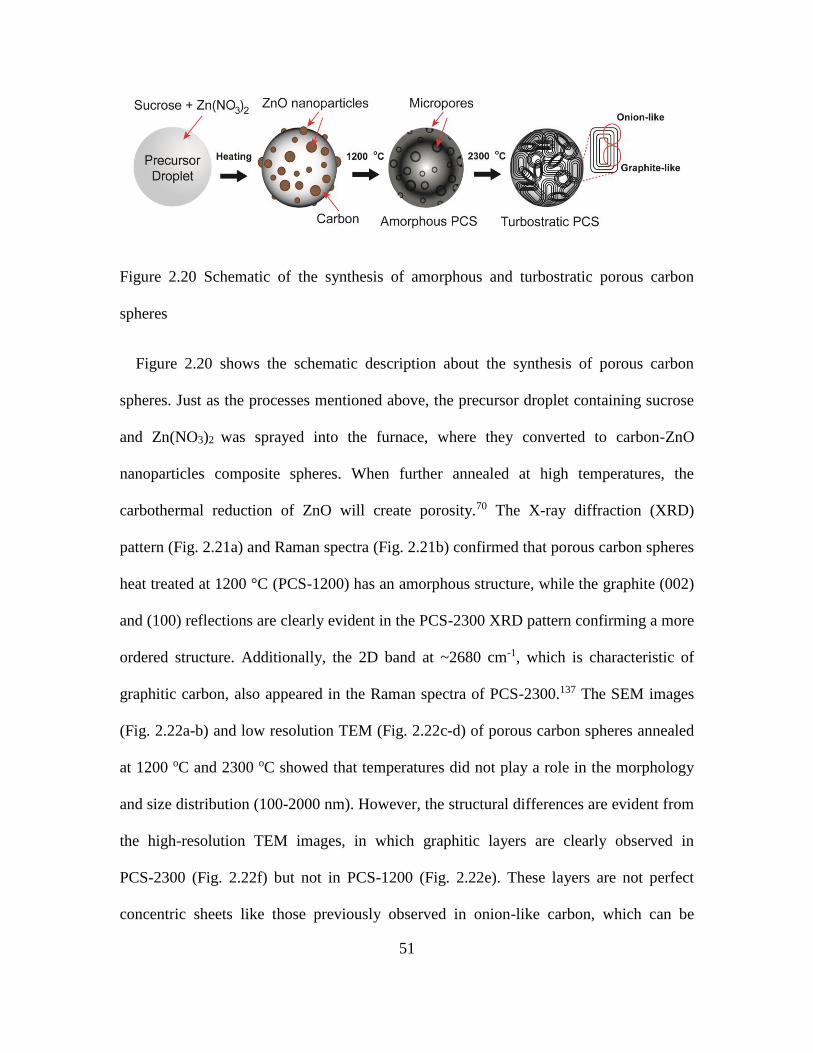
51
Figure 2.20 Schematic of the synthesis of amorphous and turbostratic porous carbon
spheres
Figure 2.20 shows the schematic description about the synthesis of porous carbon
spheres. Just as the processes mentioned above, the precursor droplet containing sucrose
and Zn(NO3)2 was sprayed into the furnace, where they converted to carbon-ZnO
nanoparticles composite spheres. When further annealed at high temperatures, the
carbothermal reduction of ZnO will create porosity.70 The X-ray diffraction (XRD)
pattern (Fig. 2.21a) and Raman spectra (Fig. 2.21b) confirmed that porous carbon spheres
heat treated at 1200 °C (PCS-1200) has an amorphous structure, while the graphite (002)
and (100) reflections are clearly evident in the PCS-2300 XRD pattern confirming a more
ordered structure. Additionally, the 2D band at ~2680 cm-1, which is characteristic of
graphitic carbon, also appeared in the Raman spectra of PCS-2300.137 The SEM images
(Fig. 2.22a-b) and low resolution TEM (Fig. 2.22c-d) of porous carbon spheres annealed
at 1200 oC and 2300 oC showed that temperatures did not play a role in the morphology
and size distribution (100-2000 nm). However, the structural differences are evident from
the high-resolution TEM images, in which graphitic layers are clearly observed in
PCS-2300 (Fig. 2.22f) but not in PCS-1200 (Fig. 2.22e). These layers are not perfect
concentric sheets like those previously observed in onion-like carbon, which can be

52
considered multi-shelled fullerenes.138,139 Rather, the PCS-2300 contained domains about
5 nm in size containing about 3-5 graphene layers, which can be considered a turbostratic
structure (Fig. 2.22f, inset). Within each domain are regions of high curvature, imparting
onion-like character, as well as planar regions that are more graphitic (Fig. 2.20). In
contrast, the PCS-1200 showed a porous amorphous structure.
Figure 2.21 (a) XRD patterns and (b) Raman spectra of porous carbon spheres annealed at
1200 °C and 2300 oC

53
Figure 2.22 SEM (a, b), low resolution TEM (c, d) and high resolution TEM (e, f) images
of porous carbon spheres annealed at (a, c, e) 1200 oC and (b, d, f) 2300 oC.
N2 adsorption/desorption isotherms and pore size distributions of porous carbon
spheres are shown in Figure 2.23. The low temperature treated spheres PCS-1200 with a
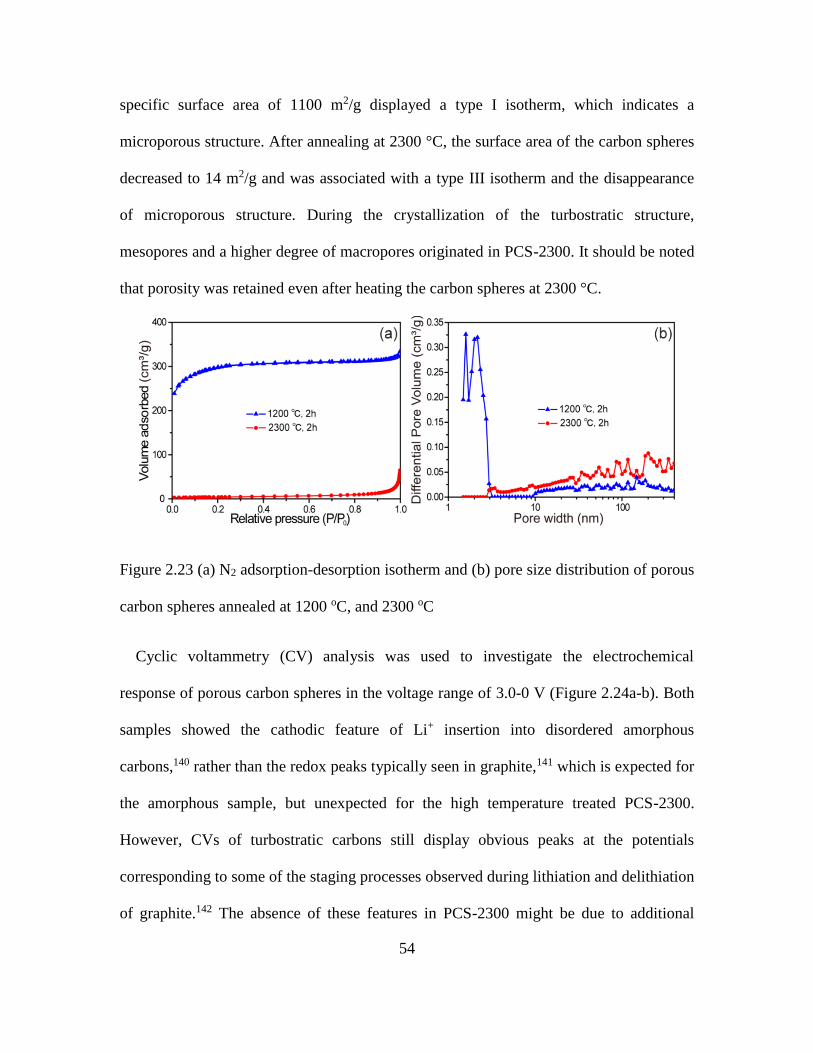
54
specific surface area of 1100 m2/g displayed a type I isotherm, which indicates a
microporous structure. After annealing at 2300 °C, the surface area of the carbon spheres
decreased to 14 m2/g and was associated with a type III isotherm and the disappearance
of microporous structure. During the crystallization of the turbostratic structure,
mesopores and a higher degree of macropores originated in PCS-2300. It should be noted
that porosity was retained even after heating the carbon spheres at 2300 °C.
Figure 2.23 (a) N2 adsorption-desorption isotherm and (b) pore size distribution of porous
carbon spheres annealed at 1200 oC, and 2300 oC
Cyclic voltammetry (CV) analysis was used to investigate the electrochemical
response of porous carbon spheres in the voltage range of 3.0-0 V (Figure 2.24a-b). Both
samples showed the cathodic feature of Li+ insertion into disordered amorphous
carbons,140 rather than the redox peaks typically seen in graphite,141 which is expected for
the amorphous sample, but unexpected for the high temperature treated PCS-2300.
However, CVs of turbostratic carbons still display obvious peaks at the potentials
corresponding to some of the staging processes observed during lithiation and delithiation
of graphite.142 The absence of these features in PCS-2300 might be due to additional

55
disorder from the imposed curvature of the spheres and lack of long-range order between
the various graphitic-like regions of different domains. Similarly, previous
electrochemical studies on carbon onions also did not show staging features during
lithiation possibly because of the lack of long-range order caused by the high curvature of
the stacked sheets.143–145 Another notable feature in the CVs of the porous carbon spheres
is the large reduction current associated with formation of the solid electrolyte interphase
(SEI). The large cathodic peak of PCS-1200 at 0.25 V can be attributed to its high surface
area compared to PCS-2300, causeing more SEI formation. The narrower anodic and
cathodic bands of PCS-2300 also further prove the graphitic structures in turbostratic
carbon spheres.
Figure 2.24 Cyclic voltammogram of porous carbon spheres annealed at (a) 1200 oC, and
(b) 2300 oC at a scan rate of 1 mV/s
The first cycle charge and discharge voltage profiles obtained at a current density of
C/10 for PCS-1200 and PCS-2300 are shown in Figure 2.25a-b, respectively. Due to the
large SEI formation caused by its high surface area (~1100 m2/g), the amorphous carbon
sphere sample PCS-1200 had more irreversible capacity loss than that of PCS-2300
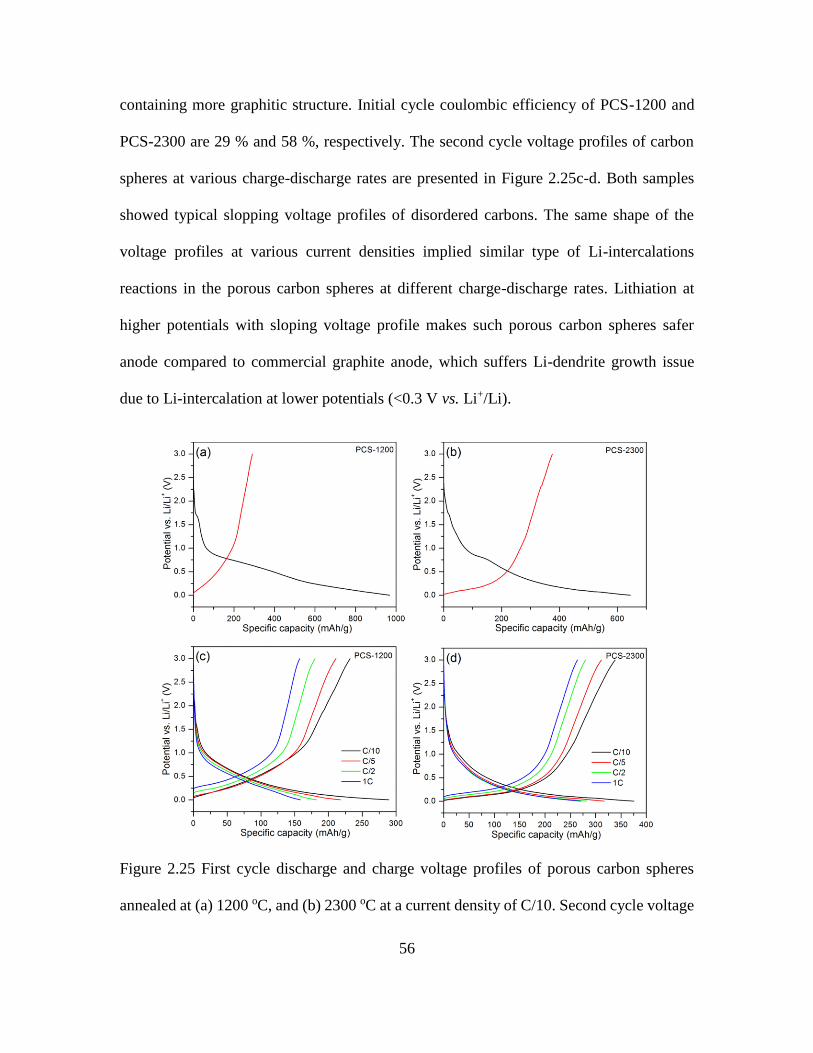
56
containing more graphitic structure. Initial cycle coulombic efficiency of PCS-1200 and
PCS-2300 are 29 % and 58 %, respectively. The second cycle voltage profiles of carbon
spheres at various charge-discharge rates are presented in Figure 2.25c-d. Both samples
showed typical slopping voltage profiles of disordered carbons. The same shape of the
voltage profiles at various current densities implied similar type of Li-intercalations
reactions in the porous carbon spheres at different charge-discharge rates. Lithiation at
higher potentials with sloping voltage profile makes such porous carbon spheres safer
anode compared to commercial graphite anode, which suffers Li-dendrite growth issue
due to Li-intercalation at lower potentials (<0.3 V vs. Li+/Li).
Figure 2.25 First cycle discharge and charge voltage profiles of porous carbon spheres
annealed at (a) 1200 oC, and (b) 2300 oC at a current density of C/10. Second cycle voltage

57
profile at various current densities for porous carbon spheres annealed at (c) 1200 oC, and
(d) 2300 oC
According to the electrochemical rate performances at different current densities
(Figure 2.26a), the Li-ion storage performances of amorphous, turbostratic and
commercial graphite anodes are significant different. At a low rate of C/10, graphite and
PCS-2300 showed a reversible capacity of 378 mAh/g, which equivalent to the
theoretical capacity of graphite (372 mAh/g). However, at higher charge-discharge rates,
specific capacity of graphite anode decreased considerably, while PCS-2300 still kept
significant capacity. For instance, at a current density of 1C, PCS-2300 demonstrated a
discharge capacity of 270 mAh/g, which is 4-fold higher than those of the commercial
graphite anode (60 mAh/g). Under similar experimental conditions, even PCS-1200
showed 2-fold higher (155 mAh/g) capacity than graphite anode. The electrochemical
performance of these turbostratic carbon spheres is notably higher than those of solid
carbon spheres reported previously, which had low reversible capacity and severe
capacity fading.146–149 The poor performance of graphite at high cycling rates is well
known and has been previously attributed to slow kinetics and poor solid-state diffusion
of Li+ within the particles.150

58
Figure 2.26 (a) Electrochemical rate performances of porous carbon spheres annealed at
1200 oC, 2300 oC, and commercial graphite; (b) Galvanostatic cycling performance of
porous carbon spheres annealed at 2300 oC at 1C rate. (c) Electrochemical impedance
spectra of porous carbon spheres annealed at 2300 oC, and commercial graphite
The long term electrochemical stability was tested for the electrochemically most
active turbostratic carbon spheres (Figure 2.26b). After 100 charge-discharge cycles at
current densities of 0.1 and 1 C, PCS-2300 retained stable specific capacities of 365 and
250 mAh/g, respectively. Capacity fading was noticed only during the first few cycles,
which was ascribed to the SEI formation. Further investigation of porous turbostratic
spheres to get insight into the superior electrochemical performance was carried out using

59
electrochemical impedance spectroscopy (EIS). Nyquist plots for PCS-2300 and
commercial graphite anode are showed in Figure 2.26c. The semicircle arises from the
sum of the contact resistance, SEI resistance, and charge-transfer resistance, while the 45o
line is due to solid-state Li+ diffusion.151–154 The smaller diameter and lower solid-state
diffusion resistance of PCS-2300 demonstrated superior Li-ion diffusion in porous carbon
spheres compared to graphite anode. This can be explained by their unique disordered
turbostratic structure and porosity, which results in the faster solid-state Li-ion diffusion,
and superior electrode-electrolyte contact (interfacial kinetics).

60
Figure 2.27 SEM images of porous carbon spheres annealed at 2300 oC (a, b) before
cycling, (c, d) after 100 galvanostatic cycles. Raman spectrum of porous carbon spheres
(annealed at 2300 oC) electrode (e) before cycling, and (f) after 100 galvanostatic cycles.
Structural stability of PCS-2300 during lithiation-delithiation process was examined by
SEM and Raman spectral analysis of pristine and cycled carbon sphere electrodes. In the
composite electrode, carbon spheres are connected together by super-P nanoparticles and

61
PVDF binder (Figure 2.27a,b), creating submicron-sized voids between individual spheres.
The structural integrity of composite electrode and the morphology of individual carbon
spheres retained after 100 galvanostatic cycles (Figure 2.27c,d). No significant amount of
solid electrolyte interface (SEI) was observed on the carbon spheres, which might be due to
the reduced reactivity of PCS-2300 due to low surface area, and uniform current
distribution resulting from spherical morphology. For both pristine and cycled porous
carbon sphere electrodes (PCS-2300), isoenergetic D, G, and 2D bands on Raman
spectrums appeared at 1332 and 1566, and 2668 cm-1, respectively (Figure 2.27e-f). D/G
ratio were also unaffected by charge-discharge cycling. These results further demonstrated
the excellent structural and electrochemical stability of carbon spheres during prolonged
lithiation-delithiation cycles.
In summary, higher Li-ion storage electrochemical performance of carbon spheres were
obtained due to its turbostratic crystal structure and slightly higher porosity than graphitic
carbon. The higher reversible capacities for PCS-2300 compared to PCS-1200 can be
attributed to its turbostratic structure, which may offer graphitic regions with dangling
bonds that can act as additional sites for Li+ adsorption. The disordered graphitic structure
present in PCS-2300 also enable fast insertion of Li-ions to attain superior specific
capacities at faster charge-discharge rates. Moreover, the porosity of the individual carbon
spheres facilitates superior electrolyte contact, which reduces the interfacial charge transfer
resistance, resulting in improved rate performance and long-term cycling stability. The
inexpensive synthesis and superior Li-ion storage performance compared to commercial
graphitic carbon anodes make the porous carbon spheres an excellent anode material for
rechargeable Li-ion batteries.

62
2.6 Conclusions for Studies on Carbon Nanospheres
In summary, a metal salt catalyzed, solution-based spray pyrolysis synthesis technique
was demonstrated able to create individual carbon nanospheres. The particle size could
be easily adjusted from ~10 nm to several micrometers by changing the concentration of
the precursors. By adjusting the ratio of carbon to metal salt precursors, hollow or solid
nanospheres could be acquired without requiring templates. The study indicates that
many kinds of metal salts can be used to form crystalline or amorphous oxides that act as
nucleation sites and catalyze the formation of carbon nanospheres. After the removal of
the metal oxides using acid or annealing at high temperature, porous-structure-carbon
spheres with SSA as high as 1106 m2/g are produced. These materials could be very
promising for energy storage applications such as li-ion batteries and supercapacitors.
The strong adsorption ability of the carbon nanospheres also makes them very promising
as sorbents for water purification and environmental remediation.

63
3 SYNTHESIS OF POROUS CARBON FOAM AND THEIR APPLICAIONS
3.1 Introduction to Porous Carbon foam
Here a facile one-pot synthesis technique without pre-synthesis of any templates or
catalyst was developed, which was able to achieve porous carbon foam with SSA up to
2340 m2/g. The approach uses the direct pyrolysis of a sucrose and zinc nitrate mixture,
with extremely quick (~ 5 min) reaction time and simple post-synthesis treatment. In this
method, the zinc nitrate decomposes and generates gas to blow the melted sugar, similar
to the role of ammonium salt in Wang’s method.29 The ZnO nanoparticles formed from
the decomposition of zinc nitrate can also serve as an etchant during high temperature
annealing119 to further activate the carbon foam and create more porosity just as in
Strubel’s method.21 However, the technique used here is not just the simple combination
of the blowing effect from Wang’s method and etching effect in Strubel’s method. In this
method, the nitrate could also act as an oxidizer to burn the sugar. Meanwhile, the ZnO
nanoparticles also act as frames to prevent the collapse of the melted porous sugar during
the carbonization process. Both of these two factors are critical and make it possible for
the reaction to be finished quickly in one step within a few minutes, which, to the best of
my knowledge, has not been reported before. Moreover, this technique also offers a way
to quickly synthesize other metal or metal oxide/porous carbon composites for multiple
applications. In this work, the role of ZnO and annealing temperature on the structure and
SSA of the carbon foam were systematically studied. The materials were then evaluated
as electrodes for supercapacitors in aqueous electrolyte and showed specific capacitances
as high as 280 F/g at a current density of 0.1 A/g, higher than activated carbons and
64
nanocarbons such as carbon nanotubes and graphene, and still remained as high as 207
F/g even at a high current density of 10 A/g.
3.2 Experimental Details of Direct Pyrolysis and Post Treatment
To synthesize porous carbon foam, sucrose and Zn(NO3)2.6H2O (both from Alfa Aesar)
were mixed with different weight ratios. Typically, 1 g sucrose and 2 g Zn(NO3)2.6H2O
(1g:2g, same naming rule for other ratios) were put in a 100 mL beaker and slowly
melted and mixed thoroughly to form a uniform viscous mixture using a hot place at 120
oC. Then the viscous mixture could be quickly carbonized and form carbon foam in about
5 minutes at ~180 oC on a hot plate or inside a box furnace. If using a hot plate, in order
to heat the precursors more uniformly, a heat gun is recommended to heat the side of the
beaker and make the entire mixture carbonized. If a box furnace were used, the reaction
would be more uniform, since the temperature is more uniform. Due to the formation of
NO2 and NOx gases, it is recommended to place the hot plate or box furnace in a fume
hood with good ventilation.
High temperature annealing experiments were performed by heating the as-prepared
carbon foam at 1200 oC in a tube furnace under N2 gas flowing at 150 sccm for 2 h. For
some samples, a graphite furnace (GT Thermal Technologies Inc, Model: 1050CG) was
used to anneal the samples at up to 2300 oC for 2 h in Ar. In some samples where the
annealing temperature was not hot enough to reduce ZnO, the ZnO was etched with HCl,
followed by thorough washing with DI water and drying.

65
Figure 3.1 Synthesis process and schematic illustration of carbon foam. a-e) Different
stages of the synthesis process: a) the starting mixture of sucrose and zinc nitrate
precursors (0.5 g sucrose and 1g zinc nitrate shown in picture); b,c) the precursors start
reacting at ~ 180 oC, with the zinc nitrate decomposing to ZnO and formation of gases
that cause the melted sucrose to blow into a foam-like structure; d) the carbon foam after
further annealing at high temperature; e) typical TEM image of carbon foam annealed at
1200 oC; f) The molecular schematic illustration for the corresponding steps.
As Figure 3.1 shows, the synthesis of carbon foam could be achieved through the
direct reaction of a sucrose and zinc nitrate mixture in a few minutes. Sucrose and zinc
nitrate were first slowly melted and mixed uniformly at a relative low temperature (~120
oC) (Figure 3.1a). The initiation of the carbonization process was characterized by a color
change in the mixture to yellow (Figure 3.1b) corresponding to the formation of NO2

66
from decomposition of Zn(NO3)2 when the temperature was increased to ~180 oC. The
reaction then proceeded according to the general process:
C12H22O11 + Zn(NO3)2 ∙ 6H2O~180 → Cfoam + ZnO + N2 ↑ +H2O ↑ +NO𝑥 ↑ +CO2 ↑
where Zn(NO3)2.6H2O, a strong oxidizer, decomposed and reacted with sucrose to
generate gases (N2, NOx, CO2, etc.), which acted to blow the melted viscous sugar and
cause it to swell (Figure 3.1b,c).
Meanwhile, the sucrose would dehydrate and polymerize, resulting in the mixture to
change to a brown color and form a foam-like composite containing embedded ZnO
nanoparticles (Figure 3.1f). After the reaction was completed, the ZnO nanoparticles
could be removed using acid or through further annealing at high temperatures. ZnO can
be reduced by carbon at 900 oC119 according to the following reaction:
xC + ZnO>900 → (𝑥 − 1)C + Zn + CO
and then the resulting zinc can evaporate, leaving the black colored porous carbon foam
behind (Figure 3.1e,f).
Thermogravimetric analysis (TGA) was used to further confirm the reactions. Heating
a carbon foam prepared from 1 g sucrose and 2 g Zn(NO3)2.6H2O (1g:2g carbon foam) in
either N2 or air resulted in the weight loss and differential thermogravimetric curves
shown in Figure 3.2. The weight loss peak at around 250 oC for both samples corresponds
to the decomposition of residual Zn(NO3)2.6H2O. The sample started burning in air and
showed a weight loss peak at around 380 oC. For the sample annealed in N2, the sugar
kept carbonizing and showed weight loss until 500 oC. Then, the weight decreased slowly
from 500 oC to 800 oC, which might be caused by the slow reaction between carbon and
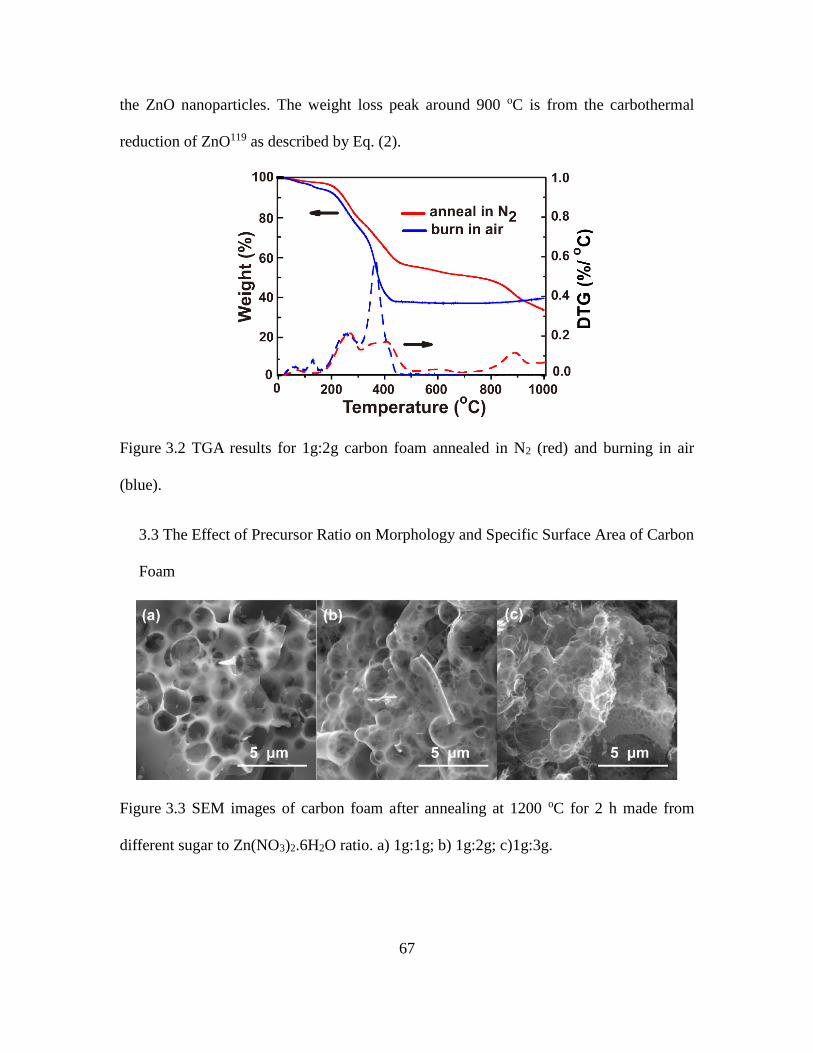
67
the ZnO nanoparticles. The weight loss peak around 900 oC is from the carbothermal
reduction of ZnO119 as described by Eq. (2).
Figure 3.2 TGA results for 1g:2g carbon foam annealed in N2 (red) and burning in air
(blue).
3.3 The Effect of Precursor Ratio on Morphology and Specific Surface Area of Carbon
Foam
Figure 3.3 SEM images of carbon foam after annealing at 1200 oC for 2 h made from
different sugar to Zn(NO3)2.6H2O ratio. a) 1g:1g; b) 1g:2g; c)1g:3g.

68
Typical scanning electron microscopy (SEM) images of the carbon foams are show in
Figure 3.3. It can be seen clearly that by increasing the amount of Zn(NO3)2.6H2O in the
precursor, the carbon foam became more porous and had more smaller pores. This could
be from the increased amount of gas (N2, NOx, CO2, etc.) generated from the
decomposition of Zn(NO3)2.6H2O and the carbonization of sugar, which could form
bubbles in the molten sugar, as seen by the morphology of the carbon foam. Moreover,
the additional ZnO nanoparticles can also etch more carbon119 and form more pores at
high temperatures.
Figure 3.4 a) N2 adsorption-desorption isotherms of carbon foam made from different
sugar to Zn(NO3)2.6H2O ratio and annealed at 1200 oC for 2 h, the inset plots the SSA
against the grams of Zn(NO3)2.6H2O used (R) with 1 g sugar in the precursor; b) the
corresponding pore size distributions calculated using the DFT method.
In order to further study the effect of the sugar to Zn(NO3)2.6H2O ratio on the SSA of
carbon foam, N2 adsorption-desorption isotherms measurements were conducted on three
carbon foam samples with different precursor ratios. Calculated from the curves shown in
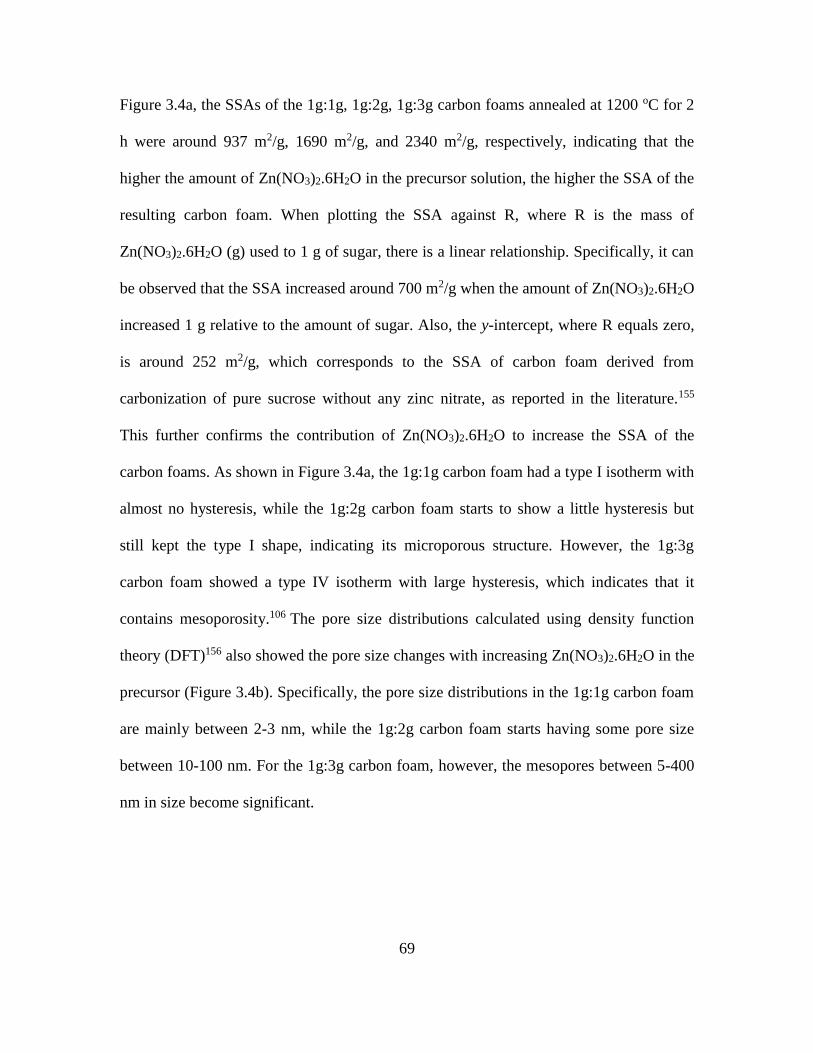
69
Figure 3.4a, the SSAs of the 1g:1g, 1g:2g, 1g:3g carbon foams annealed at 1200 oC for 2
h were around 937 m2/g, 1690 m2/g, and 2340 m2/g, respectively, indicating that the
higher the amount of Zn(NO3)2.6H2O in the precursor solution, the higher the SSA of the
resulting carbon foam. When plotting the SSA against R, where R is the mass of
Zn(NO3)2.6H2O (g) used to 1 g of sugar, there is a linear relationship. Specifically, it can
be observed that the SSA increased around 700 m2/g when the amount of Zn(NO3)2.6H2O
increased 1 g relative to the amount of sugar. Also, the y-intercept, where R equals zero,
is around 252 m2/g, which corresponds to the SSA of carbon foam derived from
carbonization of pure sucrose without any zinc nitrate, as reported in the literature.155
This further confirms the contribution of Zn(NO3)2.6H2O to increase the SSA of the
carbon foams. As shown in Figure 3.4a, the 1g:1g carbon foam had a type I isotherm with
almost no hysteresis, while the 1g:2g carbon foam starts to show a little hysteresis but
still kept the type I shape, indicating its microporous structure. However, the 1g:3g
carbon foam showed a type IV isotherm with large hysteresis, which indicates that it
contains mesoporosity.106 The pore size distributions calculated using density function
theory (DFT)156 also showed the pore size changes with increasing Zn(NO3)2.6H2O in the
precursor (Figure 3.4b). Specifically, the pore size distributions in the 1g:1g carbon foam
are mainly between 2-3 nm, while the 1g:2g carbon foam starts having some pore size
between 10-100 nm. For the 1g:3g carbon foam, however, the mesopores between 5-400
nm in size become significant.

70
Figure 3.5 TEM images at different magnifications of carbon foams made from different
sugar to Zn(NO3)2.6H2O ratios and carbonized at 350 oC for 30 min. a,b) 1g:1g, c,d)
1g:2g, e,f) 1g:3g.
These features could be further explained by the transmission electron microscopy
(TEM) images (Figure 3.5) of the as-made carbon foams that were heated at 350 oC for
30 min. At this point, most of the sugar was carbonized but ZnO had not been reduced by
carbon yet. The carbon adopted a sheet-like morphology and the ZnO nanoparticles could
be found interdispersed within. The ZnO nanoparticles in both the 1g:1g and 1g:2g
carbon foam mainly had two sizes. The smaller particles with around 5 nm size were
found embedded in the carbon matrix surrounding the bigger particles around 20 nm in
size. In the 1g:1g carbon foam (Figure 3.5a,b), the majority of the ZnO nanoparticles
were around 5 nm. However, the bigger particles became significant in the 1g:2g carbon

71
foam (Figure 3.5c,d). This explains why the 1g:1g carbon foam has a type I isotherm with
almost no hysteresis, while the isotherm of the 1g:2g carbon foam starts having the
hysteresis feature. The ZnO nanoparticles in the 1g:3g carbon foam are mainly around 10
nm instead of differentiating into two sizes. Moreover, the ZnO nanoparticles are so
crowded and interconnecting with each other that the carbon phase no longer looks like a
matrix (Figure 3.5e,f). The aggregation of ZnO nanoparticles makes the 1g:3g carbon
foam mesoporous and have a type IV isotherm.
3.4 The Role of ZnO on the Specific Surface Area of Carbon Foam
Figure 3.6 a) N2 adsorption-desorption isotherms of 1g:2g carbon foam treated with
different conditions. Sample S1 was annealed at 600 oC for 2 h then treated with HCl to
remove ZnO; sample S2 was made from S1 by further annealing at 1200 oC for 2 h;
sample S3 was annealed at 600 oC for 2 h and then further annealed at 1200 oC for 2 h
without removing ZnO with HCl. b) the corresponding pore size distributions calculated
using the DFT method.
In order to study the contribution of ZnO to the SSA at high temperature, three 1g:2g
carbon foam samples treated with different annealing conditions were characterized with

72
N2 adsorption-desorption isotherms. Specifically, after the synthesis, all three samples
were heated at 600 oC for 2 h, where most of the carbon source changed to carbon but
had not reacted with ZnO nanoparticles. For samples S1 and S2, the ZnO was removed
with HCl acid and washed with DI water thoroughly. Sample S1 had no further treatment
while S2 was further annealed at 1200 oC. Sample S3 was annealed at 1200 oC directly
without removing ZnO beforehand with HCl. Based on the N2 adsorption-desorption
isotherms (Figure 3.6a), the SSAs of S1 and S2 were 1211 m2/g and 1268 m2/g,
respectively, indicating that further annealing at 1200 oC did not change the SSA much
once the ZnO was removed. However, the SSA of S3 was 1674 m2/g, around 400 m2/g
more than that of S1 and S2, revealing that the presence of ZnO can lead to higher SSA
after annealing at 1200 oC due to the ability of ZnO to etch carbon. The pore size
distribution also reveals that from S1 to S2, further annealing at 1200 oC did not have
much change on the amount of micropores, but caused a small increase in the mesopore
volume. However, the etching effect caused by ZnO nanoparticles at high temperatures
makes the differential pore volume peak increase by about one third in the micropore
region.
3.5 The Effect of Annealing on the Specific Surface Area of Carbon Foam
For porous carbon materials, since the annealing temperatures can significantly change
the pore volume, bond structures, and surface functional groups, they have a great
influence on both the SSA157–159 and carbon electronic conductivity,158–162 which are two
critical factors for carbon materials in many applications, especially as electrode
materials. For this reason, the effect of annealing temperatures on the structure of carbon
foam was systematically studied so that good conductivity in the carbon foam could be

73
achieved by annealing the samples at higher temperatures, while still keeping the SSA
relatively high. According to the N2 adsorption-desorption isotherms of 1g:2g carbon
foams shown in Figure 3.7a, when the temperature was increased from 1200 oC to 1500
oC, the SSA remained almost the same and then started to decrease from 1690 m2/g to
1265 m2/g when the temperature was further increased to 1800 oC. For the sample
annealed at 2300 oC, the SSA had only 62 m2/g remaining.
Figure 3.7 a) N2 adsorption-desorption isotherms of the 1g:2g carbon foam annealed at
different temperatures: 1200 oC, 2 h (green); 1500 oC, 2 h (blue); 1800 oC, 2 h (red); 2300
oC, 2 h (violet), b) the corresponding pore size distributions calculated using the DFT
method.

74
Figure 3.8 TEM images of carbon foam. a,b) 1:2 CF annealed at 1200 oC for 2 h; c,d) 1:2
CF annealed at 1800 oC for 2 h; e,f) 1:2 CF annealed at 2300 oC for 2 h.
To understand this decrease in SSA after high temperature annealing, TEM was used
to study the structural changes in the carbon foam. As shown in the TEM images in
Figure 8, when the annealing temperature increased, the carbon foam started to crystallize
and its surface became smoother. For the sample annealed at 1200 oC, the surface of the
carbon foam sheet was very rough (Figure 3.8a), while the structure was mostly
amorphous, with only one to two layers of graphitic structure (Figure 3.8b). When the
samples were annealed at 1800 oC (Figure 3.8c,d) and 2300 oC (Figure 3.8e,f), the
surfaces of the foam sheets became smoother, and the structures became more crystalline.
The sample annealed at 1800 oC had two to three graphitic layers while the one annealed
at 2300 oC had three or more layers. These results indicate that the crystallization process

75
may cause the coalescence or closing of the small pores and lead to the decrease of SSA,
which also changes the pore size distribution (Figure 3.7b). According to Figure 3.7b, the
pores in the microporous region shifted to larger size when the annealing temperatures
increased from 1200 oC to 1800 oC, while the volume of pores in the mesoporous region
became higher. When the temperature further reached 2300 oC, the volume of the
smallest pores in the microporous region became negligible.
Figure 3.9 Raman spectra of 1g:2g carbon foam annealed with different temperatures:
1200 oC, 2h (green); 1500 oC, 2h (blue); 1800 oC, 2h (red); 2400 oC, 2h (violet). The
asterisk denotes N2 adsorbed from the air during the spectrum acquisition.
The Raman data shown in Figure 3.9 also confirm that the carbon foam started to
crystallize above 1500 oC, since the 2D band at ~2680 cm-1 relating to the stacking order
of the graphitic structure along the c-axis103 became more significant for samples
annealed at 1800 oC and 2300 oC. Moreover, both the D band at ∼1360 cm-1 attributed to
defect and disorder122 and the G band at∼1590 cm-1 corresponding to the sp2 carbon
76
network103,104 became sharper as the annealing temperature increased, which means the
high temperature annealing made the carbon more graphitic. Meanwhile, the curvature of
the graphitic sheets might introduce more defects, which is consistent with the TEM
result (Figure 3.8 d,f).
3.6 Electrochemical Performance of the Carbon Foams as Supercapacitor Electrodes
3.6.1 Electrochemical Measurement Details
The carbon foam powder was put onto stainless steel discs (1.5 cm diameter) directly
without any binder or carbon black to make a ~0.5 mg/cm2 electrode. For the carbon foams
annealed at 1200 oC, in order to improve the wetting with the electrolyte, the carbon foam
was mixed in a slurry with conducting carbon black (10 wt%), polyvinylidene fluoride
(PVdF, 10 wt%), and N-Methyl-2-pyrrolidone (NMP) and coated onto the stainless steel
discs as a film. Then two identical electrodes were assembled into a coin cell with
Whatman filter paper as separator and 1 M H2SO4 as the electrolyte. The coin cell was
sealed with around 1200 psi of pressure. A two-electrode set up was used to measure the
performance of the supercapacitors using cyclic voltammetry with a BioLogic VMP3
potentiostat from -0.5 V to 0.5 V. The specific capacitance was calculated from the
galvanostatic charge-discharge curves. Electrochemical impedance spectroscopy (EIS)
was conducted at open circuit voltage in the frequency range of 1 Hz to 100 kHz with a 5
mV AC amplitude.
3.6.2 Electrochemical Performance
For the batch of carbon foams used for the supercapacitor test, the as-made 1g:3g
carbon foams were annealed at 600 oC for 5 h under N2 atmosphere (designated as 1g:3g
600 oC). Then the ZnO was etched with HCl, followed by washing with DI water and

77
drying at 300 oC. The 1g:3g 700 oC or 800 oC carbon foams were obtained from the 600
oC foams by further annealing at 700 oC or 800 oC for 1 h, respectively.
Figure 3.10 Performance of supercapacitors with carbon foams electrodes in 1 M H2SO4
aqueous electrolyte. a) CV curves obtained at different scan rates for supercapacitors
made from 1g:3g 600 oC carbon foam. b) Galvanostatic charge/discharge curves of
supercapacitors made from 1g:3g 600 oC carbon foam at different current densities. The

78
specific capacitances of supercapacitors made from 1g:3g (c), 1g:2g (d), and 1g:1g (e)
carbon foams treated with different temperatures at different current densities. f) The
specific capacitances of supercapacitors made from 1g:3g, 1g:2g, and 1g:1g carbon
foams annealed at 600 oC at different current densities.
Figure 3.10a shows the typical cyclic voltammetry (CV) curves of supercapacitors
made from 1g:3g 600 oC and Figure 3.10b shows the galvanostatic charge/discharge
curves taken at different current densities. Similar galvanostatic tests were performed on
samples with different precursor ratios and annealing temperatures. The specific
capacitances of the samples treated with different conditions are shown in Figure 3.10c-f
determined by fitting the slope of the linear part of the discharge curve. The specific
capacitance was as high as 280 F/g for the 1g:3g 600 oC carbon foam at a current density
of 0.1 A/g, with 207 F/g still remaining even when the current density increased to 10 A/g
(Figure 3.10c).
Figure 3.11 a) N2 adsorption-desorption isotherms of carbon foam made from different
sugar to Zn(NO3)2.6H2O ratio and annealed at 600 oC for 5 h, b) the corresponding pore
size distributions calculated using the DFT method.

79
The other combinations of precursor ratio and annealing temperature showed lower
specific capacitances. When the post treatment temperature was held constant (e.g. 600
oC), the specific capacitance increased with the ratio of Zn(NO3)2.6H2O in the precursor
mixture (Figure 3.10f), as expected since the SSA increased with the ratio of
Zn(NO3)2.6H2O. Calculated from the N2 adsorption-desorption isotherms shown in
Figure 3.11a, the SSAs for 1g:1g, 1g:2g, and 1g:3g carbon foams annealed at 600 oC
were 788 m²/g, 1069 m²/g, and 1731 m²/g, respectively. Although the SSAs were lower
than those of corresponding carbon foams annealed at 1200 oC with ZnO nanoparticles,
the shape of the N2 adsorption-desorption isotherms and the pore size distribution curves
were similar with those shown in Figure 3.4.

80
Figure 3.12 EIS measurement of supercapacitors made of different carbon foams
annealed with different temperatures. a) 1g:3g carbon foams; b) carbon foams with
different precursor ratio annealed at 600 oC; c), d) 1g:1g, and 1g:2g carbon foams, the
insets are the zoom-in view of the high frequency region.
According to previous studies, the annealing temperature has an influence on the
carbon surface functional groups, especially oxygenated groups,158–163 which directly
relate to the wettability of the carbon surface with the electrolyte. With the removal of
oxygenated surface groups at higher temperatures, the carbon is expected to have less
wettability with the aqueous electrolyte. The annealing temperature also affects the
carbon conductivity dramatically, especially in the range between 600 oC to 800 oC,158–161
where the conductivity can increase one order of magnitude or more. This change could
also be seen from the EIS measurement in Figure 3.12. In the Nyquist plots, the intercept
with the real axis at high frequency represents the ohmic resistance including the
resistance of the electrode materials, electrolyte, and the contact resistance. The ohmic
resistance was similar for all of the different samples. Amongst each batch of carbon
foam prepared with the same precursor ratio, the charge transfer resistance Rct,
represented by the semicircle regions, decreased when the annealing temperature
increased, especially from 600 oC to 700 oC. Specifically, the 1g:3g carbon foams (Figure
3.12a) have much larger resistance than the 1g:1g (Figure 3.12c) and 1g:2g (Figure 3.12d)
carbon foams at different temperatures. Figure 3.12b compares the Nyquist plots for the
carbon foams with different precursor ratios annealed at 600 oC. Since the 1g:3g carbon
foams are more porous and have more large pores (Figure 3.11b), the contact resistance
between the carbon foam particles is more significant than that of the less porous 1g:2g

81
and 1g:1g carbon foams. The difference in the pore structure as a result of the three
carbon foam precursor ratios also causes the change of carbon conductivity to have a
different influence on the capacitance performance when combined with other factors, as
the following discussion. Considering that these two factors can affect the capacitance
properties of the carbon, the performance of the supercapacitors made from all three
types of carbon foams treated with three different temperatures (600 oC, 700 oC, and 800
oC) was studied and shown in Figure 3.10c-e.
As Figure 3.10c shows, the specific capacitances of the 1g:3g carbon foams kept
decreasing when the annealing temperature increased from 600 oC to 800 oC, despite the
fact that the carbon conductivity has increased (Figure 3.12a). Since the ultrahigh SSA
(1731 m2/g, Figure 3.11a) and mesoporous structure (Figure 3.11b) indicate a high
contact area with the electrolyte, this shows that temperature-dependent changes on the
interfacial properties of the carbon foam (e.g. wettability) outweigh the effect of changes
on the carbon conductivity. However, for both 1g:1g and 1g:2g carbon foams, since the
SSAs are much lower than that of 1g:3g carbon foam and the pores are mainly
micropores, the maximum specific capacitance obtained at 700 oC should be due to the
significant increase of the carbon conductivity158–161 (Figure 3.12c,d) and the increase in
the pore sizes (Figure 3.6b and Figure 3.7b). The specific capacitances started decreasing
at 800 oC (Figure 3.10d,e), even though the conductivity was slightly better than that of
the carbon foam annealed at 700 oC (Figure 3.12c,d). This could be due to the surface
dewetting from to the loss of the oxygenated goups.158,160,161 A similar phenomenon
showing a dependence of the specific capacitance on the annealing temperature was also
reported on other porous carbons recently.22

82
Figure 3.13 Cycle life of supercapacitor made with 1g:2g 700 oC carbon foam at a current
density of 10 A/g.
The supercapacitor made with 1g:2g 700 oC carbon foam was used to study the cycle
performance. The capacitance retention remained at 100% (Figure 3.13) after 10,000
charge/discharge cycles at a current density of 10 A/g, which demonstrates very good
long-term stability.
Figure 3.14 a) CV curves obtained at different scan rates for supercapacitor made from
1g:2g carbon foam annealed at 1200 oC with ZnO nanoparticles for 2 h. b) CV curves
obtained at scan rate of 50 mV/s for supercapacitors made of different carbon foams.

83
To further study the influence of the wettability of the carbon foam surface on the
specific capacitance, a 1g:2g carbon foam annealed at 1200 oC with ZnO nanoparticles
for 2 h was used to test the performance as supercapacitor electrodes. Due to the etching
effect of ZnO nanoparticles at high temperature, the SSA was as high as 1690 m²/g
(Figure 3.7a), much higher than that of 1g:2g 600 oC carbon foam, 1069 m²/g (Figure
3.11a). Moreover, the carbon conductivity also improved a lot, as seen by the rectangular
shape of the CV curves (Figure 3.14a). However, due to the bad wettability, the
capacitance was not as good as expected. The specific capacitance was only around 125
F/g at a 50 mV/s scan rate, while the one for the 1g:2g 600 oC carbon foam was as high
as around 175 F/g at same scan rate (Figure 3.14b). The results reveal that in aqueous
electrolyte, the wettability could be the dominant factor on the performance of the carbon
foam-based supercapacitors.
From these results, it can be seen that the carbon foams can act as high capacitance
supercapacitor electrodes, with a specific capacitance as high as 280 F/g at a current
density of 0.1 A/g, which is higher than most values reported for carbon nanotubes
(50-100 F/g),135 graphene (100-250 F/g),5,7 and activated carbon (100-200 F/g).24,48,135.
The carbon foam performance is comparable with the recently demonstrated
three-dimensional strutted graphene (250 F/g, at 0.5 A/g),29 KOH activated porous carbon
nanosheets (300 F/g, at 0.5 A/g),23 and even nitrogen doped KOH activated porous
carbon (300 F/g, at 0.1 A/g).164 However, the synthesis method to achieve the highly
porous carbon foam is simple and does not require doping or pre-synthesized templates
or particles.
84
3.7 Conclusions
In summary, a facile one-pot technique able to fabricate foam-like porous carbon have
been developed without pre-synthesizing any hard templates or precursors. By simply
adjusting the ratio of sugar to Zn(NO3)2.6H2O, the carbon foams with different SSAs and
pore size distribution can be easily achieved at a large scale. Due to the unique roles that
ZnO nanoparticles act during the synthesis and post annealing stages, a high SSA up to
2340 m²/g is obtained. The excellent electrochemical performance of the carbon foam
makes it very promising for potential applications as electrode materials in the energy
storage field. Moreover, the unique properties and the scalable synthesis make these
novel carbon foams suitable for many other applications, such as sorbents and catalyst
supports.
85
4 BIMORPH ACTUATORS
4.1 Introduction to Bimorph Actuators
In this work. the facile fabrication of printed active origami (PAO) was developed using
common plastic films and coatings of single-walled carbon nanotubes. A walking robot
was made from a common plastic sheet coated with conductive inks. The conductive inks
were printed onto plastic films, then cut with scissors, folded into a desired shape and
activated by on-board, circuitry. The solid-state actuators are multifunctional energy
transducers powered by heat, light, or electricity. The maximum observed force produced
by an actuator was 60x its own weight. Actuators were also demonstrated to bend more
than 90 degrees. The actuators were repeatedly activated for nearly 50,000 cycles without
significant loss of performance for a sub-hertz actuator and 1,000,000 cycles in the case of
a 30 Hz actuator.
The actuation of the thermal bimorph actuators can be described by the thermal
expansion of the polymer film during Joule heating of the CNT/polymer composite film.
The bending is caused by the high van der Waals adhesion between the CNTs and polymer,
and the roughly 2 orders of magnitude lower thermal expansion coefficient of the CNTs165
constraining one side of the plastic substrate, analogous to a simple bimetal actuator. The
unique combination of characteristics that comprise this actuation system creates one of
the most facile, yet versatile fabrication methods for creating PAO.
Compared to actuators using electroactive polymers (EAPs) that might give similar
performance, considering the weight of the entire structure,166 the PAO actuators have
some distinct advantages: (i) The low sheet resistance of CNT films allows for the use of
low voltages to drive the current needed for electrothermal actuation. This allowed the use

86
of batteries to power the robot. (ii) These actuators were made from common polymer
films, rather than electroactive or ferroelectric polymers, highlighting their versatility. (iii)
Due to the optical characteristics167 and excellent electrical conductivity168 of CNTs, these
actuators can also be powered by light, heat, or microwaves. (iv) These actuators were easy
to fabricate. In some cases, the conductive inks were painted on by hand. The simple
device architecture provided design flexibility that allowed the construction of several
different PAO devices.
Due to their simple structure and these distinct advantages, the actuators were also used
for photo/thermal detection applications when their size was decreased to micro scale.
Unlike the large size actuators, the micro-actuators can actuate and respond to heat and
light much faster. Based on the simple parallel plate capacitor structure, the photo/thermal
sensors were easily fabricated with these mico-actuators. And a minimum 20 µW laser
radiation was detected using the photo/thermal sensors in the measurement.
As another kind of bimorph structure actuators, the electrochemical actuators based on
electroactive materials were also demonstrated in this work. Unlike the thermal bimorph
actuators driven by thermal energy, the electrochemical bimorph actuators made use of the
volume change of the eletroactive material during the electrochemical reactions. Since
there is no energy loss from the heat, the electrochemical actuators are very suitable for
underwater applications. Using a sandwich structure, an electrochemical actuator was
fabricated that can bend toward two directions by alternatively conducting the
electrochemical reaction.

87
4.2 Experiment Details of Thermal Bimorph actuators
4.2.1 Printing Techniques and CNT Ink Preparation
Single-walled carbon nanotubes (Carbon Solutions, P3) were oxidized169 in order to
render them less hydrophobic and easier to disperse compared to un-functionalized CNTs
or CNTs grown by chemical vapor deposition. Inks were made by mixing and then
sonicating170 a 0.1-5% weight ratio (typically 0.3%) of nanotubes in a 1:1 mixture of
ethanol and water. A light centrifugation step using a micro-centrifuge at 13,000g for 30
seconds was performed in some cases to remove large bundles of nanotubes.171 Patterning
was achieved using stencils, silk screen printing and/or inkjet printing. Multiple coatings
were used to lower the sheet resistance to the typical single digit Ω/ range. The low sheet
resistance allows for a smaller driving voltage to be used to achieve actuation. Other
conductive coatings with single digit sheet resistances were tested as replacements for the
single walled carbon nanotubes. Silver paint was too rigid after drying to bend when a
voltage was applied. Sputtered gold did not adhere well enough to the substrate to constrain
one side and induce curvature.
4.2.1.1 Stencil Mask
Most actuators were made with a stencil mask such as scotch tape cut with a razor blade
or a laser-cut stencil secured to the plastic film with adhesive. The plastic substrate was
cleaned with acetone or ethanol and dried with compressed air prior to ink deposition. The
nanotube inks were deposited by pouring them onto the stencil-patterned plastic films for
low viscosity inks or squeegeed in for the high viscosity inks. The ink was then allowed to
self-level to the thickness of the tape and dried with a heat gun.

88
4.2.1.2 Ink-Jet
The carbon nanotubes were dispersed in ethanol, water and 1-cyclohexyl-2-pyrrolidone
(CHP) at a 4:4:1 ratio respectively. The CHP helped with wetting characteristics and
solution stability. The mixture was sonicated in room temperature followed by 5 minute
13,000g centrifuge step to remove large nanotube bundles. The supernatant solvents were
evaporated in cases when the concentration of nanotubes was deemed to be too low. This
process varied the actual ratio of solvents, so a variety of solvent ratios were actually used.
Dimatix Materials Printer DMP-2800 is used for the ink-jet printing. The accompanying
11610 Dimatix Materials Cartridge has a nozzle size of 22 μm and provided 10 pL per
droplet.
4.2.1.3 Screen Printing
A stencil was made by coating a polyester mesh with Chromaline Chromablue screen
printing emulsion. The emulsion was air dried for about an hour. A positive image of
the actuator circuit design was printed onto transparency film as the photo-mask. The
screen was placed in an exposure unit and exposed to UV light for two minutes to cure
the emulsion. The screen was rinsed with water to dissolve any unexposed emulsion.
Carbon nanotube ink was deposited on the silk screen and pulled across the image with a
plastic squeegee to deposit a thin layer of CNT ink onto the plastic film. The supplies
were purchased from Advanced Screen Technologies.
Inks for screen printing were made using the inks for stencil and Inkjet patterning
techniques. Phase separation was observed with an optical microscope using only a 50:50
water-ethanol solvent mixture. Screen clogging and de-wetting were problems with the

89
water-alcohol mixture. Stability and screen clogging problems were mitigated by
centrifuging the inks, then evaporating the solvent to achieve higher concentrations.
4.2.2 Plastic Film Selection
Many common plastic films were tested in this work. The plastic films and their part
numbers (P/N) are listed below: Polyimide (Kapton) - P/N 2271K73, polyoxymethylene
(acetal) - P/Ns 5742T31, 5742T11 and 5742T51, polycarbonate (PC) - P/N 85585K102,
polyester (PE) - P/N 8567K52, cellulose acetate - P/N 8564K44, Acrylonitrile butadiene
styrene (ABS) - P/N 5751T31, polyvinyl chloride (PVC) - P/N 8562K11 and polyether
ether ketone (PEEK) - P/N 4671T21, were purchased from McMaster Carr.
Plastic films were selected as substrates for the patterned nanotube coatings based on
several criteria. Selected films had a Young’s modulus large enough to retain their shape
after being folded like paper origami, and could support their own weight when configured
as a walking structure. Various plastic films (with thickness of 76.2, 127 and 254 μm) were
selected and tested for actuation based on their high linear coefficients of expansion (α),
glass transition temperatures (Tg), and melting points (Fig. 4.1A-B). All plastic films tested,
including films not meeting the modulus criteria, produced force and movement. However,
polyoxymethylene (acetal) and polyimide (Kapton) films had the best performance, based
on properties depicted in Fig. 4.1 A-B. An example of an actuator made by this method is
shown in Fig. 4.1 C-D.

90
Figure 4.1 (A) The selection of polymer films was based on the expansion coefficient (α)
being higher relative to other polymers and the modulus being high enough for the polymer
to support its own weight, as a robot, but not so high as to limit movement. Acetal certainly
sticks out with its high thermal expansion and midrange modulus. Kapton however does
not appear to be different than the other polymer, aside from its midrange modulus. (B) The
modulus changes with temperature, so a second polymer selection criterion was based on
the plot of expansion coefficient versus the glass transition temperature. Kapton’s high Tg

91
(temperature at which a polymer’s modulus rapidly decreases) allowed greater total linear
expansion than other polymers. (C) An actuator fabricated using an acetal film substrate,
before power is applied to the actuator and (D) deflection after power is applied. (D-inset)
Thermal image of the powered actuator showing uniform heating (false color scale depicts
temperature in degrees Celsius).
4.3 Characterization of Thermal Bimorph Actuators
In order to power the actuator with electricity, the center of the CNT coating was
removed to form a U-shape for CNT layer so that U-shape of CNT layer can act as a
resistor and be heated by electricity uniformly. The actuators were characterized by
measuring the force generated for a given power of electricity and the maximum force to
failure. The force exerted by the actuator is an important characteristic for a walking robot,
since it determines how much load it can carry in addition to its own weight. To understand
the effect of actuator geometry on the magnitude of the force exerted, several actuators
were fabricated with different widths, lengths and thicknesses. The force was determined
by considering the actuator as a cantilever172 and measuring the force exerted on a Mettler
XP205 balance connected to a computer for data acquisition using Lab View. Actuation
was controlled through Lab View via a data acquisition card (NI USB-6009 DAQ)
connected to a relay breakout board and DC power supply. The DAQ also recorded the
signal from a voltage divider circuit, which monitored the resistance of the actuators with
time.

92
4.3.1 Temperature and Power Relation of Active Beam Calculation
Figure 4.2 Schematic of a cantilever composite beam comprised of a CNT layer on a
plastic film with length L, width w, and thickness h.
Heat-transfer analysis was used to predict the temperature of the actuator as a function of
power input. The printed active origami is modeled as a rectangular cantilever beam
comprised of a plastic strip coated with a CNT layer as shown schematically in Fig. 4.2.
The composite beam is activated by supplying power, P, to the CNT layer, which causes
internal heating and a temperature rise in the CNT. The temperature in the CNT layer is
T, while the temperature of the plastic substrate before activation is To and the temperature
gradient across the composite beam is, ΔT = T-To, is given by
PAh
h
t
Q
Ah
hT
1
'
1
'
(4. 1)
where h is the thickness, h’ is heat conductivity A is the area normal to the heat flow,
Q/t is the heat flux or power, P.

93
The heat flow through the CNT layer is controlled by single and multiple junctions in
the 3-D CNT network, which has been analyzed by Chalopin et al.173 and Prasher et al.174
From the paper by Chalopin,173 the thermal conductivity of a CNT network is given by:
gd
lh 1
2
18.0' (4. 2)
where l is the length and d is the diameter of CNT, 1 is the density of the CNT layer,
is the thermal conductance of a CNT junction, and g is the density of graphene.
Substituting Eq. 4.2 into Eq. 4.1 gives
PAl
hdT
g
118.0
2 (4.3)
The density of the CNT layer, which can be written in terms of the mass, mCNTL, and
the thickness, h1, of the CNT layer, is given by
Ah
mCNTL
1
1 (4.4)
which can be combined with Eq. 4.3 to give:
Phml
hdT
CNTL
g
)/(18.0
2
1
(4.5)
Eq. 4.5 indicates that the temperature change on the CNT layer is independent of the
width of the composite beam specimen as observed in the experiment (Fig. 4.3A).
The thermal conductance of the CNT layer can be obtained by considering that the 3-D
CNT network is comprised of a series of single and double junction.174 Heat flow through
single junctions is not influenced by other CNTs because the CNTs are widely spaced (>
1 m). In contrast, heat flow through multiple (double) junctions is influenced by other

94
CNTs when the junction spacing is less than the coherence length, which is about 1 m at
50Hz.174 The CNT network utilized in this study, shown in Fig. 4.2, is typically
comprised of a combination of single junctions and multiple junctions. Thus, the
conductance, , of the 3-D CNT network can be estimated as
mjmjsjsj VV
(4.6)
where V is the volume fraction; the subscripts sj and mj denote single junction and double
junction, respectively. Eqs. 4.5 and 4.6 were combined and utilized to compute the
temperature of the active beam as a function of power input. All of the material
parameters, which are tabulated in Table 4.1, are either measured experimentally or taken
from the literature. The theoretical values reported by Prasher, et al.174 for the
conductance of single and multiple junctions of a 3-D CNT network were used. The only
unknown parameters are the volume fractions of the single and multiple junctions in the
3-D CNT network. Fitting the model to the experimental data shown in Fig. 4.3A
provided volume fractions of 14% and 86% for the single junction and multiple junctions,
respectively. These values are consistent with the micrograph shown in Fig. 4.2, which
reveals that most the CNT junctions are less than 1 m while a few are larger than 1 m
apart. The finding suggests that heat transfer in the 3-D CNT network is dominated by
multiple junctions.

95
Table 4.1 Material parameters for the temperature-power computation
Parameter Value, unit Source
d 12 nm Rinzler et al.169
h 127 m Measured
g 7.6 E-7 kg.m2 Prasher et al.174
mCNTL/h1 3.39 E-2 kg/m Computed from CNT layer
density and area; this study
h1 1.36 m Measured
l 1 m Prasher et al.174
sj 50 E-12 W/K Prasher et al.174
mj 3.5 E-12 W/K Prasher et al.174
Using Eq. 4.5, ΔT can be computed once the power input, P, is specified. The
experimentally obtained CNT layer temperature (T) was determined by using a thermal
camera (FLIR-T400) (Fig. 4.1D, inset) for each applied P and was in close agreement with
the theoretical predictions for 3 different actuator widths (Fig. 4.3A). Moreover, both
experimentally derived values for temperature and the calculations indicate that the
temperature on the CNT layer is independent of the width of the composite beam.
The dependence of the force on the dimensions of the actuator is shown in Figs. 4.3B-D.
The standard actuator had dimensions of 3 cm x 1 cm x 0.0127 cm and each dimension was
correspondingly evaluated. For each dimensional test, only one corresponding dimension
was changed. Various widths (0.5, 1, and 1.5 cm) with the same length (3 cm) and
thickness (0.0127 cm) are compared in Fig. 4.3B. A comparison of lengths (2, 3, and 5 cm),
using a constant width (1 cm) and thickness (0.0127 cm) is presented in Fig. 4.3C. The
effect of changing the thickness (0.0127 and 0.0254 cm) of the samples is shown in Fig.
4.3D. In each case, testing was conducted by powering the actuator for 30 seconds in 1V

96
increments in order to reach the steady state temperature (Tmax). Between each power cycle,
the actuator was allowed to cool for 30 seconds to ensure a full return to room temperature.
Figure 4.3 Comparison of experimental (solid) and calculated (dashed) results (A) The
temperature generated for actuators with different widths as a function of applied power. (B)
The exerted force for different actuator widths as a function of applied power. (C) The
exerted force for different actuator lengths as a function of applied power. (D) The exerted
force for different actuator thicknesses as a function of applied power (blue and red traces)
the modulus change for two samples with different thickness as a function of applied
power (black and orange traces).

97
4.3.2 Force of an Active Beam
The Timoshenko beam theory82 was used to determine the force, F, and curvature, ρ, for
CNT-coated plastic films. According to this beam theory:
L2
3EI =F
(4.7)
))mn
1+mn)(m+(1+m)+h(3(1
m)+αΔT(161
22
2
(4.8)
where I donates the area moment of inertia (for a rectangle cross section area I = (wh3)/12),
ρ the curvature of the actuator, E the modulus of the actuator, w is the width of the actuator,
h is the thickness of the actuator, L is the length of the actuator, m the ratio between the
thickness of the CNT film and the plastic, n is the ratio of the modulus of the CNT films
and the plastic, Δα is difference between the linear thermal expansion coefficients of the
CNT film and the plastic, and ΔT is temperature gradient across the thickness of the
composite beam. Combining eq. 4.7 and 4.8 leads to
L
TkEwhF
8
2
(4.9)
)mn
1+mn)(m+(1+m)+3(1
m)+(1
22
2
k (4.10)
and the T term can be obtained from Eq. 4.3. Substituting T into Eq. 4.9 gives
1
3
/18.0
2
8 hml
Pd
L
kEwhF
CNTL
g
(4.11)
which can be used to design and control the deflection of composite beam through the
power input, P. For illustration, Eq. 4.11 was utilized to compute the force response of the
98
composite beam of a CNT layer on an acetal film for various thicknesses, widths, and
lengths of the composite beam. The material properties for these computations were
obtained from experimental data.
The Young’s modulus of CNT films has been reported to vary from 10-100 GPa.173 This
wide range of values was narrowed by experimentally determining the Young’s modulus
for 10 sample actuators made in the lab. The actuators were set up as cantilevers. One end
of the plastic strip was clamped and small weights were placed on the other end. The
deflection was measured with a ruler and recoded along with the value of the weight placed
on the end. A graph was made from the plotted data and the slope was determined. The
slope of the line was used to calculate the Young’s modulus using the equation:sI
gLE
3
3
1 ,
where I is area moment of inertia; g = 9.81 m/s; s is the slope of stress – strain plot. The
modulus (E) was around 2.6 GPa, matching the literature values for acetal films and similar
for nanotube coated plastic films and bare films. The nanotube coating introduced a change
of 10% or less and was not measureable within the experimental error. The nanotube
coating thickness was measured by scanning electron microscopy.
The modulus of the acetal and carbon nanotube films are: Eacetal ≈ 2.6GP, Ecarbon =
10-15Eacetal, assuming Ecarbon = 12Eacetal then n = 12. SEM images were used to determine
the nanotube coating thickness (Fig. 4.2). The carbon nanotube film is about 1/100 of the
thickness of the plastic, so m=0.01 therefore k = 0.494, from Eq. 4.10. The expansion
coefficient of acetal αacetal is about 110-150 x 10-6 / K, taking αacetal = 137 x 10-6 / K, in order
to fit well with the experimental data. The expansion coefficient of nanotube film is very
small175,176 compared to that of acetal, αnanotubes<< αacetal, so, Δα≈ αacetal. A sample with the

99
dimensions 𝐿 = 3 cm, 𝑤 = 1.0 𝑐𝑚, h=0.127 mm, putting all these values into Eq. 4.11, the
force equation becomes F = 1.392P. The force generated by samples with different
dimensions was calculated using the same Eq. 4.11 and the results are shown in Figs.
4.3B-D.The force response for various thickness values is presented in Fig. 4.3D. The
force response for various widths and various lengths are presented in Figs. 4.3B and 4.3C,
respectively. In all cases, the computed forces are in good agreement with the measured
values. Thus, Eq. 4.11 can be used for designing and manipulating the motion of printed
active origami made from CNT-coated plastic films simply by controlling the power input.
The force generated by samples with different dimensions was calculated using Eq. 4.11
and the results are shown in Figs. 4.3B-D. In all cases, the computed forces are in good
agreement with the measured values at low powers (i.e. low temperatures). Thus, Eq. 4.11
can be used for designing and manipulating the motion of printed active origami made
from CNT-coated plastic films simply by controlling the power input. However, for
increasing power (temperature), the measured force started to deviate from the theoretical
value. This was a result of the temperature being too close to the Tg of the polymer
substrate, which induced polymer chain relaxation and structural changes.177 This
non-linear behavior observed at high powers indicates that the modulus is decreasing with
temperature as indicated in Fig. 4.3D.
The experimental data and calculations in Fig. 4.3 show that the maximum force for a
given actuator is achieved for a thick and short design. Conversely, the calculation also
revealed that longer and thinner designs provide greater deflection. Actuators
demonstrated curvature on both axes of the plastic film plane, but commonly favored
curvature primarily perpendicular to the longest dimension. A 2 cm × 2cm × 0.0254 cm
100
actuator was fabricated that developed more than 9 g force (0.088 N), as measured on the
balance pan, which was 60 times its own weight. The force to weight ratio using actuators
with electroactive polymers (EAPs) is often calculated using the force produced over the
weight of the conductive coating, while ignoring the weight of the plastic substrate and
liquid used for the electrolyte.178 In this case, the entire device weight for the actuator is
considered.
4.3.3 Force Measurement and Durability Cycling Data
To determine the durability of these actuators, actuators made from acetal and Kapton
were tested for maximum cycling rate (Fig. 4.4). The voltage was adjusted (15-30 V) to
heat the samples quickly, with on/off times of tens of milliseconds. The actuators typically
reached 20-30 Hz. High actuation rates were possible with thinner films (127 μm or less).
The cycling rate was intrinsically limited by the thermal conductivity of the polymer and
the film thickness. Nanotube-coated Kapton films were compared to bare films after
reaching 300 oC in an oven for several minutes with a thermal camera. The nanotube
coated sample cooled faster, although the exact rate was not determined. The increase is
expected given the higher surface area that the nanotube coating provides, so the coating
modified the thermal transfer rate and contributed to higher frequency actuation.
The actuator was setup in a cantilever configuration for the force measurement172 that
used a Mettler 205 balance as the force sensor that was connected to a computer serial port
and controlled by Lab View software for Mettler balances available on-line. Data
acquisition and control of the actuator timing was achieved using Lab-View software with
a National Instruments data acquisition card (NI USB-6009 DAQ) connected to a
computer via USB. The output signal from the DAQ was sent to a break-out board with

101
relays that switched on to connect the power supply directly to the actuator. The actuators
resistance was measured by a voltage divider circuit connected to the DAQ and recorded as
voltage (Vout), as shown in Fig. 4.6B. The actuator’s resistance was calculated using the
equation 2
out
in21 R -
V
VR=R
and the power was calculated using
22
V)V(V=P outoutin . In the
circuit, R2 is a resistor with resistance of 22 Ω, and Vin is the voltage from the power supply.
In order to measure the resistance of device, LabVIEW was used to measure the voltage of
the divider resistance Vout.
The durability of an example actuator (acetal substrate 3cm x 1.5cm x 0.0127cm) was
tested for 50,000 full cycles. Data was recorded for the force and resistance changes with
the cycles. The working voltage was 10V, the current was 0.07A and the on/off time to
5s/7s respectively, which were based on the requirement of the walking robot. The
recorded force changed less than 10% after the ~50k cycles, shown in Fig. 4.4. The
durability of the fast cycling actuators was also tested. An example Kapton actuator cycled
1,000,000 times at 30 Hz without any observable changes. A fast actuating (20 Hz) dragon
fly was designed and fabricated as shown in Fig. 4.5E.
The small resistance change that occurred might be due to changes in humidity,
structural changes (movement) or loss of metallic nanotubes. The metallic nanotubes are
known to carry the majority of the current in nanotube networks. The metallic nanotubes
were shown to burn in air when high current was passed through them.79
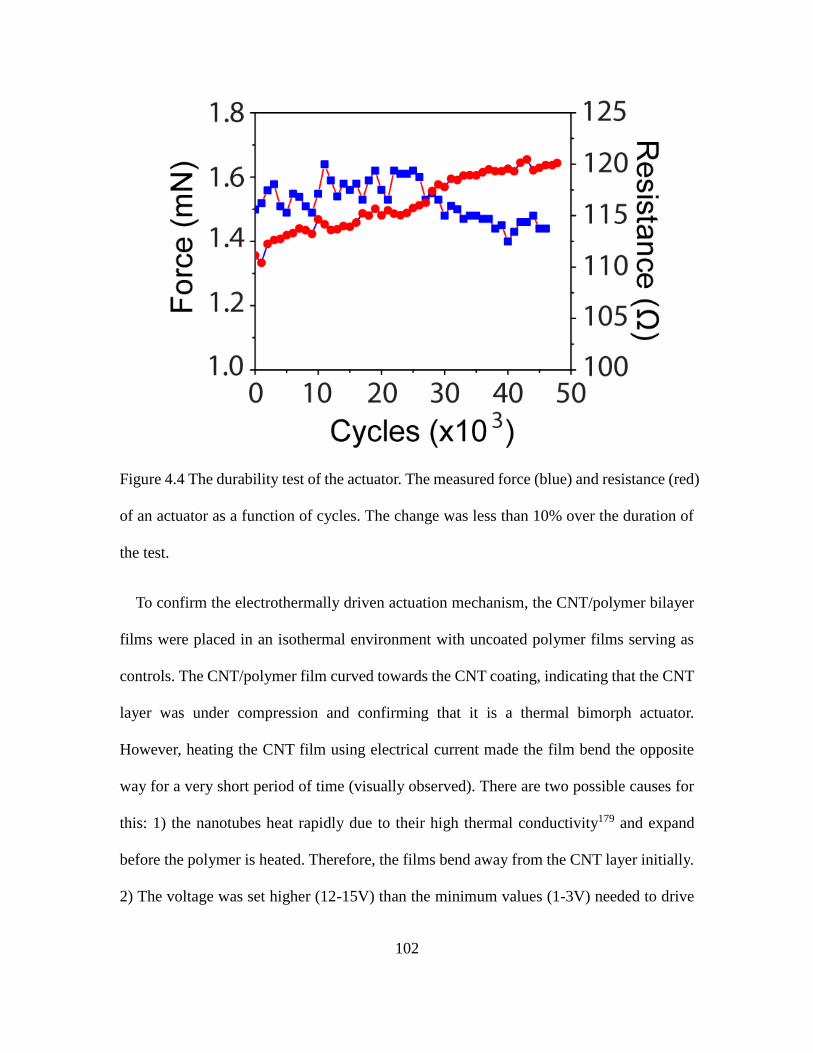
102
Figure 4.4 The durability test of the actuator. The measured force (blue) and resistance (red)
of an actuator as a function of cycles. The change was less than 10% over the duration of
the test.
To confirm the electrothermally driven actuation mechanism, the CNT/polymer bilayer
films were placed in an isothermal environment with uncoated polymer films serving as
controls. The CNT/polymer film curved towards the CNT coating, indicating that the CNT
layer was under compression and confirming that it is a thermal bimorph actuator.
However, heating the CNT film using electrical current made the film bend the opposite
way for a very short period of time (visually observed). There are two possible causes for
this: 1) the nanotubes heat rapidly due to their high thermal conductivity179 and expand
before the polymer is heated. Therefore, the films bend away from the CNT layer initially.
2) The voltage was set higher (12-15V) than the minimum values (1-3V) needed to drive

103
actuation to increase heating rates. The polymer expands closest to the nanotube coating,
while the heat is still traveling through the polymer film causing the actuator to bend
towards the cooler side. The actuator quickly bends the opposite direction once the heat
reaches the entire volume of the plastic film. Thus, the actual actuation mechanism may be
more complicated than for a bimetallic system. Based on the calculated and experimental
results, three design constraints were considered for fabrication of an active origami robot:
(i) deflection distance, (ii) exerted force, and (iii) operating temperature.
4.4 The Applications as Printed Active Origami
An actuator was fabricated that developed the force needed to carry the weight of the
circuits and the structure itself, (e.g. about 0.5grams for small robot in Fig. 4.5A-D) The
actuator also needed to move 1 cm per step, so that 50k cycles would equal 0.5 kilometers.
These requirements were based on the minimum criteria a robot needed to achieve for the
Google Lunar X-Prize (www.googlelunarxprize.org). A walking robot was made as shown
in Fig. 4.5D. The dimensions chosen for the actuators (legs) were 2 cm x 0.6 cm x 0.0076
cm. The robot body was fabricated using a laser cut Kapton stencil coated with adhesive
Fig. 4.5A. Silver ink was used as the electrical connection pathways on the main body of
the robot Fig. 4.5B. The robot's circuit in Fig. 4.5C was made by inkjet printing silver to
form the circuit traces on polyethylene naphthalate and then attaching the circuit to the
main body of the robot with tape or glue. This modular method of fabrication was favored
over printing the entire device as one unit, as different circuits could be designed and
interchanged for the same robot body. The legs were controlled initially with Lab View
through the 6009 DAQ and relay breakout board. The robot was powered by a single 12 V
A23 battery, but could also be powered by 2-3 AAA and AA batteries (3-4.5V) and was
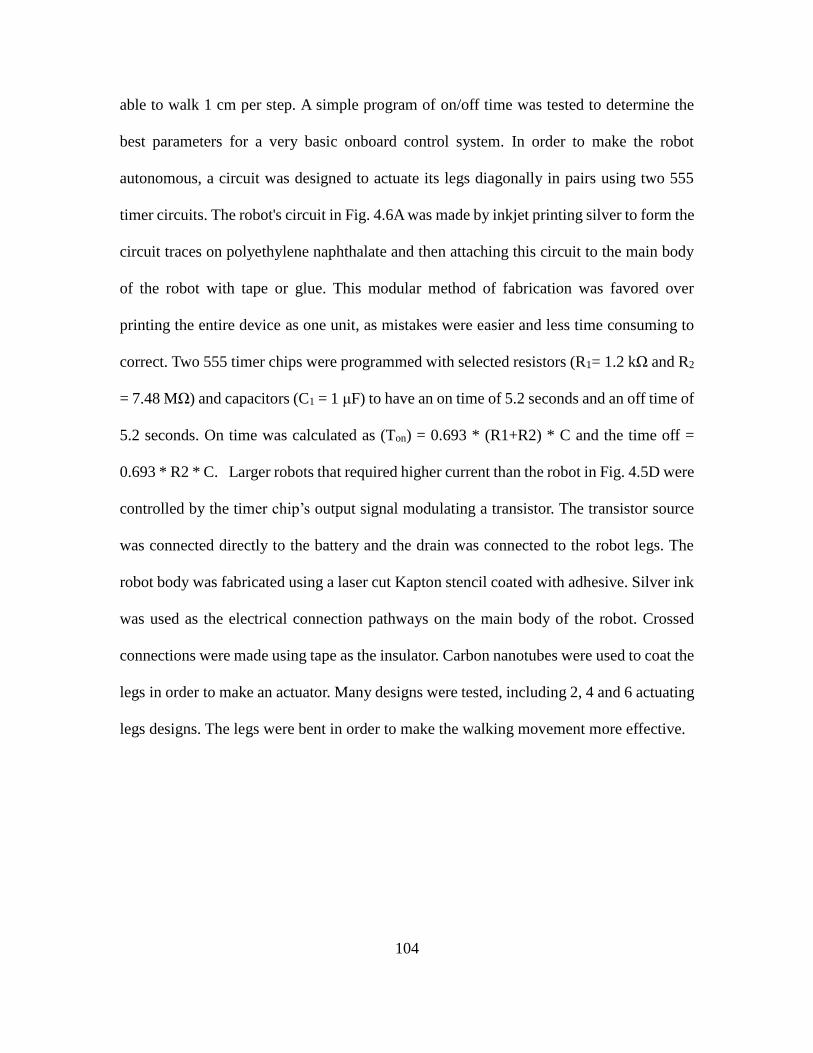
104
able to walk 1 cm per step. A simple program of on/off time was tested to determine the
best parameters for a very basic onboard control system. In order to make the robot
autonomous, a circuit was designed to actuate its legs diagonally in pairs using two 555
timer circuits. The robot's circuit in Fig. 4.6A was made by inkjet printing silver to form the
circuit traces on polyethylene naphthalate and then attaching this circuit to the main body
of the robot with tape or glue. This modular method of fabrication was favored over
printing the entire device as one unit, as mistakes were easier and less time consuming to
correct. Two 555 timer chips were programmed with selected resistors (R1= 1.2 kΩ and R2
= 7.48 MΩ) and capacitors (C1 = 1 μF) to have an on time of 5.2 seconds and an off time of
5.2 seconds. On time was calculated as (Ton) = 0.693 * (R1+R2) * C and the time off =
0.693 * R2 * C. Larger robots that required higher current than the robot in Fig. 4.5D were
controlled by the timer chip’s output signal modulating a transistor. The transistor source
was connected directly to the battery and the drain was connected to the robot legs. The
robot body was fabricated using a laser cut Kapton stencil coated with adhesive. Silver ink
was used as the electrical connection pathways on the main body of the robot. Crossed
connections were made using tape as the insulator. Carbon nanotubes were used to coat the
legs in order to make an actuator. Many designs were tested, including 2, 4 and 6 actuating
legs designs. The legs were bent in order to make the walking movement more effective.
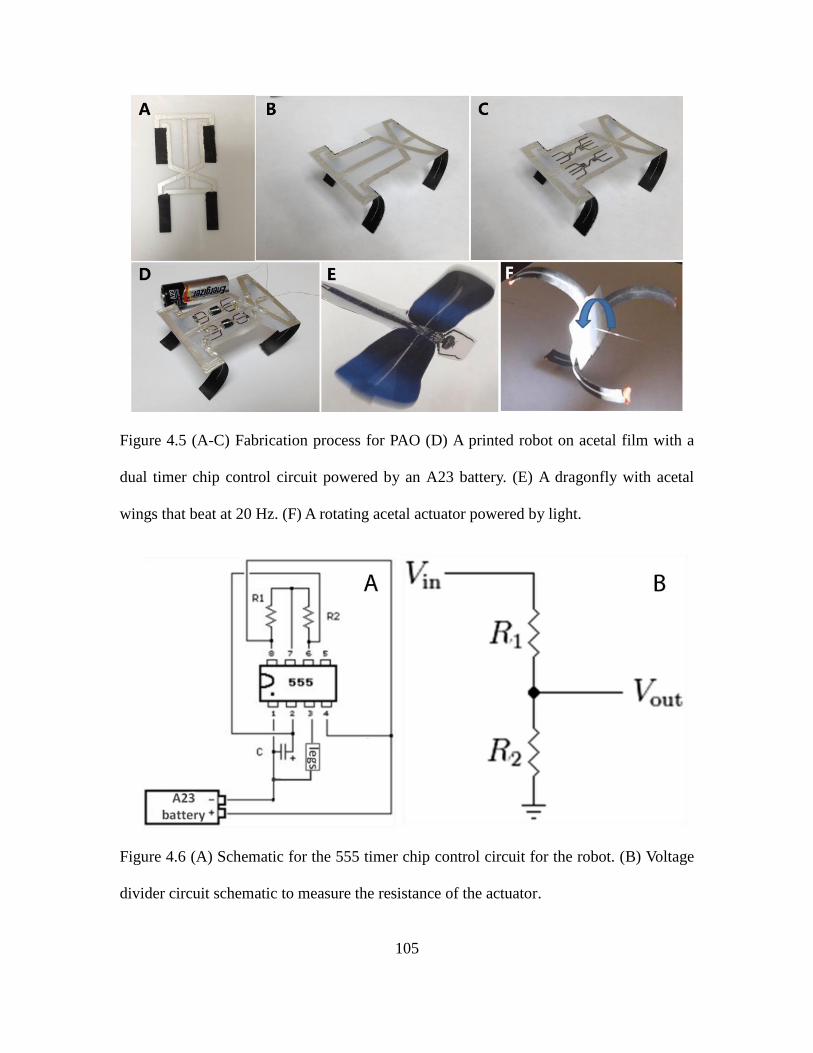
105
Figure 4.5 (A-C) Fabrication process for PAO (D) A printed robot on acetal film with a
dual timer chip control circuit powered by an A23 battery. (E) A dragonfly with acetal
wings that beat at 20 Hz. (F) A rotating acetal actuator powered by light.
Figure 4.6 (A) Schematic for the 555 timer chip control circuit for the robot. (B) Voltage
divider circuit schematic to measure the resistance of the actuator.

106
Due to their optical absorbance characteristics, the CNTs can also absorb light and
convert it to heat180 and serve as multifunctional energy transducers. This was
demonstrated by fabrication of a light-driven rotating actuator as shown in Fig. 4.5F. The
shape is a pair of vertex-intersecting parabolas extending away from each other. Each
parabola is made of two legs, with very small copper wire weights on the ends of the legs.
These small weights offer more driving force when they extend past the center of gravity
and introduce a rotational motion by moving the moment out away from the wire to create
torque. Each leg was coated with CNTs, which absorbed light and heated the polymer
substrate while under irradiation with a 300 W Xenon lamp. The increased temperatures
cause the actuator to bend outwards. Upon cooling in the dark, the copper weight was
pulled towards the center, thereby letting each leg return to its original position. The axis of
rotation was fixed by a copper wire threaded through the center of the disc and the rotation
speed was about 5s per cycle.
4.5 Applications as Photo/Thermal Detectors
Since the actuators can respond to both light and heat, they were also studied for the
applications of photo/thermal detectors based on the similar actuator structure. Unlike the
requirement in the walking robot application, the force generated by the actuators is not as
important. However, the deflection or the curvature of the actuators responding to the light
or heat is more important so that they can be sensitive enough to serve as detectors.
According to the equations mentioned before, the curvature of a suspended beam could
be expressed as Eq. 4.8. For any specific case, when the materials have been determined,
the expansion difference Δα would be fixed. The thickness h and operation temperature ΔT
can also be fixed for each application. Then the curvature will mainly depend on m, the
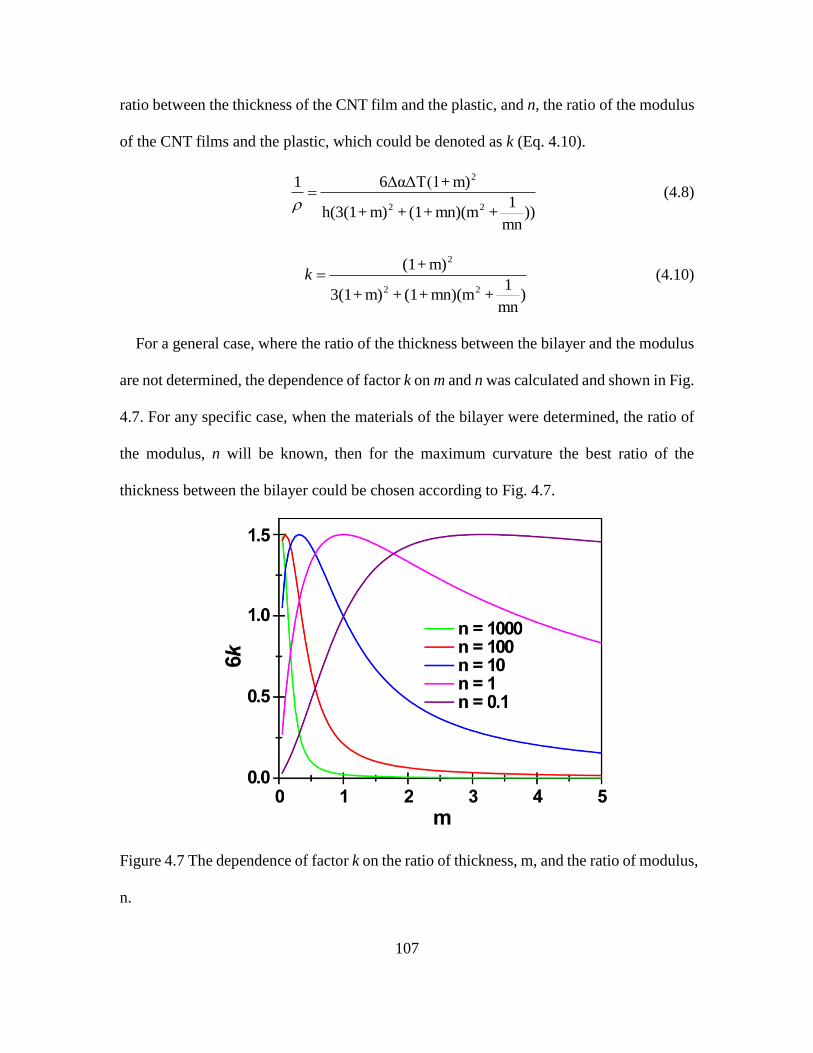
107
ratio between the thickness of the CNT film and the plastic, and n, the ratio of the modulus
of the CNT films and the plastic, which could be denoted as k (Eq. 4.10).
))mn
1+mn)(m+(1+m)+h(3(1
m)+αΔT(161
22
2
(4.8)
)mn
1+mn)(m+(1+m)+3(1
m)+(1
22
2
k (4.10)
For a general case, where the ratio of the thickness between the bilayer and the modulus
are not determined, the dependence of factor k on m and n was calculated and shown in Fig.
4.7. For any specific case, when the materials of the bilayer were determined, the ratio of
the modulus, n will be known, then for the maximum curvature the best ratio of the
thickness between the bilayer could be chosen according to Fig. 4.7.
Figure 4.7 The dependence of factor k on the ratio of thickness, m, and the ratio of modulus,
n.

108
As the demonstration of the concept, we fabricated a micro-actuator and tested its
response to a laser beam (Fig. 4.8). The micro-actuator was fabricated with a layer-by-layer
coating technique. First, a thin ZnO layer was coated onto the substrate using ZnO sol-gel
for the following release step. Then a thin PVDF polymer layer was coated on the top of
ZnO layer using 5% PVDF solution in NMP. Finally, the CNT ink was coated onto the
PVDF to form the bilayer actuator structure. After the final layers were cut into the desired
shape of the actuator, an HCl solution was used to etch the ZnO layer to release the actuator.
In order to study how fast the actuator responded to the light, a ~10 mW 405 nm laser point
was swept across the micro-actuator. After analyzing the recorded video, the actuator was
found to bend almost 90o in around 0.1 s, just as Fig. 4.8 shows. It means that at smaller
sizes the thermal bimorph actuator could respond to light or heat very fast, which is very
good and attractive for the photo/thermal sensor application.
Figure 4.8 Photos of a micro-actuator (size: ~ 1 mm × 200 μm) responding to a 10 mW 405
nm laser beam. Taken under a microscope.
Based on the similar structure of this micro-actuator, a photo/thermal sensor was further
fabricated and tested for the demonstration of the concept. As Fig. 4.9a,b shows, the sensor

109
worked based on the capacitor effect. Specifically, the CNT conductive layer worked as an
electrode, while the bottom FTO strip layer worked as the other electrode. The polymer
layer and the air gap acted as the dielectric. When the actuator was heated by light or heat,
its deflection would cause the distance to change between the CNT and FTO electrodes,
which would further change the capacitance between them. Fig. 4.9 c and d shows the
distance change before and after a laser beam shined onto the actuator. The capacitance
change was recorded with a capacitance meter, as Fig. 4.9e shows, where the capacitance
responded to the laser very quickly. Theoretically, by calibrating the capacitance change to
the corresponding power or temperature, the sensors could be used for photo or thermal
detection. And due to the wide adsorption bands of CNTs, the sensor could be potentially
used for UV-vis to IR detection. As a preliminary result, a minimum power as low as 20
μW 405 nm laser beam was detected in the lab. However, for real application, more work is
still needed in future for the improvement of both fabrication process and detailed
characterization.

110

111
Figure 4.9 Schematic, photos and characterization of a photo/thermal sensor. (a) Top and
side views of a schematic photo/thermal sensor based on parallel plate capacitor; (b) Top
view of the photo/thermal sensor based on the CNTs/PVDF micro-actuator and FTO
conductive strip; (c) and (d) side views of the same sensor when a laser beam was shined
on and off; (e) the corresponding capacitance change between CNTs and FTO conductive
layers.
4. 6 Electrochemical Actuators
Although the thermal bimorph actuators have very simple structures and can be easily
fabricated, some drawbacks, such as their high energy consumption and inability to be used
for underwater operation, limit their applications. For these reasons, electrochemical
actuators are still needed, especially for applications in water. Among the strategies for the
electrochemical actuators, ionic polymers have been studied the most.76,181–183 Here,
instead of using ionic polymers, an electrochemical actuator based on a MnO2/Au
nanostructure composite was developed. Due to its low cost and good performance, MnO2
has been widely studied for energy storage applications, such as supercapacitors.184–186 Just
like many other energy storage materials, the volume of MnO2 will change during the
intercalation process of small ions, such as Li+, or H+. This effect was used for the actuation
in the MnO2/Au electrochemical actuator.

112
Figure 4.10 Schematic for the fabrication of MnO2/Au/PDMS electrochemical actuator.
Figure 4.10 shows the process for the fabrication of the electrochemical actuator. In
order to have a flexible porous electrode for the deposition of MnO2, ZnO nanowires were
used as the template for the fabrication of porous gold electrodes. Firstly, ZnO nanowires
were grown on Si or glass surface with a liquid-phase chemical method described in the
literatures before.187,188 The as-made ZnO nanowires are shown in Fig. 4. 11 a, which are
uniform and almost vertically aligned nanowires arrays. Secondly, 20-30 nm gold was
coated onto these ZnO nanowires with sputtering for 5-10 minutes. The SEM image in Fig.
4. 11b shows that almost all ZnO nanowires were covered entirely by the rough Au layer.
After etching the ZnO nanowires templates with HCl acid, the tube-like porous Au
interconnected network was obtained, which looks like a nanoscale Au carpet (Fig. 4.11 c).
This porous Au interconnected network was then used for the electrochemical deposition
of MnO2 in 100 mM Na2SO4 and 10 mM MnSO4 solution with a current density of 100
μA/cm2 for around 1h (Fig. 4.11 d). The electrodeposition was conducted using a
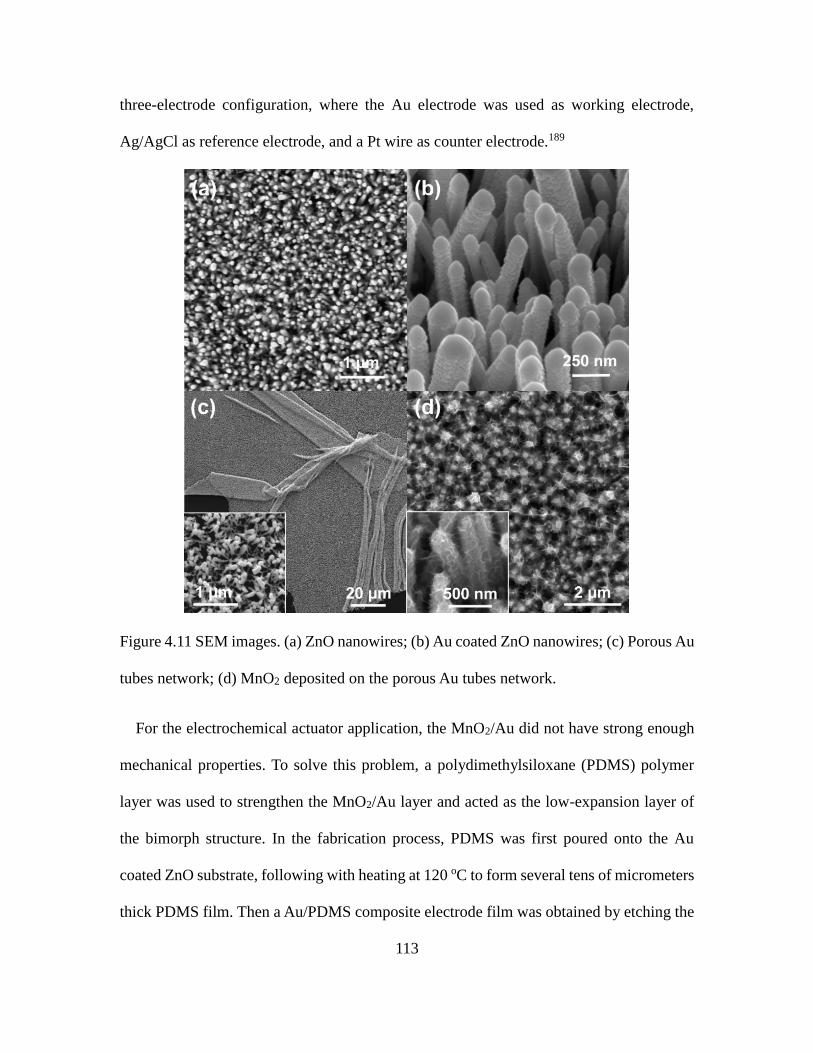
113
three-electrode configuration, where the Au electrode was used as working electrode,
Ag/AgCl as reference electrode, and a Pt wire as counter electrode.189
Figure 4.11 SEM images. (a) ZnO nanowires; (b) Au coated ZnO nanowires; (c) Porous Au
tubes network; (d) MnO2 deposited on the porous Au tubes network.
For the electrochemical actuator application, the MnO2/Au did not have strong enough
mechanical properties. To solve this problem, a polydimethylsiloxane (PDMS) polymer
layer was used to strengthen the MnO2/Au layer and acted as the low-expansion layer of
the bimorph structure. In the fabrication process, PDMS was first poured onto the Au
coated ZnO substrate, following with heating at 120 oC to form several tens of micrometers
thick PDMS film. Then a Au/PDMS composite electrode film was obtained by etching the

114
ZnO nanowires template with HCl acid. Finally, the MnO2/Au/PDMS electrochemical
actuator was fabricated by further depositing MnO2 onto the Au/PDMS electrode. A
MnO2/Au/PDMS electrochemical actuator that could bend and roll is shown in Fig. 4.12a,
which was operated in 0.1 M Na2SO4 solution with a three-electrode set up, where the
actuator was working electrode, Ag/AgCl as reference electrode, and a Pt wire as counter
electrode. When the potential was scanned back and forth over the range of -0.2 V to 1.0 V,
the following reaction: MnO2 + Na+ + e- ←→ MnOONa will caused the volume change of
the MnO2/Au composite electrode while the volume of PDMS layer remained stable. As a
result, the actuation of the bimorph was triggered.
Figure 4.12 MnO2/Au/PDMS actuators. (a) An electrochemical actuator made with
MnO2/Au composite electrode on only one side of PDMS strip (~ 0.5 × 3 cm2) can bend

115
and roll into circle shape; (b) An actuator having MnO2/Au electrode on both sides of
PDMS strip (~ 0.5 × 2.5 cm2) can bend toward to both directions.
Since the volume change only happened on the MnO2/Au layer during the
electrochemical reaction process, the actuator shown on Fig. 4.12a could only bend
towards one direction. In order to make an actuator that could bend in both directions, a
MnO2/Au/PDMS/Au/MnO2 sandwich design was used. Basically, the MnO2/Au composite
electrode was put on both sides of the PDMS layer. During the operation, one side of the
MnO2/Au electrode acted as the working electrode, while the other side of MnO2/Au
electrode worked as the counter electrode. For this case, the volume change along with the
redox reaction of MnO2 would happen alternatively, therefore the actuator could bend
toward to both sides alternatively (Fig. 4.12b).
In this work, the concept of the electrochemical actuator based on the intercalation
reaction of the energy storage material was shown. With different designs, the actuator can
bend to one direction or two directions. However, for the real application, more study is
still needed to characterize the actuators more systematically. Based on the same concept,
other energy storage materials with more volume change during the intercalation reaction
could also be promising and worthwhile for studying their application in electrochemical
actuators.
4.7 Conclusions
The unique combination of characteristics that comprise this actuation system creates
one of the most facile, yet versatile fabrication methods for creating PAO. This work will
give engineers new approaches for designing active printed electronic systems. These
actuators are light-weight, low-cost and enable rapid prototyping. Designs can be created

116
with CAD programs and printed in real time. These new devices are likely to find great
utility as actuators, printed robots and active origami. The light weight aspect might allow
new satellites and space exploration vehicles to be created at much lower costs of
development and deployment. Other innovations will benefit from printed multifunctional
and adaptive structures, such as small aircraft design and construction, robotics that are
created on demand and 3-D self-folding electronics – all from common plastic films. The
thermal bimorph actuators also showed very great potential for the application as wide
radiation detection sensors. The electrochemical bimorph actuators offer the actuation for
the underwater applications which are beyond the ability of thermal bimorph actuators.
117
5 CARBON NANOTUBE ELECTRODES FOR LOW-PPB-LEVEL CHROMIUM(VI)
DETECTION
5.1 Introduction to Cr(VI) Detection with Amperometric Technique
In amperometric-based sensing techniques, the potential between the working and
reference electrodes is held constant at the redox potential of the detecting species. The
current changes between working and counter electrodes are recorded when different
concentrations of detecting species are added. Since the current change is linear with the
concentration of the detecting species, it can be used for calculating the unknown
concentration of the detected species. Due to the different redox potentials of each
species, the amperometric technique is very selective. Here a printable technique was
used to fabricate carbon nanotube (CNT)-based electrodes for the electrochemical
detection of hexavalent chromium, Cr(VI). The CNT electrodes showed electrochemical
current responses as high as 500 nA/ppb Cr(VI) when a large area electrode was used.
The limit of detection was shown to be as low as 5 ppb Cr(VI). The electrode could be
deposited on multiple substrates, including fluorine-doped tin oxide (FTO) conducting
glass, gold coated flexible plastic, filter paper, and commercially available printed
electrodes. H2O2 was demonstrated to be a selective reducer, and a H2O2 reduction
technique was developed for the Cr(VI) detection, which also could be integrated with
normal amperometric detection methods. A flow detection system based on CNT/printed
electrodes was also demonstrated, which could be potentially used for the real-time
monitoring of Cr(VI) levels in flowing water.
118
5.2 Experimental Details
5.2.1 Carbon Nanotube Paste
To fabricate the carbon nanotube (CNT) electrodes, 18 mg of P3 CNTs (Carbon
Solutions) was dispersed in 5 mL of a 50:50 water: ethanol solution (by volume) by
sonicating for 20 min with a probe sonicator in pulse mode to make a CNT paste.
5.2.2 Fabrication of Carbon Nanotube Electrodes
A series of different electrodes were prepared using the CNT paste. The paste was
uniformly coated with a spatula onto FTO glass to make a ~1 cm2 working electrode. To
serve as a comparison, a gold film electrode was made by sputtering gold onto FTO glass
directly.
For the flexible electrode, a PET (polyethylene terephthalate) plastic sheet was coated
with Ti for 5 min then Au for 10 min using a sputtering coater. Then the CNT paste was
coated on top of the metal layers with a spatula.
Screen printed carbon electrodes (part#: RRPE1002C) were obtained from Pine
Research Instrumentation. The CNT paste was coated on the rectangular carbon working
electrode with a spatula.
The CNT paste was directly painted or filtered through filter paper to fabricate a CNT
coated filter paper electrode with about 30 cm2 active area.
5.2.3 Electrochemical Measurements
A three-electrode set up was used to measure the concentration of Cr(VI), in which Pt
wire worked as counter electrode while a saturated calomel electrode (SCE) was used as
reference electrode. In the printed electrodes case, the printed carbon electrode coated

119
with CNT paste was used as the working electrode, while the counter and reference
electrodes were used as they were.
All measurements were performed on BioLogic SP-150 electrochemical potentiostat.
Different concentrations of Cr(VI) (K2Cr2O7 solution) were dissolved in 0.1 M HCl. Cyclic
voltammetry (CV) and amperometric measurements were used to determine the
Cr(VI)/Cr(III) redox reaction peak and Cr(VI) concentration, respectively.
5.2.4 Water Samples
Most measurements were conducted in 0.1 M HCl in nanopure water solution. For the
real water case, samples were collected from 7 different sites at the Santan Generating
Station in Gilbert, AZ, labelled Sites A through G as shown in Fig. 5.1. Detailed
information regarding the different samples is shown in Table 5.1. In this report, the F
sample was used, representing the blowdown from cooling towers 1 – 4, for the real
sample test.
Figure 5.1 Sample sites for SRP water tests.

120
Table 5.1 Descriptions for the water samples
Site Description
A Raw canal water after clarifier
B Canal water discharge from service water tank, chlorinated
C CT-6 blowdown discharge, with bisulfite, de-chlorinated
D Final plant discharge waste (ST-005)
E Discharge from A well
F CT1-4 blowdown discharge, de-chlorinated
G Raw canal water before clarifier
5.3 Characterization of CNT Electrode for Cr(VI) Detection
Fig. 5.2 shows a typical scanning electron microscopy (SEM) image of CNTs after they
were coated as a paste onto FTO glass. The CNT bundles form a net-like film, which has
very good electric conductivity, while the pores allow for access of the electrolyte and
Cr(VI) ions.
Figure 5.2 SEM image of CNT on FTO glass.
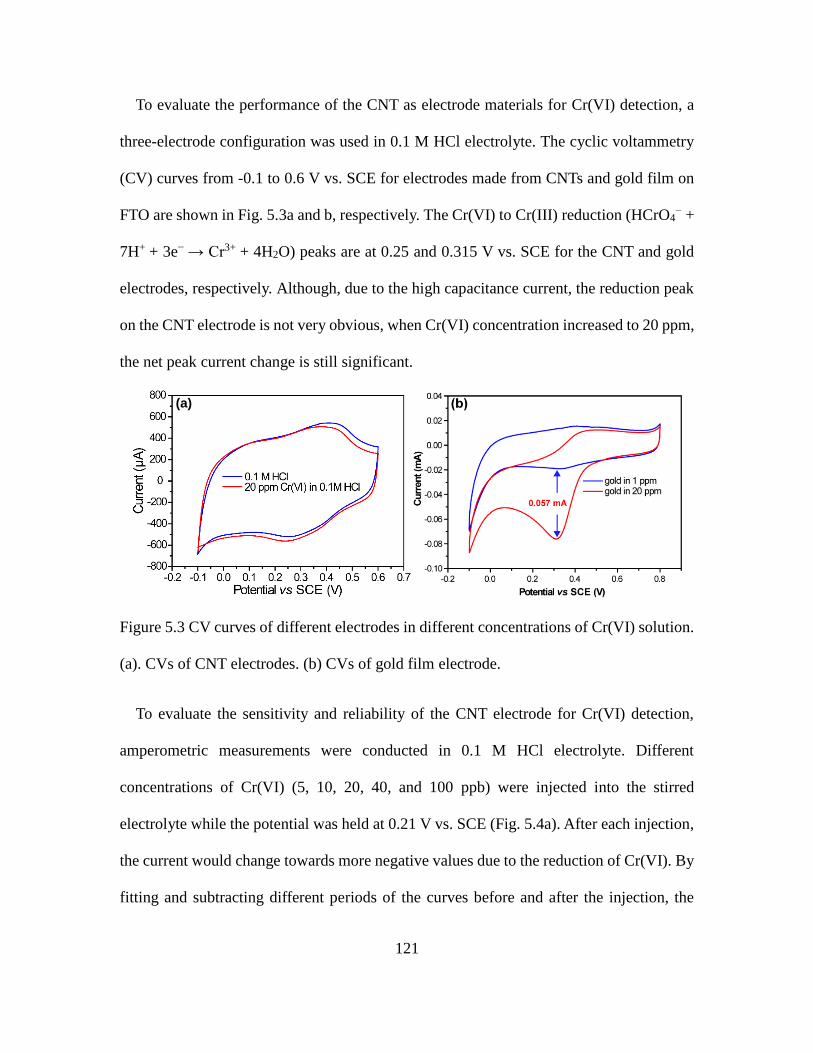
121
To evaluate the performance of the CNT as electrode materials for Cr(VI) detection, a
three-electrode configuration was used in 0.1 M HCl electrolyte. The cyclic voltammetry
(CV) curves from -0.1 to 0.6 V vs. SCE for electrodes made from CNTs and gold film on
FTO are shown in Fig. 5.3a and b, respectively. The Cr(VI) to Cr(III) reduction (HCrO4− +
7H+ + 3e− → Cr3+ + 4H2O) peaks are at 0.25 and 0.315 V vs. SCE for the CNT and gold
electrodes, respectively. Although, due to the high capacitance current, the reduction peak
on the CNT electrode is not very obvious, when Cr(VI) concentration increased to 20 ppm,
the net peak current change is still significant.
Figure 5.3 CV curves of different electrodes in different concentrations of Cr(VI) solution.
(a). CVs of CNT electrodes. (b) CVs of gold film electrode.
To evaluate the sensitivity and reliability of the CNT electrode for Cr(VI) detection,
amperometric measurements were conducted in 0.1 M HCl electrolyte. Different
concentrations of Cr(VI) (5, 10, 20, 40, and 100 ppb) were injected into the stirred
electrolyte while the potential was held at 0.21 V vs. SCE (Fig. 5.4a). After each injection,
the current would change towards more negative values due to the reduction of Cr(VI). By
fitting and subtracting different periods of the curves before and after the injection, the
(a)

122
reduction current versus Cr(VI) concentration was obtained as shown in Fig. 5.5a, which
has very good linearity and shows the electrode has a sensitivity of 21.65 nA/ppb Cr(VI).
To evaluate the reproducibility of the electrode, the CNT electrode was thoroughly rinsed
with nanopure water and dried with a heat gun. The amperometric curve of the recovered
CNT electrode is shown in Fig. 5.4b. By comparing with Fig. 5.4a, it can be seen clearly
that the sensitivity almost remains the same, which shows that the CNT electrode has very
good reproducibility.
Figure 5.4 Amperometric response of CNT electrode at 0.21 V when different
concentrations of Cr(VI) were add into 0.1 M HCl. (a) original CNT electrode, (b)
recovered CNT electrode.
(a) (b)
123
Figure 5.5 The reduction current versus Cr(VI) concentrations at different levels. (a) CNT
on FTO electrode, (b) CNT on gold coated PET electrode.
In order to make a flexible electrode so that it can be put inside of a water pipe for real
time monitoring, a gold coated PET plastic sheet was used as the substrate for the CNT
electrode. Due to the flexibility of this electrode, it can be wrapped the sheet into a roll
shape so that it can fit into a small volume while maintaining a relatively larger working
area. Fig. 5.6 shows the amperometric measurement of the CNT electrode on gold coated
PET (5 cm x 1 cm), which has around 5 times more area than the CNT on FTO electrode.
The relative reduction current versus concentration plot is shown in Fig. 5.5b. With the
larger working area, the sensitivity was increased to almost 90 nA/ppb, while the linearity
was still well maintained. Although the noise in the signal was still relatively high, the
current change of even 5 ppb level injection was significant compared with that in Fig. 5.4a.
The dependence of sensitivity on the electrode working area also offers another way to
increase the detection limit of the electrode with the additional benefit of the electrode
being flexible. This will be further studied in future research to find the limitation of this
detection method.

124
Figure 5.6 Amperometric response of CNT on gold coated PET electrode at 0.21 V when
different concentrations of Cr(VI) were injeted into 0.1 M HCl, and the picture of the
corresponding electrode (CNT coated area: ~1.5 cm x 2 cm).
5.4 CNT/Filter Paper Flexible Electrodes for Cr(VI) Detection
Due to its smooth surface, the gold coated plastic sheet does not promote good adhesion
with the CNT layer, which makes it hard to fabricate large area uniform electrodes. To
solve this problem, CNT coated filter paper electrodes were developed (Fig. 5.7b). Due the
high porosity of the filter paper, the CNT paste could be easily uniformly coated onto the
filter paper. The CNT paste could even be filtered through the filter paper to form the
electrode very quickly. Due to the high conductivity of the CNTs, the resistance of
CNT/filter paper electrode is only several tens of ohms. Nonetheless, to ensure a good
electrical connection with the CNT/filter paper electrode, a layer of silver paint was coated
on the edge of the electrode for the contact to the potentiostat. As shown in Fig. 5.7b, a
layer of polyvinylidene fluoride (PVDF) was used to cover the top area of the electrode in

125
order to restrict the electrochemical reaction to only the CNT active area. The layer also
prevents the solution from wetting the top area that was coated with silver paint.
Because of the large active area (~30 cm2) and high porosity of the filter paper, the
sensitivity of the CNT/filter paper electrodes was as high as ~500 nA/ppb. Although the
noise also increased to around 1 μA, the signal to noise ratio still improved significantly
compared to the CNT/FTO or CNT/Au-PET electrodes. As Fig. 5.7a shows, even 5 ppb
Cr(VI) addition can cause a significant current change (2.5 μA), while the current change is
linear to the concentration of Cr(VI). The influence of Cr(III) was also tested. Even adding
200 ppb of Cr(III) did not cause any noticeable current change, indicating that the electrode
is very selective for Cr(VI).
Figure 5.7 (a) Amperometric response of CNT coated filter paper electrode at 0.21 V when
different concentrations of Cr(VI) or Cr(III) were injected into 0.1 M HCl. (b) The picture
of the corresponding CNT coated filter paper electrode (CNT active area: ~ 5 cm x 6 cm).

126
5.5 CNT Coated Printed Electrodes for Cr(VI) Detection
Although the CNT/filter paper electrode had much better sensitivity due to its high
surface area, its high capacitive current from adsorption of ions at the electric double layer
made the relaxation time to reach the equilibrium very long. This characteristic is not ideal
for practical applications where real-time monitoring might be desired. For more practical
applications, a CNT modified commercial printed electrode was developed (Fig. 5.8c). As
the picture shows, the CNTs were coated on the working electrode area of the commercial
printed electrodes, while the counter and reference electrodes were embedded in the
printed electrodes.
Figure 5.8 Standard addition measurement of Cr(VI) with CNT/printed electrodes. (a)The
reduction current versus Cr(VI) concentrations, (b) the corresponding amperometric curve
with different additions. (c) The picture of CNT coated printed electrode (1cm × 4 cm).
In the standard addition measurement, the current changed linearly with increasing
Cr(VI) concentration up to 1000 ppb (Fig. 5.8a,b). The sensitivity was around 6.27 nA/ppb,
while the noise also decreased significantly compared with that of the large CNT/filter
paper electrode. More importantly, due to its smaller active area, the current could reach
equilibrium quickly in just a few minutes. As Fig. 5.9a shows, when the amperometric
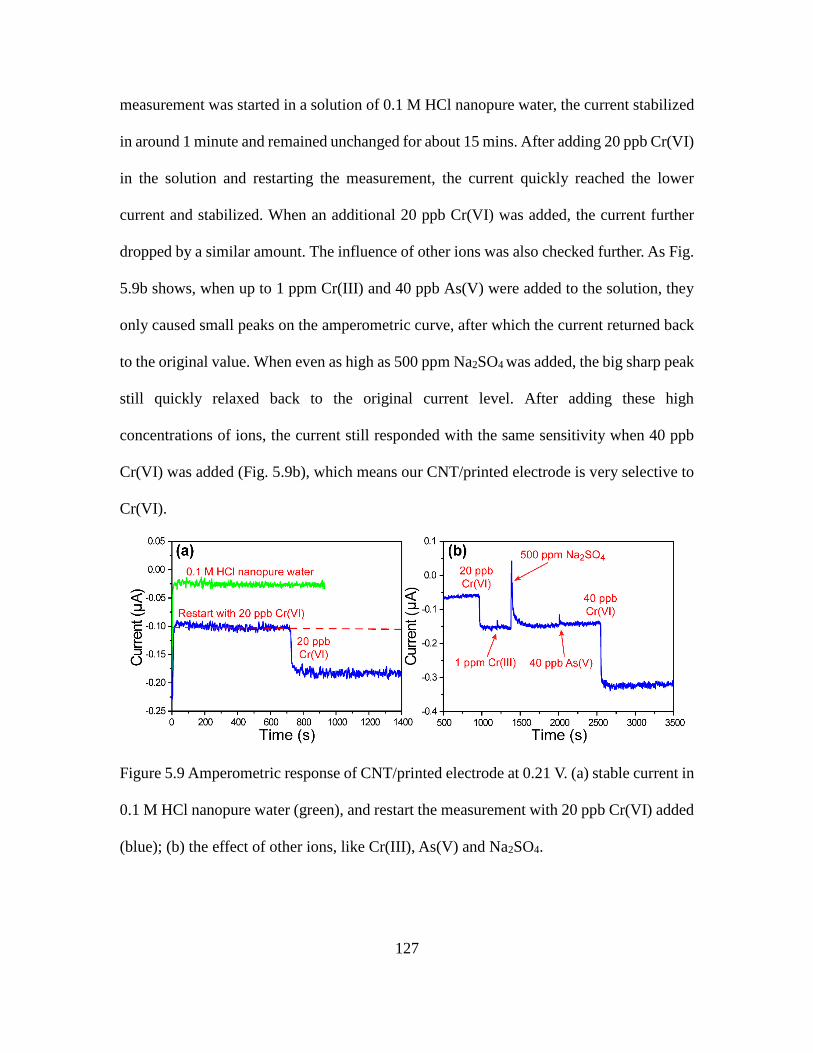
127
measurement was started in a solution of 0.1 M HCl nanopure water, the current stabilized
in around 1 minute and remained unchanged for about 15 mins. After adding 20 ppb Cr(VI)
in the solution and restarting the measurement, the current quickly reached the lower
current and stabilized. When an additional 20 ppb Cr(VI) was added, the current further
dropped by a similar amount. The influence of other ions was also checked further. As Fig.
5.9b shows, when up to 1 ppm Cr(III) and 40 ppb As(V) were added to the solution, they
only caused small peaks on the amperometric curve, after which the current returned back
to the original value. When even as high as 500 ppm Na2SO4 was added, the big sharp peak
still quickly relaxed back to the original current level. After adding these high
concentrations of ions, the current still responded with the same sensitivity when 40 ppb
Cr(VI) was added (Fig. 5.9b), which means our CNT/printed electrode is very selective to
Cr(VI).
Figure 5.9 Amperometric response of CNT/printed electrode at 0.21 V. (a) stable current in
0.1 M HCl nanopure water (green), and restart the measurement with 20 ppb Cr(VI) added
(blue); (b) the effect of other ions, like Cr(III), As(V) and Na2SO4.
128
Due to the small active area and short response time for the CNT/printed electrode, these
electrodes were determined to be the most promising for Cr(VI) detection in the real water.
Compared to the synthetic water samples containing 0.1 M HCl, the real water samples
will have many other ionic and dissolved species that may affect the measurement. In order
to maintain the same background current, a partially replacing background solution (PRBS)
technique was developed so that this electrode could be used for the detection of Cr(VI) in
real water. First, concentrated HCl was added to 50 mL of real water to make a 0.1 M
solution, which was then exposed to a 0.21 V vs. SCE bias long enough (~ 2 h) so that all of
the Cr(VI) in solution was completely reduced to Cr(III), while the other dissolved ions
remained unchanged. Then, 25 mL of fully reduced solution was replaced with 25 mL of
fresh solution (the same real water with 0.1 M HCl). During this whole process, the
electrodes were immersed in the solution at all times, so that the electric double layer on
the surface of the electrodes would not be perturbed and there would be no current change
due to the capacitance effect. Because of the small active area and thin electrode
connection wires (Fig. 5.8c), the capacitance change was very small during the PRBS
process. However, for the CNT/filter paper large electrode, even with the active area
immersed in the solution all the time, due to the large PVDF coated conducting area, the
capacitance between the PVDF covered CNT and the solution would change significantly
enough to cause big current change. For this reason, the small CNT/printed electrode is
preferred for testing Cr(VI) concentrationa in real water with the PRBS techniques.

129
Figure 5.10 Amperometric response of CNT/printed electrode at 0.21 V vs. SCE when half
of the reduced F real water was replaced with original one and different concentrations of
Cr(VI) were injected into 0.1 M HCl sample F real water.
As an example, the sample F real water was used to test with this technique. As shown in
Fig. 5.10, the background current when applying 0.21 V vs. SCE onto the CNT/printed
electrode in 50 mL of reduced sample F real water with 0.1 M HCl is ib. Since the Cr(VI)
was reduced from the solution, this background current is due to the adsorption of other
ions or potentially even side reactions with other constituents in the water. Then 25 mL of
reduced background solution was replaced with 25 mL of fresh solution, which contains
the unknown amount of Cr(VI). The addition of the fresh solution at ~30 min, caused a
current drop Δif that corresponds to half of the concentration Cr(VI) in the sample F real
water. After the current stabilized at new equilibrium value, standard additions of 20 ppb,
40 ppb, and 60 ppb Cr(VI) were conducted continuously so that the current changes, Δi1,
Δi2, and Δi3, could be used for calibration. Based on the calibration current changes, the

130
Cr(VI) concentration in sample F water corresponded to 2 Δif and was calculated to be ~52
ppb, which is very close to the value measured by UV-Vis spectroscopy of 52.8 ppb. It was
noted that the Cr(VI) levels in the site F water are not typically this high, but due to the long
time between the sampling and testing, there could have been water evaporation that led to
the concentration of Cr(VI). These tests show that this method can be successfully used to
determine the amount of Cr(VI) in the cooling tower blowdown using the CNT-based
electrodes.
5.6 Flow Detection System with CNT/Printed Electrodes and H2O2 Reduction Method
A flow system for Cr(VI) detection was further developed using the CNT/printed
electrodes (Fig. 5.11b). Specifically, the CNT modified printed electrode was placed
between two pieces of glasses, which were spaced by two small pieces of glass to form a
channel. Then the glass and electrodes were sealed and bonded together with epoxy.
Meanwhile, the thin plastic tubes were also sealed inside the channel to enable the solution
to flow in and out (Fig. 5.11b). During the measurement, the solution was pumped through
the channel with a peristaltic pump or syringe pump. Fig. 5.11a shows the test results with
this system. Initially, the background solution, 0.1 M HCl nanopure water in this case, was
flowing through the channel until the background current was stable at ib. Then, different
concentrations of Cr(VI) were added into the solution and caused the corresponding
current changes Δi, with the current changing linearly with the addition of Cr(VI). The final
current was stable at if.

131
Figure 5.11 (a) Amperometric response of CNT/printed electrode at 0.21 V when different
concentrations of Cr(VI) or H2O2 were injected into 0.1 M HCl with the flow system. (b)
The picture of corresponding CNT coated printed electrode flow detection system.
In a measurement where an unknown amount of Cr(VI) is to be quantified, the
background current must first be established. After the current is stable for the background
solution, the test solution could be switched in (i.e. with a valve) and flowed through the
system. The corresponding current change could then be used for calculating the unknown
Cr(VI) concentration. Since Cr(VI) can be reduced by hydrogen peroxide with follow
reaction:190
2HCrO4- + 3 H2O2 + 8 H+ →2 Cr3+ + 8 H2O + 3 O2
a H2O2 reduction technique was developed. In this technique, H2O2 does not just act as a
normal reducing agent. Unlike other reducing agents for Cr(VI), H2O2 can form an
unstable compound with Cr(VI), chromium peroxide, which will further decompose to
Cr(III).190 This unique reaction makes H2O2 very selective to Cr(VI) reduction.
The H2O2 was integrated into our flow detection system. As Fig. 5.11a shows, after
standard additions of different concentrations of Cr(VI), the final current was stable at if,

132
then 100 μM H2O2, about 100 times of total Cr(VI), was added into the system. Then the
current increased Δir, back to the original background value, since Cr(VI) was reduced to
Cr(III) that is nonactive to our electrodes. After the current reached the equilibrium value,
further addition of 400 μM H2O2 did not cause any more current change, which meant H2O2
itself is not active to the electrodes. So, for the real test, after the current is stable at if in the
sample solution, H2O2 is added to reduce Cr(VI) and cause current change Δir, which then
could be used to calculate the concentration of Cr(VI) in the sample solution.
The data in Fig. 5.11a demonstrate the proof-of-concept, but since the background
solution (0.1 M HCl) did not contain Cr(VI), additional tests were performed using the
H2O2 reduction technique with the flow system for F real water, which contains the
unknown amount of Cr(VI) (Fig. 5.12). Since the electrode was the same one used in 0.1 M
HCl pure water and not stabilized in the F real water condition, the initial current baseline
kept increasing due to the equilibrium process of the electrodes in the high ionic
concentration real water solution. When 20 ppb Cr(VI) was added to the system, a current
drop Δi1 = ~81 nA was achieved, which will be used as the calibration. Then, when 100 μM
H2O2 was added to the system, the current increased toward to positive value and stabilized
at ib. By linear fitting the baseline current to eliminate the capacitance current caused by the
adsorption of ions in the electric double layer, the current change due to Cr(VI) reduction in
the original F real water, Δir, was calculated to be ~250 nA. With the calibration current
change Δi1 = ~81 nA for 20 ppb Cr(VI), the Cr(VI) concentration in F real water was
determined to be Δir/Δi1*20 ppb = 61.7 ppb, which is higher than the values obtained with
PRBS and UV-Vis techniques, 52 ppb and 52.8 ppb, respectively. This discrepancy is likely
due to the unstable baseline current. If the electrodes were pre-stabilized in the F real water

133
solution first before the test, the results should be more accurate, which will be studied
further for future work to make this technique more stable for practical applications.
Figure 5.12 Amperometric response of CNT/printed electrode at 0.21 V when 20 ppb
Cr(VI) or H2O2 were injected into 0.1 M HCl F real water with the flow system.
To summarize, Fig. 5.13 shows the evolution of the electrodes developed in this project.
For each iteration, one or more problems were solved and the technique was improved.
Finally, a commercial printed electrodes based flow test system was developed, which is
very promising for practical application. In the future, the system and the technique will be
improved further. And a microfluidic-like system would be developed so that the test could
be more stable, faster and more accurate.
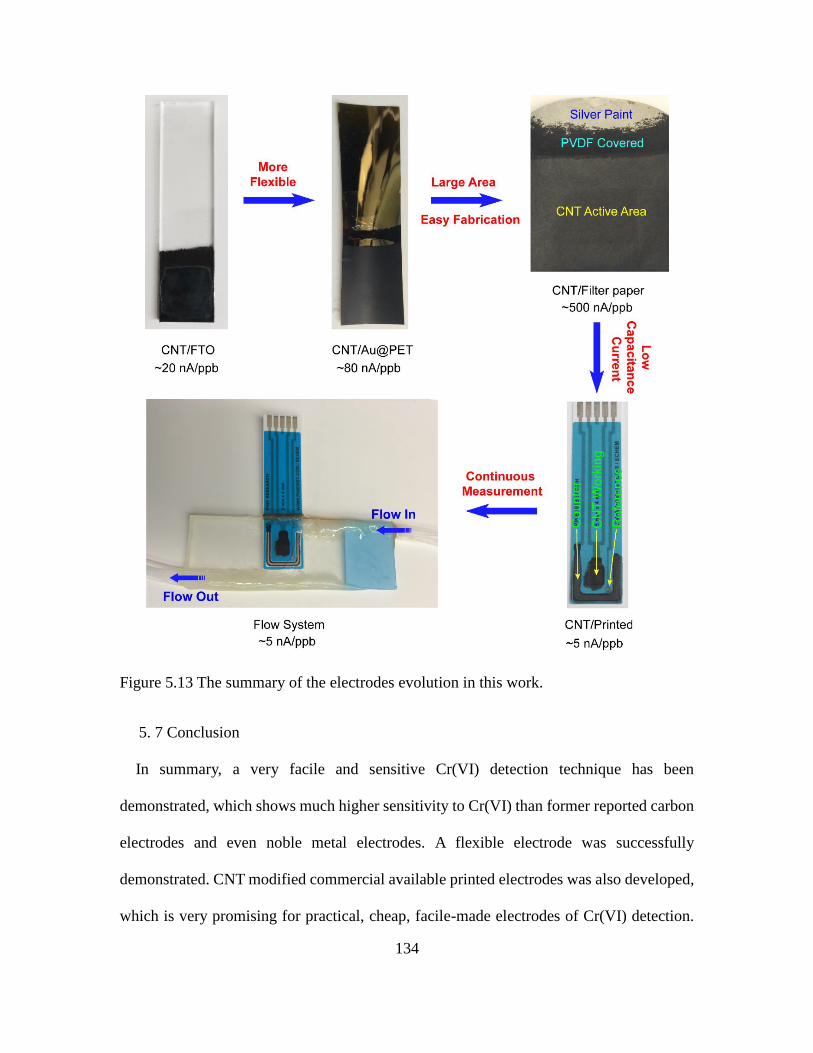
134
Figure 5.13 The summary of the electrodes evolution in this work.
5. 7 Conclusion
In summary, a very facile and sensitive Cr(VI) detection technique has been
demonstrated, which shows much higher sensitivity to Cr(VI) than former reported carbon
electrodes and even noble metal electrodes. A flexible electrode was successfully
demonstrated. CNT modified commercial available printed electrodes was also developed,
which is very promising for practical, cheap, facile-made electrodes of Cr(VI) detection.

135
The H2O2 reduction technique was also demonstrated, which could also be combined with
the normal amperometric method. The flow system based on the printed electrodes makes
the detection even suitable for real-time monitoring.

136
6 REFERENCES
(1) Kroto, H. W.; Heath, J. R.; O’Brien, S. C.; Curl, R. F.; Smalley, R. E. C60:
Buckminsterfullerene. Nature 1985, 318, 162–163.
(2) Plume, A. Buckyballs, Nanotubes and Graphene: On the Hunt for the next Big
Thing. Res. trends 2010, 6–7.
(3) Nguyen, K. T.; Zhao, Y. Integrated Graphene/nanoparticle Hybrids for Biological
and Electronic Applications. Nanoscale 2014, 6, 6245–6266.
(4) Zhu, Y.; Murali, S.; Stoller, M. D.; Ganesh, K. J.; Cai, W.; Ferreira, P. J.; Pirkle,
A.; Wallace, R. M.; Cychosz, K. a; Thommes, M.; et al. Carbon-Based
Supercapacitors Produced by Activation of Graphene. Science 2011, 332, 1537–
1541.
(5) Yoo, J. J.; Balakrishnan, K.; Huang, J.; Meunier, V.; Sumpter, B. G.; Srivastava,
A.; Conway, M.; Reddy, A. L. M.; Yu, J.; Vajtai, R.; et al. Ultrathin Planar
Graphene Supercapacitors. Nano Lett. 2011, 11, 1423–1427.
(6) Lin, J.; Zhang, C.; Yan, Z.; Zhu, Y.; Peng, Z.; Hauge, R. H.; Natelson, D.; Tour, J.
M. 3-Dimensional Graphene Carbon Nanotube Carpet-Based
Microsupercapacitors with High Electrochemical Performance. Nano Lett. 2013,
13, 72–78.
(7) Luo, J.; Jang, H. D.; Huang, J. Effect of Sheet Morphology on the Scalability of
Graphene-Based Ultracapacitors. ACS Nano 2013, 7, 1464–1471.
(8) Simon, P.; Gogotsi, Y. Materials for Electrochemical Capacitors. Nat. Mater. 2008,
7, 845–854.
(9) Wang, C.; Waje, M.; Wang, X.; Tang, J. M.; Haddon, R. C. Proton Exchange
Membrane Fuel Cells with Carbon Nanotube Based Electrodes. Nano Lett. 2004, 4,
345–348.
(10) Gong, K.; Du, F.; Xia, Z.; Durstock, M.; Dai, L. Nitrogen-Doped Carbon
Nanotube Arrays with High Electrocatalytic Activity for Oxygen Reduction.
Science 2009, 323, 760–764.
(11) Wang, H.; Yang, Y.; Liang, Y.; Robinson, J. T.; Li, Y.; Jackson, A.; Cui, Y.; Dai,
H. Graphene-Wrapped Sulfur Particles as a Rechargeable Lithium-Sulfur Battery
Cathode Material with High Capacity and Cycling Stability. Nano Lett. 2011, 11,
2644–2647.
137
(12) Hu, L.; Wu, H.; La Mantia, F.; Yang, Y.; Cui, Y. Thin, Flexible Secondary Li-Ion
Paper Batteries. ACS Nano 2010, 4, 5843–5848.
(13) Kongkanand, A.; Domínguez, R. M.; Kamat, P. V. Single Wall Carbon Nanotube
Scaffolds for Photoelectrochemical Solar Cells. Capture and Transport of
Photogenerated Electrons. Nano Lett. 2007, 7, 676–680.
(14) Ostojic, G. N.; Liang, Y. T.; Hersam, M. C. Catalytically Active Nanocomposites
of Electronically Coupled Carbon Nanotubes and Platinum Nanoparticles Formed
via Vacuum Filtration. Nanotechnology 2009, 20, 434019.
(15) Huang, J.; Ng, A. L.; Piao, Y.; Chen, C.-F.; Green, A. a; Sun, C.-F.; Hersam, M. C.;
Lee, C. S.; Wang, Y. Covalently Functionalized Double-Walled Carbon Nanotubes
Combine High Sensitivity and Selectivity in the Electrical Detection of Small
Molecules. J. Am. Chem. Soc. 2013, 135, 2306–2312.
(16) Jariwala, D.; Sangwan, V. K.; Lauhon, L. J.; Marks, T. J.; Hersam, M. C. Carbon
Nanomaterials for Electronics, Optoelectronics, Photovoltaics, and Sensing. Chem.
Soc. Rev. 2013, 42, 2824–2860.
(17) Sohn, K.; Joo Na, Y.; Chang, H.; Roh, K.-M.; Dong Jang, H.; Huang, J. Oil
Absorbing Graphene Capsules by Capillary Molding. Chem. Commun. 2012, 48.
(18) Sun, H.; Xu, Z.; Gao, C. Multifunctional, Ultra-Flyweight, Synergistically
Assembled Carbon Aerogels. Adv. Mater. 2013, 25, 2554–2560.
(19) Peigney, A.; Laurent, C.; Flahaut, E.; Bacsa, R. R.; Rousset, A. Specific Surface
Area of Carbon Nanotubes and Bundles of Carbon Nanotubes. Carbon 2001, 39,
507–514.
(20) Liang, Y. T.; Hersam, M. C. Highly Concentrated Graphene Solutions via Polymer
Enhanced Solvent Exfoliation and Iterative Solvent Exchange. J. Am. Chem. Soc.
2010, 132, 17661–17663.
(21) Strubel, P.; Thieme, S.; Biemelt, T.; Helmer, A.; Oschatz, M.; Brückner, J.;
Althues, H.; Kaskel, S. ZnO Hard Templating for Synthesis of Hierarchical Porous
Carbons with Tailored Porosity and High Performance in Lithium-Sulfur Battery.
Adv. Funct. Mater. 2015, 25, 287–297.
(22) Sevilla, M.; Fuertes, A. B. A. Direct Synthesis of Highly Porous Interconnected
Carbon Nanosheets and Their Application as High-Performance Supercapacitors.
ACS Nano 2014, 8, 5069–5078.
138
(23) Fan, X.; Yu, C.; Yang, J.; Ling, Z.; Hu, C.; Zhang, M.; Qiu, J. A
Layered-Nanospace-Confinement Strategy for the Synthesis of Two-Dimensional
Porous Carbon Nanosheets for High-Rate Performance Supercapacitors. Adv.
Energy Mater. 2014, 5, DOI: 10.1002/aenm.201401761.
(24) Xing, W.; Huang, C. C.; Zhuo, S. P.; Yuan, X.; Wang, G. Q.; Hulicova-Jurcakova,
D.; Yan, Z. F.; Lu, G. Q. Hierarchical Porous Carbons with High Performance for
Supercapacitor Electrodes. Carbon 2009, 47, 1715–1722.
(25) Wang, D.-W.; Li, F.; Liu, M.; Lu, G. Q.; Cheng, H.-M. 3D Aperiodic Hierarchical
Porous Graphitic Carbon Material for High-Rate Electrochemical Capacitive
Energy Storage. Angew. Chem. Int. Ed. Engl. 2008, 47, 373–376.
(26) Hampsey, J. E.; Hu, Q.; Wu, Z.; Rice, L.; Pang, J.; Lu, Y. Templating Synthesis of
Ordered Mesoporous Carbon Particles. Carbon 2005, 43, 2977–2982.
(27) Xia, Y.; Xiao, Z.; Dou, X.; Huang, H.; Lu, X.; Yan, R.; Gan, Y.; Zhu, W.; Tu, J.;
Zhang, W.; et al. Green and Facile Fabrication of Hollow Porous MnO/C
Microspheres from Microalgaes for Lithium-Ion Batteries. ACS Nano 2013, 7,
7083–7092.
(28) Han, F.-D.; Bai, Y.-J.; Liu, R.; Yao, B.; Qi, Y.-X.; Lun, N.; Zhang, J.-X.
Template-Free Synthesis of Interconnected Hollow Carbon Nanospheres for
High-Performance Anode Material in Lithium-Ion Batteries. Adv. Energy Mater.
2011, 1, 798–801.
(29) Wang, X.; Zhang, Y.; Zhi, C.; Wang, X.; Tang, D.; Xu, Y.; Weng, Q.; Jiang, X.;
Mitome, M.; Golberg, D.; et al. Three-Dimensional Strutted Graphene Grown by
Substrate-Free Sugar Blowing for High-Power-Density Supercapacitors. Nat.
Commun. 2013, 4, 2905.
(30) Wang, Q.; Yan, J.; Wang, Y.; Ning, G.; Fan, Z.; Wei, T.; Cheng, J.; Zhang, M.;
Jing, X. Template Synthesis of Hollow Carbon Spheres Anchored on Carbon
Nanotubes for High Rate Performance Supercapacitors. Carbon 2013, 52, 209–
218.
(31) Ma, F.; Zhao, H.; Sun, L.; Li, Q.; Huo, L.; Xia, T.; Gao, S.; Pang, G.; Shi, Z.; Feng,
S. A Facile Route for Nitrogen-Doped Hollow Graphitic Carbon Spheres with
Superior Performance in Supercapacitors. J. Mater. Chem. 2012, 22, 13464–
13468.
(32) Pech, D.; Brunet, M.; Durou, H.; Huang, P.; Mochalin, V.; Gogotsi, Y.; Taberna,
P.-L.; Simon, P. Ultrahigh-Power Micrometre-Sized Supercapacitors Based on
Onion-like Carbon. Nat. Nanotechnol. 2010, 5, 651–654.

139
(33) Wu, Z.-Y.; Li, C.; Liang, H.-W.; Zhang, Y.-N.; Wang, X.; Chen, J.-F.; Yu, S.-H.
Carbon Nanofiber Aerogels for Emergent Cleanup of Oil Spillage and Chemical
Leakage under Harsh Conditions. Sci. Rep. 2014, 4, 4079.
(34) Sun, S.; Jaouen, F.; Dodelet, J.-P. Controlled Growth of Pt Nanowires on Carbon
Nanospheres and Their Enhanced Performance as Electrocatalysts in PEM Fuel
Cells. Adv. Mater. 2008, 20, 3900–3904.
(35) Su, F.; Tian, Z.; Poh, C. K.; Wang, Z.; Lim, S. H.; Liu, Z.; Lin, J. Pt Nanoparticles
Supported on Nitrogen-Doped Porous Carbon Nanospheres as an Electrocatalyst
for Fuel Cells †. Chem. Mater. 2010, 22, 832–839.
(36) Yang, S.-T.; Cao, L.; Luo, P. G.; Lu, F.; Wang, X.; Wang, H.; Meziani, M. J.; Liu,
Y.; Qi, G.; Sun, Y.-P. Carbon Dots for Optical Imaging in Vivo. J. Am. Chem. Soc.
2009, 131, 11308–11309.
(37) Joo, J. B.; Kim, P.; Kim, W.; Kim, J.; Kim, N. D.; Yi, J. Simple Preparation of
Hollow Carbon Sphere via Templating Method. Curr. Appl. Phys. 2008, 8, 814–
817.
(38) Titirici, M.-M.; Thomas, a.; Antonietti, M. Replication and Coating of Silica
Templates by Hydrothermal Carbonization. Adv. Funct. Mater. 2007, 17, 1010–
1018.
(39) Yan, Y.; Zhang, F.; Meng, Y.; Tu, B.; Zhao, D. One-Step Synthesis of Ordered
Mesoporous Carbonaceous Spheres by an Aerosol-Assisted Self-Assembly. Chem.
Commun. 2007, 1, 2867–2869.
(40) Sun, Y.-P.; Zhou, B.; Lin, Y.; Wang, W.; Fernando, K. a S.; Pathak, P.; Meziani,
M. J.; Harruff, B. a; Wang, X.; Wang, H.; et al. Quantum-Sized Carbon Dots for
Bright and Colorful Photoluminescence. J. Am. Chem. Soc. 2006, 128, 7756–7757.
(41) Zou, Q.; Wang, M. Z.; Li, Y. G.; Lu, B. High-Resolution Transmission-Electron
Microscope Characterization of Onionlike Carbon Transformed from
Nanodiamond. J. Vac. Sci. Technol. B Microelectron. Nanom. Struct. 2010, 28,
935.
(42) N. Sano, H. Wang, M. Chhowalla, I. Alexandrou, G. A. J. A. Nanotechnology:
Synthesis of Carbon’onions' in Water. Nature 2001, 414, 506–507.
(43) Choucair, M.; Stride, J. A. The Gram-Scale Synthesis of Carbon Onions. Carbon
2012, 50, 1109–1115.

140
(44) Tang, K.; Fu, L.; White, R. J.; Yu, L.; Titirici, M.-M.; Antonietti, M.; Maier, J.
Hollow Carbon Nanospheres with Superior Rate Capability for Sodium-Based
Batteries. Adv. Energy Mater. 2012, 2, 873–877.
(45) Yao, C.; Shin, Y.; Wang, L.; Windisch, C. F.; Samuels, W. D.; Arey, B. W.; Wang,
C.; Risen, W. M.; Exarhos, G. J. Hydrothermal Dehydration of Aqueous Fructose
Solutions in a Closed System. J. Phys. Chem. C 2007, 15141–15145.
(46) Liu, H.; Ye, T.; Mao, C. Fluorescent Carbon Nanoparticles Derived from Candle
Soot. Angew. Chemie Int. Ed. 2007, 46, 6473–6475.
(47) Lee, J.-S.; Kim, S.-I.; Yoon, J.-C.; Jang, J.-H. Chemical Vapor Deposition of
Mesoporous Graphene Nanoballs for Supercapacitor. ACS Nano 2013, 7, 6047–
6055.
(48) Fang, B.; Binder, L. A Modified Activated Carbon Aerogel for High-Energy
Storage in Electric Double Layer Capacitors. J. Power Sources 2006, 163, 616–
622.
(49) Lukens, W. W.; Stucky, G. D. Synthesis of Mesoporous Carbon Foams Templated
by Organic Colloids. Chem. Mater. 2002, 14, 1665–1670.
(50) Al-Muhtaseb, S. a.; Ritter, J. a. Preparation and Properties of
Resorcinol-Formaldehyde Organic and Carbon Gels. Adv. Mater. 2003, 15, 101–
114.
(51) Fechler, N.; Wohlgemuth, S.-A.; Jäker, P.; Antonietti, M. Salt and Sugar: Direct
Synthesis of High Surface Area Carbon Materials at Low Temperatures via
Hydrothermal Carbonization of Glucose under Hypersaline Conditions. J. Mater.
Chem. A 2013, 1, 9418.
(52) Wei, L.; Nitta, N.; Yushin, G. Lithographically Patterned Thin Activated Carbon
Films as a New Technology Platform for on-Chip Devices. ACS Nano 2013, 7,
6498–6506.
(53) Chu, W. Dye Removal from Textile Dye Wastewater Using Recycled Alum
Sludge. Water Res. 2001, 35, 3147–3152.
(54) Wang, S.; Li, H.; Xu, L. Application of Zeolite MCM-22 for Basic Dye Removal
from Wastewater. J. Colloid Interface Sci. 2006, 295, 71–78.
(55) Malik, P. K. Dye Removal from Wastewater Using Activated Carbon Developed
from Sawdust: Adsorption Equilibrium and Kinetics. J. Hazard. Mater. 2004, 113,
81–88.
141
(56) Wang, S.; Li, H.; Xie, S.; Liu, S.; Xu, L. Physical and Chemical Regeneration of
Zeolitic Adsorbents for Dye Removal in Wastewater Treatment. Chemosphere
2006, 65, 82–87.
(57) Crini, G. Non-Conventional Low-Cost Adsorbents for Dye Removal: A Review.
Bioresour. Technol. 2006, 97, 1061–1085.
(58) Tchounwou, P. B.; Patlolla, A. K.; Centeno, J. A. Invited Reviews: Carcinogenic
and Systemic Health Effects Associated with Arsenic Exposure—a Critical
Review. Toxicol. Pathol. 2003, 31, 575–588.
(59) Mohan, D.; Pittman Jr., C. U. Arsenic Removal from Water/wastewater Using
adsorbents—A Critical Review. J. Hazard. Mater. 2007, 142, 1–53.
(60) Lemly, A. D. Aquatic Selenium Pollution Is a Global Environmental Safety Issue.
Ecotoxicol. Environ. Saf. 2004, 59, 44–56.
(61) Li, L.; Quinlivan, P. A.; Knappe, D. R. U. Effects of Activated Carbon Surface
Chemistry and Pore Structure on the Adsorption of Organic Contaminants from
Aqueous Solution. Carbon 2002, 40, 2085–2100.
(62) Daifullah, A. A. M.; Girgis, B. S. Removal of Some Substituted Phenols by
Activated Carbon Obtained from Agricultural Waste. Water Res. 1998, 32, 1169–
1177.
(63) Huang, C. P.; Wu, M. H. The Removal of chromium(VI) from Dilute Aqueous
Solution by Activated Carbon. Water Res. 1977, 11, 673–679.
(64) Monser, L.; Adhoum, N. Modified Activated Carbon for the Removal of Copper,
Zinc, Chromium and Cyanide from Wastewater. Sep. Purif. Technol. 2002, 26,
137–146.
(65) Rivera-Utrilla, J.; Sánchez-Polo, M.; Gómez-Serrano, V.; Álvarez, P. M.;
Alvim-Ferraz, M. C. M.; Dias, J. M. Activated Carbon Modifications to Enhance
Its Water Treatment Applications. An Overview. J. Hazard. Mater. 2011, 187, 1–
23.
(66) Asadullah, M.; Jahan, I.; Ahmed, M. B.; Adawiyah, P.; Malek, N. H.; Rahman, M.
S. Preparation of Microporous Activated Carbon and Its Modification for Arsenic
Removal from Water. J. Ind. Eng. Chem. 2014, 20, 887–896.
(67) Hu, Z.; Lei, L.; Li, Y.; Ni, Y. Chromium Adsorption on High-Performance
Activated Carbons from Aqueous Solution. Sep. Purif. Technol. 2003, 31, 13–18.

142
(68) Chan, C. One-Dimensional Nanostructured Materials for Li-Ion Battery and
Supercapacitor Electrodes. 2009.
(69) Stoller, M. D.; Ruoff, R. S. Best Practice Methods for Determining an Electrode
Material’s Performance for Ultracapacitors. Energy Environ. Sci. 2010, 3, 1294–
1301.
(70) Wang, C.; Wang, Y.; Graser, J.; Zhao, R.; Gao, F.; O’Connell, M. J.
Solution-Based Carbohydrate Synthesis of Individual Solid, Hollow, and Porous
Carbon Nanospheres Using Spray Pyrolysis. ACS Nano 2013, 7, 11156–11165.
(71) Demaine, E. D.; O’Rourke, J. A Survey of Folding and Unfolding in
Computational Geometry. Comb. Comput. Geom. 2005, 52, 167–211.
(72) Demaine, E. D.; O’Rourke, J. Geometric Folding Algorithms; Cambridge
university press Cambridge, 2007.
(73) Stellman, P.; Buchner, T.; Arora, W. J.; Barbastathis, G. Dynamics of
Nanostructured Origami. Microelectromechanical Syst. J. 2007, 16, 932–949.
(74) Landi, B. J.; Raffaelle, R. P.; Heben, M. J.; Alleman, J. L.; VanDerveer, W.;
Gennett, T. Single Wall Carbon Nanotube-Nafion Composite Actuators. Nano Lett.
2002, 2, 1329–1332.
(75) Baughman, R. H.; Cui, C.; Zakhidov, A. A.; Iqbal, Z.; Barisci, J. N.; Spinks, G. M.;
Wallace, G. G.; Mazzoldi, A.; De Rossi, D.; Rinzler, A. G.; et al. Carbon
Nanotube Actuators. Science 1999, 284, 1340–1344.
(76) Meng, H.; Jinlian Hu. A Brief Review of Stimulus-Active Polymers Responsive to
Thermal, Light, Magnetic, Electric, and Water/Solvent Stimuli. J. Intell. Mater.
Syst. Struct. 2010, 21, 859–885.
(77) Liu, Y.; Flood, A. H.; Bonvallet, P. A.; Vignon, S. A.; Northrop, B. H.; Tseng, H.
R.; Jeppesen, J. O.; Huang, T. J.; Brough, B.; Baller, M.; et al. Linear Artificial
Molecular Muscles. J. Am. Chem. Soc. 2005, 127, 9745–9759.
(78) Juluri, B. K.; Kumar, A. S.; Liu, Y.; Ye, T.; Yang, Y. W.; Flood, A. H.; Fang, L.;
Stoddart, J. F.; Weiss, P. S.; Huang, T. J. A Mechanical Actuator Driven
Electrochemically by Artificial Molecular Muscles. ACS Nano 2009, 3, 291–300.
(79) Pelrine, R. High-Speed Electrically Actuated Elastomers with Strain Greater Than
100%. Science, 2000, 287, 836–839.
143
(80) Karpelson, M.; Wei, G. Y.; Wood, R. J. Driving High Voltage Piezoelectric
Actuators in Microrobotic Applications. Sensors Actuators, A Phys. 2012, 176,
78–89.
(81) Shepherd, R. F.; Ilievski, F.; Choi, W.; Morin, S. A.; Stokes, A. A.; Mazzeo, A. D.;
Chen, X.; Wang, M.; Whitesides, G. M. From the Cover: Multigait Soft Robot.
Proceedings of the National Academy of Sciences, 2011, 108, 20400–20403.
(82) Timoshenko, S. Analysis of Bi-Metal Thermostats. Journal of the Optical Society
of America, 1925, 11, 233.
(83) Riethmuller, W.; Benecke, W. Thermally Excited Silicon Microactuators. IEEE
Trans. Electron Devices 1988, 35, 758–763.
(84) Sellinger, A. T.; Wang, D. H.; Tan, L. S.; Vaia, R. a. Electrothermal Polymer
Nanocomposite Actuators. Adv. Mater. 2010, 22, 3430–3435.
(85) Hu, Y.; Chen, W.; Lu, L.; Liu, J.; Chang, C. Electromechanical Actuation with
Controllable Motion Based on a Single-Walled Carbon Nanotube and Natural
Biopolymer Composite. ACS Nano 2010, 4, 3498–3502.
(86) Chen, L.; Liu, C.; Liu, K.; Meng, C.; Hu, C.; Wang, J.; Fan, S. High-Performance,
Low-Voltage, and Easy-Operable Bending Actuator Based on Aligned Carbon
Nanotube/polymer Composites. ACS Nano 2011, 5, 1588–1593.
(87) Hawkes, E.; An, B.; Benbernou, N. M.; Tanaka, H.; Kim, S.; Demaine, E. D.; Rus,
D.; Wood, R. J. Programmable Matter by Folding. Proc. Natl. Acad. Sci. 2010,
107, 12441–12445.
(88) Onal, C. D.; Wood, R. J.; Rus, D. An Origami-Inspired Approach to Worm Robots.
IEEE/ASME Trans. Mechatronics 2013, 18, 430–438.
(89) Welch, C. M.; Nekrassova, O.; Compton, R. G. Reduction of Hexavalent
Chromium at Solid Electrodes in Acidic Media: Reaction Mechanism and
Analytical Applications. Talanta 2005, 65, 74–80.
(90) Zhang, L.; Xu, C.; Li, B. Simple and Sensitive Detection Method for chromium(VI)
in Water Using Glutathione—capped CdTe Quantum Dots as Fluorescent Probes.
Microchim. Acta 2009, 166, 61–68.
(91) JUNG, G. Y.; KIM, Y. S.; LIM, H. B. Simultaneous Determination of
Chromium(III) and Chromium(VI) in Aqueous Solution by Capillary
Electrophoresis with On-Column UV-VIS Detection. Anal. Sci. 1997, 13, 463–
467.
144
(92) Posta, J.; Alimonti, A.; Petrucci, F.; Caroli, S. On-Line Separation and
Preconcentration of Chromium Species in Seawater. Anal. Chim. Acta 1996, 325,
185–193.
(93) Zhang, H.; Liu, Q.; Wang, T.; Yun, Z.; Li, G.; Liu, J.; Jiang, G. Facile Preparation
of Glutathione-Stabilized Gold Nanoclusters for Selective Determination of
Chromium (III) and Chromium (VI) in Environmental Water Samples. Anal. Chim.
Acta 2013, 770, 140–146.
(94) Hallam, P. M.; Kampouris, D. K.; Kadara, R. O.; Banks, C. E. Graphite Screen
Printed Electrodes for the Electrochemical Sensing of chromium(VI). Analyst 2010,
135, 1947–1952.
(95) Jena, B. K.; Raj, C. R. Highly Sensitive and Selective Electrochemical Detection
of Sub-Ppb Level chromium(VI) Using Nano-Sized Gold Particle. Talanta 2008,
76, 161–165.
(96) Jin, W.; Wu, G.; Chen, A. Sensitive and Selective Electrochemical Detection of
chromium(VI) Based on Gold Nanoparticle-Decorated Titania Nanotube Arrays.
Analyst 2014, 139, 235–241.
(97) Xu, H.; Zheng, Q.; Yang, P.; Liu, J.; Xing, S.; Jin, L. Electrochemical Synthesis of
Silver Nanoparticles-Coated Gold Nanoporous Film Electrode and Its Application
to Amperometric Detection for Trace Cr(VI). Sci. China Chem. 2011, 54, 1004–
1010.
(98) Williams, D. B.; Carter, C. B. The Transmission Electron Microscope; Springer,
1996.
(99) Goldstein, J.; Newbury, D. E.; Echlin, P.; Joy, D. C.; Romig Jr, A. D.; Lyman, C.
E.; Fiori, C.; Lifshin, E. Scanning Electron Microscopy and X-Ray Microanalysis:
A Text for Biologists, Materials Scientists, and Geologists; Springer Science &
Business Media, 2012.
(100) Warren, B. E. X-Ray Diffraction; Courier Corporation, 1969.
(101) Watts, J. F. X-Ray Photoelectron Spectroscopy. Vacuum 1994, 45, 653–671.
(102) Long, D. A. Raman Spectroscopy. New York 1977, 1–12.
(103) Pimenta, M. a; Dresselhaus, G.; Dresselhaus, M. S.; Cançado, L. G.; Jorio, a; Saito,
R. Studying Disorder in Graphite-Based Systems by Raman Spectroscopy. Phys.
Chem. Chem. Phys. 2007, 9, 1276–1291.

145
(104) Malard, L. M.; Pimenta, M. a.; Dresselhaus, G.; Dresselhaus, M. S. Raman
Spectroscopy in Graphene. Phys. Rep. 2009, 473, 51–87.
(105) Ferrari, a. C.; Meyer, J. C.; Scardaci, V.; Casiraghi, C.; Lazzeri, M.; Mauri, F.;
Piscanec, S.; Jiang, D.; Novoselov, K. S.; Roth, S.; et al. Raman Spectrum of
Graphene and Graphene Layers. Phys. Rev. Lett. 2006, 97, 187401.
(106) Sing, K. S. W.; Everett, D. H.; Haul, R. a. W.; Moscou, L.; Pierotti, R. a.;
Rouquérol, J.; Siemieniewska, T. Reporting Physisorption Data for Gas/solid
Systems with Special Reference to the Determination of Surface Area and Porosity
(Recommendations 1984). Pure Appl. Chem. 1985, 57, 603–619.
(107) Alhamami, M.; Doan, H.; Cheng, C.-H. A Review on Breathing Behaviors of
Metal-Organic-Frameworks (MOFs) for Gas Adsorption. Materials (Basel). 2014,
7, 3198–3250.
(108) Rouquerol, J.; Rouquerol, F.; Llewellyn, P.; Maurin, G.; Sing, K. S. W. Adsorption
by Powders and Porous Solids: Principles, Methodology and Applications;
Academic press, 2013.
(109) Brunauer, S.; Emmett, P. H.; Teller, E. Adsorption of Gases in Multimolecular
Layers. 1936, 407.
(110) Barrett, E. P.; Joyner, L. G.; Halenda, P. P. The Determination of Pore Volume
and Area Distributions in Porous Substances. I. Computations from Nitrogen
Isotherms. J. Am. Chem. Soc. 1951, 73, 373–380.
(111) Kruk, M.; Jaroniec, M.; Sayari, A. Application of Large Pore MCM-41 Molecular
Sieves To Improve Pore Size Analysis Using Nitrogen Adsorption Measurements.
Langmuir 1997, 13, 6267–6273.
(112) Seaton, N. A.; Walton, J. P. R. B.; quirke, N. A New Analysis Method for the
Determination of the Pore Size Distribution of Porous Carbons from Nitrogen
Adsorption Measurements. Carbon 1989, 27, 853–861.
(113) Landers, J.; Gor, G. Y.; Neimark, A. V. Density Functional Theory Methods for
Characterization of Porous Materials. Colloids Surfaces A Physicochem. Eng. Asp.
2013, 437, 3–32.
(114) Ravikovitch, P. I.; Haller, G. L.; Neimark, A. V. Density Functional Theory Model
for Calculating Pore Size Distributions: Pore Structure of Nanoporous Catalysts.
Adv. Colloid Interface Sci. 1998, 76–77, 203–226.
(115) Suh, W. H.; Suslick, K. S. Magnetic and Porous Nanospheres from Ultrasonic
Spray Pyrolysis. J. Am. Chem. Soc. 2005, 127, 12007–12010.

146
(116) Bang, J. H.; Helmich, R. J.; Suslick, K. S. Nanostructured ZnS:Ni 2+
Photocatalysts Prepared by Ultrasonic Spray Pyrolysis. Adv. Mater. 2008, 20,
2599–2603.
(117) Okuyama, K.; Wuled Lenggoro, I. Preparation of Nanoparticles via Spray Route.
Chem. Eng. Sci. 2003, 58, 537–547.
(118) Jin, Y. Z.; Gao, C.; Hsu, W. K.; Zhu, Y.; Huczko, A.; Bystrzejewski, M.; Roe, M.;
Lee, C. Y.; Acquah, S.; Kroto, H.; et al. Large-Scale Synthesis and
Characterization of Carbon Spheres Prepared by Direct Pyrolysis of Hydrocarbons.
Carbon 2005, 43, 1944–1953.
(119) Chen, H.-K. Kinetic Study on the Carbothermic Reduction of Zinc Oxide. Scand. J.
Metall. 2001, 30, 292–296.
(120) Qiu, J.; Li, Y.; Wang, Y.; Liang, C.; Wang, T.; Wang, D. A Novel Form of Carbon
Micro-Balls from Coal. Carbon 2003, 41, 767–772.
(121) Qian, J.; Pantea, C.; Huang, J.; Zerda, T. W.; Zhao, Y. Graphitization of Diamond
Powders of Different Sizes at High Pressure–high Temperature. Carbon 2004, 42,
2691–2697.
(122) Jawhari, T.; Roid, A.; Casado, J. Raman Spectroscopic Characterization of Some
Commercially Available Carbon Black Materials. Carbon 1995, 33, 1561–1565.
(123) Hanigan, D.; Zhang, J.; Herckes, P.; Krasner, S. W.; Chen, C.; Westerhoff, P.
Adsorption of N-Nitrosodimethylamine Precursors by Powdered and Granular
Activated Carbon. Environ. Sci. Technol. 2012, 46, 12630–12639.
(124) Sing, K. S. W. Reporting Physisorption Data for Gas/solid Systems with Special
Reference to the Determination of Surface Area and Porosity (Recommendations
1984). Pure Appl. Chem. 1985, 57, 603–619.
(125) Corapcioglu, M. O.; Huang, C. P. The Surface Acidity and Characterization of
Some Commercial Activated Carbons. Carbon 1987, 25, 569–578.
(126) Chingombe, P.; Saha, B.; Wakeman, R. J. Surface Modification and
Characterisation of a Coal-Based Activated Carbon. Carbon 2005, 43, 3132–3143.
(127) Torres, J.; Pintos, V.; Domínguez, S.; Kremer, C.; Kremer, E. Selenite and
Selenate Speciation in Natural Waters: Interaction with Divalent Metal Ions. J.
Solution Chem. 2010, 39, 1–10.

147
(128) Hu, J.; Chen, C.; Zhu, X.; Wang, X. Removal of Chromium from Aqueous
Solution by Using Oxidized Multiwalled Carbon Nanotubes. J. Hazard. Mater.
2009, 162, 1542–1550.
(129) Mandich, N. V; Lalvani, S. B.; Wiltkowski, T.; Lalvani, L. S. Selective Removal
of Chromate Anion by a New Carbon Adsorbent. Met. Finish. 1998, 96, 39–44.
(130) Eguez, H.; Cho, E. Adsorption of Arsenic on Activated Charcoal. JOM 1987, 39,
38–41.
(131) Lorenzen, L.; van Deventer, J. S. J.; Landi, W. M. Factors Affecting the
Mechanism of the Adsorption of Arsenic Species on Activated Carbon. Miner.
Eng. 1995, 8, 557–569.
(132) Goh, K.-H.; Lim, T.-T. Geochemistry of Inorganic Arsenic and Selenium in a
Tropical Soil: Effect of Reaction Time, pH, and Competitive Anions on Arsenic
and Selenium Adsorption. Chemosphere 2004, 55, 849–859.
(133) Gonzalez, C. M.; Hernandez, J.; Parsons, J. G.; Gardea-Torresdey, J. L. A Study of
the Removal of Selenite and Selenate from Aqueous Solutions Using a Magnetic
Iron/manganese Oxide Nanomaterial and ICP-MS. Microchem. J. 2010, 96, 324–
329.
(134) Jegadeesan, G.; Mondal, K.; Lalvani. Selenate Removal from Sulfate Containing
Aqueous Solutions. Environ. Technol. 2005, 26, 1181–1188.
(135) Zhang, L. L.; Zhao, X. S. Carbon-Based Materials as Supercapacitor Electrodes.
Chem. Soc. Rev. 2009, 38, 2520–2531.
(136) Wang, Y.; Shi, Z.; Huang, Y.; Ma, Y.; Wang, C.; Chen, M.; Chen, Y.
Supercapacitor Devices Based on Graphene Materials. J. Phys. Chem. C 2009, 113,
13103–13107.
(137) Ferrari, A. C.; Meyer, J. C.; Scardaci, V.; Casiraghi, C.; Lazzeri, M.; Mauri, F.;
Piscanec, S.; Jiang, D.; Novoselov, K. S.; Roth, S.; et al. Raman Spectrum of
Graphene and Graphene Layers. Phys. Rev. Lett. 2006, 97, 187401.
(138) Sano, N.; Wang, H.; Chhowalla, M.; Alexandrou, I.; Amaratunga, G. A. J.
Nanotechnology: Synthesis of Carbon “Onions” in Water. Nature 2001, 414, 506–
507.
(139) Pech, D.; Brunet, M.; Durou, H.; Huang, P.; Mochalin, V.; Gogotsi, Y.; Taberna,
P.-L.; Simon, P. Ultrahigh-Power Micrometre-Sized Supercapacitors Based on
Onion-like Carbon. Nat Nano 2010, 5, 651–654.

148
(140) Endo, M.; Nishimura, Y.; Takahashi, T.; Takeuchi, K.; Dresselhaus, M. S. Lithium
Storage Behavior for Various Kinds of Carbon Anodes in Li Ion Secondary
Battery. J. Phys. Chem. Solids 1996, 57, 725–728.
(141) Zheng, T.; Dahn, J. R. The Effect of Turbostratic Disorder on the Staging
Transitions in Lithium Intercalated Graphite. Synth. Met. 1995, 73, 1–7.
(142) Fujimoto, H. Development of Efficient Carbon Anode Material for a High-Power
and Long-Life Lithium Ion Battery. J. Power Sources 2010, 195, 5019–5024.
(143) Han, F. D.; Yao, B.; Bai, Y. J. Preparation of Carbon Nano-Onions and Their
Application as Anode Materials for Rechargeable Lithium-Ion Batteries. J. Phys.
Chem. C 2011, 115, 8923–8927.
(144) Han, F.-D.; Bai, Y.-J.; Liu, R.; Yao, B.; Qi, Y.-X.; Lun, N.; Zhang, J.-X.
Template-Free Synthesis of Interconnected Hollow Carbon Nanospheres for
High-Performance Anode Material in Lithium-Ion Batteries. Adv. Energy Mater.
2011, 1, 798–801.
(145) Wang, Q.; Sun, X.; He, D.; Zhang, J. Preparation and Study of Carbon
Nano-Onion for Lithium Storage. Mater. Chem. Phys. 2013, 139, 333–337.
(146) Tian, W.-Q.; Wu, X.-Y.; Wang, K.-X.; Jiang, Y.-M.; Wang, J.-F.; Chen, J.-S.
Hierarchical Porous Carbon Spheres as an Anode Material for Lithium Ion
Batteries. RSC Adv. 2013, 3, 10823–10827.
(147) Lee, K. T.; Lytle, J. C.; Ergang, N. S.; Oh, S. M.; Stein, A. Synthesis and Rate
Performance of Monolithic Macroporous Carbon Electrodes for Lithium-Ion
Secondary Batteries. Adv. Funct. Mater. 2005, 15, 547–556.
(148) Wang, H.; Abe, T.; Maruyama, S.; Iriyama, Y.; Ogumi, Z.; Yoshikawa, K.
Graphitized Carbon Nanobeads with an Onion Texture as a Lithium-Ion Battery
Negative Electrode for High-Rate Use. Adv. Mater. 2005, 17, 2857–2860.
(149) Wang, Q.; Li, H.; Chen, L.; Huang, X. Novel Spherical Microporous Carbon as
Anode Material for Li-Ion Batteries. Solid State Ionics 2002, 152–153, 43–50.
(150) Buqa, H.; Goers, D.; Holzapfel, M.; Spahr, M. E.; Novak, P. High Rate Capability
of Graphite Negative Electrodes for Lithium-Ion Batteries. J. Electrochem. Soc.
2005, 152, A474.
(151) Fujimoto, H.; Tokumitsu, K.; Mabuchi, A.; Chinnasamy, N.; Kasuh, T. The Anode
Performance of the Hard Carbon for the Lithium Ion Battery Derived from the
Oxygen-Containing Aromatic Precursors. J. Power Sources 2010, 195, 7452–
7456.

149
(152) Zheng, T.; Xing, W.; Dahn, J. R. Carbons Prepared from Coals for Anodes of
Lithium-Ion Cells. Carbon 1996, 34, 1501–1507.
(153) Ren, Z. F.; Huang, Z. P.; Xu, J. W.; Wang, J. H.; Bush, P.; Siegal, M. P.;
Provencio, P. N. Synthesis of Large Arrays of Well-Aligned Carbon Nanotubes on
Glass. Science 1998, 282, 1105–1107.
(154) Iijima, S.; Ichihashi, T. Single-Shell Carbon Nanotubes of 1-Nm Diameter. Nature
1993, 363, 603–605.
(155) Armandi, M.; Bonelli, B.; Geobaldo, F.; Garrone, E. Nanoporous Carbon Materials
Obtained by Sucrose Carbonization in the Presence of KOH. Microporous
Mesoporous Mater. 2010, 132, 414–420.
(156) Ravikovitch, P. I.; Neimark, A. V. Characterization of Nanoporous Materials from
Adsorption and Desorption Isotherms. Colloids Surfaces A Physicochem. Eng. Asp.
2001, 187-188, 11–21.
(157) Liu, B.; Shioyama, H.; Jiang, H.; Zhang, X.; Xu, Q. Metal-Organic Framework
(MOF) as a Template for Syntheses of Nanoporous Carbons as Electrode Materials
for Supercapacitor. Carbon 2010, 48, 456–463.
(158) Ruiz, V.; Blanco, C.; Raymundo-Piñero, E.; Khomenko, V.; Béguin, F.;
Santamaría, R. Effects of Thermal Treatment of Activated Carbon on the
Electrochemical Behaviour in Supercapacitors. Electrochim. Acta 2007, 52, 4969–
4973.
(159) Adinaveen, T.; John Kennedy, L.; Judith Vijaya, J.; Sekaran, G. Surface and
Porous Characterization of Activated Carbon Prepared from Pyrolysis of Biomass
(rice Straw) by Two-Stage Procedure and Its Applications in Supercapacitor
Electrodes. J. Mater. Cycles Waste Manag. 2014, 1–12.
(160) Sánchez-González, J.; Stoeckli, F.; Centeno, T. A. The Role of the Electric
Conductivity of Carbons in the Electrochemical Capacitor Performance. J.
Electroanal. Chem. 2011, 657, 176–180.
(161) Pandolfo, a. G.; Hollenkamp, a. F. Carbon Properties and Their Role in
Supercapacitors. J. Power Sources 2006, 157, 11–27.
(162) Kennedy, L. J.; Vijaya, J. J.; Sekaran, G. Electrical Conductivity Study of Porous
Carbon Composite Derived from Rice Husk. Mater. Chem. Phys. 2005, 91, 471–
476.
(163) Darmstadt, H.; Roy, C.; Kaliaguine, S.; Choi, S. .; Ryoo, R. Surface Chemistry of
Ordered Mesoporous Carbons. Carbon 2002, 40, 2673–2683.

150
(164) Zhao, L.; Fan, L.-Z.; Zhou, M.-Q.; Guan, H.; Qiao, S.; Antonietti, M.; Titirici,
M.-M. Nitrogen-Containing Hydrothermal Carbons with Superior Performance in
Supercapacitors. Adv. Mater. 2010, 22, 5202–5206.
(165) Dresselhaus, M. S.; Dresselhaus, G.; Charlier, J. C.; Hernández, E. Electronic,
Thermal and Mechanical Properties of Carbon Nanotubes. Philos. Trans. A. Math.
Phys. Eng. Sci. 2004, 362, 2065–2098.
(166) Shahinpoor, M.; Bar-Cohen, Y.; Simpson, J. O.; Smith, J. Ionic Polymer-Metal
Composites (IPMCs) as Biomimetic Sensors, Actuators and Artificial Muscles-a
Review. Smart Mater. Struct. 1998, 7, R15.
(167) Kataura, H.; Kumazawa, Y.; Maniwa, Y.; Umezu, I.; Suzuki, S.; Ohtsuka, Y.;
Achiba, Y. Optical Properties of Single-Wall Carbon Nanotubes. Synth. Met. 1999,
103, 2555–2558.
(168) Wu, Z.; Chen, Z.; Du, X.; Logan, J. M.; Sippel, J.; Nikolou, M.; Kamaras, K.;
Reynolds, J. R.; Tanner, D. B.; Hebard, A. F.; et al. Transparent, Conductive
Carbon Nanotube Films. Science 2004, 305, 1273–1276.
(169) Rinzler, A. G.; Liu, J.; Dai, H.; Nikolaev, P.; Huffman, C. B.; Rodriguez-Macias, F.
J.; Boul, P. J.; Lu, A. H.; Heymann, D.; Colbert, D. T.; et al. Large-Scale
Purification of Single-Wall Carbon Nanotubes: Process, Product, and
Characterization. Applied Physics A: Materials Science & Processing, 1998, 67,
29–37.
(170) O’Connell, M. J.; Boul, P.; Ericson, L. M.; Huffman, C.; Wang, Y.; Haroz, E.;
Kuper, C.; Tour, J.; Ausman, K. D.; Smalley, R. E. Reversible
Water-Solubilization of Single-Walled Carbon Nanotubes by Polymer Wrapping.
Chem. Phys. Lett. 2001, 342, 265–271.
(171) O’Connell, M. J.; Bachilo, S. M.; Huffman, C. B.; Moore, V. C.; Strano, M. S.;
Haroz, E. H.; Rialon, K. L.; Boul, P. J.; Noon, W. H.; Kittrell, C.; et al. Band Gap
Fluorescence from Individual Single-Walled Carbon Nanotubes. Science 2002,
297, 593–596.
(172) Kim, J.; Kang, Y.; Yun, S. Blocked Force Measurement of Electro-Active Paper
Actuator by Micro-Balance. Sensors Actuators, A Phys. 2007, 133, 401–406.
(173) Chalopin, Y.; Volz, S.; Mingo, N. Upper Bound to the Thermal Conductivity of
Carbon Nanotube Pellets. J. Appl. Phys. 2009, 105.
(174) Prasher, R. S.; Hu, X. J.; Chalopin, Y.; Mingo, N.; Lofgreen, K.; Volz, S.; Cleri, F.;
Keblinski, P. Turning Carbon Nanotubes from Exceptional Heat Conductors into
Insulators. Phys. Rev. Lett. 2009, 102.
151
(175) Jiang, H.; Liu, B.; Huang, Y.; Hwang, K. C. Thermal Expansion of Single Wall
Carbon Nanotubes. J. Eng. Mater. Technol. 2004, 126, 265–270.
(176) Maniwa, Y.; Fujiwara, R.; Kira, H.; Tou, H.; Kataura, H.; Suzuki, S.; Achiba, Y.;
Nishibori, E.; Takata, M.; Sakata, M.; et al. Thermal Expansion of Single-Walled
Carbon nanotube(SWNT) Bundles : X-Ray Diffraction Studies. Phys. Rev. B 2001,
64, 10–12.
(177) Lendlein, A.; Kelch, S. Shape-Memory Polymers. Angew. Chemie Int. Ed. 2002,
41, 2034–2057.
(178) Otero, T. F. Reactive Conducting Polymers as Actuating Sensors and Tactile
Muscles. Bioinspir. Biomim. 2008, 3, 035004.
(179) Xiao, L.; Chen, Z.; Feng, C.; Liu, L.; Bai, Z. Q.; Wang, Y.; Qian, L.; Zhang, Y.; Li,
Q.; Jiang, K.; et al. Flexible, Stretchable, Transparent Carbon Nanotube Thin Film
Loudspeakers. Nano Lett. 2008, 8, 4539–4545.
(180) Lu, S.; Panchapakesan, B. Optically Driven Nanotube Actuators. Nanotechnology,
2005, 16, 2548–2554.
(181) Kim, B.; Kim, D.-H.; Jung, J.; Park, J.-O. A Biomimetic Undulatory Tadpole
Robot Using Ionic Polymer–metal Composite Actuators. Smart Mater. Struct.
2005, 14, 1579.
(182) Shahinpoor, M.; Kim, K. J. Ionic Polymer-Metal Composites: I. Fundamentals.
Smart Mater. Struct. 2001, 10, 819.
(183) Sutar, D.; Aswal, D. K.; Gupta, S. K.; Yakhmi, J. V. Electrochemical Actuator
from Conductive Electroactive Polymer Polypyrrole Deposited on Gold. Indian J.
Pure Appl. Phys. 2007, 45, 354–357.
(184) Lang, X.; Hirata, A.; Fujita, T.; Chen, M. Nanoporous Metal/oxide Hybrid
Electrodes for Electrochemical Supercapacitors. Nat. Nanotechnol. 2011, 6, 232–
236.
(185) Jiang, H.; Li, C.; Sun, T.; Ma, J. High-Performance Supercapacitor Material Based
on Ni(OH)2 Nanowire-MnO2 Nanoflakes Core–shell Nanostructures. Chem.
Commun. 2012, 48, 2606.
(186) Wei, W.; Cui, X.; Chen, W.; Ivey, D. G. Manganese Oxide-Based Materials as
Electrochemical Supercapacitor Electrodes. Chem. Soc. Rev. 2011, 40, 1697–1721.

152
(187) Xu, C.; Shin, P.; Cao, L.; Gao, D. Preferential Growth of Long ZnO Nanowire
Array and Its Application in Dye-Sensitized Solar Cells. J. Phys. Chem. C 2009,
114, 125–129.
(188) Greene, L. E.; Law, M.; Goldberger, J.; Kim, F.; Johnson, J. C.; Zhang, Y.;
Saykally, R. J.; Yang, P. Low‐temperature Wafer‐scale Production of ZnO
Nanowire Arrays. Angew. Chemie Int. Ed. 2003, 42, 3031–3034.
(189) Hu, L.; Chen, W.; Xie, X.; Liu, N.; Yang, Y.; Wu, H.; Yao, Y.; Pasta, M.;
Alshareef, H. N.; Cui, Y. Symmetrical MnO2–carbon Nanotube–textile
Nanostructures for Wearable Pseudocapacitors with High Mass Loading. ACS
Nano 2011, 5, 8904–8913.
(190) Niekerk, W. Van; Lachmann, G.; Eldik, R. Van; Hamza, M. A Kinetic and
Mechanistic Study of the Chromium (VI) Reduction by Hydrogen Peroxide in
Acidic Aqueous Solutions. Water SA 2007, 33, 619–626.