capitamalls asia limitedcapitamallsasia.listedcompany.com/newsroom/cma011112b.pdf · capitamalls...
TRANSCRIPT
Presentation to media and analysts *Nov 2012*
Singapore • China • Malaysia • Japan • India
Presentation to media & analysts 2 November 2012
CapitaMalls Asia Limited
Asia’s Leading Mall Developer, Owner and Manager
Presentation to media and analysts *Nov 2012*
Contents CapitaMalls Asia Overview and China
Strategy - Corporate Overview and Strengths - China Presence and Business Strategy West China Region - Overview - Chengdu - Operating Malls in West Region - New Projects in West Region North China Region - Overview - Beijing - Operating Malls in North Region - New Projects in North Region
1

Presentation to media and analysts *Nov 2012* CMA Overview and China Strategy
Presentation to media and analysts *Nov 2012*
Corporate Overview and Strengths
3
Presentation to media and analysts *Nov 2012*
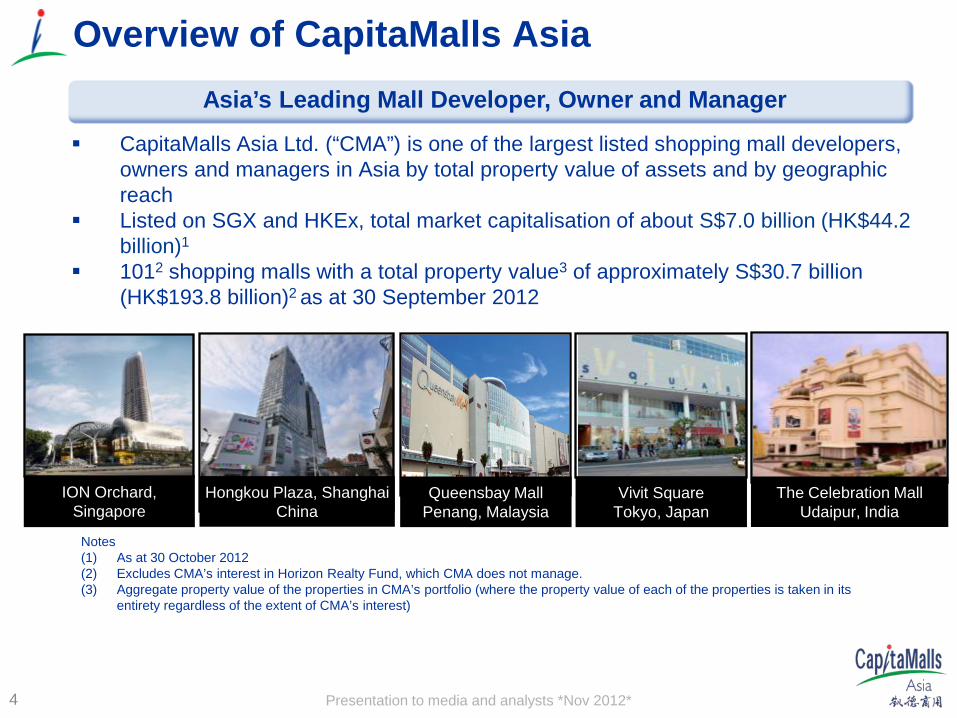
CapitaMalls Asia Ltd. (“CMA”) is one of the largest listed shopping mall developers, owners and managers in Asia by total property value of assets and by geographic reach
Listed on SGX and HKEx, total market capitalisation of about S$7.0 billion (HK$44.2 billion)1
1012 shopping malls with a total property value3 of approximately S$30.7 billion (HK$193.8 billion)2 as at 30 September 2012
Overview of CapitaMalls Asia Asia’s Leading Mall Developer, Owner and Manager
Queensbay Mall Penang, Malaysia
Vivit Square Tokyo, Japan
ION Orchard, Singapore
Hongkou Plaza, Shanghai China
The Celebration Mall Udaipur, India
Notes (1) As at 30 October 2012 (2) Excludes CMA’s interest in Horizon Realty Fund, which CMA does not manage. (3) Aggregate property value of the properties in CMA’s portfolio (where the property value of each of the properties is taken in its
entirety regardless of the extent of CMA’s interest)
4
Presentation to media and analysts *Nov 2012*
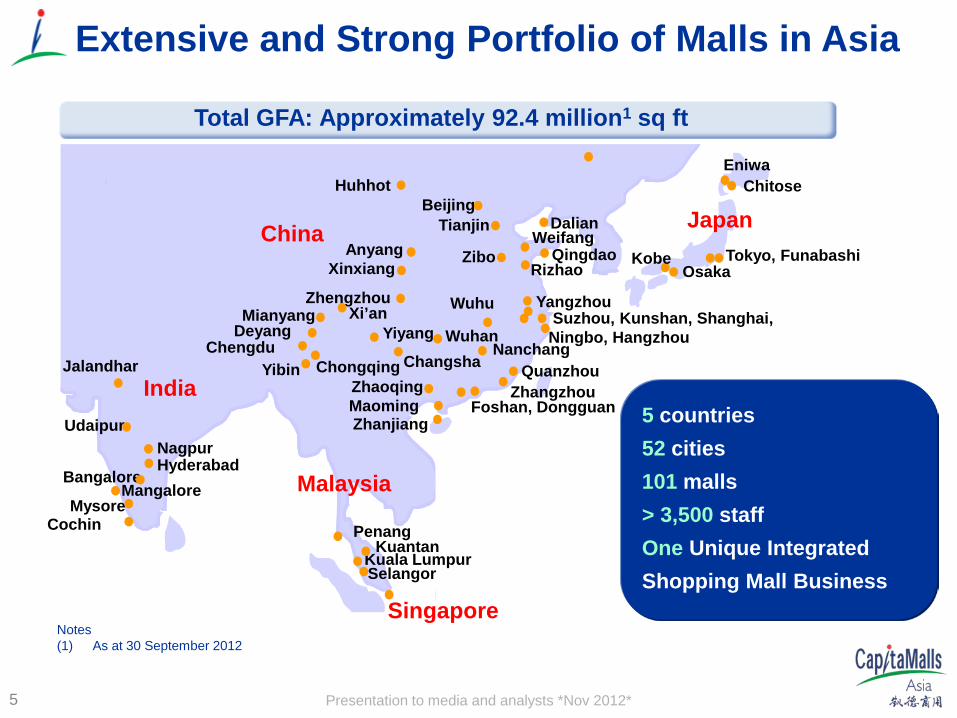
Extensive and Strong Portfolio of Malls in Asia
Total GFA: Approximately 92.4 million1 sq ft
5
India
Tokyo, Funabashi Osaka
Zhanjiang Maoming
Wuhu Suzhou, Kunshan, Shanghai, Ningbo, Hangzhou
Weifang Zibo
Beijing
Zhengzhou
Chengdu
Mianyang
China Xinxiang
Anyang
Yangzhou
Deyang
Huhhot
Foshan, Dongguan
Penang
Jalandhar
Udaipur Nagpur
Mangalore Mysore
Cochin
Bangalore Hyderabad
Tianjin
Rizhao
Yibin Chongqing
Yiyang
Changsha Quanzhou Zhangzhou
Eniwa Chitose
Xi’an
Dalian
Kobe
Wuhan
Zhaoqing
Japan
Selangor Kuala Lumpur
Malaysia
Singapore
Nanchang
5 countries 52 cities 101 malls
> 3,500 staff One Unique Integrated Shopping Mall Business
Kuantan
Qingdao
Notes (1) As at 30 September 2012

Presentation to media and analysts *Nov 2012*
From 5 Malls in 2002 to 101 Malls Today
6
Proven track record since 2002
1.8 2.7 3.1 5.2
11.3 13.3
19.4 20.4 21.9
29.4 30.7
Dec-02 Dec-03 Dec-04 Dec-05 Dec-06 Dec-07 Dec-08 Dec-09 Dec-10 Dec-11 Sep-12
Property valuation on a 100% basis (in S$ billion)
182 659 > 3,500 Employees
Milestones
Properties 5 10 10 24 55 78 96 86 91 101
CMT listing
CRCT listing
CMA listing
CMMTlisting
CMA HK listing
Presentation to media and analysts *Nov 2012*
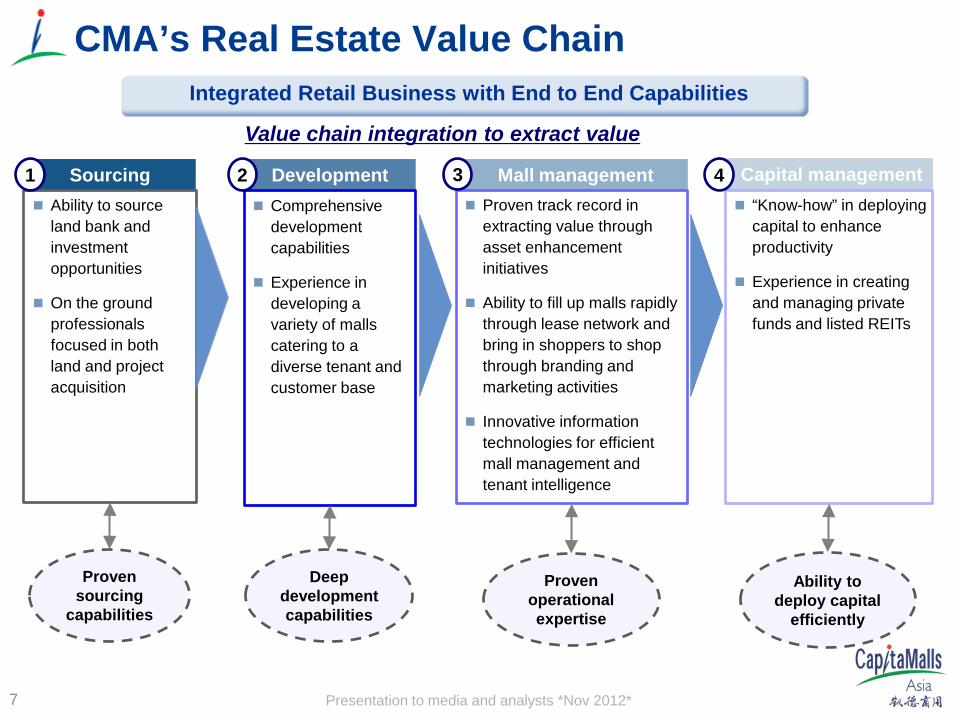
CMA’s Real Estate Value Chain Integrated Retail Business with End to End Capabilities
7
Value chain integration to extract value
Sourcing Ability to source
land bank and investment opportunities
On the ground professionals focused in both land and project acquisition
Development Comprehensive
development capabilities
Experience in developing a variety of malls catering to a diverse tenant and customer base
Capital management “Know-how” in deploying
capital to enhance productivity
Experience in creating and managing private funds and listed REITs
1
Proven sourcing
capabilities
Deep development capabilities
Ability to deploy capital
efficiently
Mall management Proven track record in
extracting value through asset enhancement initiatives
Ability to fill up malls rapidly through lease network and bring in shoppers to shop through branding and marketing activities
Innovative information technologies for efficient mall management and tenant intelligence
Proven operational expertise
2 3 4
Presentation to media and analysts *Nov 2012*
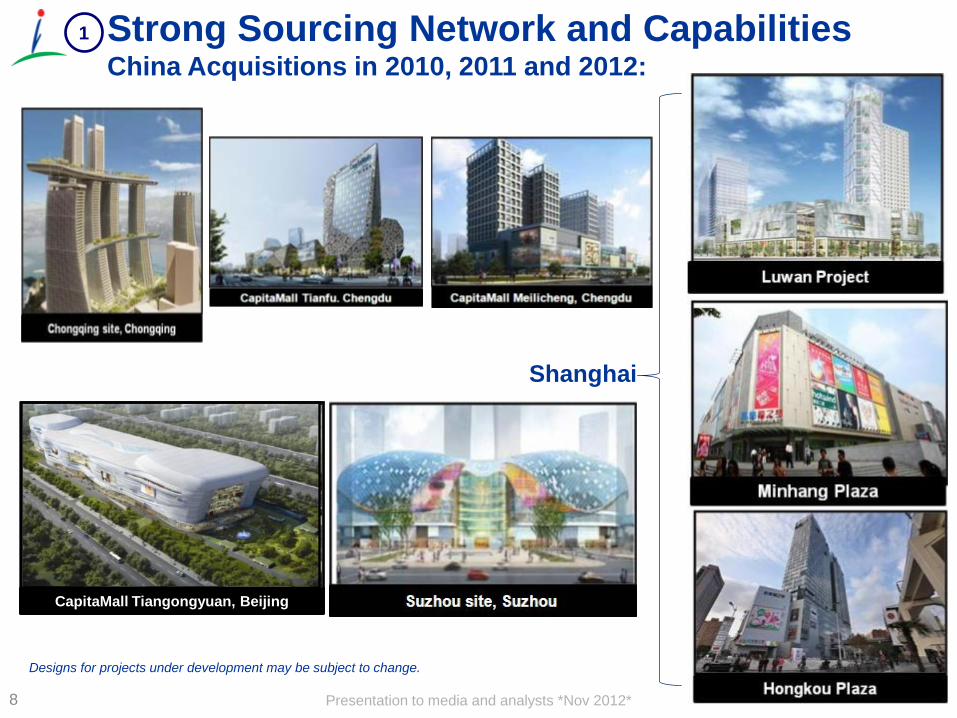
Strong Sourcing Network and Capabilities China Acquisitions in 2010, 2011 and 2012:
Designs for projects under development may be subject to change.
Shanghai
CapitaMall Tiangongyuan, Beijing
8
1
Presentation to media and analysts *Nov 2012*
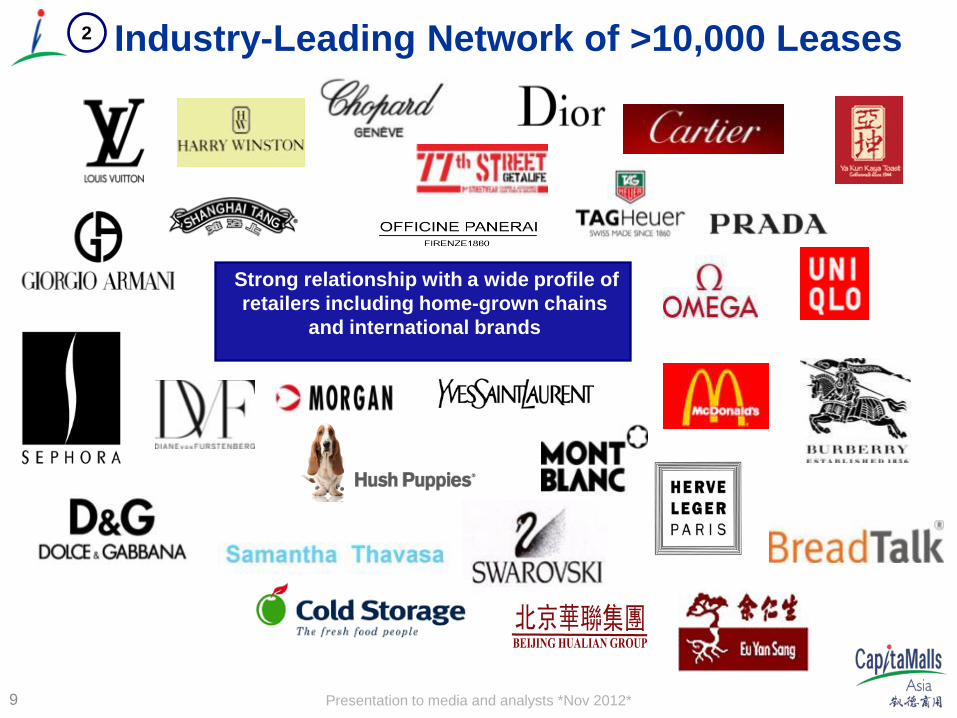
Strong relationship with a wide profile of retailers including home-grown chains
and international brands
Industry-Leading Network of >10,000 Leases 2
9
Presentation to media and analysts *Nov 2012*
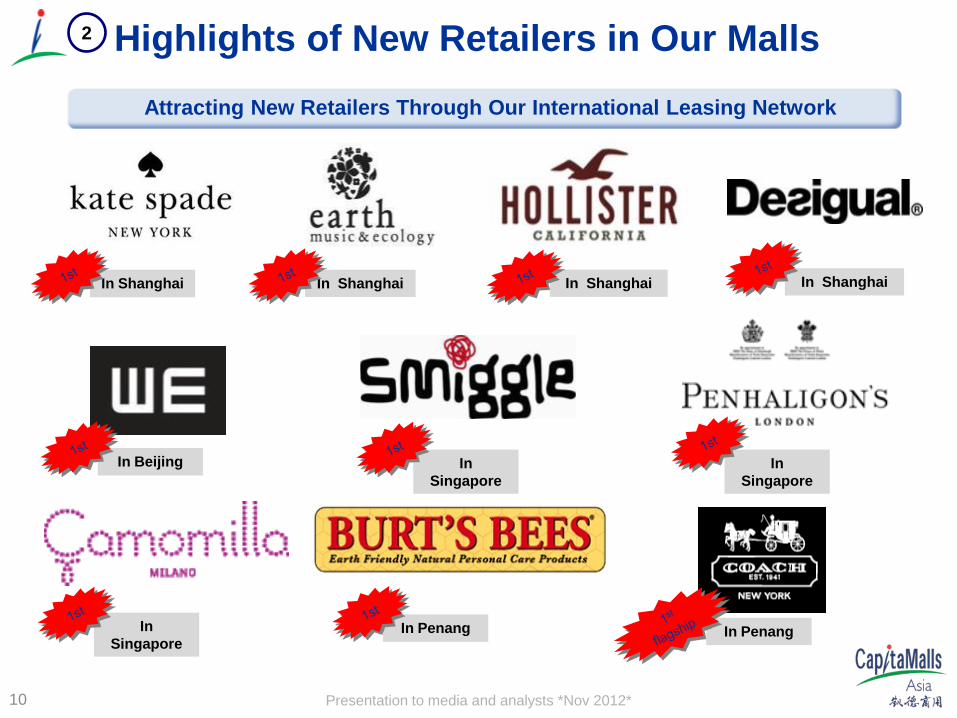
Attracting New Retailers Through Our International Leasing Network
In Shanghai
In Singapore
In Singapore
In Shanghai In Shanghai In Shanghai
In Penang
In Beijing
In Penang In Singapore
Highlights of New Retailers in Our Malls
10
2

Presentation to media and analysts *Nov 2012*
Partnering Our Retailers to Grow and Regionalise
11
3
• Tenant engagement programme to add value to retailers’ business • Seminars and workshops conducted by industry experts
Presentation to media and analysts *Nov 2012*
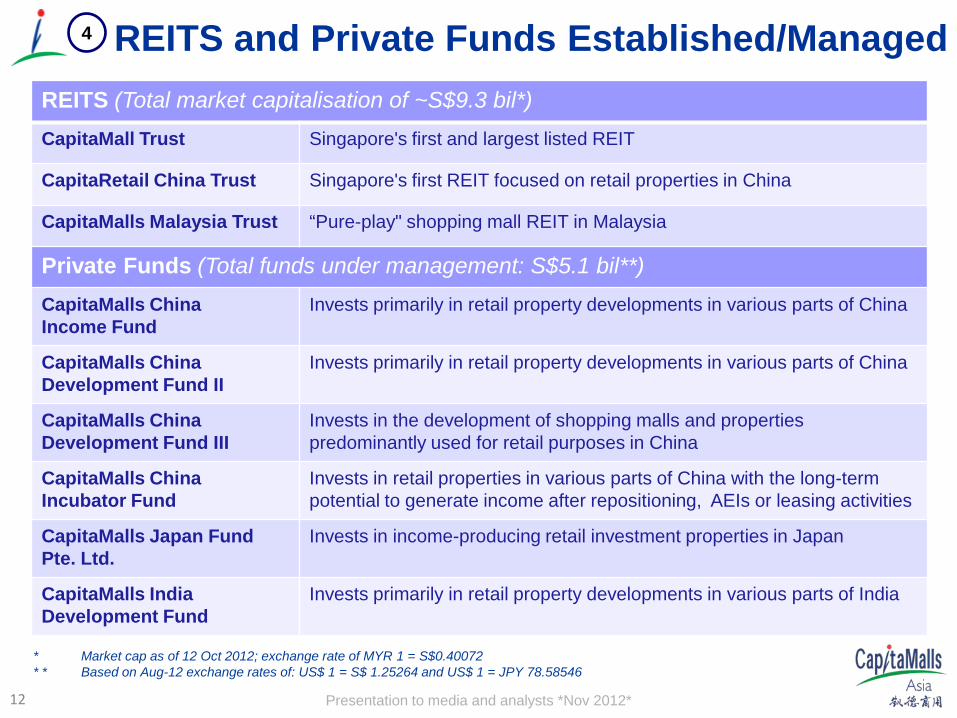
REITS and Private Funds Established/Managed 4
REITS (Total market capitalisation of ~S$9.3 bil*) CapitaMall Trust Singapore's first and largest listed REIT
CapitaRetail China Trust Singapore's first REIT focused on retail properties in China
CapitaMalls Malaysia Trust “Pure-play" shopping mall REIT in Malaysia
Private Funds (Total funds under management: S$5.1 bil**) CapitaMalls China Income Fund
Invests primarily in retail property developments in various parts of China
CapitaMalls China Development Fund II
Invests primarily in retail property developments in various parts of China
CapitaMalls China Development Fund III
Invests in the development of shopping malls and properties predominantly used for retail purposes in China
CapitaMalls China Incubator Fund
Invests in retail properties in various parts of China with the long-term potential to generate income after repositioning, AEIs or leasing activities
CapitaMalls Japan Fund Pte. Ltd.
Invests in income-producing retail investment properties in Japan
CapitaMalls India Development Fund
Invests primarily in retail property developments in various parts of India
* Market cap as of 12 Oct 2012; exchange rate of MYR 1 = S$0.40072 * * Based on Aug-12 exchange rates of: US$ 1 = S$ 1.25264 and US$ 1 = JPY 78.58546
12

Presentation to media and analysts *Nov 2012*
China Presence and Business Strategy
13
Presentation to media and analysts *Nov 2012*
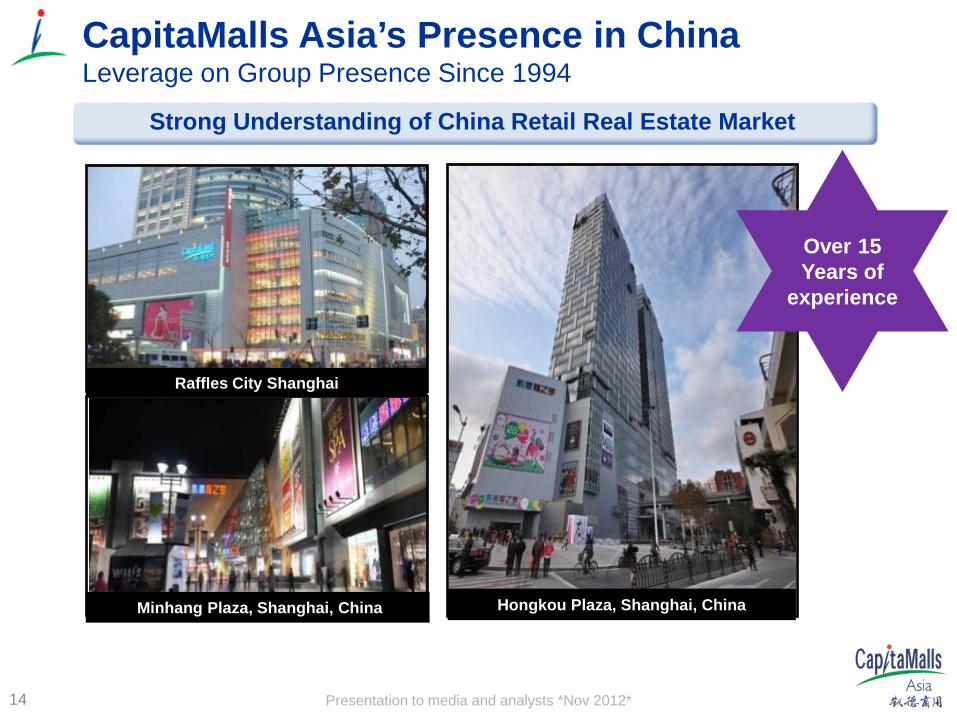
CapitaMalls Asia’s Presence in China Leverage on Group Presence Since 1994
Minhang Plaza, Shanghai, China Hongkou Plaza, Shanghai, China
Raffles City Shanghai
Strong Understanding of China Retail Real Estate Market
Over 15 Years of
experience
14

Presentation to media and analysts *Nov 2012*
Malls are Strategically Located in Large Population Catchment Areas
Raffles City Beijing CapitaMall Jinniu, Chengdu CapitaMall Dongguan
CapitaMall Saihan, Huhhot CapitaMall Yuhuating, Changsha CapitaMall Qibao, Shanghai
One-stop shopping, dining and entertainment destinations within sizeable population catchment areas
Well-positioned and accessible via major transportation routes
15
Presentation to media and analysts *Nov 2012*
Suzhou
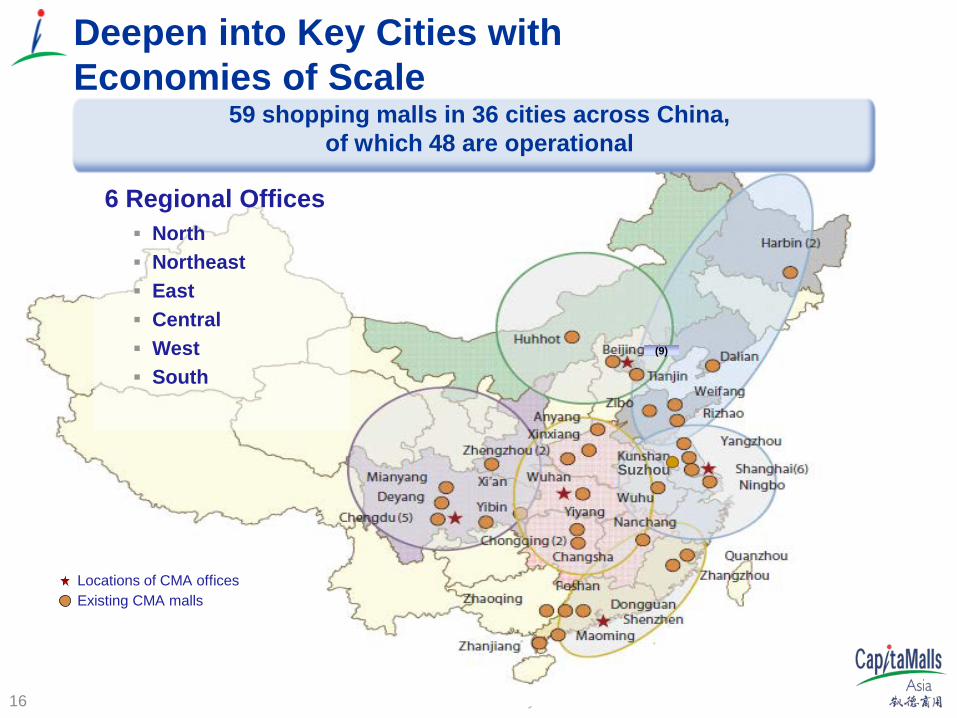
Deepen into Key Cities with Economies of Scale
59 shopping malls in 36 cities across China, of which 48 are operational
16
Existing CMA malls Locations of CMA offices
6 Regional Offices North Northeast East Central West South
(9)

Presentation to media and analysts *Nov 2012*
3
5,950 6,718 7,641
8,921
10,849
13,268
15,700
18,123
2004 2005 2006 2007 2008 2009 2010 2011
2
Rising Disposable Income per Capita (RMB) Creating Stimulus for Consumption
RMB Bil
9,422 10,493 11,759
13,786 15,781
17,175 19,109
21,810
2004 2005 2006 2007 2008 2009 2010 2011
RMB
30.9% 35.8%
42.5% 47.0% 51.1% 55.0% 58.6% 61.9%
1995 2000 2005 2010 2015 2020 2025 2030
Increasing Urbanisation – Projected to reach 61.9% in 2030 1
Strong Potential for Shopping Mall Sector in China, especially in Tier 2 and 3 cities
Retailers Continue to Enjoy Strong Sales
China Fundamentals Remain Strong
Source: National Bureau of Statistics of China
Source: United Nations Source: National Bureau of Statistics of China
17
Presentation to media and analysts *Nov 2012*
Chengdu
Anyang Mall
Zhengzhou Xinxiang
Chongqing
Foshan
Coastal Cities
Wuhan
Shenzhen
Zhengzhou
Chengdu
Inland Plants
Changsha
Tianjin
Beijing
Shanghai
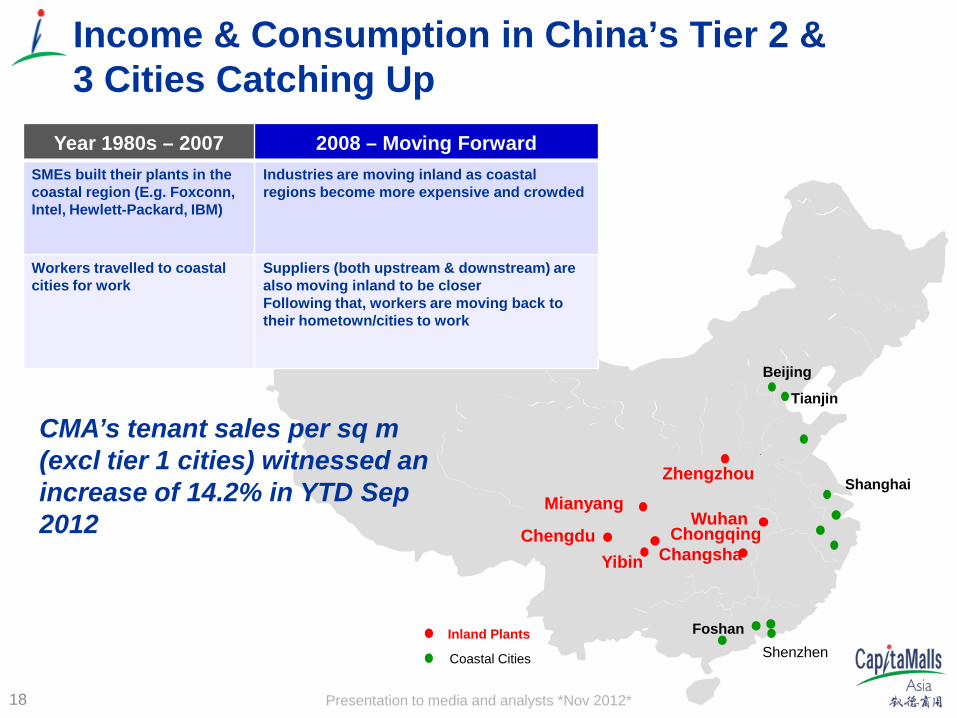
Year 1980s – 2007 2008 – Moving Forward SMEs built their plants in the coastal region (E.g. Foxconn, Intel, Hewlett-Packard, IBM)
Industries are moving inland as coastal regions become more expensive and crowded
Workers travelled to coastal cities for work
Suppliers (both upstream & downstream) are also moving inland to be closer Following that, workers are moving back to their hometown/cities to work
CMA’s tenant sales per sq m (excl tier 1 cities) witnessed an increase of 14.2% in YTD Sep 2012
Mianyang
Yibin
Income & Consumption in China’s Tier 2 & 3 Cities Catching Up
18
Presentation to media and analysts *Nov 2012*
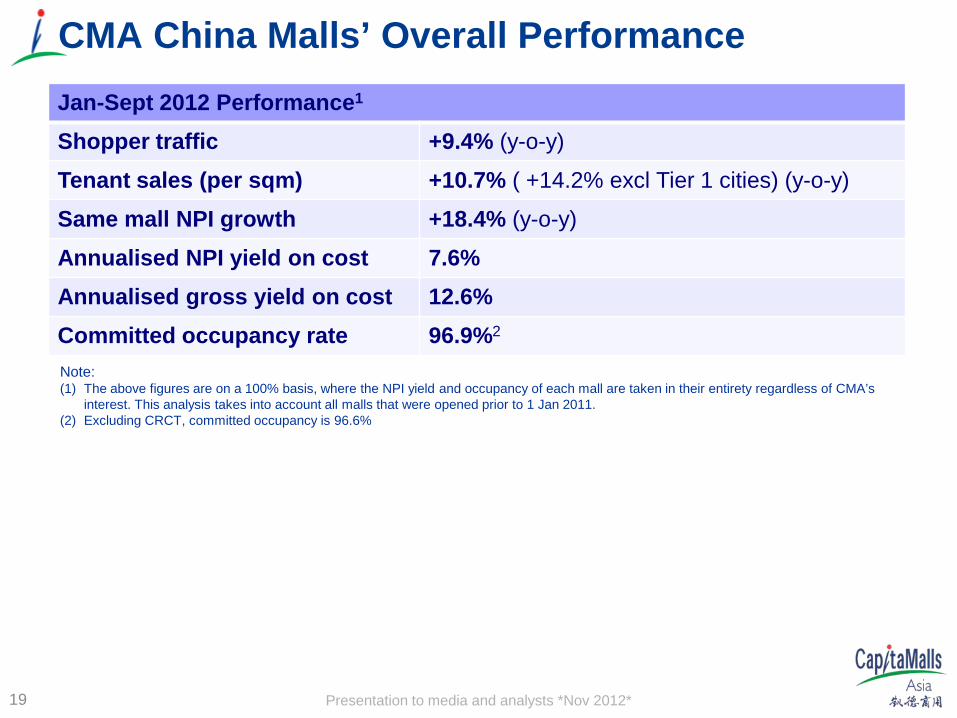
CMA China Malls’ Overall Performance
19
Jan-Sept 2012 Performance1 Shopper traffic +9.4% (y-o-y)
Tenant sales (per sqm) +10.7% ( +14.2% excl Tier 1 cities) (y-o-y)
Same mall NPI growth +18.4% (y-o-y) Annualised NPI yield on cost 7.6%
Annualised gross yield on cost 12.6%
Committed occupancy rate 96.9%2
Note: (1) The above figures are on a 100% basis, where the NPI yield and occupancy of each mall are taken in their entirety regardless of CMA’s
interest. This analysis takes into account all malls that were opened prior to 1 Jan 2011. (2) Excluding CRCT, committed occupancy is 96.6%
Presentation to media and analysts *Nov 2012*
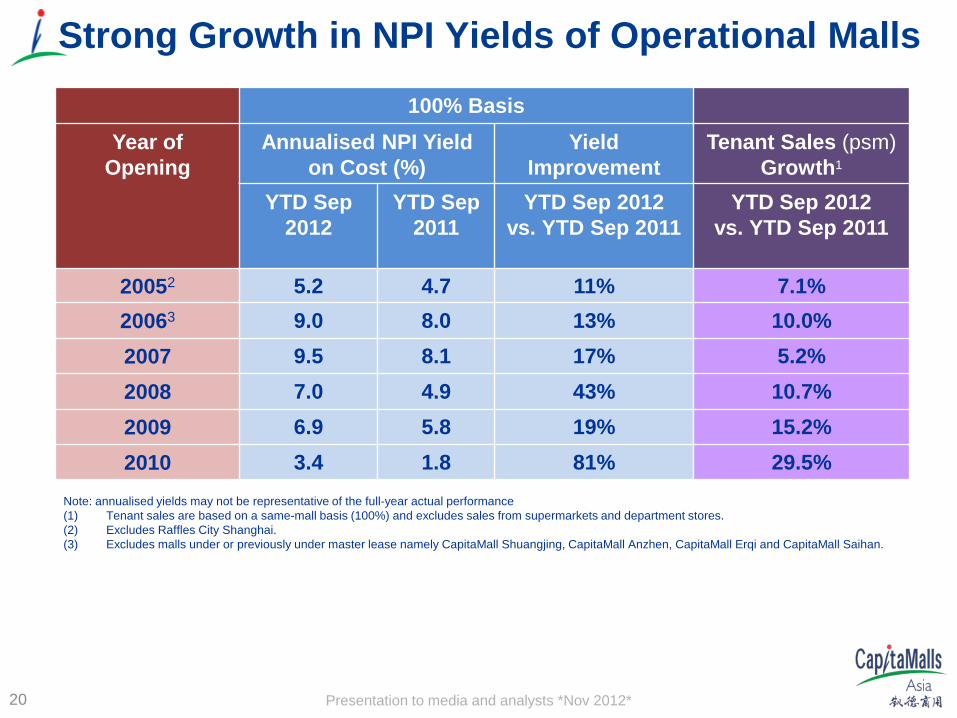
Strong Growth in NPI Yields of Operational Malls
20
100% Basis
Year of Opening
Annualised NPI Yield on Cost (%)
Yield Improvement
Tenant Sales (psm) Growth1
YTD Sep 2012
YTD Sep 2011
YTD Sep 2012 vs. YTD Sep 2011
YTD Sep 2012 vs. YTD Sep 2011
20052 5.2 4.7 11% 7.1% 20063 9.0 8.0 13% 10.0% 2007 9.5 8.1 17% 5.2% 2008 7.0 4.9 43% 10.7% 2009 6.9 5.8 19% 15.2%
2010 3.4 1.8 81% 29.5% Note: annualised yields may not be representative of the full-year actual performance (1) Tenant sales are based on a same-mall basis (100%) and excludes sales from supermarkets and department stores. (2) Excludes Raffles City Shanghai. (3) Excludes malls under or previously under master lease namely CapitaMall Shuangjing, CapitaMall Anzhen, CapitaMall Erqi and CapitaMall Saihan.
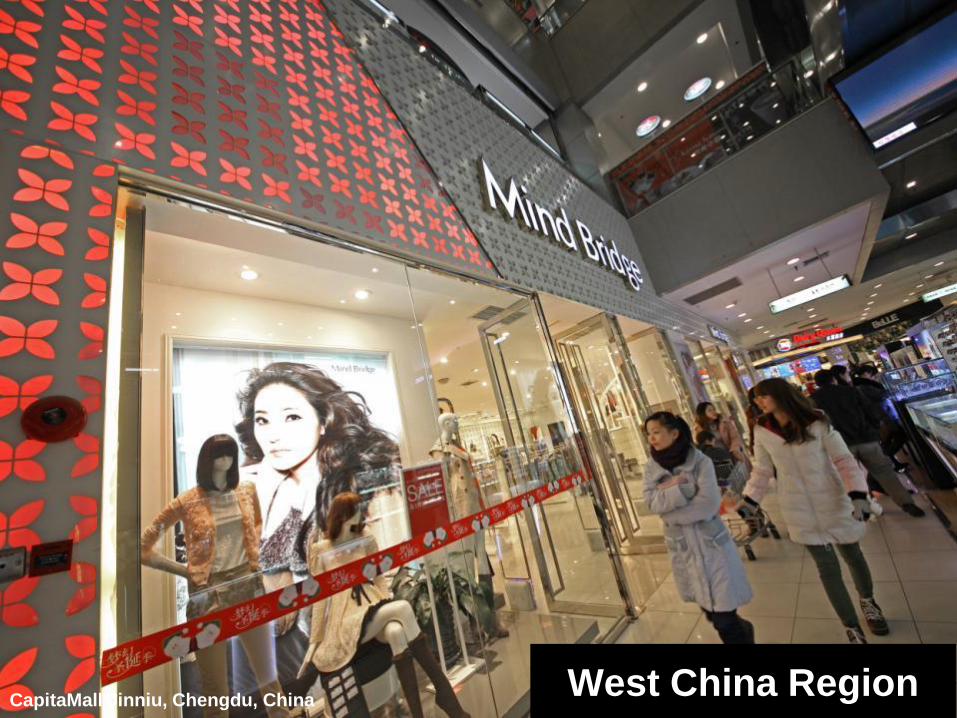
Presentation to media and analysts *Nov 2012* 21 West China Region CapitaMall Jinniu, Chengdu, China
Presentation to media and analysts *Nov 2012*
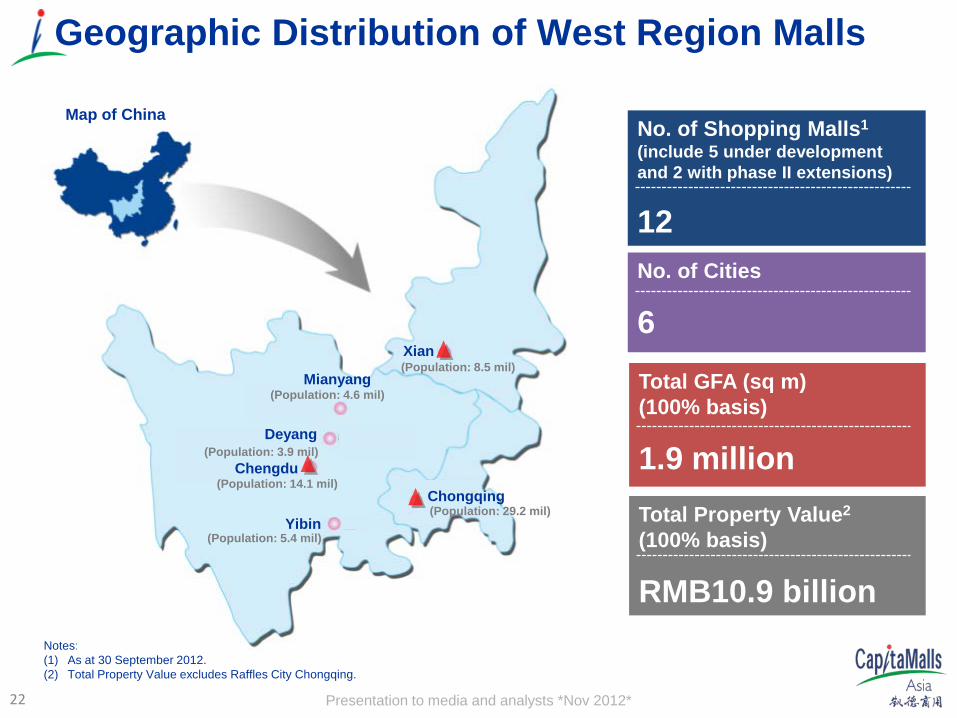
Geographic Distribution of West Region Malls
No. of Shopping Malls1 (include 5 under development and 2 with phase II extensions)
12 No. of Cities
6 Total GFA (sq m) (100% basis)
1.9 million Total Property Value2 (100% basis)
RMB10.9 billion Notes: (1) As at 30 September 2012. (2) Total Property Value excludes Raffles City Chongqing.
Map of China
Mianyang
Chengdu
Deyang
Yibin
Chongqing
Xian
(Population: 4.6 mil)
(Population: 14.1 mil)
(Population: 8.5 mil)
(Population: 5.4 mil)
(Population: 29.2 mil)
(Population: 3.9 mil)
22

Presentation to media and analysts *Nov 2012*
Chengdu
23
Presentation to media and analysts *Nov 2012* 24
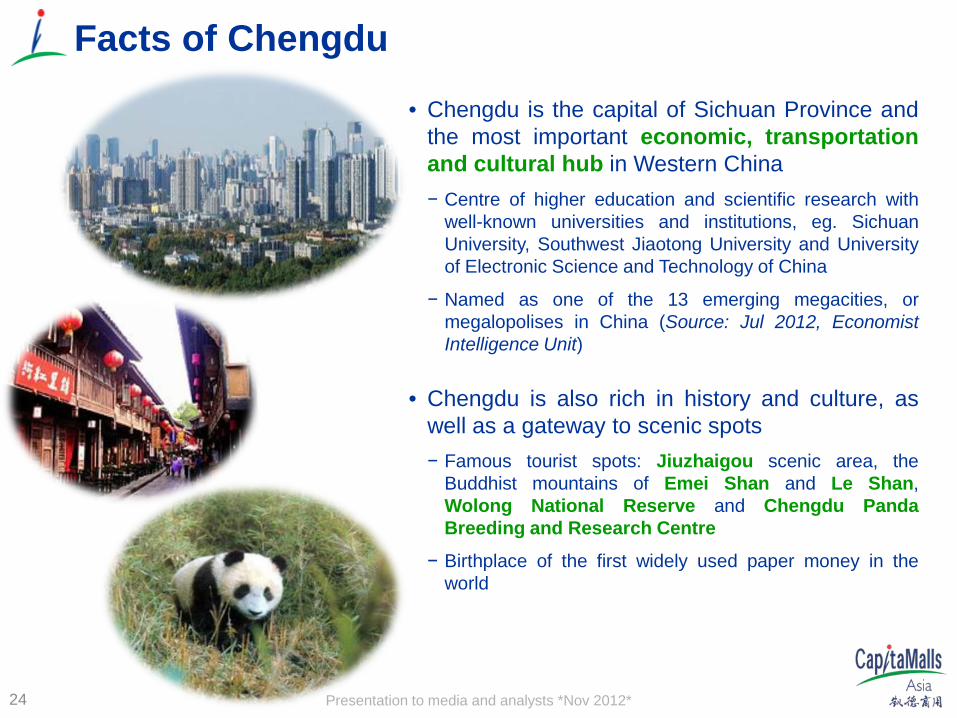
Facts of Chengdu
• Chengdu is the capital of Sichuan Province and the most important economic, transportation and cultural hub in Western China − Centre of higher education and scientific research with
well-known universities and institutions, eg. Sichuan University, Southwest Jiaotong University and University of Electronic Science and Technology of China
− Named as one of the 13 emerging megacities, or megalopolises in China (Source: Jul 2012, Economist Intelligence Unit)
• Chengdu is also rich in history and culture, as well as a gateway to scenic spots − Famous tourist spots: Jiuzhaigou scenic area, the
Buddhist mountains of Emei Shan and Le Shan, Wolong National Reserve and Chengdu Panda Breeding and Research Centre
− Birthplace of the first widely used paper money in the world

Presentation to media and analysts *Nov 2012*
Excellent Connectivity Around the World
Source: Chengdu Shuangliu International Airport, Chengdu Metro.
25
Extensive Transportation Network that Enhances Chengdu’s Accessibility
Chengdu Shuangliu International Airport
Air
High-speed Railway Railway Highway
Chengdu Highway
• 3 national highways that links Sichuan Province to Shanxi Province, Tibet and Yunnan Province
• 8 expressways to Chongqing, Mianyang, Leshan, Ya’an, Dazhou and Dujiangyan
• 5th busiest airport in China & handled 29 million passengers in 2011 (12.6% increase from 2010)
• Flights to 92 domestic and 19 international destinations, including Amsterdam, New Delhi, Bangalore, Mumbai, Singapore, Hong Kong, Macao, Tokyo, Seoul, etc.
• High-speed railway: − Chengdu-Dujiangyan high speed railway
(completed) − Shanghai–Wuhan–Chengdu high speed
railway (2013) − Chengdu-Chongqing high speed railway
(2014) − Xian-Chengdu high speed railway (2014)
Metro
• Existing subway lines 1 & 2 • Planning subway lines 3 – 7 to be operational by 2017 • Expected to carry 13.1 million passengers per day by 2020
Presentation to media and analysts *Nov 2012*
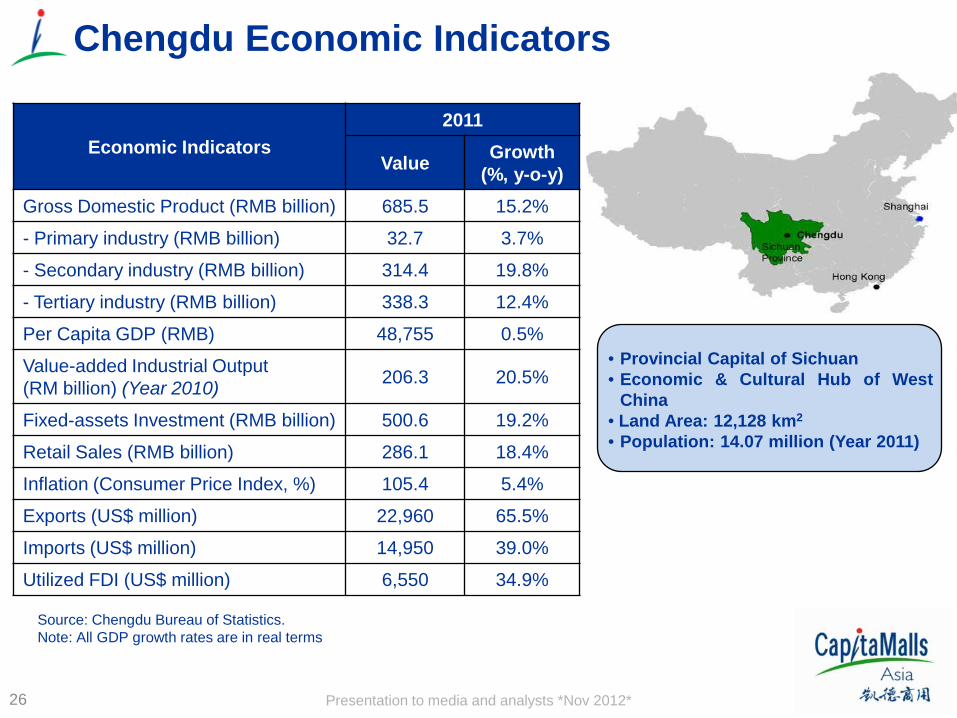
Chengdu Economic Indicators
Economic Indicators 2011
Value Growth (%, y-o-y)
Gross Domestic Product (RMB billion) 685.5 15.2%
- Primary industry (RMB billion) 32.7 3.7%
- Secondary industry (RMB billion) 314.4 19.8%
- Tertiary industry (RMB billion) 338.3 12.4%
Per Capita GDP (RMB) 48,755 0.5%
Value-added Industrial Output (RM billion) (Year 2010) 206.3 20.5%
Fixed-assets Investment (RMB billion) 500.6 19.2%
Retail Sales (RMB billion) 286.1 18.4%
Inflation (Consumer Price Index, %) 105.4 5.4%
Exports (US$ million) 22,960 65.5%
Imports (US$ million) 14,950 39.0%
Utilized FDI (US$ million) 6,550 34.9%
Source: Chengdu Bureau of Statistics. Note: All GDP growth rates are in real terms
26
• Provincial Capital of Sichuan • Economic & Cultural Hub of West
China • Land Area: 12,128 km2
• Population: 14.07 million (Year 2011)

Presentation to media and analysts *Nov 2012* 27
Chengdu Population Growth
Source: Chengdu Bureau of Statistics Note: Total population includes long-stay residents
2007 2008 2009 2010 2011 Population (m) 12.53 12.71 12.87 14.05 14.07 % Growth - 1.4% 1.3% 9.2% 0.2%
0.0%
1.0%
2.0%
3.0%
4.0%
5.0%
6.0%
7.0%
8.0%
9.0%
10.0%
11.50
12.00
12.50
13.00
13.50
14.00
14.50
mill
ion

Presentation to media and analysts *Nov 2012*
Source: Statistical bureau of various cities
Chengdu: One of China’s Fastest Growing Cities
28
100%
150%
200%
250%
2005 2006 2007 2008 2009 2010 2011
Per Capita GDP
RMB 2005 2006 2007 2008 2009 2010 2011
Beijing 45,993 52,054 61,274 66,797 70,452 75,943 80,394
Shanghai 49,649 54,858 62,041 66,932 69,164 76,074 82,560
Chengdu 19,670 22,445 26,849 31,203 35,215 48,510 48,755
100%
150%
200%
250%
300%
2005 2006 2007 2008 2009 2010 2011
GDP
RMB bil 2005 2006 2007 2008 2009 2010 2011
Beijing 689 772 901 1,049 1,187 1,378 1,600
Shanghai 914 1,030 1,200 1,370 1,505 1,717 1,920
Chengdu 238 277 332 394 450 555 685
Average GDP growth of 19.3%, above China’s average of 9.2%
Presentation to media and analysts *Nov 2012*
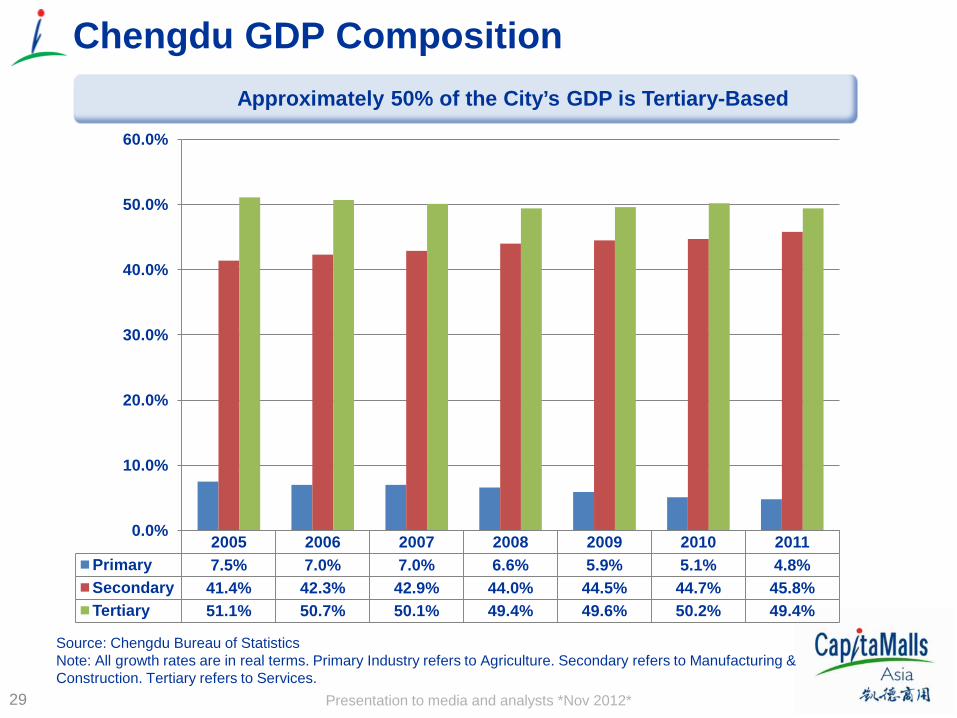
Chengdu GDP Composition
Source: Chengdu Bureau of Statistics Note: All growth rates are in real terms. Primary Industry refers to Agriculture. Secondary refers to Manufacturing & Construction. Tertiary refers to Services.
29
2005 2006 2007 2008 2009 2010 2011 Primary 7.5% 7.0% 7.0% 6.6% 5.9% 5.1% 4.8% Secondary 41.4% 42.3% 42.9% 44.0% 44.5% 44.7% 45.8% Tertiary 51.1% 50.7% 50.1% 49.4% 49.6% 50.2% 49.4%
0.0%
10.0%
20.0%
30.0%
40.0%
50.0%
60.0%
Approximately 50% of the City’s GDP is Tertiary-Based
Presentation to media and analysts *Nov 2012*
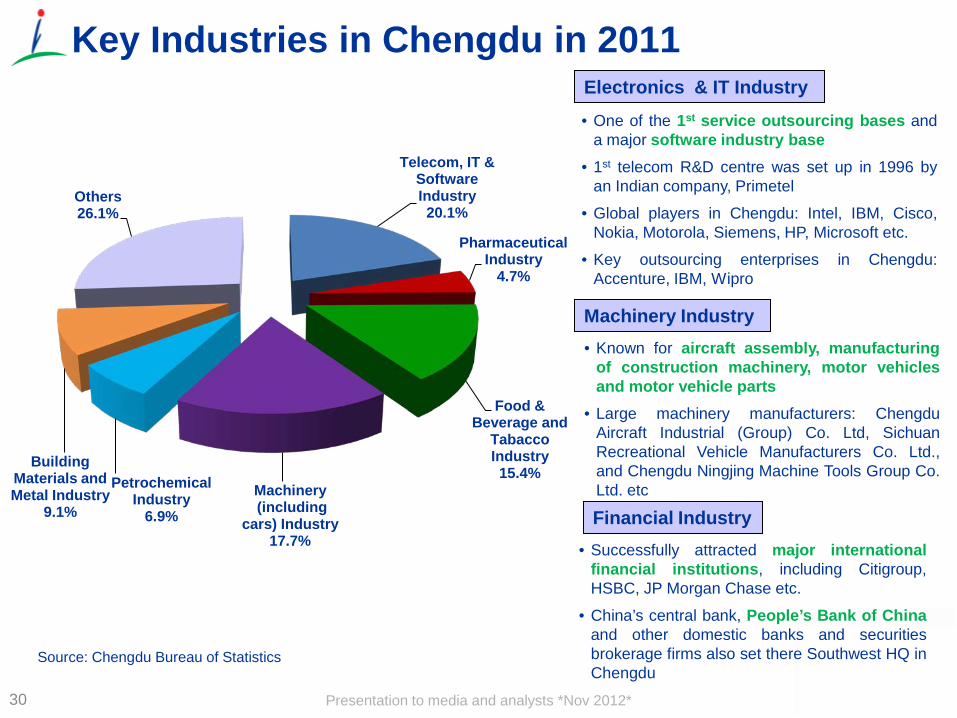
Key Industries in Chengdu in 2011
Source: Chengdu Bureau of Statistics
30
Telecom, IT & Software Industry 20.1%
Pharmaceutical Industry
4.7%
Food & Beverage and
Tabacco Industry 15.4%
Machinery (including
cars) Industry 17.7%
Petrochemical Industry
6.9%
Building Materials and Metal Industry
9.1%
Others 26.1%
• One of the 1st service outsourcing bases and a major software industry base
• 1st telecom R&D centre was set up in 1996 by an Indian company, Primetel
• Global players in Chengdu: Intel, IBM, Cisco, Nokia, Motorola, Siemens, HP, Microsoft etc.
• Key outsourcing enterprises in Chengdu: Accenture, IBM, Wipro
Electronics & IT Industry
Financial Industry
Machinery Industry • Known for aircraft assembly, manufacturing
of construction machinery, motor vehicles and motor vehicle parts
• Large machinery manufacturers: Chengdu Aircraft Industrial (Group) Co. Ltd, Sichuan Recreational Vehicle Manufacturers Co. Ltd., and Chengdu Ningjing Machine Tools Group Co. Ltd. etc
• Successfully attracted major international financial institutions, including Citigroup, HSBC, JP Morgan Chase etc.
• China’s central bank, People’s Bank of China and other domestic banks and securities brokerage firms also set there Southwest HQ in Chengdu

Presentation to media and analysts *Nov 2012*
Source: Statistical bureau of various cities
Chengdu: One of China’s Fastest Growing Cities
31
RMB bil 2005 2006 2007 2008 2009 2010 2011
Beijing 291 330 384 465 531 623 690
Shanghai 298 338 387 458 517 607 678
Chengdu 101 116 136 162 205 242 286
RMB 2005 2006 2007 2008 2009 2010 2011
Beijing 17,653 19,978 21,989 24,725 26,738 29,073 32,903
Shanghai 18,645 20.668 23,623 26,675 28,838 31,838 36,230
Chengdu 11,359 12,789 14,849 16,943 18,659 20,836 23,932
Stronger Disposable Income Per Capita & Retail Sales Growth
Disposable Income Per Capita
100%
120%
140%
160%
180%
200%
220%
2005 2006 2007 2008 2009 2010 2011
Retail Sales
100%
150%
200%
250%
300%
2005 2006 2007 2008 2009 2010 2011

Presentation to media and analysts *Nov 2012*
1 金牛 Jinniu
2 沙湾 Shawan
来福士 Raffles City 3
4 天府 Tianfu
Chengdu Major Micro-Markets
Source: CBRE
5
魅力城 Meilicheng
Major Office Areas 1. CBD 2. South Renmin Road
Major Retail Areas 3. Chunxi Road 4. Yanshikou
Major Luxury Residential Areas 5. Qingshuihe-Shuangnan 6. Zijing 7. Dongdajie-Wangjiang 8. South New City 9. Jianshe Road
Major Industrial Areas 10. Chengdu HIDZ1 (West Park) 11. Chengdu HIDZ1 (South Park) 12. Chengdu ETDZ2
Notes: (1) Refers to High-tech Industrial Development Zone. (2) Refers to Economic & Technological Development Zone.
CMA Projects in Chengdu
32

Presentation to media and analysts *Nov 2012*
Chengdu Retail Supply and Retail Space Per Capita
Source: Chengdu Bureau of Statistics and Jones Lang LaSalle and Cushman & Wakefield Note: Population includes long-stay residents and population growth from 2012 to beyond 2014 is based on a 2.2% increase
per annum.
33
0 0.1 0.2 0.3 0.4 0.5 0.6 0.7 0.8 0.9 1
0 100,000 200,000 300,000 400,000 500,000 600,000 700,000 800,000 900,000
1,000,000 1,100,000 1,200,000 1,300,000 1,400,000
Ret
ail S
pace
per
Cap
ita
Ret
ail G
FA (s
q m
)
Total Departmental Store Supply Total Shopping Mall Supply Retail Space Per Capita
Presentation to media and analysts *Nov 2012*
0.00
0.20
0.40
0.60
0.80
1.00
1.20
Singapore Shanghai Beijing Chengdu
0.31
0.18 0.10
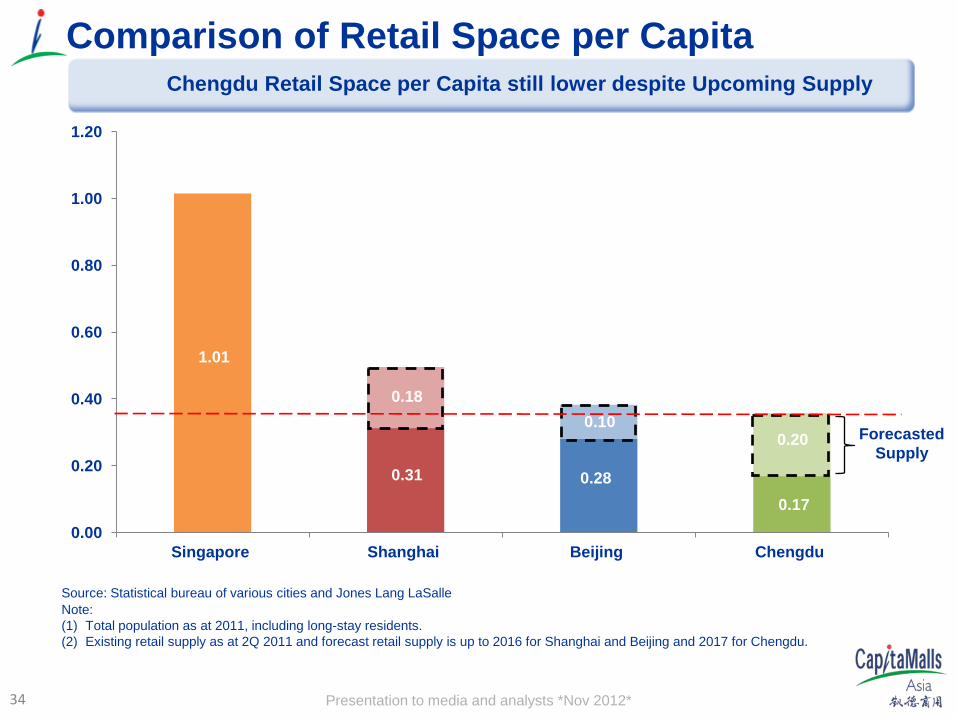
Comparison of Retail Space per Capita
Note: (1) Total population as at 2011, including long-stay residents. (2) Existing retail supply as at 2Q 2011 and forecast retail supply is up to 2016 for Shanghai and Beijing and 2017 for Chengdu.
0.28 0.17
Forecasted Supply
Source: Statistical bureau of various cities and Jones Lang LaSalle
1.01
0.20
Chengdu Retail Space per Capita still lower despite Upcoming Supply
34

Presentation to media and analysts *Nov 2012*
Operating Malls in West Region
35
Presentation to media and analysts *Nov 2012*
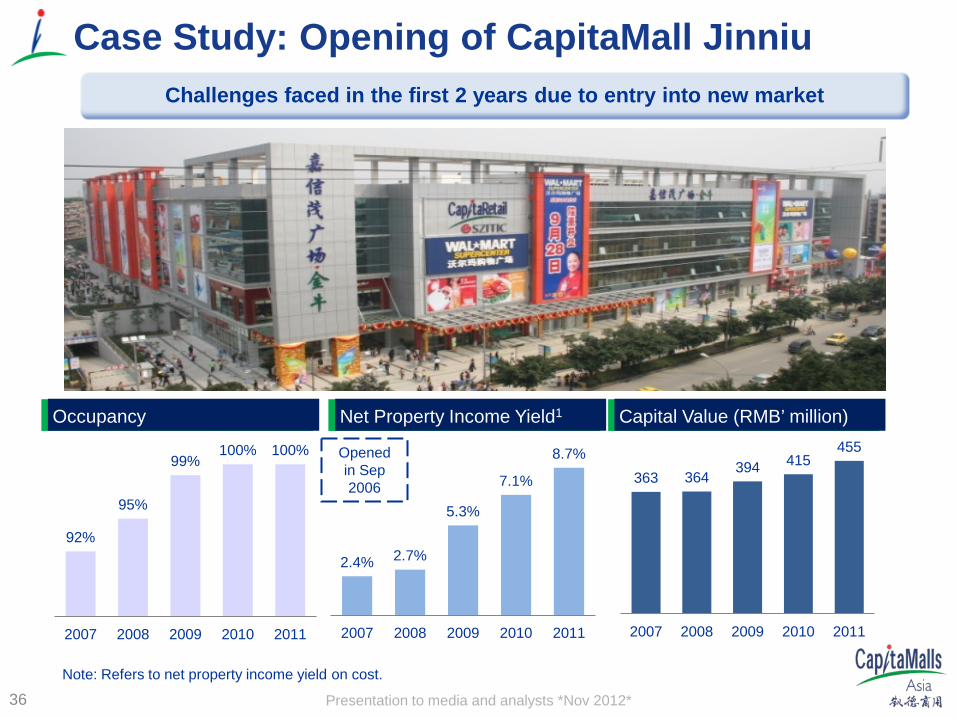
2.4% 2.7%
5.3%
7.1%
8.7%
2007 2008 2009 2010 2011
Net Property Income Yield1 Occupancy
Opened in Sep 2006
Case Study: Opening of CapitaMall Jinniu
Capital Value (RMB’ million)
Challenges faced in the first 2 years due to entry into new market
92%
95%
99% 100% 100%
2007 2008 2009 2010 2011
Note: Refers to net property income yield on cost.
363 364 394 415
455
2007 2008 2009 2010 2011
36

Presentation to media and analysts *Nov 2012*
752 884
1,033
2009 2010 2011
9,213 11,372
14,998 16,606 16,270
2007 2008 2009 2010 2011
Shopper Traffic (‘000) Tenants’ Sales per sq m1 (RMB)
CAGR: 15.3% p.a. CAGR: 17.2% p.a.
We Persevered & Grew Our Business
Note: Excludes supermarket GTO sales. 37
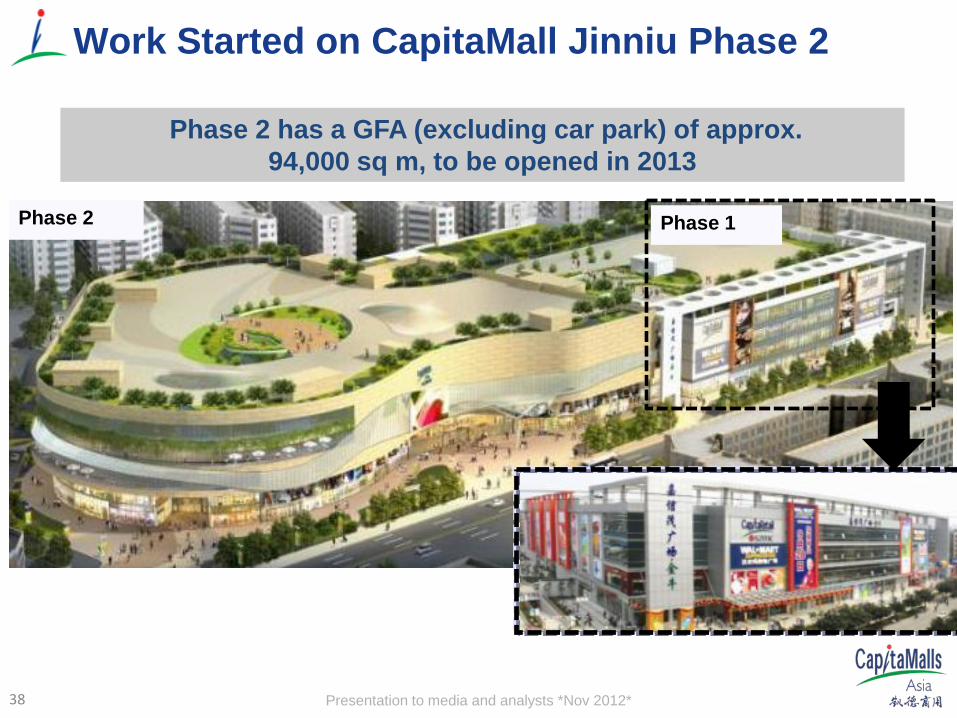
Presentation to media and analysts *Nov 2012* 38
Phase 1 Phase 2
Work Started on CapitaMall Jinniu Phase 2
Phase 2 has a GFA (excluding car park) of approx. 94,000 sq m, to be opened in 2013

Presentation to media and analysts *Nov 2012* 39
CapitaMall Jinniu Positioning Largest One-Stop Shopping Mall in Jinniu District
Positioned as a Mid-High End Mall with a Target Catchment of approx. 800,000 population (5 km radius)
• Existing Tenants in Jinniu Phase 1:
• Potential Prospects for Jinniu Phase 2:

Presentation to media and analysts *Nov 2012* 40
Key Statistics: CapitaMall Jinniu Phase I Opening Date: September 2006
Location: Jinniu district in Chengdu’s northwest, amidst government buildings, high-end residences and reputable schools
GFA (excluding car park)
~57,800 sq m
NLA ~48,400 sq m
No. of Floors 5 (including 1 basement)
No. of Car park spaces
390
Key retailers: Walmart, KFC, Pizza Hut, Watsons, CSC,Vero Moda, DQ, New Dynamic Institute, Highwave Sports, Belle, Basic House, Mind Bridge, I’M DAVID
CapitaMall Jinniu, Chengdu (Phase I)
Presentation to media and analysts *Nov 2012* 41
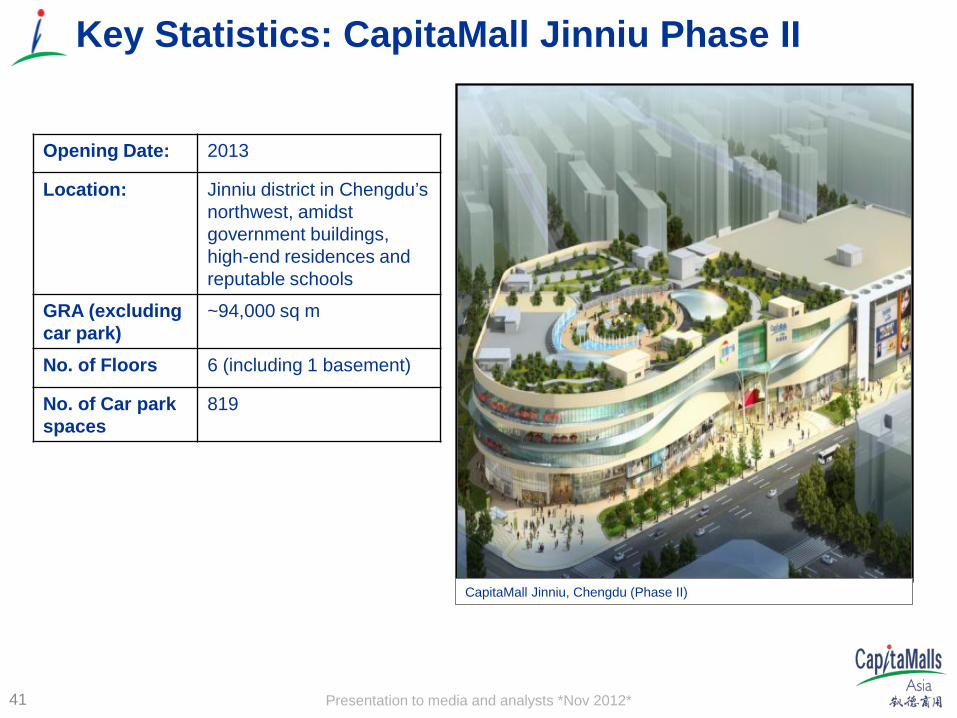
Opening Date: 2013
Location: Jinniu district in Chengdu’s northwest, amidst government buildings, high-end residences and reputable schools
GRA (excluding car park)
~94,000 sq m
No. of Floors 6 (including 1 basement)
No. of Car park spaces
819
Key Statistics: CapitaMall Jinniu Phase II
CapitaMall Jinniu, Chengdu (Phase II)

Presentation to media and analysts *Nov 2012* 42
Key Statistics: CapitaMall Shawan
Opening date September 2009
Location Within Shawan’s economic centre and the city’s Second Ring Road
GFA (excluding car park)
~38,600 sq m
NLA ~26,700 sq m No. of floors 5 (including 1 basement)
No. of car park spaces
268
Key retailers Century Mart Supermarket, Zi Jin Cinema, Starbucks, KFC, Mannings, Ajisen Ramen, Highwave Sports, Jack & Jones, Vero Moda, Only

Presentation to media and analysts *Nov 2012*
Key Statistics: CapitaMall Shapingba
43
Opening date: April 2008
Location: At the core of Chongqing commercial district and opposite Chongqing’s North train station
GFA (excluding car park)
~41,900 sq m
NLA ~26,900 sq m
No. of floors 7 (including 2 basements)
Key retailers Sephora, Haagen Dazs, Yonghui Supermarket, Guess, Pizza Hut, KFC, Watsons, Esprit, Cache Cache, Adidas, Lee, Vero Moda, Jack Jones, G200, Baby Fox
Presentation to media and analysts *Nov 2012* 44
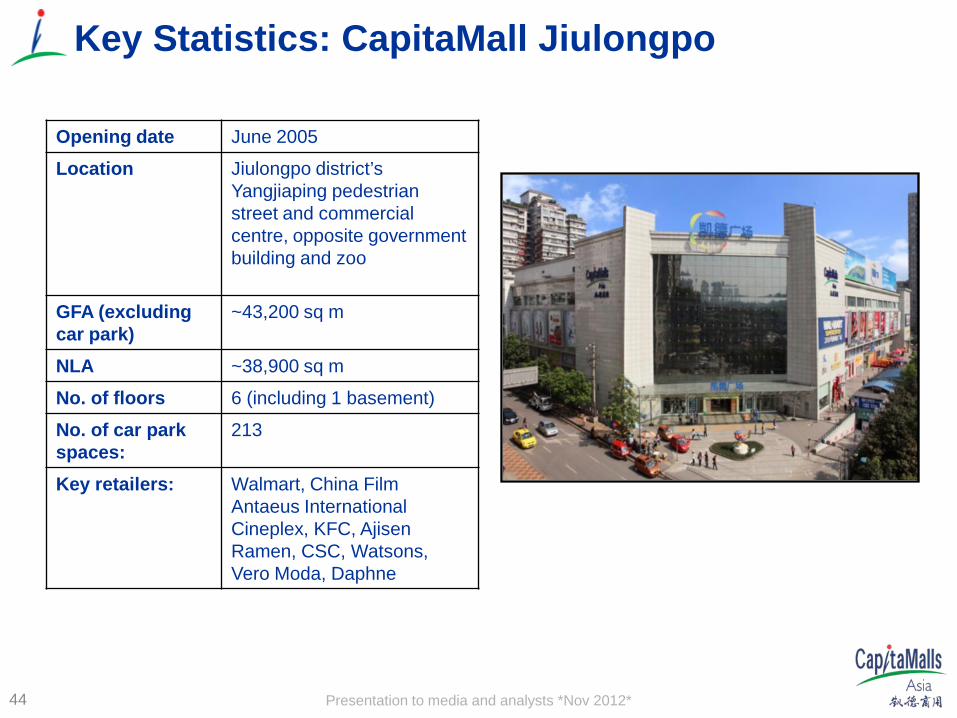
Key Statistics: CapitaMall Jiulongpo
Opening date June 2005
Location Jiulongpo district’s Yangjiaping pedestrian street and commercial centre, opposite government building and zoo
GFA (excluding car park)
~43,200 sq m
NLA ~38,900 sq m
No. of floors 6 (including 1 basement)
No. of car park spaces:
213
Key retailers: Walmart, China Film Antaeus International Cineplex, KFC, Ajisen Ramen, CSC, Watsons, Vero Moda, Daphne
Presentation to media and analysts *Nov 2012*
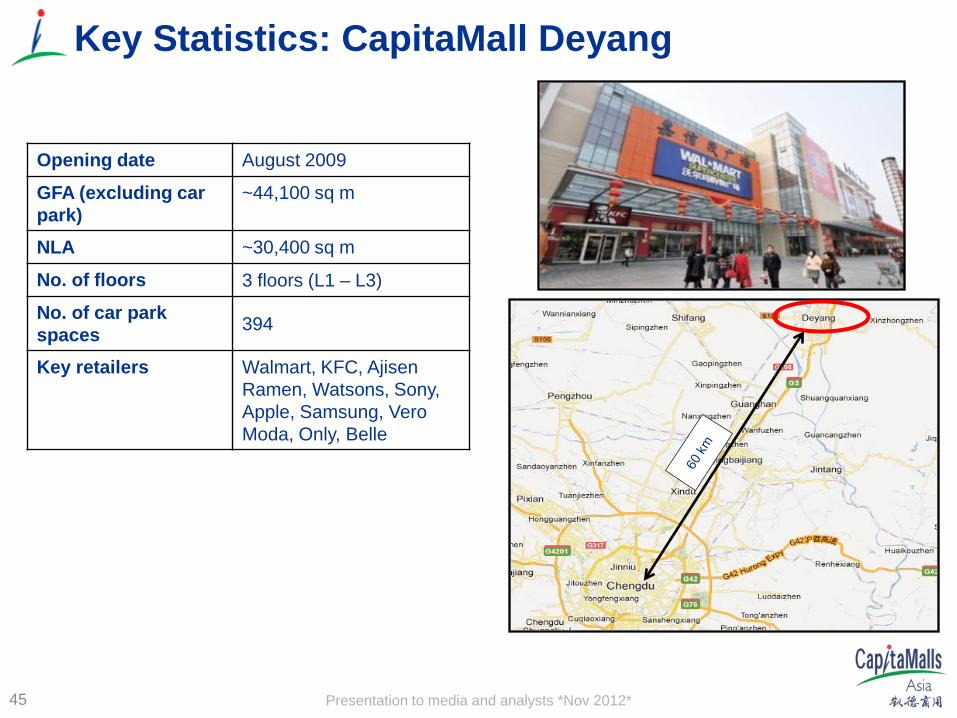
Key Statistics: CapitaMall Deyang
45
Opening date August 2009
GFA (excluding car park)
~44,100 sq m
NLA ~30,400 sq m
No. of floors 3 floors (L1 – L3)
No. of car park spaces 394
Key retailers Walmart, KFC, Ajisen Ramen, Watsons, Sony, Apple, Samsung, Vero Moda, Only, Belle
Presentation to media and analysts *Nov 2012*
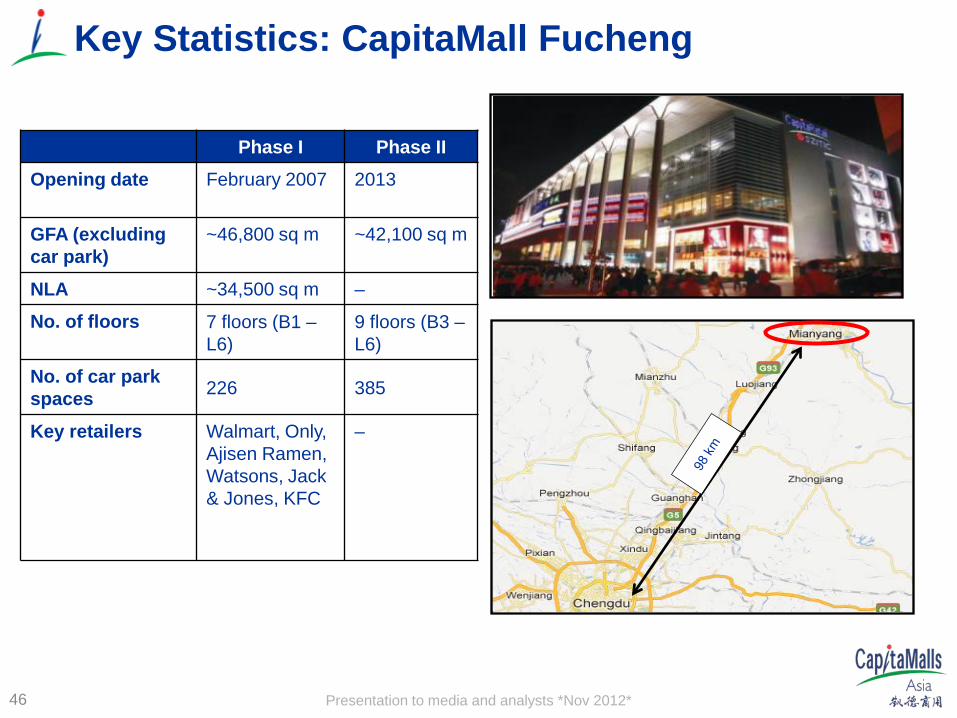
Key Statistics: CapitaMall Fucheng
46
Phase I Phase II Opening date February 2007 2013
GFA (excluding car park)
~46,800 sq m ~42,100 sq m
NLA ~34,500 sq m –
No. of floors 7 floors (B1 – L6)
9 floors (B3 – L6)
No. of car park spaces 226 385
Key retailers Walmart, Only, Ajisen Ramen, Watsons, Jack & Jones, KFC
–
Presentation to media and analysts *Nov 2012*
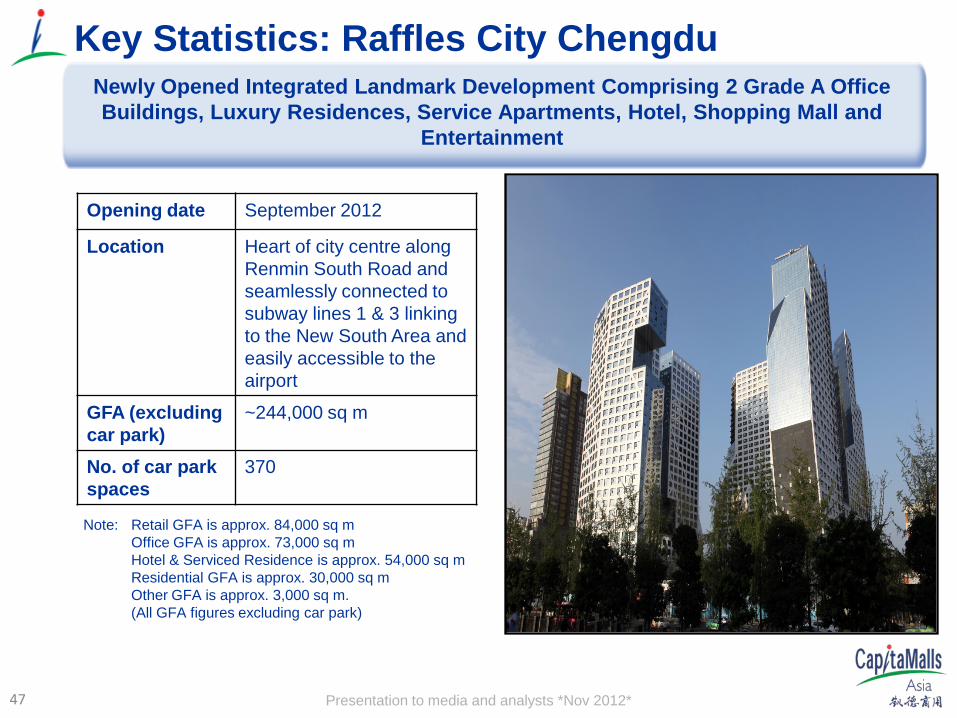
Key Statistics: Raffles City Chengdu
Opening date September 2012
Location Heart of city centre along Renmin South Road and seamlessly connected to subway lines 1 & 3 linking to the New South Area and easily accessible to the airport
GFA (excluding car park)
~244,000 sq m
No. of car park spaces
370
Newly Opened Integrated Landmark Development Comprising 2 Grade A Office Buildings, Luxury Residences, Service Apartments, Hotel, Shopping Mall and
Entertainment
Note: Retail GFA is approx. 84,000 sq m Office GFA is approx. 73,000 sq m Hotel & Serviced Residence is approx. 54,000 sq m Residential GFA is approx. 30,000 sq m Other GFA is approx. 3,000 sq m. (All GFA figures excluding car park)
47
Presentation to media and analysts *Nov 2012*
New Projects in West Region
48
Presentation to media and analysts *Nov 2012*
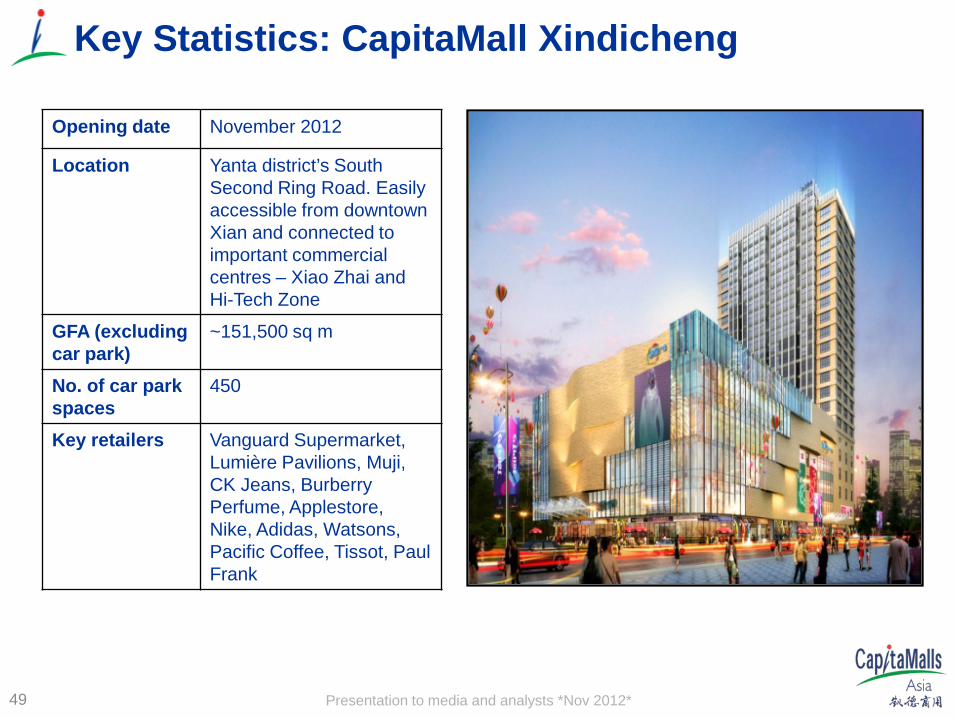
Key Statistics: CapitaMall Xindicheng
49
Opening date November 2012
Location Yanta district’s South Second Ring Road. Easily accessible from downtown Xian and connected to important commercial centres – Xiao Zhai and Hi-Tech Zone
GFA (excluding car park)
~151,500 sq m
No. of car park spaces
450
Key retailers Vanguard Supermarket, Lumière Pavilions, Muji, CK Jeans, Burberry Perfume, Applestore, Nike, Adidas, Watsons, Pacific Coffee, Tissot, Paul Frank
Presentation to media and analysts *Nov 2012* 50
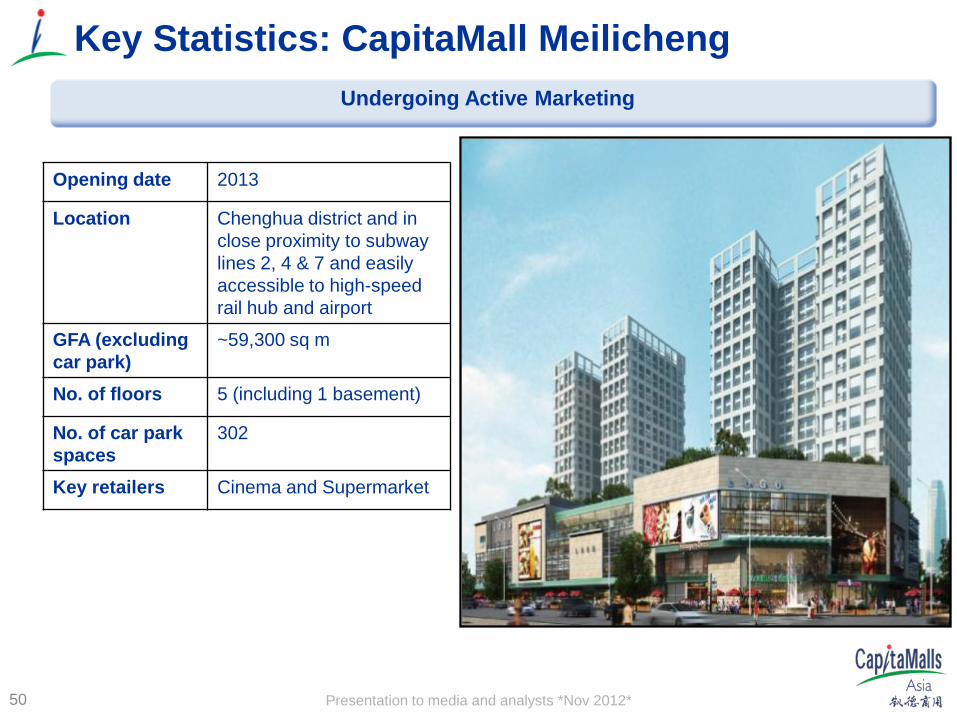
Key Statistics: CapitaMall Meilicheng
Opening date 2013
Location Chenghua district and in close proximity to subway lines 2, 4 & 7 and easily accessible to high-speed rail hub and airport
GFA (excluding car park)
~59,300 sq m
No. of floors 5 (including 1 basement)
No. of car park spaces
302
Key retailers Cinema and Supermarket
Undergoing Active Marketing
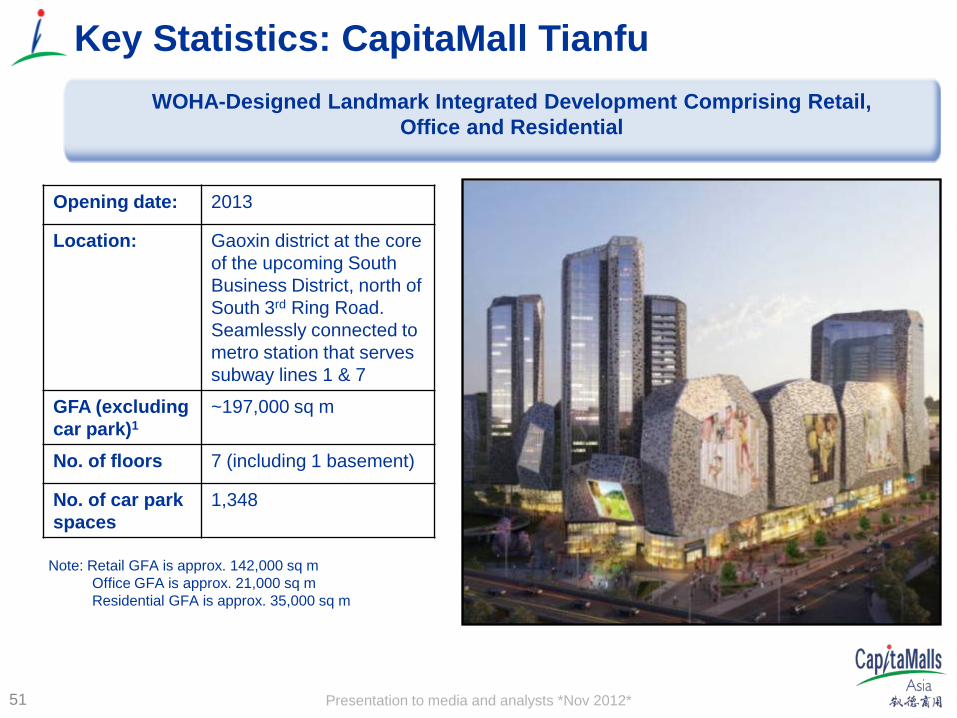
Presentation to media and analysts *Nov 2012* 51
Key Statistics: CapitaMall Tianfu
Opening date: 2013
Location: Gaoxin district at the core of the upcoming South Business District, north of South 3rd Ring Road. Seamlessly connected to metro station that serves subway lines 1 & 7
GFA (excluding car park)1
~197,000 sq m
No. of floors 7 (including 1 basement)
No. of car park spaces
1,348
Note: Retail GFA is approx. 142,000 sq m Office GFA is approx. 21,000 sq m Residential GFA is approx. 35,000 sq m
WOHA-Designed Landmark Integrated Development Comprising Retail, Office and Residential
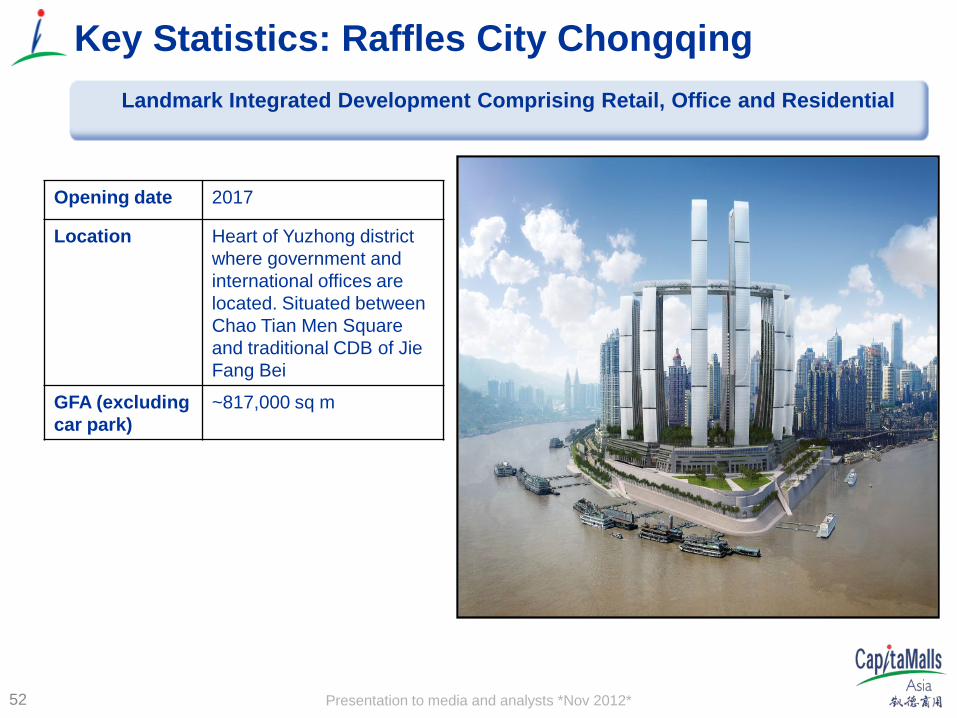
Presentation to media and analysts *Nov 2012* 52
Key Statistics: Raffles City Chongqing
Opening date 2017
Location Heart of Yuzhong district where government and international offices are located. Situated between Chao Tian Men Square and traditional CDB of Jie Fang Bei
GFA (excluding car park)
~817,000 sq m
Landmark Integrated Development Comprising Retail, Office and Residential

Presentation to media and analysts *Nov 2012* Raffles City Beijing, Beijing, China North China Region
Presentation to media and analysts *Nov 2012*
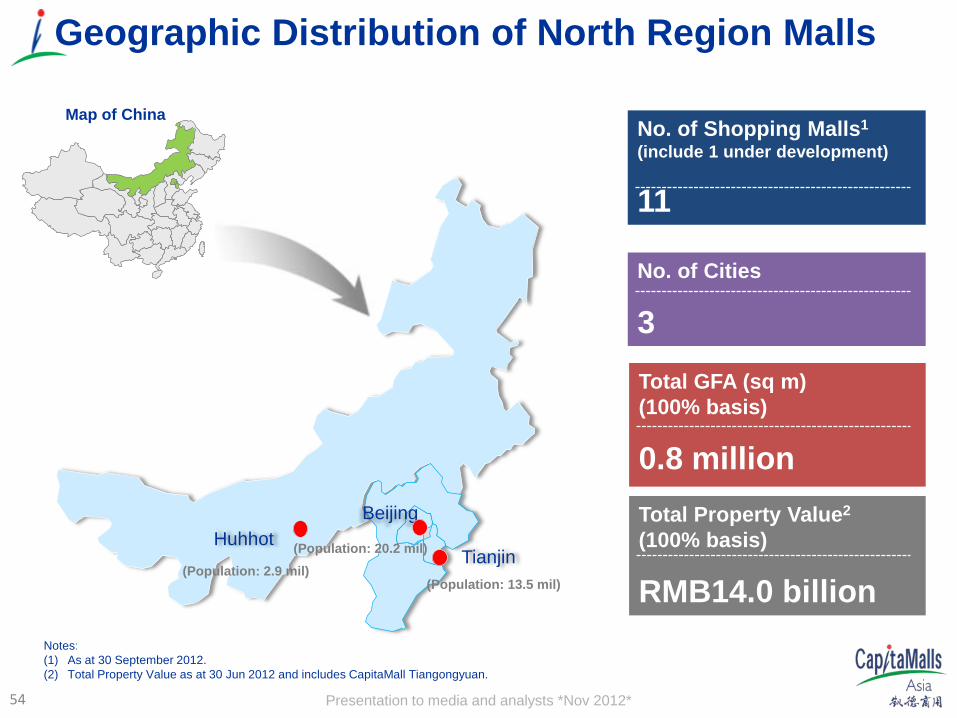
Geographic Distribution of North Region Malls
No. of Shopping Malls1 (include 1 under development)
11
No. of Cities
3 Total GFA (sq m) (100% basis)
0.8 million Total Property Value2 (100% basis)
RMB14.0 billion Notes: (1) As at 30 September 2012. (2) Total Property Value as at 30 Jun 2012 and includes CapitaMall Tiangongyuan.
Map of China
Tianjin
Beijing Huhhot
(Population: 2.9 mil) (Population: 20.2 mil)
(Population: 13.5 mil)
54

Presentation to media and analysts *Nov 2012*
Beijing
55

Presentation to media and analysts *Nov 2012* 56
Facts of Beijing
• The capital of China • The political and cultural centre • The largest retail market • Highly educated workforce and large
graduate population • Key Statistics:
Total population .20.2 million Disposable Income RMB 32,903 Per Capita Total retail sales RMB 690 billion for 2011:
Presentation to media and analysts *Nov 2012*
Beijing Economic Snapshot
• Economic Fundamentals – strong growth pace at heart of nation – 2011: GDP achieved 8.1% growth, expect strong growth momentum in 2012.
– Per capita GDP reached RMB80,394.
– Per capita urban disposable income reached RMB32,903, an increase of 13.2% over the
previous year.
– Retail sales of consumer goods crossed RMB690 billion, ranked 1st in China, ahead of Shanghai.
• Beijing Suburb Development Plan – Background: Beijing had 20m population at end of 2011, one of the most populated cities in
the world, driven by the fast-pace economic growth.
– Beijing New Town Development Plan (2007): Channel priority development emphasis to 5 suburban districts (Daxing, Tongzhou, Shunyi, Changping & Fangshan).
– Beijing South Area Development Plan (2009) Accelerate economic development towards southern Beijing, including:
(a) investing RMB290 billion in infrastructure, (b) building Daxing MRT line to connect to city centre, (c) endorsing Beijing’s 2nd international airport site in Daxing.
57
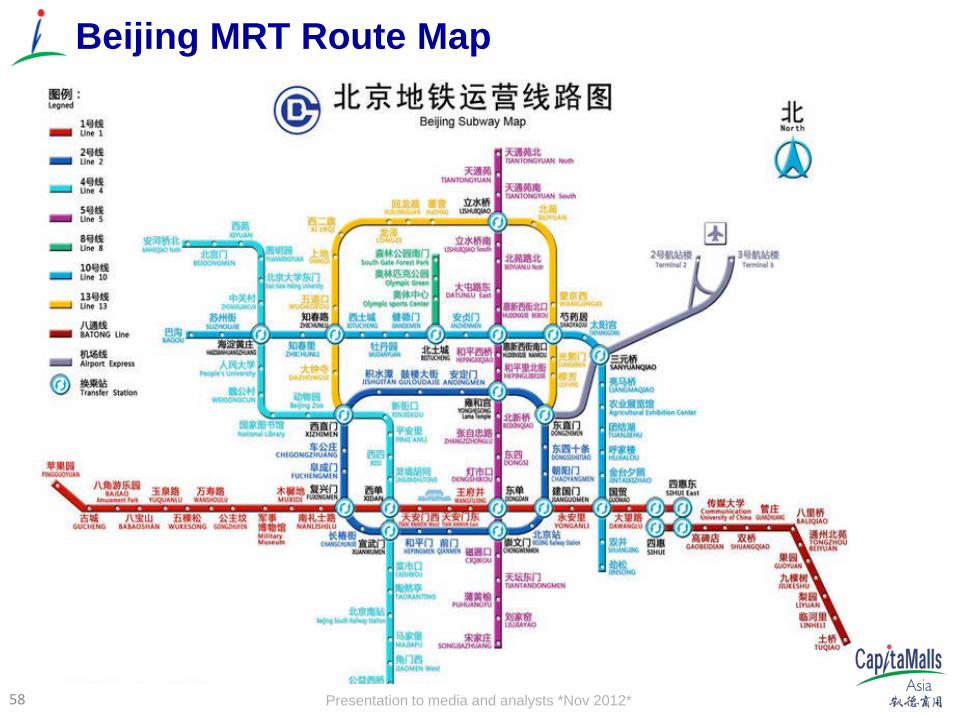
Presentation to media and analysts *Nov 2012* 58
Beijing MRT Route Map

Presentation to media and analysts *Nov 2012*
CMA Presence in Beijing
59
① CapitaMall Xizhimen
② CapitaMall Wangjing
③ Raffles City Beijing
④ CapitaMall Crystal
⑤ CapitaMall Cuiwei
⑥ CapitaMall Anzhen
⑦ CapitaMall Shuangjing
⑧ CapitaMall Taiyanggong
⑨ CapitaMall Tiangongyuan
2 8
7
6
1
5 4 3
Beijing Map
N Existing Beijing Portfolio
Beijing city-north relatively congested
Bei
jing
city
-wes
t rel
ativ
ely
hilly
reg
ion B
eijing CB
D extending eastbound
Beijing city-south being promoted for development emphasis
9
Under development site in Beijing

Presentation to media and analysts *Nov 2012*
Operating Malls in North Region
60
Presentation to media and analysts *Nov 2012*
8.7% 8.9% 9.3% 9.8% 11.4%
2007 2008 2009 2010 2011
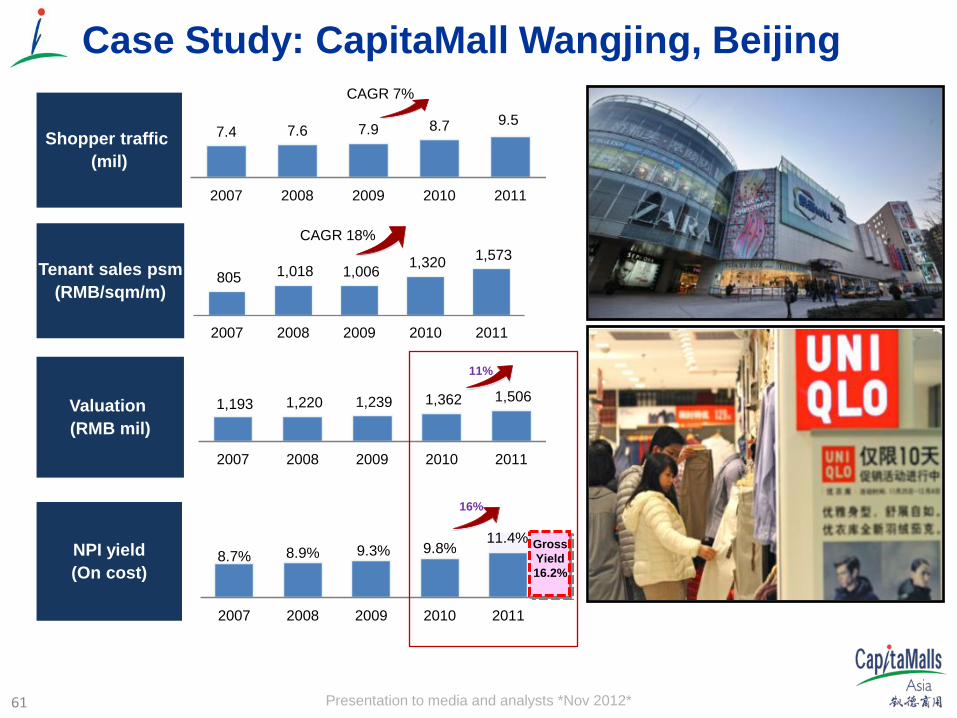
Case Study: CapitaMall Wangjing, Beijing
7.4 7.6 7.9 8.7 9.5
2007 2008 2009 2010 2011
Shopper traffic (mil)
CAGR 7%
805 1,018 1,006 1,320 1,573
2007 2008 2009 2010 2011
Tenant sales psm (RMB/sqm/m)
CAGR 18%
NPI yield (On cost)
Valuation (RMB mil)
1,193 1,220 1,239 1,362 1,506
2007 2008 2009 2010 2011
Gross Yield 16.2%
11%
16%
61
Presentation to media and analysts *Nov 2012*
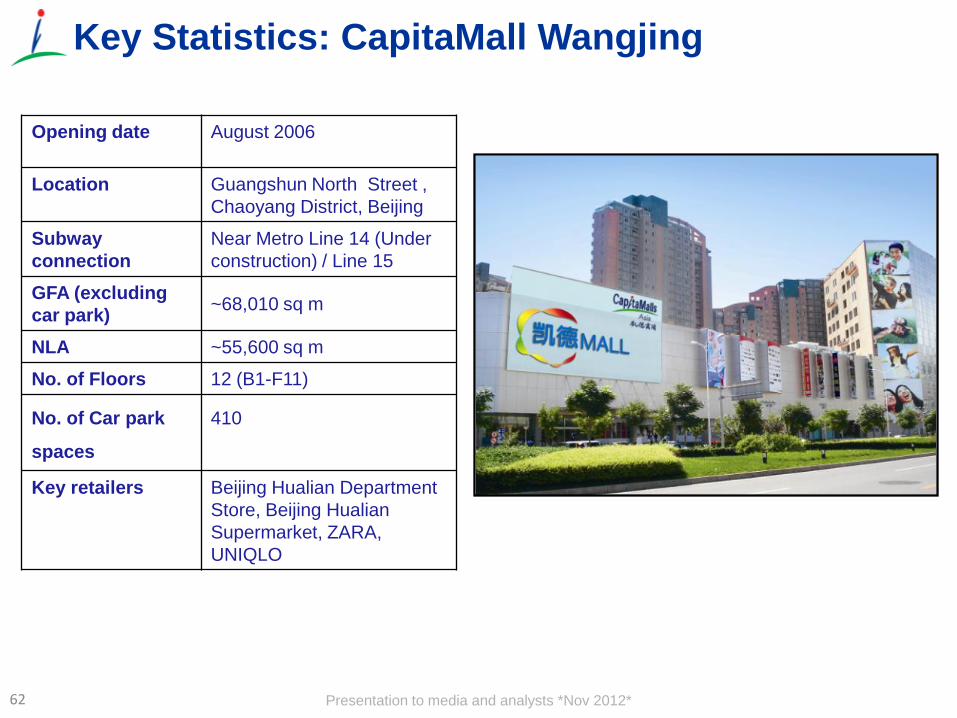
Opening date August 2006
Location Guangshun North Street , Chaoyang District, Beijing
Subway connection
Near Metro Line 14 (Under construction) / Line 15
GFA (excluding car park) ~68,010 sq m
NLA ~55,600 sq m
No. of Floors 12 (B1-F11)
No. of Car park
spaces
410
Key retailers Beijing Hualian Department Store, Beijing Hualian Supermarket, ZARA, UNIQLO
Key Statistics: CapitaMall Wangjing
62
Presentation to media and analysts *Nov 2012*
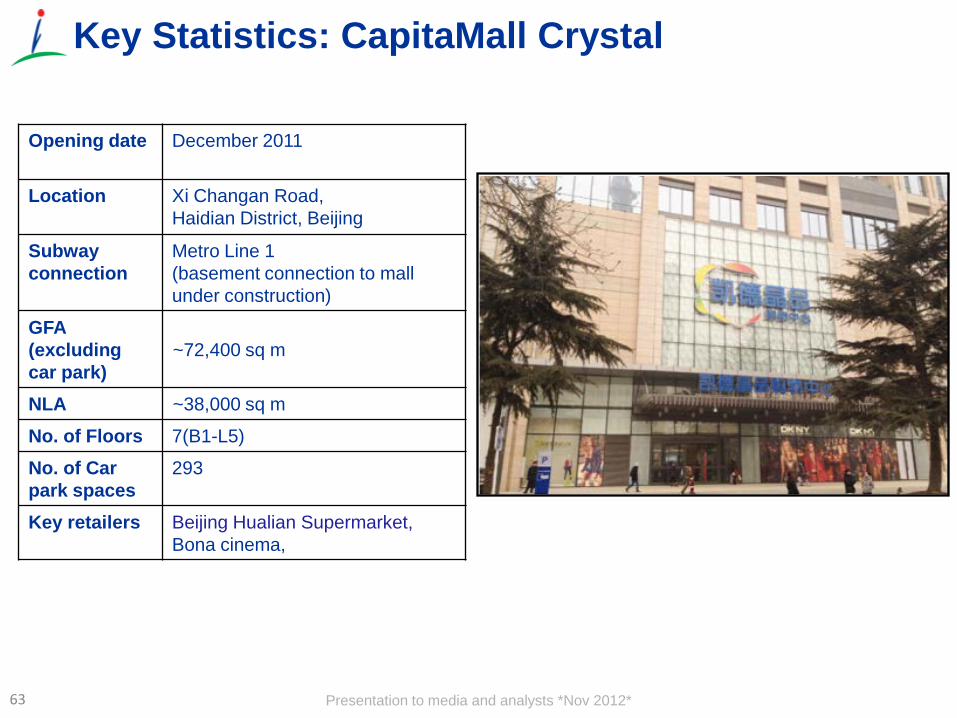
Opening date December 2011
Location Xi Changan Road, Haidian District, Beijing
Subway connection
Metro Line 1 (basement connection to mall under construction)
GFA (excluding car park)
~72,400 sq m
NLA ~38,000 sq m
No. of Floors 7(B1-L5)
No. of Car park spaces
293
Key retailers Beijing Hualian Supermarket, Bona cinema,
Key Statistics: CapitaMall Crystal
63
Presentation to media and analysts *Nov 2012*
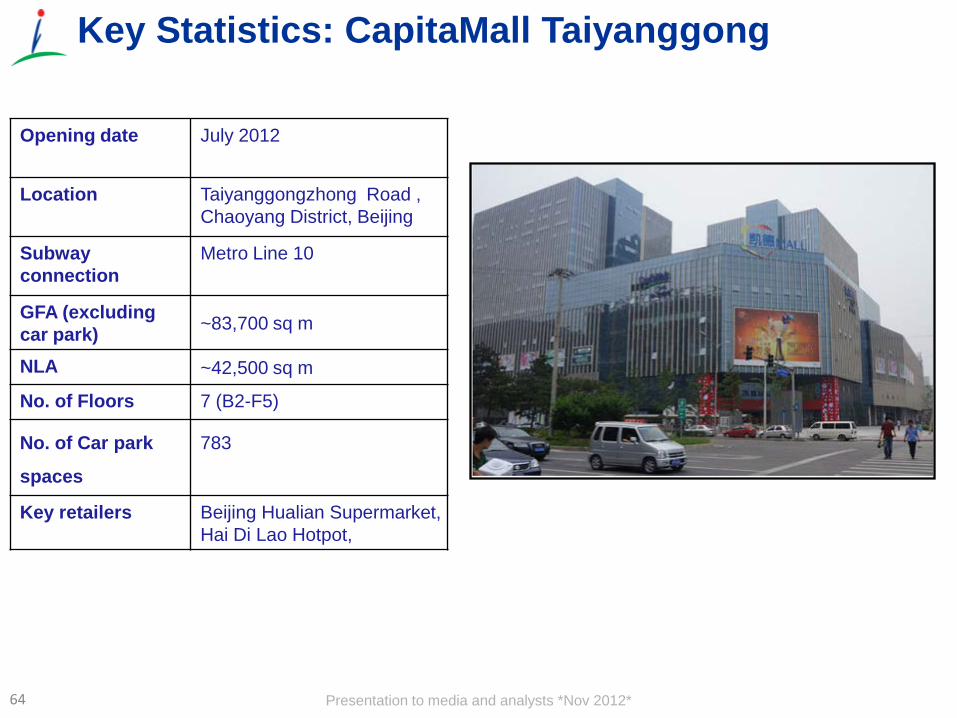
Opening date July 2012
Location Taiyanggongzhong Road , Chaoyang District, Beijing
Subway connection
Metro Line 10
GFA (excluding car park) ~83,700 sq m
NLA ~42,500 sq m
No. of Floors 7 (B2-F5)
No. of Car park
spaces
783
Key retailers Beijing Hualian Supermarket, Hai Di Lao Hotpot,
Key Statistics: CapitaMall Taiyanggong
64

Presentation to media and analysts *Nov 2012*
Opening date April 2010
Location Cuiwei Road, Haidian District, Beijing
Subway connection Near Metro Line 1 Wanshoulu station (1KM) Gongzhufen station(1.2KM)
GFA (excluding car park) ~56,100 sq m
NLA ~35,000 sq m
No. of Floors 5 (B1-F4)
No. of Car park spaces
416
Key retailers Beijing Hualian Supermarket, Hai Di Lao Hotpot
Key Statistics: CapitaMall Cuiwei
65

Presentation to media and analysts *Nov 2012*
Key Statistics: CapitaMall Xizhimen
Opening date October 2007
Location Xizhimenwai Road , Xichen District, Beijing
Subway Connection
Metro Line 2/4/13
GFA (excluding car park) ~83,000 sq m
NLA ~51,000 sq m
No. of Floors 8 (B2-F6)
Key retailers Beijing Hualian Supermarket, Watsons, KFC
66
Presentation to media and analysts *Nov 2012*
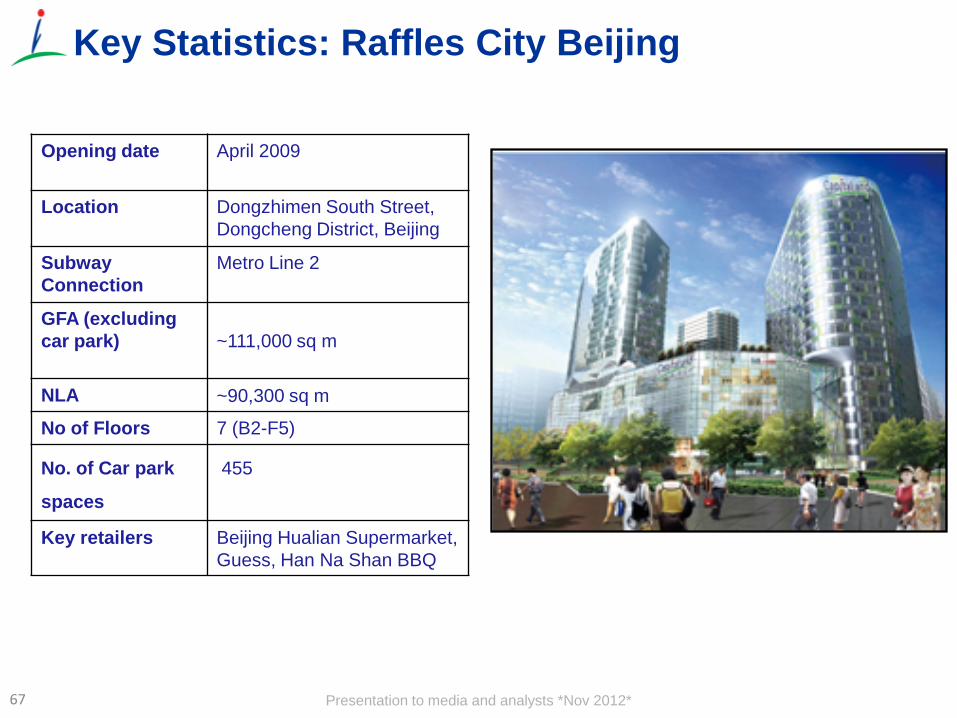
Opening date April 2009
Location Dongzhimen South Street, Dongcheng District, Beijing
Subway Connection
Metro Line 2
GFA (excluding car park) ~111,000 sq m
NLA ~90,300 sq m
No of Floors 7 (B2-F5)
No. of Car park
spaces
455
Key retailers Beijing Hualian Supermarket, Guess, Han Na Shan BBQ
Key Statistics: Raffles City Beijing
67
Presentation to media and analysts *Nov 2012*
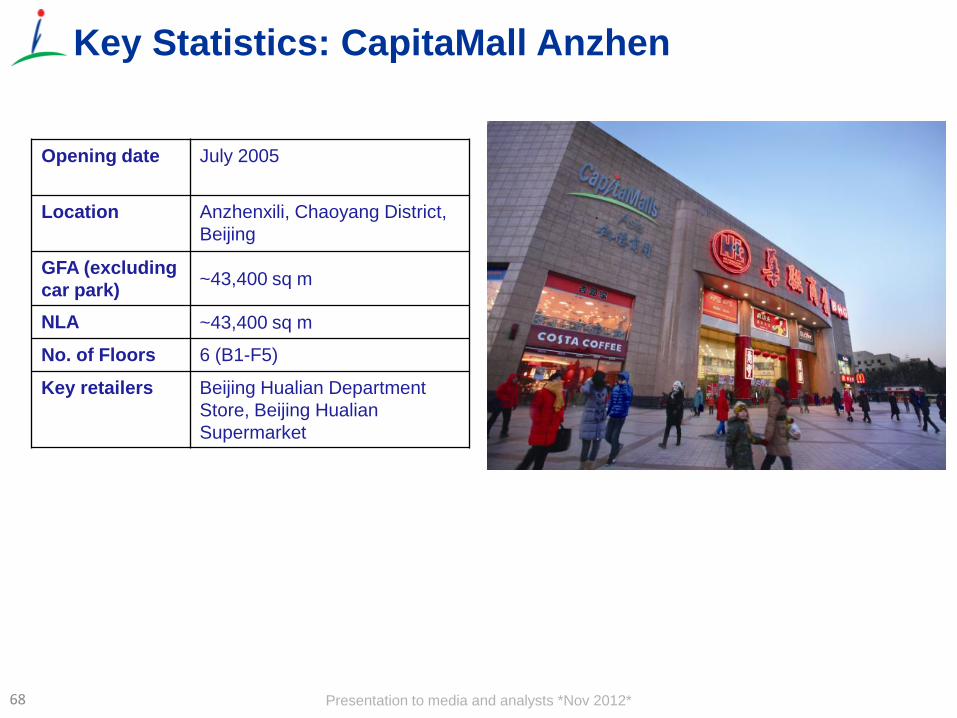
Opening date July 2005
Location Anzhenxili, Chaoyang District, Beijing
GFA (excluding car park) ~43,400 sq m
NLA ~43,400 sq m
No. of Floors 6 (B1-F5)
Key retailers Beijing Hualian Department Store, Beijing Hualian Supermarket
Key Statistics: CapitaMall Anzhen
68

Presentation to media and analysts *Nov 2012*
Opening date March 2004
Location Guangqu Road, Chaoyang District, Beijing
GFA (excluding car park) ~49,500 sq m
NLA ~49,500 sq m
No. of Floors 4 (B1-F3)
No. of Car park
spaces
334
Key retailers Carrefour, B&Q
Key Statistics: CapitaMall Shuangjing
69

Presentation to media and analysts *Nov 2012*
Opening date December 2008
Location Nan Bei Avenue, Hexi District,Tianjin
GFA (excluding car park) ~59,300 sq m
NLA ~40,700 sq m
No. of Floors 5 (B1-F4)
No. of Car park
spaces
436
Key retailers e-mart supermarket, Xing Mei Cinema
Key Statistics: CapitaMall TianjinOne
70
Presentation to media and analysts *Nov 2012*
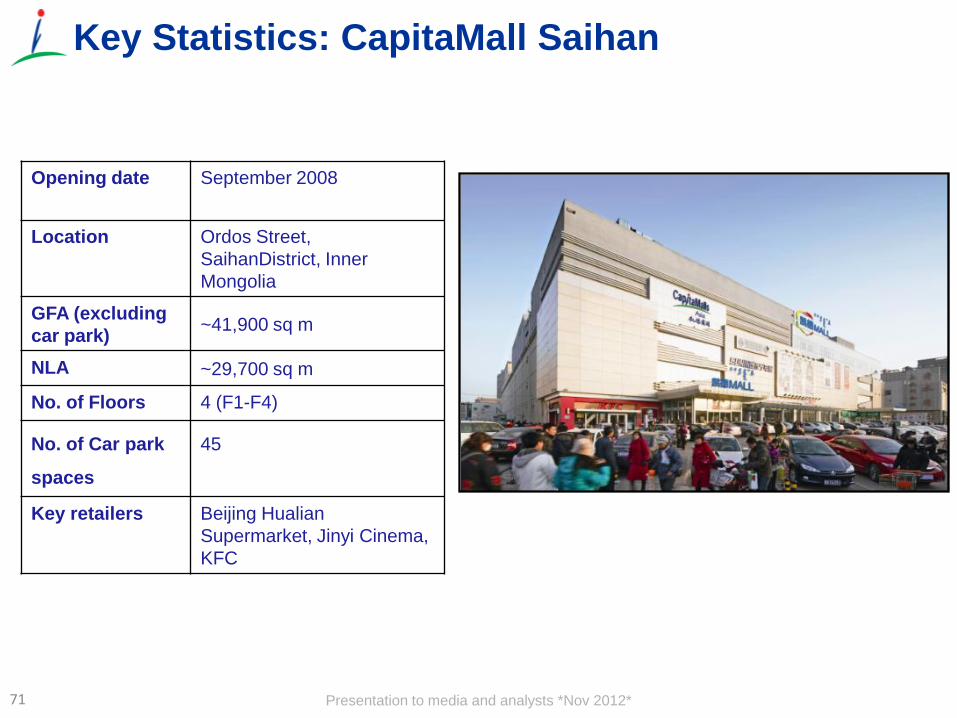
Opening date September 2008
Location Ordos Street, SaihanDistrict, Inner Mongolia
GFA (excluding car park) ~41,900 sq m
NLA ~29,700 sq m
No. of Floors 4 (F1-F4)
No. of Car park
spaces
45
Key retailers Beijing Hualian Supermarket, Jinyi Cinema, KFC
Key Statistics: CapitaMall Saihan
71

Presentation to media and analysts *Nov 2012*
New Projects in North Region
72
Presentation to media and analysts *Nov 2012*
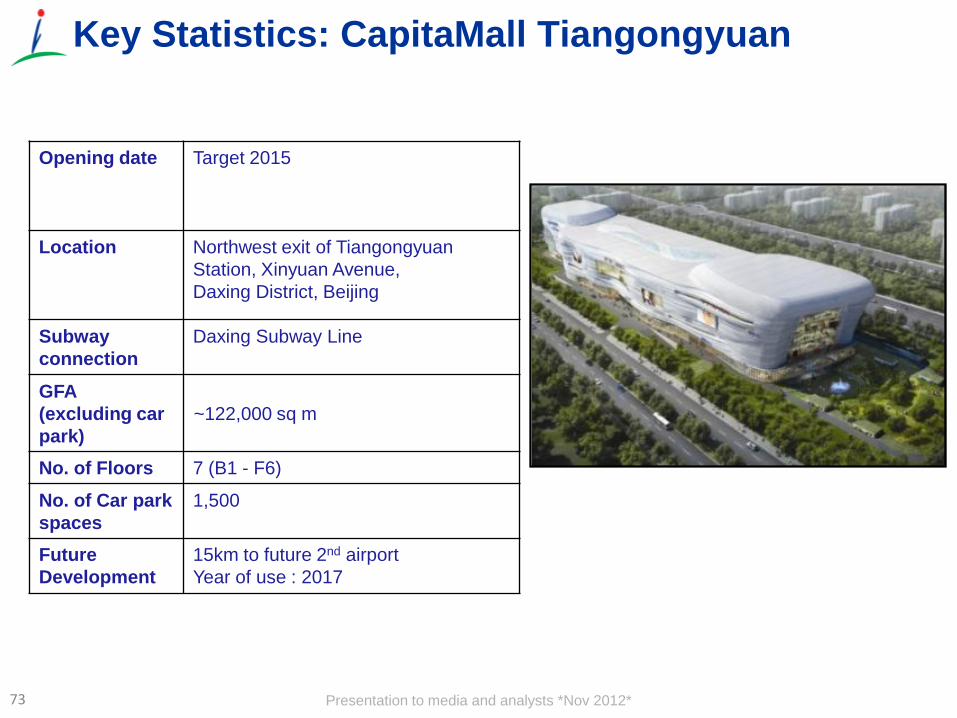
Opening date Target 2015
Location Northwest exit of Tiangongyuan Station, Xinyuan Avenue, Daxing District, Beijing
Subway connection
Daxing Subway Line
GFA (excluding car park)
~122,000 sq m
No. of Floors 7 (B1 - F6)
No. of Car park spaces
1,500
Future Development
15km to future 2nd airport Year of use : 2017
Key Statistics: CapitaMall Tiangongyuan
73
Presentation to media and analysts *Nov 2012*
Thank you