capital structure and its impact on profitability
DESCRIPTION
capital structure and its impact on firms profitabilityTRANSCRIPT

Relationship Between Capital Structure and
Profitability

Flow of Presentation
Introduction
Importance of capital structure
Factors considering while framing Capital
Structure
Capital structure and profitability
Data Analysis
Limitation of Study
Conclusion

Introduction
A mix of a company's long-term debt, specific short-
term debt, common equity and preferred equity. The
capital structure is how a firm finances its overall
operations and growth by using different sources of
funds.
Debt comes in the form of bond issues or long-term
notes payable, while equity is classified as common
stock, preferred stock or retained earnings. Short-term
debt such as working capital requirements is also
considered to be part of the capital structure.

Capital StructureCapital structure consists of short term debt, Long term debt and equity financing. It tells how company uses different sources of finances to finance its operations.
Debt financing.Debt financing means when a company wants to borrow money it takes debt from the banks, or other sources of finance and after a specified interval of time this debt have to be paid back. The lender in this case is not the owner of the company. He receives fixed interest payments till the maturity of debt and receives back the principal amount at maturity.
Equity financing.In equity financing companies issue shares to get financing. In this case the person who buy share becomes owner of company. There are no interest payments in this case, and no return of principal amount.
Profitability.Profitability is the ability of a company to generate net income consistently.

Importance of Capital Structure
Profitability is the primary goal of all businesses.
Without profitability the business will not survive in
the long run.
Profitability is measured with income and expenses.
Profitability is measured with an “income
statement” because income statement is measure
of income and expenses during a given time period.

Factors that Influence a Company's Capital - Structure Decision
Business Risk
Company's Tax Exposure
Financial Flexibility
Management Style
Growth Rate
Market Conditions

Capital Structure and Profitability
A firm’s financial structure has impact on the firm’s profitability. Firms can use this financial structure that is debt to equity ratio to increase profitability of a company.
Firms that are using internal financing i.e. retained earnings are found to be more profitable then those using external financing.
Relationship between debt financing and profits has been misinterpreted. Firm’s size matter, large firms issue more debt then smaller firms where as smaller firms mostly go for equity financing. Firms which are more profitable tend to repurchase equity and issue debt.
The objective of the capital structure is the source of the funds used by a firm in the way that will increase the company’s common stock price.
Capital structure management is the objective by which firm seeks the mix of funds that will minimize its cost of capital.
The decision about capital structure is very important especially when the economic environment is not stable. So this decision can impact on company’s profitability.

Data Analysis

Capital Structure and Profitability Relationship in Fertilizer Sector
By Analyzing it was found that there is no relationship
between capital structure and profitability.
As due to equilibrium in perfect capital markets, the
capital structure has no impact on profitability of
companies.
In agriculture sector companies use conservative
financing to run their operations which do not affect
the cost of financing in the fertilizer sector, so it have
no impact on companies value.

Mar '09 Mar '10 Mar '11 Mar '12 Mar '130
200
400
600
800
1000
1200
1400
1600
1800
551.69 551.69 551.69 551.69 551.69
1,424.231,330.84
481.62
1,185.21
1,673.21
210.36 234.44 245.39 248.83 272.67
Rashtriya Chemicals and Fertilizers
Total Share Capital Total Debt Reported Net Profit
Capital Structure and Profitability Relationship in Fertilizer sector

In 2010, reported a 11% jump in its net profit to
233.44 from 210.60 in previous year due to lower
input costs and realization of government subsidies.
Results also shows a significant relationship between
current liabilities and profitability of company in
fertilizer sector.
Capital Structure and Profitability Relationship in Fertilizer sector
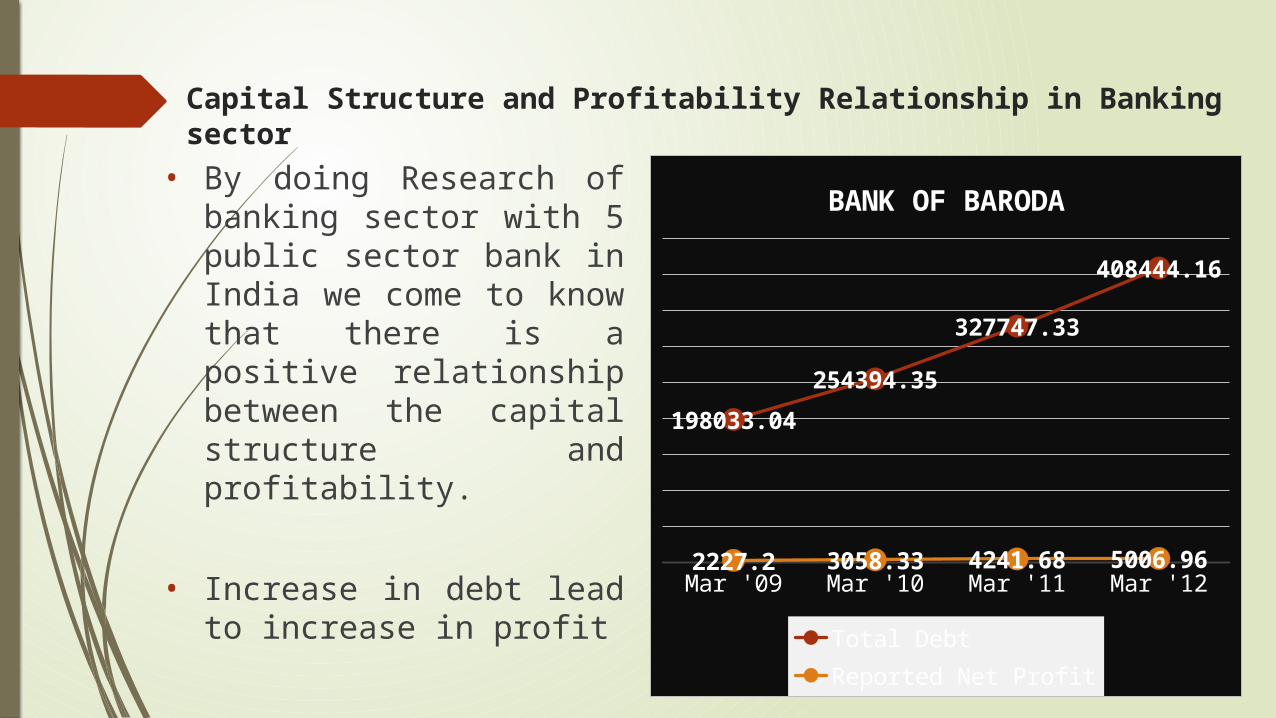
• By doing Research of banking sector with 5 public sector bank in India we come to know that there is a positive relationship between the capital structure and profitability.
• Increase in debt lead to increase in profit
Capital Structure and Profitability Relationship in Banking sector
Mar '09 Mar '10 Mar '11 Mar '12
198033.04
254394.35
327747.33
408444.16
2227.2 3058.33 4241.68 5006.96
BANK OF BARODA
Total Debt Reported Net Profit

Capital Structure and Profitability Relationship in Banking sector
Dec '08 Dec '09 Dec '10 Dec '11 Dec '120
20000
40000
60000
80000
100000
120000
43102.74
52906.2
65901.28
81047.75
105620.81
422.66 511.25 611.63 803.14 810.38
DENA BANK
Total Debt Reported Net Profit
Dec '09 Dec '10 Dec '11 Dec '120
50000
100000
150000
200000
250000
300000
350000
400000
450000
252161.84
320907.19350330.26
417207.17
1741.07 2488.71 2677.52 2749.35
BANK OF INDIA
Total Debt Reported Net Profit

Capital Structure and Profitability Relationship in Banking sector
Mar '09 Mar '10 Mar '11 Mar '12 Mar '130
50000
100000
150000
200000
250000
300000
350000
142587.73179255.05
215777.26240778.44
287558.84
1726.55 2074.92 2081.95 1787.14 2157.93
Union Bank of India
Total Share Capital Total Debt
• Union Bank of India fund infusion of about Rs 1,000 crore as part of recapitalization plan of the government in 2011-12.Net non-performing assets (NPAs) sequentially rose 13 basis points to 1.32% while gross NPAs by 20 basis points to 2.57%

Mar '09 Mar '10 Mar '11 Mar '12 Mar '130
2000
4000
6000
8000
10000
12000
14000
16000
634.88 634.88 635 671.04 684.03
9121.23 9166.05
7370.35
11686.01
14104.98
SBI
Total Share Capital Reported Net Profit
In 2011 SBI has issued the right share issue of Rs 20000 cr and that’s why the profit of the company is down in 2011.
Capital Structure and Profitability Relationship in Banking sector
Mar '09 Mar '10 Mar '11 Mar '12 Mar '130
200000
400000
600000
800000
1000000
1200000
1400000
1600000
9121.23 9166.05 7370.3511686.0114104.98
795786.81907127.83
1053501.771170652.93
1371922.28
SBI
Reported Net Profit Total Debt

By conducting the thorough research we come to know
that there is a positive relationship between the capital
structure and profitability.
If there is an increase in the debt then the profitibility
would increase.
And if there is a decline in the debt then the profitability
would also decline.
Capital Structure and Profitability Relationship in IT sector

Mar '09 Mar '10 Mar '11 Mar '12 Mar '130
5000
10000
15000
20000
25000
30000
971.41 971.41 959.41 971.41 971.41
25,911.5123,693.82
28,301.14
23,693.8225,911.51
5,062.976,696.42 6,865.69 6,696.42
5,062.97
TechMahindra
Total Share Capital Total Debt Reported Net Profit
In 2011, SBI has issued the right share issue of Rs 20000 cr and that’s why the profit of the company is down in 2011. .
Capital Structure and Profitability Relationship in IT sector

The study results reveal significantly negative relation
between debt and profitability.
Our findings imply that an increase in debt position is
associated with a decrease in profitability; thus, the
higher the debt, the lower the profitability of the firm.
The results also show that profitability increases with
control variables; size and sales growth.
Capital Structure and Profitability Relationship in Manufacturing sector

Capital Structure and Profitability Relationship in Manufacturing sector
Mar '09 Mar '10 Mar '11 Mar '12 Mar '130.00
5,000.00
10,000.00
15,000.00
20,000.00
25,000.00
30,000.00
6203.45
887.41 959.41 971.41 971.41
26,946.1825,239.20
28,301.14
23,693.8225,911.51
5,201.74 5,046.806,865.69 6,696.42
5,062.97
Tata Steel
Total Share Capital Total Debt Reported Net Profit

During FY 2013, Tata Steel Group raised debt from
various banks and financial markets .
An amount of Rs 15472 crore was incurred on capital
expenditure
And Rs 27099 crore was utilised towards repayment of
principal obligations.
It bought 51% stake in Canada’s Labrador mines project.
Capital Structure and Profitability Relationship in Manufacturing Sector

During FY 2012 : 6 million tonnes per annum plant in Odisha's Kalinganagar. Investment - Rs 35,000 crore. 65:35 debt equity ratio for spent Rs. 3700 crore in FY 2012. During FY 2011,FY 2010 and FY 2009: Eurozone crisis Current steel demand is almost 30% lower than the pre-2008
financial crisis level. Lower average selling prices compared with the all-time high
price levels .
Capital Structure and Profitability Relationship in Manufacturing Sector

The study results reveal no significant relation between debt and profitability.
Our findings imply that an increase in debt position is having no relevance with profitability; thus, the higher the debt, the lower the profitability of the firm.
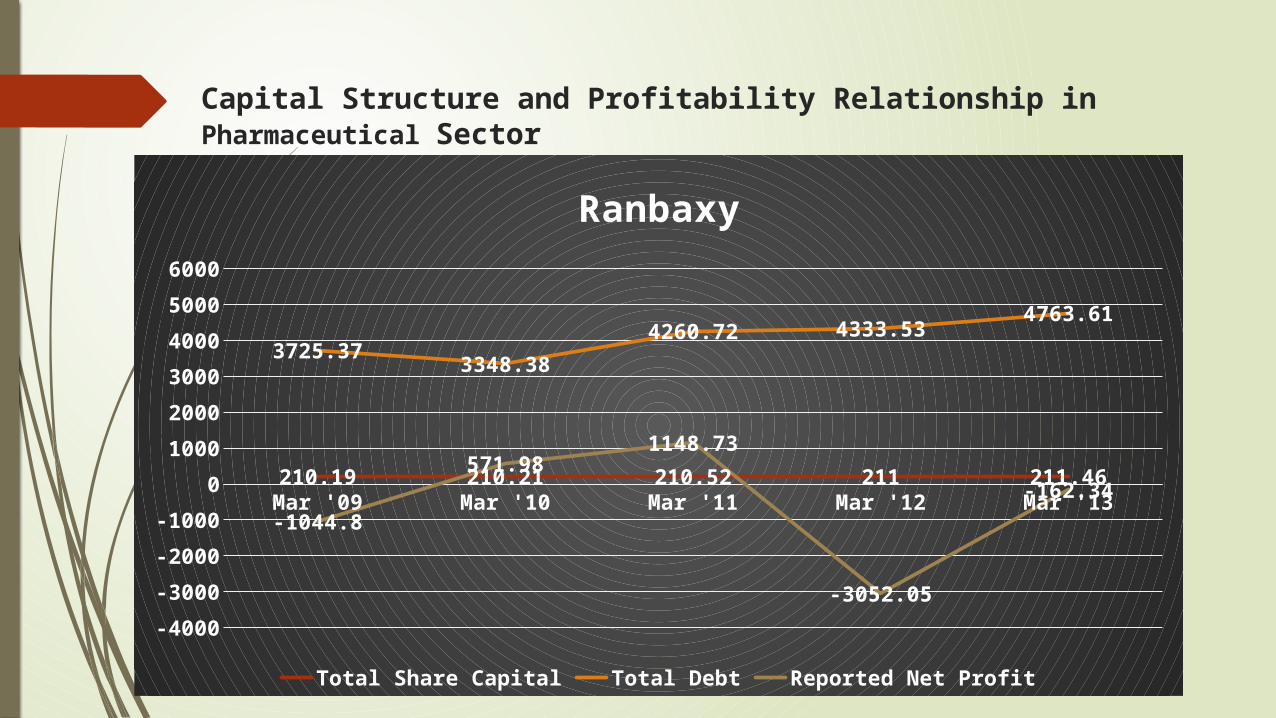
Capital Structure and Profitability Relationship in Pharmaceutical Sector
Capital Structure and Profitability Relationship in Pharmaceutical Sector
Mar '09 Mar '10 Mar '11 Mar '12 Mar '13
-4000
-3000
-2000
-1000
0
1000
2000
3000
4000
5000
6000
210.19 210.21 210.52 211 211.46
3725.373348.38
4260.72 4333.534763.61
-1044.8
571.981148.73
-3052.05
-162.34
Ranbaxy
Total Share Capital Total Debt Reported Net Profit

2008, loss on exceptional items stood at Rs 784.3 crore due to change in AS 30.
Increase in profit in 2009, due to savings on selling, general and administrative department. EBITDA stood double than 2008
Growth in domestic market to 16% compared to last year. In 2009-10, gain from forex reserve stood to 675 crore as
compared to 23.7 crore in 2008-09. In 2010, License fees generated was Rs 170 crore which was
milestone. In 2011, a sharp decline in sales outside india which was 68%
of 2010. Third time affected by forex effects, loss stood to 470 crores
from where it had gains in 2010.
Capital Structure and Profitability Relationship in Pharmaceutical Sector

Limitation of study

Conclusion