capital improvement board of managers - in
TRANSCRIPT

Capital Improvement Board of Managers (of Marion County, Indiana)
(A Component Unit of the Consolidated City of Indianapolis - Marion County)
Comprehensive Annual Financial Report For the Fiscal Years Ended December 31, 2016 and 2015
(THIS PAGE INTENTIONALLY LEFT BLANK)

Comprehensive Annual Financial Report
Fiscal Years Ended December 31, 2016 and 2015 Capital Improvement Board of Managers (of Marion County, Indiana) - a Component Unit of the Consolidated City of Indianapolis - Marion County Indianapolis, Indiana
Prepared by:
Finance Department Melina Kennedy, President
(THIS PAGE INTENTIONALLY LEFT BLANK)

Capital Improvement Board of Managers (of Marion County, Indiana)
(A Component Unit of the Consolidated City of Indianapolis-Marion County)
December 31, 2016 and 2015
Contents
Introductory Section (Unaudited)
Letter of Transmittal .......................................................................................................................................... 2
Certificate of Achievement for Excellence in Financial Reporting .................................................................. 10
Organization Table ........................................................................................................................................... 11
Principal Officers and Management ................................................................................................................. 12
Financial Section
Independent Auditor’s Report on Financial Statements ................................................................................... 14
Management’s Discussion and Analysis (Unaudited) ...................................................................................... 16
Financial Statements
Statements of Net Position ......................................................................................................................... 28
Statements of Revenues, Expenses and Changes in Net Position............................................................... 30
Statements of Cash Flows .......................................................................................................................... 31
Notes to Financial Statements .................................................................................................................... 33
Required Supplementary Information - Pension Information (Unaudited)
Schedule of CIB’s Proportionate Share of the Net Pension Liability ........................................................ 69
Schedule of CIB Contributions .................................................................................................................. 70
Other Supplementary Information
Analysis of Certain Operating Expenses ................................................................................................... 71
Statistical Section (Unaudited)
Table I - Net Position by Component ............................................................................................................... 73
Table II - Changes in Net Position ................................................................................................................... 75
Table III - Event Statistics ................................................................................................................................ 77
Table IV - Largest Customers .......................................................................................................................... 79
Table V - Rate Schedule - Exhibits .................................................................................................................. 80
Table VI - Rate Schedule - Meetings ............................................................................................................... 81
Table VII - Rate Schedule - Hourly Labor Reimbursement Rates ................................................................... 82
Table VIII - Food Service and Concession Revenues ...................................................................................... 83
Table IX - Ratios of Outstanding Debt by Type .............................................................................................. 84
Table X - State and Local Taxes and Other Assistance ................................................................................... 85
Table XI - Pledged Revenue Coverage ............................................................................................................ 87
Table XII - Demographic and Economic Statistics .......................................................................................... 90
Table XIII - Principal Employers ..................................................................................................................... 91
Table XIV - Number of Employees (FTEs) by Identifiable Activity ............................................................... 92
Table XV - Occupancy Statistics ..................................................................................................................... 93

(THIS PAGE INTENTIONALLY LEFT BLANK)

Introductory Section
(THIS PAGE INTENTIONALLY LEFT BLANK)

2
May 31, 2017 Capital Improvement Board of Managers (of Marion County, Indiana) Indianapolis, Indiana We are pleased to present the Comprehensive Annual Financial Report of the Capital Improvement Board of Managers (of Marion County, Indiana) (“CIB”), for the fiscal years ended December 31, 2016 and 2015.
The financial statements of the CIB are prepared in accordance with accounting principles generally accepted in the United States of America, and we believe they present the CIB’s financial affairs in a manner designed to fairly set forth the financial position and results of operations of the CIB. We also believe that all disclosures necessary to enable the reader to gain an understanding of the CIB’s financial affairs have been included. Responsibility for both the accuracy of the presented data and the completeness and fairness of the presentation, including all disclosures, rests with the CIB. The financial statements have been audited by the Indiana State Board of Accounts and the independent auditor’s report has been included in this report.
Management’s discussion and analysis (MD&A) immediately follows the independent auditor’s report and provides a narrative introduction, overview and analysis of the basic financial statements. The MD&A complements this letter of transmittal and should be read in conjunction with it.
Profile of the CIB
Structure and Reporting Entity: The CIB is a municipal body of Marion County created pursuant to the provisions of Indiana Code (IC) 36-10-9. The CIB has no stockholders or equity holders and all revenues and other receipts must be deposited and disbursed in accordance with provisions of such statute. The board is composed of nine members. Six of the nine board members are appointed by the Mayor of the City of Indianapolis, one is appointed by the Marion County Board of Commissioners, one is appointed by the City-County Council of the Consolidated City of Indianapolis-Marion County, a unified form of government commonly referred to as “Unigov” (“City-County Council”) and one is appointed jointly by majority vote of a body consisting of one member of the board of the county commissioners of each county in which a food and beverage tax is in effect under IC 6-9-35 on January 1 of the appointment. The board of county commissioners that has the greatest population of all counties in which a food and beverage tax is in effect under IC 6-9-35 on January 1 of the year of the appointment shall convene the meeting to make the joint appointment. Each county in which a food and beverage tax is in effect under IC 6-9-35 on January 1 of the year of the appointment is entitled to be represented at the meeting by one member of the county’s board of county commissioner, who shall be selected by that county’s board of county commissioners. One of the members appointed by the Mayor must be engaged in the hotel or motel business in the county. Not more than four of the members appointed by the Mayor may be affiliated with the same political party.

(THIS PAGE INTENTIONALLY LEFT BLANK)

3
The CIB is authorized by the statute to finance, construct, equip, operate and maintain any capital facilities or improvements of general public benefit or welfare which would tend to promote convention, cultural, entertainment and recreational activities and thereby positively impact the wider public and civic well-being of the community. While the CIB receives certain excise tax revenue, the CIB has no taxing power. The exercise of any taxing power requires the action of the Indiana General Assembly and, in certain instances when so authorized by the Indiana General Assembly, the enactment by ordinance of the City-County Council. Additionally, certain of these taxes are statutorily restricted to limited purposes. The CIB operates facilities used in convention, cultural, entertainment and recreational activities in downtown Indianapolis. Such activities are maintained, for accounting and reporting purposes, in a single enterprise fund.
Melina Kennedy was appointed to the CIB board by the incoming Mayor of the City of Indianapolis, Joe Hogsett, and was thereafter elected as the new board president.
CIB Operating Model: As an operating model, the CIB’s public purposes are achieved by operating capital facilities, which are important drivers to the economic vitality of the strong and growing convention, cultural, entertainment and recreational businesses (public and private) serving the public and civic interests of the State of Indiana and particularly the central Indiana region. The public and civic interests are directly and indirectly served by the investment and activity of the CIB and its growth fostering effect on the larger economy, including most directly the MSA Indianapolis public and private sector hospitality industry. Additionally, the broader private and public sector is benefited by leisure, amenity and employment opportunities. The hospitality industry is an important element and has played a central role in stabilizing the core of the City of Indianapolis, thereby generally transmitting a rippling benefit throughout the region and the State. This model, ever expanding since its inception in 1965, has become an important element to the success story that is the central Indiana region.
At the core of this operating model is an understanding that the CIB’s activities work in tandem with the private sector to foster diverse economic growth. The CIB’s assets, activities and ancillary amenities allow a larger private hospitality industry to operate. In turn, the hospitality industry mutually develops and services the region’s significant convention, cultural, entertainment and recreational activity and amenities. This understanding of the hospitality industry, as a significant driver allowing the region to enjoy amenities and activities beyond the means of the region to be supported by just its citizens, supports viewing it as an element that fosters non-hospitality economic growth and quality of life in the region. Viewed in this context, an operating model that permits the generation of non-operating revenue (from both the industry’s customers as well as regional users and beneficiaries of these activities and amenities) to support and subsidize the CIB’s capital and operating costs can be seen as thoughtful and balanced taxation policy. Tax policy impacting the CIB is managed by the Indiana General Assembly and the City-County Council. Ultimately, the CIB operations serve to protect and support a region that has thrived and competes well in comparison to other similar cities in the nation.
Internal Control Structure: In developing and evaluating the CIB’s accounting system, we have given consideration to the adequacy of the internal control structure, designing it to provide reasonable, but not absolute, assurance regarding: (1) the safeguarding of assets against loss from unauthorized use or disposition; and (2) the reliability of financial records for preparing financial statements and maintaining accountability for assets. The concept of reasonable assurance recognizes that: (1) the cost of a control should not exceed the benefits likely to be derived; and (2) the valuation of costs and benefits requires estimates and judgments by management.
All internal control evaluations occur within the above framework. We believe that the CIB’s internal accounting controls adequately safeguard assets and provide reasonable assurance of proper recording of financial transactions.

4
Budget: The CIB maintains budgetary controls. The objective of these budgetary controls is to ensure compliance with legal provisions embodied in the annual approved budget.
(1) The Chief Financial Officer prepares the budget for review and approval by the members of the governing board of the CIB.
(2) The budget is advertised online at www.budgetnotices.in.gov.
(3) The CIB’s board approves and submits the budget to the City-County Council for its review.
(4) The Municipal Corporations Committee of the Council holds public hearings on the budget of the CIB and forwards it for approval to the City-County Council.
(5) The budget of the CIB is reviewed and approved by the City-County Council. The overall adopted budget of the City (of which the CIB’s budget is a part), is reviewed and certified by the Indiana Department of Local Government Finance (“DLGF”).
CIB Facilities: Among the facilities managed by the CIB are the multi-purpose Indiana Convention Center (“ICC”) and the state-of-the-art Lucas Oil Stadium (“LOS”). The Convention Center covers a 6 city block area in downtown Indianapolis. The LOS site covers a 6½ city block area just south of the Convention Center and is connected by internal and covered structures, allowing combined use opportunities.
Since opening in 1972, the Indiana Convention Center has had four major expansions, with the fourth being completed in January 2011. With this latest expansion, the Indiana Convention Center now contains 566,300 square feet of clear span convention and exhibition space, 71 meeting rooms and 3 ballrooms. The 11 exhibit halls range in size from 36,300 square feet to 88,900 square feet. The Sagamore Ballroom, with 33,335 square feet, can be divided into seven different sections. The 500 Ballroom has 13,536 square feet and an adjoining reception room. The 10,202 square foot Wabash Ballroom features a 24’ ceiling and may be divided into three separate sections.
LOS features a retractable roof, offering spectacular views of the Indianapolis skyline. In addition, LOS has an infill playing surface, 7 locker rooms, exhibit space, meeting rooms, operable north window, dual two-level club lounges, 139 suites, retractable sideline seating, house reduction curtains, two large video boards, ribbon boards, spacious concourses, interior and exterior plaza space, 11 indoor docks and 2 vehicle ramps to the event level. LOS is connected to the Convention Center and several hotels and entertainment options by a pedestrian connector. Tradeshows can take advantage of an indoor 30,000 square foot loading dock, retractable seating and operable walls to utilize up to 183,000 contiguous square feet of space. Football games can be played indoors or outdoors using the retractable roof and operable north window. The house reduction curtain system covers the entire Terrace Level seating, reducing capacity from 63,000 to approximately 41,000. Basketball and other mini-stadium events have the option of playing in the round for up to 71,000 fans or in a much smaller configuration with a house reduction curtain system. Concerts may be played indoors or outdoors in full stadium or reduced house configurations. Seating configurations range in size from 15,000 to 71,000.
In addition to managing the Indiana Convention Center & Lucas Oil Stadium, the CIB also maintains Victory Field and Bankers Life Fieldhouse.
5
Victory Field, home to the Indianapolis Indians AAA baseball team, has been recognized as the "Best Minor League Ballpark in America" by prominent publications such as Baseball America and Sports
Illustrated. It is constructed on a 13-acre site in White River State Park, which is subleased to, and operated by, the Indianapolis Indians franchise. Located on the southwest corner of West and Maryland streets, the ballpark is in close proximity to the Indiana Convention Center & Lucas Oil Stadium. Victory Field seats approximately 14,200 people, which includes an open-air stadium seating area and the very popular grassy berms in the outfield areas, which offer inviting, lawn seating. This grassy area, around the outfield wall, can accommodate up to 2,000 people. The park’s main deck of seats wraps from behind home plate to the foul poles in left and right field. When fans enter the ballpark, they can walk down the steps to their seats in a lower seating bowl, or up to their seats in the upper bowl. There are 12,200 seats with back and arm rests. The ballpark also features many modern-day amenities, such as 29 luxury suites and cup holders at most seats.
Bankers Life Fieldhouse (formerly Conseco Fieldhouse), widely acknowledged as one of the finest sports and civic arenas in the country, is home to the National Basketball Association’s Indiana Pacers and the Women’s National Basketball Association’s Indiana Fever (2012 WNBA Champions). With a basketball-seating capacity of 17,923 that includes 64 suites, 2,405 club seats, and a loft with 56 loge seats and 48 theater seats, Bankers Life Fieldhouse occupies approximately 750,000 square feet between Delaware and Pennsylvania Streets at Georgia Street in the warehouse district of downtown Indianapolis. The first retro-styled facility in the NBA, Bankers Life Fieldhouse has three seating levels: First Financial Bank Founders Level, Krieg DeVault Club Level and Balcony Level; and the concourses on each level evoke memories of a traditional Indiana basketball Fieldhouse, complemented by state-of-the art amenities. Highlighting the inner bowl of the Fieldhouse are the windows that support the 14-story (140 foot), exposed steel roof. Throughout the day, and during select events, the curtains to these windows are lowered; giving fans not only a view to the outside, but a beautiful view of downtown Indianapolis. The window theme is continued on both the Pennsylvania and Delaware Street sides of the Entry Pavilion, home to the 18 ticket windows and retro-styled ticker board announcing upcoming events. A true tribute to the game of basketball in Indiana, the sightlines were designed for the best viewing of a basketball game; but also give patrons a great view for the many other events held at the Fieldhouse. From concerts, hockey, high school and college sports to the circus and even the World Swimming Championship, the Fieldhouse is also highly acclaimed for both the number and variety of non-basketball events it holds each year. Its many meeting rooms, restaurants and multi-use spaces also make the Fieldhouse ideal for the smaller corporate gatherings and ceremonies held daily. Located in the heart of downtown Indianapolis, the Fieldhouse is located within walking distance of Circle Centre Mall, the Indiana Convention Center, Lucas Oil Stadium, Victory Field, the State Capitol Building and the City-County Building.
Major Initiatives of the CIB: The Indiana Convention Center & Lucas Oil Stadium are excellent venues that have hosted very diverse groups - Super Bowl XLVI® and NFL Experience, NCAA® Men’s and Women’s Final Four® Basketball Championships, Big Ten Football Championship, North American Christian Annual Convention, National FFA Organization Convention, Indiana Black Expo and VFW Annual National Convention.
6
The CIB’s primary objective, aside from the management and maintenance of its various facilities, is to build on the momentum of its convention and trade show business and continue to attract national and international sporting and other events to its facilities. A breakdown of current year events hosted and future events scheduled follows:
Current Year Events
United Rentals, Inc. Annual Meeting and Show, JAMfest Super Nationals, Circle of Stars Gymnastics Invitational, WWETT Expo, NTEA Work Truck Show and Green Truck Summit, Nike Mideast Qualifier Volleyball, M-PACT, American Coatings Show & Conference, FDIC International, Indiana Comic Con, 500 Festival Mini Marathon Expo, Fresenius Medical Care North America, NCAA Tourney Town, USA Volleyball Association Girl’s Junior National Championship, The Gospel Coalition National Women’s Conference, WASTECON/STORMCON, Gen Con “The Best Four Days in Gaming”, United Pentecostal Church International General Conference 2016, Do it Best Corp. May & October Markets, National FFA Convention, LeadingAge 2016 Annual Meeting & Expo, Revive Our Hearts presents Cry Out! True Woman National Conference, Percussive Arts Society International Convention, SEMA/PRI Show, 2016 Monster Jam, National Football Scouting Combine, Supercross, DCI World Championships, IHSAA State Football Championships, Music For All Grand National Championship, Big Ten Football Championship and Fanfest, and Indianapolis Colts Football.
Major Events for 2017
Archery Trade Association Annual Trade Show, JAMfest Super Nationals, Monument Builders of North America, WWETT Expo, NTEA Annual Convention & Work Truck Show, American Academy of Audiology—AudiologyNOW®, The Gospel Coalition National Conference, Indiana ComicCon, Nike Mideast Qualifier Volleyball, FDIC International, 500 Festival Mini Marathon Expo, American Society for Mass Spectrometry Annual Conference, Church of the Nazarene General Assembly, American Veterinary Medical Association 2017 Annual Convention, American Association of Diabetes Educators 2017 Annual Meeting, American Society for Healthcare Engineering Annual Conference & Exposition, Gen Con “The Best Four Days in Gaming”, American Association for Respiratory Care Congress 2017, Do it Best Corp. May & October Markets, Railway Interchange, National FFA Convention, Honor Society of Nursing, Sigma Theta Tau International 44th Biennial Convention, North American Cystic Fibrosis Conference 2017, National Catholic Youth Conference, SEMA/PRI Show, 2017 Monster Jam, Purdue University vs. University of Louisville Football, National Football Scouting Combine, Supercross, DCI World Championships, Music For All Grand National Championship, Big Ten Football Championships and Fanfest, and Indianapolis Colts Football.

7
Major Events for 2018
Archery Trade Association Annual Trade Show, American Baseball Coaches Association 74th Annual Convention, Association of Fraternal Leadership and Values Central Fraternal Leadership Conference, LiveVantage Corporation 2018 Elite Academy, JAMfest Super Nationals, WWETT Expo, NTEA Annual Convention & Work Truck Show, Indiana ComicCon, Nike Mideast Qualifier Volleyball, FDIC International, 500 Festival Mini Marathon Expo, Gen Con “The Best Four Days in Gaming”, National Recreation & Park Association Congress & Expo, Do it Best Corp. May & October Markets, GameStop, Inc. 2018 Conference, North American Die Casting Association Congress & Exposition, American Organization of Nurse Executives 2018 Annual Meeting, Navistar Parts & Service Expo, Furnaces North America, Foundation of Flexographic Technical Association Annual Forum and INFO*FLEX Exhibition, Technical Association of the Pulp & Paper Industry CorrExpo, National FFA Convention, SEMA/PRI Show, 2018 Monster Jam, National Football Scouting Combine, Supercross, DCI World Championships, Music For All Grand National Championship, Big Ten Football Championships and Fanfest, and Indianapolis Colts Football.
Indianapolis as a Destination
Often referred to as “the Crossroads of America,” Indianapolis is at the center of America’s heartland, with more interstates converging in the city than in any other city in the United States, a key selling point to draw groups to CIB facilities. Indiana benefits from its proximity to major markets and population centers - both nationally and internationally. The Indianapolis International Airport, often named the best in the country, continues to work to increase the presence of airlines at the airport. The additions of nonstop flights to cities from coast to coast, as well as internationally, in recent years has made it more convenient for visitors to reach Indianapolis. With more visitors coming to the city than ever before, the city has seen a strong growth in its culinary scene with new restaurants opening and restaurateurs expanding successful concepts. Neighborhoods like Mass Ave, Fountain Square, and Fletcher Place are bustling with foot and bike traffic from visitors looking to experience authentic Indianapolis fare. Fletcher Place’s Milktooth was named one of the best restaurants in the world by Condé Nast Traveler. Indianapolis is the nation’s 14th largest city. According to the U.S. Census Bureau’s Statistics for 2014, the estimated population of Indianapolis is 848,788 and 1,936,255 for the Indianapolis Metropolitan Area. Indianapolis offers a multitude of cultural, educational, sporting, shopping and dining opportunities to its residents and visitors. The Indianapolis 500 celebrated its 100th running with a record crowd, and the Indianapolis Motor Speedway welcomed the Red Bull Air Race for the first year. The Crown Royal 400 at the Brickyard, Grand Prix of Indianapolis, NFL’s Indianapolis Colts, NBA’s Indiana Pacers, WNBA’s Indiana Fever, NASL’s Indy Eleven, ECHL’s Indy Fuel hockey team, and AAA Indianapolis Indians baseball team are among the city’s other prominent sporting attractions, as well as countless amateur sporting events like the Big Ten Championship Football Game and the Men’s and Women’s Big Ten Basketball Tournaments.
Circle Centre Mall and White River State Park offer two prominent attractions within walking distance of downtown hotels and CIB facilities. White River State Park is home to a scenic Central Canal Walk and seven major attractions, including the NCAA Headquarters and Hall of Champions, Indianapolis Zoo, Indiana State Museum, and Eiteljorg Museum of American Indian and Western Art.

8
A short distance from downtown, visitors can enjoy the world’s largest children’s museum - the Children’s Museum of Indianapolis, Indianapolis Motor Speedway, and Indianapolis Museum of Art. Indy’s already robust arts and cultural scene continues to grow. Staples like the Indiana Repertory Theatre and Indianapolis Symphony Orchestra have been joined by smaller fringe theaters and First Friday gallery tours. Indianapolis has garnered media attention for its livability, attractions, and way of life.
• Best Places to Travel in 2017 – Travel + Leisure
• Hottest Food Cities of 2016 – Zagat
• Most Underrated Food City in the U.S. – Condé Nast Traveler
• 2016 America’s Favorite Cities – Travel + Leisure
• 2016 Top Ten Best Cities for Young Professionals - Forbes
• 2016 Trips Your Need to Book: Indianapolis – Yahoo
• #1 Airport in America - Condé Nast Traveler
• America’s Best Urban Bike Paths: Cultural Trail - Fodor’s Travel
• Best in the U.S. 2015 - Lonely Planet
• #1 Convention City in the U.S. - USA Today
• 52 Places to Visit in the World - The New York Times
• Top 10 Best Downtowns – Livability
• Best Airport in North America – Airports Council International
• Best Overall Stadium Experience - for the 5th consecutive year, Stadium Journey ranked Lucas Oil Stadium as its top NFL stadium destination.
Indianapolis now welcomes more than 28.2 million visitors annually, providing $4.9 billion in economic impact, producing $1.2 billion in tax receipts, and generating 77,800 full-time-equivalent jobs in Central Indiana. The hallmarks of the Indianapolis economy have long been its diversity and steady growth, which is part of the foundation of Indy’s strong performance during the past several years. Indianapolis can boast of diverse strengths in the manufacturing, distribution, retail and service sectors. Economic diversity keeps Indianapolis on a steady growth track. Additionally, Indiana’s real estate availability affords a wide selection of available land, existing office space and industrial parks. Finally, many of the city’s accomplishments, such as Victory Field, Bankers Life Fieldhouse, Circle Centre Mall, Lucas Oil Stadium, and the expanded Convention Center were all the result of successful partnerships between private and public sectors. The stable economy and many attractions of Indianapolis, along with its central location within the nation, make it a prominent convention and tourist center and the reason it won the distinction of Best Convention City by USA TODAY readers.
According to the most recent data available, visitors spend about $4.6 billion annually in Central Indiana and support more than 75,000 full-time equivalent jobs. Visit Indy, Inc. (Visit Indy), the official “destination marketing organization” for Indianapolis and primary seller of the Indiana Convention Center and Lucas Oil Stadium (ICCLOS) for events to be held 14 months or more from the booking date, reports continued growth in convention market share since the completion of the ICCLOS expansion and the opening of the 1,005-room JW Marriott Indianapolis in 2011. In 2015, Visit Indy booked 904,717 future event-related hotel room-nights (conventions, major meetings, amateur sporting events in partnership with the Indiana Sports Corp., etc.), an all-time record for the organization, more than the organization booked in 2000 and 2001 combined. Some of the recent success can be attributed to Indy’s recognition by the readers of USA Today as the “#1 Convention City in America” as well as the city’s inclusion on the New York Times’ list of “52 Places to Go in


(THIS PAGE INTENTIONALLY LEFT BLANK)

10

(THIS PAGE INTENTIONALLY LEFT BLANK)
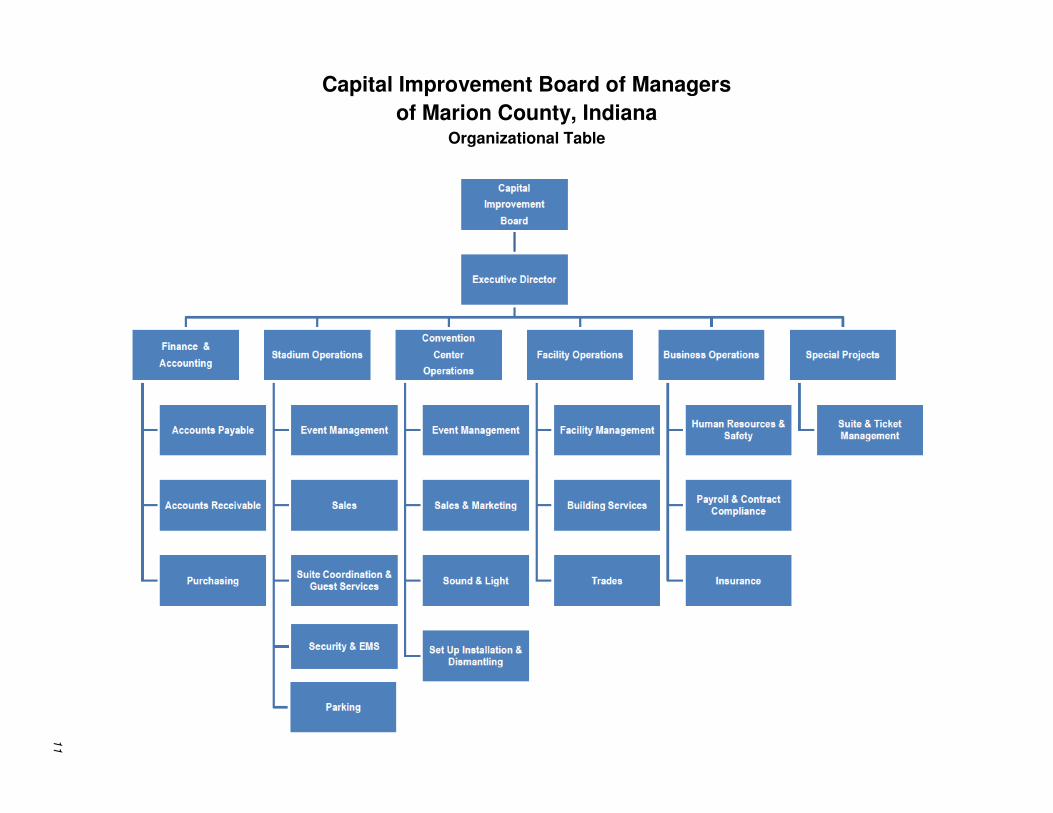
Capital Improvement Board of Managers
of Marion County, Indiana Organizational Table
11

(THIS PAGE INTENTIONALLY LEFT BLANK)

12
Capital Improvement Board of Managers
(of Marion County, Indiana) Principal Officers and Management
Mayor, City of Indianapolis The Honorable Joe Hogsett Board Members (during 2016)
Name
Title
Term Ending
Years of
Service
Occupation
Melina Kennedy President January 16, 2018 1 General Manager at Cummins, Inc.
David E. Corbitt Vice President
January 16, 2018 1 Attorney, Krieg Devault LLP
Mary Ann Fagan Treasurer January 16, 2018 1 Former St. Margaret's Hospital Guild President
Douglas R. Brown Secretary January 16, 2018 16 Attorney, Bose McKinney & Evans LLP
Maggie Lewis Member January 16, 2018 5 City-County Council, President District 10
Jim Dora, Jr. Member January 16, 2018 7 President & CEO, General Hotels Corporation
Michael Terrell Member January 16, 2018 1 Attorney, Taft Stettinius & Hollister LLP
Brenda Myers Member January 16, 2018 7 Executive Director, Hamilton County Tourism, Inc.
David Ruhmkorff Member January 16, 2018 1 International Vice President, IBEW Sixth District Office

13
Capital Improvement Board of Managers
(of Marion County, Indiana) Principal Officers and Management (Continued)
Administrative Personnel
Name
Position
Years of Service
Barney Levengood Executive Director 26
Timothy M. Kuehr Chief Financial Officer 3
Debbie Hennessey Convention Center Director 4
Michael A. Fox Stadium Director 32
Thomas L. Boyle Director of Operations 22
Christina Kelley Business Operations Director 6 Counsel to the Board Bingham Greenebaum Doll, LLP Indianapolis, Indiana

Financial Section
(THIS PAGE INTENTIONALLY LEFT BLANK)

STATE OF INDIANA
AN EQUAL OPPORTUNITY EMPLOYER STATE BOARD OF ACCOUNTS 302 WEST WASHINGTON STREET ROOM E418 INDIANAPOLIS, INDIANA 46204-2769
Telephone: (317) 232-2513
Fax: (317) 232-4711 Web Site: www.in.gov/sboa
INDEPENDENT AUDITOR'S REPORT
TO: THE OFFICIALS OF THE CAPITAL IMPROVEMENT BOARD OF MANAGERS OF MARION COUNTY, INDIANA Report on the Financial Statements We have audited the accompanying financial statements of the Capital Improvement Board of Managers of Marion County (CIB), a component unit of the Consolidated City of Indianapolis - Marion County, as of and for the years ended December 31, 2016 and 2015, and the related notes to the financial statements, which collectively comprise the CIB's basic financial statements as listed in the Table of Contents. Management's Responsibility for the Financial Statements Management is responsible for the preparation and fair presentation of these financial statements in accordance with accounting principles generally accepted in the United States of America; this includes the design, implementation, and maintenance of internal control relevant to the preparation and fair presentation of financial statements that are free from material misstatement, whether due to fraud or error. Auditor's Responsibility Our responsibility is to express an opinion on these financial statements based on our audit. We conducted our audit in accordance with auditing standards generally accepted in the United States of America. Those standards require that we plan and perform the audit to obtain reasonable assurance about whether the financial statements are free from material misstatement. An audit involves performing procedures to obtain audit evidence about the amounts and disclosures in the financial statements. The procedures selected depend on the auditor's judgment, including the assessment of the risks of material misstatement of the financial statements, whether due to fraud or error. In making those risk assessments, the auditor considers internal control relevant to the CIB's preparation and fair presentation of the financial statements in order to design audit procedures that are appropriate in the circumstances, but not for the purpose of expressing an opinion on the effectiveness of the CIB's internal control. Accordingly, we express no such opinion. An audit also includes evaluating the appropriateness of accounting policies used and the reasonableness of significant accounting estimates made by management, as well as evaluating the overall presentation of the financial statements. We believe that the audit evidence we have obtained is sufficient and appropriate to provide a basis for our audit opinion.
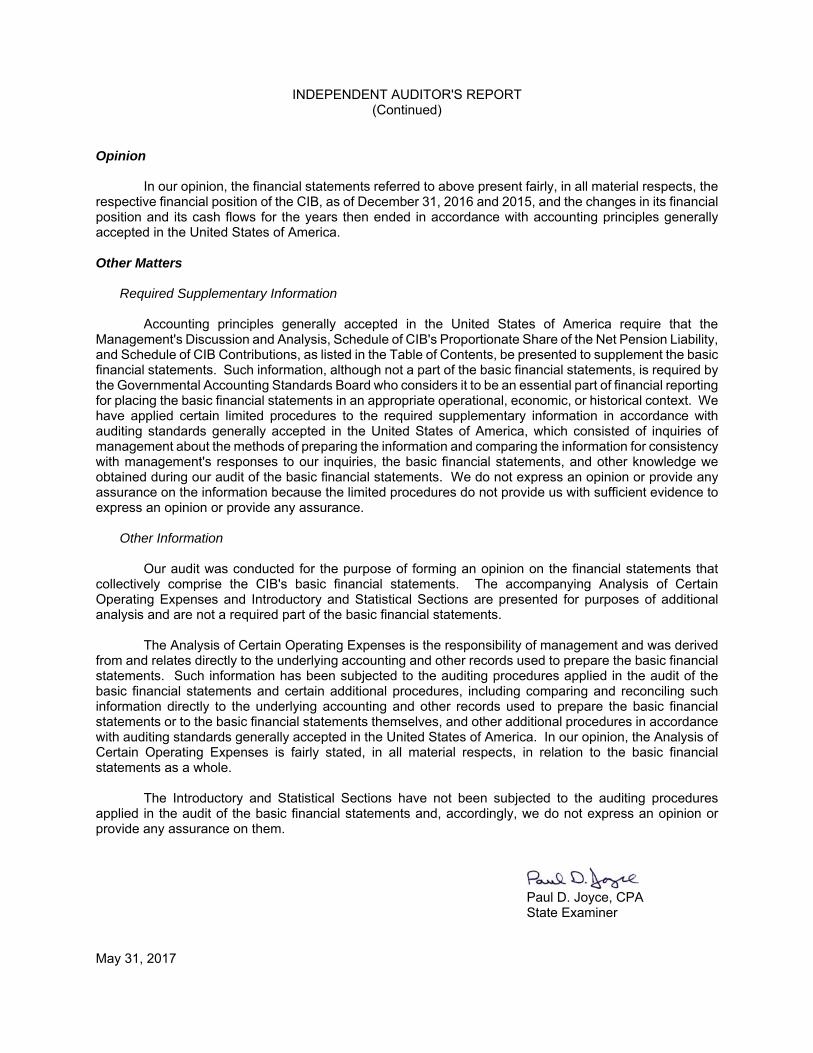
INDEPENDENT AUDITOR'S REPORT (Continued)
Opinion In our opinion, the financial statements referred to above present fairly, in all material respects, the respective financial position of the CIB, as of December 31, 2016 and 2015, and the changes in its financial position and its cash flows for the years then ended in accordance with accounting principles generally accepted in the United States of America. Other Matters Required Supplementary Information Accounting principles generally accepted in the United States of America require that the Management's Discussion and Analysis, Schedule of CIB's Proportionate Share of the Net Pension Liability, and Schedule of CIB Contributions, as listed in the Table of Contents, be presented to supplement the basic financial statements. Such information, although not a part of the basic financial statements, is required by the Governmental Accounting Standards Board who considers it to be an essential part of financial reporting for placing the basic financial statements in an appropriate operational, economic, or historical context. We have applied certain limited procedures to the required supplementary information in accordance with auditing standards generally accepted in the United States of America, which consisted of inquiries of management about the methods of preparing the information and comparing the information for consistency with management's responses to our inquiries, the basic financial statements, and other knowledge we obtained during our audit of the basic financial statements. We do not express an opinion or provide any assurance on the information because the limited procedures do not provide us with sufficient evidence to express an opinion or provide any assurance.
Other Information Our audit was conducted for the purpose of forming an opinion on the financial statements that collectively comprise the CIB's basic financial statements. The accompanying Analysis of Certain Operating Expenses and Introductory and Statistical Sections are presented for purposes of additional analysis and are not a required part of the basic financial statements. The Analysis of Certain Operating Expenses is the responsibility of management and was derived from and relates directly to the underlying accounting and other records used to prepare the basic financial statements. Such information has been subjected to the auditing procedures applied in the audit of the basic financial statements and certain additional procedures, including comparing and reconciling such information directly to the underlying accounting and other records used to prepare the basic financial statements or to the basic financial statements themselves, and other additional procedures in accordance with auditing standards generally accepted in the United States of America. In our opinion, the Analysis of Certain Operating Expenses is fairly stated, in all material respects, in relation to the basic financial statements as a whole. The Introductory and Statistical Sections have not been subjected to the auditing procedures applied in the audit of the basic financial statements and, accordingly, we do not express an opinion or provide any assurance on them.
Paul D. Joyce, CPA State Examiner May 31, 2017
16
MANAGEMENT’S DISCUSSION AND ANALYSIS
(Unaudited)
Introduction
The management of Capital Improvement Board of Managers of Marion County, Indiana (“CIB”), which is a component unit of the Consolidated City of Indianapolis-Marion County (“City”) and conducts its business in the City, offers readers of the CIB’s financial statements this narrative overview and analysis of the financial activities of the CIB for the fiscal years ended on December 31, 2016 and 2015. This Management’s Discussion and Analysis is being presented to provide additional information regarding the activities of the CIB in connection with its financial statements and to meet the requirements of Governmental Accounting Standards Board (“GASB”) Statement No. 34, Basic Financial Statements - and Management’s Discussion and Analysis - for
State and Local Governments.
The CIB is organized and operated to acquire, construct, finance, lease, operate, promote and publicize capital improvements and thereby serve the convention and visitor industry and the commercial, industrial and cultural interests of Indiana and its citizens. This presently occurs principally through its operation of the Indiana Convention Center (“ICC”) & Lucas Oil Stadium (“LOS”), and its use arrangements related to Victory Field and Bankers Life Fieldhouse.
Financial Highlights
The following are some highlights from the CIB’s financial statements for the year ended December 31, 2016:
� The CIB’s financial position continued to improve in 2016. As was the case in 2015, the CIB ended 2016 with a positive net cash flow and an increase in operating cash balances. The CIB’s 2017 budget anticipates meeting 2017 expenditures with budgeted revenues and cash reserves.
� The CIB experienced a decrease in Total assets and deferred outflows of resources of about $26.2 million, or 1.8 percent in 2016. Current assets - restricted increased by about $14.7 million primarily due to increases in the stadium and convention center sublease investment accounts as well as increased receivables from the State of Indiana. Current
assets - unrestricted increased about $9.4 million due to an increase in operating cash balances. Capital assets decreased by about $44.4 million. This represents depreciation expense, net of additions and disposals in 2016. Included in 2016 disposals was the transfer of Victory Field assets as well as a write off of approximately $3.4 million in capital assets no longer in use. Other noncurrent assets decreased by $6.0 million due to the partial forgiveness of a note receivable. Deferred outflows of resources increased by about $170 thousand due mainly to deferrals associated with the net pension liability.
� Total liabilities and deferred inflows of resources decreased by about $36.9 million, or 3.2 percent in 2016. Current liabilities increased about $37.8 million in 2016 largely due to $32 million of notes payable that mature in 2017. Noncurrent liabilities decreased about $73.5 million due to the maturity of these notes payable as well as decreases in capital lease obligations and other bonds and notes payable. Deferred inflows of resources decreased $1.2 million due primarily to the continued amortization of inflows related to capital lease refinancing transactions.
� Net position increased by about $10.7 million, or 3.7 percent in 2016.
17
� Operating revenues increased by $144 thousand, 0.5 percent, primarily due to an increase in labor reimbursements that offset a decrease in food service and concession income.
� Nonoperating revenues increased by about $11.1 million, or 6.9 percent due to state and local taxes and other assistance and positive fluctuations in the underlying activities from which all tax revenues are derived.
� Operating expenses in 2016 increased by approximately $4.2 million, or 4.6 percent, in large part due to increases in depreciation expense.
� Nonoperating expenses increased by about $15.3 million, or 18.8 percent. This was the result of the transfer of Victory Field assets during the year.
Overview of Financial Statements
This financial report of the CIB includes the following financial statements for the calendar year 2016:
� Statement of Net Position
� Statement of Revenues, Expenses and Changes in Net Position
� Statement of Cash Flows
Also included are notes to the financial statements that provide more detailed data. These financial statements are prepared in accordance with accounting principles generally accepted in the United States of America promulgated by GASB.
The net position of the CIB is composed of three categories:
� Net investment in capital assets - this reflects the CIB’s investment in capital assets (e.g. land, buildings, machinery and equipment), less any related debt used to acquire those assets that is still outstanding. The CIB uses these capital assets to provide services to the public; consequently, these assets are not available for future spending. Although the CIB’s investment in its capital assets is reported net of related debt, it should be noted that the resources to repay this debt must be provided from other sources, since the capital assets themselves cannot be used to liquidate these liabilities.
� Restricted - this represents resources that are subject to external restrictions (which principally relate to trust agreements under which capital lease obligations and bonded indebtedness were incurred) on how they may be used.
� Unrestricted - this represents resources that may be used to meet the CIB’s ongoing obligations to the public and creditors.
The Statement of Net Position reflects the assets and liabilities of the CIB using the accrual basis of accounting, which is similar to the accounting used by most private-sector companies. The CIB’s net position represents one way to measure the CIB’s financial health. In a general way, changes in net position that occur over time may also serve as an indicator of whether the financial position of the CIB is strengthening or softening. However, to assess the overall fiscal health of the CIB, readers of the CIB’s financial statements should consider additional nonfinancial factors such as the ability of the CIB to retain and attract conventions, trade shows, tourism, sporting and cultural events and other activities that utilize the capital assets of the CIB; the general economic health and outlook in Indianapolis-Marion County in the hotel and motel, retail food and beverage and rental car industries, which are subject to certain local taxes that are committed to and financially support the CIB; and the general economic health and outlook locally (that is, Indianapolis-Marion County and the surrounding region) as well as nationally with regard to consumer appetite for scheduling, attending and supporting the events and activities at the facilities of the CIB.
18
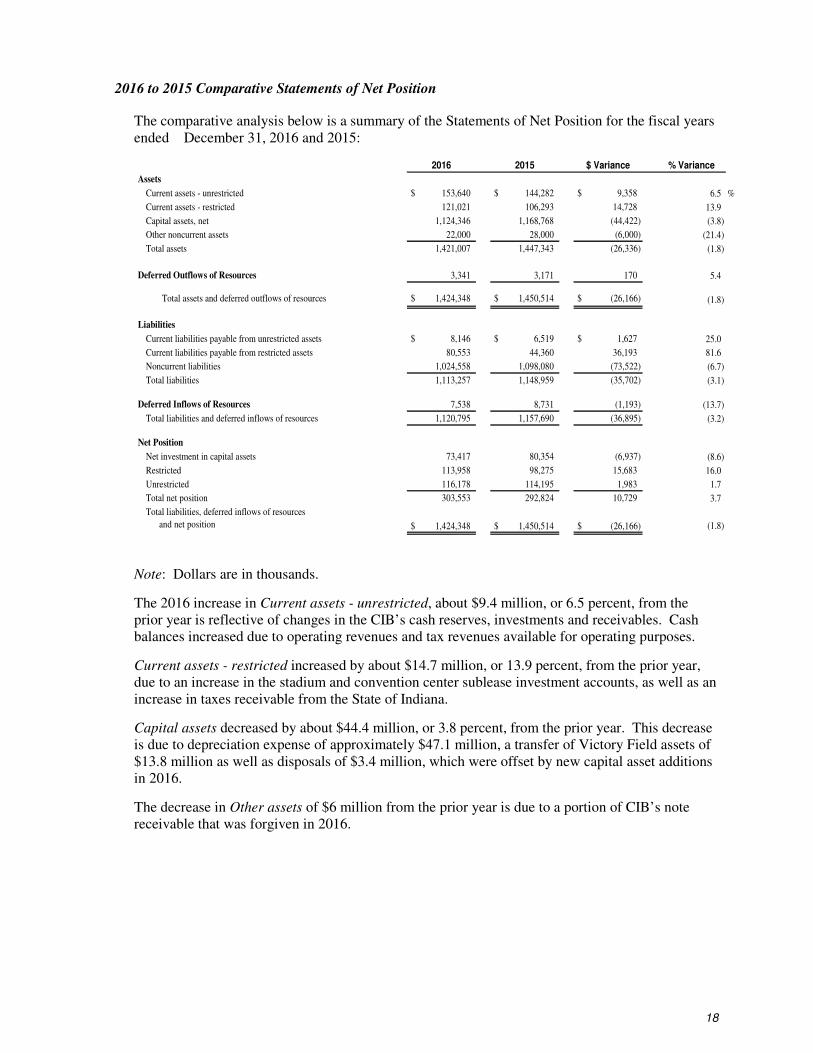
2016 to 2015 Comparative Statements of Net Position
The comparative analysis below is a summary of the Statements of Net Position for the fiscal years ended December 31, 2016 and 2015:
2016 2015 $ Variance % Variance
Assets
Current assets - unrestricted $ 153,640 $ 144,282 $ 9,358 6.5 %
Current assets - restricted 121,021 106,293 14,728 13.9
Capital assets, net 1,124,346 1,168,768 (44,422) (3.8)
Other noncurrent assets 22,000 28,000 (6,000) (21.4)
Total assets 1,421,007 1,447,343 (26,336) (1.8)
Deferred Outflows of Resources 3,341 3,171 170 5.4
Total assets and deferred outflows of resources $ 1,424,348 $ 1,450,514 $ (26,166) (1.8)
Liabilities
Current liabilities payable from unrestricted assets $ 8,146 $ 6,519 $ 1,627 25.0
Current liabilities payable from restricted assets 80,553 44,360 36,193 81.6
Noncurrent liabilities 1,024,558 1,098,080 (73,522) (6.7)
Total liabilities 1,113,257 1,148,959 (35,702) (3.1)
Deferred Inflows of Resources 7,538 8,731 (1,193) (13.7)
Total liabilities and deferred inflows of resources 1,120,795 1,157,690 (36,895) (3.2)
Net Position
Net investment in capital assets 73,417 80,354 (6,937) (8.6)
Restricted 113,958 98,275 15,683 16.0
Unrestricted 116,178 114,195 1,983 1.7
Total net position 303,553 292,824 10,729 3.7
Total liabilities, deferred inflows of resources
and net position $ 1,424,348 $ 1,450,514 $ (26,166) (1.8)
Note: Dollars are in thousands.
The 2016 increase in Current assets - unrestricted, about $9.4 million, or 6.5 percent, from the prior year is reflective of changes in the CIB’s cash reserves, investments and receivables. Cash balances increased due to operating revenues and tax revenues available for operating purposes.
Current assets - restricted increased by about $14.7 million, or 13.9 percent, from the prior year, due to an increase in the stadium and convention center sublease investment accounts, as well as an increase in taxes receivable from the State of Indiana.
Capital assets decreased by about $44.4 million, or 3.8 percent, from the prior year. This decrease is due to depreciation expense of approximately $47.1 million, a transfer of Victory Field assets of $13.8 million as well as disposals of $3.4 million, which were offset by new capital asset additions in 2016.
The decrease in Other assets of $6 million from the prior year is due to a portion of CIB’s note receivable that was forgiven in 2016.

19
Deferred outflows of resources increased by about $170 thousand, due to amounts associated with the CIB’s net pension liability.
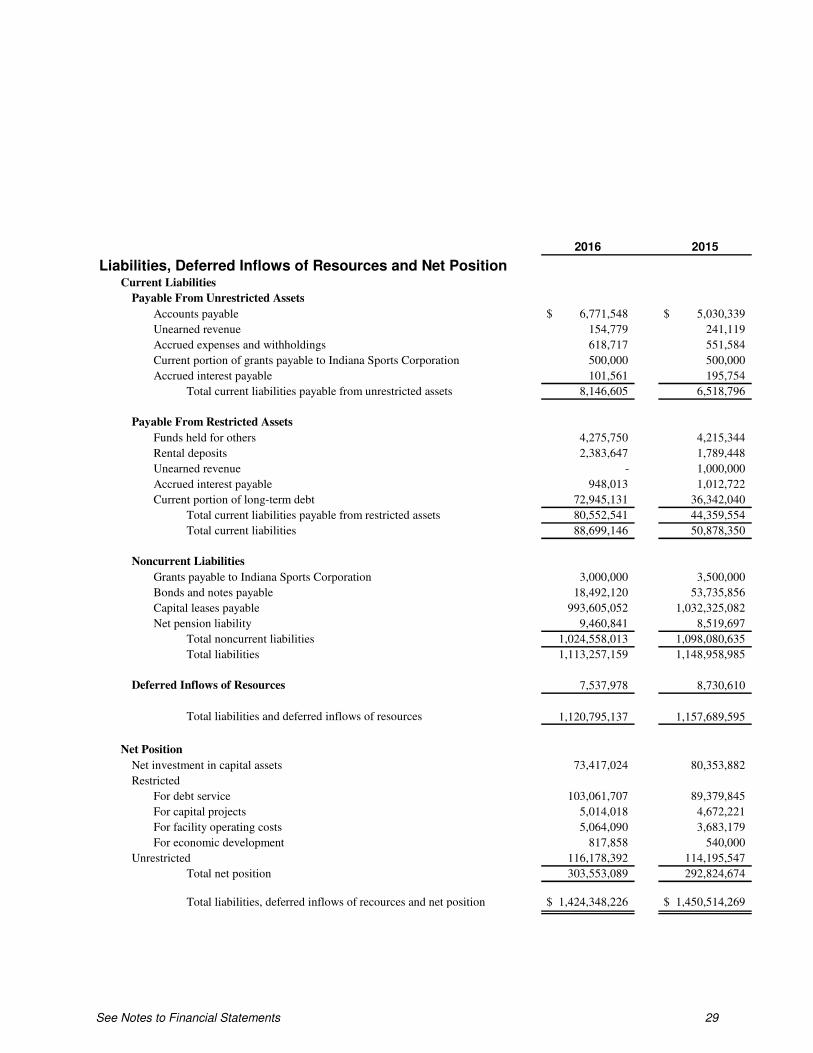
Current liabilities payable from unrestricted assets increased about $1.6 million, or 25.0 percent, from the prior year due mainly to a $1.8 million increase in accounts payable.
Current liabilities payable from restricted assets increased about $36.2 million, or 81.6 percent, from the prior year. The current portion of long-term debt increased by approximately $36.6 million due to a $32 million note that matures in 2017, while unearned revenue decreased by $1 million due to the recognition of contributions from the ISCBA.
Noncurrent liabilities decreased by about $73.5 million, or 6.7 percent, from the prior year. The net decrease in noncurrent liabilities in 2016 is due to reductions of the capital lease obligations and other debt during the year, as well as the $32 million note payable due in 2017 becoming a current liability.
Deferred inflows of resources decreased by approximately $1.2 million, or 13.7 percent from the prior year. This was due primarily to the amortization of gains on refinancing.
Net investment in capital assets decreased about $6.9 million, or 8.6 percent, in 2016, as a result of the transfer of Victory Field assets.
Restricted net position increased about $15.7 million, or 16.0 percent, in 2016, as a result of an increase in cash equivalents held with fiscal agent and an increase in receivables due from the State of Indiana.
The approximate $2.0 million, or 1.7 percent, increase from the prior year in Unrestricted net
position is primarily due to the increase in operating cash.

20
2015 to 2014 Comparative Statements of Net Position
The comparative analysis below is a summary of the Statements of Net Position for the fiscal years ended December 31, 2015 and 2014:
2015 2014 $ Variance % Variance
Assets
Current assets - unrestricted $ 144,282 $ 150,774 $ (6,492) (4.3) %
Current assets - restricted 106,293 105,439 854 0.8
Capital assets, net 1,168,768 1,191,588 (22,820) (1.9)
Other noncurrent assets 28,000 34,000 (6,000) (17.6)
Total assets 1,447,343 1,481,801 (34,458) (2.3)
Deferred Outflows of Resources 3,171 629 2,542 404.1
Total assets and deferred outflows of resources $ 1,450,514 $ 1,482,430 $ (31,916) (2.2)
Liabilities
Current liabilities payable from unrestricted assets $ 6,519 $ 11,254 $ (4,735) (42.1)
Current liabilities payable from restricted assets 44,360 42,277 2,083 4.9
Noncurrent liabilities 1,098,080 1,138,538 (40,458) (3.6)
Total liabilities 1,148,959 1,192,069 (43,110) (3.6)
Deferred Inflows of Resources 8,731 10,105 (1,374) (13.6)
Total liabilities and deferred inflows of resources 1,157,690 1,202,174 (44,484) (3.7)
Net Position
Net investment in capital assets 80,354 69,317 11,037 15.9
Restricted 98,275 93,178 5,097 5.5
Unrestricted 114,195 117,761 (3,566) (3.0)
Total net position 292,824 280,256 12,568 4.5
Total liabilities, deferred inflows of resources
and net position $ 1,450,514 $ 1,482,430 $ (31,916) (2.2)
Note: Dollars are in thousands. The 2014 Statement of Net Position does not reflect the impact of the adoption of GASB Statement No. 68 (see Note 1 of Financial Statements).
The 2015 decrease in Current assets - unrestricted, about $6.5 million, or 4.3 percent, from the prior year is reflective of changes in the CIB’s cash reserves, investments and receivables. Cash balances increased due to operating revenues and tax revenues available for operating purposes, however, investments decreased as they were used to fund bond payments during the year.
Current assets - restricted increased by about $.9 million, or 0.8 percent, from the prior year, due to an increase in the stadium and convention center sublease investment accounts, as well as an increase in taxes receivable from the State of Indiana.
Capital assets decreased by about $22.8 million, or 1.9 percent, from the prior year. This decrease is due to depreciation expense of approximately $41.6 million, which was offset by new additions in capital assets in 2015.
The decrease in Other assets of $6 million from the prior year is due to a portion of CIB’s note receivable that was forgiven in 2015.

21
Deferred outflows of resources increased by about $2.5 million, due to amounts associated with the CIB’s net pension liability.
Current liabilities payable from unrestricted assets decreased about $4.7 million, or 42.1 percent, from the prior year due mainly to a $4.6 million decrease in accounts payable.
Current liabilities payable from restricted assets increased about $2.1 million, or 4.9 percent, from the prior year. The current portion of long-term debt increased by approximately $6.3 million while box office settlement funds decreased by approximately $4.1 million.
Noncurrent liabilities decreased by about $40.5 million, or 3.6 percent, from the prior year. The net decrease in noncurrent liabilities in 2015 is due to reductions of the capital lease obligations and other debt during the year.
Deferred inflows of resources decreased by approximately $1.4 million, or 13.6 percent from the prior year. This was due primarily to the amortization of gains on refinancing.
Net investment in capital assets increased about $11 million, or 15.9 percent, in 2015, as a result of newly acquired capital assets and reductions of debt.
Restricted net position increased about $5.1 million, or 5.5 percent, in 2015, as a result of an increase in cash equivalents held with fiscal agent of $5.6 million. This represents tax revenues received to be used to pay down capital lease obligations.
The approximate $3.6 million, or 3.0 percent, decrease from the prior year in Unrestricted net
position is primarily due to the adoption of GASB Statement No. 68 and associated recognition of a net pension liability beginning in 2015.

22
2016 to 2015 Comparative Statements of Revenues, Expenses and Changes in Net Position
The comparative analysis below is a summary of the Statements of Revenues, Expenses and Changes in Net Position for the fiscal years ended December 31, 2016 and 2015:
2016 2015 $ Variance % Variance
Operating Revenues
Rental income $ 9,438 $ 10,171 $ (733) (7.2) %
Food service and concession commissions 5,150 6,162 (1,012) (16.4)
Parking lot income 595 669 (74) (11.1)
Labor reimbursements 14,487 12,711 1,776 14.0
Other operating income 1,882 1,695 187 11.0
Total operating revenues 31,552 31,408 144 0.5
Nonoperating Revenues
Investment income 632 371 261 70.4
State and local taxes and other assistance 169,239 158,780 10,459 6.6
Other 1,041 665 376 56.5
Total nonoperating revenues 170,912 159,816 11,096 6.9
Total revenues 202,464 191,224 11,240 5.9
Operating Expenses
Salaries and wages 16,857 16,457 400 2.4
Fringe benefits 4,887 4,587 300 6.5
Utilities 8,713 8,471 242 2.9
Repairs and maintenance 3,110 4,521 (1,411) (31.2)
Insurance 1,652 1,797 (145) (8.1)
Security 3,269 3,588 (319) (8.9)
Nondepreciable equipment, parts and supplies 4,180 3,991 189 4.7
Other 6,440 7,056 (616) (8.7)
Depreciation and amortization 47,145 41,584 5,561 13.4
Total operating expenses 96,253 92,052 4,201 4.6
Nonoperating Expenses
Interest expense 44,960 47,791 (2,831) (5.9)
Compensation to Visit Indy, Inc. 11,950 11,500 450 3.9
Bankers Life Fieldhouse operating reimbursements 8,475 8,255 220 2.7
Pacers Basketball note receivable forgiveness 6,000 6,000 - -
Colts inducements/Revenue Sharing and Day-of-Game expenses 5,390 5,120 270 5.3
Public safety support payments 1,880 1,995 (115) (5.8)
Other 17,827 520 17,307 3,328.3
Total nonoperating expenses 96,482 81,181 15,301 18.8
Total expenses 192,735 173,233 19,502 11.3
Capital Contributions 1,000 - 1,000 100.0
Increase in Net Position 10,729 17,991 (7,262) (40.4)
Net Position, Beginning of Year 292,824 280,256 12,568 4.5
Change in Accounting Principle (Note 1) - (5,423) 5,423 (100.0)
Net Assets, Beginning of Year - as restated 292,824 274,833 17,991 6.5
Net Position, End of Year $ 303,553 $ 292,824 $ 10,729 3.7
Note: Dollars are in thousands.
23
Total operating revenues increased about $144 thousand, or 0.5 percent. Labor reimbursements increased $1.8 million compared to 2015 while food service and concessions decreased by $1.0 million and rental income decreased by $733 thousand.
Total nonoperating revenues increased about $11.1 million, or 6.9 percent, due to an increase in the state and local taxes and other assistance.
Total operating expenses increased by $4.2 million, or 4.6 percent. Depreciation expense increased by $5.6 million while repairs and maintenance costs decreased $1.4 million.
Total nonoperating expenses increased about $15.3 million, or 18.8 percent. Other nonoperating expenses increased by $17.3 million primarily due to the transfer of Victory Field assets. Interest expense decreased by $2.8 million due to lower interest rates as well as debt payments being applied more toward principal than interest compared to 2015.
Capital contributions of $1.0 million in 2016 represent capital additions at Lucas Oil Stadium reimbursed by the Indiana Stadium and Convention Building Authority.
24
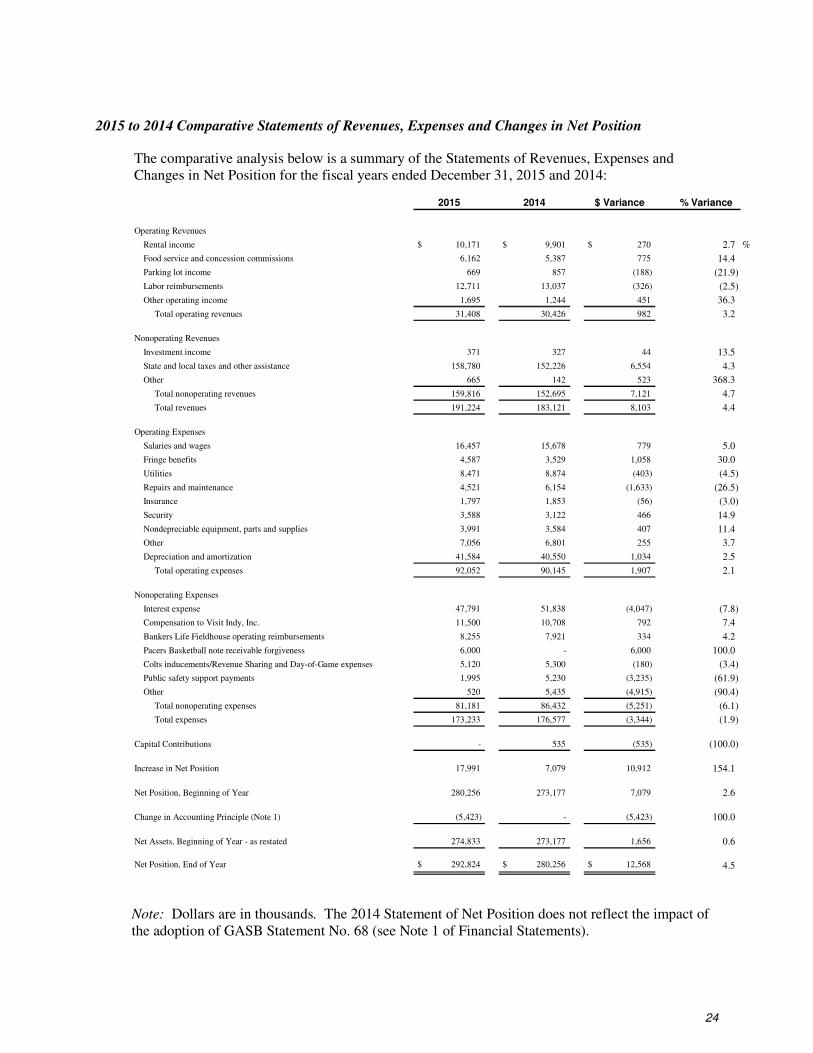
2015 to 2014 Comparative Statements of Revenues, Expenses and Changes in Net Position
The comparative analysis below is a summary of the Statements of Revenues, Expenses and Changes in Net Position for the fiscal years ended December 31, 2015 and 2014:
2015 2014 $ Variance % Variance
Operating Revenues
Rental income $ 10,171 $ 9,901 $ 270 2.7 %
Food service and concession commissions 6,162 5,387 775 14.4
Parking lot income 669 857 (188) (21.9)
Labor reimbursements 12,711 13,037 (326) (2.5)
Other operating income 1,695 1,244 451 36.3
Total operating revenues 31,408 30,426 982 3.2
Nonoperating Revenues
Investment income 371 327 44 13.5
State and local taxes and other assistance 158,780 152,226 6,554 4.3
Other 665 142 523 368.3
Total nonoperating revenues 159,816 152,695 7,121 4.7
Total revenues 191,224 183,121 8,103 4.4
Operating Expenses
Salaries and wages 16,457 15,678 779 5.0
Fringe benefits 4,587 3,529 1,058 30.0
Utilities 8,471 8,874 (403) (4.5)
Repairs and maintenance 4,521 6,154 (1,633) (26.5)
Insurance 1,797 1,853 (56) (3.0)
Security 3,588 3,122 466 14.9
Nondepreciable equipment, parts and supplies 3,991 3,584 407 11.4
Other 7,056 6,801 255 3.7
Depreciation and amortization 41,584 40,550 1,034 2.5
Total operating expenses 92,052 90,145 1,907 2.1
Nonoperating Expenses
Interest expense 47,791 51,838 (4,047) (7.8)
Compensation to Visit Indy, Inc. 11,500 10,708 792 7.4
Bankers Life Fieldhouse operating reimbursements 8,255 7,921 334 4.2
Pacers Basketball note receivable forgiveness 6,000 - 6,000 100.0
Colts inducements/Revenue Sharing and Day-of-Game expenses 5,120 5,300 (180) (3.4)
Public safety support payments 1,995 5,230 (3,235) (61.9)
Other 520 5,435 (4,915) (90.4)
Total nonoperating expenses 81,181 86,432 (5,251) (6.1)
Total expenses 173,233 176,577 (3,344) (1.9)
Capital Contributions - 535 (535) (100.0)
Increase in Net Position 17,991 7,079 10,912 154.1
Net Position, Beginning of Year 280,256 273,177 7,079 2.6
Change in Accounting Principle (Note 1) (5,423) - (5,423) 100.0
Net Assets, Beginning of Year - as restated 274,833 273,177 1,656 0.6
Net Position, End of Year $ 292,824 $ 280,256 $ 12,568 4.5
Note: Dollars are in thousands. The 2014 Statement of Net Position does not reflect the impact of the adoption of GASB Statement No. 68 (see Note 1 of Financial Statements).

25
Total operating revenues increased about $1 million, or 3.2 percent. Food service and concessions increased $.8 million and rental income increased $.3 million compared to 2014.
Total nonoperating revenues increased about $7.1 million, or 4.6 percent, due to an increase in the state and local taxes and other assistance.
Total operating expenses increased by $1.9 million, or 2.1 percent. Salaries and wages increased by about $.8 million, or 5.0 percent. Fringe benefits increased $1.1 million, or 30 percent. Repairs and maintenance costs decreased $1.6 million while depreciation expense increased by $1 million.
Total nonoperating expenses decreased about $5.3 million, or 6.1 percent. Other nonoperating expenses decreased $4.9 million primarily due to a multi-year grant commitment made in the prior year to the Indiana Sports Corporation for the Natatorium. Interest expense decreased by $4 million as one of the CIB’s capital lease obligations was paid off during 2015. Public safety support payments decreased $3.2 million as provided for in the associated agreement with the City of Indianapolis. This agreement stipulated monthly payments equivalent to 100.0 percent of the revenues derived from the 2013 new tax increases for the first twelve months, and 25.0 percent for each month thereafter.
Capital Asset and Debt Administration
Capital Assets
As discussed, the CIB is organized and operated to acquire, construct, lease, finance, operate, promote and publicize capital improvements and thereby serve the convention and visitor industry and the commercial, industrial and cultural interests of Indiana and its citizens. Because these assets are leased from the other governments and ownership of the assets ultimately reverts to the CIB upon expiration or termination of these leases, they are accounted for as property owned under capital leases and are depreciated along with other assets owned by the CIB. Readers are referred to footnotes 3 and 4 to the financial statements for more detailed information on capital asset activity. These capital improvements (capital assets) consist primarily of the following:
Indiana Convention Center & Lucas Oil Stadium
Among the facilities managed by the CIB is a multi-purpose sports and convention facility, the Indiana Convention Center & Lucas Oil Stadium. Over the years, the ICC has been expanded to meet the ever-growing demand for convention space in Indianapolis, the capitol city of Indiana. As the lure of the City’s many tourist, cultural and sports attractions grows around the country, so grows the appeal of Indianapolis for convention and trade show organizers. The Indiana Convention Center & Lucas Oil Stadium hosts numerous state and national conventions, trade shows, cultural and sporting events each year, bringing millions of visitors to Indianapolis and central Indiana.
The Indiana Convention Center & Lucas Oil Stadium were constructed, expanded and improved using a mix of private and public funds, including the proceeds from a number of tax-exempt and taxable bond offerings by Marion County Convention and Recreational Facilities Authority (“MCCRFA”) and the Indiana Finance Authority (“IFA”). Lease agreements relating to these facilities secure the related bonds, along with certain state and local taxes which are used by the CIB to pay lease rentals. Such state and local taxes also secure certain bond and note indebtedness of the CIB and other lease obligations of the CIB related to other facilities.
In 2005, the CIB entered into a lease and other agreements with the Colts extending their relationship and commitment with the City of Indianapolis and setting forth the terms of their use of the CIB’s facilities. The Colts will play their home NFL games in Indianapolis through their 2034 season. The CIB is obligated to operate, maintain and insure the Indiana Convention Center & Lucas Oil Stadium at its expense.

26
Bankers Life Fieldhouse (formerly Conseco Fieldhouse)
Bankers Life Fieldhouse (including a connected parking facility) was completed in 1999 and is used for a variety of sporting events, concerts and other special events. The Pacers Basketball, LLC, a National Basketball Association franchise (“Pacers”), is the exclusive operator of the facility. Other frequent users include the Indiana Fever (a Women’s National Basketball Association basketball franchise).
Bankers Life Fieldhouse was built using a mix of private and public funds, including the proceeds from a 1997 tax-exempt and taxable bond offering of MCCRFA. A lease agreement (between MCCRFA, as lessor, and the CIB, as lessee) related to Bankers Life Fieldhouse secures the related bonds, along with certain state and local taxes which are committed by the CIB to pay lease rentals.
In 2014, the CIB entered into an Amended and Restated Operating Agreement with the Pacers. In this amendment, the CIB secured a ten-year agreement with three one-year options. In addition, the language that would allow the Pacers to trigger an early termination right based on operating losses was removed. Language was added that would entitle the City of Indianapolis to a right of first offer. In exchange, the CIB agreed to assume certain operating expenses, such as off-site storage, general liability insurance, daily security and utilities. An annual operating payment of over $7 million will be made to the Pacers and $33.5 million will be provided in building improvements over the term of the agreement.
Victory Field
MCCRFA completed construction of Victory Field in 1995. Victory Field is home to the Indianapolis Indians (“Indians”), a AAA minor league baseball franchise affiliated with the Pittsburgh Pirates organization.
Victory Field was built using a mix of public and private funds, including the proceeds from a taxable bond offering of MCCRFA. A lease agreement (between MCCRFA, as lessor, and the CIB, as lessee) related to Victory Field also secured the related bonds, along with certain state and local taxes which were committed by the CIB to pay lease rentals. In 2015, the CIB made its final lease payments in support of the underlying MCCRFA bonds, which were then paid in full. In anticipation of the reversion of title of Victory Field from MCCRFA to the CIB and thereafter to White River State Park Development Commission (“WRSP”) in 2016, a new lease agreement between WRSP and the CIB and a new sublease agreement between the CIB and the Indians were concurrently executed. See Note 10 for further information.
Long-Term Debt
The CIB’s long-term debt is comprised of capital lease obligations, bond indebtedness and note indebtedness.
The CIB has acquired certain of its existing capital assets through capital leasing arrangements involving MCCRFA and, in 2005, began acquiring other capital assets through capital leasing arrangements involving the Indiana Office of Management and Budget (“IOMB”), the Indiana Stadium and Convention Building Authority (“ISCBA”), and the IFA (collectively and individually their interests being referred to in this discussion as “the State Leasing Entities”).
MCCRFA’s revenue bonds are payable solely from the respective trust estates under which they were issued and rely upon the receipt of debt service lease rentals to provide for their payment. The CIB’s lease payments to MCCRFA are funded and secured by a pledge of certain state and local tax revenues that varies depending on which debt is involved.

27
The IFA’s revenue obligations are payable from and secured by ISCBA obligations that are supported by the ISCBA’s leases with IOMB, as lessee, who in turn receives rent under subleases with the CIB, as sublessee. The CIB’s lease payments to IOMB are funded and secured by a pledge of certain state and local tax revenues.
In addition to its lease obligations, the CIB has direct outstanding revenue bonds and note indebtedness of its own. Such borrowings were undertaken for a variety of purposes, including making certain capital improvements, meeting certain contractual commitments with recurring users of its facilities and providing working capital. Like its lease obligations, these indebtedness obligations are payable from, and secured by, certain state and local tax revenues, which pledges vary depending on which debt is involved. While the CIB has contractually agreed to certain debt-related limitations in connection with its capital lease obligations and bond indebtedness, certain provisions of Indiana law also limit the amount of bond and note indebtedness that it may incur.
Readers are referred to footnotes 4, 5, 6 and 7 to the financial statements for more detailed information on long-term debt activity and associated funding mechanisms.
Economic Factors and Other Matters
With the ICC expansion as a key driver, Indianapolis tourism and convention business continued to grow in 2016. As a convention and tourism business, the CIB is charged with the public purpose of promoting and publicizing Indianapolis and the central Indiana region. It continues to pursue this core purpose. The CIB’s focus for the business of the ICC & LOS in 2017 includes maximizing the use of the facilities by concentrating on hosting large trade show events, consideration of its available rentable space (and amenities) to meet demand (and effectively compete with other national offerings) and minimizing the wear and tear on facilities (by proactively and continuously undertaking maintenance and repairs).
There are no events scheduled for CIB facilities that have been cancelled for 2017 that would adversely affect operations. Regardless, the CIB will pursue continuing efforts, including the CIB’s marketing relationships with Visit Indy, to attract new and recurring conventions, trade shows, sports, tourism, cultural events and other activities to its facilities and in the Central Indiana region.
Requests for Information
This financial report is designed to provide a general overview of the CIB’s finances and to demonstrate the CIB’s accountability for the public funds it receives. If you have any questions about this report or need additional financial information, your inquiries should be directed to:
Finance Department Capital Improvement Board of Managers
of Marion County, Indiana 100 South Capitol Avenue
Indianapolis, Indiana 46225-1071

(THIS PAGE INTENTIONALLY LEFT BLANK)

See Notes to Financial Statements 28
Capital Improvement Board of Managers (of Marion County, Indiana)
(A Component Unit of the Consolidated City of Indianapolis-Marion County)
Statements of Net Position
December 31, 2016 and 2015
2016 2015
Assets and Deferred Outflows of ResourcesCurrent Assets
Unrestricted Assets
Cash and cash equivalents $ 78,751,906 $ 75,336,191
Cash equivalents held with fiscal agent 32,087,715 26,454,056
Investments 31,155,418 31,223,055
Interest receivable 27,848 28,917
Accounts receivable 3,753,726 3,087,446
Inventories - 19,473
Current portion of note receivable 6,000,000 6,000,000
Prepaid expenses and other 1,863,564 2,133,334
Total unrestricted assets 153,640,177 144,282,472
Restricted Assets
Cash and cash equivalents 13,035,027 12,217,013
Cash equivalents held with fiscal agent 78,163,682 70,212,605
Interest receivable 22,449 21,090
Receivable from State of Indiana 29,800,171 23,842,052
Total restricted assets 121,021,329 106,292,760
Total current assets 274,661,506 250,575,232
Noncurrent Assets
Note receivable 22,000,000 28,000,000
Nondepreciable capital assets 130,037,593 136,723,002
Depreciable capital assets, net 994,308,497 1,032,045,073
Total noncurrent assets 1,146,346,090 1,196,768,075
Total assets 1,421,007,596 1,447,343,307
Deferred Outflows of Resources 3,340,630 3,170,962
Total assets and deferred outflows of resources $ 1,424,348,226 $ 1,450,514,269
See Notes to Financial Statements 29
2016 2015
Liabilities, Deferred Inflows of Resources and Net PositionCurrent Liabilities
Payable From Unrestricted Assets
Accounts payable $ 6,771,548 $ 5,030,339
Unearned revenue 154,779 241,119
Accrued expenses and withholdings 618,717 551,584
Current portion of grants payable to Indiana Sports Corporation 500,000 500,000
Accrued interest payable 101,561 195,754
Total current liabilities payable from unrestricted assets 8,146,605 6,518,796
Payable From Restricted Assets
Funds held for others 4,275,750 4,215,344
Rental deposits 2,383,647 1,789,448
Unearned revenue - 1,000,000
Accrued interest payable 948,013 1,012,722
Current portion of long-term debt 72,945,131 36,342,040
Total current liabilities payable from restricted assets 80,552,541 44,359,554
Total current liabilities 88,699,146 50,878,350
Noncurrent Liabilities
Grants payable to Indiana Sports Corporation 3,000,000 3,500,000
Bonds and notes payable 18,492,120 53,735,856
Capital leases payable 993,605,052 1,032,325,082
Net pension liability 9,460,841 8,519,697
Total noncurrent liabilities 1,024,558,013 1,098,080,635
Total liabilities 1,113,257,159 1,148,958,985
Deferred Inflows of Resources 7,537,978 8,730,610
Total liabilities and deferred inflows of resources 1,120,795,137 1,157,689,595
Net Position
Net investment in capital assets 73,417,024 80,353,882
Restricted
For debt service 103,061,707 89,379,845
For capital projects 5,014,018 4,672,221
For facility operating costs 5,064,090 3,683,179
For economic development 817,858 540,000
Unrestricted 116,178,392 114,195,547
Total net position 303,553,089 292,824,674
Total liabilities, deferred inflows of recources and net position $ 1,424,348,226 $ 1,450,514,269

See Notes to Financial Statements 30
Capital Improvement Board of Managers
(of Marion County, Indiana) (A Component Unit of the Consolidated City of Indianapolis-Marion County)
Statements of Revenues, Expenses and Changes in Net Position
Years Ended December 31, 2016 and 2015
2016 2015
Operating Revenues
Rental income $ 9,438,144 $ 10,170,929
Food service and concession commissions 5,150,223 6,162,083
Parking lot income 594,841 669,487
Labor reimbursements 14,487,112 12,710,518
Other operating income 1,881,768 1,694,869
31,552,088 31,407,886
Operating Expenses
Salaries and wages 16,856,973 16,457,151
Fringe benefits 4,887,494 4,586,831
Utilities 8,712,985 8,470,529
Repairs and maintenance 3,110,200 4,521,427
Insurance 1,651,311 1,796,854
Security 3,269,384 3,588,459
Nondepreciable equipment, parts and supplies 4,180,150 3,990,845
Other 6,439,648 7,055,743
Depreciation and amortization 47,145,100 41,584,565
96,253,245 92,052,404
Operating Loss (64,701,157) (60,644,518)
Nonoperating Revenues (Expenses)
Investment income 632,005 371,195
State and local taxes and other assistance 169,238,548 158,780,475
Interest expense (44,959,975) (47,790,546)
Compensation to Visit Indy, Inc. (11,950,000) (11,499,992)
Bankers Life Fieldhouse operating reimbursements (8,474,999) (8,255,037)
Pacers Basketball note receivable forgiveness (6,000,000) (6,000,000)
Inducements/revenue sharing to Indianapolis Colts (3,500,000) (3,500,000)
Indianapolis Colts’ Day-of-Game expenses (1,890,000) (1,620,000)
Grants to other organizations (650,000) (450,000)
Public safety support payments (1,879,998) (1,995,335)
Loss on sale/disposal of capital assets (17,176,509) (70,104)
Other 1,040,500 665,363
74,429,572 78,636,019
Increase in Net Position Before Capital Contributions 9,728,415 17,991,501
Capital Contributions 1,000,000 -
Increase in Net Position 10,728,415 17,991,501
Net Position, Beginning of Year 292,824,674 280,255,942
Change in Accounting Principle (Note 1) - (5,422,769)
Net Assets, Beginning of Year - as restated 292,824,674 274,833,173
Net Position, End of Year $ 303,553,089 $ 292,824,674
See Notes to Financial Statements 31
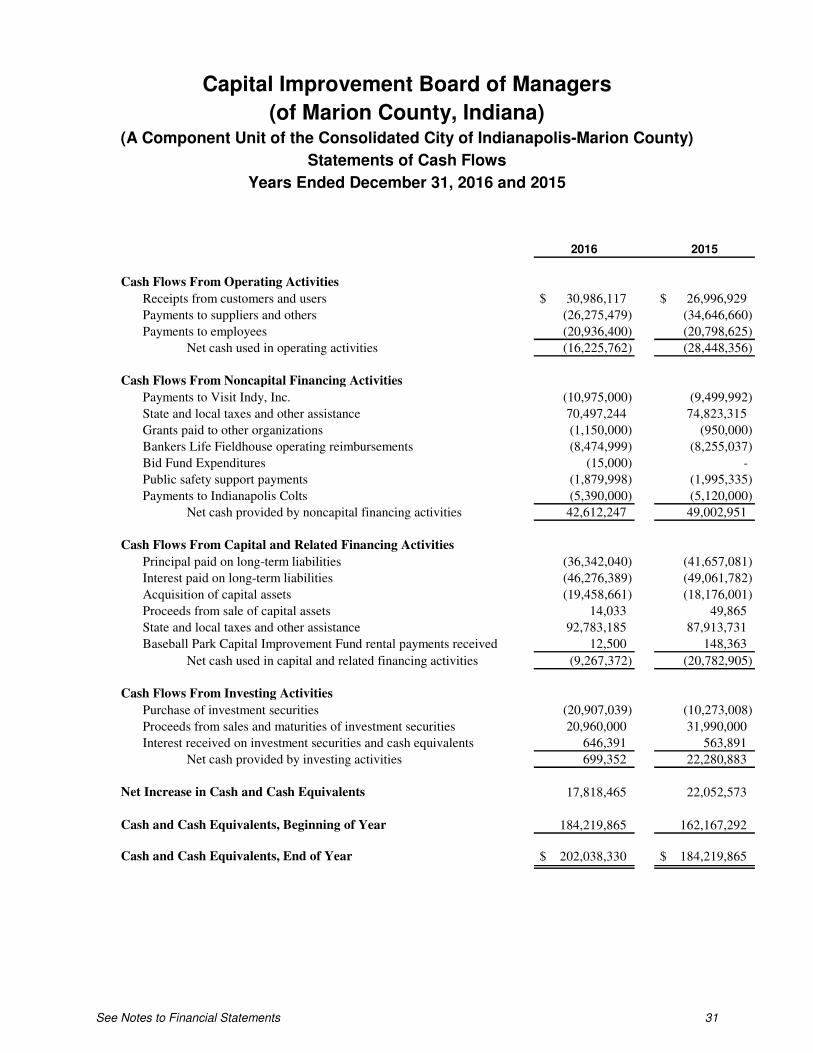
Capital Improvement Board of Managers
(of Marion County, Indiana) (A Component Unit of the Consolidated City of Indianapolis-Marion County)
Statements of Cash Flows
Years Ended December 31, 2016 and 2015
2016 2015
Cash Flows From Operating Activities
Receipts from customers and users $ 30,986,117 $ 26,996,929
Payments to suppliers and others (26,275,479) (34,646,660)
Payments to employees (20,936,400) (20,798,625)
Net cash used in operating activities (16,225,762) (28,448,356)
Cash Flows From Noncapital Financing Activities
Payments to Visit Indy, Inc. (10,975,000) (9,499,992)
State and local taxes and other assistance 70,497,244 74,823,315
Grants paid to other organizations (1,150,000) (950,000)
Bankers Life Fieldhouse operating reimbursements (8,474,999) (8,255,037)
Bid Fund Expenditures (15,000) -
Public safety support payments (1,879,998) (1,995,335)
Payments to Indianapolis Colts (5,390,000) (5,120,000)
Net cash provided by noncapital financing activities 42,612,247 49,002,951
Cash Flows From Capital and Related Financing Activities
Principal paid on long-term liabilities (36,342,040) (41,657,081)
Interest paid on long-term liabilities (46,276,389) (49,061,782)
Acquisition of capital assets (19,458,661) (18,176,001)
Proceeds from sale of capital assets 14,033 49,865
State and local taxes and other assistance 92,783,185 87,913,731
Baseball Park Capital Improvement Fund rental payments received 12,500 148,363
Net cash used in capital and related financing activities (9,267,372) (20,782,905)
Cash Flows From Investing Activities
Purchase of investment securities (20,907,039) (10,273,008)
Proceeds from sales and maturities of investment securities 20,960,000 31,990,000
Interest received on investment securities and cash equivalents 646,391 563,891
Net cash provided by investing activities 699,352 22,280,883
Net Increase in Cash and Cash Equivalents 17,818,465 22,052,573
Cash and Cash Equivalents, Beginning of Year 184,219,865 162,167,292
Cash and Cash Equivalents, End of Year $ 202,038,330 $ 184,219,865

See Notes to Financial Statements 32
Capital Improvement Board of Managers
(of Marion County, Indiana) (A Component Unit of the Consolidated City of Indianapolis-Marion County)
Statements of Cash Flows (Continued)
Years Ended December 31, 2016 and 2015
2016 2015
Noncash Noncapital Financing Activities
Forgiveness of Pacers Basketball note receivable $ 6,000,000 $ 6,000,000
Noncash Capital and Related Financing Activities
Capital assets acquisitions included in accounts payable 1,169,094 714,098
Capital contributions 1,000,000 -
Long-term debt forgiven 1,043,000 517,000
Transfer of Victory Field assets 13,757,671 -
Amortization of deferred gains and loss on lease refinancings 1,167,451 1,223,408
Reconciliation of Operating Loss to Net Cash Used in Operating
Activities
Operating loss $ (64,701,157) $ (60,644,518)
Adjustment to reconcile operating loss to net cash used in
operating activities
Depreciation and amortization 47,145,100 41,584,565
Nondepreciable equipment expense funded by capital lease
obligation 16,100 -
Pension expense in excess of contributions made 746,296 403,361
Change in assets and liabilities
Accounts receivable (667,955) (203,039)
Inventories 19,473 19,473
Prepaid expenses (705,230) 5,987
Accounts payable 1,286,213 (5,248,263)
Unearned revenue (86,340) (26,854)
Accrued expenses and withholdings 67,132 (158,004)
Funds held for others 60,406 (3,886,509)
Rental deposits 594,200 (294,555)
Net cash used in operating activities $ (16,225,762) $ (28,448,356)

33
Capital Improvement Board of Managers
(of Marion County, Indiana) (A Component Unit of the Consolidated City of Indianapolis-Marion County)
Notes to Financial Statements
December 31, 2016 and 2015
Note 1: Summary of Significant Accounting Policies
The Capital Improvement Board of Managers (of Marion County, Indiana) (“CIB”) is a municipal body created under Indiana Code (“IC”) 36-10-9 and is governed by a nine-member board. Six of the nine board members are appointed by the Mayor of the City of Indianapolis, one is appointed by the Marion County Board of Commissioners, one is appointed by the City-County Council of the Consolidated City of Indianapolis-Marion County, a unified form of government commonly referred to as “Unigov” (“City-County Council”) and one is appointed jointly by majority vote of a body consisting of one member of the board of the county commissioners of each county in which a
food and beverage tax is in effect under IC 6-9-35 on January 1 of the appointment. The governments of the City of Indianapolis and Marion County, Indiana have been consolidated and operate under one elected City-County Council. The CIB has no stockholders or equity holders and all revenues and other receipts must be deposited and disbursed in accordance with provisions of this statute. The CIB is authorized to finance, construct, equip, operate and maintain any capital facilities or improvements of general public benefit or welfare which would tend to promote cultural, recreational, public or civic well-being of the community. Facilities used in sports, recreation and convention activities are leased and/or operated by the CIB in downtown Indianapolis.
Reporting Entity
The CIB is considered to be a component unit of the Consolidated City of Indianapolis-Marion County. The CIB has based this determination upon the fact that Unigov is financially accountable for the CIB and its operations. Financial accountability is evidenced by the following:
a. The Mayor of Indianapolis, acting in his capacity as the executive of both the City and the County, appoints a voting majority of the CIB’s governing body;
b. Unigov, through its elected City-County Council approves the CIB’s budget and may, at its discretion, choose to modify it;
c. The CIB is fiscally dependent upon Unigov in that it may not issue revenue bond or general obligation bond debt without approval by the Mayor of Indianapolis and the City-County Council.
Measurement Focus and Basis of Accounting and Financial Reporting
The CIB is a business-type activity that prepares its financial statements on the accrual basis and economic resources measurement focus in conformity with accounting principles generally accepted in the United States of America as applied to governmental units. Under the accrual basis of accounting, revenues are recorded when earned and expenses are recorded when a liability is incurred, regardless of the timing of the related cash flows.

34
Capital Improvement Board of Managers
(of Marion County, Indiana) (A Component Unit of the Consolidated City of Indianapolis-Marion County)
Notes to Financial Statements
December 31, 2016 and 2015
Use of Estimates
The preparation of financial statements in conformity with accounting principles generally accepted in the United States of America requires management to make estimates and assumptions that affect the reported amounts of assets, deferred outflows of resources, liabilities and deferred inflows of resources as well as the disclosure of contingent assets and liabilities at the date of the financial statements and the reported amounts of revenues and expenses during the reporting period. Actual results could differ from those estimates.
Cash, Cash Equivalents and Investments
For purposes of the statements of cash flows, the CIB considers all highly liquid investments (including those that are held with fiscal agent and/or are restricted) with an original maturity of three months or less when purchased to be cash equivalents.
Investments are recorded at fair value (generally based upon quoted market prices).
Inventories
Inventories consist of maintenance and operating supplies and are valued at the lower of cost or market. Cost is determined on the first-in, first-out (“FIFO”) method.
Receivable From State of Indiana
The receivable from the State of Indiana represents certain derived tax revenues and fees accrued in accordance with GASB Statement No. 33, Accounting and Financial Reporting for Nonexchange
Transactions. This balance is comprised of the following at December 31:
2016 2015
State and local taxes 29,486,831$ 23,525,512$
Specialty license plate fees 313,340 316,540
29,800,171$ 23,842,052$

35
Capital Improvement Board of Managers
(of Marion County, Indiana) (A Component Unit of the Consolidated City of Indianapolis-Marion County)
Notes to Financial Statements
December 31, 2016 and 2015
Capital Assets
Purchased capital assets are stated at cost. Donated capital assets are stated at estimated fair value at the date of donation. Depreciation is charged as an expense of operations using the straight-line method. The CIB uses a capitalization threshold of $20,000 for recording individual capital assets. Estimated useful lives used to compute depreciation are as follows:
Years
Buildings and improvements 10-50
Parking garage 30
Equipment, furniture and fixtures and other 3-25
The CIB capitalizes interest as a component of construction in progress, based on interest costs of borrowings specifically for the project. There was no interest capitalized during 2016 or 2015.
Compensated Absences
Employees earn vacation time based on the calendar year. Certain employees are allowed to carry over from the previous year any accrued unused vacation days. No employee may have more than thirty unused vacation days on December 31 of any year. The CIB has recorded a current liability of $428,891 and $382,305 for accrued vacation and related benefits at December 31, 2016 and 2015, respectively, as these benefits are expected to be used within one year. No accrual for employees’ sick pay or personal time is recorded since employees are not paid for unused sick leave or personal time upon termination of employment.
Cost-Sharing Defined-Benefit Pension Plan
The CIB participates in a cost-sharing multiple-employer defined-benefit pension plan (“Plan”). For purposes of measuring the net pension liability, deferred outflows of resources and deferred inflows of resources related to pensions, and pension expense, information about the fiduciary net
position of the Plan and additions to/deductions from the Plan’s fiduciary net position have been determined on the same basis as they are reported by the Plan. For this purpose, benefit payments (including refunds of employee contributions) are recognized when due and payable in accordance with the benefit terms.
Original Issue Discounts and Premiums
Original issue discounts and premiums on bonds are amortized using the interest method over the life of the bonds to which they relate.

36
Capital Improvement Board of Managers
(of Marion County, Indiana) (A Component Unit of the Consolidated City of Indianapolis-Marion County)
Notes to Financial Statements
December 31, 2016 and 2015
Deferred Outflows of Resources
As of December 31, 2016 and 2015, deferred outflows of resources consisted of the following:
2016 2015
Net difference between projected and actual earnings on
pension plan investments 1,548,548$ 635,281$
Changes in assumptions - pension 417,420 720,201
Changes in proportion and differences between contributions
recognized and proportionate share of contributions - pension 258,170 437,543
Difference between expected and actual experience - pension 211,958 365,705
CIB's contributions made subsequent to the measurement date
of the net pension liability 600,676 559,971
Deferred loss on capital lease refinancing 303,858 452,261
Total deferred outflows of resources 3,340,630$ 3,170,962$
Deferred Inflows of Resources
As of December 31, 2016 and 2015, deferred inflows of resources consisted of the following:
2016 2015
Changes in proportion and differences between contributions
recognized and proportionate share of contributions - pension 130,893$ 7,515$
Difference between expected and actual experience - pension 17,464 17,619
Deferred gains on capital lease refinancings 7,389,621 8,705,476
Total deferred inflows of resources 7,537,978$ 8,730,610$
Revenue and Expense Recognition
Operating revenues of the CIB are derived primarily from convention, trade show, sporting and other special events held at the Indiana Convention Center & Lucas Oil Stadium and consist mainly of rental income, food service and concession commissions and labor reimbursements. All expenses that relate to operating the Indiana Convention Center & Lucas Oil Stadium facilities are considered to be operating expenses of the CIB. However, certain expenses incurred by the CIB on behalf of the Indianapolis Colts (“Colts”) and Pacers Basketball LLC (“Pacers”) are excluded from operations. All revenues and expenses not meeting this definition are reported as nonoperating revenues and expenses or capital contributions.
When both restricted and unrestricted resources are available for use, it is the CIB’s policy to use restricted resources first, then unrestricted resources as they are needed.
37
Capital Improvement Board of Managers
(of Marion County, Indiana) (A Component Unit of the Consolidated City of Indianapolis-Marion County)
Notes to Financial Statements
December 31, 2016 and 2015
Restricted Assets
Pursuant to Indiana statutes and the provisions of the CIB’s Amended and Restated Capital Improvement Bond Fund Revenue Deposit Agreement and Amended and Restated Stadium and Convention Special Fund Revenue Deposit Agreement, certain tax revenues (state and local) and fees are allocated to the CIB and are pledged to secure and pay installments of rent under certain lease and sublease agreements and other obligations of the CIB discussed later in the notes.
Annual Budget
The CIB makes operating and capital expenditures only as provided in its approved budget. The CIB is required by law to adopt an operating and capital budget, which in total cannot be increased by the CIB without the approval of the City-County Council. While the CIB also budgets for certain debt service costs, payment of these costs does not require City-County Council approval. The CIB prepares its annual budget on the modified accrual basis, while the accompanying financial statements are on the accrual basis.
Adoption of New Accounting Standard
The CIB implemented GASB Statement No. 72, Fair Value Measurement and Application (“GASB 72”) during 2016. The primary objective of GASB 72 is to address accounting and financial reporting issues related to fair value measurements. Fair value is defined as the price that would be received to sell an asset or paid to transfer a liability in an orderly transaction between market participants at the measurement date.
The CIB implemented GASB Statement No. 68, Accounting and Financial Reporting for Pensions
– an amendment of GASB Statement No. 27 (GASB 68), during 2015. The primary objective of GASB 68 is to improve accounting and financial reporting by state and local governments for pensions. With the implementation of GASB 68, the CIB recorded a net pension liability of $8,519,697 as of December 31, 2015, which was not previously included on the statement of net position. This amount represents the CIB’s proportionate share of the net pension liability of the Public Employees’ Retirement Fund of Indiana. Adoption of GASB 68 resulted in a decrease of $5,422,769 in beginning unrestricted net position as of January 1, 2015.
In addition, deferred inflows of resources of $25,134 and deferred outflows of resources of $2,718,701 as of December 31, 2015, were recognized on the statement of net position as a result of the CIB’s adoption of GASB 68.

38
Capital Improvement Board of Managers
(of Marion County, Indiana) (A Component Unit of the Consolidated City of Indianapolis-Marion County)
Notes to Financial Statements
December 31, 2016 and 2015
Note 2: Cash, Cash Equivalents and Investments
Deposits
Custodial credit risk is the risk that in the event of a bank failure, the CIB’s deposits may not be returned to it. The CIB’s deposit policy for custodial credit risk requires compliance with the provisions of Indiana statutes.
The CIB’s cash deposits are insured up to $250,000 at financial institutions insured by the Federal Deposit Insurance Corporation’s (“FDIC”). Any cash deposits in excess of the $250,000 FDIC limits are partially or fully collateralized by the depository institution and insured by the Indiana Public Deposits Insurance Fund (“Fund”) via the pledged collateral from the institutions securing deposits of public funds. The Fund is a multiple financial institution collateral pool as provided under Indiana Code, Section 5-13-12-1.
Investments
Indiana statutes generally authorize the CIB to invest in United States obligations and issues of federal agencies, secured repurchase agreements fully collateralized by U.S. Government or U.S. Government agency securities, municipal securities of Indiana issuers that have not defaulted during the previous 20 years, certificates of deposit and open-end money market mutual funds.
The CIB categorizes its fair value measurements within the fair value hierarchy established by generally accepted accounting principles. The hierarchy is based on the valuation inputs used to measure the fair value of the asset. Level 1 inputs are quoted prices in active markets for identical assets; Level 2 inputs are significant other observable inputs; Level 3 inputs are significant unobservable inputs.
The CIB has the following recurring fair value measurements as of December 31, 2016 and 2015:
• U.S. Treasury notes of $20,795,008 and $20,841,676, respectively, are valued using quoted market prices (Level 1 inputs).
• U.S. Government-sponsored enterprise securities of $10,360,410 and $10,381,379, respectively, are valued using a matrix pricing model (Level 2 inputs).
• Open-end money market mutual funds of $110,591,871 and $96,804,985, respectively, are valued using quoted market prices (Level 1 inputs).
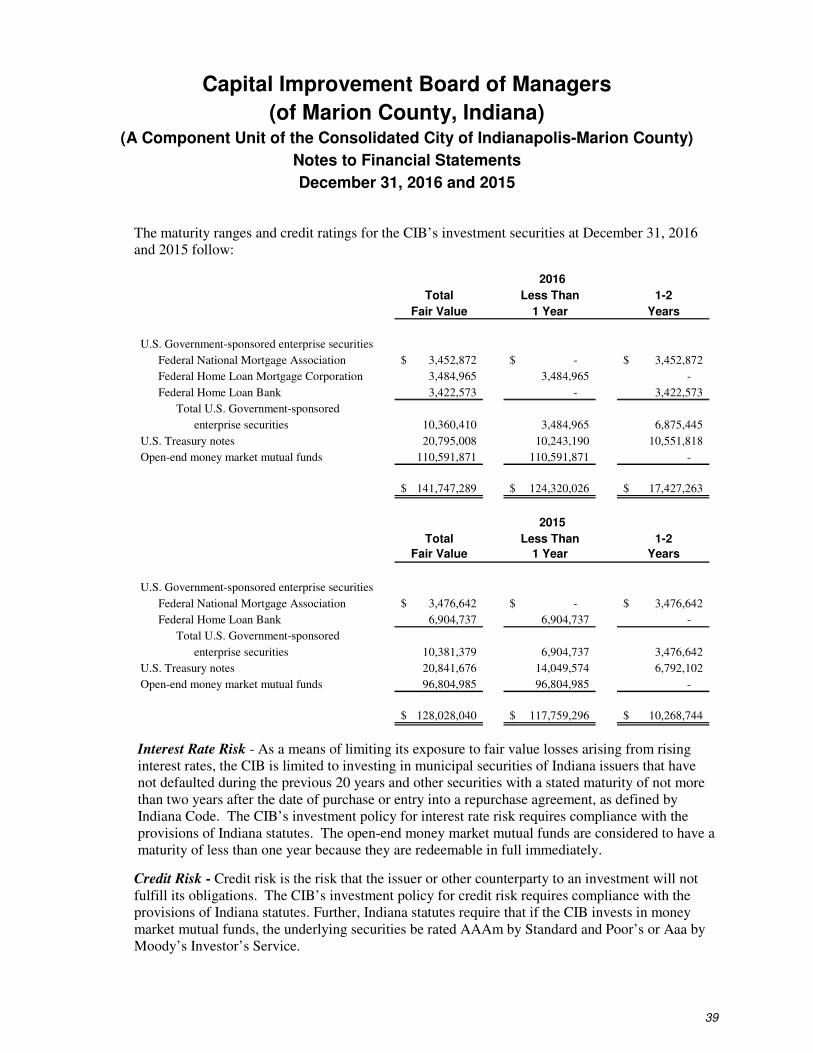
39
Capital Improvement Board of Managers
(of Marion County, Indiana) (A Component Unit of the Consolidated City of Indianapolis-Marion County)
Notes to Financial Statements
December 31, 2016 and 2015
The maturity ranges and credit ratings for the CIB’s investment securities at December 31, 2016 and 2015 follow:
Total Less Than 1-2
Fair Value 1 Year Years
U.S. Government-sponsored enterprise securities
Federal National Mortgage Association 3,452,872$ -$ 3,452,872$
Federal Home Loan Mortgage Corporation 3,484,965 3,484,965 -
Federal Home Loan Bank 3,422,573 - 3,422,573
Total U.S. Government-sponsored
enterprise securities 10,360,410 3,484,965 6,875,445
U.S. Treasury notes 20,795,008 10,243,190 10,551,818
Open-end money market mutual funds 110,591,871 110,591,871 -
141,747,289$ 124,320,026$ 17,427,263$
2016
Total Less Than 1-2
Fair Value 1 Year Years
U.S. Government-sponsored enterprise securities
Federal National Mortgage Association 3,476,642$ -$ 3,476,642$
Federal Home Loan Bank 6,904,737 6,904,737 -
Total U.S. Government-sponsored
enterprise securities 10,381,379 6,904,737 3,476,642
U.S. Treasury notes 20,841,676 14,049,574 6,792,102
Open-end money market mutual funds 96,804,985 96,804,985 -
128,028,040$ 117,759,296$ 10,268,744$
2015
Interest Rate Risk - As a means of limiting its exposure to fair value losses arising from rising interest rates, the CIB is limited to investing in municipal securities of Indiana issuers that have not defaulted during the previous 20 years and other securities with a stated maturity of not more than two years after the date of purchase or entry into a repurchase agreement, as defined by Indiana Code. The CIB’s investment policy for interest rate risk requires compliance with the provisions of Indiana statutes. The open-end money market mutual funds are considered to have a maturity of less than one year because they are redeemable in full immediately.
Credit Risk - Credit risk is the risk that the issuer or other counterparty to an investment will not fulfill its obligations. The CIB’s investment policy for credit risk requires compliance with the provisions of Indiana statutes. Further, Indiana statutes require that if the CIB invests in money market mutual funds, the underlying securities be rated AAAm by Standard and Poor’s or Aaa by Moody’s Investor’s Service.

40
Capital Improvement Board of Managers
(of Marion County, Indiana) (A Component Unit of the Consolidated City of Indianapolis-Marion County)
Notes to Financial Statements
December 31, 2016 and 2015
Custodial Credit Risk - For an investment, custodial credit risk is the risk that, in the event of the failure of the counterparty, the CIB will not be able to recover the value of its investments or collateral securities that are in the possession of an outside party. The CIB’s open-end money market mutual funds are not subject to custodial credit risk at December 31, 2016 and 2015, as their existence is not evidenced by securities that exist in physical or book entry form. The CIB’s investment policy does not address how investment securities and securities underlying repurchase agreements are to be held.
Concentration of Credit Risk - The CIB places no limit on the amount that may be invested in any one issuer.
Foreign Currency Risk - This risk relates to adverse effects on the fair value of an investment from changes in exchange rates. The CIB’s investment policy prohibits foreign investments.
Summary of Carrying Values
Deposits and investment securities included in the statements of net position are classified as follows:
2016 2015
Carrying value
Deposits 91,446,459$ 87,414,880$
Investments 141,747,289 128,028,040
233,193,748$ 215,442,920$
Cash and cash equivalents
Current - unrestricted 110,839,621$ 101,790,247$
Current - restricted 91,198,709 82,429,618
Total cash and cash equivalents 202,038,330 184,219,865
Investment securities
Current - unrestricted 31,155,418 31,223,055
Total investment securities 31,155,418 31,223,055
233,193,748$ 215,442,920$
Investment Income
Investment income for the year ended December 31, 2016 and 2015 consisted of:
2016 2015
Interest and dividend income 632,005$ 371,195$

41
Capital Improvement Board of Managers
(of Marion County, Indiana) (A Component Unit of the Consolidated City of Indianapolis-Marion County)
Notes to Financial Statements
December 31, 2016 and 2015
Cash, cash equivalents and investment securities are restricted as follows:
2016 2015
Operating reserve - rental deposits 2,383,647$ 1,789,448$
Bid fund 817,858 540,000
Bond fund 7,136,979 7,075,859
Renewal and replacement 5,000,000 5,000,000
Stadium and convention center sublease accounts 26,594,248 25,408,721
Stadium and convention center sublease reserve account 44,432,455 37,728,025
Box office 3,731,995 4,215,344
Baseball capital improvement fund 14,018 672,221
Meridian Center parking fund 1,087,509 -
91,198,709$ 82,429,618$
Note 3: Capital Assets
A summary of changes to capital assets for the year ended December 31, 2016 and 2015 follows:
Beginning Ending
Balance Transfers Transfers Balance
January 1, and and December 31,
2016 Additions Disposals 2016
Capital assets, not being depreciated:
Land and land improvements 131,608,147$ -$ (1,753,519)$ 129,854,628$
Construction in progress 5,114,855 182,965 (5,114,855) 182,965
Total capital assets, not being depreciated 136,723,002 182,965 (6,868,374) 130,037,593
Capital assets, being depreciated:
Buildings and improvements 1,311,693,807 20,080,523 (37,731,794) 1,294,042,536
Land improvements 6,162,050 420,762 (574,664) 6,008,148
Equipment, furniture and fixtures and other 116,091,037 4,346,096 (3,953,527) 116,483,606
Total capital assets, being depreciated 1,433,946,894 24,847,381 (42,259,985) 1,416,534,290
Less accumulated depreciation for:
Buildings and improvements (319,909,604) (38,713,670) 22,923,547 (335,699,727)
Land improvements (4,644,709) (279,049) 466,464 (4,457,294)
Equipment, furniture and fixtures and other (77,347,508) (8,152,381) 3,431,117 (82,068,772)
Total accumulated deprecation (401,901,821) (47,145,100) 26,821,128 (422,225,793)
Total capital assets, being depreciated, net 1,032,045,073 (22,297,719) (15,438,857) 994,308,497
Capital assets, net 1,168,768,075$ (22,114,754)$ (22,307,231)$ 1,124,346,090$
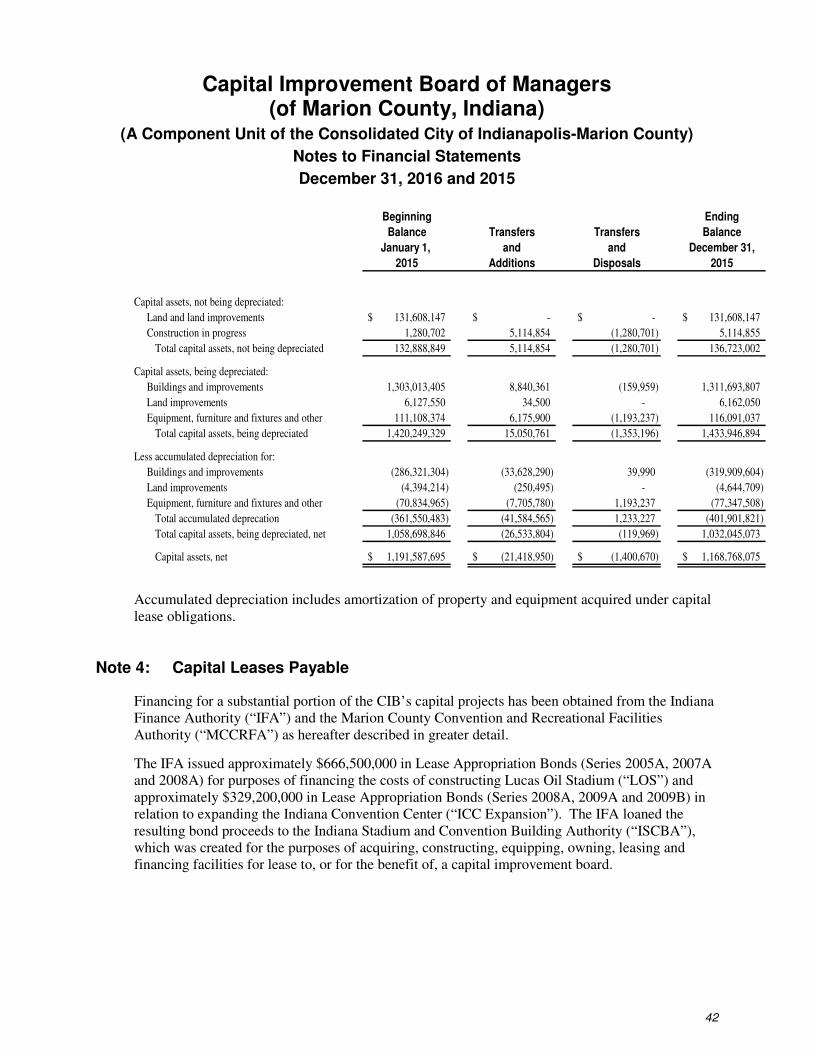
42
Capital Improvement Board of Managers (of Marion County, Indiana)
(A Component Unit of the Consolidated City of Indianapolis-Marion County)
Notes to Financial Statements
December 31, 2016 and 2015
Beginning Ending
Balance Transfers Transfers Balance
January 1, and and December 31,
2015 Additions Disposals 2015
Capital assets, not being depreciated:
Land and land improvements 131,608,147$ -$ -$ 131,608,147$
Construction in progress 1,280,702 5,114,854 (1,280,701) 5,114,855
Total capital assets, not being depreciated 132,888,849 5,114,854 (1,280,701) 136,723,002
Capital assets, being depreciated:
Buildings and improvements 1,303,013,405 8,840,361 (159,959) 1,311,693,807
Land improvements 6,127,550 34,500 - 6,162,050
Equipment, furniture and fixtures and other 111,108,374 6,175,900 (1,193,237) 116,091,037
Total capital assets, being depreciated 1,420,249,329 15,050,761 (1,353,196) 1,433,946,894
Less accumulated depreciation for:
Buildings and improvements (286,321,304) (33,628,290) 39,990 (319,909,604)
Land improvements (4,394,214) (250,495) - (4,644,709)
Equipment, furniture and fixtures and other (70,834,965) (7,705,780) 1,193,237 (77,347,508)
Total accumulated deprecation (361,550,483) (41,584,565) 1,233,227 (401,901,821)
Total capital assets, being depreciated, net 1,058,698,846 (26,533,804) (119,969) 1,032,045,073
Capital assets, net 1,191,587,695$ (21,418,950)$ (1,400,670)$ 1,168,768,075$
Accumulated depreciation includes amortization of property and equipment acquired under capital lease obligations.
Note 4: Capital Leases Payable
Financing for a substantial portion of the CIB’s capital projects has been obtained from the Indiana Finance Authority (“IFA”) and the Marion County Convention and Recreational Facilities Authority (“MCCRFA”) as hereafter described in greater detail.
The IFA issued approximately $666,500,000 in Lease Appropriation Bonds (Series 2005A, 2007A and 2008A) for purposes of financing the costs of constructing Lucas Oil Stadium (“LOS”) and approximately $329,200,000 in Lease Appropriation Bonds (Series 2008A, 2009A and 2009B) in relation to expanding the Indiana Convention Center (“ICC Expansion”). The IFA loaned the resulting bond proceeds to the Indiana Stadium and Convention Building Authority (“ISCBA”), which was created for the purposes of acquiring, constructing, equipping, owning, leasing and financing facilities for lease to, or for the benefit of, a capital improvement board.
43
Capital Improvement Board of Managers
(of Marion County, Indiana) (A Component Unit of the Consolidated City of Indianapolis-Marion County)
Notes to Financial Statements
December 31, 2016 and 2015
In connection with the above, legislation was passed in 2005 by the State of Indiana, which generally increased the percentages and, in some cases, expanded the areas of application for certain existing excise taxes (“2005 New Excise Tax Revenues”), increased the amount of revenues to be captured within the existing Professional Sports Development Area (“2005 PSDA Revenues”) and established certain new fees. This legislation is further explained later in these notes.
The ISCBA leases the LOS and ICC Expansion through December 31, 2040 under separate Lease Agreements (“Stadium Lease Agreement” and “Convention Center Lease Agreement”) to the Indiana Office of Management and Budget (“IOMB”). The IOMB, in turn, subleases LOS and the ICC Expansion under separate Sublease Agreements (“Stadium Sublease Agreement” and “Convention Center Sublease Agreement”) to the CIB.
Sublease rentals are payable solely from, and are secured exclusively by a pledge of, the 2005 New Excise Tax Revenues, the 2005 PSDA Revenues and certain fees as later described in these notes, and starting in 2028 (following retirement of the previously outstanding lease and bond obligations of the CIB), certain of the CIB’s existing state and local tax assistance revenues. Such amounts are pledged in accordance with an Amended and Restated Stadium and Convention Special Fund Revenue Deposit Agreement between the CIB, IOMB, the ISCBA, the IFA, the Indiana State Budget Director and the Deposit Trustee. Payment by the Deposit Trustee to the Stadium Bond or Convention Center Bond Trustee for the purpose of paying sublease rental payments under the Subleases constitutes lease rentals under the Leases and payment of amounts due under the respective loan agreements.
MCCRFA was created pursuant to IC 36-10-9.1 and is authorized thereunder to acquire one or more capital improvements from the CIB or other local governments, by purchase or lease and to fund or refund indebtedness incurred on account of such capital improvements to enable the respective government to make a savings on its debt service obligations.
Pursuant to its Master Lease Agreement with MCCRFA, the CIB is leasing a portion of the Indiana Convention Center through June 1, 2029. Under a separate Master Lease Agreement II, the CIB is leasing Bankers Life Fieldhouse (a multi-purpose arena) and an adjacent parking garage.

44
Capital Improvement Board of Managers
(of Marion County, Indiana) (A Component Unit of the Consolidated City of Indianapolis-Marion County)
Notes to Financial Statements
December 31, 2016 and 2015
Under each of the Master Lease and Sublease Agreements, the CIB has the option to purchase the leased facilities at a price equal to the amount required to provide for payment or redemption of all related outstanding debt obligations. Also, the CIB is obligated to pay certain expenses and all costs to operate, insure and maintain the leased facilities. The CIB’s Master Lease and Sublease payment obligations are payable from and secured by a pledge of certain state and local taxes to be received by the CIB. Certain lease obligations have specific or senior liens on some of the state and local taxes.
A number of MCCRFA bond refundings have resulted in the restructuring of the CIB’s Master Lease Agreements with MCCRFA. These transactions are described in the paragraphs that follow.
In May 2012, the CIB recorded a deferred outflow of resources of $1,959,928 on the restructuring of its Master Lease Agreement with MCCRFA, which will be amortized over the period ending 2021. The restructuring was the result of the issuance of MCCRFA’s Excise Taxes Lease Rental Revenue Refunding Senior Bonds, Series 2012A (the “2012A Senior Bonds”). The 2012A Senior Bonds were issued to refund a portion of MCCRFA’s Excise Taxes Lease Rental Revenue Refunding Senior Bonds, Series 2003A. As a result of this refunding transaction, the CIB was able to restructure its lease obligation to MCCRFA and reduce its aggregate debt service payments by approximately $3,000,000 and obtain an economic gain (difference between the present values of the old and new debt service payments) of approximately $2,950,000.
In relation to a 2003 refunding transaction for MCCRFA, the CIB recorded a deferred inflow of resources of $2,445,312 on the restructuring of its Master Lease Agreement with MCCRFA, which was being amortized into income over the period ending in 2021. Due to the aforementioned 2012 refunding, $675,456 of the then unamortized balance of $809,010 of the 2003 deferred inflow of resources was included in the determination of the 2012 deferred outflow of resources on the restructuring of the Master Lease Agreement.
In November 2011, the CIB recorded a deferred inflow of resources of $12,340,306 on the restructuring of its Master Lease Agreement II with MCCRFA, which will be amortized into income over the period ending 2026. The restructuring was the result of the issuance of MCCRFA’s Excise Taxes Lease Rental Revenue Refunding Subordinate Bonds, Series 2011A (the “2011A Subordinate Bonds”). The 2011A Subordinate Bonds were issued to refund MCCRFA’s Excise Taxes Lease Rental Revenue Refunding Subordinate Bonds, Series 1997A. As a result of this refunding transaction, the CIB was able to restructure its lease obligation to MCCRFA and reduce its aggregate debt service payments by approximately $11,640,000 and obtain an economic gain (difference between the present values of the old and new debt service payments) of approximately $11,320,000.

45
Capital Improvement Board of Managers
(of Marion County, Indiana) (A Component Unit of the Consolidated City of Indianapolis-Marion County)
Notes to Financial Statements
December 31, 2016 and 2015
In June 2011, the CIB recorded a deferred inflow of resources of $910,000 on the restructuring of its Master Lease Agreement with MCCRFA, which will be amortized into income over the period ending in 2026. The restructuring was the result of the issuance of MCCRFA’s Excise Taxes Lease Rental Revenue Refunding Senior Bonds, Series 2011B (“2011B Senior Bonds”). The 2011B Senior Bonds were issued to refund MCCRFA’s Excise Taxes Lease Rental Revenue Refunding Senior Bonds, Series 1997A. As a result of this refunding transaction, the CIB was able to restructure its lease obligation to MCCRFA and reduce its aggregate debt service payments by approximately $1,590,000 and obtain an economic gain (difference between the present values of the old and new debt service payments) of approximately $1,050,000.
In April 2011, the CIB recorded a deferred inflow of resources of $2,100,896 on the restructuring of its Master Lease Agreement with MCCRFA, which will be amortized into income over the period ending in 2020. The restructuring was the result of the issuance of MCCRFA’s Excise Taxes Lease Rental Revenue Refunding Senior Bonds, Series 2011A (“2011A Senior Bonds”). The 2011A Senior Bonds were issued to refund MCCRFA’s Excise Taxes Lease Rental Revenue Refunding Senior Bonds, Series 2001A. As a result of this refunding transaction, the CIB was able to restructure its lease obligation to MCCRFA and reduce its aggregate debt service payments by approximately $3,200,000 and obtain an economic gain (difference between the present values of the old and new debt service payments) of approximately $3,080,000.
Assets held under these capital leases include substantially all of the CIB’s land and depreciable capital assets. See Note 3 for a breakdown of assets by major asset class.
Future minimum lease payments at December 31, 2016, together with the present value of the net minimum lease payments, are as follows:
2017 81,889,671$
2018 85,452,032
2019 86,525,533
2020 85,516,503
2021 85,435,400
2022-2026 426,771,393
2027-2031 301,451,393
2032-2036 287,526,143
2037-2039 60,217,636
1,500,785,704
Amount representing interest (468,444,521)
Present value of minimum lease payments 1,032,341,183
Current portion of capital lease obligations (38,736,131)
Total long-term portion of capital lease obligations 993,605,052$

46
Capital Improvement Board of Managers
(of Marion County, Indiana) (A Component Unit of the Consolidated City of Indianapolis-Marion County)
Notes to Financial Statements
December 31, 2016 and 2015
Note 5: Long-Term Debt
Long-term debt of the CIB (excluding capital lease obligations) consists of the following:
Junior Subordinate Notes
Under a borrowing arrangement executed in 1998, certain civic-minded local businesses (“Junior Lenders”) began lending to the CIB pursuant to junior notes certain funds paid to them from Circle Center Limited Partnership (an activity and investment that had civic origins and was unrelated to the CIB) for the purpose of assisting with the financing of Bankers Life Fieldhouse and other CIB activities. The Junior Lenders lent certain income and other proceeds that they received from their respective interests in Circle Centre Partners Limited Partnership. These notes were issued as junior obligations with a payment right similar to MCCRFA’s bondholders except they are, in all respects, subordinate.
The notes mature on December 31, 2017, with interest at a per annum rate equal to a rolling monthly average of the yield on 13-week United States Treasury Bills. Interest is payable annually. The notes can be prepaid at the CIB’s option at any time without penalty.
During 2016, no additional borrowing under such loans occurred but two of the junior lenders forgave their notes in the aggregate amount of $1,043,000. During 2015, no additional borrowing under such loans occurred but one of the junior lenders forgave his note in the amount of $517,000. The aggregate balance of these loans at December 31, 2016 and 2015 is $32,199,000 and $33,242,000, respectively. Accrued and unpaid interest on these notes at December 31, 2016 and 2015 amounted to $101,561 and $15,754, respectively.
Series 1999A Bonds
During 1999, the CIB issued $25,805,000 of Excise Taxes Revenue Subordinate Bonds, Series 1999A (the “1999A Subordinate Bonds”), and $23,800,000 of Excise Taxes Revenue Subordinate Refunding Notes, Series 1999A (collectively, the “1999 Subordinate Bonds”). A portion of the proceeds from these debt issues was used to finance certain renovations and improvements to the Indiana Convention Center and the CIB’s former domed stadium facility, while the remaining proceeds were used to prepay a prior loan to the Colts. The Subordinate Refunding Notes were paid off in 2008. Information regarding the remaining Series 1999A Subordinate Bonds at December 31, 2016 and 2015 follows:
2016 2015
Term bonds, maturing June 1, 2017 to June 1, 2021. Interest at
5.00%, due semiannually on June 1 and December 1 11,520,000$ 13,435,000$
Unamortized discount (17,880) (26,144)
Total Series 1999A Subordinate Bonds 11,502,120$ 13,408,856$

47
Capital Improvement Board of Managers
(of Marion County, Indiana) (A Component Unit of the Consolidated City of Indianapolis-Marion County)
Notes to Financial Statements
December 31, 2016 and 2015
Treasurer of State Junior Subordinate Notes
The CIB entered into a Note Purchase Agreement with the Treasurer of the State of Indiana. On December 15, 2009, the CIB completed an initial State Treasurer Loan and issued a note (“2009 Note”) in the amount of $9,000,000, bearing interest at a per annum rate of 5.25 percent with a maturity date of December 15, 2019. The note was reissued in July 2010 with an interest rate of 4.25 percent and again in November 2011 with an interest rate of 3 percent. The outstanding principal balance on the 2009 Note was paid in full during 2015.
On December 15, 2010, the CIB completed a second State Treasurer Loan and issued a note (“2010 Note”) in the amount of $9,000,000, bearing interest at 3.46 percent with a maturity date of December 15, 2020. This note was reissued in November 2011 with an interest rate of 3 percent. Interest payments are required to be made annually thereafter on each December 1.
During 2015, the CIB established a bid fund, in accordance with Indiana Code 5-13-10.5-18 (as amended), to be used to assist the CIB, the Indianapolis Convention and Visitors Association (“Visit Indy, Inc.”) or the Indiana Sports Corporation in securing conventions, sporting events and other special events. In conjunction with the creation of the bid fund, the outstanding principal balance on the 2009 Note was required to be paid in full. Additionally, the interest payments due on the 2009 Note (had such note not been prepaid in 2015) were placed into the bid fund.
Also in conjunction with the creation of the bid fund as described above, all principal and interest payments that would otherwise be made on the 2010 Note shall be deposited into the bid fund, on an annual basis. The term of the 2010 Note was also extended from 2020 to 2025. If the CIB deposits amounts into the bid fund equal to the payments of principal and interest that would otherwise be due under the repayment schedule on the 2010 Note, the CIB is only required to repay the principal amount of the obligation to the Treasurer of the State of Indiana.
The debt service requirements to maturity for long-term debt of the CIB (excluding capital lease obligations) are as follows at December 31, 2016:
Principal Interest* Total
2017 34,209,000$ 995,750$ 35,204,750$
2018 2,115,000 692,625 2,807,625
2019 2,220,000 584,250 2,804,250
2020 2,330,000 470,500 2,800,500
2021 2,845,000 341,125 3,186,125
2022-2025 9,000,000 1,090,500 10,090,500
52,719,000$ 4,174,750$ 56,893,750$
*Interest component of debt service requirements above include the required annual interest amounts that must be placed into the bid fund on the 2010 Treasurer of State Junior Subordinate Note.

48
Capital Improvement Board of Managers
(of Marion County, Indiana) (A Component Unit of the Consolidated City of Indianapolis-Marion County)
Notes to Financial Statements
December 31, 2016 and 2015
Note 6: Changes in Long-Term Obligations
The following is a summary of long-term obligation transactions for the CIB for the years ended December 31, 2016 and 2015:
Balance Balance
January 1, December 31, Current
2016 Additions Reductions 2016 Portion
Long-term obligations
Junior Subordinate Notes 33,242,000$ -$ (1,043,000)$ 32,199,000$ 32,199,000$
Subordinate Bonds, Series 1999A 13,435,000 - (1,915,000) 11,520,000 2,010,000
Treasurer of State Junior
Subordinate Notes, Series 2010A 9,000,000 - - 9,000,000 -
Capital Leases 1,066,752,122 16,100 (34,427,039) 1,032,341,183 38,736,131
Bond Discount (26,144) - 8,264 (17,880) -
Grant Payable 4,000,000 - (500,000) 3,500,000 500,000
1,126,402,978$ 16,100$ (37,876,775)$ 1,088,542,303$ 73,445,131$
Balance Balance
January 1, December 31, Current
2015 Additions Reductions 2015 Portion
Long-term obligations
Junior Subordinate Notes 33,759,000$ -$ (517,000)$ 33,242,000$ -$
Subordinate Bonds, Series 1999A 15,260,000 - (1,825,000) 13,435,000 1,915,000
Treasurer of State Junior
Subordinate Notes, Series 2009A 9,000,000 - (9,000,000) - -
Treasurer of State Junior
Subordinate Notes, Series 2010A 9,000,000 - - 9,000,000 -
Capital Leases 1,097,569,587 14,616 (30,832,081) 1,066,752,122 34,427,040
Bond Discount (35,782) - 9,638 (26,144) -
Grant Payable 4,500,000 - (500,000) 4,000,000 500,000
1,169,052,805$ 14,616$ (42,664,443)$ 1,126,402,978$ 36,842,040$

49
Capital Improvement Board of Managers
(of Marion County, Indiana) (A Component Unit of the Consolidated City of Indianapolis-Marion County)
Notes to Financial Statements
December 31, 2016 and 2015
Note 7: State and Local Taxes and Other Assistance
A summary of the various sources of state and local taxes and other assistance received by the CIB follows. These include certain Excise Taxes, PSDA Revenues, Ticket Fees, Specialty License Plate Fees and interlocal funding.
Excise Taxes consist of the Marion County Innkeeper’s Tax, the Marion County Food and Beverage Tax, the Marion County Admissions Tax, the Marion County Supplemental Auto Rental Excise Tax, the Regional County Food and Beverage Tax and the Indiana Cigarette Tax, all of which are described in greater detail below.
Marion County Innkeeper’s Tax
Since 1997, a 6 percent Marion County Innkeeper’s Tax (the “Original Marion County Innkeeper’s Tax”) has been levied on every person engaged in the business of renting or furnishing, for periods of less than 30 days, any lodgings in any hotel, motel, inn, tourist camp, tourist cabin, or any other place in which lodgings are regularly furnished for a consideration. This tax is applied in addition to the Indiana Gross Retail and Use Taxes imposed under these circumstances. In accordance with IC 6-9-8 (as amended), one-sixth of the Innkeeper’s Tax of 6 percent is to be used solely to fund lease rental payments (Senior or Subordinate) or other obligations related to convention center expansion projects.
The Marion County Innkeeper’s Tax was increased in 2005 by an additional 3 percent (the “2005 Marion County Innkeeper’s Tax”) and again in 2009 (effective September 1, 2009) by an additional 1 percent (the “2009 Marion County Innkeeper’s Tax”).
Marion County Food and Beverage Tax
Since 1981, a 1 percent Marion County Food and Beverage Tax (the “Original Marion County Food and Beverage Tax”) has been imposed on the gross retail income received by a retail merchant from any transaction within Marion County in which food or beverage is furnished, prepared or served. However, it does not apply to transactions exempt from Indiana Gross Retail Tax, as defined under Indiana statutes.
The Marion County Food and Beverage Tax was increased in 2005 by an additional 1 percent (the “2005 Marion County Food and Beverage Tax”).
50
Capital Improvement Board of Managers
(of Marion County, Indiana) (A Component Unit of the Consolidated City of Indianapolis-Marion County)
Notes to Financial Statements
December 31, 2016 and 2015
Marion County Admissions Tax
Since 1997, a 5 percent Marion County Admissions Tax (the “Original Marion County Admissions Tax”) has been imposed on each person who pays a price of admission to certain events held in a facility financed in whole or in part by bonds or notes issued under IC 18-4-17 (before its repeal), IC 36-10-9 or IC 36-10-9.1. As stated in IC 6-9-13, the tax equals 5 percent of the price of admissions to such an event and is paid with the price of admission. Generally, events sponsored by educational, religious, political and charitable organizations are exempt.
The Marion County Admissions Tax was increased in 2005 by an additional 1 percent (the “2005 Marion County Admissions Tax”), and again in 2013 (effective March 1, 2013) by an additional 4 percent (the “2013 Marion County Admissions Tax”).
Marion County Supplemental Auto Rental Excise Tax
Since 1997, a 2 percent Marion County Supplemental Auto Rental Excise Tax (the “Original Marion County Supplemental Auto Rental Excise Tax”) has been imposed under IC 6-6-9.7 on the rental of certain passenger motor vehicles and trucks at a rate equal to 2 percent of the gross retail income received by a retail merchant for the rental. Certain exclusions apply.
The Marion County Supplemental Auto Rental Excise Tax was increased in 2005 by an additional 2 percent (the “2005 Marion County Supplemental Auto Rental Excise Tax”). Additionally, it was increased in 2013 (effective March 1, 2013) by an additional 2 percent (the “2013 Marion County Supplemental Auto Rental Excise Tax”).
Regional County Food and Beverage Tax
In 2005, a 1 percent Regional County Food and Beverage Tax was established (the “2005 Regional County Food and Beverage Tax”) by six of the counties surrounding Marion County, those being Boone, Johnson, Hamilton, Hancock, Hendricks and Shelby. The food and beverage tax, equal to 1 percent, is imposed on the gross retail income resulting from any transaction in which food or beverage is furnished, prepared or served by a retail merchant for consideration and for consumption at a location, or on equipment, provided by the retail merchant, including transactions in which food or beverage is served by a retail merchant off its premises. This tax is in addition to the Indiana Gross Retail Tax.
As long as there are any obligations owed by the CIB to the ISCBA or any state agency under a lease or other agreement entered into between the CIB and the ISCBA or any state agency, the CIB receives one-half of the amounts received from the 1 percent Regional County Food and Beverage Tax up to annual maximum of $5 million.
51
Capital Improvement Board of Managers
(of Marion County, Indiana) (A Component Unit of the Consolidated City of Indianapolis-Marion County)
Notes to Financial Statements
December 31, 2016 and 2015
Indiana Cigarette Tax
IC 6-7 provides that the CIB shall receive $350,000 annually from receipts of the Indiana Cigarette Tax. This tax is levied on each person who first sells, uses, consumes, handles or distributes cigarettes. The rate of tax depends upon the weight of the cigarettes and also applies to all cigarette papers, wrappers or tubes made or prepared for the purpose of making cigarettes to be sold, exchanged, bartered, given away or otherwise disposed of within Indiana.
Original Excise Tax Revenues
The Original Marion County Innkeeper’s Tax, Original Marion County Food and Beverage Tax, Original Marion County Admissions Tax, Original Marion County Supplemental Auto Rental Excise Tax and the CIB’s Indiana Cigarette Tax receipts (collectively, the “Original Excise Tax Revenues”) are distributed to the CIB and are used to pay its outstanding obligations (other than those relating to LOS and the ICC Expansion) and otherwise further its operating purposes.
2005 New Tax Revenues
The 2005 Marion County Innkeeper’s Tax, 2005 Marion County Food and Beverage Tax, 2005 Marion County Admissions Tax, 2005 Marion County Supplemental Auto Rental Excise Tax and 2005 Regional County Food and Beverage Tax receipts and, starting in 2028 following retirement of the previously outstanding lease and bond obligations of the CIB, certain of the CIB’s original state and local assistance tax revenues (collectively, the “2005 New Tax Revenues”), are to be distributed to the CIB and used to pay obligations relating to LOS and the ICC Expansion.
Professional Sports Development Area Revenues
Pursuant to IC 36-7-31, the Metropolitan Development Commission of the City of Indianapolis, Indiana, and of Marion County, Indiana (the “Commission”), may establish a professional sports development area which may include any facility (a) used in the training of a team engaged in professional sports events, or (b) financed in whole or in part by notes or bonds issued by a political subdivision or issued under the CIB’s or the IFA’s enabling act and used to hold a professional sporting event. Certain state and local taxes generated in the area are allocated to a professional sports development area fund and can be used to finance the construction and equipping of a designated capital improvement used for a professional sporting event. The taxes which may be allocated to the PSDA Fund include the Indiana Gross Retail Tax, the Indiana Use Tax, the Indiana Adjusted Gross Income Tax imposed on an individual, the Marion County Option Income Tax and the 2 percent Marion County Food and Beverage Tax as previously described (the “Covered Taxes”).

52
Capital Improvement Board of Managers
(of Marion County, Indiana) (A Component Unit of the Consolidated City of Indianapolis-Marion County)
Notes to Financial Statements
December 31, 2016 and 2015
In 1997, the Commission adopted a resolution establishing the Marion County PSDA and the State Budget Agency approved such resolution. All Covered Taxes generated within the designated area are to be deposited into the PSDA Fund (the “Original PSDA Revenues”); provided, however, that the total amount of state revenue (i.e., Indiana Gross Retail Tax, Indiana Use Tax and Indiana Adjusted Gross Income Tax) captured by the PSDA may not exceed $5,000,000 per year for 20 consecutive years (the “State PSDA Cap”). The Original PSDA Revenues are distributed to the CIB to be used to pay obligations relating to Bankers Life Fieldhouse.
In 2005, the PSDA was expanded to include the LOS site such that, commencing July 1, 2007, there may be captured in the PSDA up to $11,000,000 per year in Covered Taxes comprising state revenues for up to 34 consecutive years ending December 31, 2040 (the “PSDA Revenues Increase”) in addition to the up to $5,000,000 in Covered Taxes comprising state revenues originally to be captured in the PSDA. Such action also permitted the original $5,000,000 per year State PSDA Cap to be extended beyond the original 20 years (which would have expired in 2017) to January 1, 2041 (the “Post-2017 Original PSDA Revenues”), so that the maximum amount of state revenue that may be captured by the PSDA is $16,000,000 per year. The Post-2017 Original PSDA Revenues and the PSDA Revenues Increase are collectively referred to as the 2005 PSDA Revenues. The 2005 PSDA Revenues are distributed to the CIB to be used to pay obligations relating to LOS and the ICC Expansion.
The Covered Taxes to be collected within the tax area include the following:
Descriptions of Tax IC Section Current Rate
Indiana Gross Retail Tax 6-2.5-2-2 7.00%
(generally)
Indiana Use Tax 6-2.5-3-3 7.00%
(generally)
Indiana Adjusted Gross 6-3-2-1 3.30%
Income Tax for Individuals
Marion County Option 6-3.5-6-8 1.77%
Income Tax for Individuals (resident rate)
0.4425%
(nonresident rate)
Marion County Food and Beverage Tax 6-9-12-5 2%

53
Capital Improvement Board of Managers
(of Marion County, Indiana) (A Component Unit of the Consolidated City of Indianapolis-Marion County)
Notes to Financial Statements
December 31, 2016 and 2015
The Indiana Gross Retail Tax is imposed on all retail transactions made in Indiana. The person acquiring property in Indiana is liable for the tax, but retail merchants are responsible for collecting the tax. The Indiana Gross Retail Tax is imposed, at the time of sale, on the amount of gross retail income received by the retail merchant.
The Indiana Use Tax is imposed on the storage, use, or consumption of tangible personal property in Indiana. The Indiana Use Tax is similar to the Indiana Gross Retail Tax in that it is measured by the gross retail income received from a retail transaction and is computed using the same rates.
The Indiana Adjusted Gross Income Tax is imposed on both individuals (resident and nonresident) and corporations. The tax is applied to the adjusted gross income, as defined under Indiana statutes, of all resident individuals and to the part of the adjusted gross income derived from sources within Indiana of all nonresident individuals.
The Marion County Option Income Tax is imposed on the Indiana adjusted gross income of individual resident and nonresident county taxpayers of Marion County.
As noted previously, the Marion County Food and Beverage Tax is generally imposed on the gross retail income received by a retail merchant from any transaction within Marion County in which food or beverage is furnished, prepared or served.
The total amount of Indiana Gross Retail Tax, Indiana Use Tax and Indiana Adjusted Gross Income Tax for Individuals to be captured and deposited into the PSDA fund is limited. However, Marion County taxes are not limited.
In 2009, the Commission adopted a resolution expanding the Marion County PSDA and the State Budget Agency approved such resolution. The Commission resolution designates certain hotel, motel, or multi-brand complex of hotels and motels with significant meeting space that are located in the 2009 Tax Area Addition. By this designation and effective July 1, 2009, all Covered Taxes (except for Marion County Food and Beverage Taxes) generated from such hotel and motel facilities in the 2009 Tax Area Addition (the “2009 PSDA Revenues”) are captured and distributed to the CIB to be used to pay operating expenses of the CIB facilities; provided, however, that the total amount captured by the PSDA expansion may not exceed $8,000,000 per year. The 2009 Tax Area Addition designation expires January 1, 2041.
The expanded PSDA currently includes: (1) Bankers Life Fieldhouse, (2) the Indiana Convention Center & Lucas Oil Stadium, (3) Victory Field, (4) the Indianapolis Colts Practice Facility and (5) the area in Indianapolis bounded on the east by Illinois Street, on the south by Maryland Street, and on the west and north by Washington Street, as those streets were located on June 1, 2009 (the “2009 Tax Area Addition”).

54
Capital Improvement Board of Managers
(of Marion County, Indiana) (A Component Unit of the Consolidated City of Indianapolis-Marion County)
Notes to Financial Statements
December 31, 2016 and 2015
2009 New Tax Revenues
The new 2009 Marion County Innkeeper’s Tax receipts and 2009 PSDA Revenues (collectively, “the 2009 New Tax Revenues”) are to be distributed to the CIB and are restricted to paying operating expenses of the CIB facilities.
2013 New Tax Revenues
The new 2013 Marion County Admissions Tax and 2013 Marion County Supplemental Auto Rental Excise Tax receipts are to be distributed to the CIB and are restricted to paying operating expenses of the CIB facilities.
In connection with a Public Safety Support Agreement dated March 1, 2013, between the CIB and the Consolidated City of Indianapolis-Marion County, the CIB paid to the Consolidated City of Indianapolis-Marion County 100 percent of the revenue from these increases for the first twelve months the increases were in effect. Thereafter, the CIB is to pay to the Consolidated City of Indianapolis-Marion County 25 percent of the revenue from these increases, but not to exceed $3,000,000 annually. The term of the Public Safety Support Agreement extends to February 28, 2017 and thereafter automatically renews for additional four-year periods until terminated.
Specialty License Plate Fees
The Indiana Bureau of Motor Vehicles issues a National Football League franchised football team license plate as a specialty group recognition license plate, featuring the name and logo of the Indianapolis Colts. An annual fee of twenty dollars ($20) is charged for the license plate in addition to standard license plate fees and is collected by the Indiana Bureau of Motor Vehicles at the time the plate is sold.
Interlocal Agreement
In 2010, an Interlocal Cooperation Agreement was established pursuant to which the Metropolitan Development Commission of Marion County, Indiana, acting in its capacity as the Redevelopment Commission of the City of Indianapolis, Indiana (the “Redevelopment Commission”), provides $8,000,000 of funding annually to the CIB to further their mutual purposes, including to better assure the CIB’s funding sources for Visit Indy, Inc. Visit Indy, Inc. is an important body through which the convention and visitor industry and the commercial, industrial and cultural interests of Indianapolis and its citizens are promoted and publicized, including the CIB’s capital improvements. The CIB received $8,000,000 of funding in 2016 and 2015. The agreement renews annually and assumes the same terms and level of funding, subject to certain factors, including, the availability of funds, and unless either party gives a six-month termination notice prior to the end of the annual cycle.

55
Capital Improvement Board of Managers
(of Marion County, Indiana) (A Component Unit of the Consolidated City of Indianapolis-Marion County)
Notes to Financial Statements
December 31, 2016 and 2015
Summary of State and Local Taxes and Other Assistance
State and local taxes and other assistance received or accrued by the CIB in 2016 and 2015 include the following components:
2016 2015
Marion County food and beverage (1%) 25,949,205$ 23,855,213$
Innkeeper's tax (5%) 28,040,681 25,846,373
Innkeeper's tax (1%) 5,608,136 5,169,275
Auto rental excise tax (2%) 2,454,540 2,223,861
Admissions tax (5%) 6,651,843 6,559,420
Cigarette tax 350,000 350,000
PSDA tax allocation 8,753,020 7,895,163
Total Original Excise Taxes and Original PSDA Revenues 77,807,425 71,899,305
Marion County food and beverage (1%) 25,949,205 23,855,213
Regional food and beverage (1%) 5,016,616 5,167,191
Innkeeper's tax (3%) 16,824,409 15,507,824
Auto rental excise tax (2%) 2,454,540 2,223,861
Admissions tax (1%) 1,330,369 1,311,884
PSDA tax allocation 9,995,639 9,189,759
Total 2005 New Tax Revenues and 2005 PSDA Revenues 61,570,778 57,255,732
Innkeeper's tax (1%) 5,608,136 5,169,275
PSDA tax allocation 7,806,354 8,315,926
Total 2009 New Tax Revenues and 2009 PSDA Revenues 13,414,490 13,485,201
Auto rental excise tax (2%) 2,454,540 2,223,861
Admissions tax (4%) 5,321,475 5,247,536
Total 2013 New Tax Revenues 7,776,015 7,471,397
Specialty License Plate Fees 669,840 668,840
Interlocal Agreement Funding 8,000,000 8,000,000
Total State and Local Taxes and Other Assistance 169,238,548$ 158,780,475$
Total lease rental and other debt obligations paid with state and local taxes and fees for the year ended December 31, 2016 and 2015 amounted to $82,152,531 and $81,335,330, respectively.

56
Capital Improvement Board of Managers
(of Marion County, Indiana) (A Component Unit of the Consolidated City of Indianapolis-Marion County)
Notes to Financial Statements
December 31, 2016 and 2015
Note 8: Agreements With Pacers Basketball, LLC
During 1997, the CIB approved new Operating and Financial Agreements with Pacers Basketball, LLC (“Pacers”) that, among other things, governed the use of Bankers Life Fieldhouse. The agreements had a twenty-year initial term, commencing in 1999, with ten five-year extension options. In connection with these agreements, the Pacers received revenues from Fieldhouse operations, naming rights, signage, advertising and broadcast revenues and were responsible for making daily repairs to keep the facility operational. The CIB, however, was responsible for major repairs on the facility.
The Financial Agreement provided for targeted profitability for the Pacers. If this target was not reached, the CIB was required to reimburse the Pacers for certain operating expenses. In addition, the Pacers remained obligated, upon early termination of the Financial Agreement, to repay the CIB for advances made through 1999 for utility and maintenance costs of the CIB’s previous arena facility, Market Square Arena. At the conclusion of each NBA Season during the initial twenty-year term of the Financial Agreement, 5 percent of such cumulative advances were to be forgiven. At December 31, 2016 and 2015, the outstanding unamortized balance of advances aggregated $6,373,355 and $7,170,024, respectively.
In 2012 and 2010, the CIB, MCCRFA and the Pacers entered into amendments to the Operating Agreement which provided various amendatory and additional covenants. Under these amendments, the CIB agreed to provide three noninterest-bearing operating loans to the Pacers, which totaled $40,000,000. The loans were subject to certain approval, repayment and forgiveness provisions. The amendments also required the CIB to make capital improvements to Bankers Life Fieldhouse of up to $3,500,000.
During 2014, the CIB signed an Amended and Restated Operating Agreement with MCCRFA, Pacers Basketball, LLC and certain entities related to Pacers Basketball, LLC. This agreement, as further amended in 2015, supersedes the original Operating and Financial Agreements and related amendments. The initial term of the Amended and Restated Operating Agreement expires in 2024, with the Pacers possessing a unilateral option to extend the agreement for one year. The Amended and Restated Operating Agreement provides generally that the Pacers may terminate the agreement under certain circumstances as follows: (i) CIB’s failure to obtain, prior to any fiscal year, approval of an annual budget or other appropriation sufficient to satisfy its obligations under the Amended and Restated Operating Agreement, including its obligation to pay certain operating expense reimbursements (approximately $7,100,000 in year one with 3% annual increases), pay certain operating expense items, pay the video/sound system license fee (approximately $923,000 per year), fund its obligations with respect to scheduled capital repairs and replacements (aggregating $7,000,000) and fund its obligations with respect to refresh improvements (aggregating $26,500,000); (ii) CIB’s failure to pay (after receiving a final appropriation therefor) any operating expense reimbursements, operating expense items or video/sound system license for which it is responsible or the amount of any final non-appealable judgment rendered against the CIB under the Amended and Restated Operating Agreement; (iii) certain circumstances involving eminent domain, damage or destruction of the Fieldhouse; (iv) breach of the Pacers right to
57
Capital Improvement Board of Managers
(of Marion County, Indiana) (A Component Unit of the Consolidated City of Indianapolis-Marion County)
Notes to Financial Statements
December 31, 2016 and 2015
exclusively possess and operate the Fieldhouse; (v) default under the Fieldhouse lease related to the MCCRFA bonds that result in termination of such lease or possession by MCCRFA; (vi) CIB’s failure to honor any indemnity obligation under the Amended and Restated Operating Agreement or Parking Agreement and such obligation is found by a court to be unenforceable; (vii) CIB’s or MCCRFA’s failure to fulfill any material obligation under the Amended and Restated Operating Agreement or the related Parking Agreement and such obligation is found by a court to be unenforceable; (viii) certain circumstances following the death of Herbert Simon under which certain Pacers loans are called or matured, the Pacers are unable to obtain replacement financing on a non-recourse basis (with the assistance of the CIB if it so chooses) and the CIB does not successfully execute its right of first offer; (ix) certain circumstances under which the NBA ceases to exist and the Pacers do not join a successor or replacement professional basketball league.
Additionally, the operating agreement provides that a sale of shares, which would constitute a controlling interest in the Pacers, or the sale of substantially all of the assets of the Pacers, is subject to the CIB’s right of first refusal and, after the sale, the Pacers (or buyer, if sale of assets) will remain bound by the Amended and Restated Operating Agreement.
The Amended and Restated Operating Agreement also provides for scheduled annual forgiveness of previous operating loans that aggregated $40,000,000 to the Pacers, so long as no event of default remains outstanding. At December 31, 2016 and 2015, the outstanding note receivable balance was $28,000,000 and $34,000,000, respectively. During 2016 and 2015, $6,000,000 of this note was forgiven by the CIB in accordance with a mutually agreed-upon amortization schedule.
During 2015, the CIB entered into a Training Facility Use Agreement with Pacers Training Center, Inc. (an affiliate of the Pacers). This agreement grants Pacers Training Center, Inc. use of certain land, easements and existing improvements owned by CIB so that the Pacers may construct a state-of-the-art training and medical office facility that will facilitate development of downtown Indianapolis and the use of the Fieldhouse in furtherance of municipal purposes. The initial term of this agreement is 40 years at $1 per year, effective December 14, 2015 with one ten year renewal option. All maintenance costs will be the responsibility of Pacers Training Center, Inc., with the exception of maintaining a vehicular ramp, which will be the responsibility of the CIB. Upon the occurrence of a Termination Event or Special Termination Event, as defined in the Training Facility Use Agreement, the CIB may elect to exercise a purchase option on the facility. Additionally, under a Termination Event, the CIB retains an Occupancy Option that would provide for the surrender of all or a portion of the facility to the CIB in return for an annual occupancy fee.

58
Capital Improvement Board of Managers
(of Marion County, Indiana) (A Component Unit of the Consolidated City of Indianapolis-Marion County)
Notes to Financial Statements
December 31, 2016 and 2015
Note 9: Lease Agreement With the Indianapolis Colts
Effective September 1, 2005, the CIB and the Colts entered into a lease agreement (the “Colts Lease Agreement”). Under the Colts Lease Agreement, the CIB is to receive $250,000 annually from the Colts during the term of the agreement, provided that the Colts play at least ten pre-season, regular season or post-season games in Lucas Oil Stadium. If the Colts do not play at least ten games in the Stadium in any given NFL season, the annual rent will be reduced by $25,000 for each game below the ten-game minimum that is not played in Lucas Oil Stadium. Also, the Colts agreed to reimburse the CIB for any Day-of-Game Personnel Expenses (as defined in the Colts Lease Agreement). The CIB, in turn, agreed to reimburse the Colts for all ordinary and reasonable Day-of-Game Expenses (as defined in the Colts Lease Agreement). The CIB also agreed to pay the Colts $3,500,000 of annual revenues from Non-Colts Events (as defined in the Colts Lease Agreement) held at the Stadium. The Colts Lease Agreement expires on August 31, 2038. However, in the event the Colts are not among the top five NFL teams in total gross operating revenues for the 2030 fiscal year, the Colts have the right to terminate the lease without cause at their sole discretion effective as of August 31, 2035.
Contractual Undertaking
During 2007, the Colts undertook a $34,000,000 loan through the NFL’s G-3 program and a $66,000,000 loan through a series of transactions involving fixed rate bonds, with a par amount of $74,050,000, issued by the City of Indianapolis (the “City’s Colts Loan”) and the Bond Bank to finance its commitment. To secure the Bond Bank’s bonds issued as part of the City’s Colts Loan, the CIB entered into a Contractual Undertaking (“Undertaking”), secured by a subordinate pledge on certain Original Excise Tax Revenues and the Indiana Cigarette Tax Revenues of the CIB, which would require payments to the Bond Bank by the CIB if the Colts fail to timely repay the City’s Colts Loan. The Colts are obligated to pay the City’s Colts Loan with interest such that no payments are anticipated on such Undertaking by the CIB. The Undertaking remains in effect until all of the associated Bond Bank bonds, the term of which extend through 2035, have been paid in full. The CIB’s obligation with regard to this Undertaking is not subject to acceleration, except as therein provided, and is treated as debt of the CIB with regard to its legal debt limit. The CIB is subrogated to the rights of the Bond Bank and the City if it is required to make any payments in connection with this Undertaking. There is no right of set-off for amounts the CIB pays to the Colts under the Colts Lease Agreement, if the Colts do not make a loan payment. However, if the CIB fails to pay amounts due under the Colts Lease Agreement, the Colts may offset such amounts against its required loan payments. The total amount subject to the Undertaking at December 31, 2016 and 2015, is approximately $66,500,000 and $67,810,000, respectively.
59
Capital Improvement Board of Managers
(of Marion County, Indiana) (A Component Unit of the Consolidated City of Indianapolis-Marion County)
Notes to Financial Statements
December 31, 2016 and 2015
Note 10: Baseball Facility
In 1994, the CIB entered into an agreement to lease (“Ground Lease”) certain real estate from the Indiana White River State Park Development Commission (“WRSP”), a State agency. The CIB constructed Victory Field, a professional baseball facility, on this land. The initial lease period of the Ground Lease commenced December 1, 1994, and expired March 31, 2016. Upon expiration of the initial lease term, ownership of Victory Field assets of (net book value of $13.8 million) reverted to WRSP. The CIB entered into a new lease with WRSP that expires March 31, 2036.
Under the Ground Lease and a related agreement, the CIB agreed to provide for the construction of the baseball facility and to sublease the facility to the Indianapolis Indians, Inc. (“Indians”), a minor league baseball franchise. To fund a portion of the cost of Victory Field, MCCRFA issued its Excise Taxes Lease Rental Revenue Bonds, Series 1995A. Such bonds were payable primarily from rental payments to be made by the CIB under a separate financing lease, dated June 1, 1995, referred to as the Second Amendment to Master Lease Agreement, between the CIB and MCCRFA. This lease was to end on the sooner of March 31, 2016, or the June 1 or December 1 next following payment of such bonds. During June 2015, the MCCRFA debt associated with Victory Field was fully redeemed; therefore, as of December 31, 2015, the Second Amendment to Master Lease Agreement had terminated.
In November 2015, the CIB entered into a new lease with WRSP for the real estate and all associated improvements thereon, including the professional baseball facility (collectively, the “Leased Premises”), and concurrently entered into a new sublease for the Leased Premises with the Indians, with both having initial terms commencing on April 1, 2016, and expiring March 31, 2036. The lease between the CIB and WRSP allows for extensions, provided that in no event shall the lease term and all extensions exceed in total 99 years. The sublease between the CIB and the Indians allows for up to four five-year extensions.
Under the new sublease, the Indians are not obligated to pay rent to the CIB during the initial term, and the CIB is not obligated to pay rent to WRSP. Over the first four years of the new sublease, the CIB commits to make up to $2 million per year of capital repair, replacement and improvement projects to the Leased Premises, up to an aggregate maximum of $6 million. The Indians are responsible for all operating costs of the Leased Premises and are also entitled to all revenue received from Indians events. Repair, replacement and maintenance costs for the Leased Premises are shared by the CIB and the Indians, as more specifically defined in the sublease agreement.
60
Capital Improvement Board of Managers
(of Marion County, Indiana) (A Component Unit of the Consolidated City of Indianapolis-Marion County)
Notes to Financial Statements
December 31, 2016 and 2015
Note 11: Hudnut Commons (formerly, Capitol Commons)
The CIB and the City entered into agreements with developers in 1986 to construct and operate the Hudnut Commons (an open, public landscaped area), a parking facility beneath the Hudnut Commons and a convention hotel. The construction of the Hudnut Commons was funded by $6,300,000 of private grants. The developers funded construction of the underground parking facility and the hotel. In 1988, the CIB obtained a leasehold interest in the garage and thereupon became the lessor in a long-term lease arrangement for the operation of the garage facility.
During 2004, the CIB, in conjunction with the City, determined that it was in the best interests of the City and Marion County, to allow for the construction of a new, high-rise, corporate headquarters facility on a portion of the existing Hudnut Commons site. The CIB entered into a Joint Development Agreement with the Department of Metropolitan Development of the Consolidated City of Indianapolis-Marion County (“DMD”) and an internationally known retail mall developer that generally provides the framework for various ancillary agreements governing the ownership, use and operation of the Hudnut Commons site and its associated underground parking garage. In short, the various agreements govern the transfer from the CIB to DMD of certain rights and interests related to the Hudnut Commons surface improvements and all air rights above the surface of such property, together with approximately one-half of the underground Hudnut Commons parking garage.
The CIB generally retains responsibility for one-third of all operating costs associated with the maintenance of the entire garage and for any necessary capital improvements to the Hudnut Commons site and one-half of the parking garage transferred to DMD. These responsibilities are more fully described in a separate Operating Agreement between the CIB and DMD and in the Second and Third Amendment and Restatement of Lease between the CIB and the garage tenant and operator. Both of these agreements have a term of 99 years, ending in 2105. In return for accepting these responsibilities, the CIB continues to receive a portion of all rental payments and/or Monthly Parking Allowance Payments, as defined in the agreements.
Note 12: Risk Management
The CIB is exposed to various risks of loss related to theft of, damage to and destruction of assets, as well as torts and natural disasters. The CIB purchases commercial insurance policies for such risks of loss. Certain of these policies allow for deductibles, which range from $250 to $250,000 per occurrence. Settled claims have not exceeded this commercial coverage in any of the past three years.

61
Capital Improvement Board of Managers
(of Marion County, Indiana) (A Component Unit of the Consolidated City of Indianapolis-Marion County)
Notes to Financial Statements
December 31, 2016 and 2015
Note 13: Retirement Plan
Plan Description
The CIB contributes to the Indiana Public Employees’ Retirement Fund (“PERF”), a cost-sharing multiple-employer defined-benefit plan established in accordance with IC 5-10.3. PERF is administered by the Indiana Public Retirement System (“INPRS”) and is governed by the INPRS Board of Trustees (“INPRS Board”). PERF provides retirement, disability and survivor benefits to full-time employees of the State of Indiana not covered by another plan, those political subdivisions that elect to participate in the retirement plan and certain INPRS employees. Substantially all of the CIB’s full-time employees are eligible to participate in this plan.
INPRS issues a publicly available financial report that includes financial statements and required supplementary information for PERF, and can be found at http://www.inprs.in.gov/. This report may also be obtained by writing to Indiana Public Retirement System, One North Capitol, Suite 001, Indianapolis, Indiana 46204, or by calling 888-526-1687.
There are two tiers to the PERF plan. The first is the Public Employee’s Defined Benefit Plan (“PERF Hybrid Plan”) and the second is the Public Employees’ Annuity Savings Account Only Plan (“PERF ASA Only Plan”). During 2015, the PERF ASA Only Plan was available only to employees of the State. As of July 1, 2016, employees for political subdivisions are now eligible to participate.
There are two aspects to the PERF Hybrid Plan defined-benefit structure. The first portion is the monthly defined-benefit pension that is funded by the employer. The second portion of the PERF Hybrid Plan benefit structure is the Annuity Savings Account (“ASA”) that supplements the defined-benefit at retirement.
Funding Policy
The funding policies of INPRS provide for actuarially determined periodic contributions at rates that, for individual employees, increase gradually over time so that sufficient assets will be available to pay benefits when due.
The employer defined-benefit contribution rate is based on an actuarial valuation and is adopted, and may be amended, by the INPRS Board. For both 2016 and 2015, the CIB contributed 11.2 percent of employee compensation to the plan. The ASA consists of the employee contribution, which is set by statute at 3 percent of compensation, as defined by Indiana statutes, plus the interest/earnings or losses credited to the employee’s account. The employer may choose to make the contributions on behalf of its participating employees, which the CIB has elected to do. In addition, under certain circumstances, employees may elect to make additional voluntary contributions of up to 10 percent of their compensation into their ASA. An employee’s contribution and interest credits belong to the employee and do not belong to the state or the CIB.

62
Capital Improvement Board of Managers
(of Marion County, Indiana) (A Component Unit of the Consolidated City of Indianapolis-Marion County)
Notes to Financial Statements
December 31, 2016 and 2015
Retirement Benefits
The PERF Hybrid Plan retirement benefit consists of the sum of a defined pension benefit provided by employer contributions plus the amount credited to the employee’s ASA. Retirement benefits vest after ten years of creditable service. The vesting period is eight years for certain elected officials. Employees are immediately vested in their annuity savings account. At retirement, an employee may choose to receive a lump-sum payment of the amount credited to the employee’s ASA, receive the amount as an annuity or leave the contributions invested with INPRS.
Vested employees leaving a covered position, who wait 30 days after termination, may withdraw their ASA and will not forfeit creditable service or a full retirement benefit. However, if an employee is eligible for a full retirement at the time of the withdrawal request, he/she will have to begin drawing his/her pension benefit in order to withdraw the ASA. A nonvested employee who terminates employment prior to retirement may withdraw his/ her ASA after 30 days, but by doing so, forfeits his/her creditable service. An employee who returns to covered service and works no less than six (6) months in a covered position may reclaim his/her forfeited creditable service.
An employee who has reached: (1) age 65 and has at least 10 years of creditable service; (2) age 60 and has at least 15 years of creditable service; or (3) at least age 55 and whose age plus number of years of creditable service is at least 85 is eligible for normal retirement and, as such, is entitled to 100 percent of the pension benefit component. This annual pension benefit is equal to 1.10 percent times the average annual compensation times the number of years of creditable service. The average annual compensation in this calculation uses the 20 calendar quarters of creditable service in which the employee’s annual compensation was the highest. All 20 calendar quarters do not have to be continuous, but they must be in groups of four consecutive calendar quarters. The same calendar quarter may not be included in two different groups. Employee contributions paid by the employer on behalf of the employee and severance pay up to $2,000 are included as part of the employee’s salary.
An employee who has reached at least age 50 and has at least 15 years of creditable service is eligible for early retirement with a reduced pension. An employee retiring early receives a percentage of the normal annual pension benefit. The percentage of the pension benefit at retirement remains the same for the employee’s lifetime. For age 59, the early retirement percentage of the normal annual pension benefit is 89 percent. This amount is reduced five percentage points per year (e.g., age 58 is 84 percent) to age 50 being 44 percent.
The monthly pension benefits for employees in pay status may be increased periodically as cost of living adjustments (“COLA”). Such increases are not guaranteed by statute and have historically been provided on an “ad hoc” basis and can only be granted by the Indiana General Assembly.

63
Capital Improvement Board of Managers
(of Marion County, Indiana) (A Component Unit of the Consolidated City of Indianapolis-Marion County)
Notes to Financial Statements
December 31, 2016 and 2015
Disability and Survivor Benefits
The PERF Hybrid Plan also provides disability and survivor benefits. An employee who has at least five years of creditable service and becomes disabled while in active service, on FMLA leave, receiving workers’ compensation benefits or receiving employer-provided disability insurance benefits may retire for the duration of the disability, if the employee has qualified for social security disability benefits and has furnished proof of the qualification. The disability benefit is calculated the same as that for a normal retirement without reduction for early retirement. The minimum benefit is $180 per month, or the actuarial equivalent.
Upon the death in service of an employee with 15 or more years of creditable service as of January 1, 2007, a survivor benefit may be paid to the surviving spouse to whom the employee had been married for two or more years, or surviving dependent children under the age of 18. This payment is equal to the benefit which would have been payable to a beneficiary if the employee had retired at age 50 or at death, whichever is later, under an effective election of the joint and survivor option available for retirement benefits. A surviving spouse or surviving dependent children are also entitled to a survivor benefit upon the death in service after January 1, 2007, of an employee who was at least 65 years of age and had at least 10 but not more than 14 years of creditable service.
The authority to establish or amend benefit provisions of PERF rests with the Indiana General Assembly.
Contributions
Employer contribution rates are adopted annually by the INPRS Board for PERF. The contributions are actuarially determined based on the funding policy, actuarial assumptions and actuarial methods established by the INPRS Board. Contributions determined by the actuarial valuation become effective either 12 or 18 months after the valuation date, depending on the applicable employer. In the case of the CIB, contribution rates and amounts determined by the June 30, 2016 actuarial valuation and adopted by the INPRS Board therefore become effective on January 1, 2018. The CIB’s contractually required contribution rate for both 2016 and 2015 was 11.2% of annual payroll, actuarially determined as an amount that is expected to finance the costs of benefits earned by employees during the year, with an additional amount to finance any unfunded accrued liability. For the years ended December 31, 2016 and 2015, the CIB’s actual contributions made were equal to the actuarially required contributions.

64
Capital Improvement Board of Managers
(of Marion County, Indiana) (A Component Unit of the Consolidated City of Indianapolis-Marion County)
Notes to Financial Statements
December 31, 2016 and 2015
Pension Liabilities, Pension Expense, and Deferred Outflows of Resources and Deferred Inflows of Resources Related to Pensions
At December 31, 2016 and 2015, the CIB reported a liability of $9,460,841 and $8,519,697, respectively, for its proportionate share of PERF’s net pension liability. The net pension liabilities were measured as of June 30, 2016, and June 30, 2015, respectively. In each instance, the total pension liability used to calculate the net pension liability was determined by an actuarial valuation as of those respective dates. Member census data for the year preceding the measurement period was used in developing each actuarial valuation. Standard actuarial roll forward techniques were then used to project the total pension liability to the measurement date. Wages reported by the CIB relative to the collective wages of the plan served as the basis to determine the CIB’s proportionate share. This basis of allocation is consistent with the manner in which contributions to the pension plan are determined. At June 30, 2016, the CIB’s proportion was 0.20846%, which was a decrease of 0.00072% from its proportion measured as of June 30, 2015.
For the years ended December 31, 2016 and 2015, the CIB recognized pension expense of $1,905,562 and $1,522,260, respectively. At December 31, 2016 and 2015, the CIB reported deferred outflows of resources and deferred inflows of resources related to pensions from the following sources:
Deferred Deferred Deferred Deferred
Outflows of Inflows of Outflows of Inflows of
Resources Resources Resources Resources
Differences between expected and actual experience 211,958$ 17,464$ 365,705$ 17,619$
Net difference between projected and actual earnings on
pension plan investments 1,548,548 635,281 -
Changes in assumptions 417,420 - 720,201 -
Changes in proportion and differences between the CIB's
contribution and proportionate share of contributions 258,170 130,893 437,543 7,515
CIB's contributions subsequent to the measurement date 600,676 - 559,971 -
Total 3,036,772$ 148,357$ 2,718,701$ 25,134$
At December 31, 2016 At December 31, 2015

65
Capital Improvement Board of Managers
(of Marion County, Indiana) (A Component Unit of the Consolidated City of Indianapolis-Marion County)
Notes to Financial Statements
December 31, 2016 and 2015
At December 31, 2016 and 2015, the CIB reported $600,676 and $559,971, respectively, as deferred outflows of resources related to pensions resulting from CIB’s contributions subsequent to the measurement date that will be recognized as a reduction of the net pension liability in the following fiscal year. Other amounts reported as net deferred outflows of resources at December 31, 2016, related to pensions will be recognized in pension expense as follows:
2017 903,657$
2018 531,894
2019 600,391
2020 251,797
2,287,739$
Actuarial Assumptions
The total pension liabilities in the June 30, 2016 and 2015 actuarial valuations were determined using the following actuarial assumptions, applied to all periods included in the measurement:
Inflation 2.25%
Salary increases 2.5% - 4.25% average, including inflation
Ad hoc cost of living adjustments 1.0% average
Long-term expected rate of return 6.75%, net of pension plan investment expense
Mortality rates were based on the RP-2014 (with MP-2014 improvement removed) Total Data Set Mortality Tables projected on a fully generational basis using the mortality improvement scale inherent in the mortality projection included in the Social Security Administration’s 2014 Trustee Report.
The actuarial assumptions used in the June 30, 2016 and June 30, 2015 valuations were based on the results of an actuarial experience study performed for the period June 30, 2010 through June 30, 2014.
The long-term expected rate of return on pension plan investments was determined by using a building-block approach and assumes a time horizon, as defined in the INPRS Investment Policy Statement. A forecasted rate of inflation serves as the baseline for the return expectation. Various real return premiums over the baseline inflation rate have been established for each asset class. The long-term expected nominal rate of return has been determined by calculating a weighted- average of the expected real return premiums for each asset class, adding the projected inflation rate and adding the expected return from rebalancing uncorrelated asset classes.

66
Capital Improvement Board of Managers (A Component Unit of the Consolidated City of Indianapolis-Marion County)
Notes to Financial Statements December 31, 2016 and 2015
The target allocation and best estimates of arithmetic real rates of return for each major asset class are summarized in the following table:
Long-Term
Target Expected Real
Asset Class Allocation Rate of Return
Public equity 22% 5.7%
Private equity 10% 6.2%
Fixed income - ex inflation linked 24% 2.7%
Fixed income - inflation linked 7% 0.7%
Commodities 8% 2.0%
Real estate 7% 2.7%
Absolute return 10% 4.0%
Risk parity 12% 5.0%
100%
At June 30, 2016
Discount Rate
The discount rate used to measure the total pension liability was 6.75% for the years ended June 30, 2016 and 2015. The projection of cash flows used to determine the discount rate assumed that employee contributions will be made at the current contribution rate and that participating employer contributions will be made at contractually required rates, actuarially determined. Based on those assumptions, the PERF’s fiduciary net position was projected to be available to make all projected future benefit payments of current active and inactive employees. Therefore, the long-term expected rate of return on pension plan investments was applied to all periods of projected benefit payments to determine the total pension liability.

67
Capital Improvement Board of Managers
(of Marion County, Indiana) (A Component Unit of the Consolidated City of Indianapolis-Marion County)
Notes to Financial Statements
December 31, 2016 and 2015
Sensitivity of the CIB’s Proportionate Share of the Net Pension Liability to Changes in the Discount Rate
The CIB’s proportionate share of the net pension liability has been calculated using a discount rate of 6.75%. The following presents the CIB’s proportionate share of the net pension liability calculated using a discount rate of 1% higher and 1% lower than the current rate for the year ended December 31, 2016.
Current
1% Decrease Discount Rate 1% Increase
(5.75%) (6.75%) (7.75%)
CIB's proportionate share of PERF's net pension liability 13,588,008$ 9,460,841$ 6,030,542$
At December 31, 2016
Pension Plan Fiduciary Net Position
Detailed information about the pension plan’s fiduciary net position is available in the separately issued PERF financial report.
Note 14: Commitments and Contingencies
Visit Indy, Inc.
In return for its assistance in attracting users to the Indiana Convention Center & Lucas Oil Stadium, the CIB has agreed to compensate Visit Indy, Inc. (“Visit Indy”) monthly in the form of a base amount. In December 2014, a new funding agreement was executed with Visit Indy for 2015 and 2016. The base fee paid to Visit Indy was $791,666 per month in 2015 and $870,833 per month in 2016. The base fee to be paid to Visit Indy for calendar year 2017 is $1,025,708 per month. The CIB contributed $3,500,000 to Visit Indy in December 2014, portions of which were to be credited against the base compensation or refunded to the CIB in 2015 or 2016, if certain eligibility requirements were not met by Visit Indy. All eligibility requirements were satisfied by Visit Indy, resulting in the CIB recognizing a compensation expense of $2,000,000 in 2015 and $1,500,000 in 2016. The CIB paid an additional $525,000 to Visit Indy during 2016 to share in the costs of certain events to be held at the Convention Center in future years.

68
Capital Improvement Board of Managers
(of Marion County, Indiana) (A Component Unit of the Consolidated City of Indianapolis-Marion County)
Notes to Financial Statements
December 31, 2016 and 2015
Department of Metropolitan Development
As mentioned previously in these notes, the CIB has also entered into an Interlocal Agreement with the Department of Metropolitan Development of Marion County, Indiana. This agreement provides $8,000,000 of annual assistance that will be used to fund the CIB’s payments to Visit Indy.
Indiana Sports Corporation
During 2014, the CIB approved a multi-year grant to the Indiana Sports Corporation to assist with the ongoing repairs and maintenance of the Indiana University Natatorium on the campus of Indiana University-Purdue University at Indianapolis. The grant amounts to $500,000 annually for a term of 10 years, beginning in 2014. As of December 31, 2016 and 2015, the unpaid portion of this grant was $3,500,000 and $4,000,000, respectively.
Litigation
The CIB is involved in certain litigation, which is considered by management to be incidental to the conduct of CIB operations. In the opinion of management, the ultimate outcome of these matters, in the aggregate, is not currently expected to have a materially adverse effect upon the financial position, changes in financial position and cash flows of the CIB.

Required Supplementary Information

(THIS PAGE INTENTIONALLY LEFT BLANK)

69
Capital Improvement Board of Managers (of Marion County, Indiana)
(A Component Unit of the Consolidated City of Indianapolis of Marion County) Required Supplementary Information
Schedule of CIB’s Proportionate Share of the Net Pension Liability Indiana Public Employees’ Retirement Fund(PERF)
Last 10 Fiscal Years*
2016 2015 2014
CIB's proportion of the net pension liability 0.20846% 0.20918% 0.19860%
CIB's proportionate share of the net pension liability 9,460,841$ 8,519,697$ 5,219,079$
CIB's covered payroll 9,990,592$ 10,019,254$ 9,696,453$
CIB's proportionate share of the net pension
liability as a percentage of its covered payroll 95% 85% 54%
Plan fiduciary net position as a percentage of the
total pension liability 75% 77% 84%
*The amounts presented for each fiscal year were determined as of June 30 (measurement date).
Note: Ten years of information is required to be disclosed and will be added as the information becomes available.
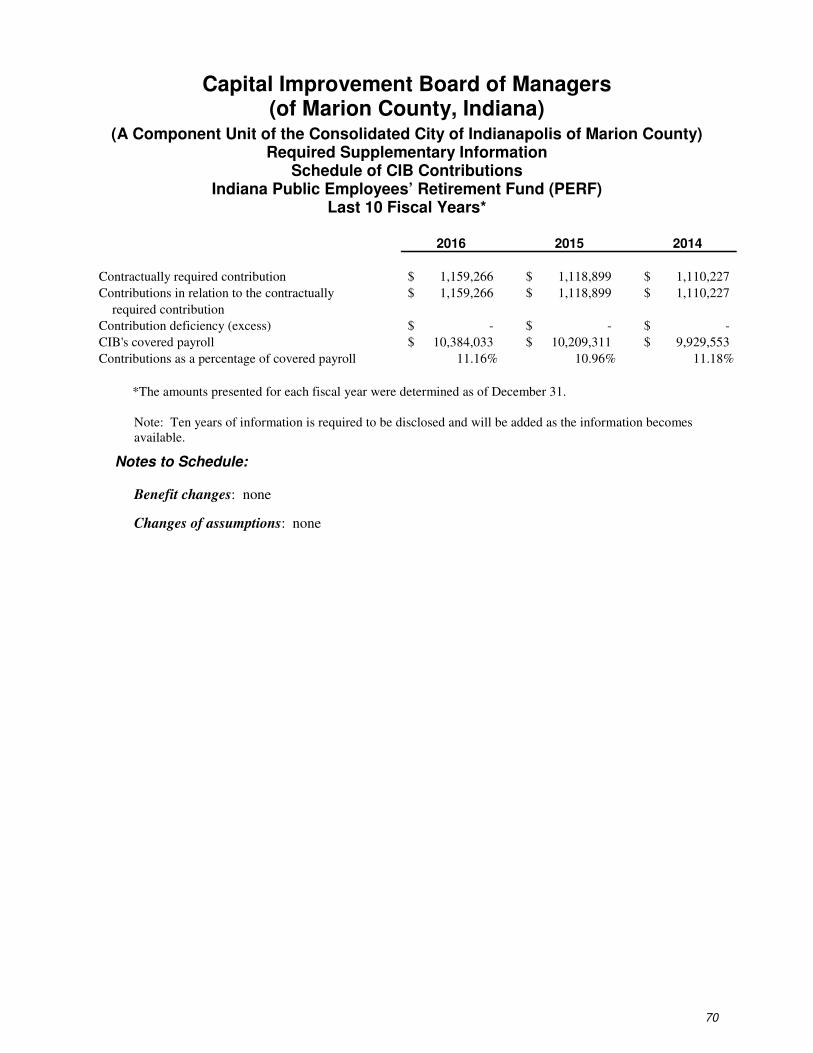
70
Capital Improvement Board of Managers (of Marion County, Indiana)
(A Component Unit of the Consolidated City of Indianapolis of Marion County) Required Supplementary Information
Schedule of CIB Contributions Indiana Public Employees’ Retirement Fund (PERF)
Last 10 Fiscal Years*
2016 2015 2014
Contractually required contribution 1,159,266$ 1,118,899$ 1,110,227$
Contributions in relation to the contractually 1,159,266$ 1,118,899$ 1,110,227$
required contribution
Contribution deficiency (excess) -$ -$ -$
CIB's covered payroll 10,384,033$ 10,209,311$ 9,929,553$
Contributions as a percentage of covered payroll 11.16% 10.96% 11.18%
*The amounts presented for each fiscal year were determined as of December 31.
Note: Ten years of information is required to be disclosed and will be added as the information becomes available.
Notes to Schedule:
Benefit changes: none
Changes of assumptions: none

Other Supplementary Information

(THIS PAGE INTENTIONALLY LEFT BLANK)

71
Capital Improvement Board of Managers (of Marion County, Indiana)
(A Component Unit of the Consolidated City of Indianapolis-Marion County)
Analysis of Certain Operating Expenses
Years Ended December 31, 2016 and 2015
2016 2015
Salaries and Wages
Administration $ 4,788,749 $ 4,494,314
Mechanical 3,747,364 3,793,334
Service 1,726,002 1,711,221
Temporary 6,594,858 6,458,282
$ 16,856,973 $ 16,457,151
Fringe benefits
Social security taxes 994,326 1,071,755
Public employees' retirement fund 1,905,562 1,522,260
Employees' insurance 1,279,314 1,245,874
State unemployment taxes 12,147 24,430
Workers' compensation 158,518 195,766
Other 537,627 526,746
$ 4,887,494 $ 4,586,831
Utilities
Electricity 4,569,320 4,177,173
Steam 1,361,035 1,525,543
Chilled Water 2,173,854 1,893,513
Water and sewer 547,459 805,995
Gas 61,317 68,305
$ 8,712,985 $ 8,470,529
Repairs and Maintenance
Control systems maintenance contract 90,467 101,582
Elevator and escalator maintenance contract 236,796 239,104
Computer maintenance contracts 291,714 169,038
Major repairs 1,930,729 3,237,426
Property damages - 10,776
Grounds maintenance 219,090 317,660
Fire extinguisher system 76,737 87,285
Sprinkler system 9,385 3,508
Trash removal 73,974 78,059
Communications repairs 57,740 63,854
LOS maintenance contracts 123,568 213,135
$ 3,110,200 $ 4,521,427

72
Capital Improvement Board of Managers (of Marion County, Indiana)
(A Component Unit of the Consolidated City of Indianapolis-Marion County)
Analysis of Certain Operating Expenses (Continued)
Years Ended December 31, 2016 and 2015
2016 2015
Insurance
Fire and extended coverage $ 837,315 $ 921,661
Public liability 727,598 788,765
Fidelity bond 86,398 86,428
$ 1,651,311 $ 1,796,854
SecuritySecurity staff $ 3,269,384 $ 3,588,459
Nondepreciable Equipment, Parts and Supplies $ 4,180,150 $ 3,990,845
Other
Advertising and promotion 375,409 365,916
Telephone 61,553 42,945
Legal fees 623,714 921,318
Accounting and audit fees 129,850 115,540
Consulting fees 234,755 570,214
Architects and engineers 65,537 135,310
Equipment rental 531,054 641,281
Postage (1,020) 17,891
Travel 10,526 7,721
Dues and subscriptions 12,500 12,479
Suite cable service 40,819 47,987
Medical services - Indianapolis Colts games 55,693 54,057
Parking 265,264 274,912
Set-up/installation and dismantling fees 3,191,065 3,374,043
Miscellaneous 842,929 474,129
$ 6,439,648 $ 7,055,743

Statistical Section (Unaudited)
This section of the CIB’s comprehensive annual financial report presents detailed, contextual information and data to assist the reader in understanding what the information contained in the
financial statements, note disclosures and supplementary information says about the CIB’s overall financial health.
Contents Pages
Financial Trends These schedules contain trend information to help the reader understand how the
CIB’s financial performance and well-being have changed over time. 73-78
Revenue Capacity
These schedules contain information to help the reader assess the CIB’s most significant own-source revenues. 79-83
Debt Capacity These schedules present information to help the reader assess the affordability of
the CIB’s current levels of outstanding debt and the CIB’s ability to issue additional debt in the future. 84-89
Demographic and Economic Information These schedules offer demographic and economic indicators to help the reader
understand the socioeconomic environment within which the CIB’s financial activities take place and to facilitate comparisons of financial statement information over time and among governments. 90-91
Operating Information These schedules contain operational and infrastructure data to help the reader
understand how the information in the CIB’s financial report relates to the services the CIB provides and the activities it performs. 92-94
Sources: Unless otherwise noted, the information in these schedules is derived from the comprehensive annual financial reports for the relevant year.
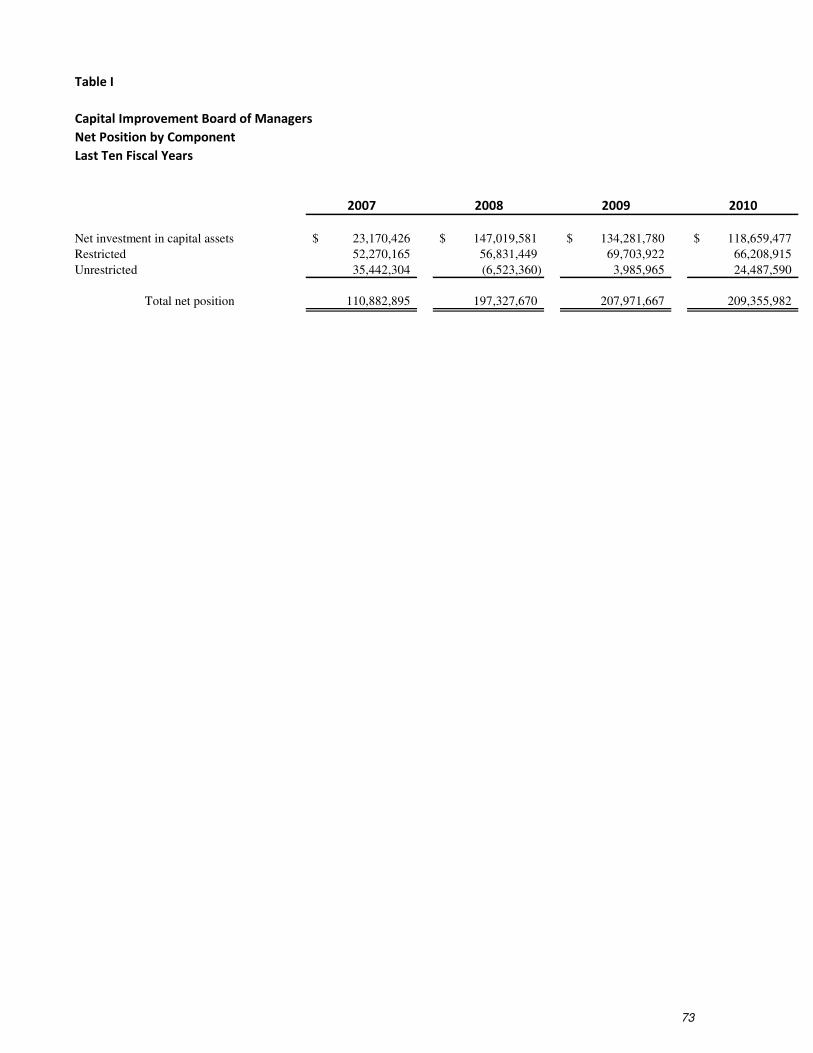
73
Table I
Capital Improvement Board of Managers
Net Position by Component
Last Ten Fiscal Years
2007 2008 2009 2010
Net investment in capital assets 23,170,426$ 147,019,581$ 134,281,780$ 118,659,477$
Restricted 52,270,165 56,831,449 69,703,922 66,208,915
Unrestricted 35,442,304 (6,523,360) 3,985,965 24,487,590
Total net position 110,882,895 197,327,670 207,971,667 209,355,982
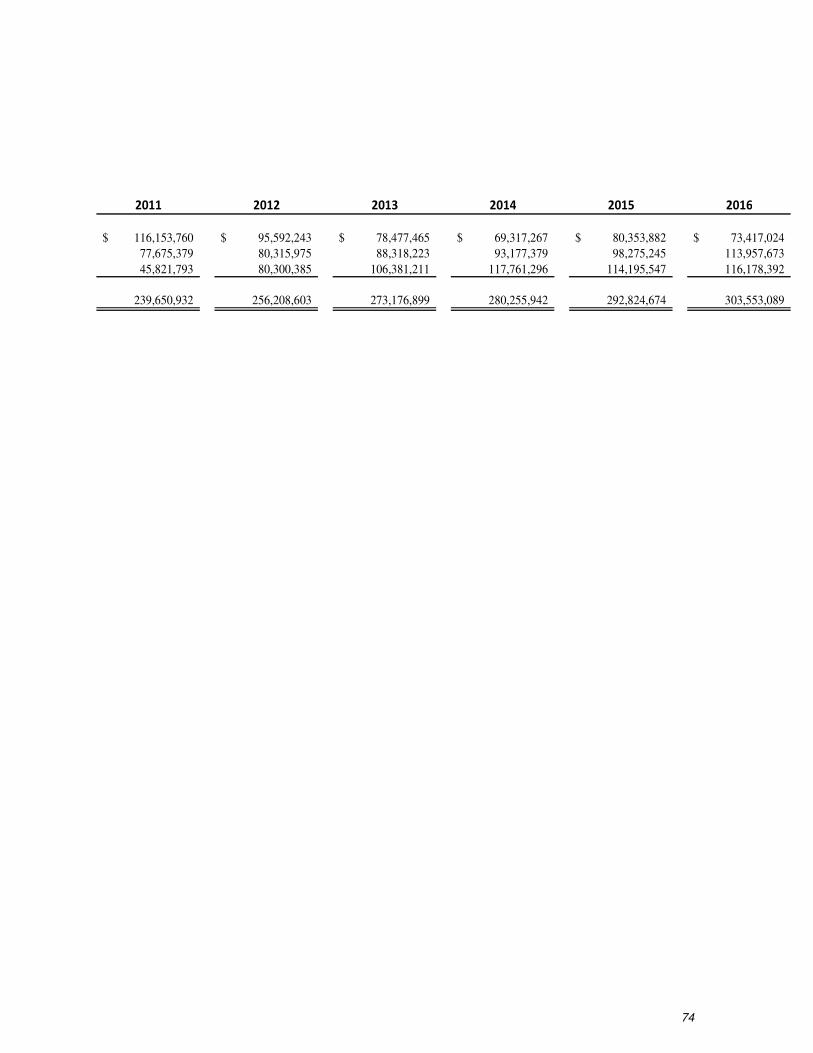
74
2011 2012 2013 2014 2015 2016
116,153,760$ 95,592,243$ 78,477,465$ 69,317,267$ 80,353,882$ 73,417,024$
77,675,379 80,315,975 88,318,223 93,177,379 98,275,245 113,957,673
45,821,793 80,300,385 106,381,211 117,761,296 114,195,547 116,178,392
239,650,932 256,208,603 273,176,899 280,255,942 292,824,674 303,553,089

75
Table II
Capital Improvement Board of Managers
Changes in Net Position
Last Ten Fiscal Years
2007 2008 2009 2010
Operating revenues
Rental income 6,354,696$ 6,326,285$ 6,791,593$ 6,313,472$
Food service and concession commissions 6,675,775 3,677,833 4,532,348 3,070,691
Parking lot income 411,846 664,680 1,313,711 1,498,870
Labor reimbursements 6,033,689 8,557,650 7,892,040 7,780,220
Advertising income 1,300,477 - - -
Other operating income 1,047,026 603,098 746,845 413,886
Total operating revenues 21,823,509 19,829,546 21,276,537 19,077,139
Nonoperating revenues
Investment income 4,270,088 2,106,780 407,443 207,154
State and local taxes and other assistance 98,782,093 106,867,838 101,434,649 120,583,069
Gain (loss) on sale/disposal of capital assets (28,588) 17,598 - 11,028
Other 1,206,312 319,170 72,774 80,746
Total nonoperating revenues 104,229,905 109,311,386 101,914,866 120,881,997
Total Revenues 126,053,414 129,140,932 123,191,403 139,959,136
Operating expenses
Salaries, wages and fringe benefits 13,849,005 16,544,495 14,530,703 13,224,267
Utilities 4,259,820 5,278,056 5,441,608 5,414,506
Repairs, maintenance, equipment, parts and supplies 1,918,641 1,948,935 1,357,256 5,244,483
Insurance 1,107,108 1,281,698 1,255,953 1,116,622
Security 1,173,598 3,216,882 2,784,096 3,310,355
Other 5,394,458 6,202,122 4,253,411 4,619,506
Depreciation and amortization 29,844,812 38,023,853 35,795,575 32,531,535
Total operating expenses 57,547,442 72,496,041 65,418,602 65,461,274
Nonoperating expenses
Interest expense 20,197,976 19,353,144 34,129,715 48,649,587
Bankers Life Fieldhouse operating reimbursements - - - -
Pacers Basketball note receivable forgiveness - - - -
Compensation to Visit Indy, Inc. 7,736,800 7,970,491 7,780,503 9,191,660
Payments to Indianapolis Colts 10,539,932 7,795,422 5,313,734 4,940,000
Grants to other organizations 2,986,823 3,479,845 526,947 -
Public safety support payments - - - -
Other 18,542,245 34,913,245 - -
Total nonoperating expenses 60,003,776 73,512,147 47,750,899 62,781,247
Total Expenses 117,551,218 146,008,188 113,169,501 128,242,521
Capital Contributions - 103,312,031 622,095 6,892,503
Increase in Net Position 8,502,196$ 86,444,775$ 10,643,997$ 18,609,118$

76
2011 2012 2013 2014 2015 2016
9,059,609$ 8,550,211$ 10,416,132$ 9,900,660$ 10,170,929$ 9,438,144$
4,751,669 3,970,814 7,100,477 5,386,550 6,162,083 5,150,223
1,008,637 1,430,227 1,209,008 856,771 669,487 594,841
11,052,122 14,088,686 13,057,670 13,037,347 12,710,518 14,487,112
- - - - - -
1,486,114 1,056,423 579,418 1,244,052 1,694,869 1,881,768
27,358,151 29,096,361 32,362,705 30,425,380 31,407,886 31,552,088
240,385 336,931 274,569 327,490 371,195 632,005
128,797,124 138,776,422 142,921,658 152,226,092 158,780,475 169,238,548
(1,059,636) (127,086) (1,411,290) 15,453 (70,104) (17,176,509)
88,709 102,990 221,136 141,641 665,363 1,040,500
128,066,582 139,089,257 142,006,073 152,710,676 159,746,929 153,734,544
155,424,733 168,185,618 174,368,778 183,136,056 191,154,815 185,286,632
15,996,726 19,021,245 18,814,974 19,206,224 21,043,982 21,744,467
5,427,906 5,398,935 5,413,326 8,873,546 8,470,529 8,712,985
7,445,010 8,249,662 8,278,729 9,738,019 8,512,272 7,290,350
1,246,862 1,515,684 1,399,559 1,852,980 1,796,854 1,651,311
2,799,552 2,629,337 2,611,043 3,121,731 3,588,459 3,269,384
6,209,407 9,325,541 5,411,222 6,801,231 7,055,743 6,439,648
36,402,218 40,413,230 40,528,314 40,550,478 41,584,565 47,145,100
75,527,681 86,553,634 82,457,167 90,144,209 92,052,404 96,253,245
48,878,681 50,981,983 52,017,898 51,838,276 47,790,546 44,959,975
- - - 7,921,022 8,255,037 8,474,999
- - - - 6,000,000 6,000,000
9,035,902 9,105,000 10,605,000 10,708,000 11,499,992 11,950,000
5,260,000 5,200,000 5,200,000 5,300,362 5,120,000 5,390,000
705,894 450,000 488,501 5,450,000 450,000 650,000
- - 7,720,125 5,230,144 1,995,335 1,879,998
- - - - - -
63,880,477 65,736,983 76,031,524 86,447,804 81,110,910 79,304,972
139,408,158 152,290,617 158,488,691 176,592,013 173,163,314 175,558,217
14,278,375 812,137 1,088,209 535,000 - 1,000,000
30,294,950$ 16,707,138$ 16,968,296$ 7,079,043$ 17,991,501$ 10,728,415$

77
Table III
Capital Improvement Board of Managers
Event Statistics
Last Ten Fiscal Years
2007 2008 2009 2010
Number of Events
Entertainment 8 12 12 10
Trade Shows 21 22 18 15
Local, Business and Social 238 308 163 174
State Convention Business 64 83 72 79
National Convention Business 34 42 69 43
Competition 45 47 67 62
Total Number of Events 410 514 401 383
Event Days
Entertainment 8 15 17 15
Trade Shows 48 54 45 39
Local, Business and Social 348 401 192 206
State Convention Business 118 139 126 137
National Convention Business 113 130 182 123
Competition 66 78 103 92
Total Event Days 701 817 665 612
Attendance
Entertainment 49,380 127,078 155,346 93,344
Trade Shows 117,177 102,289 85,449 160,239
Local, Business and Social 204,449 248,436 83,716 77,008
State Convention Business 92,685 85,516 126,368 85,331
National Convention Business 293,984 317,815 333,576 303,882
Competition 936,939 1,044,627 1,080,090 1,103,387
Total Attendance 1,694,614 1,925,761 1,864,545 1,823,191
Source: Sales Office - Capital Improvement Board of Managers

78
2011 2012 2013 2014 2015 2016
5 6 2 4 4 1
19 19 13 18 15 15
148 130 130 140 135 141
84 74 71 79 56 66
83 85 115 106 95 52
101 97 78 86 75 71
440 411 409 433 380 346
7 8 2 6 4 1
47 66 37 44 45 40
175 163 145 164 157 220
129 118 128 129 92 113
216 270 304 290 267 158
155 149 108 119 131 108
729 774 724 752 696 640
11,886 52,709 7,420 22,066 81,161 3,718
168,136 652,201 209,611 246,567 320,027 186,404
71,640 57,067 133,327 125,578 65,080 72,825
66,408 69,687 74,510 100,844 56,717 84,516
468,324 413,477 509,242 635,701 401,486 417,300
1,222,636 1,196,333 1,188,153 1,267,171 1,158,898 1,096,800
2,009,030 2,441,474 2,122,263 2,397,927 2,083,369 1,861,563

Table IV
Capital Improvement Board of Managers
Largest Customers
$ Amount % of Total $ Amount % of Total $ Amount % of Total $ Amount % of Total
Customer 1 250,000$ 2.68% 1,120,128$ 7.73% -$ 0.00% 1,370,128$ 4.73%
Customer 2 512,693 5.51% 532,002 3.67% 99,144 1.93% 1,143,839 3.95%
Customer 3 463,134 4.97% 478,345 3.30% 113,885 2.21% 1,055,364 3.65%
Customer 4 297,367 3.19% 353,639 2.44% 202,343 3.93% 853,349 2.95%
Customer 5 286,242 3.07% 300,706 2.08% 161,236 3.13% 748,184 2.58%
Customer 6 202,643 2.18% 458,749 3.17% 83,951 1.63% 745,343 2.57%
Customer 7 387,273 4.16% 39,475 0.27% 215,018 4.17% 641,766 2.22%
Customer 8 69,818 0.75% 246,566 1.70% 301,230 5.85% 617,614 2.13%
Customer 9 54,058 0.58% 153,208 1.06% 211,346 4.10% 418,612 1.45%
Customer 10 88,709 0.95% 146,834 1.01% 176,633 3.43% 412,176 1.42%
Subtotal 2,611,937 28.04% 3,829,652 26.43% 1,564,786 30.38% 8,006,375 27.65%
Balance from other customers 6,701,207 71.96% 10,657,460 73.57% 3,585,437 69.62% 20,944,104 72.35%
9,313,144$ 100.00% 14,487,112$ 100% 5,150,223$ 100% 28,950,479$ 100%
$ Amount % of Total $ Amount % of Total $ Amount % of Total $ Amount % of Total
Customer 1 250,000$ 3.93% 95,775$ 1.59% 2,298,212$ 34.43% 2,643,987$ 13.87%
Customer 2 457,344 7.20% 583,254 9.67% 46,926 0.70% 1,087,524 5.70%
Customer 3 158,065 2.49% 322,601 5.35% 87,102 1.30% 567,768 2.98%
Customer 4 87,749 1.38% 279,984 4.64% 117,656 1.76% 485,389 2.55%
Customer 5 178,075 2.80% 243,542 4.04% 56,455 0.85% 478,072 2.51%
Customer 6 - 0.00% 354,087 5.87% 80,829 1.21% 434,916 2.28%
Customer 7 65,793 1.04% 164,701 2.73% 152,591 2.29% 383,085 2.01%
Customer 8 97,636 1.54% 120,678 2.00% 106,241 1.59% 324,555 1.70%
Customer 9 133,556 2.10% 114,936 1.90% 67,853 1.02% 316,345 1.66%
Customer 10 65,173 1.03% 117,256 1.94% 59,579 0.89% 242,008 1.27%
Subtotal 1,493,391 23.50% 2,396,814 39.72% 3,073,444 46.04% 6,963,649 36.53%
Balance from other customers 4,861,305 76.50% 3,636,875 60.28% 3,602,331 53.96% 12,100,511 63.47%
6,354,696$ 100.00% 6,033,689$ 100.00% 6,675,775$ 100.00% 19,064,160$ 100.00%
Sources: Rental income and labor reimbursement amounts obtained from the Sales Office - Capital Improvement Board of Managers.
Food Service Commissions obtained from Service America.
Note: Rental income for 2016 excludes $125,000 of fixed rental fees received from the Indianapolis Indians.
Rental Income Labor Reimbursements Food Service Commissions Total
December 31, 2016
Rental Income Labor Reimbursements Food Service Commissions Total
December 31, 2007
79
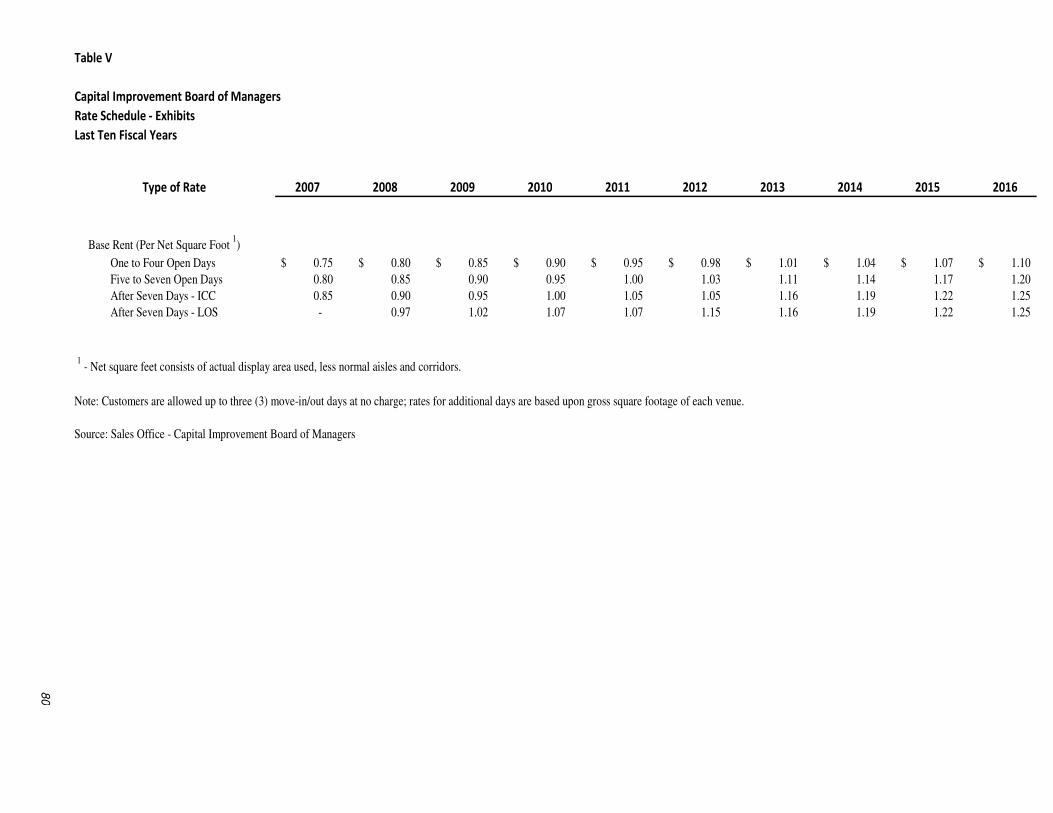
Table V
Capital Improvement Board of Managers
Rate Schedule - Exhibits
Last Ten Fiscal Years
Type of Rate 2007 2008 2009 2010 2011 2012 2013 2014 2015 2016
Base Rent (Per Net Square Foot 1)
One to Four Open Days 0.75$ 0.80$ 0.85$ 0.90$ 0.95$ 0.98$ 1.01$ 1.04$ 1.07$ 1.10$
Five to Seven Open Days 0.80 0.85 0.90 0.95 1.00 1.03 1.11 1.14 1.17 1.20
After Seven Days - ICC 0.85 0.90 0.95 1.00 1.05 1.05 1.16 1.19 1.22 1.25
After Seven Days - LOS - 0.97 1.02 1.07 1.07 1.15 1.16 1.19 1.22 1.25
1 - Net square feet consists of actual display area used, less normal aisles and corridors.
Note: Customers are allowed up to three (3) move-in/out days at no charge; rates for additional days are based upon gross square footage of each venue.
Source: Sales Office - Capital Improvement Board of Managers
80

Table VI
Capital Improvement Board of Managers
Rate Schedule - Meetings
Last Ten Fiscal Years
Type of Rate 2007 2008 2009 2010 2011 2012 2013 2014 2015 2016
Convention Meetings
Base Rent (Per Net Square Foot)
Halls 0.05$ 0.05$ 0.05$ 0.05$ 0.05$ 0.05$ 0.06$ 0.06$ 0.06$ 0.06$
RCA Dome 0.13 - - - - - - - - -
Sagamore Ballrooms 0.15 0.15 0.15 0.15 0.16 0.16 0.17 0.17 0.18 0.18
Wabash Ballrooms 0.15 0.15 0.15 0.15 0.16 0.16 0.17 0.17 0.18 0.18
500 Ballroom/Reception Room 0.11 0.11 0.11 0.11 0.13 0.13 0.13 0.13 0.16 0.16
White River Ballroom 0.10 - - - - - - - - -
Meeting Rooms 1
0.13 0.12 0.12 0.12 0.16 0.16 0.17 0.17 0.18 0.18
Non-Convention Meetings
Base Rent (Per Net Square Foot)
Halls 0.07$ 0.07$ 0.07$ 0.07$ 0.07$ 0.07$ 0.08$ 0.08$ 0.08$ 0.08$
RCA Dome 0.16 - - - - - - - - -
Sagamore Ballrooms 0.17 0.17 0.17 0.17 0.18 0.18 0.19 0.19 0.20 0.20
Wabash Ballrooms 0.17 0.17 0.17 0.17 0.18 0.18 0.19 0.19 0.20 0.20
500 Ballroom/Reception Room 0.12 0.12 0.12 0.12 0.14 0.14 0.15 0.15 0.18 0.18
White River Ballroom 0.11 - - - - - - - - -
Meeting Rooms 1
0.16 0.16 0.16 0.16 0.16 0.16 0.17 0.17 0.20 0.20
Lucas Oil Stadium
Base Rent (Per Net Square Foot)
Stadium -$ 0.24$ 0.24$ 0.24$ 0.24$ 0.24$ 0.24$ 0.27$ 0.27$ 0.27$
Halls - 0.05 0.05 0.05 0.05 0.05 0.05 0.06 0.06 0.06
Meeting Rooms - 0.16 0.27 0.27 0.27 0.27 0.27 0.31 0.31 0.31
Party Plazas - 0.38 0.18 0.18 0.18 0.18 0.18 0.18 0.18 0.18
Club Lounges - 0.34 0.06 0.06 0.06 0.06 0.06 0.14 0.14 0.14
1 - Rates vary by meeting room; rates presented are blended.
Source: Sales Office - Capital Improvement Board of Managers
81
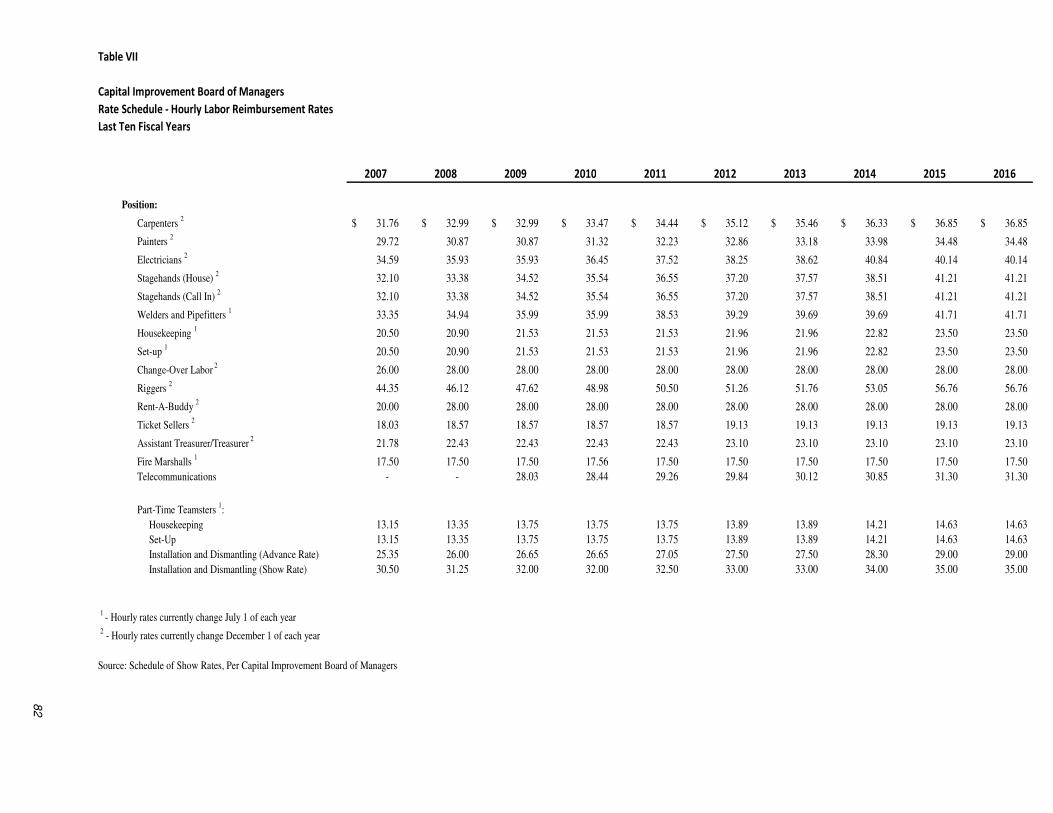
Table VII
Capital Improvement Board of Managers
Rate Schedule - Hourly Labor Reimbursement Rates
Last Ten Fiscal Years
2007 2008 2009 2010 2011 2012 2013 2014 2015 2016
Position:
Carpenters 2
31.76$ 32.99$ 32.99$ 33.47$ 34.44$ 35.12$ 35.46$ 36.33$ 36.85$ 36.85$
Painters 2
29.72 30.87 30.87 31.32 32.23 32.86 33.18 33.98 34.48 34.48
Electricians 2
34.59 35.93 35.93 36.45 37.52 38.25 38.62 40.84 40.14 40.14
Stagehands (House) 2
32.10 33.38 34.52 35.54 36.55 37.20 37.57 38.51 41.21 41.21
Stagehands (Call In) 2
32.10 33.38 34.52 35.54 36.55 37.20 37.57 38.51 41.21 41.21
Welders and Pipefitters 1
33.35 34.94 35.99 35.99 38.53 39.29 39.69 39.69 41.71 41.71
Housekeeping 1
20.50 20.90 21.53 21.53 21.53 21.96 21.96 22.82 23.50 23.50
Set-up 1
20.50 20.90 21.53 21.53 21.53 21.96 21.96 22.82 23.50 23.50
Change-Over Labor 2
26.00 28.00 28.00 28.00 28.00 28.00 28.00 28.00 28.00 28.00
Riggers 2
44.35 46.12 47.62 48.98 50.50 51.26 51.76 53.05 56.76 56.76
Rent-A-Buddy 2
20.00 28.00 28.00 28.00 28.00 28.00 28.00 28.00 28.00 28.00
Ticket Sellers 2
18.03 18.57 18.57 18.57 18.57 19.13 19.13 19.13 19.13 19.13
Assistant Treasurer/Treasurer 2
21.78 22.43 22.43 22.43 22.43 23.10 23.10 23.10 23.10 23.10
Fire Marshalls 1
17.50 17.50 17.50 17.56 17.50 17.50 17.50 17.50 17.50 17.50
Telecommunications - - 28.03 28.44 29.26 29.84 30.12 30.85 31.30 31.30
Part-Time Teamsters 1:
Housekeeping 13.15 13.35 13.75 13.75 13.75 13.89 13.89 14.21 14.63 14.63
Set-Up 13.15 13.35 13.75 13.75 13.75 13.89 13.89 14.21 14.63 14.63
Installation and Dismantling (Advance Rate) 25.35 26.00 26.65 26.65 27.05 27.50 27.50 28.30 29.00 29.00
Installation and Dismantling (Show Rate) 30.50 31.25 32.00 32.00 32.50 33.00 33.00 34.00 35.00 35.00
1
- Hourly rates currently change July 1 of each year
2 - Hourly rates currently change December 1 of each year
Source: Schedule of Show Rates, Per Capital Improvement Board of Managers
82

83
Table VIII
Capital Improvement Board of Managers
Food Service and Concession Revenues
Last Ten Fiscal Years
CIB CIB
Revenues Expenses Commission 1
Profit 2
Total
2007 18,672,495$ 17,729,488$ 5,601,749$ 1,074,026$ 6,675,775$
2008 13,925,935 11,355,237 1,647,517 2,059,350 3,706,867
2009 13,060,511 8,605,225 - 4,532,348 4,532,348
2010 12,792,675 9,721,984 - 3,070,691 3,070,691
2011 15,122,275 10,370,606 - 4,751,669 4,751,669
2012 14,474,034 10,503,220 - 3,970,814 3,970,814
2013 22,374,396 15,273,919 - 7,100,477 7,100,477
2014 20,451,249 15,064,699 - 5,386,550 5,386,550
2015 22,876,654 16,714,571 - 6,162,083 6,162,083
2016 20,751,393 15,601,170 - 5,150,223 5,150,223
1 - Under its contract with Service America (d/b/a Centerplate) through June 1, 2008, the CIB received a 30%
commission on ICC revenues as defined in the agreement. Effective June 2, 2008, the CIB no longer receives
commissions on ICC revenues under its agreement.
2 - Revenues minus expenses, net of Service America's management fee and share of profits and exclusive of
Colts' novelty sales through June 1, 2008. Effective June 2, 2008, the CIB retains net profits from Convention
Center events and Non-Colts events at Lucas Oil Stadium.
Source: Service America (d/b/a Centerplate) Monthly Commission Reports

Table IX
Capital Improvement Board of Managers
Ratios of Outstanding Debt by Type
Last Ten Fiscal Years
Junior Subordinate Capital Per % of
Fiscal Subordinate Revenue Due to Lease Event Per Personal
Year Notes 1
Bonds 1,3
State 2
Obligations Other Total Attendee Capita Income
2007 33,759,000$ 28,058,319$ 474,121,857$ 347,064,809$ -$ 883,003,985$ 521$ 520$ 1.33%
2008 33,759,000 24,450,944 66,946,403 931,455,268 16,371,000 1,072,982,615 557 624 1.56%
2009 33,759,000 23,087,579 185,038,966 926,049,285 9,000,000 1,176,934,830 631 675 1.76%
2010 33,759,000 21,658,178 265,535,629 900,730,275 18,000,000 1,239,683,082 680 706 1.80%
2011 33,759,000 20,162,694 - 1,152,047,761 18,000,000 1,223,969,455 609 688 1.67%
2012 33,759,000 18,596,076 - 1,143,268,830 18,000,000 1,213,623,906 497 675 1.57%
2013 33,759,000 16,953,271 - 1,123,051,172 18,000,000 1,191,763,443 562 654 1.51%
2014 33,759,000 15,224,218 - 1,097,569,587 18,000,000 1,164,552,805 486 591 1.71%
2015 33,242,000 13,408,856 - 1,066,752,122 9,000,000 1,122,402,978 539 564 1.17%
2016 32,199,000 11,502,120 - 1,032,341,183 9,000,000 1,085,042,303 583 n/a n/a
1 - These obligations are payable from and secured by a pledge of certain state and local assistance, but the lien on such revenues is subordinate to that of certain lease payment obligations of the CIB.
2 - This obligation represents the accumulation of amounts spent and accrued on the Lucas Oil Stadium and Convention Center Expansion Projects. Once the projects were completed and the related lease payments for
the facilities began, the related obligations were reclassified as capital lease obligations.3 - Amounts are net of discounts and premiums.4 - The Indianapolis-Carmel-Anderson Metropolitan Statistical Area (MSA) includes Boone, Brown, Hamilton, Hancock, Hendricks, Johnson, Madison, Marion, Morgan, Putnam, and Shelby Counties in Central Indiana,
as defined by the U.S. Office of Management and Budget.
n/a = Information is not available.
Indianapolis - Carmel MSA 4
84
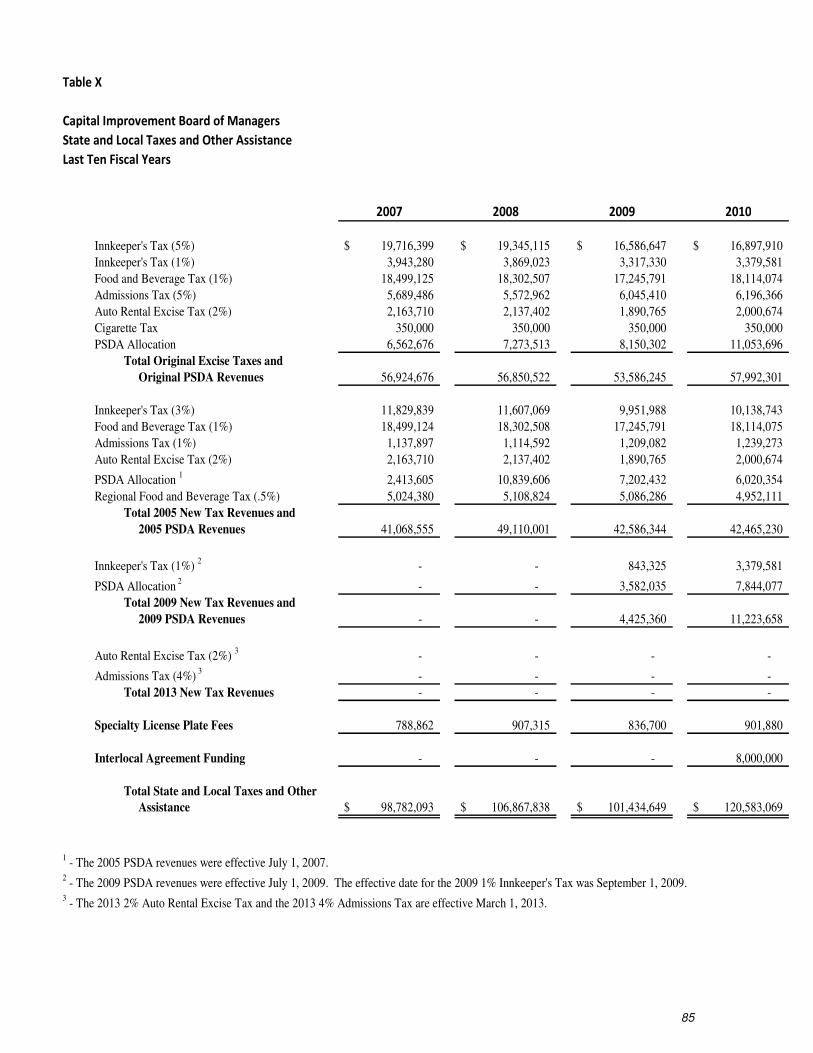
85
Table X
Capital Improvement Board of Managers
State and Local Taxes and Other Assistance
Last Ten Fiscal Years
2007 2008 2009 2010
Innkeeper's Tax (5%) 19,716,399$ 19,345,115$ 16,586,647$ 16,897,910$
Innkeeper's Tax (1%) 3,943,280 3,869,023 3,317,330 3,379,581
Food and Beverage Tax (1%) 18,499,125 18,302,507 17,245,791 18,114,074
Admissions Tax (5%) 5,689,486 5,572,962 6,045,410 6,196,366
Auto Rental Excise Tax (2%) 2,163,710 2,137,402 1,890,765 2,000,674
Cigarette Tax 350,000 350,000 350,000 350,000
PSDA Allocation 6,562,676 7,273,513 8,150,302 11,053,696
Total Original Excise Taxes and
Original PSDA Revenues 56,924,676 56,850,522 53,586,245 57,992,301
Innkeeper's Tax (3%) 11,829,839 11,607,069 9,951,988 10,138,743
Food and Beverage Tax (1%) 18,499,124 18,302,508 17,245,791 18,114,075
Admissions Tax (1%) 1,137,897 1,114,592 1,209,082 1,239,273
Auto Rental Excise Tax (2%) 2,163,710 2,137,402 1,890,765 2,000,674
PSDA Allocation 1
2,413,605 10,839,606 7,202,432 6,020,354
Regional Food and Beverage Tax (.5%) 5,024,380 5,108,824 5,086,286 4,952,111
Total 2005 New Tax Revenues and
2005 PSDA Revenues 41,068,555 49,110,001 42,586,344 42,465,230
Innkeeper's Tax (1%) 2
- - 843,325 3,379,581
PSDA Allocation 2
- - 3,582,035 7,844,077
Total 2009 New Tax Revenues and
2009 PSDA Revenues - - 4,425,360 11,223,658
Auto Rental Excise Tax (2%) 3
- - - -
Admissions Tax (4%) 3
- - - -
Total 2013 New Tax Revenues - - - -
Specialty License Plate Fees 788,862 907,315 836,700 901,880
Interlocal Agreement Funding - - - 8,000,000
Total State and Local Taxes and Other
Assistance 98,782,093$ 106,867,838$ 101,434,649$ 120,583,069$
1 - The 2005 PSDA revenues were effective July 1, 2007.
2 - The 2009 PSDA revenues were effective July 1, 2009. The effective date for the 2009 1% Innkeeper's Tax was September 1, 2009.
3 - The 2013 2% Auto Rental Excise Tax and the 2013 4% Admissions Tax are effective March 1, 2013.

86
2011 2012 2013 2014 2015 2016
20,058,708$ 22,594,512$ 22,146,073$ 24,442,590$ 25,846,373$ 28,040,681$
4,011,742 4,518,902 4,429,215 4,888,518 5,169,275 5,608,136
19,456,828 21,363,190 21,003,275 22,197,299 23,855,213 25,949,205
4,944,580 6,537,019 6,893,128 6,466,187 6,559,420 6,651,843
2,051,253 2,349,515 2,143,664 2,329,548 2,223,861 2,454,540
350,000 350,000 350,000 350,000 350,000 350,000
7,691,826 7,212,774 7,456,830 7,711,600 7,895,163 8,753,020
58,564,937 64,925,912 64,422,185 68,385,742 71,899,305 77,807,425
12,035,225 13,556,707 13,287,644 14,665,554 15,507,824 16,824,409
19,456,828 21,363,190 21,003,275 22,197,287 23,855,213 25,949,205
988,916 1,307,404 1,365,402 1,293,237 1,311,884 1,330,369
2,051,253 2,349,515 2,143,664 2,329,548 2,223,861 2,454,540
7,444,361 8,544,320 9,622,556 8,692,067 9,189,759 9,995,639
5,387,617 5,193,634 5,208,134 5,404,418 5,167,191 5,016,616
47,364,200 52,314,770 52,630,675 54,582,111 57,255,732 61,570,778
4,011,742 4,518,902 4,429,215 4,888,518 5,169,275 5,608,136
9,959,285 8,270,978 8,196,782 8,162,404 8,315,926 7,806,354
13,971,027 12,789,880 12,625,997 13,050,922 13,485,201 13,414,490
- - 1,817,460 2,329,548 2,223,861 2,454,540
- - 2,688,901 5,172,949 5,247,536 5,321,475
- - 4,506,361 7,502,497 7,471,397 7,776,015
896,960 745,860 736,440 704,820 668,840 669,840
8,000,000 8,000,000 8,000,000 8,000,000 8,000,000 8,000,000
128,797,124$ 138,776,422$ 142,921,658$ 152,226,092$ 158,780,475$ 169,238,548$
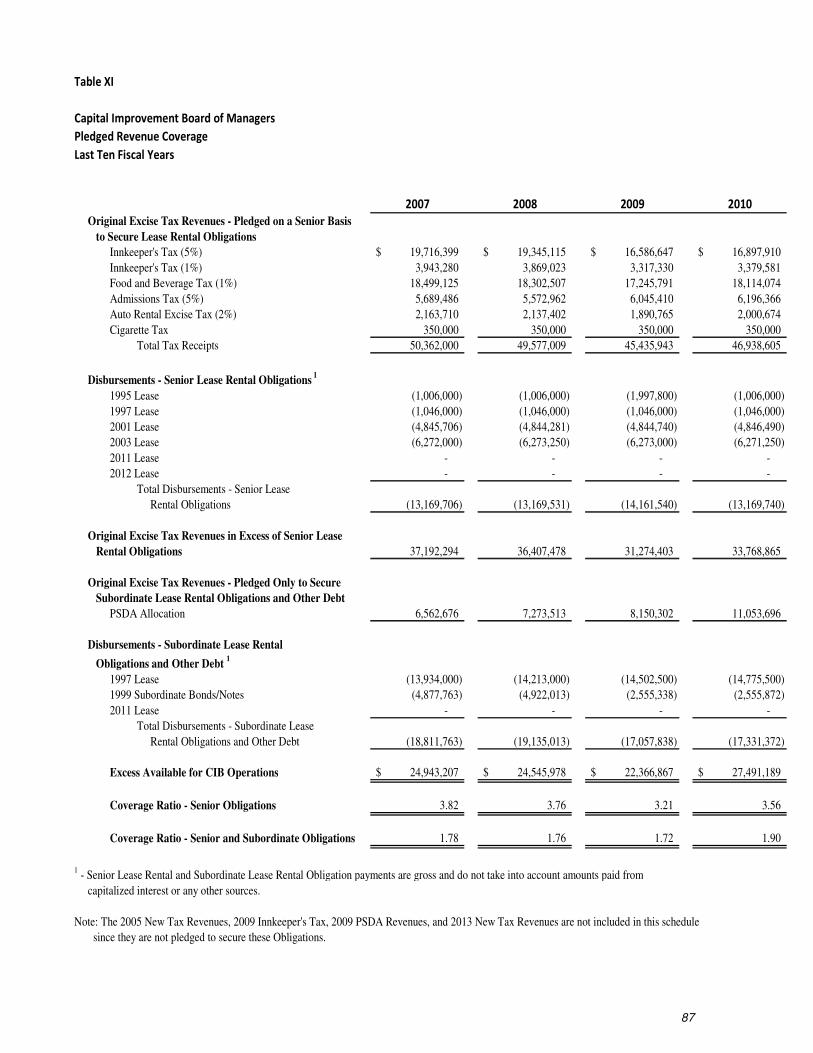
87
Table XI
Capital Improvement Board of Managers
Pledged Revenue Coverage
Last Ten Fiscal Years
2007 2008 2009 2010
Original Excise Tax Revenues - Pledged on a Senior Basis
to Secure Lease Rental Obligations
Innkeeper's Tax (5%) 19,716,399$ 19,345,115$ 16,586,647$ 16,897,910$
Innkeeper's Tax (1%) 3,943,280 3,869,023 3,317,330 3,379,581
Food and Beverage Tax (1%) 18,499,125 18,302,507 17,245,791 18,114,074
Admissions Tax (5%) 5,689,486 5,572,962 6,045,410 6,196,366
Auto Rental Excise Tax (2%) 2,163,710 2,137,402 1,890,765 2,000,674
Cigarette Tax 350,000 350,000 350,000 350,000
Total Tax Receipts 50,362,000 49,577,009 45,435,943 46,938,605
Disbursements - Senior Lease Rental Obligations 1
1995 Lease (1,006,000) (1,006,000) (1,997,800) (1,006,000)
1997 Lease (1,046,000) (1,046,000) (1,046,000) (1,046,000)
2001 Lease (4,845,706) (4,844,281) (4,844,740) (4,846,490)
2003 Lease (6,272,000) (6,273,250) (6,273,000) (6,271,250)
2011 Lease - - - -
2012 Lease - - - -
Total Disbursements - Senior Lease
Rental Obligations (13,169,706) (13,169,531) (14,161,540) (13,169,740)
Original Excise Tax Revenues in Excess of Senior Lease
Rental Obligations 37,192,294 36,407,478 31,274,403 33,768,865
Original Excise Tax Revenues - Pledged Only to Secure
Subordinate Lease Rental Obligations and Other Debt
PSDA Allocation 6,562,676 7,273,513 8,150,302 11,053,696
Disbursements - Subordinate Lease Rental
Obligations and Other Debt 1
1997 Lease (13,934,000) (14,213,000) (14,502,500) (14,775,500)
1999 Subordinate Bonds/Notes (4,877,763) (4,922,013) (2,555,338) (2,555,872)
2011 Lease - - - -
Total Disbursements - Subordinate Lease
Rental Obligations and Other Debt (18,811,763) (19,135,013) (17,057,838) (17,331,372)
Excess Available for CIB Operations 24,943,207$ 24,545,978$ 22,366,867$ 27,491,189$
Coverage Ratio - Senior Obligations 3.82 3.76 3.21 3.56
Coverage Ratio - Senior and Subordinate Obligations 1.78 1.76 1.72 1.90
1 - Senior Lease Rental and Subordinate Lease Rental Obligation payments are gross and do not take into account amounts paid from
capitalized interest or any other sources.
Note: The 2005 New Tax Revenues, 2009 Innkeeper's Tax, 2009 PSDA Revenues, and 2013 New Tax Revenues are not included in this schedule
since they are not pledged to secure these Obligations.

88
2011 2012 2013 2014 2015 2016
20,058,708$ 22,594,512$ 22,146,073$ 24,442,590$ 25,846,373$ 28,040,681$
4,011,742 4,518,902 4,429,215 4,888,518 5,169,275 5,608,136
19,456,828 21,363,190 21,003,275 22,197,299 23,855,213 25,949,205
4,944,580 6,537,019 6,893,128 6,466,187 6,559,420 6,651,843
2,051,253 2,349,515 2,143,664 2,329,548 2,223,861 2,454,540
350,000 350,000 350,000 350,000 350,000 350,000
50,873,111 57,713,138 56,965,355 60,674,142 64,004,142 69,054,405
(1,006,000) (1,006,000) (1,006,000) (408,867) - -
(523,000) - - - - -
(2,424,023) - - - - -
(6,271,750) (4,281,805) (2,134,413) - - -
(1,399,679) (4,225,282) (5,827,617) (5,844,389) (5,845,745) (5,844,550)
- (500,219) (3,192,081) (5,780,226) (6,206,014) (6,267,417)
(11,624,452) (10,013,306) (12,160,111) (12,033,482) (12,051,759) (12,111,967)
39,248,659 47,699,832 44,805,244 48,640,660 51,952,383 56,942,438
7,691,826 7,212,774 7,456,830 7,711,600 7,895,163 8,753,020
(7,453,000) - - - - -
(2,185,556) (991,400) (2,540,400) (2,543,900) (2,540,300) (2,537,200)
(2,989,100) (9,098,125) (13,561,925) (14,903,975) (15,397,100) (15,893,400)
(12,627,656) (10,089,525) (16,102,325) (17,447,875) (17,937,400) (18,430,600)
34,312,829$ 44,823,081$ 36,159,749$ 38,904,385$ 41,910,146$ 47,264,858$
4.38 5.76 4.68 5.04 5.31 5.70
2.41 3.23 2.28 2.32 2.40 2.55
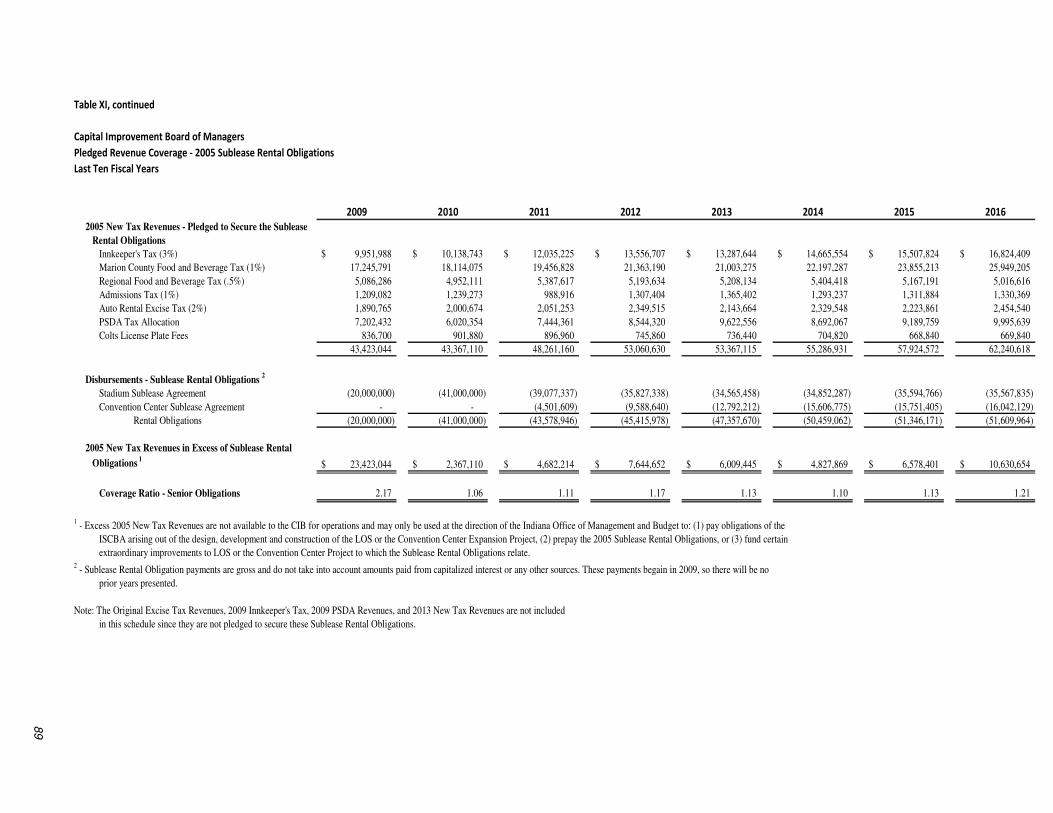
Table XI, continued
Capital Improvement Board of Managers
Pledged Revenue Coverage - 2005 Sublease Rental Obligations
Last Ten Fiscal Years
2009 2010 2011 2012 2013 2014 2015 2016
2005 New Tax Revenues - Pledged to Secure the Sublease
Rental Obligations
Innkeeper's Tax (3%) 9,951,988$ 10,138,743$ 12,035,225$ 13,556,707$ 13,287,644$ 14,665,554$ 15,507,824$ 16,824,409$
Marion County Food and Beverage Tax (1%) 17,245,791 18,114,075 19,456,828 21,363,190 21,003,275 22,197,287 23,855,213 25,949,205
Regional Food and Beverage Tax (.5%) 5,086,286 4,952,111 5,387,617 5,193,634 5,208,134 5,404,418 5,167,191 5,016,616
Admissions Tax (1%) 1,209,082 1,239,273 988,916 1,307,404 1,365,402 1,293,237 1,311,884 1,330,369
Auto Rental Excise Tax (2%) 1,890,765 2,000,674 2,051,253 2,349,515 2,143,664 2,329,548 2,223,861 2,454,540
PSDA Tax Allocation 7,202,432 6,020,354 7,444,361 8,544,320 9,622,556 8,692,067 9,189,759 9,995,639
Colts License Plate Fees 836,700 901,880 896,960 745,860 736,440 704,820 668,840 669,840
43,423,044 43,367,110 48,261,160 53,060,630 53,367,115 55,286,931 57,924,572 62,240,618
Disbursements - Sublease Rental Obligations 2
Stadium Sublease Agreement (20,000,000) (41,000,000) (39,077,337) (35,827,338) (34,565,458) (34,852,287) (35,594,766) (35,567,835)
Convention Center Sublease Agreement - - (4,501,609) (9,588,640) (12,792,212) (15,606,775) (15,751,405) (16,042,129)
Rental Obligations (20,000,000) (41,000,000) (43,578,946) (45,415,978) (47,357,670) (50,459,062) (51,346,171) (51,609,964)
2005 New Tax Revenues in Excess of Sublease Rental
Obligations 1
23,423,044$ 2,367,110$ 4,682,214$ 7,644,652$ 6,009,445$ 4,827,869$ 6,578,401$ 10,630,654$
Coverage Ratio - Senior Obligations 2.17 1.06 1.11 1.17 1.13 1.10 1.13 1.21
1 - Excess 2005 New Tax Revenues are not available to the CIB for operations and may only be used at the direction of the Indiana Office of Management and Budget to: (1) pay obligations of the
ISCBA arising out of the design, development and construction of the LOS or the Convention Center Expansion Project, (2) prepay the 2005 Sublease Rental Obligations, or (3) fund certain
extraordinary improvements to LOS or the Convention Center Project to which the Sublease Rental Obligations relate.2 - Sublease Rental Obligation payments are gross and do not take into account amounts paid from capitalized interest or any other sources. These payments begain in 2009, so there will be no
prior years presented.
Note: The Original Excise Tax Revenues, 2009 Innkeeper's Tax, 2009 PSDA Revenues, and 2013 New Tax Revenues are not included
in this schedule since they are not pledged to secure these Sublease Rental Obligations.
89

90
Table XII
Capital Improvement Board of Managers
Demographic and Economic Statistics
Last Ten Fiscal Years
Personal Per Capita Annual Average
Income Personal Unemployment
Year Population (in millions) Income Rate
2007 1,697,656 66,396 39,110 3.9%
2008 1,720,796 68,804 39,984 6.7%
2009 1,743,658 66,989 38,419 8.4%
2010 1,756,241 68,888 39,225 8.4%
2011 1,778,568 73,298 41,212 8.2%
2012 1,798,634 77,492 43,084 7.9%
2013 1,823,479 78,929 43,285 5.8%
2014 2
1,971,274 67,940 44,017 5.7%
2015 1,988,817 96,004 48,272 4.1%
2016 n/a n/a n/a 4.2%
1 - The Indianapolis-Carmel-Anderson Metropolitan Statistical Area (MSA) includes Boone,
Hamilton, Hancock, Hendricks, Johnson, Madison, Marion, Morgan, and Shelby counties in
Central Indiana, as defined by the U.S. Office of Management and Budget.
2 - During 2014, the city of Anderson and the counties of Madison and Morgan were
added to the Indianapolis-Carmel-Anderson MSA
n/a = Information is not available.
Source: Indiana Department of Workforce Development (www.hoosierdata.in.gov)
Indianapolis-Carmel-Anderson MSA 1
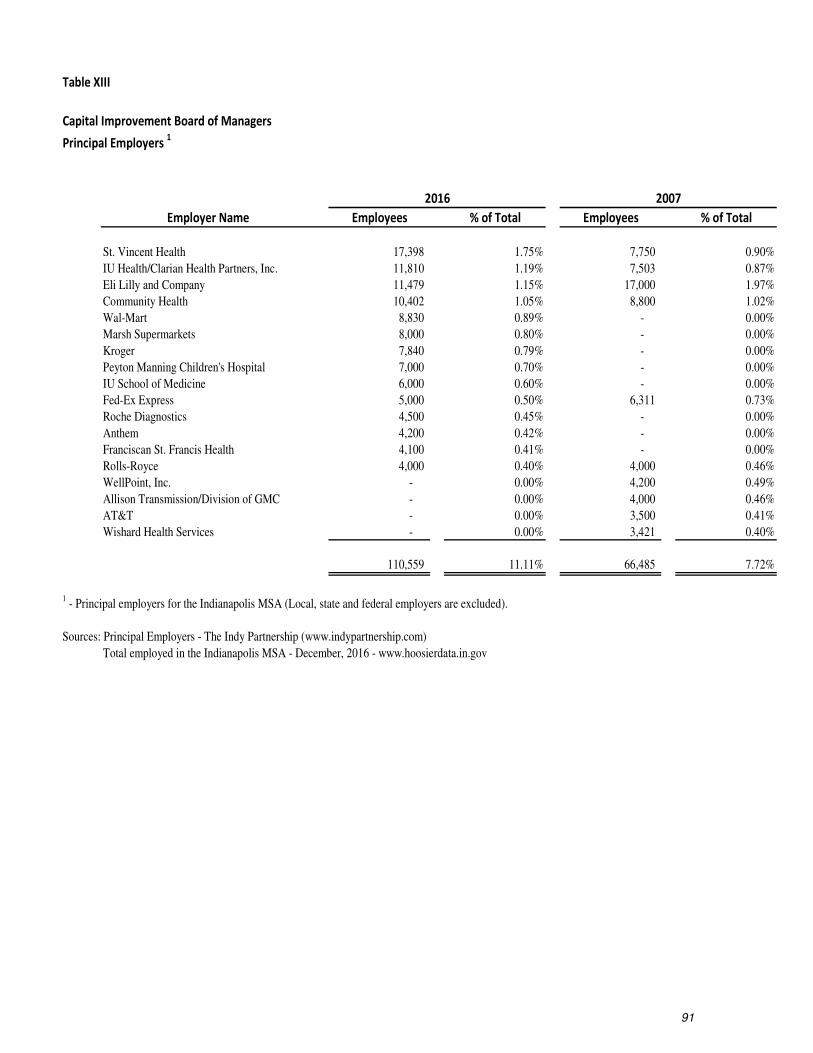
91
Table XIII
Capital Improvement Board of Managers
Principal Employers 1
Employer Name Employees % of Total Employees % of Total
St. Vincent Health 17,398 1.75% 7,750 0.90%
IU Health/Clarian Health Partners, Inc. 11,810 1.19% 7,503 0.87%
Eli Lilly and Company 11,479 1.15% 17,000 1.97%
Community Health 10,402 1.05% 8,800 1.02%
Wal-Mart 8,830 0.89% - 0.00%
Marsh Supermarkets 8,000 0.80% - 0.00%
Kroger 7,840 0.79% - 0.00%
Peyton Manning Children's Hospital 7,000 0.70% - 0.00%
IU School of Medicine 6,000 0.60% - 0.00%
Fed-Ex Express 5,000 0.50% 6,311 0.73%
Roche Diagnostics 4,500 0.45% - 0.00%
Anthem 4,200 0.42% - 0.00%
Franciscan St. Francis Health 4,100 0.41% - 0.00%
Rolls-Royce 4,000 0.40% 4,000 0.46%
WellPoint, Inc. - 0.00% 4,200 0.49%
Allison Transmission/Division of GMC - 0.00% 4,000 0.46%
AT&T - 0.00% 3,500 0.41%
Wishard Health Services - 0.00% 3,421 0.40%
110,559 11.11% 66,485 7.72%
1 - Principal employers for the Indianapolis MSA (Local, state and federal employers are excluded).
Sources: Principal Employers - The Indy Partnership (www.indypartnership.com)
Total employed in the Indianapolis MSA - December, 2016 - www.hoosierdata.in.gov
2016 2007
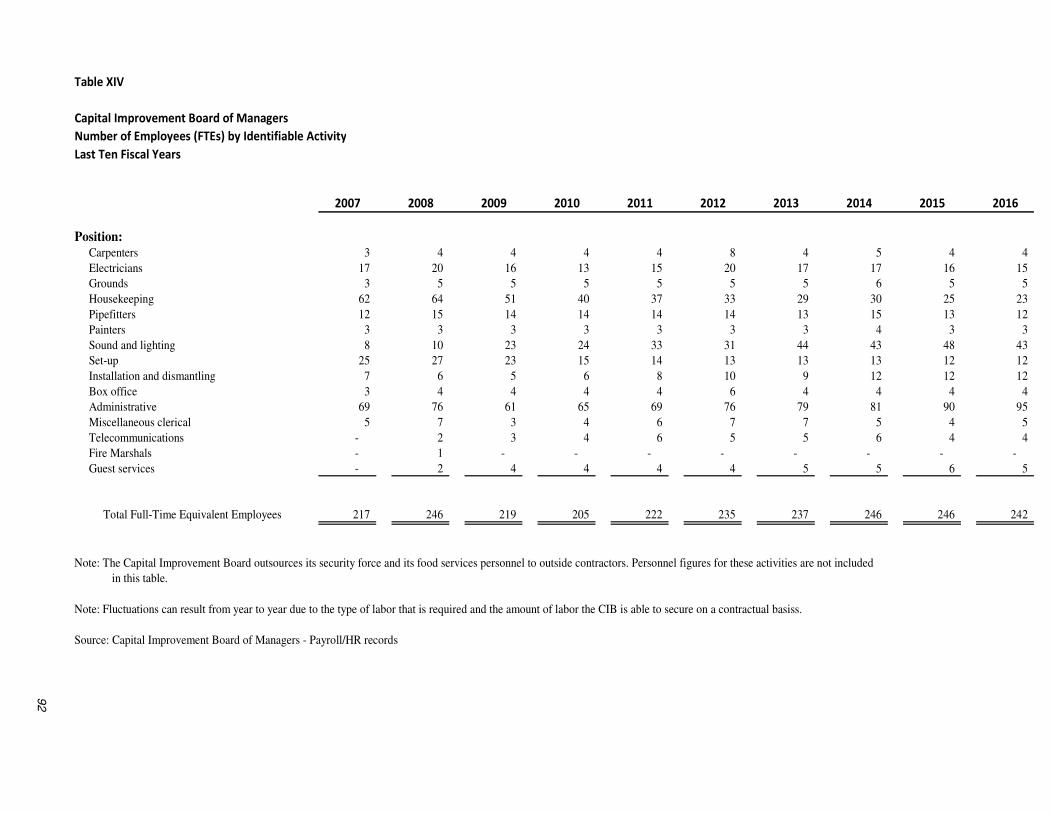
Table XIV
Capital Improvement Board of Managers
Number of Employees (FTEs) by Identifiable Activity
Last Ten Fiscal Years
2007 2008 2009 2010 2011 2012 2013 2014 2015 2016
Position: Carpenters 3 4 4 4 4 8 4 5 4 4
Electricians 17 20 16 13 15 20 17 17 16 15
Grounds 3 5 5 5 5 5 5 6 5 5
Housekeeping 62 64 51 40 37 33 29 30 25 23
Pipefitters 12 15 14 14 14 14 13 15 13 12
Painters 3 3 3 3 3 3 3 4 3 3
Sound and lighting 8 10 23 24 33 31 44 43 48 43
Set-up 25 27 23 15 14 13 13 13 12 12
Installation and dismantling 7 6 5 6 8 10 9 12 12 12
Box office 3 4 4 4 4 6 4 4 4 4
Administrative 69 76 61 65 69 76 79 81 90 95
Miscellaneous clerical 5 7 3 4 6 7 7 5 4 5
Telecommunications - 2 3 4 6 5 5 6 4 4
Fire Marshals - 1 - - - - - - - -
Guest services - 2 4 4 4 4 5 5 6 5
Total Full-Time Equivalent Employees 217 246 219 205 222 235 237 246 246 242
Note: The Capital Improvement Board outsources its security force and its food services personnel to outside contractors. Personnel figures for these activities are not included
in this table.
Note: Fluctuations can result from year to year due to the type of labor that is required and the amount of labor the CIB is able to secure on a contractual basiss.
Source: Capital Improvement Board of Managers - Payroll/HR records
92
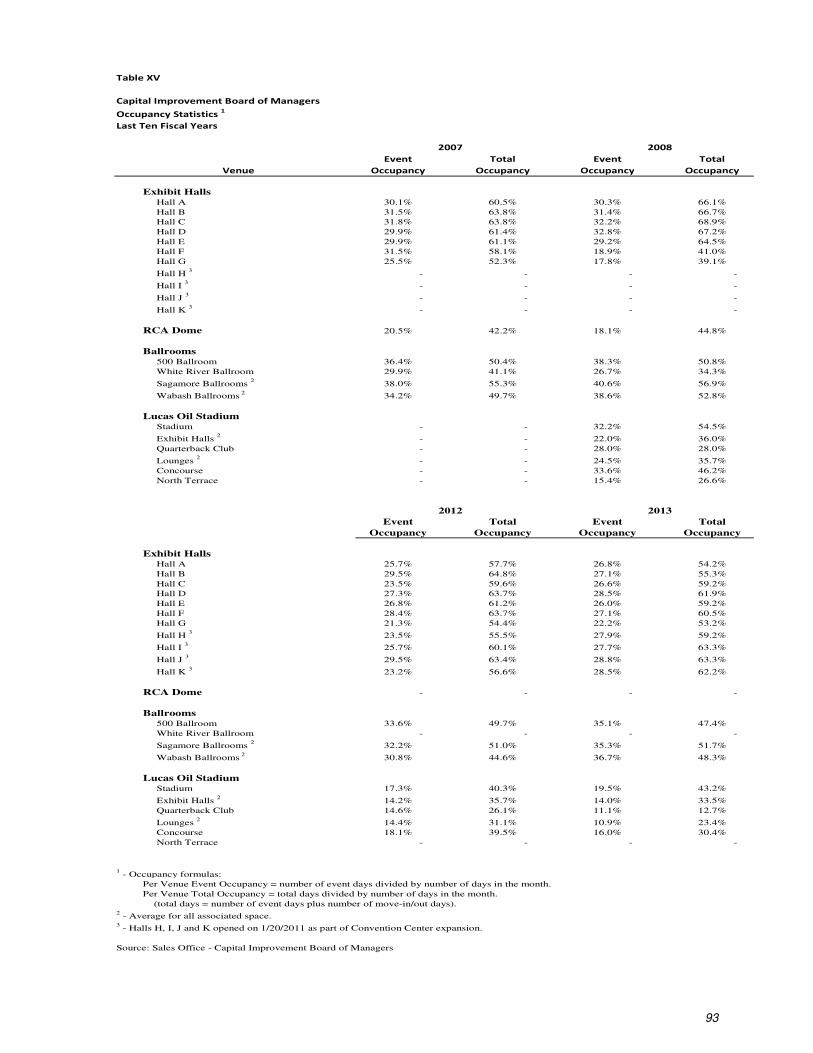
93
Table XV
Capital Improvement Board of Managers
Occupancy Statistics 1
Last Ten Fiscal Years
Event Total Event Total
Venue Occupancy Occupancy Occupancy Occupancy
Exhibit Halls Hall A 30.1% 60.5% 30.3% 66.1%
Hall B 31.5% 63.8% 31.4% 66.7%
Hall C 31.8% 63.8% 32.2% 68.9%
Hall D 29.9% 61.4% 32.8% 67.2%
Hall E 29.9% 61.1% 29.2% 64.5%
Hall F 31.5% 58.1% 18.9% 41.0%
Hall G 25.5% 52.3% 17.8% 39.1%
Hall H 3
- - - -
Hall I 3
- - - -
Hall J 3
- - - -
Hall K 3
- - - -
RCA Dome 20.5% 42.2% 18.1% 44.8%
Ballrooms 500 Ballroom 36.4% 50.4% 38.3% 50.8%
White River Ballroom 29.9% 41.1% 26.7% 34.3%
Sagamore Ballrooms 2
38.0% 55.3% 40.6% 56.9%
Wabash Ballrooms 2
34.2% 49.7% 38.6% 52.8%
Lucas Oil Stadium Stadium - - 32.2% 54.5%
Exhibit Halls 2
- - 22.0% 36.0%
Quarterback Club - - 28.0% 28.0%
Lounges 2
- - 24.5% 35.7%
Concourse - - 33.6% 46.2%
North Terrace - - 15.4% 26.6%
Event Total Event Total
Occupancy Occupancy Occupancy Occupancy
Exhibit Halls Hall A 25.7% 57.7% 26.8% 54.2%
Hall B 29.5% 64.8% 27.1% 55.3%
Hall C 23.5% 59.6% 26.6% 59.2%
Hall D 27.3% 63.7% 28.5% 61.9%
Hall E 26.8% 61.2% 26.0% 59.2%
Hall F 28.4% 63.7% 27.1% 60.5%
Hall G 21.3% 54.4% 22.2% 53.2%
Hall H 3
23.5% 55.5% 27.9% 59.2%
Hall I 3
25.7% 60.1% 27.7% 63.3%
Hall J 3
29.5% 63.4% 28.8% 63.3%
Hall K 3
23.2% 56.6% 28.5% 62.2%
RCA Dome - - - -
Ballrooms 500 Ballroom 33.6% 49.7% 35.1% 47.4%
White River Ballroom - - - -
Sagamore Ballrooms 2
32.2% 51.0% 35.3% 51.7%
Wabash Ballrooms 2
30.8% 44.6% 36.7% 48.3%
Lucas Oil Stadium Stadium 17.3% 40.3% 19.5% 43.2%
Exhibit Halls 2
14.2% 35.7% 14.0% 33.5%
Quarterback Club 14.6% 26.1% 11.1% 12.7%
Lounges 2
14.4% 31.1% 10.9% 23.4%
Concourse 18.1% 39.5% 16.0% 30.4%
North Terrace - - - -
1 - Occupancy formulas:
Per Venue Event Occupancy = number of event days divided by number of days in the month.
Per Venue Total Occupancy = total days divided by number of days in the month.
(total days = number of event days plus number of move-in/out days).2 - Average for all associated space.
3 - Halls H, I, J and K opened on 1/20/2011 as part of Convention Center expansion.
Source: Sales Office - Capital Improvement Board of Managers
2007 2008
2012 2013

94
Event Total Event Total Event Total
Occupancy Occupancy Occupancy Occupancy Occupancy Occupancy
30.1% 63.1% 29.3% 58.1% 31.2% 65.8%
34.4% 68.9% 29.0% 58.6% 28.8% 64.1%
31.7% 67.5% 29.6% 62.2% 26.0% 62.2%
33.3% 68.3% 31.5% 62.7% 30.7% 66.8%
26.2% 63.1% 27.9% 60.8% 25.5% 61.4%
18.3% 39.1% 20.0% 41.9% 23.0% 53.7%
15.6% 36.9% 14.2% 32.9% 21.1% 51.5%
- - - - 18.5% 45.7%
- - - - 19.7% 47.4%
- - - - 23.4% 52.0%
- - - - 19.9% 47.7%
- - - - - -
30.3% 43.7% 22.7% 42.5% 30.7% 39.7%
- - - - - -
36.0% 50.2% 23.7% 45.9% 31.6% 45.2%
35.9% 47.9% 23.2% 39.6% 39.8% 48.2%
39.2% 88.1% 16.2% 36.2% 18.4% 31.8%
32.6% 71.3% 14.9% 28.1% 14.1% 26.8%
33.6% 44.8% 18.9% 22.7% 12.1% 13.9%
33.3% 62.2% 14.7% 23.9% 13.4% 18.9%
39.2% 76.2% 18.4% 31.0% 19.2% 28.8%
19.6% 49.7% - - - -
Event Total Event Total Event Total
Occupancy Occupancy Occupancy Occupancy Occupancy Occupancy
25.5% 52.6% 25.5% 54.5% 29.0% 58.5%
24.1% 50.7% 24.7% 51.2% 29.5% 59.0%
25.2% 54.8% 25.2% 55.6% 27.9% 59.6%
27.1% 58.6% 26.8% 56.4% 26.0% 55.2%
24.4% 56.4% 22.7% 50.1% 23.8% 51.9%
22.7% 50.4% 20.8% 47.9% 26.2% 57.1%
20.3% 47.4% 20.0% 46.3% 22.7% 51.9%
23.8% 53.7% 20.5% 49.9% 24.3% 56.8%
23.3% 53.4% 24.1% 55.3% 30.3% 65.3%
26.0% 58.4% 28.2% 61.6% 32.8% 65.3%
24.7% 57.0% 27.1% 60.5% 32.2% 63.9%
- - - - - -
32.6% 43.6% 27.4% 36.4% 31.7% 43.4%
- - - - - -
32.6% 47.9% 33.2% 47.1% 31.5% 48.0%
32.1% 43.2% 30.2% 39.9% 33.3% 44.0%
20.4% 41.1% 20.6% 43.3% 20.5% 35.5%
16.0% 32.1% 11.7% 32.2% 17.0% 32.1%
14.4% 17.4% 17.0% 19.8% 11.2% 14.8%
15.4% 29.4% 12.7% 31.5% 10.2% 18.9%
20.1% 37.8% 17.1% 38.3% 18.0% 28.4%
- - - - - -
2009 2010 2011
2014 2015 2016