maryland capital improvement planning process and capital
TRANSCRIPT
Maryland Capital Improvement Planning Process and Capital Facilities Space Guidelines
for Higher Education Report
Prepared By:
Workgroup to Study Maryland’s Capital Improvement Planning Process
and Capital Facilities Space Guidelines for Higher Education
October 2006
MARYLAND HIGHER EDUCATION COMMISSION
Kevin M. O’Keefe, Chairman
Donald J. Slowinski, Sr., Vice Chairman
Victor E. Bernson, Jr.
Joann A. Boughman
Anne Osborn Emery
Ilona Modly Hogan
James G. Morgan
Kurt A. Musser
Emmett Paige, Jr.
Sherman L. Ragland, II
Paul L. Saval
Mario F. VillaSanta
Calvin W. Burnett Secretary of Higher Education
Robert L. Ehrlich, Jr. Michael S. Steele Governor Lt. Governor

i
Table of Contents Workgroup Members……………………………………………………….1 Background....................................................................................................3 Higher Education Capital Budget ..................................................................3 Space Guidelines and Assessment of Space Needs .......................................5
Type of Institution..............................................................................6 Space Inventory .................................................................................6 Enrollment..........................................................................................7 Space Factor.......................................................................................8 Weekly Student Contact Hours..........................................................9 Space Allowance................................................................................10
Assessment of Space Using Current Space Guidelines .................................10
Current Inventories ............................................................................10 Projected Inventories .........................................................................11
Weekly Student Contact Hours and Utilization Rates...................................14 Impact of Scheduling and Enrollment Management Practices on Space Utilization.......................................................................................15 Assessment of Standards Used in Other States..............................................17 Limitations of Assessment Standards ............................................................18
Building and Space Quality ...............................................................18 Importance of Facility Renewal.........................................................19 Distance Learning ..............................................................................21
Findings and Recommendations ....................................................................22 Appendix Exhibit A. Space Guidelines
Community Colleges .........................................................................1-9 Four-Year Public Institutions.............................................................10-12
Exhibit B. Space Planning Data
Community Colleges .........................................................................1-2 Four-Year Public Institutions.............................................................3
Exhibit C. Community College Space Surplus and Deficit Exhibit D. Four-Year Public Institutions Space Surplus and Deficits

ii
Exhibit E. Community College Academic Space Inventory Exhibit F. Four-Year Public Institution Academic Space Inventory Exhibit G. Review of Community College and State University Facilities Space Planning Models Florida Postsecondary Education Planning Commission – January 2000 Exhibit H. Enrollment and Utilization Data

1
Workgroup Members Barbara Ash Director of Research Maryland Association of Community Colleges
Larry Hartwick Capital Project Manager St. Mary’s College of Maryland
David Beard Finance Policy Analyst Maryland Higher Education Commission
Rachel Hise Senior Policy Analyst Department of Legislative Services
Mark Beck Director, Capital Planning University System of Maryland
Charles “Chip” Jackson Associate Vice President for Facilities St. Mary’s College of Maryland
Tim Campbell Executive Vice President and Chief Business and Financial Officer Villa Julie College
Diane Lucas Supervising Budget Examiner Department of Budget and Management Office of Budget Analysis
Jeffrey Cann Finance Policy Analyst Maryland Higher Education Commission
Denise Nadasen Director, Office of Institutional Research, Planning & Assessment University of Maryland, College Park
Gregory Deal Assistant Vice President for Campus Operations Harford Community College
Geoffrey Newman Director of Finance Policy Maryland Higher Education Commission
Janice Doyle Assistant Secretary for Finance Policy Maryland Higher Education Commission
Monica Randall Director of Finance Policy Maryland Higher Education Commission
Gayle Fink Director of Institutional Research University System of Maryland
Matthew D. Riven Vice President for Research and Policy Development Maryland Independent College and University Association

2
Teresa Garraty Team Leader Department of Budget and Management Office of Capital Budgeting
Ray Vollmer Associate Vice President for Finance & Management Morgan State University
Arthur Glass Vice President for Administration Frederick Community College
Cynthia Wilder University Facility Planner Morgan State University
3
Background In the 2004 Maryland State Plan for Postsecondary Education, The Maryland Higher Education Commission (MHEC) included several recommendations to assess the implications of enrollment growth on capacity at Maryland’s colleges and universities. Current Commission enrollment projections anticipate an increase of almost 56,000 postsecondary education students by 2015. The purpose of this assessment was to determine how best to meet the needs of this increasing student population, including whether additional facilities are needed and, if so, where are they needed. In addition, the assessment included discussion of whether Maryland is maximizing utilization of current and existing higher education facilities and if there are ways other than building space or increasing space usage to accommodate more students. The first step was to examine the capital facilities space guidelines for higher education and the capital improvement planning process. To conduct the review process, the Enrollment and Capacity Work Group was established. Under the direction of MHEC, the work group comprised members of the higher education community, including representatives of the University System of Maryland, Morgan State University, St. Mary’s College of Maryland, the Maryland Independent Colleges and Universities Association, the Maryland Association of Community Colleges, the Department of Budget and Management and the Department of Legislative Services. A broad review of the principle factors affecting space guidelines and the facilities inventory systems for both the four-year institutions and the community colleges was conducted. The workgroup acknowledged the complexity of the issue and determined that their review of the space guidelines would focus on academic space, specifically Classroom and Teaching Laboratory space. Both categories represent space directly related to meeting the academic needs of students. If it was determined that the guidelines required more extensive review, a committee comprising facility planning specialists would need to be convened to conduct the analysis. Higher Education Capital Budget
Each year, the Governor and General Assembly pass a State budget that authorizes the issuance of debt for capital projects for all state agencies and several jurisdictions. Included in the annual authorization are capital projects including construction of new facilities, renovation of existing facilities, improvements to infrastructure, property acquisition, and maintenance and renewal funding for facilities for public and private colleges and universities.
Four-Year Public Colleges and Universities State capital funds for four-year public colleges and universities are provided directly to the institutions through the Maryland Consolidated Capital Bond Bill as General Obligation (G.O.) Bonds, as PAYGO funds provided through the annual operating budget, and as Academic Revenue Bonds (ARB). Four-year colleges and universities

4
and Baltimore City Community College develop ten-year facilities master plans based on facilities inventory and space needs assessments, which are then considered for adoption into the statewide five-year Capital Improvement Program (CIP). Community Colleges State capital funds for locally-operated community colleges are provided through the Community College Construction Grant Program (Grant), which is administered by MHEC, and reviewed and analyzed by the Maryland Department of Budget and Management (DBM) and the Maryland Department of General Services (DGS).
The Grant program comprises capital projects submitted by the community colleges in their annual five-year Capital Improvement Program (CIP) that presents a capital budget request for the current fiscal year and projections for the subsequent four years. For projects to be considered for the Grant, colleges must submit a program statement for each project to the three agencies. Analysis of the program statements includes review of several factors, including:
1. timing of the project, 2. the project’s consistency with the mission of the college and inclusion in
the facilities master plan, 3. enrollment demand at the college, 4. capacity and space needs, and 5. availability of local funding and project costs.
In addition, each project is prioritized within a project category and by type of facility according to the MHEC Capital Funding Guidelines. The amount of State funding for a project eligible for inclusion in the Community College Capital Grant program is based on two criteria:
(1) The portion of the project which meets the eligibility requirements for State support, and (2) The State/local cost-sharing formula as defined in statute and based on the current expense formula used by the Maryland State Department of Education (MSDE). Regional colleges may receive up to 75 percent of State support while other community colleges may receive between 50 percent and 70 percent of State support, depending on the wealth of their jurisdiction. The balance of funding for projects is provided through local and/or college sources.
Total funding for the Community College Capital Grant is then determined by the funding needed for eligible projects and funding available from the State to fund the Grant. MHEC compiles a consolidated list of all community college projects to be included within the program for the current fiscal year.

5
Over the past five fiscal years, the State has made significant progress in adding to the space capacity at public colleges and universities. Between FY 2002 and 2006, Maryland provided almost $1.3 billion in funding for capital projects at both the four-year public institutions and community colleges. Funding to four-year public institutions represented $870 million of the total and the community colleges received over $185 million. In FY 2007, an additional $270 million in funding was authorized for institutional capital projects, of which $214 million was authorized for the four-year public institutions, and almost $56 million was provided for the community colleges. In addition, the State Capital Improvement Program commits to over $649 million for the four-year public institutions and over $257 million for the community colleges in State capital funding between fiscal 2008 and fiscal 2011. Space Guidelines and Assessment of Space Needs Maryland space guidelines are used by MHEC, DBM, DGS, the Maryland Office of Planning, and the Board of Public Works to evaluate individual construction projects and long range planning to determine higher education space needs to be considered for capital funding. They provide standards for computation of space allowances using space categories listed in the national Higher Education General Information Survey (HEGIS) Space Classification System. Exhibit A provides the current space guidelines for public four-year institutions and community colleges. The determination of space needs includes consideration of the following:
1. Type of institutions for which the need is to be considered, 2. Current and projected space inventories, 3. Current and projected enrollments, 4. Calculation of space factors, and 5. Calculation of space allowances.
Community colleges and four-year institutions follow separate guidelines to allow for differences in mission, enrollment, student population, and overall facilities needs. For the purpose of this analysis, the workgroup focused on three categories of academic space: classroom, teaching laboratory, and office space. The workgroup focused on these three categories because they use similar factors to determine needs and to calculate projections. The standards for research laboratory space and for study and stack space were not reviewed. These standards use other factors for measurement and projections, but have never been completely reviewed to determine whether they are the best and most valid factors to use in order to evaluate these categories. Therefore, the review of space guidelines in this report focuses on classroom, teaching laboratory and office space only.
6
Type of Institution The public four-year space guidelines were last updated in 1999. They provide specific factors for calculating space requirements based on several factors, including enrollment, net assignable square feet, and bound volume equivalents. The factors used in calculating space needs are based upon where the space falls within the HEGIS classification (e.g. Classroom – HEGIS 100). In general, four-year institutions enroll larger numbers of “traditional” students (i.e. full-time residential students ages 18 – 22) seeking bachelor’s degrees. These institutions have a greater need for support and athletic facilities space. Community College guidelines were developed in 2000 and are very similar to the guidelines used for four-year public colleges and universities. Specific space factors are used to determine space needs by HEGIS code classification. While the factors are similar for both the community colleges and the public four-year institutions, space needs as calculated by the guidelines can differ as they take into consideration community college characteristics of enrolling larger numbers of working and parenting students seeking associate’s degrees or specialized training. A greater proportion of community college students enroll on a part-time basis. In general, whereas four-year institutions enroll a greater proportion of full-time residential students, community college enrollments include a large proportion of students in continuing education and workforce development courses. Other differences for facility needs correspond to the upper-division level of undergraduate as well as post-baccalaureate instruction provided at the four-year institutions. Even within public four-year institutions, these needs can differ greatly depending upon the level of instruction provided and research performed, i.e. baccalaureate, master’s, doctorate, or first-professional level. Space Inventory The first factor to be considered in calculating space needs is an institution’s space inventory. Space inventories are expressed in Net Assignable Square Feet (NASF), reflecting functional space excluding hallways, restrooms, and mechanical rooms. Higher education institutions are required to report current space inventories of campus facilities annually to MHEC in the Facilities Inventory Report. Community colleges perform physical inventories on an annual or bi-annual basis in order to keep current with space available in their facilities. Four-year public institutions survey their campuses as needed, revise their records and report a full Space Inventory and Guidelines Application (SGAP) Report every year. The facilities inventory reports provide the current inventory of facilities at a campus and include:
1. Type of facility by one of eight room use categories, 2. Size of facility in Gross Square Feet (GSF) and Net Assignable Square
Feet (NASF), 3. Year constructed,
7
4. Year renovated, 5. Condition of facility, 6. Replacement value, and 7. Renovation costs.
Facilities Inventory reports include both on- and off-campus space, as well as leased space. They represent the baseline from which current and projected space needs and allowances are calculated and are used to project future space needs in the space guidelines application program (SGAP) for the four-year institutions, and in the Facilities Inventory and Computation of Space Needs tables for community colleges. Projected space inventories are determined by adding or deleting space provided by capital projects estimated to be completed within a ten-year period and are reported in the Existing and Projected Changes tables for four-year institutions and Facilities Inventory Changes tables for community colleges. New building projects add space to the inventory while renovation projects reconfigure space by adding space in some categories and reducing or eliminating space in others to meet capacity. Enrollment Another factor in calculating space needs is enrollment. Enrollment is measured in three forms, Full-Time Equivalent Students (FTES), Full-Time Day Equivalent Students (FTDES), and Full-Time Night Equivalent Students (FTNES). Full-Time Equivalent Students (FTES) reflects total enrollment of the institution as measured by registered credit hours and comprises both FTDES and FTNES. Full-Time Day Equivalent Students (FTDES) are based on credit hours generated by students who attend classes on campus between 8:00 am and 5:00 pm. Full-Time Night Equivalent Students are based on credit hours generated by students who attend classes after 5:00 pm. All student-based space other than classroom and laboratory space needs is calculated based on levels of FTDE enrollment. Library space is based on Bound Volume Equivalents, or numbers of books and periodicals. Weekly Student Contact Hours (WSCH) is the primary enrollment factor in the classroom and laboratory space allowances. A Weekly Student Contact Hour (WSCH) is defined as: one student in one classroom or class lab for one instructional “hour” (typically 50 minutes plus class change time) per week. Space allowances for classroom and teaching laboratories are based on WSCH generated by FTDES, or enrollments of students attending classes between 8:00 am and 5:00 pm. WSCHs are generated through FTDE for credit hours taught for a particular space category, i.e. classroom, teaching laboratory. WSCH’s are multiplied by the Space Factor to produce the Space Allowance. The space factor is explained below and is a predetermined multiplier based on the FTDE enrollment of the institution. To assess future space needs, the four-year institutions and community colleges use ten-year enrollment projections, as published in MHEC’s annual Enrollment Projections Report. For classroom and laboratory space, ten-year WSCH projections are determined

8
by multiplying current actual WSCHs by the percent change between current actual FTDE enrollment and ten-year projected FTDE enrollment. The community college space guidelines recognize enrollments at all campus locations as “on-campus” enrollments. To reflect accurate facilities inventory needs, there are situations when sites should report enrollments and facilities with their on-campus figures – these include instances where colleges have chosen to open a facility away from their main campus for the purpose of delivering programs in another part of its service area and qualifies as permanent space; and, there are situations when sites should include enrollments, but exclude facilities inventories from their on-campus figures – such as when a college is forced to utilize outside space in order to accommodate enrollment that it cannot presently fit at its main campus and is considered overflow space. This temporary overflow space should be excluded; otherwise, the need for permanent space would not be evident. For purposes of reporting facilities inventories and enrollments to be included in the computation of community college space needs, on-campus facilities and enrollments include all locations of instruction open to the general public, including main campus, branch campus and off-site locations. In calculating space needs, a facility’s space is designated as either Permanent or Overflow:
Permanent (Market-Driven, Permanent/Leased/Dedicated). Enrollments AND facilities inventories are reported when activities are directly related to market-driven conditions, with the college having choice in location. Permanent space is generally dedicated to the college. Overflow (Temporary/Leased/Shared Due to Additional Need for space). Enrollments, not facilities inventories, are reported when activities are directly related to overflow conditions (unable to accommodate on-campus demand). Shared space, such as K-12 or community facilities, is generally considered overflow.
Four-year public colleges and universities use the same approach to differentiate permanent and overflow space in the SGAP reports. Space Factor The next component considered is the space factor. The formula for calculating the space factor for classrooms and laboratories includes three components: Station Size, Utilization Rate, and Occupancy Rate.
Station Size: Station size is the Net Assignable Square Feet (NASF) assigned to each student station (NASF-SS). Classroom student stations require less NASF than class lab and open lab student stations.

9
Utilization Rate: Utilization Rate is the number of daytime hours per week the classroom/lab is scheduled to be in use.
Occupancy Rate: Occupancy Rate is the percent of classroom/lab seats occupied per week (8 am – 5 pm, Monday through Friday). The space factor formula is as follows:
Space Factor = NASF-SS Utilization Rate X Occupancy Rate
Example [See Exhibit A - Community College Space Guidelines .03B(2)]:
Space Factor (1.11) = 20 (NASF-SS) 27 (Utilization Rate) X .667 (Occupancy Rate)
The basis for space factors used in calculating classroom and laboratory needs are FTDE enrollment levels. For institutions with FTDE enrollments of 3,000 or less, the classroom space factor is 1.50, and the laboratory factor is 7.00. Institutions with more than 3,000 FTDEs use a classroom factor of 1.11 and a laboratory factor of 5.83. These factors take into account the frequency of scheduling space, whether the space is used for multiple purposes, the complexity of programs provided at larger institutions, and economies of scale realized by larger institutions. The Space Factor is multiplied by Weekly Student Contact Hours (WSCH) to calculate space allowances. Weekly Student Contact Hours Since they reflect the actual time that students spend in a classroom or laboratory, Weekly Student Contact Hours (WSCH) are the basis for determining the need for classroom and laboratory space. This factor is combined with enrollments and multiplied by the Space Factor at the institution to determine how much space should be allowed, or approved. One WSCH is defined as one student occupying a classroom or class laboratory seat for one hour. There is a high correlation between weekly student contact hours and semester credit hours at the institutional level. A typical full-time student might take four three-credit courses, each meeting in classrooms for three hours a week, and a fifth three-credit course that meets for one or two hours a week in a classroom and two or three hours a week in a lab. Because credits are not awarded for laboratory contact hours on a one to one basis, the number of WSCH at each campus is slightly higher than the number of semester credit hours. WSCH are reported by each institution and are dependent upon the programs and classes offered. Because WSCHs measure time spent in the room rather than credit or credit
10
hours generated, WSCHs may vary greatly not only between different institutions, but also between classes and programs, particularly at the WSCH per student level. For example, a three credit course that requires only three hours of class time per week will generate lower WSCHs than a course carrying the same credit hours but requiring more classroom time. Thus, two institutions that would appear to be similar in other aspects might have differing space needs based upon the types of classes and programs they offer. This makes standardization of weekly student contact hours extremely difficult. Exhibit B provides weekly student contact hours by institution within the community colleges and the University System of Maryland. A typical undergraduate FTDE student will have 15 credit hours and a total of 10 to 18 WSCH in classrooms and class labs. Campuses with large graduate enrollments might have a lower ratio of FTDE to WSCH because full-time graduate students are assumed to carry 12 rather than 15 semester credit hours. State guidelines use WSCH projections to estimate the need for both classroom and class laboratory space. WSCH are projected separately for each of those space guidelines, broken down as 13 to 14 classroom WSCH per FTDE, and 3 to 4 class lab WSCH per FTDE. Space Allowance Finally, the consideration of space allowances for different types of space are taken into account. For classroom and laboratory inventories, the Space Factor multiplied by Weekly Student Contact Hours (WSCH) provides the Space Allowance. The Space Allowance is then compared with the actual inventory to determine whether a surplus (actual inventory is greater than allowance) or a deficit (actual inventory is less than allowance) exists. Assessment of Space Using Current Space Guidelines Current Inventories Exhibits C through F show academic space surplus and deficit and inventory data for Maryland community colleges and public four-year institutions. An analysis of current academic space inventory at public community colleges indicates an overall deficit of 665,904 NASF out of 3.3 million NASF in total academic space (Exhibits C and E). Community colleges show an overall surplus of 77,714 NASF on a total inventory of 846,084 NASF in classroom space, a deficit of 380,764 NASF on a total inventory of 1.2 million NASF in teaching laboratory space, and a deficit of 362,854 NASF on a total inventory of 1.2 million NASF in office space. For purposes of this discussion, total academic space means the sum of the classroom, teaching laboratory, and office space categories reported in Exhibits C through F.
11
However, it is important to note that while the community colleges as a segment may show a surplus or deficit overall, space needs of each institution should be looked at on an individual basis, as they will have either surpluses or deficits independent of the overall segment. A breakout of space categories by community colleges in Exhibit C shows that most colleges have a surplus of classroom space. Only Carroll Community College, the Community college of Baltimore County, Montgomery College, and Wor-Wic Community College report current deficits of classroom space. Six colleges report current laboratory space surpluses while all colleges except Cecil Community College report deficits in office space. Four-year public colleges and universities show even greater space deficits. As Exhibits D and F show, these institutions show an overall deficit of 222,659 NASF on a total inventory of 1 million NASF in classroom space, a deficit of 402,409 NASF on 1.4 million NASF in teaching laboratory space, and a deficit of 112,500 NASF in office space. An analysis of the surplus and deficits at individual Maryland four-year public campuses shows the following: while the overall public four-year segment shows a deficit in classroom space, the institutional classroom space ranges from a high of 5,434 NASF surplus at the University of Baltimore to a 97,272 NASF deficit at the University of Maryland, College Park. The levels of deficits at other campuses fall between 7,500 and 16,500 NASF with the outliers being Frostburg State University with a surplus of 2,043 NASF, Towson University with a deficit of 22,356 NASF and University of Maryland Baltimore County with a 47,877 NASF deficit. Total academic space shows a range of a 37,652 NASF surplus at the University of Maryland Eastern Shore to a 476,254 NASF deficit at the University of Maryland, Baltimore. Bowie State University, Frostburg State University and the University of Baltimore report surpluses of total academic space. Other institutions report deficits falling between 12,966 NASF at Morgan State University to 103,913 NASF for Towson University. Other institutions with large academic space deficits include University of Maryland, College Park at 68,512 NASF, Salisbury University at 51,279 NASF, and Morgan State University at 44,323 NASF. Projected Inventories In addition to showing current space inventory surplus and deficit data, Exhibits C and D provide ten-year projections. While these inventory projections provide valuable information to show where needs will be in the future, it is important to consider that they are limited by two elements: projections of enrollment, and projections of State resources available to fund capital projects in the future. Enrollment projections published annually by MHEC have proven to be reliable estimates of enrollment. Projections of funding that can be provided for capital projects are more problematic, since the State CIP only projects capital funding for four-year public institutions and the community college grant

12
for a period of five years. This causes a ten-year projection to be limited by the uncertainty of the level of funding available for projects past a five year period. Since conservative ten-year projections will not assume State funding for projects, and therefore will likely omit projects, in years six through ten, levels of space deficits tend to be overstated. Four-year public institutions receive State capital funding on an individual basis, therefore projections of future funding based upon the State five-year Capital Improvement Program provides more reliable information on what projects will actually be completed within ten years, as opposed to projects that the institutions would like to fund and complete. For the purpose of analysis, this report uses two parameters to establish a range of future surplus or deficits in four-year public institution space. The minimum, or 2014 Projected, level is a projection using only State-funded projects receiving funding as reported in the institutional Space Guideline Application (SGAP) reports and the maximum, or 2014 Institutional Projected, level is the level that would result from what the institutions would request to be funded based on facilities master plans for that period. Projections for community colleges are even more limited due to the nature of funding community college capital projects in a consolidated grant. Under this program, the State only projects five-year funding for the total Grant, rather than for individual community colleges and their projects. As a result, space projections for individual community colleges can only be based on funding provided in the base year, since future projections do not provide detail by college. For the purpose of analysis, this report uses two parameters to establish a range of future surplus or deficits in community college space. The minimum, or State-funded, level is a projection using only State-funded projects receiving funding in the base year and the maximum, or Community College Projected, level is a community college projection of projects for which community colleges would request funding based on facilities master plans for that period. The ten-year projections for surplus and deficit of community college space shows a minimum projected total space deficit of 580,842 NASF if fully funded, and a maximum deficit of 925,782 NASF in 2014. The range for classroom space falls between a minimum surplus of 46,730 NASF to a maximum surplus of 96,449 NASF. Laboratory space improves in either scenario from a minimum deficit of 261,113 NASF to a maximum deficit of 375,032 NASF. Office space, however, increases deficits to either a minimum 416,178 NASF, or a maximum of 597,480 NASF. A review of individual college data in Exhibit C shows that whether community college capital projects included in the current facilities master plans are fully funded, partially funded, or unfunded, twelve of the sixteen colleges are projected to have deficits in total academic space. The picture looks better for classroom space. Only Allegany College, Baltimore City Community College, Community College of Baltimore County, Harford Community College, Montgomery College and Wor-Wic Community College show projected deficits in classroom space. The Community Colleges show a greater need for laboratory space, with only four colleges, Baltimore City Community College, Carroll
13
Community College, Chesapeake College, and Hagerstown Community College reporting projected surpluses of laboratory space. The picture at four-year public institutions in Exhibit D shows increased deficits in all space categories between fall 2004 and fall 2014 for the segment. Classroom space deficit is projected to grow by a minimum of 7 percent to 239,474 NASF to a maximum of 19 percent to 265,321 NASF in fall 2014. Deficits in teaching laboratory space are projected to grow from 402,409 NASF in fall 2004 to a minimum of 442,894 NASF and a maximum of 547,211 NASF in fall 2014. Office space deficits will grow from 112,500 NASF in fall 2004 to a range of 462,162 NASF to 609,978 NASF in fall 2014. These tables illustrate how academic space availability can vary widely among institutions. Exhibit D shows, for Projected 2014 space, that only two four-year public institutions, Bowie State University and the University of Maryland Eastern Shore, project surpluses of 10,876 NASF to 27,621 NASF at Bowie State and 77,681 NASF at UMES of academic space in 2014. Only three other institutions, Salisbury University, Towson University and St. Mary’s College project improvements in their academic space deficits for that period. The University of Maryland, College Park, University of Maryland Baltimore County and Towson University project the greatest deficit ranges in classroom space at 81,657 NASF at the University of Maryland, College Park, 43,615 NASF to 55,900 NASF at University of Maryland Baltimore County, and 33,516 NASF at Towson University in 2014 space, respectively. The largest deficits in academic space are projected to be at the University of Maryland, Baltimore at 455,271 NASF to 562,011 NASF, University of Maryland Baltimore County at 180,148 NASF to 280,159 NASF, University of Maryland, College Park at 247,174 NASF to 304,604 NASF, and Morgan State University at 151,941 NASF. Even with such high projected space deficits, Maryland has made significant strides in addressing space needs at all campuses. Since fall 2000, classroom and laboratory space for four-year public colleges and universities in the University System of Maryland has risen from 2.1 million NASF to 2.4 million NASF, or 14.3 percent, for fall 2004. Total academic space during that time has increased from 5.6 million NASF to 6.4 million NASF, or 14 percent. Classroom and laboratory space at Morgan State University was 188,946 NASF in fall 2000 and 202,039 in fall 2004, while total academic space rose 6 percent from 440,176 NASF in fall 2000 to 467,089 in fall 2004. Classroom and laboratory space at St. Mary’s College remained unchanged at 48,438 NASF in fall 2000 and 2004. Total academic space rose slightly, from 106,874 in fall 2000 to 108,942 in fall 2004. As shown in Exhibit F, the projected inventory for USM in FY 2014 is 2.5 to 2.7 million NASF in classroom and laboratory space, and between 6.5 million and 6.8 million NASF in total academic space. Morgan projects total classroom and laboratory space of 212,820 NASF and total academic space of 403,547 NASF in fall 2014, while projections for St. Mary’s College are 73,375 NASF and 138,237 NASF, in total classroom and total laboratory space, respectively.
14
Community colleges reported an increase of 23 percent in classroom and laboratory space, from 1.8 million NASF in fall 2000 to 2.1 million NASF in fall 2004. Total academic space rose 14 percent, from 2.9 million NASF in fall 2000, to 3.3 million in fall 2004. Exhibit E shows that the projected inventory for community colleges ranges from an increase of 18 percent in classroom and laboratory space to 2.4 million NASF, to an increase of 27 percent to 2.6 million NASF in fall 2014. Projected total academic space showed ranges from an increase of 18 percent to 3.9 million NASF, to an increase of 27 percent to 4.2 million NASF. Weekly Student Contact Hours (WSCH) and Utilization Rates The workgroup considered the issue of institution-wide consistency in defining and calculating weekly student contact hours (WSCH) and utilization rates, two of the three factors used in calculating space needs for classroom and laboratory inventories. To determine the level of consistency in how these factors are defined and calculated by the institutions, the institutions were surveyed within their respective segments. All sixteen community colleges responded to the survey administered by the Maryland Association of Community Colleges (MACC), and the eleven degree-granting institutions of the University System of Maryland (USM) responded to the USM survey, however, the responses from the University of Maryland University College, University of Maryland, Baltimore and University of Maryland College Park were discounted because of their unique structures and levels of research needs. To maintain a constant base among all institutions, the surveys focused on assessment of classroom space, excluding laboratory space using the following principles:
• Enrollment: Use ten-year projections of fall term, full-time day equivalent (FTDE) or, for the University of Baltimore, fall term, full-time day equivalent (FTDE) or full-time night equivalent (FTNE), whichever is larger.
• Credit Hours: Only credit hours generated on-campus are used. For community
colleges, this includes credit hours from all locations, e.g. branch campuses and permanent off-campus sites controlled by the college. • Full-time Undergraduates = 15 credit hours per semester • Full-time Graduates = 12 credit hours per semester
• Weekly Student Contact Hour: Defined as one student in one classroom (or class
lab) for one instructional “hour” (typically 50 minutes plus class change time). Weekly student contact hour (WSCH) projections are to be used to compute classroom and class laboratory needs.
To calculate classroom WSCH, institutions were directed to use the following standardized instructions, using data from the prior fall semester:

15
• Identify each course that is categorized as a lecture or discussion. Exclude labs, independent studies, internships, off-campus, study abroad courses and web-based credit hours.
• Use only courses that start before 5:00 pm. If a course starts before 5:00, but
extends beyond 5:00 pm, the entire course hours are counted.
• Take the total number of minutes that each course is scheduled to meet during the week and divide by 50. This is the course Weekly Student Contact Hours (WSCH).
• Take the course WSCH and multiply by the number of students registered for the
course.
• Result: Total WSCH for one course.
• Example: One, 3-credit course, with 25 registered students (headcount)
WSCH = 150 minutes per week = 3 WSCH per student 50 minutes per class
3 WSCH per student x 25 students = 75 WSCH Utilization rates vary by campus location, building, room type, time of day and day of the week. One-time events were generally not reflected in the utilization rate. Only lecture-type classrooms owned and operated by the institution were included. Discussions of the workgroup indicate that each segment calculates Full-Time Day Equivalent student enrollment and Weekly Student Contact Hours using the same method. Survey data summarized in Exhibit H show that community college utilization rates vary significantly due to variations in the proportion of students attending in the evenings versus daytime, and on varying levels of continuing education enrollments among the colleges. USM institutions exhibit greater consistency due to similarities in day-time credit load associated with the full-time nature of the majority of their undergraduate students. Impact of Scheduling and Enrollment Management Practices on Space Utilization Enrollment management is a significant component of facilities planning. Class scheduling and class size directly impact the utilization of space. If rooms can be utilized more efficiently, class sizes can be maximized, and room scheduling for classes and labs can be managed effectively, this can have a great impact on increasing capacity of current space, and lower the need to add new space.

16
To provide practical perspective on the impact of enrollment practices and scheduling logistics on capacity, registrars from one representative institution from each segment, Anne Arundel Community College and the University of Maryland College Park, presented scheduling strategies, techniques and practices, and explained how they influence classroom utilization rates and weekly student contact hours. Scheduling classroom and laboratory space must consider several factors, including: the type of instruction and content needed; the number and timing of classes to be scheduled within day and evening sessions; location and demand for classes on- and off-campus by enrollment and facilities; requirements for temporary or surge space if needed; and the impact of online or distance education enrollments to meet the need. Anne Arundel Community College enhances capacity utilization by scheduling space in a priority system. Credit classes to be provided in a full semester have priority over classes provided for shorter periods or for non-credit classes. Classes provided three days per week have priority over those classes scheduled for only two days per week. College scheduling is centralized through the registrar’s office rather than through departments or faculty. Further, student needs are also considered a high priority. For example, evening classes start later at the Arnold campus than at the Arundel Mills site to accommodate for student commute times. Alternatively, education classes typically start and end early to accommodate students’ outside work schedules. The University of Maryland, College Park practices a similar approach to scheduling space to maximize utilization. For the most part, scheduling is centralized in the office of the registrar, with scheduling strategies based on departmental needs and university-wide requirements. While scheduling is centralized, Department Chairs maintain the ability to reserve or hold space for unscheduled activities, allowing for some flexibility in meeting interdepartmental needs. In addition, colleges and departments have classroom and conference space that they manage independently. This type of scheduling is utilized at the discretion of the department and is not factored into the scheduling system. Thus, University-wide space reports based on scheduling data often exclude these courses. As a standard practice, this concept reduces scheduling conflicts. Another issue concerning scheduling is the limitation of space guidelines to include only hours where scheduled space time is recorded. Where space is scheduled at a department’s or professor’s discretion, or where time is scheduled ad hoc for discussion or other reasons, and this time is not formally recorded, it is not included as scheduled time. While this imposes a limitation in the analysis of space utilization, the goal is to capture all scheduled time in order to form a true picture of space needs. The workgroup considered institutional scheduling strategies in relation to utilization rates for facilities. Scheduling must be flexible and remains an ongoing effort to meet the instructional priorities of both students and faculty. It was also discussed that while institutions indicate that they strive to maximize utilization rates, deficits in classroom space cause institutions to schedule classes in alternative or substandard rooms. Classes are often scheduled in meeting rooms,
17
conference rooms, and breakout rooms that are not designed as classrooms and would not otherwise be used or counted as classroom space. Institutions also schedule classes in older classrooms that are in need of renovation and updating to meet current instructional standards. They will also schedule larger classes that result in crowded conditions where sections cannot be expanded. Community Colleges also put temporary buildings on their campuses in order to accommodate more classes. Another factor to consider in the use of alternative space to meet class scheduling needs is that technological capability is now an essential element to providing adequate classroom space. Any discussion or analysis of whether space is adequate for providing instruction must now consider if the space has been designed to support the technological needs of faculty and students and whether the space includes the following:
• configuration for interactive instruction, • flexible seating, • wireless connectivity capability, • ability to support digital audio and visual technology, • capability for individual students to interact with the instructor electronically, and • availability of access outside the classroom.
Other considerations include whether the space has adequate power and heating and air conditioning to support equipment, and if there is a central “hub”, or control area for the instructor in the class. Assessment of Standards Used in Other States To evaluate the adequacy of Maryland’s community college and four-year space planning and utilization standards for classroom and laboratory space, the workgroup examined selected national higher education space planning standards. State planning guideline comparisons were derived from a report published by the Florida Postsecondary Education Planning Commission (PEPC) titled: “A Review of Community College and State University Facilities Space Planning Models” (Final Report & Recommendations, January 2000). This report included results of a 1998 national survey of space planning standards and guidelines among state university systems and community colleges nationally (Exhibit G). Based on the national survey, three factors are considered when comparing classroom and laboratory space standards among both four-year public institutions and community colleges: Weekly Room Hours; Standard Occupancy Rate; and Student Station Size. Space guideline factors are calculated by dividing the Student Station Size by the product of Weekly Room Hours multiplied by the Occupancy Rate. The higher the Weekly Room Hours and Occupancy rates, the lower the space needs. As shown in Exhibit G, Maryland’s four-year public institution standards for classroom and instructional laboratory space are comparable to those of other states. Maryland is below the Other States average standard in Weekly Room Hours for both classroom and laboratory space, and below the Other States average standard in Station Size for
18
laboratory space. However, Maryland’s standards do fall within the ranges for each category. Maryland is slightly above the Other States average standard in Occupancy Rates for both classroom and lab space and Station Size for classroom space. Differences between Maryland and the national averages were no greater than approximately 10 percent of the average response from the surveyed university systems in each category. Maryland’s community college space standard data reflect a slightly different picture. Maryland is below the Other States average standard in every category except for classroom Station Size, and even falls outside the lower ranges of Weekly Room Hours and Occupancy Rate for laboratory space. It is not clear what impact variations in continuing education and minutes per class period (i.e., 50 vs. 60) may have on the guidelines. Limitations of Assessment Standards While the consideration of space, space needs, and capacity are important factors in the evaluation of the ability of institutions to meet the future needs of students, there are other issues that impact an institution’s enrollment capacity that are not addressed by the space guidelines. 1. Building and Space Quality Space guidelines provide a quantitative tool to evaluate current and 10-year inventory needs. However, they include no provision to evaluate building and space quality. The Commission’s Facilities Inventory System Report, which is based on the Postsecondary Education Facilities Inventory and Classification Manual of the National Center for Education Statistics (NCES) (1992), provides a separate tool that reports current, building-by-building campus space inventories that includes condition codes. A building condition code is determined by dividing the estimated renovation cost by the estimated replacement cost. The condition code tool provides a rating of the overall condition of a building using a scale of condition codes from 1 to 6. A condition rating of “1” indicates estimated renovation cost is 10-15 percent of the estimated replacement cost and the building is suitable for continued use with normal maintenance. A condition code of “6” indicates termination of building occupancy for reasons other than safety or structural problems (code 5), with estimated renovation costs exceeding 50 percent of the estimated replacement cost. Although this system provides information regarding the overall condition of buildings, it does not identify room and building quality relative to instructional and learning environments. For example, conference rooms lacking necessary technology and configuration for effective delivery of instruction are often used as classrooms, altering the effectiveness of the space to provide optimum learning conditions. While the building in which the room is located may be rated with a condition code of 1, the quality of the space as a classroom might not be as conducive to instruction as a designated and
19
configured classroom. As a consequence, building condition codes are not always a relevant indicator of the suitability of a space for its intended use. 2. Importance of Facility Renewal An important component in meeting the space needs of all campuses is the inclusion of a system to maintain existing or older facilities. Such a system should provide for the ongoing maintenance for existing facilities, as well as for more extensive renovations and updates to older buildings as needed. It should be able to analyze the status of existing buildings and balance the costs and benefits of updating existing facilities against demolishing older buildings and building new ones. Sometimes, older buildings can be renovated to increase efficiency and capacity at a much lower cost than demolition and new construction. Institutions within the community college segment have sustained a backlog of facilities improvement projects due to the age and heavy use of buildings and infrastructure constructed as early as the 1950's. These facilities are in need of upgrading to meet current instructional and service needs, code requirements, quality of space and services, and technological advances. Examples include roofing projects, improved roadways, utilities upgrade, fire and safety systems installation, telecommunications upgrade and asbestos removal. To provide ongoing support for projects of this nature, DBM and MHEC have discussed developing a Facilities Renewal Budget in the Community College Capital Grant program. One of the priorities of the USM Board of Regents is to maintain an adequate annual investment of operating funds for the maintenance of capital assets. Funding to support this effort is intended to be from the operating budget. Historically, however, operating funds have not been able to sustain an adequate level of facilities renewal funding. Consequently, through recent policy changes, the Board of Regents has enacted two facilities renewal backlog reduction strategies:
1. Pare down the backlog to a manageable size through deliberate spending on major renovation and replacement in the capital budget; and
2. Adopt an annual operating spending formula (with help from the Academic Revenue Bond-funded facilities renewal line item in the capital budget) based on an industry guideline of 2 percent of the replacement value (RV) of campus buildings. This ongoing spending is intended to keep the backlog from growing--to keep on top of the problem, once it is "fixed" with the capital budget.
The current USM backlog is an estimated $1.6 billion list of facilities needs that may be characterized as major replacement and renovation capital projects. Without intervention, it will continue to grow each year with the increased cost of construction and as a result of unfunded maintenance. This figure also includes some associated costs for functional remodeling, programmatic reconfiguration and exterior/interior finishes that would normally be done along with the actual system "renewal" work. As

20
mentioned earlier, the backlog is a major focus in the USM Capital Budget and it is in the capital budget where the biggest impact in reducing the backlog can be made.
In December 2005, the Board of Regents approved an expansion to their 1992 policy on facilities renewal to meet the backlog challenge. The new policy states that the Regents will approve an annual Capital Budget request to the State that includes, at a minimum, the FY 2006 level of funding building renovation and replacement ($70 million) adjusted for inflation. These are the large-scale projects typically included in the overall capital program for the System. USM defines this figure as a rolling annual average of the 5-Year CIP to allow for annual variations in funding.
Factors such as "age" and "condition" of facilities are some of the measures that help define the existing "backlog" of facilities renewal need for a particular institution. Thus, the allocation of funding for replacement and renovation projects in the capital budget varies depending on the specific needs of each institution. Thus, institutions requiring more intense investment in existing facilities will be appropriated a higher proportion of the capital budget until those needs are adequately addressed. This is especially true where enrollment pressures demand such investment.
The USM Board of Regents also approved language in the facilities renewal policy that requires institutional operating spending for facilities renewal to be targeted at 2 percent of the current replacement value (RV) of all institutional capital assets. Operating funds shall be enhanced at each institution until the 2 percent of replacement value spending level is reached. To assist institutions in achieving this goal, annual spending targets (in 2/10ths of 1 percent increments) have been established. Also, until institutions are able to fully fund the 2 percent, they may include their allocated share of the $15 million facilities renewal capital budget line item appropriation in the target calculation.
The 2 percent of replacement value spending amount is a target, one of many industry standards for maintenance. Obviously, the real needs could be more or less, depending on the age/condition of the physical plant. The allocation of the $15 million capital ARB facilities renewal line item is also formulaic and does not include building condition in the calculation. Building condition is, however, a critical part of the way institutions request, and the Regents recommend, capital projects like total building renovation or replacement. That's where USM is able make a difference for the schools that need it. A good case-in-point is the heavy investment, and planned investment, in facilities for Coppin State University, where the unmet need for facilities and facilities repairs was deemed significant by a 2001 study. The percentage of the $15 million each year in ARBs attributed to each institution changes little year-to-year because they are based solely on the replacement value of the academic State-supported facilities at each. In other words, the ARB amount is allocated annually among institutions on a formulaic basis, based on the replacement value of the academic physical plant. Building condition is not factored into this calculation. To do so could create a disincentive for institutions to work to maintain facilities in an efficient way. Instead, as mentioned above, building condition, or need, plays a key role in the project selection through the Regents' overall capital funding strategy.

21
Obviously, there are limits on both operating and capital funds and, likewise, there are many other needs that compete with maintenance. The actions by the USM Board of Regents, however, is a reallocation of funding that they expect to receive, not necessarily a request for additional funding from the State. By this policy, the Regents expect institutions to make maintenance a priority; thus the need to make these funding allocation decisions differently in the future for both operating and capital. 3. Distance Learning Distance education is a rapidly growing segment for the delivery of education. It is becoming a critical tool at most institutions and is often cited as a potential way to address capacity needs for Maryland’s higher education institutions. A workgroup comprising of members of the Maryland Community College Research Group and the Distance Learning Initiative Committee compiled data for distance learning trends at Maryland community colleges. Credit hours taught by distance learning are estimated to have increased from approximately 5 percent of total community college credit hours in the fall 2002 semester to 7 percent in the fall 2003 semester. However, the experience of many institutions providing the greatest number of distance education credits has been that very few students participate in only distance versus traditional classroom learning. For example, at Anne Arundel Community College, 68 percent of students who enroll in distance learning courses simultaneously enroll in classroom courses. Most community colleges indicate similar trends. Prince George’s Community College reports that many of their students take on-line courses when they are unable to register for a similar classroom course. While distance learning changes the primary mode of delivering instruction, it does not necessarily eliminate all facility needs for participating students. Students may still spend time on campus in libraries and labs, testing facilities, and accessing student services. For example, Frederick Community College estimates that the level of tests that distance learning students took on campus rose from 17 percent in FY 2002 to 23 percent in FY 2004. Faculty and staff are required to support educational services for students, regardless of the delivery mechanism, and must be available for questions, counseling, as well as other support services for students. To provide distance education courses, whether in the form of on-line courses, tele-video classes, or other delivery technology, colleges and universities must invest in both specialized technology as well as space in which to house and maintain equipment. Maryland community colleges report distance learning credit hours on the annual Commission credit hour enrollment report. Enrollments reported in this report provide the basis of enrollment and enrollment projections. FTDE enrollment and enrollment projections account for distance learning enrollments through a method developed by an intersegmental workgroup in association with MHEC. Under this method, distance learning credit hours are discounted by taking the proportion of distance learning credit

22
hours produced by students taking a combination of distance learning and face-to-face courses to the total number of distance learning credit hours. This percentage, currently 62 percent statewide, is then discounted by the proportion of each individual institution’s proportion of credit hours produced before 5 pm to total credit hours produced. This calculation allows for space needed for those students who take both on-campus and distance learning classes. Within the past three years, Maryland public four-year institutions have begun to report distance learning credit hours on their annual enrollment report to MHEC. However, this is a new activity and a method for converting distance learning credit hours to be included in enrollment calculations for space planning has not been implemented. While the current method accounts for some distance learning enrollments, no method has been developed for determining space allowances for the infrastructure needs associated with the delivery of distance learning instruction. Findings and Recommendations Findings:
1. The State of Maryland utilizes a sound capital process to provide support for
capital development to its colleges and universities.
Maryland has an effective State capital budget process, in which higher education is included. Maryland recently received a grade of A- by Governing Magazine for Infrastructure in the Grading the States 2005 issue, noting the strength of Maryland in Capital Planning, Project Monitoring, Internal Coordination and Intergovernmental Coordination. The statewide five-year capital plan includes projects from all state agencies, including higher education institutions, and is centrally prioritized at the State level. The plan is updated each year through the state capital budget process. Agencies must select and prioritize projects included in their capital budget requests and projects are prioritized based on the impending need for facilities expansion or new development in accordance with their agency Master Plan. Inclusion in the State five-year CIP, rather than requiring institutions to request bond funding annually on an individual basis, provides higher education institutions with consistency in State capital funding and allows them to plan capital projects in a more consistent manner from year to year. Maryland has invested significant levels of State funding in higher education capital projects over the past six years, providing over $1.2 billion in capital funding to four-year public institutions and over $287 million to community colleges.
23
2. Maryland space guidelines for classroom, class lab and office space are reasonable and the factors used are comparable to guidelines in other states. As discussed earlier in this report, an analysis of Maryland’s standards against other states shows that Maryland’s use of Weekly Student Contact Hours, Occupancy Rates, and Student Station Size as factors in the space planning model is consistent with the methods used in other states. Exhibit G shows that Maryland’s space standards can be compared to national ranges and that for the most part, Maryland’s standards are within those ranges.
3. The utilization and occupancy standards of Maryland public colleges and universities are within the ranges found nationally. The 4-year public colleges and university standards approach the average guidelines for classroom and laboratory of other states, while Maryland community colleges standards are within the range for classrooms but are below other states' guidelines for weekly room hours and occupancy for laboratories. The weekly room hours, occupancy rates and net assignable square feet are elements of the formula yielding the Space Guidelines Factor. The factors for Maryland four-year public institutions' classrooms and labs are near the average for all states surveyed. The factors for Maryland community college labs are lower than the Other States averages and within the range for station size only; they are above the average for classroom station size among states surveyed nationwide. Based on a 1998 national survey of space planning standards and guidelines among state university systems and community colleges nationally, Maryland’s four-year public institution standards for classroom and instructional laboratory space are comparable to those of other states. Maryland is below the Other States average in Weekly Room Hours for both classroom and laboratory space, and in Station Size for laboratory space, but Maryland’s standards fall within the ranges for each category. Maryland is slightly above the Other States average in Occupancy Rates for both classroom and lab space and Station Size for classroom space. Differences between Maryland and the national averages were no greater than approximately 10 percent of the average response from the surveyed university systems in each category (Exhibit G). However, although the public four-year institutions are within the ranges, both the public four-year institutions and the community colleges are toward the low ends of the ranges for most of the factors, suggesting that there is room for improvements in these areas. Maryland’s community college space standard data reflect a slightly different picture. Maryland is below average in every category except for classroom Station Size, and even falls outside the lower ranges of Weekly Room Hours and Occupancy Rate for laboratory space. The community colleges indicate that the space guidelines and standards are reasonable and adequate even though the needs of continuing education students are
24
not currently addressed. Limitations of the facilities and current space as well as increasing enrollments (of credit and non-credit students) have contributed to the variation of space utilization rates between schools (see exhibit H). Efforts to increase space utilization are often hampered by facilities maintenance, renovation and construction needs in addition to students' scheduling preferences. As a result, the community colleges indicate their facilities at many schools are being utilized at near the highest level possible.
4. Due to continued capital budget authorizations to higher education, academic
space at Maryland colleges and universities will increase by FY 2014. However, due to increases in enrollment, deficits in academic space are projected to increase during that time.
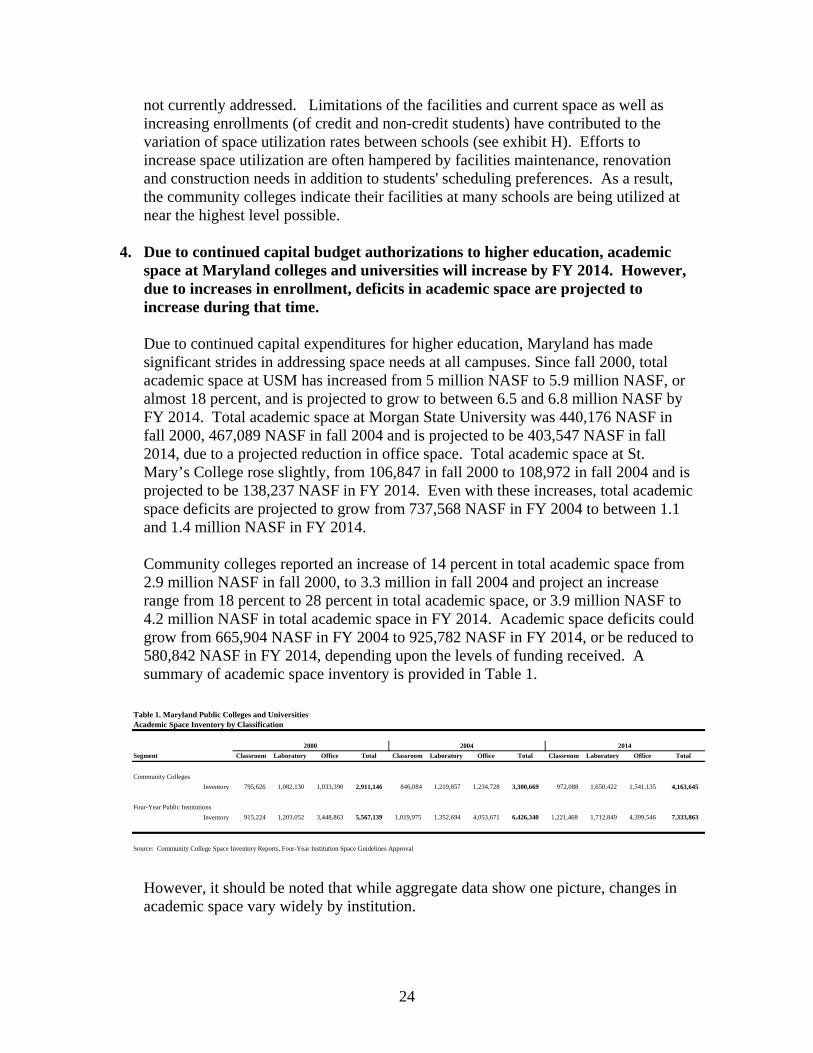
Due to continued capital expenditures for higher education, Maryland has made significant strides in addressing space needs at all campuses. Since fall 2000, total academic space at USM has increased from 5 million NASF to 5.9 million NASF, or almost 18 percent, and is projected to grow to between 6.5 and 6.8 million NASF by FY 2014. Total academic space at Morgan State University was 440,176 NASF in fall 2000, 467,089 NASF in fall 2004 and is projected to be 403,547 NASF in fall 2014, due to a projected reduction in office space. Total academic space at St. Mary’s College rose slightly, from 106,847 in fall 2000 to 108,972 in fall 2004 and is projected to be 138,237 NASF in FY 2014. Even with these increases, total academic space deficits are projected to grow from 737,568 NASF in FY 2004 to between 1.1 and 1.4 million NASF in FY 2014.
Community colleges reported an increase of 14 percent in total academic space from 2.9 million NASF in fall 2000, to 3.3 million in fall 2004 and project an increase range from 18 percent to 28 percent in total academic space, or 3.9 million NASF to 4.2 million NASF in total academic space in FY 2014. Academic space deficits could grow from 665,904 NASF in FY 2004 to 925,782 NASF in FY 2014, or be reduced to 580,842 NASF in FY 2014, depending upon the levels of funding received. A summary of academic space inventory is provided in Table 1.
However, it should be noted that while aggregate data show one picture, changes in academic space vary widely by institution.
Table 1. Maryland Public Colleges and Universities Academic Space Inventory by Classification
Segment Classroom Laboratory Office Total Classroom Laboratory Office Total Classroom Laboratory Office Total
Community Colleges Inventory 795,626
1,082,130 1,033,390
2,911,146
846,084
1,219,857
1,234,728
3,300,669
972,088
1,650,422 1,541,135
4,163,645
Four-Year Public Institutions Inventory 915,224
1,203,052 3,448,863
5,567,139
1,019,975
1,352,694
4,053,671
6,426,340
1,221,468
1,712,849 4,399,546
7,333,863
Source: Community College Space Inventory Reports, Four-Year Institution Space Guidelines Approval
2000 2004 2014

25
5. Funding for facility maintenance is an important component of a good facility plan.
As was discussed earlier in the report, it is important for colleges and universities to have a system to maintain and renovate existing or older facilities in order to make the space comply with the requirements of its intended use. A good facilities maintenance plan:
• provides for ongoing maintenance for existing facilities, • provides for more extensive renovations and updates to older buildings, • is able to analyze the status of existing buildings, and • balances the costs and benefits of updating existing facilities against
demolishing them and building new ones.
Both community colleges and the four-year public colleges and universities have backlogs of facilities improvement projects. These facilities are in need of upgrading to meet current instructional and service needs, code requirements, quality of space and services, and technological advances. A good system of facilities maintenance or renewal plans provides an adequate annual investment of operating funds for the maintenance of capital assets. One method for providing funding for this purpose is to allocate a portion of annual funding specifically for the purpose of facilities renewal. This is the method used in other states through the annual appropriations in the state budget or through adoption of such a policy by the higher education governing boards of the state. This allocation is made either through the annual operating budget or by dedicating a portion of the annual capital budget for this purpose. A range of two to ten percent of the Current Replacement Value (CRV), depending upon the condition of the building, is used to establish needed levels of facilities renewal funds.
Recommendations: 1. Ensure continued accuracy of space inventory data and enrollment and Weekly
Student Contact Hour calculations so that the calculation of space needs using the guidelines provide an accurate and consistent assessment. As explained in the report, calculations of space needs are based upon several components. These include inventories of facilities by category and Net Assignable Square Feet, and enrollment information, particularly Full-Time Equivalent enrollments and Weekly Student Contact Hours.
In order to assure accurate space needs and future projections, this inventory and enrollment data must be accurate. Under current policies, responsibility for maintaining current facilities inventory information and enrollment are based at the institutional level. Institutions are then responsible for reporting the information

26
annually through reports to MHEC. Institutions have an important responsibility to collect data and perform inventories of their campuses frequently in order to maintain current and accurate data. MHEC, other state agencies, and the higher education institutions must continue to ensure that the data being used to assess space needs and availability are accurate.
2. Each institution should establish utilization goals and identify efficiencies in use of space based on mission and develop and implement strategies to increase utilization to reflect the growing diversity in the format, times of instructional courses, programs and changes in student demand. They should also develop a method of reporting goals and utilization rates annually. Development of utilization goals, strategies and reporting should be made in consultation with the Maryland Higher Education Commission. Traditional enrollments for postsecondary institutions were students who had graduated high school, enrolled full-time at colleges and universities and attended classes and lived in residence halls on campus. Community colleges traditionally served students who were pursuing two-year degrees in specialized fields such as nursing, or needed to achieve certification in order to qualify for employment in an area.
The current student population continues to include traditional students, but has grown in the population of older students attending part-time or at night and who are pursuing bachelors, masters, or associates degrees while working full-time. These students need more flexibility in class scheduling and program offerings.
To meet these new demands, institutions are continually working to provide programs, classes and instruction through alternative methods. Colleges and universities have built up evening programs, scheduling classes after 5 pm. They have also built weekend programs. Institutions are also developing alternative methods of providing instruction through various forms of distance learning, including CDs, interactive video, and the internet.
These methods will have varying effectiveness depending upon the type of institutions and on the types of students each institution enrolls. Institutions that enroll full-time students who require higher levels of personal, in-class interactive classes will be less likely to achieve greater capacity through alternative delivery methods, but instead will have to improve scheduling efficiencies. Colleges and universities with greater proportions of adult students who take courses in the evenings, on a part-time basis, and are open to taking other types of classes can achieve greater capacity through these methods.

27
3. Consider alternative measures for evaluating utilization rates, for example space per FTE as opposed to FTDE to accommodate the variations in college missions and the increase in diversity in the format and times of instructional courses and programs. Add an FTES assessment to the space guideline data to develop a trend line for this measure.
Under the current space inventory system, space needs are based on Weekly Student Credit Hours generated by Full-Time Day Equivalent (FTDE) students. This is based on the traditional and somewhat outdated model that college students attended classes full-time during the week between the hours of 8 AM and 5 PM combined with the assumption that these are the peak hours when facilities will be used
Student demographic information shows that there is a growing proportion of students pursuing postsecondary education who are older and work full-time. Current attendance patterns at both four-year institutions and community colleges show that greater numbers of these students are attending classes in evening hours and on weekends. Institutions, particularly community colleges, experience high levels of class attendance in the evenings between 6 PM and 10 PM.
To take this into account, consideration should be made to adjusting the enrollment factor to include all full-time equivalent students (FTES). The model should be adjusted to account for those institutions whose peak enrollment times are after 5 PM, while continuing to account for institutions whose peak enrollment demand is during the traditional period. This will capture students attending at all hours and create a more accurate assessment of the actual space needs of the institutions.
4. In developing the statewide ten-year growth plan for higher education, evaluate
alternatives for relieving pressure of facilities inventory needs as shown in Exhibits C and D with the understanding that these can only address demand for a limited group of students.
a. Share best practices in alternative scheduling b. Address issues impacting the offering of tuition differentials for off-
peak classes or other incentives c. Monitor and analyze impact of on-line instructional delivery on
facilities needs
Community Colleges and four-year public colleges and universities have both found success in scheduling classes through a centralized system. Community Colleges use a priority system, while the four-year public institutions use a similar approach by centralizing scheduling in the office of the registrar in a priority system while allowing for some flexibility at the departmental level. However, when noncentralized scheduling occurs, this scheduling is often not recorded, and therefore not counted as scheduled time.

28
Further, scheduling classes in class and lab space is constrained by the ability of that space to accommodate students effectively and by the availability of both the space and students at particular times and days. Institutions regularly face the competing goals of providing flexible schedules while trying to fit classes in order to maximize utilization rates. The University System of Maryland has proposed extending scheduled time and increasing utilization rates at institutions as part of its Effectiveness and Efficiencies (E&E) initiative. Another method to increase availability of courses and programs is to use alternative methods of delivery, such as through distance learning and online instruction. Institutions from both segments have made significant strides in implementing this type of delivery. However, the ability to provide instruction, courses and programs through this means can be limited by the type of program. A program requiring a high level of laboratory time, for example, is less likely to be able to deliver instruction through alternative means than a course in English or Business. Institutions with different missions, as well, may find it more or less difficult to deliver programs through alternative means. Another factor in considering the appropriateness of alternative course delivery is whether the students enrolled at the institution would benefit from receiving instruction through other means. Some students need a traditional, in-class experience in order for their education to be effective. Other students, particularly older students with workplace experience, who are taking classes during nontraditional schedules, may find it beneficial to have courses that can fit their busy schedules. Institutions, governing boards, and State agencies should assess institutional curricula to determine how institutions can incorporate methods to increase utilization of existing facilities or to increase course availability through alternative means. This would help relieve the pressure of anticipated deficits in academic space as projected in Exhibits C and D and discussed in the report. The workgroup also recommends that reasons for the variation in Maryland community college utilization rates as compared to national standards and national rates should be further explored.
Finally, the workgroup recommends that segments of higher education and state agencies undertake a study of this issue to determine an efficient way to combine scheduling practices, space utilization and alternative course delivery for the purpose of adding capacity without the need for additional space.

29
5. In developing the statewide ten-year growth plan for higher education, recognize the importance of the impact of new facilities on institutional operating budgets and auxiliary facilities on enrollment growth and utilization efficiencies as well as continued capital support to higher education.
While Maryland’s space guidelines and planning process provides a sound process to plan for capital budget needs for facilities into the future, the capital funding costs associated with future projects provides only a part of the picture. When considering fiscal issues associated with facilities within the context of a statewide ten-year growth plan for higher education, it will be important to consider the impact of new facilities on institutional operating budgets as these buildings come on line. Additionally, there must be recognition of the impact on the need for additional auxiliary facilities, particularly parking and housing facilities, associated with increasing enrollments. This should also encompass efforts to increase utilization for all space in order to develop an effective plan for the next ten years.
6. Review of academic space guidelines and planning should include discussion and
evaluation of space standards for Research Laboratory and Study and Stack space. This review should consider and, if possible, determine whether they are sound, valid and comparable to best practices of other public higher education planners nationally.
Discussions of the workgroup indicated that analysis of space needs for research space and study and stack space are more complex than that for the classifications of space considered in this report. Maryland space standards for research laboratory and Study and stack space use different space factors than those reviewed. Research Laboratory space also uses a set of vastly different assumptions from teaching laboratory space based upon the level of degree offered and limited to specific HEGIS disciplines. Study space discounts FTDE levels for calculating space needs for study facilities, while stack space is based on Bound Volume Equivalent measures used in library planning and evaluation. Research space measures have been difficult to standardize. Research functions are extremely diverse and dynamic, so finding appropriate measures for space to house these functions is complex. Historically, research activities in the same or similar disciplines could be aggregated and assumptions could be made regarding space needs. As technology has changed and research programs have become interdisciplinary in nature, the difficulty in finding common space guidelines has increased. For four-year public colleges in universities, each research facility is weighed on the merits of its justification during the preparation of the architectural program rather than on specific research space guideline or inventory standards. Library and study space is slightly more manageable and possibly more easily quantified and standardized, but must consider broader issues concerning what the State needs in terms of information resources for higher education and other issues that are larger than just library and study space. While stack and study space needs

30
might be simplified to consider book shelves and seating, questions that would need to be discussed include: 1) what are the State's needs for library facilities at higher education institutions across Maryland, 2) how has the trend to digital library resources impacted the requirements for space, materials and functions at college libraries, 3) how will the trend impact these needs in the future, and, ultimately 4) how does this translate into operating and capital funding requirements.
Methods for planning and guidelines for these spaces should be reviewed and analyzed in a similar manner as those reviewed in this report to determine whether they are sound, valid and comparable to best practices of other public higher education planners nationally.

31
Appendix
1
Exhibit A.
Title 13B MARYLAND HIGHER EDUCATION COMMISSION
Subtitle 07 COMMUNITY COLLEGES
Chapter 05 Space Allocation Guidelines
Authority: Education Article, Title 11 and Title 16, Annotated Code of Maryland
13B.07.05.01
.01 General Principles.
A. This chapter provides guidelines for determining space needs that are eligible for capital funding by the State. The space allocation guidelines delineated in this chapter are to be used to compute suggested maximum allowances for a campus for each type of space in the National Higher Education General Information Survey (HEGIS) Space Classification System. These guidelines may not be used to design a specific space or facility. Any space architecturally designed, however, shall fall within the computed needs developed in Regulation .03 of this chapter.
B. These regulations are not fixed standards and may be subject to modifications when justified as reflected in the Maryland Higher Education Commission's Community College Facilities Manual. The regulations shall be used by the Department of Budget and Management, the Department of General Services, the Maryland Higher Education Commission, and the Board of Public Works in evaluating both long-range planning and individual construction projects.
C. Normally, projects shall be planned using a 10-year enrollment projection certified by the Secretary of Higher Education.
D. On-campus full-time day (8 a.m. to 5 p.m.) students and part-time day students shall be equated to full-time day equivalent (FTDE) students. This count, used in conjunction with space factors, shall be the major basis for determining space needs. Only students attending the campus for which space needs are being computed shall be counted.
E. The FTDE count for each college shall be certified by the Secretary.
F. On-campus daytime weekly student contact hours (WSCH) shall be used to compute classroom and laboratory space needs. The WSCH shall be certified by the Secretary of Higher Education. Except for remedial or other prerequisite courses, noncredit contact hours are not included in computing space, and only "on campus" hours shall be included.

2
G. Enrollment projections to be used by a college in applying these regulations should be consistent with the approved role and mission statement for that college. The enrollment projection should be that which is contained in the facilities master plan most recently endorsed by the Commission.
H. Office space is based on the count of full-time equivalent faculty, full-time administrators, full-time librarians, full-time staff, and student officers as certified to by the Secretary.
I. The space inventory to be used by a college in applying these regulations to determine eligibility for State funding is the total amount of on-campus space minus space contained in temporary structures. Temporary structures are those with an anticipated useful life of less than 15 years or those that were not intended to occupy space on campus for more than 15 years from original construction.
J. The space inventory is recorded in terms of net assignable square feet (NASF). The space allowances computed under these guidelines are also recorded as NASF.
13B.07.05.02
.02 Capital Guidelines.
Space allocation guidelines for college campuses are as follows:
Room Use Category Space Factor by Size of FTDE HEGIS Code Space Base 3000 & Under 3001 & Up
100 Classroom Facilities WSCH1 1.50 1.11 110 Classroom
200 Laboratory Facilities WSCH2 7.00 5.83 210 Class Laboratory
220 Open Laboratory FTDE 4.20 4.20 300 Office FTEF3 166.00 166.00 FT Staff
Student Offices4
320 Testing & Tutoring Centers FTDE5 Core of 1,500 NASF and 0.5
NASF/FTDE in excess of 1,500 FTDE. 400 Library
410 Study/Seating FTDE 6.25 6.25 420 Stack BVE6 .10- .10+ 400—455 Processing Percent of 420
with minimum .40 .40

3
of 1,200 NASF7
500 Special Use
520
Physical Education—Pool, Gym, and Fitness/Wellness Center
FTDE8
Core of 28,000 NASF (consisting of 14,000 for a gym, 8,000 for a pool, and 6,000 for a fitness center) and 10 NASF/FTDE in excess of 1,500 FTDE and 6,000 NASF of service space (consisting of 3,500 for lockers and 2,500 for storage).
530 Audiovisual, Radio, TV FTDE
Core of 1,600 NASF and 0.8 NASF/FTDE in excess of 1,500 FTDE up to 3,000 FTDE and 2 NASF/FTDE in excess of 3,000 FTDE.
580 Greenhouse Campus Core of 1,000 NASF
600 General Use
610 Assembly FTDE Core of 12,000 NASF and 2 NASF/FTDE in excess of 1,500 FTDE.
620 Exhibition FTDE Core of 1,500 NASF and 0.5 NASF/FTDE in excess of 1,500 FTDE.
630 Food Facilities PHC9 10.2 8.4 650 Lounge Facilities PHC10 3.0 3.0
660 Merchandising FTDE Core of 1,600 NASF and 0.5 NASF/FTDE in excess of 1,500 FTDE.
680 Meeting Space FTDE Core of 6,000 NASF
Core of 8,000 NASF
700 Support
710 Data Processing, Telecomm FTDE11
Core of 2,500 NASF for the first 4,000 FTDE and 0.75 NASF/FTDE beyond 4,000 FTDE.
720—745
Shops, Storage, Vehicle Storage, and Repair
Total Campus Allowance minus this category12
0.04 0.04
750 Central Service FTDE Core of 4,000 NASF for the first 4,000 FTDE and 1 NASF/FTDE beyond 4,000 FTDE.
760 Hazardous Materials Total Storage 2% of existing inventory in Room Use Categories 720—745.
800 Health Care FTDE Core of 500 NASF and 0.2 NASF/FTDE in excess of 1,500 FTDE.

4
1WSCH-Lecture. Weekly student contact hours for on-campus day students in credit courses and eligible noncredit courses where instruction is lecture.
2WSHC-Lab. Weekly student contact hours for on-campus day students in credit courses and eligible noncredit courses where instruction is lab.
3FTEF—Full-time equivalent faculty, including librarians, plus 25% of all part-time faculty.
41,120 square feet maximum for student offices.
5FTDE—Full-time day equivalent is total credit hours taught on campus between 8 a.m. and 5 p.m. divided by 15 credit hours.
6BVE—Bound volume equivalent which is 20,000 BVE for the first 1,000 FTE and 1,000 BVE for every 100 FTE above 1,000.
7A minimum allowance is needed for cataloging, binding, and maintenance regardless of collection size.
8Minimum size of gym is 14,000 NASF for activity space, 8,000 NASF for pool, 6,000 NASF for fitness space, 3,500 NASF for lockers, and 2,500 NASF for storage.
9PHC—Planning headcount is 50% of FTDE for on-campus credit and eligible noncredit courses plus FTEF and FT Staff and includes space for seating, preparation, and storage.
10Allowance includes quiet, study, and building lounges.
11FTDE for on-campus credit courses and eligible noncredit courses.
12Allowance related to required service space on campus total square footage.
13B.07.05.03
.03 Capital Guidelines Factor Development.
A. The elements for computing the space factor used for determining space needs for classrooms and laboratories are the net assignable square feet per student station (NASF/SS), the number of hours in a 45-hour week the space shall be used (hours/week), and the percent of student occupancy of the room when space is in use. These elements are expressed in the formula: NASF/SS Space Factor = hours/week X percent of occupancy
B. 100—Classroom.

5
(1) For the smaller colleges, the guideline was computed on the basis of the following formula:
(a) Assume 18 NASF—average station size;
(b) Assume 20 hours per week—target room utilization rate;
(c) Assume 60 percent—expected seat occupancy rate;
(d) 18 divided by (20 X 0.60) yields 1.5.
(2) For the large colleges, the following formula was used:
(a) Assume 20 NASF—average station size;
(b) Assume 27 hours per week—target room utilization rate;
(c) Assume 66.7 percent—expected seat occupancy rate; and
(d) 20 divided by (27 X .667) yields 1.11.
C. 200—Laboratory.
(1) For the smaller colleges, the guideline was computed on the basis of the following formula:
(a) Assume 50 NASF—average station size for natural and social science labs;
(b) Assume 115 NASF—average station size for technical and career labs;
(c) Assume 80 percent of lab contact hours are generated in natural and social sciences labs, and 20 percent in technical and career labs;
(d) Assume 15 hours per week—target room utilization rate;
(e) Assume 60 percent—expected seat occupancy rate;
(f) For natural and social sciences labs, 50 times 0.80 divided by (15 X 0.60) yields 4.45;
(g) For technical and career labs, 115 times 0.20 divided by (15 X 0.60) yields 2.55; and
(h) The sum of 4.45 and 2.55 is 7.0.
(2) For the larger colleges, the guideline was computed in the same manner except that the target room utilization rate was raised to 18 hours per week.

6
D. 300—Office.
(1) The allowance of 166.0 NASF per individual requiring office space is adopted to cover all space required for faculty offices, administrative offices, clerical offices, student offices (1,120 square feet maximum), library offices, file rooms, mimeograph rooms, vaults, conference room, waiting rooms, interview rooms, closets, private toilets, record rooms, and office supply rooms. Centralized duplicating or print shops are not included.
(2) 320—A core space of 1,500 NASF and .05 NASF/FTDE in excess of 1,500 FTDE.
E. 400—Study.
(1) This category includes library and learning resource centers. Seating station size is 25 NASH which, when multiplied by seating for 25 percent of the FTDE, produces a seating factor of 6.25 (25 X 0.25).
(2) The size of the stack space is determined by allowing 0.1 NASF per bound volume equivalent (BVE) with a library of 20,000 BVE recommended for the first 1,000 FTE and 1,000 BVE per 100 FTE after that, although no ceiling on volume count is mandatory.
(3) The processing and service spaces are determined as a group by taking 40 percent of the stack space. A minimum of 1,200 NASF is needed for service regardless of collection size.
(4) The total space for the library is found by adding the space computed for seating, stack, and service.
F. 500—Special Use.
(1) 520—Physical Education. A core of 28,000 NASF (consisting of 14,000 for a gym, 8,000 for a pool, and 6,000 for a fitness center) and 10 NASF/FTDE in excess of 1,500 FTDE and 6,000 NASF of service space (consisting of 3,500 for lockers and 2,500 for storage).
(2) 530—Audiovisual, Radio, TV. A core allowance of 1,600 NASF assumes that each campus will have space for audio/TV electronic distribution equipment racks and panels (600 NASF), equipment and materials storage and circulation area (600 NASF), and a maintenance workshop and technician area (400 NASF). The additional 0.8 NASF/FTDE in excess of 1,500 recognizes that larger campuses may require more space for specialized productions.
(3) 580—Greenhouse. Assumes that greenhouses supporting the instructional program in biology require a minimum amount of space regardless of the size of the college.
G. 600—General Use.

7
(1) 610—Assembly. A core of 12,000 NASF and 2 NASF/FTDE in excess of 1,500 FTDE.
(2) 620—Exhibition. A core space of 1,200 NASF is provided for the first 1,500 FTDE. Regardless of campus size, a minimum amount of space is provided for exhibition of materials, works or art, artifacts, etc. Additional space is provided for campuses larger than 1,500 FTDE in recognition of specialized program offerings and increased demand.
(3) 630—Food Facilities. This factor is based upon the potential number of users to be served, type of service to be used, number of turnovers, preparation methods, commuter implications, and storage. Space is to be provided for 50 percent of the FTDE students, FTE faculty, and FT staff. Allowance is for 15 NASF per seat for dining, 3 NASF per seat for serving, a turnover of 3:1 per meal, 70 percent of dining and serving allowance for campuses 3,000 FTDE and under, and 40 percent of dining and serving allowance for campuses 3,001 FTDE and over.
(4) 650—Lounge Facilities. This factor is based upon the potential numbers of users. Included are primary areas in any student center (game lounge, quiet lounge, study lounge as well as building lounges).
(5) 660—Merchandising. A core allowance is provided for basis space for storage display of textbooks and academic supplies and materials as well as sales space for a variety of student convenience and interest items. Space beyond 1,500 FTDE allows for increases in the size of student body growth. Storage and backspace requirements grow at a disproportionate rate because increases in the size of the college produce variety in program and instructional offerings that produce a variety in book titles required to support curricula.
(6) 680—Meeting Space. A core of 6,000 NASF for FTDE of 3,000 or less and a core of 8,000 NASF for FTDE 3,001 and above.
H. 700—Support.
(1) 710—Data Processing. Allows for average requirements for computer centers and necessary peripherals and processing space. Excluded from this space are instructional computing spaces which are within the HEGIS 200 category. Also, central control monitoring systems are excluded.
(2) 720—745 Shops, Storage, Vehicle Storage and Repair. Assumption is that the amount of building space on campus and the number of vehicles to be stored/maintained has a direct relationship to the amount of required service space.
(3) 760—Hazardous Materials. An allowance of 2 percent of the existing inventory in room use categories 720—745 is used to determine storage space requirement.

8
I. 800—Health Facilities. The factor provides a minimum space allocation as well as the opportunity for expansion at larger colleges. Space for infirmaries and health clinics only for students is included in this factor.
13B.07.05.04
.04 Outdoor Facilities.
A. Regular Parking. The allowance is 300 square feet per car and the number of spaces is based upon the following:
(1) 75 percent—full-time faculty;
(2) 75 percent—staff;
(3) 75 percent—full-time day equivalent for on-campus credit and eligible noncredit courses; and
(4) 2 percent—visitors (2 percent of total authorized spaces).
B. Handicapped Parking. The parking stall shall be 9 feet wide with a 4-foot wide pedestrian space between each other stall reserved for the handicapped. These spaces shall be in addition to those identified as regular parking. Total reserved spaces shall conform to the following:
Total Parking Spaces on Lot Required Minimum Number ofHandicapped Accessible Spaces
Up to 25 1 26—50 2 51—75 3 76—100 4 101—150 5 151—200 6 201—300 7 301—400 8 401—500 9 501—1,000 2 percent of total over 1,000 20 + 1 for each 100 over 1,000
C. Outdoor Physical Education and Recreational Facilities. Outdoor physical education and recreational facilities shall be based upon 100 square feet per headcount day student and justified by program requirements with a minimum of the following, if justified:
(1) Six tennis courts;
9
(2) Two fields, with a total of 300,000 square feet, one of which may have a track consisting of six lanes with an eight-lane straight-away.
13B.07.05.9999
Administrative History
Effective date: January 26, 1998 (25:2 Md. R. 77)
Regulation .01 amended effective April 15, 2002 (29:7 Md. R. 621)
Regulation .02 repealed and new Regulation .02 adopted effective April 15, 2002 (29:7 Md. R. 621)
Regulation .03 amended effective April 15, 2002 (29:7 Md. R. 621)
Regulation .04 amended effective April 15, 2002 (29:7 Md. R. 621)

10
MARYLAND HIGHER EDUCATION COMMISSION SPACE GUIDELINES FOR FOUR-YEAR PUBLIC INSTITUTIONS
Revised Allowances Summary September 9, 1999
Room Use Category 100 – Classrooms
• UB 1.71 NASF/WSCH • UMB Health Sciences 1.43 NASF/WSCH • All other institutions 1.11 NASF/WSCH
Room Use Category 210- Class Labs
• Institutions (excluding UB) up to 3,000 FTDE: 7.00 NASF/Lab WSCH • Institutions with 3,000 to 6,000 FTDE: 5.83 NASF/Lab WSCH • Institutions over 6,000 FTDE: 5.00 NASF/Lab WSCH • UB: 4.00 NASF/Lab WSCH
Room Use Category 220 – Open Labs
• 4.2 NASF/FTDE Room Use Category 250 – Research/Non-Class Lab
• One module per FT faculty member in academic disciplines in which a doctoral degree is awarded; one-half module/FT faculty member engaged in research in academic disciplines in which the highest degree awarded is a master’s degree; and one-tenth module/FT faculty member engaged in research in disciplines in which the highest degree awarded is a baccalaureate degree, limited to the following disciplines and module sizes:
• Hegis Disciplines 0100, 0400, 0900, 1000: 1,000 NASF/Module • Hegis Disciplines 0200, 1200, 1300, 1900, 2000: 650 NASF
The minimum allowance for this category is set at 5,000 NASF Room Use Category 300/350 – Offices
• 166 NASF/FTE person requiring office space (faculty and staff only), plus an additional 30 NASF/FT faculty member only in academic disciplines in which a doctoral or master’s degree is awarded and which do not qualify for space in the Hegis 250 space category.
Room Use Category 410 – Study Facilities
• 35 NASF/FTDE for 20% of the undergraduate and graduate FTDE No agreement reached with the State for this category Room Use Category 420 – Stack Facilities
• .10 NASF/PBVE Law and Med at X 1.5

11
No agreement reached with the State for this category Room Use Category 440 – Library Processing Space
• 20% of the allowance for Hegis 410 and 420 space with a minimum of 3,000 NASF
No agreement reached with the State for this category Room Use Category 510- Armory
• New guideline allowance - Ad-hoc Room Use Category – 520 - Physical Education New guideline allowance
• 30 NASF/undergraduate FTDE for the first 1,600 plus 10 NASF for each additional undergraduate FTDE, 3 NASF/graduate FTDE, and an allowance of 5,800 NASF of team related locker/shower/support space for institutions with ICA programs.
Room Use Category 530 – Media Productions
• New guideline allowance: 2 NASF/FTDE Room Use Category 540 – Clinic: Ad hoc Room Use Category 550 - Demonstration: Ad hoc Room Use Category 560 - Field Building: Ad hoc Room Use Category 580- Greenhouse: Ad hoc Room Use Category 540 – Clinic: Ad hoc Room Use Category 570 – Animal Quarters
• New guideline allowance: none at this time Room Use Category 610 – Assembly/Theater New guideline allowance:
• 12,000 NASF/institution, plus • 10,000 NASF/institution with degree program in Theater, plus • 5,000 NASF/institution with degree program in Music, plus • 2 NASF/FTDE
Room Use Category 620 – Exhibit
• New guideline allowance: 1.0 NASF/FTDE Room Use Category 650 – Lounge
• New guideline allowance: 3% of Hegis space categories 100 to 800 (excluding 630-670)
Room Use Category 630 – Food Facilities: Ad hoc Room Use Category 640 – Day Care: Ad hoc Room Use Category 660 – Merchandising: Ad hoc

12
Room Use Category 670 - Recreation: Ad hoc Room Use Category 680 - Meeting: Ad hoc Room Use Category 710 – Central Computer or Telecommunications New guideline allowance:
• A core of 2,500 NASF for the first 4,000 FTDE, 0.75 NASF/FTDE beyond 4,000 Room Use Category 720 to 740 – Shop, Central Storage, and Vehicle Storage New guideline allowance:
• 4 % of NASF excluding NASF in room use categories 720-745 Room Use Category 750 – Central Service New guideline allowance:
• A core of 4,000 NASF for the first 4,000 FTDE, 1 NASF/FTDE beyond 4,000 FTDE and 1.5 NASF/FTDE beyond 15,000 FTDE
Room Use Category 760 – Central Service New guideline allowance:
• 3 % of existing inventory in Room Use Category 250 and 2 % of existing inventory in Room Use Categories 720 – 740
Room Use Category 800 – Health Care Facilities New guideline allowance:
• A core of 1,000 NASF for the first 2,000 FTDE, 0.3 NASF/FTDE beyond for institutions with at least 300 residential students or 0.5 NASF/FTDE beyond 2,000 FTDE for institutions with fewer than 300 residential students.
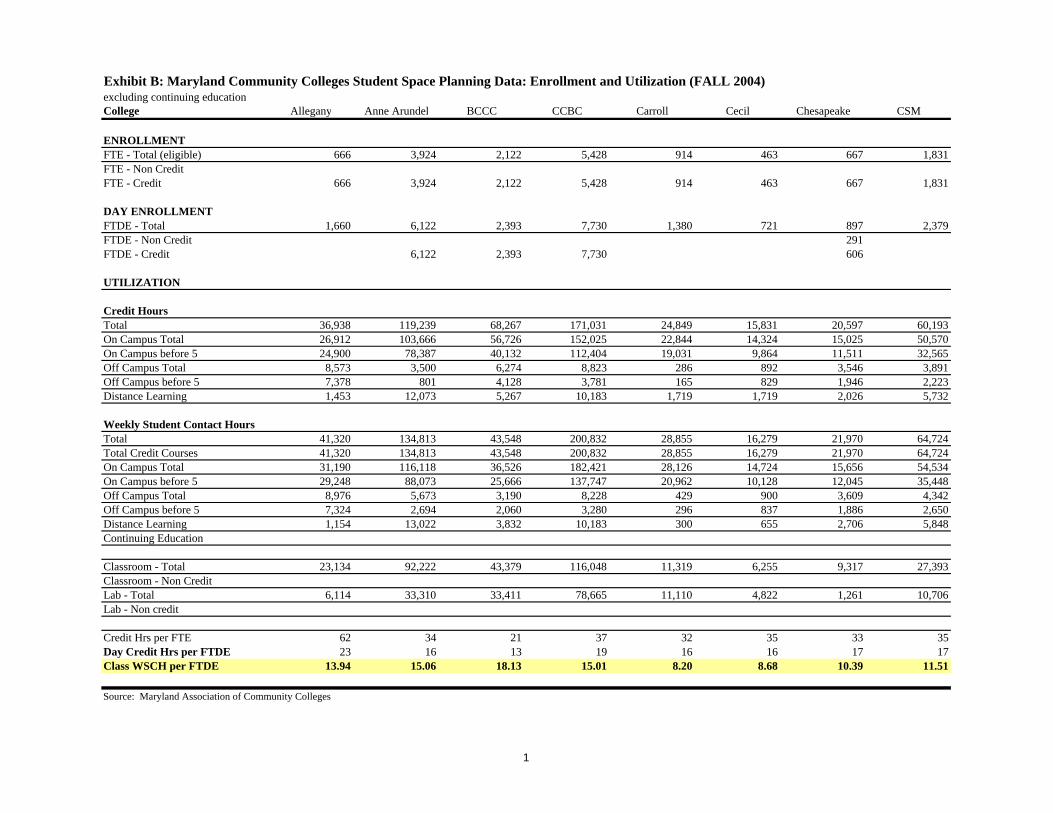
Exhibit B: Maryland Community Colleges Student Space Planning Data: Enrollment and Utilization (FALL 2004)excluding continuing educationCollege Allegany Anne Arundel BCCC CCBC Carroll Cecil Chesapeake CSM
ENROLLMENTFTE - Total (eligible) 666 3,924 2,122 5,428 914 463 667 1,831FTE - Non CreditFTE - Credit 666 3,924 2,122 5,428 914 463 667 1,831
DAY ENROLLMENTFTDE - Total 1,660 6,122 2,393 7,730 1,380 721 897 2,379FTDE - Non Credit 291FTDE - Credit 6,122 2,393 7,730 606
UTILIZATION
Credit HoursTotal 36,938 119,239 68,267 171,031 24,849 15,831 20,597 60,193On Campus Total 26,912 103,666 56,726 152,025 22,844 14,324 15,025 50,570On Campus before 5 24,900 78,387 40,132 112,404 19,031 9,864 11,511 32,565Off Campus Total 8,573 3,500 6,274 8,823 286 892 3,546 3,891Off Campus before 5 7,378 801 4,128 3,781 165 829 1,946 2,223Distance Learning 1,453 12,073 5,267 10,183 1,719 1,719 2,026 5,732
Weekly Student Contact HoursTotal 41,320 134,813 43,548 200,832 28,855 16,279 21,970 64,724Total Credit Courses 41,320 134,813 43,548 200,832 28,855 16,279 21,970 64,724On Campus Total 31,190 116,118 36,526 182,421 28,126 14,724 15,656 54,534On Campus before 5 29,248 88,073 25,666 137,747 20,962 10,128 12,045 35,448Off Campus Total 8,976 5,673 3,190 8,228 429 900 3,609 4,342Off Campus before 5 7,324 2,694 2,060 3,280 296 837 1,886 2,650Distance Learning 1,154 13,022 3,832 10,183 300 655 2,706 5,848Continuing Education
Classroom - Total 23,134 92,222 43,379 116,048 11,319 6,255 9,317 27,393Classroom - Non CreditLab - Total 6,114 33,310 33,411 78,665 11,110 4,822 1,261 10,706Lab - Non credit
Credit Hrs per FTE 62 34 21 37 32 35 33 35Day Credit Hrs per FTDE 23 16 13 19 16 16 17 17Class WSCH per FTDE 13.94 15.06 18.13 15.01 8.20 8.68 10.39 11.51
Source: Maryland Association of Community Colleges
1

Exhibit B: Maryland Commuexcluding continuing educationCollege
ENROLLMENTFTE - Total (eligible)FTE - Non CreditFTE - Credit
DAY ENROLLMENTFTDE - TotalFTDE - Non CreditFTDE - Credit
UTILIZATION
Credit HoursTotalOn Campus TotalOn Campus before 5Off Campus TotalOff Campus before 5Distance Learning
Weekly Student Contact HoursTotalTotal Credit CoursesOn Campus TotalOn Campus before 5Off Campus TotalOff Campus before 5Distance LearningContinuing Education
Classroom - TotalClassroom - Non CreditLab - TotalLab - Non credit
Credit Hrs per FTEDay Credit Hrs per FTDEClass WSCH per FTDE
Source: Maryland Association of Comm
unity College Student Space Planning Data: Enrollment and Utilization (FALL 2004)
Frederick Garrett Hagerstown Harford Howard Montgomery PGCC Wor-Wic
1,285 174 830 1,550 1,805 5,838 3,156 858
1,285 174 830 1,550 1,805 5,838 3,156 858
1,514 342 1,583 2,171 2,557 9,594 4,293 1,233
1,583 2,557 2,557
39,257 6,525 29,577 46,231 55,650 194,347 100,732 26,34433,433 5,369 27,602 41,810 51,199 185,954 55,027 24,20122,707 4,257 21,146 30,949 38,359 142,728 23,305 16,874
2,668 469 914 1,013 1,223 1,523 13,208 5072,050 432 640 427 771 1,182 6,267 4023,156 687 1,061 3,498 3,228 6,922 9,192 1,636
39,015 8,629 32,142 52,512 63,613 233,955 85,374 32,07039,015 8,629 32,142 52,512 63,613 233,955 85,374 32,07033,209 5,012 30,167 47,467 58,951 225,220 65,874 27,38622,564 3,674 23,028 35,480 44,339 176,201 46,353 18,917
2,677 3,028 914 1,399 1,331 1,593 11,811 2,9802,059 2,966 640 787 873 1,234 5,680 2,4133,129 590 1,061 3,646 3,331 7,142 7,689 1,704
12,540 4,275 17,523 30,040 23,260 120,148 53,663 14,826
9,554 1,539 5,634 8,407 28,865 46,952 19,319 4,091
30 49 39 34 35 40 27 3718 21 15 18 15 19 13 18
8.28 12.50 11.07 13.84 9.10 12.52 12.50 12.02
2

Exhibit B. Maryland Public Four-Year College and University Student Space Planning Data: Enrollment and Utilization (FALL 2004)
University of Maryland, Baltimore
University of Maryland,
College ParkBowie State University
Towson University
University of Maryland Eastern Shore
Frostburg State
UniversityCoppin State
UniversitySalisbury University
University of Baltimore -
Night
University of Maryland Baltimore
County
Morgan State
University
ENROLLMENT
FTE - Total 5,222 28,119 3,885 14,360 3,380 4,610 3,084 6,150 3,438 9,613 6,109 FTE - Undergraduate 829 22,964 3,316 12,833 3,142 4,230 2,803 5,860 1,380 8,758 5,761 FTE - Graduate 4,393 5,156 569 1,528 238 379 281 291 2,058 855 348 PERCENT UNDERGRAD 15.87% 81.67% 85.36% 89.36% 92.95% 91.77% 90.90% 95.28% 40.13% 91.11% 94.30%
DAY ENROLLMENTFTDE - Total 4,972 26,408 2,768 11,702 2,882 3,855 2,114 4,935 2,059 8,063 5,002 FTDE - Undergraduate 830 22,115 2,676 10,864 2,723 3,641 2,034 4,873 708 7,398 4,865 FTDE - Graduate 4,142 4,293 92 837 159 214 80 61 1,351 665 138
UTILIZATION
Credit Hours 65,148 406,322 56,569 210,823 49,981 68,007 45,416 91,379 43,396 141,628 91,636 Total Undergraduate 12,430 344,454 49,744 192,492 47,123 63,453 42,047 87,893 20,696 131,370 86,413 UG before 5 PM 12,430 328,574 40,150 162,960 40,848 54,615 30,514 73,098 9,840 109,476 72,973 Total Graduate 52,718 61,868 6,825 18,331 2,858 4,554 3,369 3,486 24,700 10,258 5,223 GRAD before 5 PM 51,375 43,455 1,091 10,044 2,015 2,568 964 737 4,433 6,561 1,657
Average Classroom Utilization* n/a 67% 40% 69% 60% 60% 60% 87% n/a 64%Utilization Hours per Week n/a 30 18 31 27 27 27 39 n/a 29
Weekly Student Contact HoursClassroom 87,398 389,639 37,020 148,310 35,167 48,956 28,660 64,855 28,446 116,596 72,196 Lab 55,432 61,641 3,760 34,293 11,672 14,623 3,762 19,667 4,078 19,575 24,065
Credit Hours per FTE 12.48 14.45 14.56 14.68 14.79 14.75 14.73 14.86 12.62 14.73 15.00DAY Credit Hrs per FTDE** 12.83 14.09 14.90 14.78 14.87 14.83 14.89 14.96 15.12 14.39 14.92Class WSCH per FTDE** 17.58 14.75 13.37 12.67 12.20 12.70 13.56 13.14 13.82 14.46 14.43
Research Institution search Institution ee "Assumptions")omprehensive Inst.omprehensive Inst.omprehensive Inst.omprehensive Inst.omprehensive Inst. (See footnote **)search Institution search Institution
Source: University System of Maryland
3

Exhibit C. Community CollegesAcademic Space Surplus and Deficiency: Fall 2004 to Fall 2014
Classroom Laboratory Office Academic SpaceCollege HEGIS 100 HEGIS 200 HEGIS 300 Total
Allegany College2004 856 6,082 (7,658) (720)
State-funded 2014 (6,814) (5,851) (20,742) (33,407) Community College Projected 2014 (6,814) 3,649 (19,777) (22,942)
Anne Arundel Community College2004 36,957 (8,988) (76,434) (48,465)
State-funded 2014 36,320 (18,070) (68,238) (49,988) Community College Projected 2014 68,320 28,930 (38,238) 59,012
Baltimore City Community College1
2004 4,140 37,159 (20,818) 20,481 State-funded 2014 (6,098) 25,841 (52,493) (32,750)
Community College Projected 2014 (5,823) 18,835 (59,666) (46,654)
Carroll Community College2004 (4,789) 9,714 (10,003) (5,078)
State-funded 2014 3,480 7,879 (11,299) 60 Community College Projected 2014 3,480 7,879 (11,299) 60
Community College of Baltimore County2004 (40,885) (126,295) (39,184) (206,364)
State-funded 2014 (36,420) (143,594) (53,442) (233,456) Community College Projected 2014 (24,020) (123,354) (35,474) (182,848)
Cecil Community College2
2004 4,732 (14,084) 6,446 (2,906) State-funded 2014 2,514 (22,954) (15,786) (36,226)
Community College Projected 2014 3,637 (13,454) (14,286) (24,103)
Chesapeake College2004 697 15,642 (3,565) 12,774
State-funded 2014 4,697 15,010 (7,886) 11,821 Community College Projected 2014 4,697 15,370 (7,657) 12,410
College of Southern Maryland2004 23,037 (38,754) (15,622) (31,339)
State-funded 2014 16,316 (10,089) (11,244) (5,017) Community College Projected 2014 21,440 (55,302) (33,397) (67,259)
Frederick Community College2004 3,249 (24,147) (15,344) (36,242)
State-funded 2014 4,875 (54,907) (24,241) (74,273) Community College Projected 2014 4,875 (38,407) (941) (34,473)
Garrett College2004 5,554 230 (5,586) 198
State-funded 2014 6,473 (1,448) (783) 4,242 Community College Projected 2014 6,473 1,917 639 9,029
Hagerstown Community College2004 20,720 31,641 (6,562) 45,799
State-funded 2014 11,081 19,007 (31,843) (1,755) Community College Projected 2014 11,081 19,007 (31,843) (1,755)
Harford Community College2004 12,807 (11,896) (1,742) (831)
State-funded 2014 (1,393) (25,450) (16,565) (43,408) Community College Projected 2014 (643) (22,950) (13,400) (36,993)
Howard Community College2004 5,654 (131,989) (27,069) (153,404)
State-funded 2014 2,393 (79,120) (34,378) (111,105) Community College Projected 2014 2,393 (71,208) (32,459) (101,274)
Montgomery College2004 (6,541) (99,038) (90,093) (195,672)
State-funded 2014 (5,113) (37,851) (104,415) (147,379) Community College Projected 2014 (17,560) (19,057) (79,786) (116,403)
Prince George's Community College2004 13,128 (15,415) (37,717) (40,004)
State-funded 2014 19,532 (5,584) (39,710) (25,762) Community College Projected 2014 20,732 (5,584) (32,939) (17,791)
Wor-Wic Community College2004 (1,602) (10,626) (11,903) (24,131)
State-funded 2014 (5,113) (37,851) (104,415) (147,379) Community College Projected 2014 4,181 (7,384) (5,655) (8,858)
Total - 2004 77,714 (380,764) (362,854) (665,904) Total State-funded 2014 46,730 (375,032) (597,480) (925,782)
Total Community College Projected 2014 96,449 (261,113) (416,178) (580,842) % Change -51.55% 43.63% 43.56% 59.39%
Notes:
1. Baltimore City Community College is State-owned
2. Cecil College projections based on June 2006 Space Computations
State-funded represents projects authorized in State CIP
Community College Projected represents projects authorized in State CIP and projects included in Facilities Master Plans

Exhibit D: Four-Year Public Colleges and UniversitiesAcademic Space Surplus and Deficiency: Fall 2004 to Fall 2014
Classroom Laboratory Office Academic SpaceHEGIS 100 HEGIS 200 HEGIS 300 Total
Bowie State University2004 Current (11,856) 23,446 5,113 16,703
2014 Projected (29,955) 50,495 (9,664) 10,876 2014 Institutional Projected (28,115) 52,102 3,634 27,621
Coppin State University2004 Current (7,673) (4,714) (956) (13,343)
2014 Projected (12,641) (11,079) (6,446) (30,166) 2014 Institutional Projected (5,296) 11,621 16,854 23,179
Frostburg State University2004 Current 2,043 (1,152) 2,031 2,922
2014 Projected (6,626) (28,370) (13,773) (48,769) 2014 Institutional Projected (4,249) (16,147) 6,291 (14,105)
Salisbury University2004 Current (8,837) (51,074) 8,632 (51,279)
2014 Projected (12,081) (39,255) 17,024 (34,312) 2014 Institutional Projected (12,081) (39,255) 17,024 (34,312)
Towson University2004 Current (22,356) (39,199) (42,358) (103,913)
2014 Projected (33,516) (37,802) (10,483) (81,801) 2014 Institutional Projected (33,516) (22,897) (10,483) (66,896)
University of Baltimore2004 Current 5,434 (11,899) 19,812 13,347
2014 Projected (14,465) (4,843) (38,105) (57,413) 2014 Institutional Projected (12,465) (4,843) (31,105) (48,413)
UM, Baltimore2004 Current (16,296) (238,892) (221,066) (476,254)
2014 Projected (3,026) (329,554) (229,431) (562,011) 2014 Institutional Projected (3,026) (319,379) (132,866) (455,271)
UM Baltimore County2004 Current (47,877) 6,419 3,856 (37,602)
2014 Projected (55,900) (106,439) (117,820) (280,159) 2014 Institutional Projected (43,615) (63,732) (72,801) (180,148)
UM, College Park2004 Current (97,272) (42,666) 71,426 (68,512)
2014 Projected (81,657) (36,935) (128,582) (247,174) 2014 Institutional Projected (81,657) (36,935) (186,012) (304,604)
UM Eastern Shore2004 Current 2,993 14,250 20,409 37,652
2014 Projected 4,344 58,350 14,987 77,681 2014 Institutional Projected 4,344 58,350 14,987 77,681
Subtotal: USM2004 Current (201,697) (345,481) (133,101) (680,279)
2014 Projected (245,523) (485,432) (522,293) (1,253,248) 2014 Institutional Projected (219,676) (381,115) (374,477) (975,268)
Morgan State University2004 Current (5,288) (34,118) 26,440 (12,966)
2014 Projected (13,986) (51,773) (86,182) (151,941) 2014 Institutional Projected (13,986) (51,773) (86,182) (151,941)
St. Mary's College of Maryland2004 Current (15,674) (22,810) (5,839) (44,323)
2014 Projected (5,812) (10,006) (1,503) (17,321) 2014 Institutional Projected (5,812) (10,006) (1,503) (17,321)
Total2004 Current (222,659) (402,409) (112,500) (737,568)
2014 Projected (265,321) (547,211) (609,978) (1,422,510) 2014 Institutional Projected (239,474) (442,894) (462,162) (1,144,530)
Difference betwwen 25,847 104,317 147,816 277,980
Notes:1) Study/Stack space includes study room, stack, open-stack study room, processing, and study service.2) All data are self-reported.Source: Four Year Public Colleges and Universities, Fall 2004 Facilities Inventory and Planning Guidelines

Exhibit E. Community CollegesAcademic Space Inventory: Fall 2004 to Fall 2014
Classroom Laboratory Office Academic SpaceCollege HEGIS 100 HEGIS 200 HEGIS 300 Total
Allegany College2004 35,557 55,852 48,785 140,194
State-funded 2014 36,207 55,852 48,785 140,844 Community College Projected 2014 36,207 65,352 49,750 151,309
Anne Arundel Community College2004 108,812 152,631 132,907 394,350
State-funded 2014 111,399 150,801 150,413 412,613 Community College Projected 2014 143,399 197,801 180,413 521,613
Baltimore City Community College1
2004 56,037 67,258 102,101 225,396 State-funded 2014 47,402 63,107 118,025 228,534
Community College Projected 2014 47,677 56,101 110,852 214,630
Carroll Community College2004 23,191 31,680 32,374 87,245
State-funded 2014 34,711 27,251 52,048 114,010 Community College Projected 2014 38,191 35,130 40,749 114,070
Community College of Baltimore County2004 114,892 179,994 204,240 499,126
State-funded 2014 135,780 194,299 224,558 554,637 Community College Projected 2014 148,180 214,539 242,526 670,282
Cecil Community College2
2004 14,308 24,220 27,160 65,688 State-funded 2014 14,308 24,220 27,160 65,688
Community College Projected 2014 15,431 33,720 28,660 77,811
Chesapeake College2004 22,126 27,829 37,775 87,730
State-funded 2014 20,804 29,416 39,358 89,578 Community College Projected 2014 20,804 29,416 39,587 89,807
College of Southern Maryland2004 61,580 46,141 70,845 178,566
State-funded 2014 64,999 90,478 90,186 245,663 Community College Projected 2014 64,999 90,478 90,186 245,663
Frederick Community College2004 22,059 49,090 47,168 118,317
State-funded 2014 30,059 43,145 58,818 132,022 Community College Projected 2014 30,059 59,645 82,118 171,822
Garrett College2004 11,967 12,439 15,128 39,534
State-funded 2014 13,767 12,439 19,208 45,414 Community College Projected 2014 13,767 15,804 20,630 50,201
Hagerstown Community College2004 39,863 53,963 44,046 137,872
State-funded 2014 40,698 53,541 45,431 139,670 Community College Projected 2014 40,698 53,541 45,431 139,670
Harford Community College2004 57,868 56,070 56,575 170,513
State-funded 2014 56,865 62,422 58,283 177,570 Community College Projected 2014 57,615 64,922 61,448 183,985
Howard Community College2004 40,544 81,246 66,395 188,185
State-funded 2014 34,507 144,636 81,610 260,753 Community College Projected 2014 34,507 152,548 83,529 270,584
Montgomery College2004 143,950 243,012 221,066 608,028
State-funded 2014 166,008 371,884 260,535 798,427 Community College Projected 2014 153,561 390,678 285,164 829,403
Prince George's Community College2004 72,693 115,242 105,574 293,509
State-funded 2014 91,599 152,495 133,261 377,355 Community College Projected 2014 92,799 152,495 140,032 385,326
Wor-Wic Community College2004 20,637 23,190 22,589 66,416
State-funded 2014 33,935 30,902 31,289 96,126 Community College Projected 2014 34,194 38,252 40,060 112,506
Total - 2004 846,084 1,219,857 1,234,728 3,300,669 Total State-funded - 2014 933,048 1,506,888 1,438,968 3,878,904
Total Community College Projected - 2014 972,088 1,650,422 1,541,135 4,228,682 % CHANGE - ALL COLLEGES 10.28% 23.53% 16.54% 17.52%
Notes:
1. Baltimore City Community College is State-owned
2. Cecil College projections based on June 2006 Space Inventories
State-funded represents projects authorized in State CIP
Community College Projected represents projects authorized in State CIP and projects included in Facilities Master Plans

Exhibit F. Four-Year Public Colleges and UniversitiesAcademic Space Inventory: Fall 2004 to Fall 2014
Classroom Laboratory Office Academic SpaceHEGIS 100 HEGIS 210/225 HEGIS 300 Total
Bowie State University2004 Current 40,556 61,391 107,358 209,305
2014 Projected 48,616 100,079 130,593 279,288 2014 Institutional Projected 50,456 101,686 143,891 296,033
Coppin State University2004 Current 24,140 30,498 84,559 139,197
2014 Projected 38,840 53,029 110,162 202,031 2014 Institutional Projected 46,185 75,729 133,462 255,376
Frostburg State University2004 Current 56,384 100,291 112,434 269,109
2014 Projected 56,384 100,291 112,434 269,109 2014 Institutional Projected 58,761 112,514 132,498 303,773
Salisbury University2004 Current 63,152 84,312 155,776 303,240
2014 Projected 66,654 108,815 170,460 345,929 2014 Institutional Projected 66,654 108,815 170,460 345,929
Towson University2004 Current 135,691 172,599 372,979 681,269
2014 Projected 198,633 261,822 469,079 929,534 2014 Institutional Projected 198,633 276,727 469,079 944,439
University of Baltimore2004 Current 49,487 13,587 126,024 189,098
2014 Projected 50,144 27,255 121,093 198,492 2014 Institutional Projected 52,144 27,255 128,093 207,492
UM, Baltimore2004 Current 101,195 105,159 634,946 841,300
2014 Projected 129,059 97,104 646,229 872,392 2014 Institutional Projected 129,059 107,279 742,794 979,132
UM Baltimore County2004 Current 81,545 138,158 334,348 554,051
2014 Projected 81,545 138,158 336,878 556,581 2014 Institutional Projected 93,830 180,865 381,897 656,592
UM, College Park2004 Current 337,531 376,452 1,661,912 2,375,895
2014 Projected 361,638 386,916 1,738,944 2,487,498 2014 Institutional Projected 361,638 386,916 1,681,514 2,430,068
UM Eastern Shore2004 Current 42,028 108,058 137,759 287,845
2014 Projected 53,003 159,973 160,269 373,245 2014 Institutional Projected 53,003 159,973 160,269 373,245
Subtotal: USM2004 Current 931,709 1,190,505 3,728,095 5,850,309
2014 Projected 1,084,516 1,433,442 3,996,141 6,514,099 2014 Institutional Projected 1,110,363 1,537,759 4,143,957 6,792,079
Morgan State University2004 Current 74,850 127,189 265,050 467,089
2014 Projected 87,036 125,784 190,727 403,547 2014 Institutional Projected 87,036 125,784 190,727 403,547
St. Mary's College of Maryland2004 Current 13,416 35,000 60,526 108,942
2014 Projected 24,069 49,306 64,862 138,237 2014 Institutional Projected 24,069 49,306 64,862 138,237
Total2004 Current 1,019,975 1,352,694 4,053,671 6,426,340
2014 Projected 1,195,621 1,608,532 4,251,730 7,055,883 2014 Institutional Projected 1,221,468 1,712,849 4,399,546 7,333,863
Notes:1) Study/Stack space includes study room, stack, open-stack study room, processing, and study service.2) All data are self-reported.
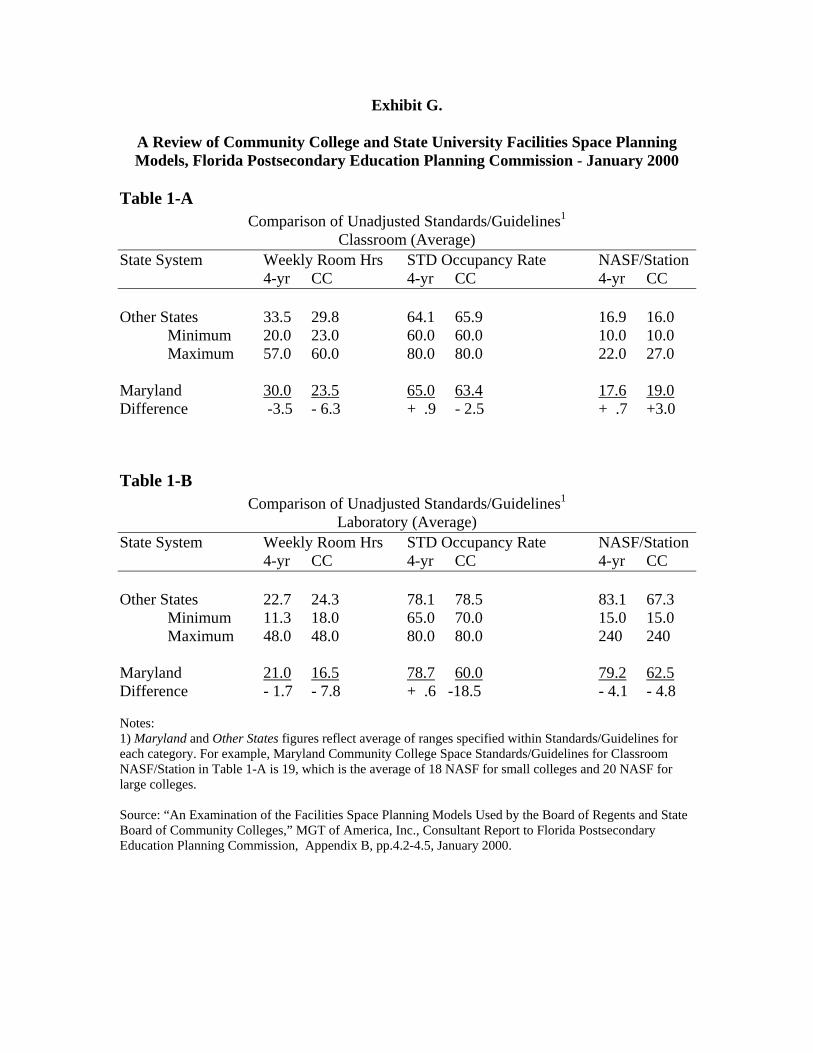
Exhibit G.
A Review of Community College and State University Facilities Space Planning Models, Florida Postsecondary Education Planning Commission - January 2000
Table 1-A Comparison of Unadjusted Standards/Guidelines1
Classroom (Average) State System Weekly Room Hrs STD Occupancy Rate NASF/Station 4-yr CC 4-yr CC 4-yr CC Other States 33.5 29.8 64.1 65.9 16.9 16.0 Minimum 20.0 23.0 60.0 60.0 10.0 10.0 Maximum 57.0 60.0 80.0 80.0 22.0 27.0 Maryland 30.0 23.5 65.0 63.4 17.6 19.0 Difference -3.5 - 6.3 + .9 - 2.5 + .7 +3.0
Table 1-B Comparison of Unadjusted Standards/Guidelines1
Laboratory (Average) State System Weekly Room Hrs STD Occupancy Rate NASF/Station 4-yr CC 4-yr CC 4-yr CC Other States 22.7 24.3 78.1 78.5 83.1 67.3 Minimum 11.3 18.0 65.0 70.0 15.0 15.0 Maximum 48.0 48.0 80.0 80.0 240 240 Maryland 21.0 16.5 78.7 60.0 79.2 62.5 Difference - 1.7 - 7.8 + .6 -18.5 - 4.1 - 4.8 Notes: 1) Maryland and Other States figures reflect average of ranges specified within Standards/Guidelines for each category. For example, Maryland Community College Space Standards/Guidelines for Classroom NASF/Station in Table 1-A is 19, which is the average of 18 NASF for small colleges and 20 NASF for large colleges. Source: “An Examination of the Facilities Space Planning Models Used by the Board of Regents and State Board of Community Colleges,” MGT of America, Inc., Consultant Report to Florida Postsecondary Education Planning Commission, Appendix B, pp.4.2-4.5, January 2000.

Exhibit H
Enrollment and Utilization Data (Fall 2004)
USM & MACC Survey of Institutions
Credit Hrs/ WSCH/ Institution Segment FTDE* FTDE* Bowie State University 4-yr 14.90 17.06 Coppin State University 4-yr 14.89 13.56 Frostburg State U. 4-yr 14.83 12.70 Morgan State University 4-yr 14.92 14.43 Salisbury University 4-yr 14.96 13.14 St. Mary’s College 4-yr 16.88 17.48 Towson University 4-yr 14.78 12.67 University of Baltimore ** 4-yr 9.17 8.62 UM, Baltimore 4-yr 12.83 17.58 UM Baltimore County 4-yr 14.39 14.46 UM, College Park 4-yr 14.09 14.75 UM Eastern Shore 4-yr 14.87 12.20 TOTAL 102.81 93.48 AVERAGE 14.69 13.35 Allegany College 2-yr 23.00 13.94 Anne Arundel Community College 2-yr 16.00 15.08 Baltimore City Community College 2-yr 13.00 18.13 CC of Baltimore County 2-yr 19.00 15.01 Carroll Community College 2-yr 16.00 08.20 Cecil Community College 2-yr 16.00 08.68 Chesapeake College 2-yr 17.00 10.39 College of Southern Maryland 2-yr 17.00 11.51 Frederick Community College 2-yr 18.00 08.28 Garrett College 2-yr 21.00 12.50 Hagerstown Community College 2-yr 15.00 11.07 Harford Community College 2-yr 18.00 13.84 Howard Community College 2-yr 15.00 07.55 Montgomery College 2-yr 19.00 12.52 Prince George’s Community College 2-yr 13.00 12.50 Wor-Wic Community College 2-yr 18.00 12.02 TOTAL 274.00 191.22 AVERAGE 17.13 11.95 Notes:** University of Baltimore based on FTNE and enrollments after 5 pm.