canadian plat disease survey , volume 81 – 2001
TRANSCRIPT

Agriculture and Agriculture et The Canadian Phytopathological SocietyAgri-Food Canada Agroalimentaire Canada Société Canadienne de Phytopathologie
Research Direction généraleBranch de la recherche
Canadian InventairePlant des maladiesDisease des plantesSurvey au CanadaVolume 81, 2001 Volume 81, 2001CPDS 81: 1 - 172 CPDS 81: 1 - 172March, 2001 le mars, 2001

Agriculture and Agriculture et The Canadian Phytopathological SocietyAgri-Food Canada Agroalimentaire Canada Société Canadienne de Phytopathologie
2001
THE CANADIAN PHYTOPATHOLOGICAL SOCIETY /
CANADIAN PLANT DISEASE SURVEY
- DISEASE HIGHLIGHTS
SOCIÉTÉ CANADIENNE DE PHYTOPATHOLOGIE /INVENTAIRE DES MALADIES DES PLANTES AU CANADA
- APERÇU DES MALADIES
The Society recognizes the continuing need for publication of plant disease surveyswhich benefit both federal and provincial agencies in planning appropriate research for
the control of plant diseases. The reports you contribute are important to documentplant pathology in Canada.
NATIONAL COORDINATOR/ COORDINATEUR NATIONAL
Dr. Robin A. A. Morrall
Department of Biology, University of SaskatchewanSaskatoon, Saskatchewan S7N 0X2
Tel. (306) 966-4410Fax (306) 966-4461
Email: [email protected]

2
Canadian PlantDisease Survey
Inventaire des maladiesdes plantes au Canada
CPDS Volume 81: 1 - 172 (2001)March, 2001
CPDS Volume 81: 1 - 172 (2001)le mars, 2001
Agriculture and Agri-Food Canada Agriculture et Agroalimentaire Canada
Contents: DISEASE HIGHLIGHTS - 2000 GROWING SEASON(+ earlier years for historical significance)
2 Contents/Sections3 Year 2001 collators/ collationneurs4 Titles and authors
Sections: 7 Diagnostic Laboratories / Laboratoires diagnostiques7 - British Columbia
16 - Alberta21 - Saskatchewan28 - Manitoba40 - Québec59 Cereals / Céreales (in order of crop within section)
- Forage legumes / Légumineuses fourragères102 Oilseeds and Special Crops / Oléagineux et cultures spéciales141 Vegetables / Légumes144 Fruit, Nuts and Berries, Ornamentals and Turfgrass /
Fruits, fruits à écale, et baies, plantes ornementales et gazon152 Forest Trees/Arbres forestiers171 2001 CPDS Author index (alphabetical)172 List of figures
The Canadian Plant Disease Survey is a periodical ofinformation and record on the occurrence andseverity of plant diseases in Canada and on theassessment of losses from disease.
Authors who have traditionally published scientificnotes in the Canadian Plant Disease Survey areencouraged to submit this material to the scientificjournal of their choice, such as the Canadian Journalof Plant Pathology and Phytoprotection.
Research Branch,Agriculture and Agri-Food CanadaStephanie A. Hilton, CompilerAgriculture and Agri-Food CanadaSouthern Crop Protection and Food Research Centre1391 Sandford StreetLondon, ON, Canada N5X 2M8Tel. (519) 457-1470 Ext. 218Email: [email protected]
L’Inventaire des maladies des plantes au Canada estun périodique d’information sur la fréquence desmaladies des plantes au Canada, leur gravité, et lespertes qu’elles occasionnent.
On encourage les auteurs, qui traditionnellementpubliaient des articles scientifiques dans l’Inventairedes maladies des plantes au Canada, à soumettredorénavant leurs textes au journal scientifique de leurchoix, par exemple, la Revue canadienne dephytopathologie et Phytoprotection.
Direction générale de la recherche,Agriculture et Agroalimentaire CanadaS.A. Hilton, CompilatriceAgriculture et Agroalimentaire CanadaCentre de recherchedu Sud sur la phytoprotection et les aliments 1391 rue Sandford, London (Ontario) N5X 2M8Tel. (519) 457-1470 ext. [email protected]

3
2001 CPDS SECTION EDITORS AND ADDRESSES
SECTION EDITORS AND ADDRESSES
DIAGNOSTIC LABORATORIES/LABORATOIRES DIAGNOSTIQUES
Ms. Marilyn D. DykstraPest Diagnostic Clinic, Laboratory Services DivisionUniversity of Guelph95 Stone Road West, Loading Zone 2Guelph, Ontario N1H 8J7Tel: (519) 767-6258 Fax: (519) 767-6240Email: [email protected]
CEREALS / CÉRÉALES Dr. Andy TekauzAgriculture and Agri-Food CanadaCereal Research Centre195 Dafoe RoadWinnipeg, Manitoba R3T 2M9Tel: (204) 983-0944 Fax: (204) 983-4604Email: [email protected]
FORAGES/ PLANTES FOURRAGÈRES Dr. Bruce D. GossenAgriculture and Agri-Food CanadaResearch Centre107 Science PlaceSaskatoon, Saskatchewan S7N 0X2Tel: (306) 956-7529 Fax: (306) 956-7247Email: [email protected]
OILSEEDS AND SPECIAL CROPS /OLÉAGINEUX ET CULTURES SPÉCIALES
Dr. Robin A.A. MorrallDepartment of BiologyUniversity of Saskatchewan112 Science PlaceSaskatoon, Saskatchewan S7N 5E2Tel: (306) 966-4410 Fax: (306) 966-4461Email:[email protected]
VEGETABLES /LÉGUMES Dr. Paul HildebrandAgriculture and Agri-Food CanadaKentville Research CentreKentville, Nova Scotia B4N 1J5Tel: (902) 678-2171 Fax: (902) 679-2311Email:[email protected]
FRUIT, NUTS and BERRIES, ORNAMENTALS andTURFGRASS/ FRUITS, FRUITS À ÉCALE, et BAIES, PLANTESORNEMENTALES et GAZON
Dr. T. HsiangDepartment of Environmental BiologyUniversity of GuelphGuelph, Ontario N1G 2W1Tel: (519) 824-4120 Ext. 2753 Fax: (519) 837-0442Email: [email protected]
FOREST TREES/ ARBRES FORESTIERS Dr. John A. MuirB.C. Ministry of Forests, Forest Practices BranchP.O. Box 9513, Station Provincial GovernmentVictoria, British Columbia V8W 9C2Tel: (250) 387-8740 Fax: (250) 387-2136Email: [email protected]

4
CANADIAN PLANT DISEASE SURVEY INDEX - AUTHORS AND TITLES
DIAGNOSTIC LABORATORIES/LABORATOIRES DIAGNOSTIQUES
V. Joshi. Diseases diagnosed on commercial crops submitted to the BCMAFF Plant DiagnosticLaboratory in 2000
7
K. Basu , S. Mathur and B.J. Penner. Crop disease summary for samples submitted to BrooksDiagnostics Ltd. from Alberta in 2000
16
G. Holzgang and P. Pearse. Diseases diagnosed on crop samples submitted to the SaskatchewanAgriculture and Food Crop Protection Laboratory in 2000
21
M. Desjardins, R.G. Platford and T.C. Shinners-Carnelley. 2000 Manitoba Crop Diagnostic Centrelaboratory submissions
28
G. Gilbert, M. Lacroix and D. Hamel. Diseases diagnosed on commercial crops submitted to the MAPAQDiagnostic Laboratory in 2000
40
CEREALS / CÉRÉALES
S. Rioux, and A. Comeau. Survol des maladies des céréales présentes au Québec en 2000 59
M.R. Fernandez, P.G. Pearse, G. Holzgang and G.R. Hughes. Fusarium head blight of barley inSaskatchewan in 2000
61
A. Tekauz, J. Gilbert, J. Gold, E. Mueller, M. Idris, M. Stulzer, M. Beyene and R. Kaethler. Survey for leafspot diseases of barley in Manitoba in 2000
63
A. Tekauz, J. Gilbert, J. Gold, E. Mueller, M. Idris, M. Stulzer, M. Beyene and E. Nedohin. Fusarium headblight of barley in Manitoba and south-eastern Saskatchewan in 2000
65
T. M. Choo, A. Comeau, M. Lacroix and K. M. Ho. Barley yellow dwarf of barley in eastern Canada in2000
66
G.R. Hughes, M.R. Fernandez and P.G. Pearse. Leaf diseases of barley and oat in Saskatchewan in2000
68
T. Fetch and K. Dunsmore. Stem rusts of cereals in western Canada in 2000 70
S. Haber and R. Kurtz. Cereal virus disease situation in Manitoba in 2000 71
J.G. Menzies, F. Matheson, C. Saramaga and C. Hoeschen. Cereal smut surveys, 2000 72
D.D. Orr and T.K. Turkington. Cereal disease survey in central Alberta - 2000 73
X. Zhu, L. M. Reid, D. Presello, and T. Woldemariam. Survey of corn pests in Ontario and Québec in2000
75
J. Chong. Crown rust of oat in Western Canada in 2000 79
M.R. Fernandez and R.M. DePauw. Ergot in common and durum wheat in Saskatchewan in 2000 80
M.R. Fernandez, P.G. Pearse, G. Holzgang and G.R. Hughes. Fusarium head blight in common anddurum wheat in Saskatchewan in 2000
83
M.R. Fernandez, G.R. Hughes and P.G. Pearse. Leaf diseases of durum wheat in Saskatchewan in 2000 86
T. Fetch and B. McCallum. Stripe rust of wheat in Manitoba and Saskatchewan in 2000 88
J. Gilbert, A. Tekauz, J. Gold, R. Kaethler, E. Mueller, U. Kromer, K. Morgan and A. DiCarlo. 2000fusarium head blight survey of spring wheat in Manitoba and eastern Saskatchewan
89

5
J. Gilbert, A. Tekauz, J. Gold, R. Kaethler, U. Kromer, K. Morgan, E. Mueller and A. DiCarlo. Survey ofleaf spot diseases of wheat in Manitoba - 2000
90
G.R. Hughes, M.R. Fernandez and P.G. Pearse. Leaf diseases of common wheat in Saskatchewan in2000
91
B. McCallum, P. Seto Goh and B. Mulock. Leaf rust of wheat in western Canada in 2000 94
W. McFadden-Smith. Fungi isolated from crowns of winter wheat in Saskatchewan, 1987 95
L. Tamburic-Ilincic and A. Schaafsma. Fusarium head blight survey of winter wheat in 2000 in Ontario 96
A. Tekauz, J. Gold, M. Idris, M. Beyene, M. Stulzer, E. Nedohin and B. Geoffroy. Fusarium head blight ofwinter wheat in Manitoba in 2000
98
A. Tekauz, J. Gold, J. Gilbert, E. Mueller, M. Idris, M. Stulzer, M. Beyene and B. Geoffroy. Leaf spots ofwinter wheat in Manitoba in 2000
100
OILSEEDS AND SPECIAL CROPS / OLÉAGINEUX ET CULTURES SPÉCIALES
D. Benard, R.M. Lange and L.M. Harrison. Survey of Fusarium wilt and other canola diseases in Alberta,2000
102
P.G. Pearse, R.A.A. Morrall, R. Kutcher, M. Keri, D. Kaminski, R. Gugel, K. Anderson, C. Trail, W. Greuel.Survey of canola diseases in Saskatchewan, 2000
105
D.L. McLaren, and R.G. Platford. Distribution, prevalence and incidence of canola diseases in Manitoba(2000)
108
R.A.A. Morrall, B. Carriere, S. Cronje, D. Schmeling and L. Thomson. Seed-borne pathogens of chickpeain Saskatchewan in 2000
111
H. Wang, S. F. Hwang, G.D. Turnbull, K.F. Chang and R.J. Howard. Disease survey of chickpea in west-central Saskatchewan in 2000
115
A.G. Xue and L. Yager. Diseases of field bean in Manitoba in 2000 119
A.G. Xue and L. Yager. Diseases of field pea in Manitoba in 2000 121
K.Y. Rashid, M. Desjardins, S. Duguid, and R. G. Platford. Diseases of flax in Manitoba andSaskatchewan in 2000
123
R.A.A. Morrall, B. Carriere, S. Cronje, D. Schmeling and L. Thomson. Seed-borne pathogens of lentil inSaskatchewan in 2000
126
R.A.A. Morrall, B. Carriere, S. Cronje, D. Schmeling and L. Thomson. Seed-borne pathogens of pea inSaskatchewan in 2000
130
T.R. Anderson and A.U. Tenuta. Diseases of soybean in Ontario and estimated yield losses, 1994,1996-2000
133
S.D. Bardin and H.C. Huang. Survey of damping-off diseases of sugar beet in southern Alberta in 2000 136
K.Y. Rashid, M. Desjardins and R.G. Platford. Diseases of sunflower in Manitoba in 2000 138
VEGETABLES / LÉGUMES
F. Daayf and H.W. (Bud) Platt. Cross-Canada potato late blight survey in 1999 141
FRUIT, NUTS AND BERRIES, ORNAMENTALS AND TURFGRASS,/ FRUITS, FRUITS À ÉCALE, ETBAIES, PLANTES ORNEMENTALES ET GAZON
E. Hudgins. Survey of blueberry scorch virus in highbush blueberries in British Columbia, 2000 144
6
W. McFadden-Smith and K.W. Ker. Survey for flag leaf symptoms of powdery mildew in grape in NiagaraPeninsula, Ontario, 1991-1994
148
R. Favrin. Outbreak investigation and detection survey for plum pox potyvirus in 2000 149
D’Ann Rochon, Jane Theilmann and Gayle Jesperson. Little cherry virus survey in the Okanagan andKootenay valleys of British Columbia
151
FOREST TREES/ ARBRES FORESTIERS
V. Vujanovic and M. St-Arnaud. Pathogenic fungal species on balsam fir in southern Québec 152
A. Hopkin, L. Innes, and K. Harrison. Distribution of butternut canker (sirococcus clavigignenti-juglandacearum) in eastern Canada
154
V. Vujanovic, A. Cogliastro, A. Paquette and D. Gagnon. Le chancre fusarien sur le chêne rouge(Quercus rubra) au Québec en 1999 et 2000
158
K.J. Harrison, G.R. Warren and A.W. MacKay. Status of European larch canker in Atlantic Canada 2000 161
A.J. Woods. Foliar disease assessment in young (1-20 year old) lodgepole pine stands in north-westernBritish Columbia
163
V. Vujanovic and M. St-Arnaud. Pathogen biodiversity in pine tree collections under urban ecologicalconditions, Québec
166
S. Zeglen. Whitebark pine and white pine blister rust in British Columbia - 1999 169
INDEX.
List of 2001 CPDS authors in alphabetical order 171
List of Figures 172

7
Diagnostic Laboratories / Laboratoires diagnostiques
CROP: Commercial crops - Diagnostic Laboratory Report
LOCATION: British Columbia
NAME AND AGENCY:Vippen Joshi, P.Ag. Plant Diagnostic Pathologist, BC Ministry of Agriculture, Food and FisheriesAbbotsford Agriculture Centre, 1767 Angus Campbell Road, Abbotsford, BC V3G 2M3
TITLE: DISEASES DIAGNOSED ON COMMERCIAL CROPS SUBMITTED TO THE BCMAFFPLANT DIAGNOSTIC LABORATORY IN 2000.
METHODS: The BCMAFF Plant Diagnostic Laboratory provides diagnosis and controlrecommendations for diseases and disorders of commercial agricultural crops grown in BritishColumbia. The following data reflect samples submitted to the laboratory by the Ministry extension staff,growers, agribusinesses, parks boards, and master gardeners. Diagnoses were accomplished bymicroscopic examination, culturing onto artificial media, biochemical identification of bacteria usingBIOLOG® and serological testing for viruses and bacteria with micro-well and membrane basedEnzyme-Linked Immunosorbent Assay (ELISA). Some specimens were forwarded to other laboratoriesfor identification or confirmation of the diagnosis. The lab does not do soil nutrient, tissue nutrient orchemical residue analyses.
RESULTS AND COMMENTS: Summaries of the diseases and their causal agents diagnosed oncommercial crops are presented in Tables 1-9 by crop category. The total number of submissions foreach crop category is listed at the bottom of each table. Problems not listed include: no disease andabiotic problems such as nutritional stress, pH imbalance, water stress, poor sample, physiologicalresponse to growing conditions, environmental and chemical damage, insect-related injury and damagewhere no conclusive causal factor was identified.
Table 1. Summary of diseases diagnosed on field crop samples submitted to the BCMAFF PlantDiagnostic Laboratory in 2000.
CROP DISEASE CAUSAL ORGANISM NO.Corn Common smut Ustilago maydis 1
Helictotrichon sepervirens Ergot Claviceps purpurea 1
Orchard grass Root rot Pythium sp. 1
TOTAL DISEASED SAMPLES 3
TOTAL SUBMISSIONS 7

8
Table 2. Summary of diseases diagnosed on greenhouse floriculture samples submitted to theBCMAFF Plant Diagnostic Laboratory in 2000.
CROP DISEASE CAUSAL ORGANISM NO.Aphelandra sp. INSV INSV (Impatiens Necrotic Spot Virus) 1Begonia sp. INSV INSV (Impatiens Necrotic Spot Virus) 2
Stem rot Glomerella sp. 1Bergenia sp. Foliar nematode Aphelenchoides sp. 2Bergenia cordifolia Foliar nematode Aphelenchoides sp. 1Brassica oleracea Downy mildew Peronospora parasitica 1var. acephalaCalathea sp. Leaf spot Helminthosporium sp. 1Chrysanthemum sp. Root rot Pythium sp. 1
Stem rot Pythium sp. 1Stem rot Rhizoctonia sp. 1
Croton sp. Root rot Rhizoctonia solani 1Dicentra formosa Downy mildew Peronospora dicentrae 1Digitalis purpurea Root rot Pythium sp. 1Dracaena sp. Root rot Pythium/Phytophthora spp. 1
Soft rot Erwinia sp. 1Stem rot Nectria haematococca 1
Euphorbia pulcherrima Basal stem rot Fusarium sp. 1Botrytis canker Botrytis cinerea 2Powdery mildew Oidium sp. 1Root rot Pythium/Phytophthora spp. 1Root rot Pythium sp. 1
Ficus sp. Root rot Rhizoctonia solani 1Hedera sp. Crown and root rot Pythium and Rhizoctonia sp. 1
Leaf blight Xanthomonas hederae 2Helleborus foetidus Root rot Pythium/Phytophthora spp. 1Hemerocallis sp. Root rot Phytophthora sp. 1Heuchera sp. Root rot Pythium/Phytophthora spp. 1Impatiens sp. INSV INSV (Impatiens Necrotic Spot Virus) 1
Leaf spot Myrothecium roridum 1TSWV TSWV (Tomato Spotted Wilt Virus) 1
Iris sp. Basal rot Fusarium oxysporum 1Blue mold Penicillium sp. 1Bulb rot Penicillium sp. 1
Lilium sp. Bulb rot Pythium sp. 1Bulb rot Rhizoctonia sp. 1Petal spot Botrytis sp. 1
Limonium sp. Downy mildew Peronospora sp. 1Root rot Pythium sp. 1
Lupinus sp. Anthracnose Gloeosporium sp. 1Anthracnose Colletotrichum sp. 1
Narcissus sp. Nematode damage Ditylenchus sp. 1Nemesia sp. Bacterial blight Pseudomonas cichorii 1
Continued

9
Table 2.. greenhouse floriculture crops- cont’d
CROP DISEASE CAUSAL ORGANISM NO.Paeonia suffruticosa Leaf blotch Cladosporium sp. 1Petunia sp. Black root rot Thielaviopsis basicola 1
Foliar blight Botrytis cinerea 1Pelargonium sp. Bacterial blight Xanthomonas campestris pv. pelargonii 1
Leaf spot Pseudomonas syringae 1Root rot Thielaviopsis basicola 2Root rot Pythium sp. 1Wire stem Rhizoctonia solani 1
Phlox sp. INSV INSV (Impatiens Necrotic Spot Virus) 1Downy mildew Peronospora phlogina 2
Plectranthus sp. INSV INSV (Impatiens Necrotic Spot Virus) 1Ranunculus sp. INSV INSV (Impatiens Necrotic Spot Virus) 1Rosa sp. Stem & root rot Pythium/Phytophthora spp. 1Schizostylis coccinea Leaf spot Heterosporium sp. 1Schlumbergera sp. Erwinia blight Erwinia carotovora 1
Stem rot Fusarium sp. 1Senecio cruentus INSV INSV (Impatiens Necrotic Spot Virus) 1Spathiphyllum sp. INSV INSV (Impatiens Necrotic Spot Virus) 1Trillium ovatum Anthracnose Colletotrichum sp. 1Tulipa sp. Blue mold Penicillium sp. 1
Gray mold Botrytis sp. 1Verbena sp. INSV INSV (Impatiens Necrotic Spot Virus) 1Viola sp. Downy mildew Peronospora violae 1
Leaf spot Ramularia sp. 1
TOTAL DISEASED SAMPLES 72
TOTAL SUBMISSIONS 116
Table 3. Summary of diseases diagnosed on greenhouse vegetable samples submitted to theBCMAFF Plant Diagnostic Laboratory in 2000.
CROP DISEASE CAUSAL ORGANISM NO.Cucumber Stem rot Erwinia carotovora 1Pepper INSV INSV (Impatiens Necrotic Spot Virus) 1
PMMV PMMV (Pepper Mild Mottle Virus) 1Tomato Bacterial canker Clavibacter michiganensis subsp. michiganensis 2
Botrytis canker Botrytis cinerea 1Foliar infection Penicillium sp. 1Late blight Phytophthora infestans 2Root rot Pythium sp. 4
TOTAL DISEASED SAMPLES 13
TOTAL SUBMISSIONS 40

10
Table 4. Summary of diseases diagnosed on nuts and small fruit samples submitted to theBCMAFF Plant Diagnostic Laboratory in 2000.
CROP DISEASE CAUSAL ORGANISM NO.Walnut Canker Cytospora sp. 1Blackberry Downy mildew Peronospora sparsa 1Blueberry Armillaria root rot Armillaria sp. 1
Bacterial blight Pseudomonas syringae 4Blueberry Scorch Virus Blueberry Scorch Virus* 1Canker Phomopsis sp. 1Godronia canker Godronia cassandrae 5Mummy berry Monilinia vaccinii-corymbosi 2Root rot Phytophthora sp. 5
Cranberry Black rot Allantophomopsis sp. 1Black rot Allantophomopsis cytisporea 1End rot Godronia cassandrae 1Leaf spot Protoventuria sp. 4Leaf spot Colletotrichum sp. 1
Raspberry Blossom blight Botrytis cinerea 1Crown and root rot Pythium/Phytophthora spp. 1Crown and root rot Phytophthora sp. 2Root rot Phytophthora fragariae 1Root rot Phytophthora sp. 3Spur blight Didymella applanata 2
Salmonberry Anthracnose Colletotrichum sp. 1Saskatoon Canker Cytospora sp. 1Strawberry Black root rot Phytophthora/Pythium/Rhizoctonia spp. 2
Red stele root rot Phytophthora fragariae 2Verticillium wilt Verticillium albo-atrum 1
TOTAL DISEASED SAMPLES 46
TOTAL SUBMISSIONS 76
* This is the first confirmed report of the presence of Blueberry Scorch Virus in BC. Following firstsubmission, a survey was conducted to study the distribution of this virus in Lower Mainland. A total of20 fields were infected.

11
Table 5. Summary of diseases diagnosed on special crop samples submitted to the BCMAFF PlantDiagnostic Laboratory in 2000.
CROP DISEASE CAUSAL ORGANISM NO.Basil Stem canker Botrytis cinerea 1Ginseng Crown rot Rhizoctonia solani 1
Foliar blight Alternaria panax 1Powdery mildew Erysiphe sp. 1Root rot Rhizoctonia solani 1Root rot Phytophthora sp. 1
Sea buckthorn Wilt Verticillium dahliae 1
TOTAL DISEASED SAMPLES 7
TOTAL SUBMISSIONS 10
Table 6. Summary of diseases diagnosed on tree fruit samples submitted to the BCMAFF PlantDiagnostic Laboratory in 2000.
CROP DISEASE CAUSAL ORGANISM NO.Apple Apple scab Venturia inaequalis 1
Bacterial canker Pseudomonas syringae 1Canker Cytospora sp. 1Crown gall Agrobacterium tumefaciens 1European canker Nectria galligena 2Fire blight Erwinia amylovora 2Root rot Phytophthora sp. 1
Apricot Bacterial blight Pseudomonas syringae 3Fruit spot Apricot Ring Pox * 1
Cherry Bacterial canker Pseudomonas syringae 2Root rot Phytophthora sp. 1Root rot Pythium/Phytophthora spp. 2
Grape Root rot Pythium/Phytophthora spp. 2Root rot Armillaria sp. 1Crown gall Agrobacterium tumefaciens* 1
Peach Bacterial blight Pseudomonas syringae 1Pear European canker Nectria galligena 1Plum Bacterial blight Pseudomonas syringae 1Plum (prune) Rust Tranzschelia sp. 1Prunus spp. Bacterial blight Pseudomonas syringae 1
Verticillium wilt Verticillium dahliae 1Brown rot Monilinia sp. 1
TOTAL DISEASED SAMPLES 29
TOTAL SUBMISSIONS 42
* The causal organism was suspected but not confirmed in the lab.

12
Table 7. Summary of diseases diagnosed on turfgrass green, lawn and sod samples submitted tothe BCMAFF Plant Diagnostic Laboratory in 2000.
CAUSAL AGENT/DISEASE TYPE OF SAMPLE
Green* Sod* Lawn*Pythium sp./damping off 1 1Pythium sp./root rot 13 1 1Gaeumannomyces graminis/take-all patch 5Ascochyta sp./foliar blight 1Microdochium nivale/ fusarium patch 12Typhula ishikariensis/gray snow mold 1Colletotrichum graminicol/anthracnose 15 1Colletotrichum sp./winter anthracnose 4Rhizoctonia cerealis /yellow patch 8Rhizoctonia sp./rhizoctonia patch 4Basidiomycete/localized dry spot 1 Algae 3Sclerophthora sp./downy mildew 18 1Leptosphaerulina sp./foliar blight 1Curvularia sp./foliar blight 1Septoria sp./leaf spot 3Spermospora sp./leaf spot 1
u Greens are primarily creeping bentgrass and/or annual bluegrass samples from golf courses. Lawnand sod refer to mixtures of fescue, ryegrass, Kentucky bluegrass and annual bluegrass.

13
Table 8. Summary of diseases diagnosed on field vegetable samples submitted to the BCMAFFPlant Diagnostic Laboratory in 2000.
CROP DISEASE CAUSAL ORGANISM NO.Artichoke Black lesions Pseudomonas syringae* 1Cantaloupe Leaf spot Pseudomonas syringae 1Celery Late blight Septoria sp. 1Garlic White rot Sclerotium cepivorum 1Onion Downy mildew Peronospora destructor 1
Neck rot Botrytis allii 1Smut Urocystis sp. 2White rot Sclerotium cepivorum 1
Parsnip Leaf spot Ramularia sp. 1Pea Damping off Pythium sp. 1
Root rot Pythium/Aphanomyces spp. 1Pepper Vascular wilt Verticillium dahliae 1Potato Black leg Erwinia carotovora subsp. atroseptica 2
Black scurf Rhizoctonia solani 1Common scab Streptomyces scabies 1Early blight Alternaria solani 1Late blight Phytophthora infestans 1Powdery scab Spongospora subterranea 1Powdery scab Spongospora sp. 1Russet scab Streptomyces sp. 1Silver scurf Helminthosporium solani 1Soft rot Erwinia carotovora subsp. carotovora 4
Rhubarb Red leaf spot Erwinia rhapontici 1Rutabaga Crater rot Rhizoctonia solani 1Tomato Canker Botrytis cinerea 1
Crown and root rot Fusarium oxysporum f.sp. radicis-lycopersici 1Late blight Phytophthora infestans 1Leaf mould Fulvia fulva 1White mould Sclerotinia sclerotiorum 1Powdery mildew Oidiopsis sp. 2
TOTAL DISEASED SAMPLES 36
TOTAL SUBMISSIONS 53
* Confirmed the presence of the organism but no pathogenicity test was performed.
14
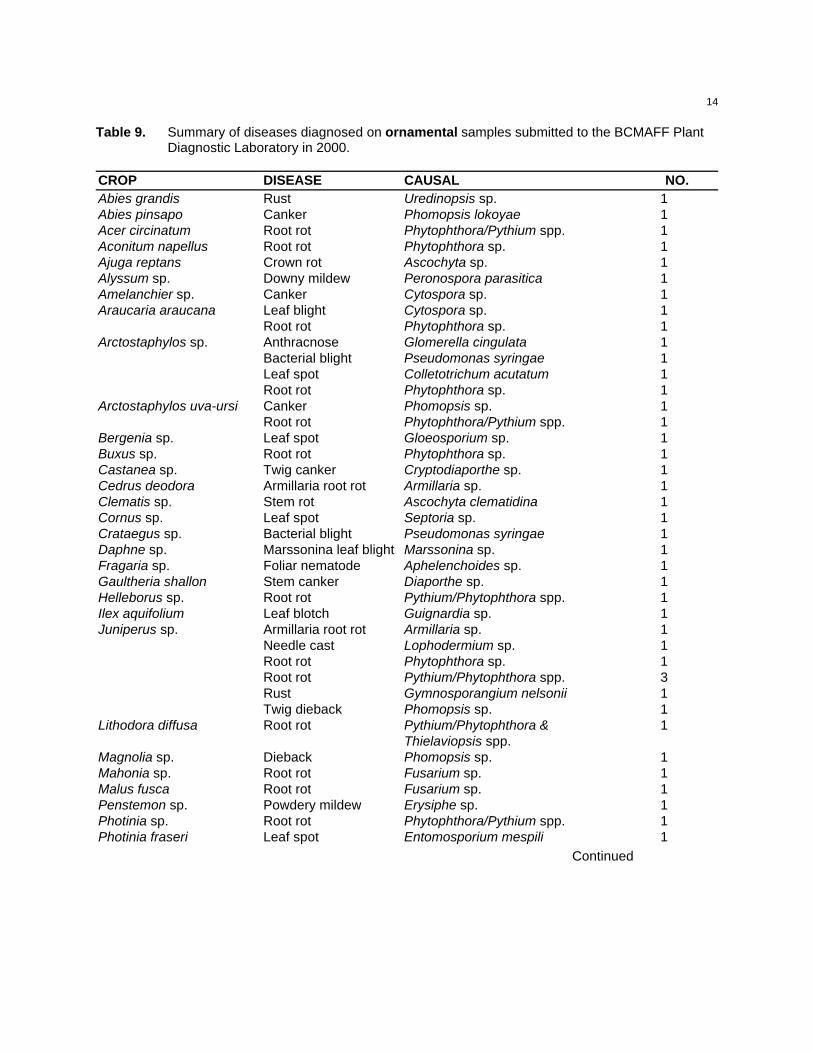
Table 9. Summary of diseases diagnosed on ornamental samples submitted to the BCMAFF PlantDiagnostic Laboratory in 2000.
CROP DISEASE CAUSAL NO.Abies grandis Rust Uredinopsis sp. 1Abies pinsapo Canker Phomopsis lokoyae 1Acer circinatum Root rot Phytophthora/Pythium spp. 1Aconitum napellus Root rot Phytophthora sp. 1Ajuga reptans Crown rot Ascochyta sp. 1Alyssum sp. Downy mildew Peronospora parasitica 1Amelanchier sp. Canker Cytospora sp. 1Araucaria araucana Leaf blight Cytospora sp. 1
Root rot Phytophthora sp. 1Arctostaphylos sp. Anthracnose Glomerella cingulata 1
Bacterial blight Pseudomonas syringae 1Leaf spot Colletotrichum acutatum 1Root rot Phytophthora sp. 1
Arctostaphylos uva-ursi Canker Phomopsis sp. 1Root rot Phytophthora/Pythium spp. 1
Bergenia sp. Leaf spot Gloeosporium sp. 1Buxus sp. Root rot Phytophthora sp. 1Castanea sp. Twig canker Cryptodiaporthe sp. 1Cedrus deodora Armillaria root rot Armillaria sp. 1Clematis sp. Stem rot Ascochyta clematidina 1Cornus sp. Leaf spot Septoria sp. 1Crataegus sp. Bacterial blight Pseudomonas syringae 1Daphne sp. Marssonina leaf blight Marssonina sp. 1Fragaria sp. Foliar nematode Aphelenchoides sp. 1Gaultheria shallon Stem canker Diaporthe sp. 1Helleborus sp. Root rot Pythium/Phytophthora spp. 1Ilex aquifolium Leaf blotch Guignardia sp. 1Juniperus sp. Armillaria root rot Armillaria sp. 1
Needle cast Lophodermium sp. 1Root rot Phytophthora sp. 1Root rot Pythium/Phytophthora spp. 3Rust Gymnosporangium nelsonii 1Twig dieback Phomopsis sp. 1
Lithodora diffusa Root rot Pythium/Phytophthora & 1Thielaviopsis spp.
Magnolia sp. Dieback Phomopsis sp. 1Mahonia sp. Root rot Fusarium sp. 1Malus fusca Root rot Fusarium sp. 1Penstemon sp. Powdery mildew Erysiphe sp. 1Photinia sp. Root rot Phytophthora/Pythium spp. 1Photinia fraseri Leaf spot Entomosporium mespili 1
Continued
15
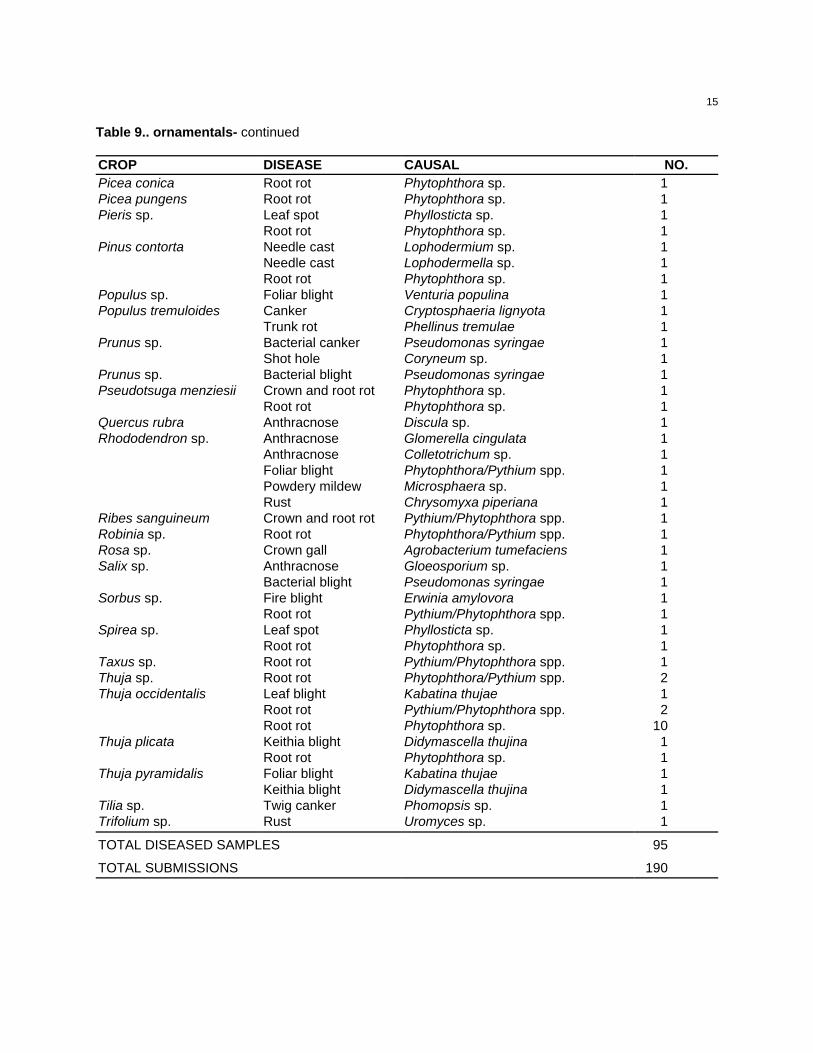
Table 9.. ornamentals- continued
CROP DISEASE CAUSAL NO.Picea conica Root rot Phytophthora sp. 1Picea pungens Root rot Phytophthora sp. 1Pieris sp. Leaf spot Phyllosticta sp. 1
Root rot Phytophthora sp. 1Pinus contorta Needle cast Lophodermium sp. 1
Needle cast Lophodermella sp. 1Root rot Phytophthora sp. 1
Populus sp. Foliar blight Venturia populina 1Populus tremuloides Canker Cryptosphaeria lignyota 1
Trunk rot Phellinus tremulae 1Prunus sp. Bacterial canker Pseudomonas syringae 1
Shot hole Coryneum sp. 1Prunus sp. Bacterial blight Pseudomonas syringae 1Pseudotsuga menziesii Crown and root rot Phytophthora sp. 1
Root rot Phytophthora sp. 1Quercus rubra Anthracnose Discula sp. 1Rhododendron sp. Anthracnose Glomerella cingulata 1
Anthracnose Colletotrichum sp. 1Foliar blight Phytophthora/Pythium spp. 1Powdery mildew Microsphaera sp. 1Rust Chrysomyxa piperiana 1
Ribes sanguineum Crown and root rot Pythium/Phytophthora spp. 1Robinia sp. Root rot Phytophthora/Pythium spp. 1Rosa sp. Crown gall Agrobacterium tumefaciens 1Salix sp. Anthracnose Gloeosporium sp. 1
Bacterial blight Pseudomonas syringae 1Sorbus sp. Fire blight Erwinia amylovora 1
Root rot Pythium/Phytophthora spp. 1Spirea sp. Leaf spot Phyllosticta sp. 1
Root rot Phytophthora sp. 1Taxus sp. Root rot Pythium/Phytophthora spp. 1Thuja sp. Root rot Phytophthora/Pythium spp. 2Thuja occidentalis Leaf blight Kabatina thujae 1
Root rot Pythium/Phytophthora spp. 2Root rot Phytophthora sp. 10
Thuja plicata Keithia blight Didymascella thujina 1Root rot Phytophthora sp. 1
Thuja pyramidalis Foliar blight Kabatina thujae 1Keithia blight Didymascella thujina 1
Tilia sp. Twig canker Phomopsis sp. 1Trifolium sp. Rust Uromyces sp. 1
TOTAL DISEASED SAMPLES 95
TOTAL SUBMISSIONS 190

16
Crop: Commercial Crops - Diagnostic Laboratory Report
Location: Alberta
Name and Agency:K. Basu , S. Mathur and B.J. PennerBrooks Diagnostics LimitedCrop Diversification Centre South, Brooks, Alberta, Canada T1R 1C5
Title: CROP DISEASE SUMMARY FOR SAMPLES SUBMITTED TO BROOKS DIAGNOSTICS LTD.FROM ALBERTA IN 2000
Methods: Brooks Diagnostics Limited (BDL), a private plant health clinic, provided diagnosis ofdiseases on commercial crops and other plants submitted by farmers, extension specialists, scientists,agribusinesses, market gardeners, florists, greenhouse growers, landscaping companies, municipalparks departments staff, nurseries, golf courses, and the general public from January 1 to August 30,2000. The company closed its doors in September after being in business for seven years.
Results: Disease identifications from various crop categories are summarized in Tables 1-10, and areorganized according to the region of submission. BDL also received samples with insect damage andfrom regions other than Alberta. These data are not included in this report.
Table 1. Summary of diseases diagnosed on cereal crops submitted to Brooks Diagnostics Ltd. in2000.
LOCATION/HOST DISEASE/SYMPTOMS CAUSAL AGENT
Southern Alberta
Barley Spot blotch Cochliobolus sativusFusarium blight Fusarium avenaceumCommon root rot Cochliobolus sativus, Fusarium spp.Spot form of net blotch Pyrenophora teresFoliar yellowing Physiological stress
Wheat Foot rot/crown rot Fusarium spp.Spot blotchFusarium spp.Seedling blight Cochliobolus sativusRoot rot Rhizoctonia solani
Northern AlbertaBarley Root rot Fusarium spp., Rhizoctonia solani
Spot blotch Cochliobolus sativus
Wheat Root rot/foot rot Fusarium sp., Rhizoctonia solaniRhizoctonia root rotRhizoctonia solani
Seedling blight/damping-off Pythium spp., Fusarium spp.,Cochliobolus sativus

17
Table 2. Summary of diseases diagnosed on field crops submitted to Brooks Diagnostics Ltd. in2000.
LOCATION/HOST DISEASE/SYMPTOMS CAUSAL AGENT
Southern Alberta
Chickpea Ascochyta blight Ascochyta rabiei
South Central Alberta
Field pea Root rot, seedling blight Fusarium spp., Pythium spp., Rhizoctonia spp.
Table 3. Summary of diseases diagnosed on forage crops submitted to Brooks Diagnostics Ltd. in2000.
LOCATION/HOST DISEASE/SYMPTOMS CAUSAL AGENT
Southern Alberta
Alfalfa Leaf spot Stemphylium botryosum
Crown/root rot Fusarium roseum, Rhizoctonia solani
Spring blackstem and leaf spot Phoma medicaginis
White leaf spot Physiological stress
Table 4. Summary of diseases diagnosed on fruit trees submitted to Brooks Diagnostics Ltd. in2000.
LOCATION/HOST DISEASE/SYMPTOMS CAUSAL AGENT
Southern Alberta
Apple Fire blight Erwinia amylovora
Saskatoon Rust Gymnosporangium spp.
18
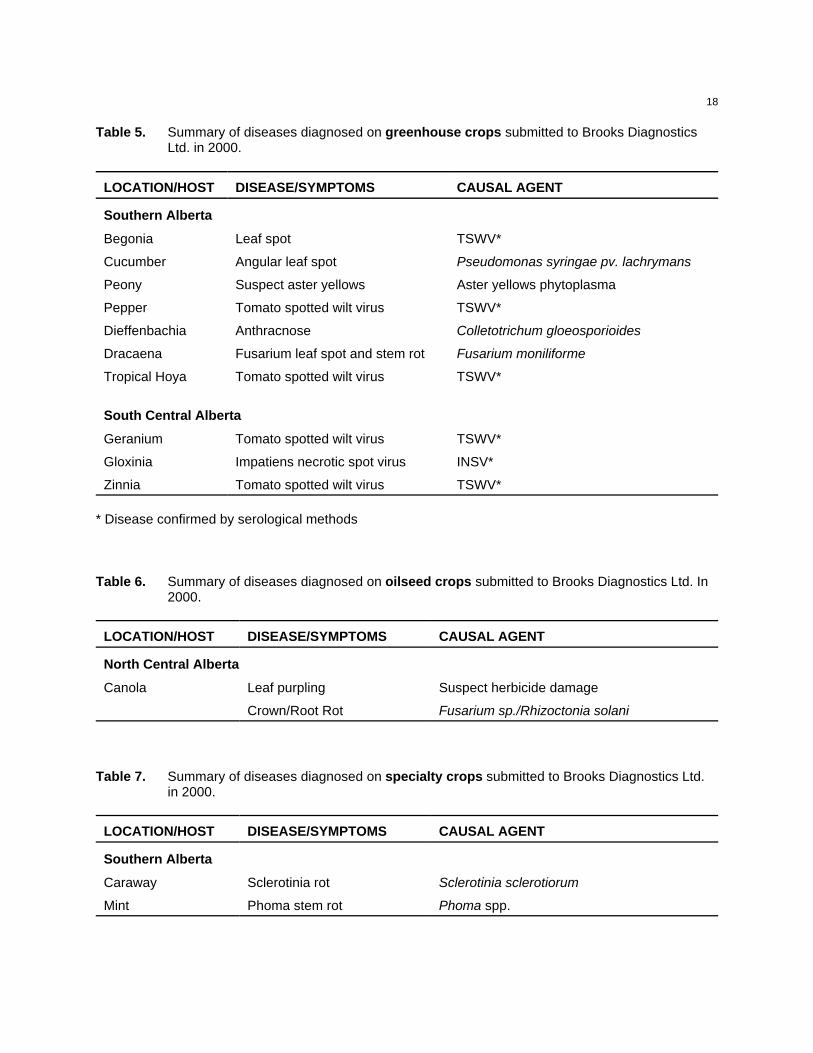
Table 5. Summary of diseases diagnosed on greenhouse crops submitted to Brooks DiagnosticsLtd. in 2000.
LOCATION/HOST DISEASE/SYMPTOMS CAUSAL AGENT
Southern Alberta
Begonia Leaf spot TSWV*
Cucumber Angular leaf spot Pseudomonas syringae pv. lachrymans
Peony Suspect aster yellows Aster yellows phytoplasma
Pepper Tomato spotted wilt virus TSWV*
Dieffenbachia Anthracnose Colletotrichum gloeosporioides
Dracaena Fusarium leaf spot and stem rot Fusarium moniliforme
Tropical Hoya Tomato spotted wilt virus TSWV*
South Central Alberta
Geranium Tomato spotted wilt virus TSWV*
Gloxinia Impatiens necrotic spot virus INSV*
Zinnia Tomato spotted wilt virus TSWV*
* Disease confirmed by serological methods
Table 6. Summary of diseases diagnosed on oilseed crops submitted to Brooks Diagnostics Ltd. In2000.
LOCATION/HOST DISEASE/SYMPTOMS CAUSAL AGENT
North Central Alberta
Canola Leaf purpling Suspect herbicide damage
Crown/Root Rot Fusarium sp./Rhizoctonia solani
Table 7. Summary of diseases diagnosed on specialty crops submitted to Brooks Diagnostics Ltd.in 2000.
LOCATION/HOST DISEASE/SYMPTOMS CAUSAL AGENT
Southern Alberta
Caraway Sclerotinia rot Sclerotinia sclerotiorum
Mint Phoma stem rot Phoma spp.

19
Table 8. Summary of diseases diagnosed on turfgrass submitted to Brooks Diagnostics Ltd. in 2000.
LOCATION/HOST DISEASE/SYMPTOMS CAUSAL AGENT
Southern Alberta
Fairway Pink snow mold Microdochium nivale
Pythium blight Pythium spp.
Green Pink snow mold Microdochium nivale
Pythium blight Pythium spp.
Melting out/leaf spot Drechslera poae
Fusarium patch Fusarium poae
Fusarium graminearum
Fusarium equiseti
Brown patch Rhizoctonia solani
Lawn Fairy ring Marasmius oreades
South Central Alberta
Green Pink snow mold Microdochium nivale
Pythium blight Pythium spp.
Brown patch Rhizoctonia spp.AnthracnoseColletotrichum
Cottony snow mold Coprinus psychromorbidus
Melting out/leaf spot Drechslera poae
Fusarium patch Fusarium poae
Fusarium graminearum
Fusarium culmorum
Fusarium avenaceum
North Eastern Alberta
Green Leptosphaerulina leaf blight Leptosphaerulina trifolii
North Western Alberta
Fairway Pythium blight Pythium sp.
Green Pink snow mold Microdochium nivale
Pythium blight Pythium spp.

20
Table 9. Summary of diseases diagnosed on vegetable crops submitted to Brooks Diagnostics Ltd.in 2000.
LOCATION/HOST DISEASE/SYMPTOMS CAUSAL AGENT
Southern Alberta
Corn Seedling blight Fusarium spp.
Potato Verticillium wilt Verticillium albo-atrumEarly blightAlternaria
Soft rot Erwinia carotovora subsp.carotovora
Dry rot Fusarium spp.
Leak Pythium ultimum
Vascular discoloration Frost injury
Stem end browning Physiological stress
Rot at vascular ring Fusarium solania
Powdery scab Spongospora subterranea
Table 10. Summary of diseases diagnosed on woody ornamental plants submitted to BrooksDiagnostics Ltd. in 2000.
LOCATION/HOST DISEASE/SYMPTOMS CAUSAL AGENT
Southern Alberta
Crabapple Dieback/chlorosis Heat stress
Mountain ash Anthracnose Colletotrichum spp.
Cytospora canker Cytospora spp.
Spruce Dieback/needle browning Environmental stress (poor drainage)Tip
Rhizosphaera needle bight Rhizosphaera kalkhoffii
Fusarium root rot Fusarium oxysporum
Yellowing and purpling /needle
desiccation Environmental stress
South Central Alberta
Pine Brown Spot Scirrhia acicola
Poplar Marssonina leaf spot Marssonina populi
Bacterial wet wood Bacteria

21
CROP: Commercial crops - Diagnostic Laboratory Report
LOCATION: Saskatchewan
NAME AND AGENCY:G. Holzgang1 and P. Pearse2
1 Crop Protection Laboratory, Saskatchewan Agriculture and Food, 346 McDonald St., Regina, Saskatchewan S4N 6P62Saskatchewan Agriculture and Food, Sustainable Production Branch, 3085 Albert St., Regina, Saskatchewan S4S 0B1
TITLE: DISEASES DIAGNOSED ON CROP SAMPLES SUBMITTED TO THE SASKATCHEWANAGRICULTURE AND FOOD CROP PROTECTION LABORATORY IN 2000.
METHODS: Saskatchewan Agriculture and Food's (SAF) Crop Protection Laboratory providesdiagnostic services and recommendations for crop health problems to the agricultural industry. Servicesinclude disease, insect and weed identification and testing of weeds for herbicide resistance. Samplesare submitted to the Crop Protection Laboratory by SAF Extension Agrologists, growers, agribusinessand home gardeners. Disease diagnosis is accomplished by microscopic examination, culturing onartificial media, ELISA testing and BIOLOGTM.
RESULTS: In 2000 the Crop Protection Laboratory received 1054 samples (April 1 - November 2, 2000)of which 75% were for disease diagnosis (39% of these were for Dutch elm disease). Other than Dutchelm disease, 34% cereals, 3% forages, 2% fruit, 10% oilseeds, 37% special crops, 2% vegetables and10% woody ornamentals, herbaceous ornamentals, turf and greenhouse comprised the remainder. Summaries of diseases/causal agents diagnosed on crop samples submitted to the Crop ProtectionLaboratory in 2000 are presented in Tables 1-8 by crop category.

22
Table 1. Summary of plant diseases diagnosed on cereal crops submitted to the SAF CropProtection Laboratory in 2000.
CROP DISEASE/CAUSAL AGENT NO. OF SAMPLES
Barley Net blotch/Pyrenophora teres 6Common root rot/Cochliobolus sativus, Fusarium spp. 3Fusarium head blight/Fusarium spp. 3Spot blotch/Cochliobolus sativus 3Seedling blight/Cochliobolus sativus, Fusarium sp. 1Chemical injury 15Environmental injury 6Nutrient deficiency 4Physiological/genetic disorder 1Mechanical injury 1
Oats Red top/Barley Yellow Dwarf Virus 2Leaf blotch/Pyrenophora avenae 2Leaf blotch/Septoria avenae 2Cephalosporium stripe/Cephalosporium gramineum 1Common root rot/Fusarium spp. 1False loose smut/Ustilago nigra 1Chemical injury 3Environmental stress 3
Rye Nutrient deficiency 1Wheat Common root rot/Cochliobolus sativus, Fusarium spp. 22
Septoria leaf blotch/Septoria tritici, S. nodorum 12Head blight/Fusarium spp. 10Prematurity blight/Cochliobolus sativus, Fusarium spp. 10Sooty molds/Alternaria spp., Cladosporium sp. 8Tan spot/Pyrenophora tritici-repentis 6Glume blotch/Septoria nodorum 5Leaf rust/Puccinia recondita 1Loose smut/Ustilago tritici 1Red smudge/Pyrenophora tritici- repentis 1Seedling blight/Pythium sp., Fusarium sp., Cochliobolus sp. 1Stem rust/Puccinia graminis 1Take all/Ophiobolus graminis 1Environmental injury 28Herbicide injury 20Nutrient deficiency 4
23
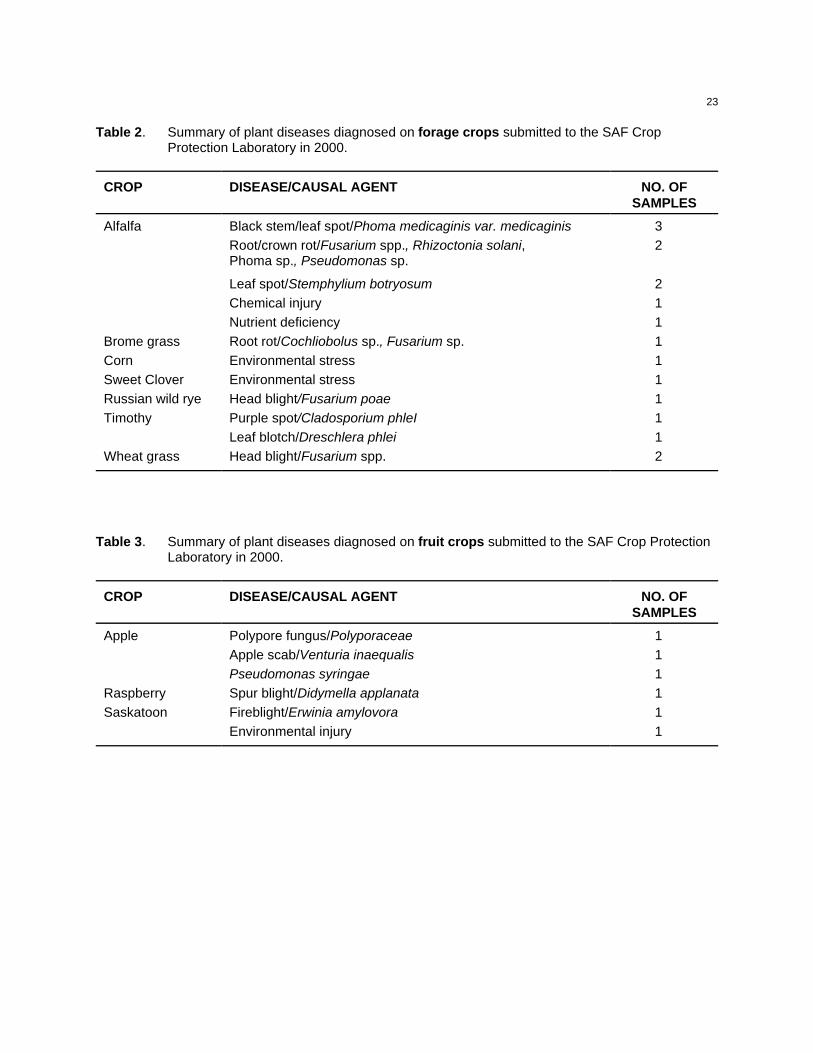
Table 2. Summary of plant diseases diagnosed on forage crops submitted to the SAF CropProtection Laboratory in 2000.
CROP DISEASE/CAUSAL AGENT NO. OFSAMPLES
Alfalfa Black stem/leaf spot/Phoma medicaginis var. medicaginis 3Root/crown rot/Fusarium spp., Rhizoctonia solani, Phoma sp., Pseudomonas sp.
2
Leaf spot/Stemphylium botryosum 2Chemical injury 1Nutrient deficiency 1
Brome grass Root rot/Cochliobolus sp., Fusarium sp. 1Corn Environmental stress 1Sweet Clover Environmental stress 1Russian wild rye Head blight/Fusarium poae 1Timothy Purple spot/Cladosporium phleI 1
Leaf blotch/Dreschlera phlei 1Wheat grass Head blight/Fusarium spp. 2
Table 3. Summary of plant diseases diagnosed on fruit crops submitted to the SAF Crop ProtectionLaboratory in 2000.
CROP DISEASE/CAUSAL AGENT NO. OFSAMPLES
Apple Polypore fungus/Polyporaceae 1Apple scab/Venturia inaequalis 1Pseudomonas syringae 1
Raspberry Spur blight/Didymella applanata 1Saskatoon Fireblight/Erwinia amylovora 1
Environmental injury 1

24
Table 4. Summary of plant diseases diagnosed on oilseed crops submitted to the SAF CropProtection Laboratory in 2000.
CROP DISEASE/CAUSAL AGENT NO. OF SAMPLES
Canola Root rot/Fusarium spp., Rhizoctonia solani 10Blackleg/Leptosphaeria maculans 4Alternaria blackspot/Alternaria spp. 4Damping off and seedling blight/Pythium sp., 3Sclerotinia stem rot/Sclerotinia sclerotiorum 2Aster yellows/Aster yellows phytoplasma 2Downy mildew/Peronospora parasitica 1Chemical injury 12Nutrient deficiency 6Environmental stress 4
Flax Chemical injury 4Sunflower Sclerotinia stem rot/Sclerotinia sclerotiorum 1
Chemical injury 1
Table 5. Summary of plant diseases diagnosed on special crops submitted to the SAF CropProtection Laboratory in 2000.
CROP DISEASE/CAUSAL AGENT NO. OFSAMPLES
Canary seed Leaf mottle/Septoria triseti 2Chemical injury 1Environmental stress 1
Caraway Root and crown rot/Fusarium spp., Rhizoctonia, 2Phytophthora sp. Alternaria blight/Alternaria sp. 1Fusarium blossom/seed blight/Fusarium sp. 1
Chickpea Ascochyta blight/Ascochyta rabiei 28Sclerotinia stem rot/Sclerotinia sclerotiorum 2Seedling blight/Fusarium sp., Rhizoctonia solani 2Root rot/Rhizoctonia solani 1Botrytis pod rot/Botrytis cinerea 1Chemical injury 5Environmental stress 5
Coriander Alternaria blight/Alternaria sp. 1Dill Phoma blight/Phoma anethi 1
Continued

25
Table 5.. special crops - cont’d
CROP DISEASE/CAUSAL AGENT NO. OF SAMPLES
Echinacea Root rot/Fusarium spp., Pythium sp., Rhizoctonia solani 1Aster yellows/Aster Yellows Phytoplasma 1
Faba bean Chocolate spot/Botrytis cinerea 1Hop Environmental stress 1Lentil Ascochyta blight/Ascochyta lentis 30
Anthracnose/Colletotrichum truncatum 10Botrytis stem and pod rot/Botrytis cinerea 9Root rot/Fusarium spp., Rhizoctonia solani 8Stemphylium leaf blight/Stemphylium botryosum 5Sclerotinia stem rot/Sclerotinia sclerotiorum 1Secondary stem rot/Fusarium sp. 1Botrytis seed rot/Botrytis cinerea 1Penicillium seed rot/Penicillium sp. 1Chemical injury 15Environmental injury 14Physiological stress 1
Mint Phoma root rot/Phoma sp. 2Fusarium root rot/Fusarium sp. 1Verticillium wilt/Verticillium albo-atrum 1
Mustard Staghead/Albugo candida 1Chemical injury 2
Pea Root rot/Fusarium spp., Rhizoctonia solani 8 Mycosphaerella blight/Mycosphaerella pinodes 6Seedling blight/Fusarium spp. 1Thielaviopsis root rot/Thielaviopsis basicola 1Powdery mildew/Erysiphe pisi 1Secondary bacteria/Pseudomonas viridiflava 1Chemical injury 6Nutrient deficiency 3Environmental injury 2
Soybean Chemical injury 1
26
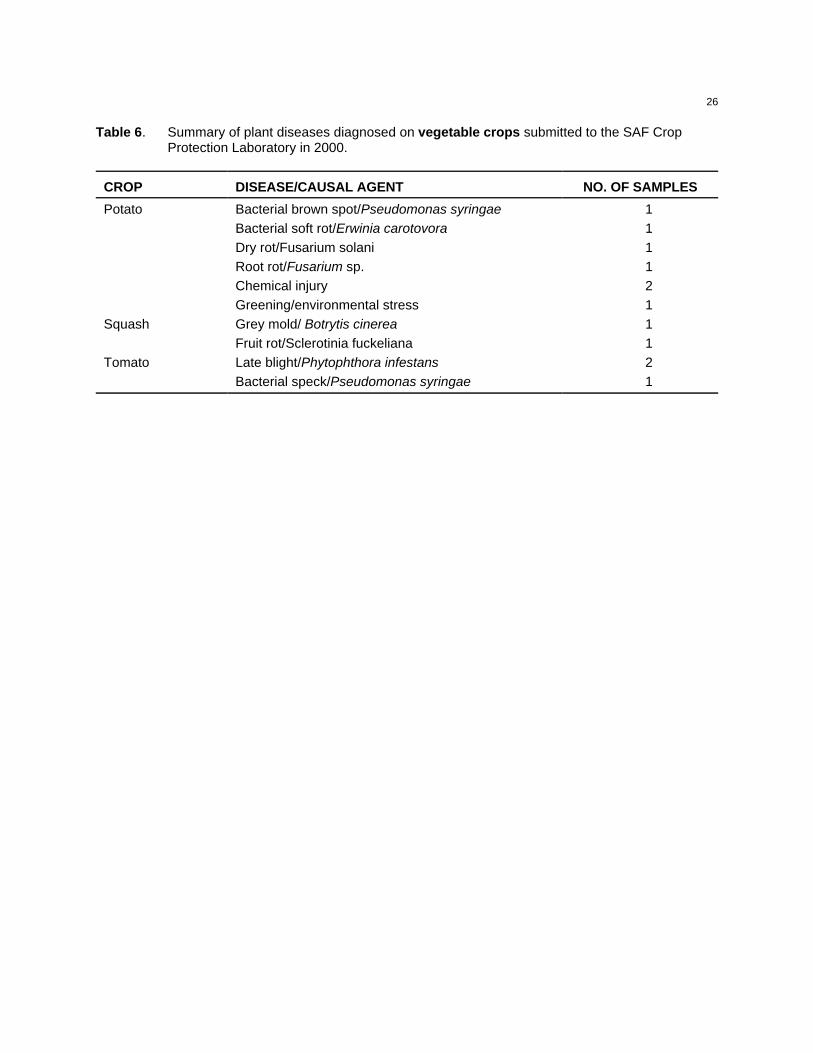
Table 6. Summary of plant diseases diagnosed on vegetable crops submitted to the SAF CropProtection Laboratory in 2000.
CROP DISEASE/CAUSAL AGENT NO. OF SAMPLES
Potato Bacterial brown spot/Pseudomonas syringae 1Bacterial soft rot/Erwinia carotovora 1Dry rot/Fusarium solani 1Root rot/Fusarium sp. 1Chemical injury 2Greening/environmental stress 1
Squash Grey mold/ Botrytis cinerea 1Fruit rot/Sclerotinia fuckeliana 1
Tomato Late blight/Phytophthora infestans 2Bacterial speck/Pseudomonas syringae 1
27
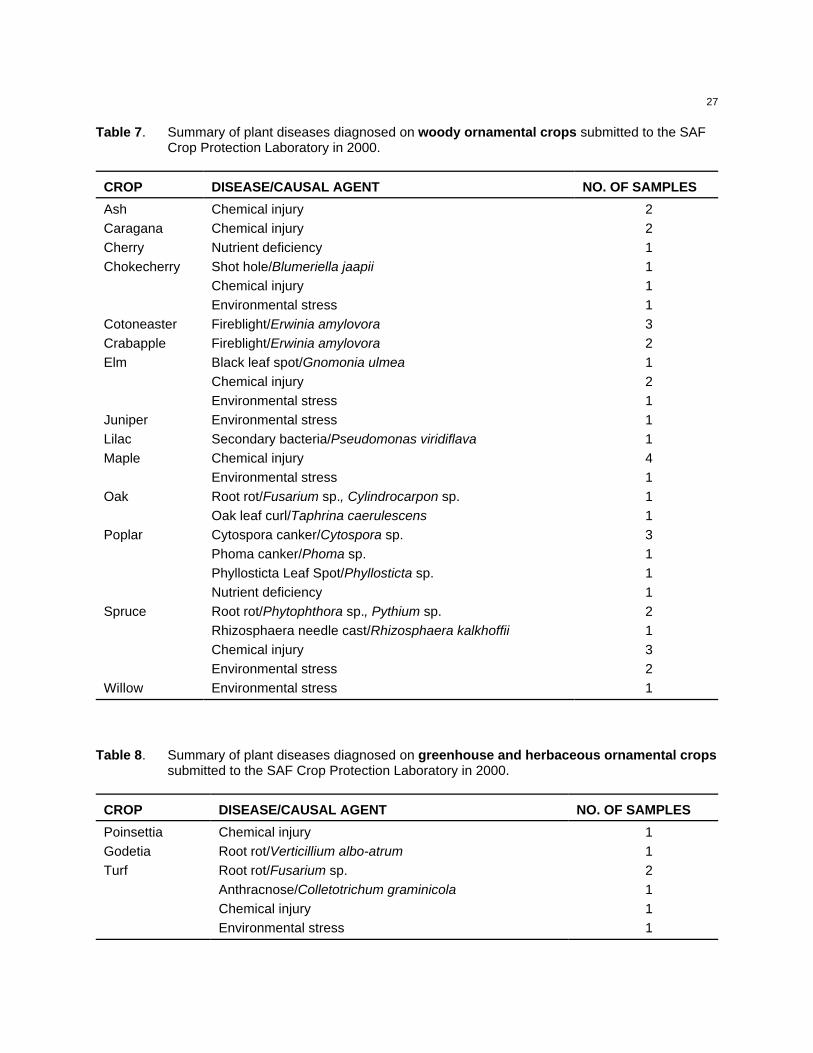
Table 7. Summary of plant diseases diagnosed on woody ornamental crops submitted to the SAFCrop Protection Laboratory in 2000.
CROP DISEASE/CAUSAL AGENT NO. OF SAMPLES
Ash Chemical injury 2Caragana Chemical injury 2Cherry Nutrient deficiency 1Chokecherry Shot hole/Blumeriella jaapii 1
Chemical injury 1Environmental stress 1
Cotoneaster Fireblight/Erwinia amylovora 3Crabapple Fireblight/Erwinia amylovora 2Elm Black leaf spot/Gnomonia ulmea 1
Chemical injury 2Environmental stress 1
Juniper Environmental stress 1Lilac Secondary bacteria/Pseudomonas viridiflava 1Maple Chemical injury 4
Environmental stress 1Oak Root rot/Fusarium sp., Cylindrocarpon sp. 1
Oak leaf curl/Taphrina caerulescens 1Poplar Cytospora canker/Cytospora sp. 3
Phoma canker/Phoma sp. 1Phyllosticta Leaf Spot/Phyllosticta sp. 1Nutrient deficiency 1
Spruce Root rot/Phytophthora sp., Pythium sp. 2Rhizosphaera needle cast/Rhizosphaera kalkhoffii 1Chemical injury 3Environmental stress 2
Willow Environmental stress 1
Table 8. Summary of plant diseases diagnosed on greenhouse and herbaceous ornamental cropssubmitted to the SAF Crop Protection Laboratory in 2000.
CROP DISEASE/CAUSAL AGENT NO. OF SAMPLES
Poinsettia Chemical injury 1Godetia Root rot/Verticillium albo-atrum 1Turf Root rot/Fusarium sp. 2
Anthracnose/Colletotrichum graminicola 1Chemical injury 1Environmental stress 1

28
CROP: Commercial crops - Diagnostic Laboratory Report
LOCATION: Manitoba
NAME AND AGENCY:M. Desjardins1, R.G. Platford2 and T.C. Shinners-Carnelley2
1 Crop Diagnostic Centre, Manitoba Agriculture and Food, 545 University Crescent, Winnipeg, Manitoba R3T 5S62 Manitoba Agriculture and Food, Soils and Crops Branch, Box 1149, Carman, Manitoba R0G 0J0
TITLE: 2000 MANITOBA CROP DIAGNOSTIC CENTRE LABORATORY SUBMISSIONS
METHODS: The Manitoba Agriculture and Food Crop Diagnostic Centre provides diagnoses andcontrol recommendations for disease problems of agricultural crops and ornamentals. Samples aresubmitted by Manitoba Agriculture and Food extension staff, farmers, agri-business, and the generalpublic. Diagnosis is based on visual examination for symptoms and culturing onto artificial media.
RESULTS: Summaries of diseases diagnosed on plants in different crop categories are presented inTables 1-10.
29
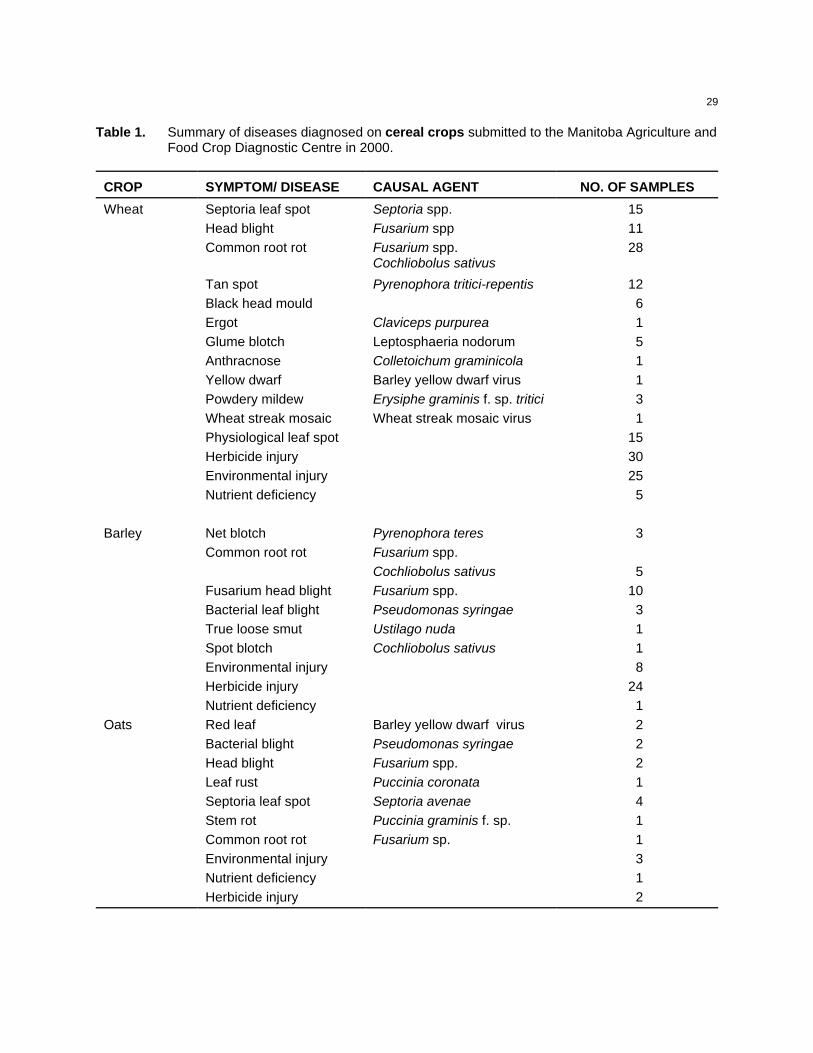
Table 1. Summary of diseases diagnosed on cereal crops submitted to the Manitoba Agriculture andFood Crop Diagnostic Centre in 2000.
CROP SYMPTOM/ DISEASE CAUSAL AGENT NO. OF SAMPLES
Wheat Septoria leaf spot Septoria spp. 15Head blight Fusarium spp 11Common root rot Fusarium spp.
Cochliobolus sativus28
Tan spot Pyrenophora tritici-repentis 12Black head mould 6Ergot Claviceps purpurea 1Glume blotch Leptosphaeria nodorum 5Anthracnose Colletoichum graminicola 1Yellow dwarf Barley yellow dwarf virus 1Powdery mildew Erysiphe graminis f. sp. tritici 3Wheat streak mosaic Wheat streak mosaic virus 1Physiological leaf spot 15Herbicide injury 30Environmental injury 25Nutrient deficiency 5
Barley Net blotch Pyrenophora teres 3Common root rot Fusarium spp.
Cochliobolus sativus 5Fusarium head blight Fusarium spp. 10Bacterial leaf blight Pseudomonas syringae 3True loose smut Ustilago nuda 1Spot blotch Cochliobolus sativus 1Environmental injury 8Herbicide injury 24Nutrient deficiency 1
Oats Red leaf Barley yellow dwarf virus 2Bacterial blight Pseudomonas syringae 2Head blight Fusarium spp. 2Leaf rust Puccinia coronata 1Septoria leaf spot Septoria avenae 4Stem rot Puccinia graminis f. sp. 1Common root rot Fusarium sp. 1Environmental injury 3Nutrient deficiency 1Herbicide injury 2

30
Table 2. Summary of diseases diagnosed on oilseed crops submitted to the Manitoba Agricultureand Food Crop Diagnostic Centre in 2000.
CROP SYMPTOM/ DISEASE CAUSAL AGENT NO. OF SAMPLES
Flax Fusarium root rot Fusarium spp. 3Pasmo Septoria linicola 1Seed and boll spot Alternaria spp. 2Seedling blight Rhizoctonia solani 1Environmental damage 7Herbicide injury 14
Sunflower Sclerotinia wilt Sclerotinia sclerotiorum 1Seedling blight Pythium sp. 2Aster yellows Aster yellows phytoplasma 1Stained kernels Alternaria zinniae 1Herbicide injury 17Environmental injury 1
Canola Blackleg Leptosphaeria maculans 1Downy mildew Peronospora parasitica 3Black spot Alternaria spp. 2Stem rot Sclerotinia sclerotiorum 4Root rot Pythium spp., 13
Rhizoctonia spp.Fusarium root rot Fusarium spp. 1Aster yellows Aster yellows phytoplasma 2Fusarium wilt Fusarium avenaceum 1Herbicide injury 88Environmental injury 7Nutrient deficiency 3

31
Table 3. Summary of diseases diagnosed on forage crops submitted to the Manitoba Agricultureand Food Crop Diagnostic Centre in 2000.
CROP SYMPTOM/ DISEASE CAUSAL AGENT NO. OF SAMPLES
Alfalfa Root rot Fusarium spp. 2Spring black stem and leaf spot Phoma medicaginis 9Botrytis blossom blight Botrytis cinerea 1Common leaf spot Pseudopeziza medicaginis 5Downy mildew Peronospora trifoliorum 2Stemphylium leaf spot Stemphylium botryosum 1Sclerotinia crown and stem rot Sclerotinia sclerotiorum 4Alfalfa mosaic Alfalfa mosaic virus 2Nutrient deficiency 1Environmental injury 2Herbicide injury 2
Trefoil Stemphylium leaf spot Stemphylium botryosum 1
Table 4. Summary of diseases diagnosed on grass crops submitted to the Manitoba Agriculture andFood Crop Diagnostic Centre in 2000.
CROP SYMPTOM/ DISEASE CAUSAL AGENT NO. OF SAMPLES
Lawn and Turf Melting out Drechslera spp 2Septoria leaf spot Septoria sp. 1Fusarium patch Microdochium nivale 4Leptosphaerulina leaf blight Leptosphaerulina sp. 2Necrotic ring spot Leptosphaeria korrae 1Powdery mildew Erysiphe graminis 1Red thread Laetisaria fuciformis 1Pythium blight Pythium spp. 2Anthracnose Colletotrichum graminicola 3Rust Puccinia spp. 1Slime mould Physarum spp. 1Environmental stress 2
Timothy Brown leaf stripe Cercosporidium graminis 4Fusarium root rot Fusarium spp. 3Purple eye spot Heterosporium phlei 3

32
Table 5. Summary of diseases diagnosed on vegetable crops submitted to the Manitoba Agricultureand Food Crop Diagnostic Centre in 2000.
CROP SYMPTOM/ DISEASE CAUSAL AGENT NO. OF SAMPLES
Cabbage Blackleg Phoma lingam 1
Carrot Pythium root dieback Pythium sp. 2Alternaria leaf blight Alternaria dauci 3
Cauliflower Blackleg Phoma lingam 1Downy mildew Peronospora sp. 1
Cucumber Angular leaf spot Pseudomonas syringae pv.lachrymans
1
Garlic Blue mould Penicillium sp. 2
Onion Purple blotch Alternaria porri 1Botrytis neck rot Botrytis sp. 1
Pea Ascochyta blight Ascochyta pisi 2Root rot Fusarium sp., Rhizoctonia sp. 1Sclerotinia stem rot Sclerotinia sclerotiorum 1Powdery mildew Erysiphe pisi 1Anthracnose Colletotrichum sp. 1Bacterial blight Pseudomonas syringae 1
Pepper Bacterial leaf spot Xanthomonas campestris pv.vesicatoria
1
Radish Bacterial soft rot Undetermined 1
Rutabaga Blackleg Phoma lingam 1Bacterial soft rot Undetermined 1Aster yellows Aster yellows phytoplasma 1
Tomato Septoria leaf spot Septoria lycopersici 3Late blight Phytophthora infestans 6Bacterial speck Pseudomonas syringae 1

33
Table 6. Summary of diseases diagnosed on fruit crops submitted to the Manitoba Agriculture andFood Crop Diagnostic Centre in 2000.
CROP SYMPTOM/ DISEASE CAUSAL AGENT NO. OF SAMPLES
Apple Frogeye leaf spot Botryosphaeria obtusa 1Canker Unidentified 2Iron chlorosis Nutrient deficiency 2
Crabapple Frogeye leaf spot Botryosphaeria obtusa 1
Raspberry Anthracnose Elsinoe veneta 2Fire blight Erwinia amylovora 1Spur blight Didymella applanata 1Downy mildew Peronospora sp. 1
Strawberry Root rot Fusarium spp., Pythium spp., Rhizoctonia sp.
2
Common leaf spot Mycosphaerella fragariae 1Fruit rot Botrytis cinerea 1Black root rot Pythium sp.,Fusarium sp.,
Rhizoctonia sp.3
Powdery mildew Sphaerotheca macularis 1Anthracnose Colletotrichum sp. 1
Saskatoon Brown rot Monilinia sp. 1Entomosporium leaf andberry spot
Entomosporium mespili 1
Canker Cytospora spp. 1Root rot Fusarium spp., Pythium spp.,
Cylindrocarpon spp.2
Black leaf Apiosporina collinsii 1
Chokecherry Shothole Blumeriella jaapii 1Black knot Apiosporina morbosa 1

34
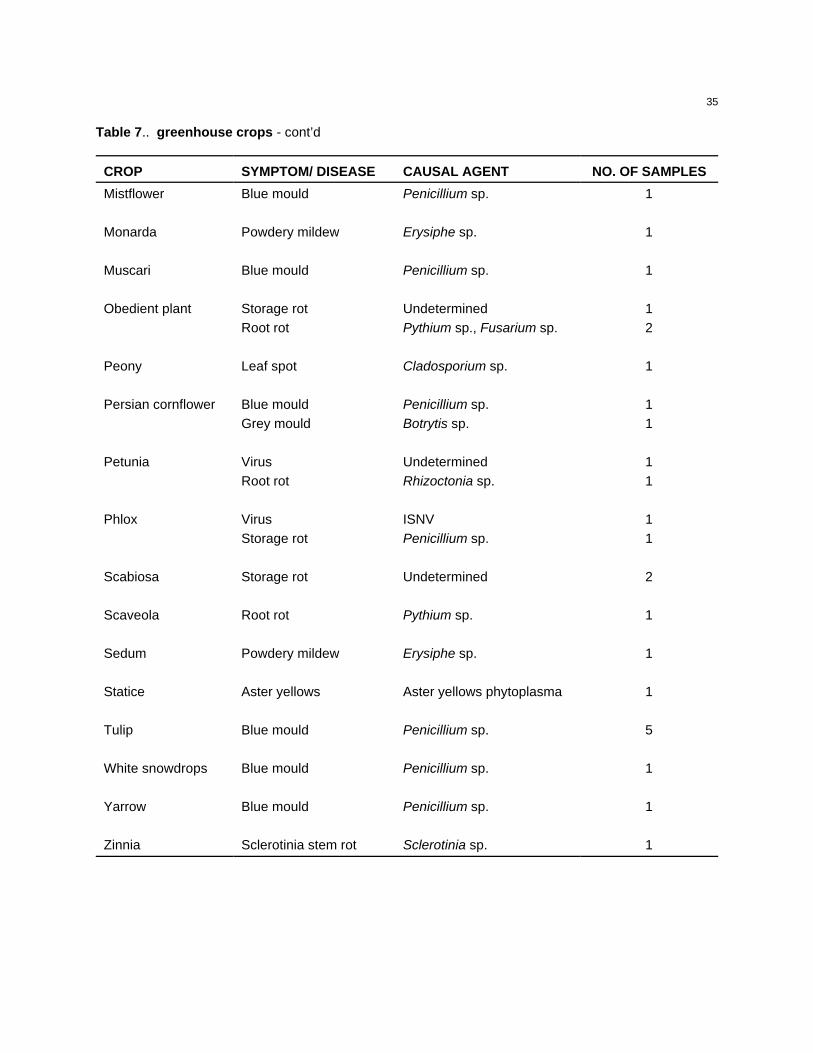
Table 7. Summary of diseases diagnosed on greenhouse crops submitted to the ManitobaAgriculture and Food Crop Diagnostic Centre in 2000.
CROP SYMPTOM/ DISEASE CAUSAL AGENT NO. OF SAMPLES
Aconites Blue mould Penicillium sp. 1Storage rot Aspergillus sp. 1
Begonia Virus Undetermined 1Grey mould Botrytis spp. 1Powdery mildew Erysiphe sp. 1
Columbine Root rot Fusarium sp. 1Grey mould Botrytis sp. 1
Cotoneaster Fire blight Erwinia amylovora 1
Elder Leaf spot Undetermined 1
Fuschia Root rot Pythium sp. 1
Geranium Bacterial leaf spot Undetermined 1Root rot Pythium sp. 1Verticillium wilt Verticillium sp. 1
Hemerocallis Bulb rot Fusarium sp. 1
Hyacinth Storage rot Aspergillus sp. 2Blue mould Penicillium sp. 2
Impatiens Virus TSWV 1Root rot Pythium sp. 1
Iris Grey mould Botrytis sp. 1
Juniper Canker Undetermined 1Juniper rust Gymnosporangium nelsonii 1Twig blight/canker Phomopsis sp. 2
Lilac Alternaria leaf spot Alternaria sp. 1Continued
35
Table 7.. greenhouse crops - cont’d
CROP SYMPTOM/ DISEASE CAUSAL AGENT NO. OF SAMPLES
Mistflower Blue mould Penicillium sp. 1
Monarda Powdery mildew Erysiphe sp. 1
Muscari Blue mould Penicillium sp. 1
Obedient plant Storage rot Undetermined 1Root rot Pythium sp., Fusarium sp. 2
Peony Leaf spot Cladosporium sp. 1
Persian cornflower Blue mould Penicillium sp. 1Grey mould Botrytis sp. 1
Petunia Virus Undetermined 1Root rot Rhizoctonia sp. 1
Phlox Virus ISNV 1Storage rot Penicillium sp. 1
Scabiosa Storage rot Undetermined 2
Scaveola Root rot Pythium sp. 1
Sedum Powdery mildew Erysiphe sp. 1
Statice Aster yellows Aster yellows phytoplasma 1
Tulip Blue mould Penicillium sp. 5
White snowdrops Blue mould Penicillium sp. 1
Yarrow Blue mould Penicillium sp. 1
Zinnia Sclerotinia stem rot Sclerotinia sp. 1
36
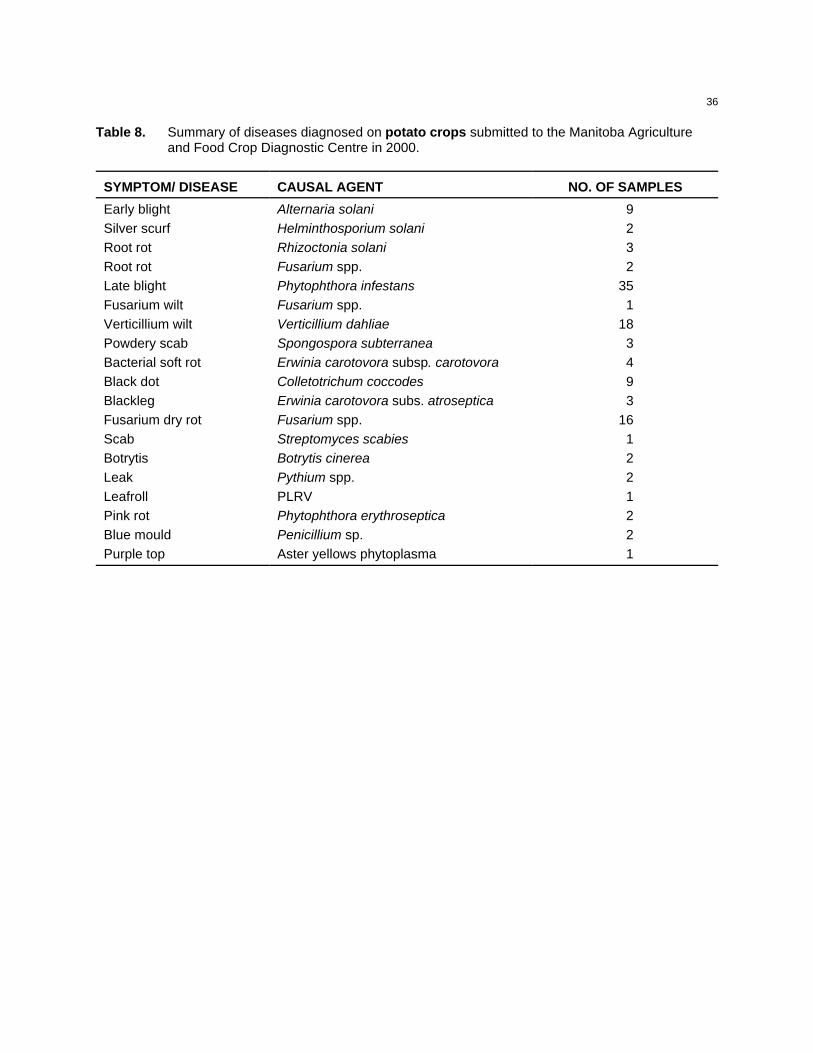
Table 8. Summary of diseases diagnosed on potato crops submitted to the Manitoba Agricultureand Food Crop Diagnostic Centre in 2000.
SYMPTOM/ DISEASE CAUSAL AGENT NO. OF SAMPLES
Early blight Alternaria solani 9Silver scurf Helminthosporium solani 2Root rot Rhizoctonia solani 3Root rot Fusarium spp. 2Late blight Phytophthora infestans 35Fusarium wilt Fusarium spp. 1Verticillium wilt Verticillium dahliae 18Powdery scab Spongospora subterranea 3Bacterial soft rot Erwinia carotovora subsp. carotovora 4Black dot Colletotrichum coccodes 9Blackleg Erwinia carotovora subs. atroseptica 3Fusarium dry rot Fusarium spp. 16Scab Streptomyces scabies 1Botrytis Botrytis cinerea 2Leak Pythium spp. 2Leafroll PLRV 1Pink rot Phytophthora erythroseptica 2Blue mould Penicillium sp. 2Purple top Aster yellows phytoplasma 1

37
Table 9. Summary of diseases diagnosed on shade and shelterbelt trees submitted to the ManitobaAgriculture and Food Crop Diagnostic Centre in 2000.
CROP SYMPTOMS/ DISEASE CAUSAL AGENT NO. OF SAMPLES
Ash Anthracnose Gloeosporium aridum 4Leaf rust Puccinia sparganioides 2
Aspen Neofabraea Neofabraea sp. 1
Elm Dutch elm disease Ophiostoma ulmi 14Canker Undetermined 4
Maple Vascular impairment Undetermined 1
Oak Anthracnose Apiognomonia quercina 1
Pine Canker Undetermined 2
Poplar Canker Cytospora sp.Root rot Undetermined 1Slime flux Erwinia nimipressuralis 1
Russian olive Canker Undetermined 1
Snowberry Leaf spot Undetermined 1
Spruce Root rot Pythium sp. 2Needle cast Rhizosphaera sp., Lirula sp. 18Cytospora canker Leucostoma kunzei 2Canker Undetermined 7Sooty mould Undetermined 1Rust Chrysomyxa sp. 1
Willow Canker Cytospora sp. 1Root rot Undetermined 1

38
Table 10. Summary of diseases diagnosed on special field crops submitted to the ManitobaAgriculture and Food Crop Diagnostic Centre in 2000.
CROP SYMPTOM/DISEASE
CAUSAL AGENT NO. OFSAMPLES
Buckwheat Blossom necrosis Fusarium sp., Alternaria sp. 5Charcoal rot Macrophomina phaseolina 1Root rot Fusarium sp. 1Botrytis flower blast Botrytis sp. 1
Chickpea Root rot Fusarium oxysporum 1
Coriander Stem and flower blight Alternaria sp., Fusarium sp. 1
Corn Northern corn leaf Setosphaeria turcica 1Root rot Undetermined 1
Cranberry Bacterial blight Pseudomonas syringae
Echinacea Aster yellows Aster yellows phytoplasma 1
Faba bean Root rot Undetermined 2Alternaria leaf spot Alternaria sp. 1Fusarium root rot Fusarium sp. 2Leaf spot Stemphylium sp. 1Chocolate spot Botrytis sp. 2
Field bean Root rot Fusarium sp. 7Root rot Rhizoctonia sp. 2Root rot Undetermined 3Leaf spot Septoria sp. 5Leaf spot Stemphylium sp. 1Common blight Xanthomonas campestris pv. phaseoli 18Halo blight Pseudomonas syringae pv. phaseolicola 8Rust Uromyces appendiculatus 1Anthracnose Colletotrichum lindemuthianum 12White mould Sclerotinia sp. 2Black pod spot Alternaria sp. 2Ascochyta blight Ascochyta sp. 1Alternaria leaf spot Alternaria sp. 2
Continued

39
Table 10.. Special field crops - cont’d
CROP SYMPTOM/DISEASE
CAUSAL AGENT NO. OFSAMPLES
Field pea Root rot Fusarium spp., Fusarium oxysporum,Fusarium avenaceum, Rhizoctonia sp.
3
Mycosphaerella blight Mycosphaerella pinodes 1White mould Sclerotinia sp. 1Anthracnose Colletotrichum sp. 1
Hemp Sclerotinia stem rot Sclerotinia sclerotiorum 2Root rot Fusarium sp. 1Stem rot Fusarium sp.Aster yellows Aster yellows phytoplasma 1
Lentil Root rot Fusarium sp. 1Fusarium blight Fusarium avenaceum 3Fusarium stem rot Fusarium sp. 2Sclerotinia stem rot Sclerotinia sp. 2Anthracnose Colletotrichum sp. 2
Soybean Bacterial blight Pseudomonas syringae pv. glycinea 2
Fusarium stem and root rot
Fusarium sp. 2
Slime mould Undetermined 1

40
CROP: Diagnostic Laboratory Report - Commercial Crops
LOCATION: Québec
NAME AND AGENCY:G. Gilbert, M. Lacroix and D. HamelMinistère de l'Agriculture, des Pêcheries et de l'Alimentation du Québec (MAPAQ),Complexe scientifique, 2700, rue Einstein - D.1.200h, Sainte-Foy, Québec G1P 3W8
TITLE: DISEASES DIAGNOSED ON COMMERCIAL CROPS SUBMITTED TO THE MAPAQDIAGNOSTIC LABORATORY IN 2000
METHODS: The objective of the MAPAQ diagnostic laboratory is to provide diagnosis and controlrecommendations for disease problems of commercial crops. The following data reflect diagnoses ofsamples submitted to the laboratory by extension staff of MAPAQ, the "Régie des assurances agricolesdu Québec", the "Institut québécois du développement de l'horticulture ornementale" and by theagricultural industry. Diagnosis is based on visual examination of symptoms and on the use of variouslaboratory tests to detect and to identify pathogens. The following tests are used in the laboratory; fornematodes, isolation with the Baermann funnel and microscope examination; for fungi, isolation onartificial media, microscope examination and pathogenicity testing; for bacteria, isolation on artificialmedia, classical biochemical tests including API-20E and Biolog®, ELISA and PCR tests; forphytoplasmas, PCR tests and for viruses, ELISA tests.
RESULTS AND COMMENTS: The distribution of crop samples was: vegetable crops 25.9%,greenhouse vegetables 11.6%, storage vegetables 3.8%, small fruit 26.5%, apple trees 2.5%, perennialsand woody ornamentals 7.0%, greenhouse ornamentals 13.3%, cereal crops 3.5%, herbs 1.3% andother crops 4.3%. Problems not listed include insect related injury, pathogen detection in substrates andasymptomatic plants, damage where no conclusive disease-causing organism was identified and seedproblems.
ACKNOWLEDGEMENT: The authors gratefully thank Carolle Fortin, Chantal Malenfant, Mario Tésolinand Lise Vézina for technical assistance.

41
Table 1. Summary of vegetable field crop diseases diagnosed by the MAPAQ diagnostic laboratory in2000.
CROP CAUSAL AGENT/DISEASE NO. OF SAMPLESAsparagus Fusarium wilt and root rot 1
Stemphylium blight 1
Bean Fusarium oxysporum 1Fusarium solani 1Potyvirus 2Pythium root rot 1Sclerotinia rot 2Oedema 1Wind injury 1
Broccoli Peronospora parasitica 1Pythium sp. 1Erwinia carotovora subsp. carotovora 1Pseudomonas syringae 1Xanthomonas campestris pv. armoraciae 3Xanthomonas campestris pv. campestris 1Brown bud 3Nicosulfuron injury 1
Cabbage Alternaria brassicicola 3Pythium crown rot 3Rhizoctonia solani 2Sclerotinia sclerotiorum 2Erwinia carotovora subsp.carotovora 2Pseudomonas cichorii 2Xanthomonas campestris pv. armoraciae 2Xanthomonas campestris pv. campestris 2Mineral deficiencies (Ca, Mg) 2Water deficit 1
Cantaloup Fusarium equiseti 1Fusarium solani 1Sclerotinia sclerotiorum 1Pseudomonas syringae 2
Carrot Cercospora carotae 1Cylindrocarpon sp. 1Fusarium solaniPythium sp. (cavity spot) 1Rhizoctonia solani 1Xanthomonas campestris pv. carotae 1Meloidogyne sp. 2Linuron injury 1
Continued

42
Table 1.. vegetable field crop - cont’d
CROP CAUSAL AGENT/DISEASE NO. OF SAMPLESCauliflower Alternaria brassicicola 1
Peronospora parasitica 1Rhizoctonia solani 1Xanthomonas campestris pv. armoraciae 1
Celery Pythium root rot 3Pseudomonas fluorescens 1Pseudomonas syringae 1
Chinese cabbage Rhizoctonia solani 1
Corn Bipolaris sp. 1Fusarium spp. 3Fusarium graminearum 5Puccinia sorghi 5Pythium root rot 1Pseudomonas syringae 1Acid soil 1Aluminum toxicity 1Excessive water 1Glyphosate injury 1Late frost 1Imazethapyr injury 1
Cucumber Alternaria leaf spot 2Phytophthora capsici 1Pythium crown rot 2Rhizoctonia fruit rot 1Sclerotinia sclerotiorum 1Verticillium sp. 1Pseudomonas syringae 4Cold injury 1
Garlic Fusarium bulb rot 1Pythium sp. 1Sclerotium cepivorum 1Potyvirus 2Sun burn 1
Leek Fusarium oxysporum 1Pseudomonas marginalis 1Pseudomonas syringae 3
Lettuce Botrytis cinerea 1Bremia lactucae 3Rhizoctonia basal rot 1Pythium root rot 2
Continued

43
Table 1.. vegetable field crop - cont’d
CROP CAUSAL AGENT/DISEASE NO. OF SAMPLESLettuce Pseudomonas marginalis 1
Pseudomonas syringae 1Xanthomonas campestris pv. vitians 4Ammonia toxicity 2Boron toxicity 2Water stress 2
Onion Botrytis neck rot 3Fusarium basal rot 6Peronospora destructor 3Phytophthora cinnamomi 1Sclerotinia sclerotiorum 1Stemphylium botryosum 5Pseudomonas syringae 1Pseudomonas viridiflava 1Harvest injury 1Lightning injury 1Phenoxy injury 1Wind injury 1
Pea Erysiphe sp. 2Fusarium oxysporum 1Pythium root rot 1Glyphosate injury 1
Pepper Botrytis cinerea 1Phytophthora capsici 1Pythium root rot 1Sclerotinia sclerotiorum 2Clavibacter michiganensis subsp.michiganensis 1Pseudomonas syringae 10Magnesium deficiency 1Phenoxy injury 2Sun burn 1
Potato Alternaria solani 3Botrytis cinerea 1Colletotrichum coccodes 2Fusarium tuber rot 2Helminthosporium solani 1Phytophthora infestans 2Pythium tuber rot 3Rhizoctonia solani 7Spongospora subterranea 1Clavibacter michiganensis subsp. sepedonicus 4Erwinia carotovora subsp. carotovora 7
Continued

44
Table 1.. vegetable field crop - cont’d
CROP CAUSAL AGENT/DISEASE NO. OF SAMPLESPotato Streptomyces spp. 2
Verticillium sp. 7Pratylenchus 1PLRV 1TSWV 1Black heart 1Calcium deficiency 1Glufosinate injury 1Heat necrosis 1Late frost damage 1Manganese toxicity 1
Pumpkin Cladosporium cucumerinum 5Fusarium fruit spot 4Oïdium sp. 1Phoma cucurbitacearum 1Septoria cucurbitacearum 2Erwinia carotovora subsp. carotovora 1Pseudomonas syringae 6CMV 2TSWV 1Heat stress 1Light Stress 2Oedema 1Wind injury 1
Radish Peronospora parasitica 1Pythium root rot 1Rhizoctonia solani 2
Rutabaga Cylindrocarpon root rot 1
Squash Fusarium oxysporum (wilt) 2Sclerotinia sclerotiorum 1Septoria cucurbitacearum 1Pseudomonas syringae 2
Tomato Alternaria solani 1Botrytis cinerea 1Fusarium crown rot 1Phytophthora infestans 9Sclerotinia sclerotiorum 1Thielaviopsis sp. 1Clavibacter michiganensis subsp. michiganensis 6Pseudomonas syringae pv. tomato 2Cold injury 1Glyphosate injury 2Phenoxy injury 1
Continued

45
Table 1.. vegetable field crop - cont’d
CROP CAUSAL AGENT/DISEASE NO. OF SAMPLESWatermelon Fusarium oxysporum (wilt) 1
Phoma cucurbitacearum 1Verticillium sp. 1Cold injury 1Wind injury 1
TOTAL SUBMISSIONS 301
Table 2. Summary of greenhouse vegetable diseases diagnosed by the MAPAQ diagnosticlaboratory in 2000.
CROP CAUSAL AGENT/DISEASE NO. OF SAMPLESCucumber Didymella brioniae 1
Penicillium canker 1Phoma cucurbitacearum 3Phomopsis cucurbitae 1Pyrenochaeta sp. 1Pythium root rot 3Rhizoctonia solani 1Sclerotinia sclerotiorum 2Verticillium sp. 1Erwinia tracheiphila 1CMV 6TSWV 5Salt damage 1Sun burn 1
Lettuce Botrytis cinerea 1Bremia lactucae 1Oïdium sp. 1Pythium root rot 8Pseudomonas cichorii 1Pseudomonas marginalis 1Fertilizer burn 1Salt damage 1Iron deficiency 1
Pepper Botrytis stem rot 1Pythium root rot 1Clavibacter michiganensis subsp. michiganensis 1Pseudomonas syringae 1
Continued
46
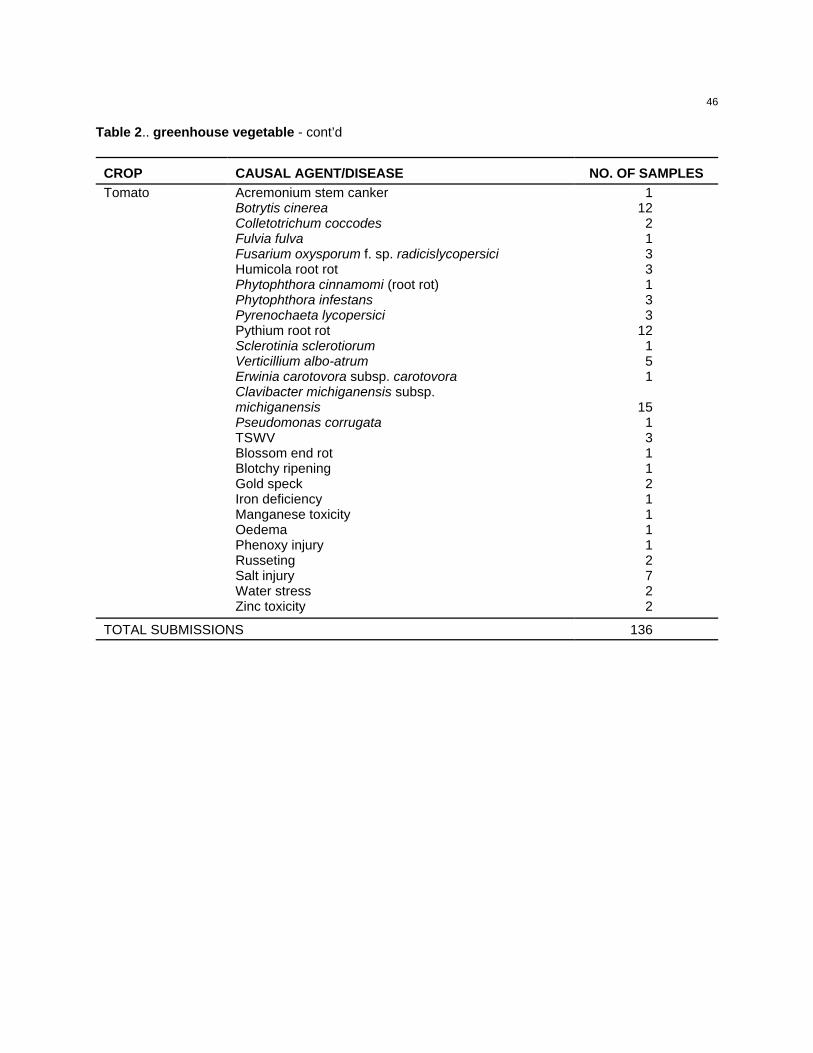
Table 2.. greenhouse vegetable - cont’d
CROP CAUSAL AGENT/DISEASE NO. OF SAMPLESTomato Acremonium stem canker 1
Botrytis cinerea 12Colletotrichum coccodes 2Fulvia fulva 1Fusarium oxysporum f. sp. radicislycopersici 3Humicola root rot 3Phytophthora cinnamomi (root rot) 1Phytophthora infestans 3Pyrenochaeta lycopersici 3Pythium root rot 12Sclerotinia sclerotiorum 1Verticillium albo-atrum 5Erwinia carotovora subsp. carotovora 1Clavibacter michiganensis subsp.michiganensis 15Pseudomonas corrugata 1TSWV 3Blossom end rot 1Blotchy ripening 1Gold speck 2Iron deficiency 1Manganese toxicity 1Oedema 1Phenoxy injury 1Russeting 2Salt injury 7Water stress 2Zinc toxicity 2
TOTAL SUBMISSIONS 136

47
Table 3. Summary of storage vegetable diseases diagnosed by the MAPAQ diagnostic laboratory in2000.
CROP CAUSAL AGENT/DISEASE NO. OF SAMPLESCarrot Alternaria radicina 2
Botrytis cinerea 2Cylindrocarpon sp. 2Fusarium solani 1Phytophthora sp. 1Pythium sp. 4Rhizoctonia carotae 3Pseudomonas marginalis 1
Cole crops Alternaria brassicicola 3Fusarium rot 1Pseudomonas marginalis 1Black midrib 2Black speck 2Necrotic spot 1Oedema 1
Potato Colletotrichum coccodes 1Fusarium dry rot 4Helminthosporium solani 1Phoma sp. 1Rhizoctonia solani 3Clavibacter michiganensis subsp. sepedonicus 1Erwinia carotovora subsp. carotovora 2After cooking browning 1Heat necrosis 1Hollow heart 2Jelly end rot 1
TOTAL SUBMISSIONS 45
48
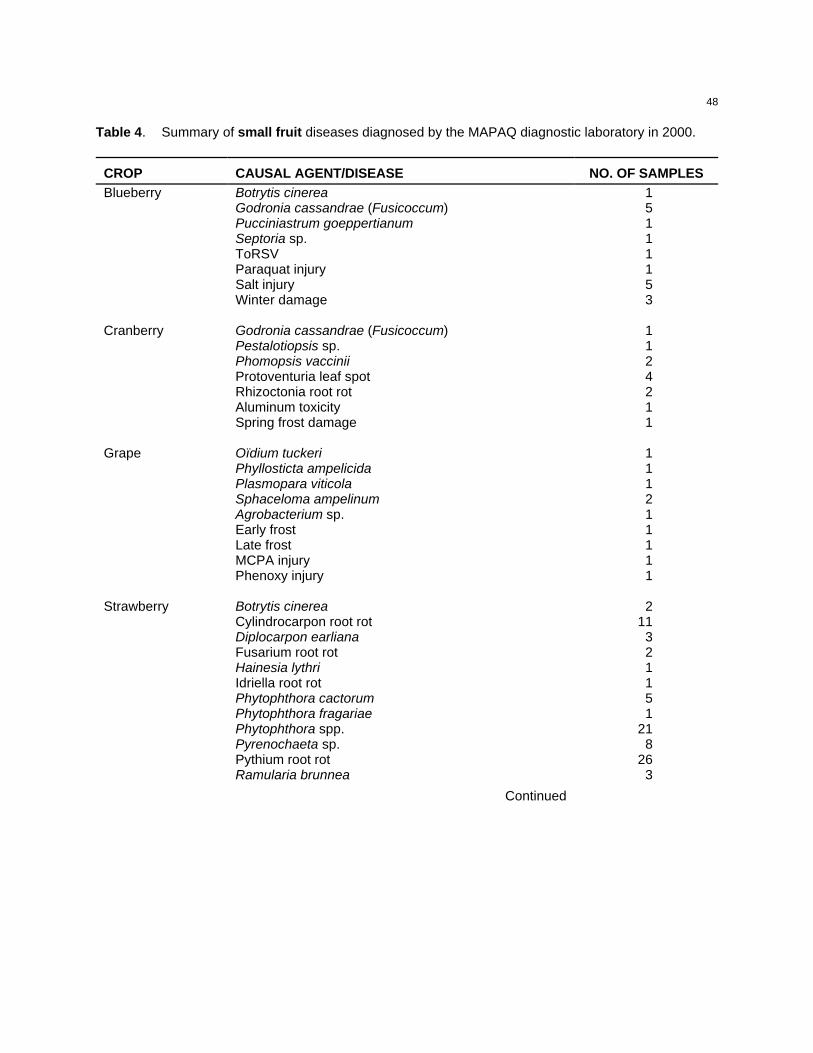
Table 4. Summary of small fruit diseases diagnosed by the MAPAQ diagnostic laboratory in 2000.
CROP CAUSAL AGENT/DISEASE NO. OF SAMPLESBlueberry Botrytis cinerea 1
Godronia cassandrae (Fusicoccum) 5Pucciniastrum goeppertianum 1Septoria sp. 1ToRSV 1Paraquat injury 1Salt injury 5Winter damage 3
Cranberry Godronia cassandrae (Fusicoccum) 1Pestalotiopsis sp. 1Phomopsis vaccinii 2Protoventuria leaf spot 4Rhizoctonia root rot 2Aluminum toxicity 1Spring frost damage 1
Grape Oïdium tuckeri 1Phyllosticta ampelicida 1Plasmopara viticola 1Sphaceloma ampelinum 2Agrobacterium sp. 1Early frost 1Late frost 1MCPA injury 1Phenoxy injury 1
Strawberry Botrytis cinerea 2Cylindrocarpon root rot 11Diplocarpon earliana 3Fusarium root rot 2Hainesia lythri 1Idriella root rot 1Phytophthora cactorum 5Phytophthora fragariae 1Phytophthora spp. 21Pyrenochaeta sp. 8Pythium root rot 26Ramularia brunnea 3
Continued

49
Table 4. . small fruit - cont’d
CROP CAUSAL AGENT/DISEASE NO. OF SAMPLESRaspberry Armillaria mellea 1
Botrytis cinerea 2Coniothyrium fuckelii 2Didymella applanata 2Cylindrocarpon root rot 13Fusarium wilt 3Phragmidium rubi-idaei 1Phytophthora root 33Pucciniastrum americanum 1Pyrenochaeta root rot 5Pythium root rot 8Rhizoctonia root rot 5Sphaceloma necator (Elsinoe veneta) 10Septoria rubi 1Verticillium spp. 2Yeast fruit rot 1Agrobacterium rubi 1Agrobacterium tumefaciens 3Pseudomonas syringae 1Pratylenchus sp. 8Dichlobenil injury 1Glyphosate injury 1Hail damage 1pH imbalance 3Sun burn 2Winter damage 23
Total submissions 310
Table 5. Summary of herbaceous (annuals and perennials) and woody ornamental diseasesdiagnosed by the MAPAQ diagnostic laboratory in 2000.
CROP CAUSAL AGENT/DISEASE NO. OF SAMPLESAcer spp. Discula sp. 1
Taphrina dearnessii 2Water stress 2
Amaranthus sp. Pythium root rot 1Pseudomonas syringae 1
Aster sp. Basidiophora entospora 1
Begonia sp. Botrytis cinerea 1Oïdium 1
Continued

50
Table 5. . herbaceous (annuals and perennials) and woody ornamental - cont’d
CROP CAUSAL AGENT/DISEASE NO. OF SAMPLESBrowallia sp. Pythium root rot 2Campanula sp. Phoma sp. 1
Pythium root rot 1Salt damage 1
Canna sp. Potyvirus 1
Catalpa sp. Phomopsis sp. 1
Chrysanthemum sp. Phoma sp. 1Pythium root rot 1
Cornus sp. Septoria sp. 1
Daphne sp. Botrytis cinerea 1
Delphinium sp. Pythium root rot 1Rhizoctonia root rot 2
Dicentra sp. Pythium root rot 1
Echinacea sp. Pythium root rot 1
Eryngium sp. Sclerotinia sclerotiorum 1
Fraxinus pennsylvanica Phyllactinia guttata 1
Hemerocallis sp. Phytophthora sp. 2
Juniperus sp. Phomopsis juniperovora 1Rhizoctonia root rot 1Sphaeropsis sp. 1
Lilium sp. Botrytis leaf spot 1
Livistona sp. Cold injury 1
Paeonia sp. Botrytis leaf spot 1Cylindrocarpon root rot 1Rhizoctonia root rot 1
Petunia sp. Sclerotinia sclerotiorum 1
Physocarpus sp. Sphaerotheca sp. 1
Picea sp. Melampsorella caryophyllacearum 1
Continued

51
Table 5. . herbaceous (annuals and perennials) and woody ornamental - cont’d
CROP CAUSAL AGENT/DISEASE NO. OF SAMPLESPinus spp. Sphaeropsis sapinea 1
Winter injury 1
Platanus occidentalis Discula sp. 1
Rosa spp. ApMV 1PNRSV 1Manganese deficiency 1
Rhododendron sp. Pucciniastrum vaccinii 1
Salix sp. Cytospora sp. 1
Salvia sp. Sclerotinia sclerotiorum 1
Sedum sp. Rhizoctonia root rot 1
Syringa vulgaris Phytophthora sp. 1Verticillium sp. 3Pseudomonas syringae 1Mineral toxicities (Cu, Mn, Zn) 3
Thuja occidentalis Cylindrocarpon root rot 4Fusarium root rot 4Pestalotiopsis funerea 3Pyrenochaeta root rot 1Pythium root rot 3Mechanical injury 2pH imbalance 1Water excess 1
Tilia cordata Cercospora microsora 1Water stress 2
Ulmus americana Ophiostoma ulmi 1
TOTAL SUBMISSIONS 78
52
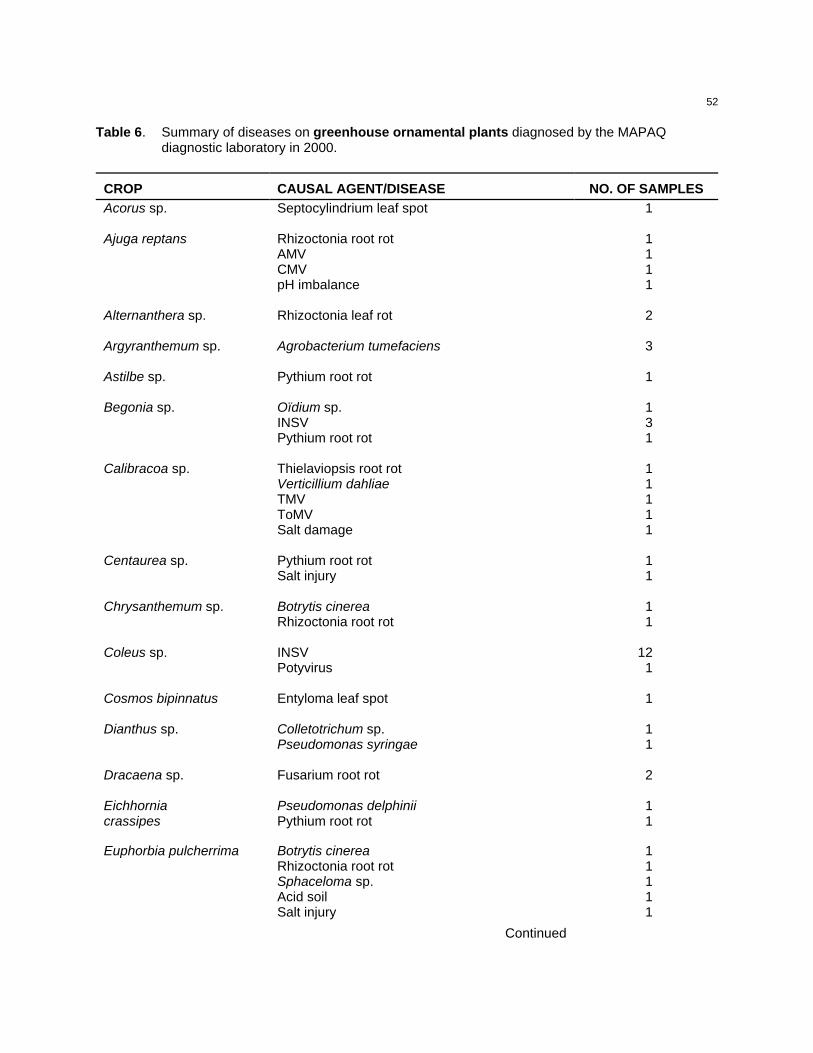
Table 6. Summary of diseases on greenhouse ornamental plants diagnosed by the MAPAQdiagnostic laboratory in 2000.
CROP CAUSAL AGENT/DISEASE NO. OF SAMPLESAcorus sp. Septocylindrium leaf spot 1
Ajuga reptans Rhizoctonia root rot 1AMV 1CMV 1pH imbalance 1
Alternanthera sp. Rhizoctonia leaf rot 2
Argyranthemum sp. Agrobacterium tumefaciens 3
Astilbe sp. Pythium root rot 1
Begonia sp. Oïdium sp. 1INSV 3Pythium root rot 1
Calibracoa sp. Thielaviopsis root rot 1Verticillium dahliae 1TMV 1ToMV 1Salt damage 1
Centaurea sp. Pythium root rot 1Salt injury 1
Chrysanthemum sp. Botrytis cinerea 1Rhizoctonia root rot 1
Coleus sp. INSV 12Potyvirus 1
Cosmos bipinnatus Entyloma leaf spot 1
Dianthus sp. Colletotrichum sp. 1Pseudomonas syringae 1
Dracaena sp. Fusarium root rot 2
Eichhornia Pseudomonas delphinii 1crassipes Pythium root rot 1
Euphorbia pulcherrima Botrytis cinerea 1Rhizoctonia root rot 1Sphaceloma sp. 1Acid soil 1Salt injury 1
Continued

53
Table 6.. greenhouse ornamental plants - cont’d
CROP CAUSAL AGENT/DISEASE NO. OF SAMPLESGardenia sp. Cylindrocarpon root rot 1
Gerbera jamesonii Fusarium root rot 2Verticillium sp. 1
Hibiscus syriacus Cladosporium leaf spot 1Pythium root rot 1Thielaviopsis root rot 1pH imbalance 1
Hosta sp. Botrytis cinerea 1
Hydrangea sp. Salt injury 1pH imbalance 1
Impatiens sp. Rhizoctonia root rot 1INSV 12pH imbalance 1Water excess 1
Kalanchoe sp. Botrytis cinerea 1INSV 1
Lobelia sp. pH imbalance 1
Lisianthus sp. Pythium root rot 1
Lychnis chalcedonica INSV 1
Monarda fistulosa INSV 1Salt injury 1
Nemesia sp. INSV 1
Pelargonium sp. Botrytis cinerea 1Pythium black leg 6Agrobacterium tumefaciens 1Erwinia carotovora subsp. carotovora 1PFBV 12Acid soil 1Iron toxicity 1Manganese toxicity 1Oedema 3Salt injury 2Water excess 2
Continued

54
Table 6.. greenhouse ornamental plants - cont’d
CROP CAUSAL AGENT/DISEASE NO. OF SAMPLESPericallis sp. INSV 1
Petunia sp. TMV 1ToMV 1
Philodendron sp. INSV 1
Physalis alkekengi Entyloma sp. 2
Phlox sp. Septoria sp. 1CMV 1INSV 1Potyvirus 1
Piper hispidium Water stress 1
Polemonium sp. CMV 1INSV 1
Portulaca sp. Pythium root rot 1Salt damage 1
Pothos sp. INSV 1
Rosa sp. Coniothyrium canker 1
Rhododendron sp. Cylindrocladium root rot 1(azalea) Water stress 1
Solanum sp. CMV 1Acid soil 1
Surfinia sp. CMV 1ToMV 2Potyvirus 1Verticillium dahliae 1
Tradescantia sp. Potyvirus 1
Tulbaghia sp. INSV 1
Verbena sp. Pythium root rot 1INSV 2
Veronica sp. INSV 1
Vinca sp. Rhizoctonia 1
Continued
55
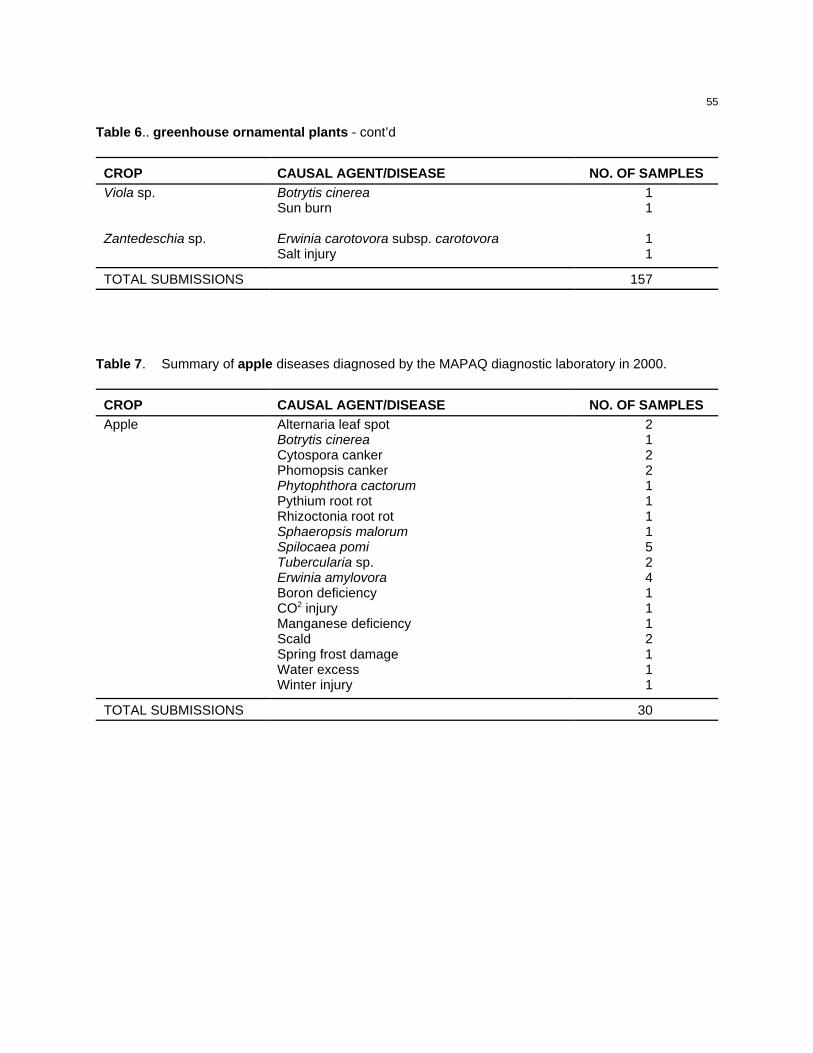
Table 6.. greenhouse ornamental plants - cont’d
CROP CAUSAL AGENT/DISEASE NO. OF SAMPLESViola sp. Botrytis cinerea 1
Sun burn 1
Zantedeschia sp. Erwinia carotovora subsp. carotovora 1Salt injury 1
TOTAL SUBMISSIONS 157
Table 7. Summary of apple diseases diagnosed by the MAPAQ diagnostic laboratory in 2000.
CROP CAUSAL AGENT/DISEASE NO. OF SAMPLESApple Alternaria leaf spot 2
Botrytis cinerea 1Cytospora canker 2Phomopsis canker 2Phytophthora cactorum 1Pythium root rot 1Rhizoctonia root rot 1Sphaeropsis malorum 1Spilocaea pomi 5Tubercularia sp. 2Erwinia amylovora 4Boron deficiency 1CO2 injury 1Manganese deficiency 1Scald 2Spring frost damage 1Water excess 1Winter injury 1
TOTAL SUBMISSIONS 30

56
Table 8. Summary of cereal crop diseases diagnosed by the MAPAQ diagnostic laboratory in 2000.
CROP CAUSAL AGENT/DISEASE NO. OF SAMPLESBarley Bipolaris sorokiniana 2
Dreschlera teres 2Erysiphe graminis 1Fusarium head blight 2Puccinia sp. 1Septoria sp. 1Ustilago sp. 1
Oats Bipolaris sorokiniana 1Puccinia coronata 3Septoria avenae 2BYDV 7Manganese deficiency 1
Wheat Bipolaris sorokiniana 1Cladosporium seed spot 1Fusarium head blight 5Gaeumannomyces graminis 3Puccinia graminis 3Septoria tritici 2
Corn Cladosporium seed spot 1Fusarium stem rot 1Pythium root rot 1Acid soil 1Glyphosate injury 1Magnesium deficiency 1Manganese deficiency 1Nicosulfuron injury 1
TOTAL SUBMISSIONS 41
57
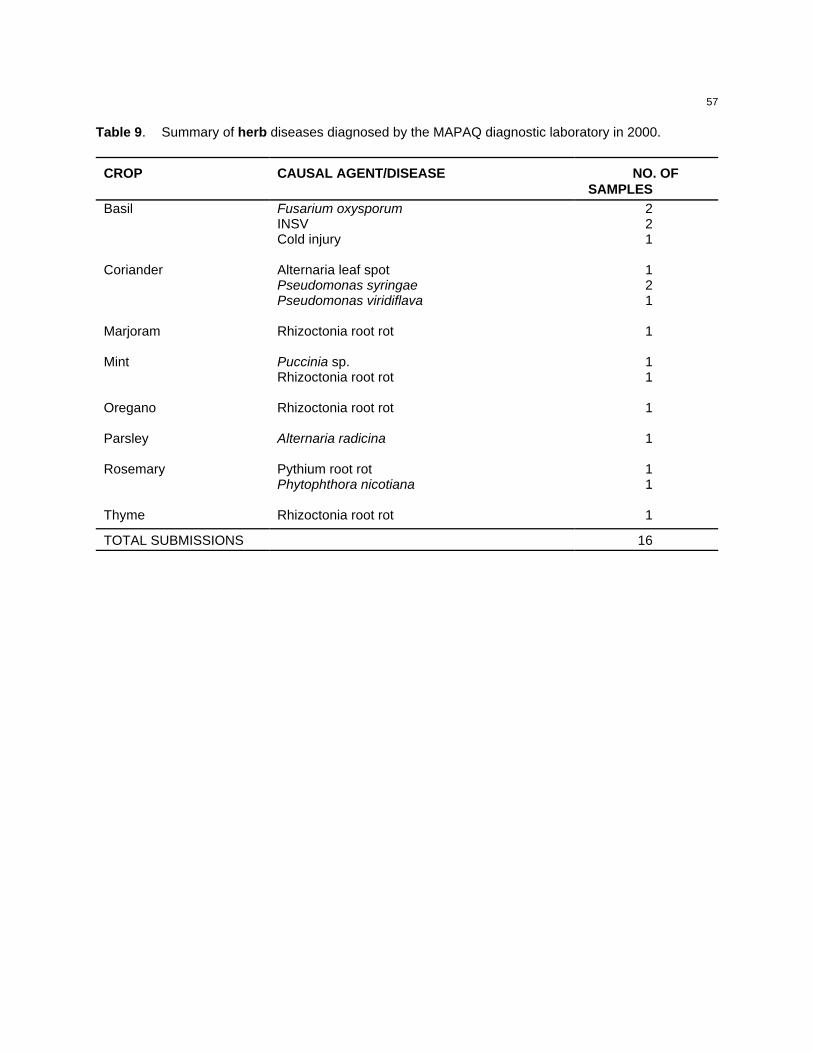
Table 9. Summary of herb diseases diagnosed by the MAPAQ diagnostic laboratory in 2000.
CROP CAUSAL AGENT/DISEASE NO. OFSAMPLES
Basil Fusarium oxysporum 2INSV 2Cold injury 1
Coriander Alternaria leaf spot 1Pseudomonas syringae 2Pseudomonas viridiflava 1
Marjoram Rhizoctonia root rot 1
Mint Puccinia sp. 1Rhizoctonia root rot 1
Oregano Rhizoctonia root rot 1
Parsley Alternaria radicina 1
Rosemary Pythium root rot 1Phytophthora nicotiana 1
Thyme Rhizoctonia root rot 1
TOTAL SUBMISSIONS 16
58
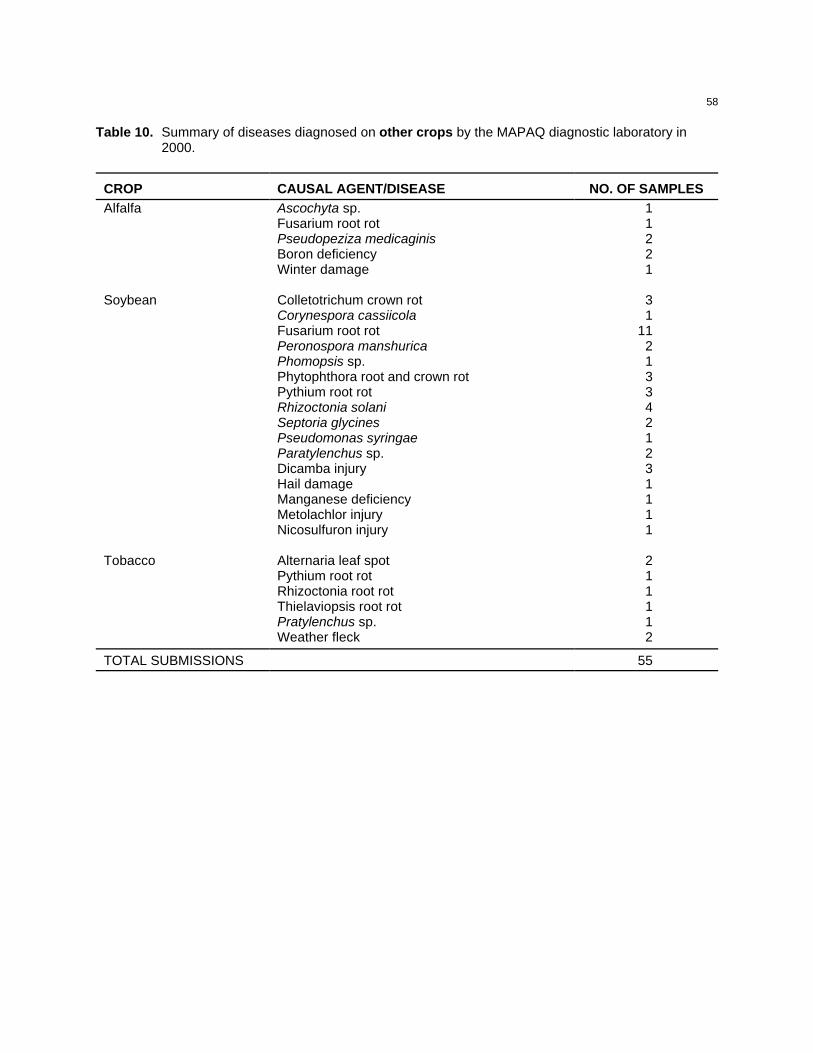
Table 10. Summary of diseases diagnosed on other crops by the MAPAQ diagnostic laboratory in2000.
CROP CAUSAL AGENT/DISEASE NO. OF SAMPLESAlfalfa Ascochyta sp. 1
Fusarium root rot 1Pseudopeziza medicaginis 2Boron deficiency 2Winter damage 1
Soybean Colletotrichum crown rot 3Corynespora cassiicola 1Fusarium root rot 11Peronospora manshurica 2Phomopsis sp. 1Phytophthora root and crown rot 3Pythium root rot 3Rhizoctonia solani 4Septoria glycines 2Pseudomonas syringae 1Paratylenchus sp. 2Dicamba injury 3Hail damage 1Manganese deficiency 1Metolachlor injury 1Nicosulfuron injury 1
Tobacco Alternaria leaf spot 2Pythium root rot 1Rhizoctonia root rot 1Thielaviopsis root rot 1Pratylenchus sp. 1Weather fleck 2
TOTAL SUBMISSIONS 55

59
Cereals / Céréales
CULTURES / CROPS : Avoine Avena sativa, Orge Hordeum vulgare, Blé Triticum aestivum
RÉGION / LOCATION : Québec
NOM ET ORGANISME / NAME AND ORGANIZATION:S. Rioux1 and A. Comeau2
1Centre de recherche sur les grains inc. (CÉROM), 2700, rue Einstein, Sainte-Foy (Québec) G1P 3W8 Téléphone: (418) 528-7896; Télécopieur: (418) 644-6855; Courriel : [email protected] et Agroalimentaire Canada, Centre de recherche et de développement sur les sols et les grandes cultures, 2560, boul. Hochelaga, Sainte-Foy (Québec) G1V 2J3
TITRE / TITLE : SURVOL DES MALADIES DES CÉRÉALES PRÉSENTES AU QUÉBEC EN 2000
INTRODUCTION ET MÉTHODES : La majorité des essais de céréales de printemps du réseaud’enregistrement et recommandation du Québec ont été visitée une fois entre la mi-juillet et la mi-aoûtdans le but de noter l’incidence des maladies des parties aériennes. On a aussi prélevé des racines etdes épis dans des champs d’orge et de blé à divers endroits au Québec afin d’étudier les pourrituresracinaires et d’évaluer le taux d’infection des épis causée par les Fusarium spp. En général, les plantesexaminées lors des visites des essais étaient au stade de développement laiteux moyen et celles dontles épis ont été prélevés, étaient au stade pâteux moyen. Pour les pourritures racinaires, lesprélèvements ont été fait entre 2 et 6 semaines après le semis et on a isolé les agents pathogènes àl’aide de milieux sélectifs.
RÉSULTATS et COMMENTAIRES : L’année 2000 se caractérise par un printemps difficile(température et précipitations) ce qui a occasionné un retard dans les semis dans la plupart des régions.La saison a également été plus fraîche et pluvieuse dans le centre et dans sud-ouest du Québec, alorsqu’à l’est de La Pocatière les premières pluies après le semis ont été suivies d’une longue sécheresse.
Bien que la saison 2000 ait été beaucoup plus pluvieuse que la normale dans les régions visitées, lafusariose de l’épi (Fusarium graminearum principalement) a eu une incidence relativement faible : lepourcentage d’épillets fusariés était de 3,6 % chez le blé (région de Montréal : 4,0%; région Centre-Québec : 2,1%) et de 5,5 % chez l’orge (région de Montréal : 6,1%; région Centre-Québec 5,5%). Onpeut peut-être expliquer ce résultat par les températures fraîches de la saison qui ont dû favoriser ledéveloppement d’espèces fongiques mieux adaptés au climat frais que le F. graminearum.
Chez l’avoine, la tache ovoïde (Stagonospora avenae) était la maladie foliaire la plus répandue. Sonincidence a été plus marquée à Normandin que dans les autres stations où l’intensité des symptômesétait plutôt moyenne. La rouille couronnée (Puccinica coronata) était assez intense à Sainte-Anne-de-Bellevue dans le sud-ouest de la province, comme c’est souvent le cas. Elle était présente aussi à LaPocatière, mais à un degré moindre. Le virus de la jaunisse nanisante de l’orge (VJNO) a touché toutesles régions du Québec, bien que faiblement dans la plupart des cas.
Chez le blé, la tache auréolée (Drechslera tritici-repentis) et la tache causée par Phaeospheria nodorum,appelée communément septoriose, ont été encore cette année les maladies foliaires les plus répanduesavec un niveau d’infection modéré. La rouille des feuilles (Puccinia recondita) a été observée danspresque toutes les régions du Québec et son incidence a été estimée à moyenne; ce qui est plus élevéequ’à l’habitude. Un autre fait marquant, le VJNO s’est manifesté dans toutes les régions. Les symptômesont même pu être notés à l’Acadie, Princeville et Hébertville. On estime des dommages dans certains
60
champs allant de 5 à 10 %. Quant à l’oïdium, causé par Erysiphe graminis, il est apparu de façonsporadique à l’état de trace, mais à Princeville l’intensité des symptômes était plus élevée. Le piétin brun(Pythium spp.) a été la maladie racinaire dominante de la saison. On a aussi observé du piétinéchaudage (Gaeumannomyces graminis) à la station de Pintendre.
Chez l’orge, la rayure réticulée (Drechslera teres) était prédominante partout au Québec. La rouille desfeuilles (Puccinia hordei), quant à elle, a eu une incidence faible à moyenne là où elle a été observée,soit aux stations situées dans la vallée du Saint-Laurent. L’oïdium qui est une maladie peu courante auQuébec, n’a en effet été observée qu’à La Pocatière, la station visitée la plus à l’est. Pour certainscultivars, l’infection a même atteint la feuille étendard. Le VJNO, tout comme chez le blé, a été trèsprésent cette année. Il a même été observé en Gaspésie, dans la vallée de la Matapédia. Larhynchosporiose (Rhynchosporium secalis) que l’on retrouve certaines années était quasi absente en2000. Quant aux maladies racinaires, le piétin brun était dominant tout comme chez le blé, mais a causédes pertes plus graves. On pense que dans certains champs, des pertes excédant 50 % étaient dues engrande partie aux Pythium.

61
CROP / CULTURE: Barley
LOCATION / RÉGION: Saskatchewan
NAME AND AGENCY / NOM ET ORGANISME:M.R. Fernandez1, P.G. Pearse2, G. Holzgang2 and G.R. Hughes3
1Agriculture and Agri-Food Canada, Semiarid Prairie Agricultural Research Centre, P.O. Box1030, Swift Current SK, S9H 3X2; Telephone: (306) 778-7255; Facsimile: (306)773-9123;e-mail: [email protected] Agriculture and Food, 3085 Albert St., Regina SK, S4S 0B13Department of Plant Sciences, University of Saskatchewan, Saskatoon SK, S7N 5A8
TITLE / TITRE: FUSARIUM HEAD BLIGHT OF BARLEY IN SASKATCHEWAN IN 2000
INTRODUCTION AND METHODS: The incidence and severity of fusarium head blight (FHB) wereassessed in 42 2-row and 21 6-row barley fields from 18 crop districts (CD) in Saskatchewan. Headsfrom 50 plants, at milk to dough stages, were collected randomly from each field and sent to the CropProtection Laboratory in Regina for disease assessment, and pathogen isolation and identification. AnFHB index (percent number of heads affected x mean severity of infection/100) was determined for eachfield. An average FHB index for infected fields in each CD, and for CDs grouped by soil zone (ZoneI=Brown, Zone II=Dark Brown and Zone III=Black/Grey soils) was calculated. Kernels from heads withsymptoms were surface sterilized in 10% Javex solution for 1 minute and plated on potato dextrose agarfor identification of Fusarium spp.
RESULTS AND COMMENTS: Overall, 75% of barley fields surveyed were affected by FHB, a higherpercentage than in 1999 (65%) or 1998 (59%) (Table 1; Fernandez et al. 1999; 2000). However, themean FHB index was lower in 2000 (0.6%) than in 1999 (1.0%) or 1998 (1.4%). In 2000, the incidenceof FHB was lower for 2-row (67%) than 6-row (90%) barley (Table 1). Conversely, the average FHBindex was higher for 2-row (0.9%) than 6-row (0.2%) barley. This is similar to results from the 1999survey. The mean FHB index was highest in crop districts 1B, 2B (south-east) and 5A (east-central). Individual fields with the highest FHB index (1.4% to 7.8%) were found in CDs 1B, 2B, 5A and 9B (north-west). The proportion of affected fields and their average FHB index was lowest in Zone I (south-west).
Fusarium sporotrichioides was isolated from the greatest number of fields, followed by F. poae and F.avenaceum (Table 1). Fusarium culmorum and F. graminearum were present in few fields. F.sporotrichioides was more prevalent in 2000 (77% of fields) than in 1999 (40%) or 1998 (22%).
We gratefully acknowledge the participation of Saskatchewan Agriculture and Food extensionagrologists in this survey, and financial support by the Agriculture Development Fund.
REFERENCES:Fernandez, M.R, P. Pearse, G. Holzgang, and G. Hughes, 2000. Fusarium head blight in barley inSaskatchewan in 1999. Can. Plant Dis. Surv. 80: 32-33. (http://res2.agr.ca/london/pmrc/pmrchome.html)
Fernandez, M.R, G. Holzgang, M.J. Celetti, and G. Hughes, 1999. The incidence of fusarium head blightin barley, common wheat and durum wheat grown in Saskatchewan during 1998. Can. Plant Dis. Surv.79: 79-82. (http://res2.agr.ca/london/pmrc/report/disease99.html)

62
Table 1. Incidence and severity (FHB index) of fusarium head blight in 2-row and 6-row barley, andfrequency of isolation of Fusarium spp. in Saskatchewan in 2000.
Soilzone/Cropdistrict
No. affectedfields/total
fields
FHB index1 Fusarium spp.
2-row
6-row 2-row 6-row avenaceum
culmorum
equiseti graminearum
poae sporotrichioides
Zone I3 BN 1 /2 - 0.8 - 1 - 1 - - -3 BS 0 /1 - - - - - - - - -4 A 0 /1 - - - - - - - - -4 B 0 /1 - - - - - - - - -7 A 1 /3 - 0.1 - 1 - - - - -Total ormean: 2 /8 - 0.5 - 2 0 1 0 0 0
Zone II1 A - 1 /1 - 0.1 - 1 - 1 - 12 A - 1 /1 - 0.4 - - - - 1 12 B 3 /3 1 /1 1.2 0.7 2 1 - 1 4 36 A 3 /3 0.5 - - - - - 2 26 B 3 /3 1 /1 0.4 0.1 1 - - - 2 37 B 2 /4 - 0.3 - - 0 1 - 1 -Total ormean: 11 /13 4 /4 0.6 0.3 3 2 1 2 10 10
Zone III1 B 1 /1 - 1 /4 - - - - 1 1 15 A 2 /2 3 /3 5.8 0.2 3 1 - 2 5 45 B 4 /5 3 /4 0.3 0.2 1 - 2 - 3 78 A 0 /2 3 /4 - 0.2 1 - - - 3 38 B 1 /3 1 /1 0.4 0.3 1 - 1 - - 19 A 1 /2 5 /5 0.1 0.2 1 - 3 - 2 59B 6 /6 - 0.6 - 6 - 1 - 1 6Total ormean: 15 /21 15 /17 1.2 0.2 11 1 7 3 15 25Overalltotal or mean: 28 /42 19 /21 0.9 0.2 16 3 9 5 25 36
Overall% fields: 34% 6% 19% 11% 53% 77%
1 FHB index calculated as (percent number of heads affected x mean severity of infection)/100.

63
CROP / CULTURE: Barley
LOCATION / RÉGION: Manitoba
NAME AND AGENCY / NOM ET ORGANISME:A. Tekauz, J. Gilbert, J. Gold, E. Mueller, M. Idris, M. Stulzer, M. Beyene and R. Kaethler Cereal Research Centre, Agriculture and Agri-Food Canada, 195 Dafoe Road, Winnipeg MB,R3T 2M9 Telephone: (204) 983-0944; Facsimile: (204) 983-4604; e-mail: [email protected]
TITLE / TITRE: SURVEY FOR LEAF SPOT DISEASES OF BARLEY IN MANITOBA IN 2000
INTRODUCTION AND METHODS: Foliar diseases of barley in Manitoba were assessed by surveying78 farm fields (21 two-row, 57 six-row) from July 24 to August 3 when most crops were at the milky tosoft dough stage of growth (ZGS 72-89). Fields were sampled at regular intervals along survey routes,depending on availability. Disease severity was recorded by sampling approximately 10 plants along adiamond-shaped transect of about 50 m per side, beginning near the field edge. Severity ratings weretaken on both the upper (flag and penultimate leaves) and lower leaf canopies, using a six-categoryscale: 0 or nil (no visible symptoms); trace (<1% leaf area affected); very slight (1-5%); slight (6-15%);moderate (16-40%); and severe (41-100%). Infected leaves with typical symptoms were collected ateach site, dried and stored in paper envelopes. Surface-sterilized pieces of infected leaf tissue wereplaced in moist chambers for 3-5 days to identify the causal agent(s) and determine the disease(s)present.
RESULTS AND COMMENTS: Conditions in Manitoba in 2000 were relatively dry and cool early in thegrowing season (to early June) but then became warmer and considerably wetter to mid September, bywhich time most barley had been harvested. Leaf spot development was therefore somewhat delayedand in most cases did not become overly damaging, particularly as many crops were seeded early. Asnoted in former reports, the field history, i.e., presence or absence of barley stubble from the previousyear, appeared to have the most influence on the level of leaf spotting observed.
Leaf spots were observed in the upper and/or lower leaf canopies of all barley fields surveyed. Diseaseseverities in the upper canopy were nil, trace or very slight in 31% of fields, slight in 51%, moderate in13%, and severe or leaves senescent in 5%. Respective severity categories in the lower canopy weretabulated as 4%, 41%, 23%, and 32%. These results are almost identical to those found in 1999. Onthis basis, foliar diseases in barley caused relatively little damage in 2000; on average, grain yield losseswere likely in the range of 2-3%.
Pyrenophora teres and Cochliobolus sativus, causal agents of net blotch and spot blotch, respectively,were most frequently isolated from infected leaf tissue, and were responsible for most of the leaf spottingrecorded (Table 1). Septoria passerinii (speckled leaf blotch) was recovered from about 1/4 of the fields,but caused relatively little of the damage observed. Rhynchosporium secalis (scald) was detected in twofields, and Stagonospora nodorum was found in 6 fields, causing less than 2% of the damage. Thepredominance of P. teres and C. sativus as leaf spot pathogens of barley in Manitoba in 2000 wastypical of most years.
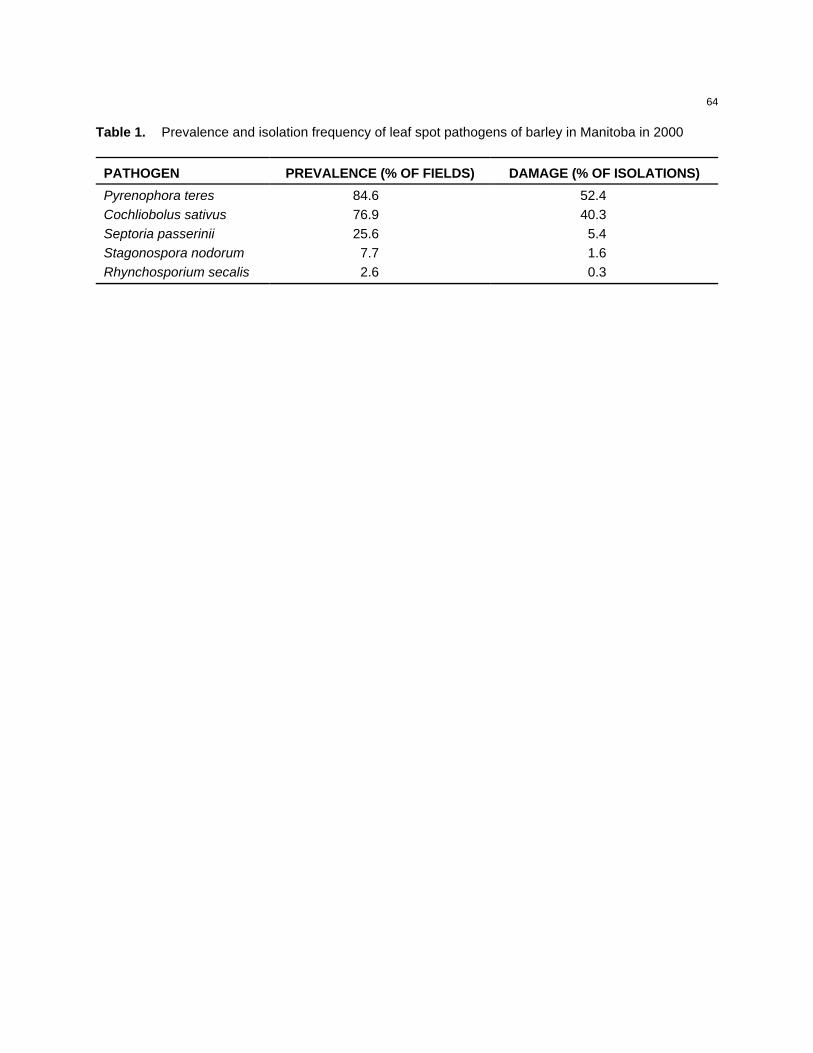
64
Table 1. Prevalence and isolation frequency of leaf spot pathogens of barley in Manitoba in 2000
PATHOGEN PREVALENCE (% OF FIELDS) DAMAGE (% OF ISOLATIONS)
Pyrenophora teres 84.6 52.4Cochliobolus sativus 76.9 40.3Septoria passerinii 25.6 5.4Stagonospora nodorum 7.7 1.6Rhynchosporium secalis 2.6 0.3

65
CROP / CULTURE: Barley
LOCATION / RÉGION: Manitoba and south-eastern Saskatchewan
NAME AND AGENCY / NOM ET ORGANISME:A. Tekauz, J. Gilbert, J. Gold, E. Mueller, M. Idris, M. Stulzer, M. Beyene and E. NedohinCereal Research Centre, Agriculture and Agri-Food Canada, 195 Dafoe Road, Winnipeg MB,R3T 2M9 Telephone: (204) 983-0944; Facsimile: (204) 983-4604; email: [email protected]
TITLE / TITRE: FUSARIUM HEAD BLIGHT OF BARLEY IN MANITOBA AND SOUTH-EASTERNSASKATCHEWAN IN 2000
INTRODUCTION AND METHODS: A total of 78 barley fields (21 two-row, 57 six-row) in southernManitoba and south-eastern Saskatchewan were surveyed for the presence of fusarium head blight(FHB) between July 24 and August 3, 2000. Fields were selected randomly along the survey routes. FHB incidence (the percentage of heads with typical symptoms) in each field was assessed by sampling80-100 spikes at 3 locations for disease. FHB severity (the average affected proportion of symptomaticheads) was estimated visually in the field. Thirty heads with FHB symptoms were collected at each fieldsite, placed in plastic bags, and subsequently frozen. A total of 50 kernels, discoloured (putativelyinfected) whenever possible, and/or normal in appearance to make up the remainder, were removedfrom five heads per location. The kernels were surface sterilized in 0.3% NaOCl and plated onto potatodextrose agar to quantify and identify Fusarium spp. on the seed.
RESULTS AND COMMENTS: Conditions initially were unfavourable (cool and little precipitation) fordevelopment of FHB in Manitoba in 2000, but frequent rains beginning in mid-June, subsequently led towidespread and sometimes severe development of the disease. Fusarium head blight was found in 77of 78 fields surveyed. Average incidence of FHB in two-row crops was 20% (range 6 - 83%) andseverity also averaged 20% (range 1 - 66%); in six-row crops incidence was 33% (range 0 - 72%) andseverity 16% (range 0 - 38%). The 2-row data are skewed somewhat as a result of very high incidenceand severity values in one two-row field that was badly lodged. The resulting average FHB Index(incidence X severity / 100) was 3.9% (range 0.3 - 55%) for two-row and 5.4% (range 0 - 38%) in six-rowbarley. Based on these levels of incidence and severity, FHB was estimated to have caused yieldlosses averaging about 2% in barley in 2000, in the region surveyed. A comparison of FHB levels in the8 south-eastern Saskatchewan barley fields surveyed with those from Manitoba, indicated considerablylower values for average incidence, severity and FHB Index (FHBI) in Saskatchewan (SK - incidence12%, severity 6%, FHBI 0.7%; MB - incidence 32%, severity 17%, FHBI 5.5%). The Fusarium speciesisolated from kernels are shown in Table 1. As in the past several years, F. graminearum was thepredominant pathogenic species. Levels of F. graminearum were lower, and those of F. poae and F.avenaceum higher, in south-eastern Saskatchewan compared to Manitoba.
Table 1. Fusarium spp. isolated from barley kernels in Manitoba and S.E. Saskatchewan in 2000.Fusarium spp. PERCENT OF FIELDS PERCENT OF KERNELS
MB MB MB SKF. graminearum 92.1 75 93 59.9F. poae 34.4 87.5 3.8 28.9F. avenaceum 19.7 62.5 1.7 5.3F. sporotrichioides 21.1 12.5 0.9 1.3F. equiseti 10.5 12.5 0.5 1.3F. culmorum 2.6 12.5 0.1 3.3

66
CROP/CULTURE: Barley
LOCATION / RÉGION: Eastern Canada
NAME AND AGENCY / NOM ET ORGANISME:T. M. Choo1, A. Comeau2, M. Lacroix3 and K.M. Ho1
1Eastern Cereal and Oilseed Research Centre, Agriculture and Agri-Food Canada, Ottawa ON,K1A 0C6 2Soils and Crops Research & Development Centre, Agriculture and Agri-Food Canada,Ste-Foy QC, G1V 2J33Laboratoire de diagnostic en phytoprotection, 2700 rue Einstein, D. I. 200. h., Ste-Foy QC,G1P 3W8
TITLE / TITRE: BARLEY YELLOW DWARF OF BARLEY IN EASTERN CANADA IN 2000
INTRODUCTION AND METHODS: In Quebec, barley yellow dwarf (BYD) was moderately abundant inthe Lac St-Jean area and more damaging in the Matapedia valley. On the Central Experimental Farm(Ottawa ON), BYDV infection was considered to be the most severe in ten years. This article reportscultivar responses in barley to the BYD epidemic at the Central Experimental Farm.
Forty-nine barley cultivars or advanced breeding lines from Eastern Canada were seeded on May 31,2000 at the Central Experimental Farm in a randomized complete block design with four replications forscreening for reactions to fusarium head blight. The seeding rate was 22 seeds m-2. Eachexperimental plot consisted of two 1.5-m rows with a row spacing of 15 cm. When leaves of someseedlings turned yellow between the veins, BYDV infection was suspected. On July 19 all of theexperimental plots were rated on a scale of 0 to 9 with 0 being no leaf chlorosis and 9 being severe leafchlorosis. To confirm the presence of BYDV, leaf samples of three cultivars ( ACCA, AC Legend, andAC Maple) were collected on August 1 for an ELISA test for the PAV strain of barley yellow dwarf virus.
RESULTS AND COMMENTS: The ELISA test showed that the optical densities of ACCA leaf samples(0.040 and 0.084) were lower than those of AC Maple (0.087 and 0.266) and AC Legend (0.161 and0.188) leaf samples. The leaf samples were collected from 2-month-old plants, thus considerable forcemight be required to extract the virus from these old and lignified tissues. We could have obtainedmore virus from these samples if they had been ground several times. The results suggest the presenceof a significant amount of BYDV in AC Maple and AC Legend. The 49 barleys differed in reactions toBYD with ACCA being most resistant. ACCA carries the BYDV resistance gene Yd2. On average, two-row cultivars were more susceptible to BYDV than six-row cultivars ( 2.54 vs. 1.94, P<0.05 ). Brightyellow leaf chlorosis was also observed in the seed multiplication plots at the Central ExperimentalFarm. The ratings of leaf chlorosis for the 13 barleys in the multiplication plots were as follows: ACKlinck 1, AB186-3 2, Morrison 2, AC Alberte 4, AC Hamilton 4, AC Parkhill 4, AC Stephen 4,AB214-2 4, OBS4181-43 4, AC Legend 5, OBS4840-1 5, OBS4065-157 5, and AC Maple 6.

67
Table 1. Barley yellow dwarf (BYD) reactions of 49 barley cultivars grown at Ottawa in 2000.
SIX-ROW BARLEY BYDz TWO-ROW BARLEY BYDACCA 0.00 Formosa 1.50AC Alma 0.75 AB233 1.75Brucefield 1.00 AC Alberte (hulless) 1.75Hamilton 1.00 AB230 2Nellygan 1.00 AC Queens 2.00Sandrine 1.00 AC Kings 2.25AB186-3 1.25 Morrison 2.25Excel 1.25 AB214-2 2.5AC Stephen 1.25 Almonte 2.50AC Westech 1.25 Belmore 2.50B1602 1.50 AC Sirius 2.50AC Klinck 1.50 AC Sterling 2.75Leger 1.50 Viking 2.75OBS4347-23 1.50 AC Parkhill 3.00OBS4985-1 1.50 Symko 3.00Grant 1.75 Serena 3.25AC Malone 1.75 AB235-2 3.50AC Burman 2.00 Sunderland 4.00OBS4984-6 2.00OAC Kippen 2.25Myriam 2.25OBS4755-1 2.25Stander 2.25Chapais 2.50Chevron 2.50OBS4181-43 2.50OBS4840-1 2.75Viviane 3AB197-4 4AC Legend 4.25AC Maple 4.75
z 0 = no leaf chlorosis, 9 = severe leaf chlorosis. LSD (0.05) = 0.96.

68
CROPS / CULTURES: Barley and Oat
LOCATION / RÉGION: Saskatchewan
NAME AND AGENCY / NOM ET ORGANISME:G.R. Hughes1, M.R. Fernandez2 and P.G. Pearse3
1Department of Plant Sciences, University of Saskatchewan, 51 Campus Drive, Saskatoon, SK,S7N 5A8 Telephone: (306) 966-4951; Facsimile: (306) 966-4951; e-mail:[email protected] and Agri-Food Canada, Semiarid Prairie Agricultural Research Centre, P.O. Box1030, Swift Current, SK, S9H 3X23Saskatchewan Agriculture and Food, 3085 Albert St., Regina, SK, S4S 0B1.
TITLE / TITRE: LEAF DISEASES OF BARLEY AND OAT IN SASKATCHEWAN IN 2000
INTRODUCTION AND METHODS: A survey of leaf diseases of barley and oat was conducted in fieldsrandomly selected from most crop districts (CD) in Saskatchewan. Ten flag and ten penultimate leaveswere collected at random from each of 51 fields of barley and 29 fields of oat at the late-milk to early-dough stages of development. The leaves were air-dried at room temperature. The percent leaf areadiseased (severity) and number of fields affected (prevalence) were calculated for each CD. At the timeof rating, the identify of diseases present, based on visual inspection, was also recorded.
RESULTS AND COMMENTS: Leaf spot diseases were found in all barley and oat fields surveyed(Table 1). While moisture conditions were generally favourable to disease development, except in thenorth-west region of the province, the cool weather experienced in the first half of the growing seasonappeared to slow disease development so that disease levels were similar to or slightly lower than thosein 1999. The average leaf spot severity on flag leaves was trace (<5%) in 12%, slight to moderate (5-25%) in 58%, moderate (26-50%) in 17% and severe (>50%) in 13% of fields surveyed. Disease levelstended to be fairly similar across all crop districts. Leaf spot disease severity in oat was low with thehighest levels occurring in the east-central region (CDs 5A, 5B). Most fields had trace or slight levels ofdisease.
The most common leaf disease in barley was net blotch, caused by Pyrenophora teres. Spot blotch(caused by Cochliobolus sativus) was the next most common disease and scald (caused byRhynchosporium secalis) was detected on leaf samples from 4 fields in north-western Saskatchewan(CDs 9A, 9B). Plating of leaf samples will be done to confirm these observations and to identify thecause of the oat leaf spots. Crown rust was not found in any oat field.
We gratefully acknowledge the participation of Saskatchewan Agriculture and Food extensionagrologists in this survey and financial support from the Saskatchewan Agriculture Development Fund.

69
Table 1. Distribution and severity of leaf spotting diseases of barley and oat in Saskatchewan fieldssurveyed at late milk to early-dough stages in 2000.
CROPDISTRICT
BARLEY OAT
% fields affected/surveyed
Mean severity1 (%) # fields affected/surveyed
Mean severity (%)
1 B 1 /1 62 1 /1 192 A 1 /1 5 2 /2 72 B 5 /5 26 1 /1 13B-N 1 /1 46 1 /1 13B-S 1 /1 1 1 /1 14 A 2 /2 14 1 /1 35 A 3 /3 14 2 /2 165 B 7 /7 26 5 /5 156 A 1 /1 11 - - - -6 B 3 /3 21 2 /2 87 A 2 /2 13 1 /1 17 B 5 /5 16 1 /1 18 A 9 /9 15 2 /2 108 B 1 /1 51 4 /4 69 A 4 /4 12 2 /2 99 B 4 /4 28 3 /3 8
Total 51 /51 29 /29
Mean 23
1 Percent flag leaf area diseased.

70
CROPS / CULTURES: Barley, Oat and Wheat
LOCATION / RÉGION: Manitoba and eastern Saskatchewan
NAME AND AGENCY / NOM ET ORGANISME:T. Fetch and K. DunsmoreCereal Research Centre, Agriculture and Agri-Food Canada, 195 Dafoe Road, Winnipeg MB,R3T 2M9 Telephone: (204) 983-1462; Facsimile: (204) 983-4604; email: [email protected]
TITLE / TITRE: STEM RUSTS OF CEREALS IN WESTERN CANADA IN 2000
INTRODUCTION AND METHODS: Surveys of fields and trap nurseries of barley, oat and wheat forincidence and severity of stem rust (Puccinia graminis Pers. f. sp. tritici Eriks. & E. Henn. and P. graminisPers. f. sp. avenae Eriks. & E. Henn.) were conducted in July, August, and September 2000. Infectedstem tissue samples obtained from fields and trap nurseries were evaluated for pathotypic specializationon appropriate sets of host differential lines.
RESULTS AND COMMENTS: Environmental conditions were unfavorable for stem rust infection, withlow temperatures and frequent rainfall. Stem rust severity on susceptible lines in trap nurseries was atvery low levels (<5%) in 2000. All spring wheat cultivars recommended for Manitoba and Saskatchewanhave excellent resistance to stem rust, and no stem rust infection was observed in any commercialfields. Barley and oat cultivars recommended for Manitoba and Saskatchewan are susceptible to stemrust infection (Pathotypes QCCJ and NA67, respectively). Little or no stem rust infection was observedin early-planted barley and oat fields. This may be due to escape from infection, unfavorableenvironmental conditions, or to application of foliar fungicides. In 2000, a significant percentage ofcereal fields in eastern Manitoba were sprayed with fungicides for control of foliar and head diseases,which additionally controlled stem rust. Low to moderate levels of infection developed during latesummer-early fall on late-planted oat fields, wild barley (Hordeum jubatum L.), and wild oat (Avena fatuaL.).
No new pathotypes of P. graminis f. sp. tritici were found to threaten Canadian wheat or barleyproduction. The most serious stem rust threat is the continued increase in frequency of pathotypes NA67and NA76 of P. graminis f. sp. avenae. These pathotypes are virulent on the effective stem rustresistance genes (Pg2, Pg9, and Pg13) deployed in Canadian oat cultivars. Since the advent ofpathotype NA67 in 1998, the frequency of this pathotype in the oat stem rust population in the easternprairie region on Canada has risen from about 20% to near 40% in 2000. These two races now threatenoat production in the rust area of the prairies. Identification and incorporation of genes conferringresistance to NA67 and NA76 are underway in the Agriculture and Agri-Food Canada, Cereal ResearchCentre breeding programs.

71
CROPS / CULTURES: Barley, Oat and Wheat
LOCATION / RÉGION: Manitoba and eastern Saskatchewan
NAME AND AGENCY / NOM ET ORGANISME:S. Haber1 and R. Kurtz2
1Agriculture and Agri-Food Canada, Cereal Research Centre, 195 Dafoe Road, Winnipeg MB,R3T 2M9 Telephone: (204) 983-1467; Facsimile: (204) 983-4604; e-mail: [email protected] Agriculture, Plant Pathology Laboratory, 201-545 University Crescent, Winnipeg MB,R3T 5S6
TITLE / TITRE: CEREAL VIRUS DISEASE SITUATION IN MANITOBA IN 2000
INTRODUCTION AND METHODS: Virus diseases on cereals in Manitoba monitored in 2000 werebarley yellow dwarf (BYD), wheat streak mosaic (WSM) and flame chlorosis (FC). Collaboratorsidentified and collected samples from early June to late August in cereal crops in Manitoba and parts ofeastern Saskatchewan. The proportion of plants with (suspected) virus symptoms in surveyed fields wasestimated and specimens with and without symptoms collected for testing. Infection with BYDV andWSMV was confirmed by transmission to indicator hosts, and for BYDV, also characterized as toserotype by enzyme-linked immunosorbent assay (ELISA). In addition to confirming identity of causalagents, transmission to indicator host plants was used to assess virulence against historicalbenchmarks. For WSMV, transmission was by mechanical inoculation to a range of susceptible springbread and durum wheat hosts; for BYDV, transmission was by cereal aphids to sets of seedlings of asusceptible oat host.
RESULTS AND COMMENTS:Barley Yellow Dwarf (BYD) - Unlike 1999 (1), losses due to BYD were generally very mild. Cerealaphid populations carrying BYDV were not in evidence in Manitoba until late June, which is similar tomost years. Compared to 1999, the proportion of early-arriving cereal aphids that were oat bird-cherry(Rhopalosiphum padi), the most efficient vector of the predominant BYDV strain, PAV, was lower androughly similar to that seen in most years. Although losses were generally mild, there were areas ofnoticeable losses in later-seeded barley in western Manitoba (near Brandon) and in barley and oat insome areas near Saskatoon. Losses due to BYD in wheat were very small. Consistent with the trend ofthe last 15-20 years, almost all virus isolates obtained from small grains were of the PAV strain(non-specifically transmitted by the oat bird-cherry aphid).
Wheat Streak Mosaic (WSM) - Localized outbreaks of WSM in spring wheat crops in Manitoba andeastern Saskatchewan in 2000 occurred in the vicinity of infected winter wheat. In affected fields losseswere estimated to be between 5 and 10%, generally lower than in 1999 or recent years (1). This mayreflect the relatively cool conditions that generally prevailed in June when most spring wheat cropswould have been in the critical early growth stages. Unlike 1999, wheat streak mosaic virus (WSMV)was not found at all in oat plants.
Flame Chlorosis (FC) - After a hiatus in 1999, FC was again observed in Manitoba in 2000, albeit onlyat extremely low levels and only at edges of wheat fields at two sites in the Red River valley south ofWinnipeg. However, no FC was found on barley in western Manitoba, where historically it has beenmost frequently observed and caused the greatest losses (2).
REFERENCES:1. Haber, S., and Kurtz, R. 2000. Cereal virus disease outbreaks in Manitoba in 1999. Can. Pl. Dis. Surv. Dis.80:41-42. (HTTP://RES.AGR.CA/LOND/PMRC/PMRCHOME.HTML)2. Haber, S., D.J.S. Barr & R.G. Platford. 1991. Observations on the distribution of flame chlorosis in Manitoba andits association with certain zoosporic fungi and the intensive cultivation of cereals. Can J. Plant Pathol. 13:241-246.

72
CROPS / CULTURES: Barley, Oat and Wheat
LOCATION / RÉGION: Manitoba and Saskatchewan
NAME AND AGENCY / NOM ET ORGANISME:J.G. Menzies, F. Matheson, C. Saramaga and C. HoeschenCereal Research Centre, Agriculture and Agri-Food Canada, 195 Dafoe Road, Winnipeg MB,R3T 2M9 Telephone: (204) 984-5167; Facsimile: (204) 983-4604; e-mail: [email protected]
TITLE / TITRE: CEREAL SMUT SURVEYS, 2000
INTRODUCTION AND METHODS: In July 2000, cereal crops were surveyed for Ustilago hordei, U.nigra, U. nuda, U. tritici, U. avenae and U. kolleri in Manitoba and Saskatchewan. The area was coveredby routes from Winnipeg - Estevan - Moose Jaw - Saskatoon - Prince Albert - Melfort - Yorkton - Russell- Minnedosa - Winnipeg, as well as one day trips around Winnipeg, MB. Fields were selected at randomat approximately 10 - 15 km intervals, depending on the frequency of the crops in the area. An estimateof the percentage of infected plants (i.e., plants with sori) was made while walking an ovoid path ofapproximately 100 m in each field. Levels of smut greater than trace (<0.1%) were estimated bycounting plants in a one m2 area at a minimum two sites on the path.
RESULTS AND COMMENTS: Loose smut (U. tritici) was found in 26% of the 143 fields of breadwheats surveyed. In most affected fields, levels of infection were trace; two fields had levels of 0.1%. Indurum wheat, loose smut was found in 46% of the 26 fields surveyed. In all infested fields, the level ofinfection was 0.1%. In awned wheats (likely of the CPS wheat class), loose smut was found in 18% ofthe 11 fields surveyed. In all these infested fields, the level of infection was 0.1%.
As has been the case for several years, very few oat fields had smut (2 of 18 fields surveyed). Infectionlevels in all positive fields surveyed were trace. Smutted oat plants were infected with U. avenae.
A high incidence of smut (U. nuda) was found in barley with 61% of the 87 fields surveyed containinginfected plants. Incidence was particularly high in 6-rowed barley (71% of 63 fields) with most fieldshaving levels of trace to 0.1 % smutted plants; however, infection levels of 0.5 to 1% smutted plants perfield were observed. In 2-rowed barley, 33% of 24 fields were affected with six fields having trace levelsand the other two levels of 0.1 %. False loose smut (U. nigra) and covered smut (U. hordei) were notfound.

73
CROPS / CULTURES: Barley and Wheat
LOCATION / RÉGION: Central Alberta
NAME AND AGENCY / NOM ET ORGANISME:D.D. Orr and T.K. TurkingtonAgriculture and Agri-Food Canada, Lacombe Research Centre, 6000 C & E Trail, Lacombe AB,T4L 1W1 Telephone: (403) 782-8133; Facsimile: (403) 782-6120; e-mail: [email protected]
TITLE / TITRE: CEREAL DISEASE SURVEY IN CENTRAL ALBERTA - 2000
METHODS: Cereal crops were randomly selected approximately every 10 km in Alberta Census District(CD) 8 (north central Alberta) on August 2 and 3. This area encompasses Sylvan Lake on the west,Bashaw on the east and is bordered north and south by Ponoka and Innisfail, respectively. Fields weretraversed in an inverted V, with analysis of 5 plants taking place at 3 locations. Leaf diseases werescored on a 0-9 scale, with a 4 rating equal to 1% leaf area diseased (PLAD) on the upper leaf canopy,5-10 PLAD on the middle canopy and 10-25 PLAD on the lower canopy. Common root rot (CRR) wasassessed on a 0-4 scale where 1=trace and 4=severe. Other diseases were rated as a percent of thefield affected.
RESULTS AND COMMENTS: The results are presented in Table 1. Central Alberta experienced awetter than normal June and July which delayed crops somewhat and resulted in generally higherdisease levels than seen in 1999. Thirty-three barley fields were examined, 22 of which were 2-row and11 of which were 6-row barley. For the second year in a row, there was an unusually high number of 2-row barley fields encountered. Disease incidence was generally higher in 2-row than 6-row barley. Scald (Rhynchosporium secalis) and spot blotch (Cochliobolus sativus) severities were higher in 2-rowbarley fields while net blotch (Pyrenophora teres) severity was higher in 6-row fields. The severities ofCRR (C. sativus and Fusarium spp.) were higher in 2000 than in 1999, but disease incidence wassimilar. Loose smut (Ustilago nuda) occurred at trace levels in about 1/3 of the 2-row and 6-row barleyfields surveyed. Bacterial blight (Xanthomonas campestris) severity and incidence were higher in 2000than in 1999. Barley leaf stripe (Pyrenophora graminea) was not noted in this survey.
Septoria/Stagonospora leaf blotch (Septoria tritici, Stagonospora nodorum) was present in all 13 wheatfields examined, at relatively high levels. Tan spot (P. tritici-repentis) was not noted in 2000. Glumeblotch (S. nodorum) was present at low levels in four fields. Take-all (Gaeumannomyces graminis) wasencountered in six fields at mainly low levels, except for one field with about 60% affected plants. Common root rot was found at levels similar to those of 1999. Powdery mildew (Erysiphe graminis) wasnoted in only one field. In a smaller survey conducted later in the season, stripe rust (Pucciniastriiformis) was found at low levels in two of the four wheat fields examined.
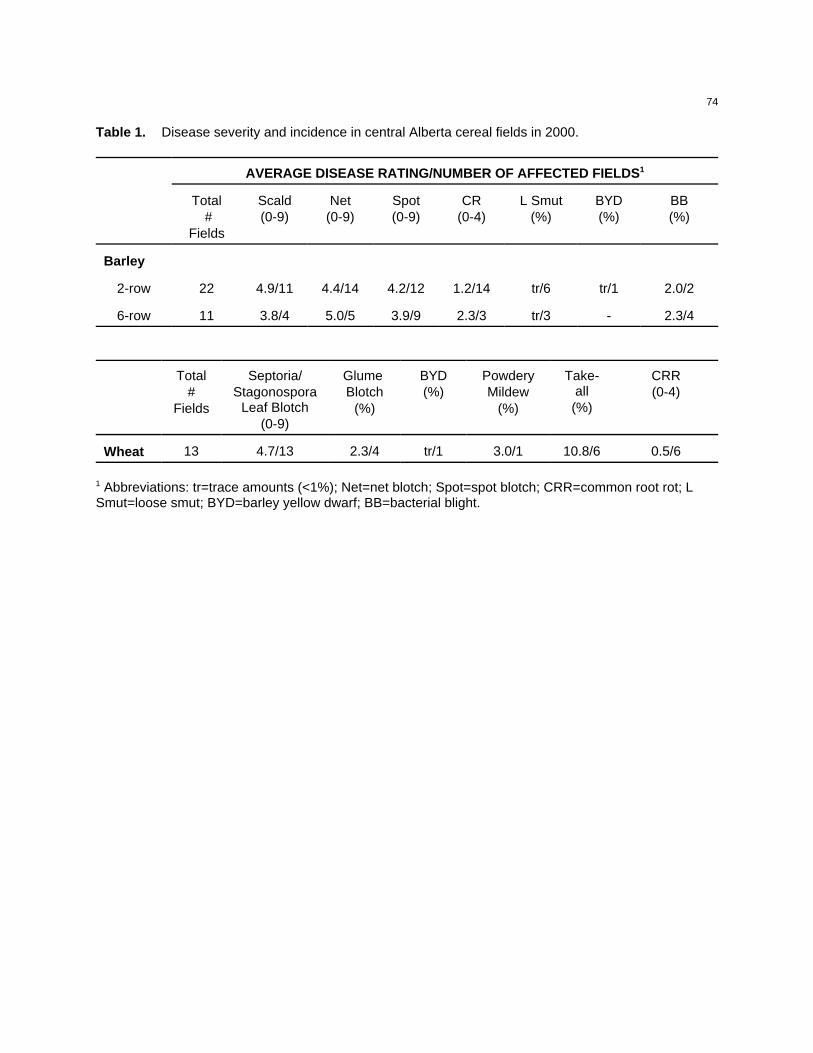
74
Table 1. Disease severity and incidence in central Alberta cereal fields in 2000.
AVERAGE DISEASE RATING/NUMBER OF AFFECTED FIELDS1
Total #
Fields
Scald(0-9)
Net(0-9)
Spot(0-9)
CR(0-4)
L Smut(%)
BYD(%)
BB(%)
Barley
2-row 22 4.9/11 4.4/14 4.2/12 1.2/14 tr/6 tr/1 2.0/2
6-row 11 3.8/4 5.0/5 3.9/9 2.3/3 tr/3 - 2.3/4
Total#
Fields
Septoria/Stagonospora
Leaf Blotch(0-9)
Glume Blotch
(%)
BYD(%)
PowderyMildew
(%)
Take-all(%)
CRR(0-4)
Wheat 13 4.7/13 2.3/4 tr/1 3.0/1 10.8/6 0.5/6
1 Abbreviations: tr=trace amounts (<1%); Net=net blotch; Spot=spot blotch; CRR=common root rot; LSmut=loose smut; BYD=barley yellow dwarf; BB=bacterial blight.

75
CROP / CULTURE: Corn
LOCATION / RÉGION: Ontario and Quebec
NAME AND AGENCY / NOM ET ORGANISME:X. Zhu, L. M. Reid, D. Presello, and T. WoldemariamAgriculture and Agri-Food Canada, Eastern Cereal and Oilseed Research Centre, Ottawa ON,K1A 0C6 Tel: (613) 759-1616; Facsimile: (613) 952-9295; e-mail: [email protected]
TITLE / TITRE: SURVEY OF CORN PESTS IN ONTARIO AND QUEBEC IN 2000
INTRODUCTION AND METHODS: In July, September, and October 2000, the Eastern Cereal andOilseed Research Centre (ECORC) conducted a corn pest survey in Ontario and Quebec. As in previoussurveys, the main purpose was to determine the distribution of the bacterial disease Stewart’s wilt(Pantoea stewartii = Erwinia stewartii) and of viral diseases, such as Maize Dwarf Mosiac (MDM),Sugarcane Mosaic (SCM), Johnson Gross Mosaic (JgM), Maize Chlorotic Dwarf (MCD), Maize ChloroticMottle (MCM), Maize White Line Mosaic (MWLM), Wheat Streak Mosaic (WSM), and Barley YellowDwarf (BYD). Also recorded were the distribution and severity of other diseases and insects includingeyespot (Aureobasidium zeae), northern leaf blight (Exserohilum turcicum), common rust (Pucciniasorghi), common smut (Ustilago maydis), head smut (Sporisorium holci-sorghi = Sphacelothecareiliana), stalk rot (Fusarium spp., and Colletotrichum graminicola), ear rot (Fusarium spp.), Europeancorn borer (Ostrinia nubilalis) and corn rootworm (Diabrotica longicornis and/or D. virgifera). As well,scouting for any new diseases in Canada was conducted, especially for grey leaf spot (Cercosporazeae-maydis).
At each of 114 locations visited between July 13 and October 5, the incidence of each pest and theseverity of the predominant pest was recorded. At the same time, Stewart’s wilt samples and leaves withvirus-like symptoms were collected. ELISA tests for Stewart’s wilt and viruses were done in thelaboratory by using reagent sets, protocols and antibodies provided by AGDIA Inc. (Elkhart, Indiana46514, USA).
RESULTS AND COMMENTS:Fungal leaf diseases: Common rust was found at every location (Table 1) and the severity wasgenerally moderate to high according to the resistance level of hybrids and planting date; only a fewcommercial hybrids exhibited high resistance. Common rust was found as early as June 17at Ottawa.This is one month earlier than usual. Late planted (late June or July) sweet corn and grain corn only hada few rust pustules in both Ontario and Quebec. This difference in severity resulting from planting date,suggests the original infectious uredospores arrived via southerly winds and rainfall due to much morerain in May and June in 2000 than usual.
Northern leaf blight was found at only 9 locations, and only one farm at Forfar in Leeds and GrenvilleCounty, ON had indications of potential severe yield loss. The same hybrid had been planted in this 55acre field for three years and yielded quite well in both 1998 and 1999, but in 2000 the corn plants diedbefore September 4 due to severe infection of northern leaf blight; yield losses were estimated at near50%. No blight was found at a farm in St-Philippe, Argenteuil County, QC which had severe northernleaf blight in 1998 but less blight in 1999. The producer eliminated the 1998 crop debris by burning andhas used a resistant hybrid since 1999.
Eyespot was found at 39 locations but only one hybrid at Elora, Willington County, ON was found to behighly susceptible. In some areas, a form of cross protection between common rust and eyespotappeared to exist, i. e., the more common rust, the less eyespot and vice-versa. One unknown leaf

76
disease was found sporadically at two locations in both Ontario and Quebec. Grey leaf spot was notfound at any of the locations surveyed in 2000.
Fungal Ear and Stalk diseases: Stalk and ear rots were observed at all locations where the cornmatured. Fusarium stalk rot, Pythium stalk rot (known as ‘early death’), and anthracnose stalk rot wereobserved. Anthracnose stalk rot was a major problem late in the season in the Chatham-Kent areas.Top-die back, a disease caused by the same pathogen as anthracnose stalk rot was widespread duringthe period September 12-14. As a result, two weeks later, corn plants dried prematurely due to thespread of anthracnose stalk rot. In north Chatham, 20-100% plant breakage above the ear was evidentin early October in every field visited. Resistance to this breakage varied among hybrids from allcompanies. Because increased lodging was expected, many farmers harvested early.
Common smut was found at 69 locations, but severe damage was not observed on commercial hybrids.Head smut was found at only four locations. In a field at the AAFC Greenbelt Farm, Ottawa-CarletonCounty, ON the head smut-infected area has increased from 75 x 30 m2 in 1998 and 300 x 100 m2 in1999, to 1850 x 400 m2 in 2000, but the incidence has decreased from 37% to 19% to 6%, respectively. The area expansion is most likely due to spread during combining, but the reason for decreasedincidence is unknown. Cladosporium ear rot (Cladosporium herbarum) was identified in one farm samplesubmitted to ECORC.
Insects: Damage from the European corn borer (ECB) was greater in southern Ontario than easternOntario or Quebec. In Chatham-Kent, Elgin, Essex, and Middlesex counties, some fields had incidencesas high as 50-80% with 20-50% stalk breakage. The ECB damage increased lodging caused byanthracnose stalk rot. Bt corn showed excellent resistance to ECB, resulting in no increase in lodgingfrom anthracnose stalk rot; there was however no effect on the fungal infection rate.
Lygus lineolaris, which usually sucks the leaves resulting in small white spots , caused severe damageon some AAFC breeding lines at Cobden, Renfrew County, ON. The nymph and adult insect suckedon the young tissues in the whorl and left a wide range of transparent tissues. The leaves dried andsometimes tightened around new whorl leaves impeding further plant growth.
Corn rootworm (CRW) damage was observed at 38 locations, but mostly consisted of leaf damage andsilk pruning. Root lodging caused by CRW was found only at Winchester in Stormont Dundas andGlengarry County, ON. Aphids were numerous in some late sweet corn and breeding material in theLondon and Ottawa areas.
Bacterial diseases: Holcus leaf spot (Pseudomonas syringae) symptoms were seen only at onelocation, and no Goss’ bacterial wilt (Clavibacter michiganensis subsp. nebraskensis = Corynebacteriumnebraskense) was observed. A total of 73 leaf samples with wilt-like symptoms and 11 kernel samplesfrom Stewart’s wilt-affected plants were collected from 42 locations in 12 Ontario and 2 Quebeccounties. As shown in Table 1, Stewart’s wilt was identified with the ELISA test at 40 locations inChatham-Kent, Elgin, Essex, Frontenac, Huron, Lambton, Leeds and Grenville, Middlesex, Oxford, Peel,Perth, and Waterloo counties, ON, and Les Maskoutains county, PQ.
All 50 of the samples collected with ‘typical’ Stewart’s wilt symptoms consisting of long streaked lesionswith wavy margins tested positive for Stewart’s wilt. Seven (30.4%) of the other 23 leaf samples werealso positive. Of the 11 kernel samples, 5 (45.5%) tested positive for Stewart’s wilt. Severe Stewart’s wiltdamage was found on late planted sweet corn (planted at the end of June) in the area around London,ON. At Northcrest and Ballymate in Middlesex County , ON, 100% of plants were diseased, about 5-25% plants died, and 10-18% plants were barren. Symptoms differed between sweet corn and graincorn. On sweet corn, the symptoms of Stewart’s wilt first appeared as long, narrow, white stripes, thenchanged to brown; plants were dwarfed and some even died.

77
Viral diseases: Viral symptoms, such as dwarfing, mosaic, and yellowish streaks were observed inlate-planted (planted during the last week of June) sweet corn at 5 locations in Middlesex County, ONand late-planted (planted first week of August) grain corn at north Ridgetown, Chatham-Kent County,ON. Other virus-like symptoms, such as deformation and yellowing were observed at 41 locations. Maize Dwarf Mosaic Virus (MDMV, formerly MDMV-A), Sugarcane Mosaic Virus (SCMV, formerlyMDMV-B), and Wheat Streak Mosaic Virus (WSMV) were identified in Ontario; no virus was identified inQuebec by ELISA tests. MDMV was identified at 7 locations in Chatham-Kent and Middlesex Counties,SCMV at 7 locations in Chatham-Kent, Middlesex, and Ottawa-Carleton counties, but WSMV only atBallymate, Middlesex county.
More virus diseases were detected in later-planted plants. In fields with plants subsequently testingpositive for virus, 0, 4-12%, and 70% plants with typical viral symptoms were observed in fields plantedin late May (Ottawa-Carleton County), in late June (Middlesex County), and in early August (Chatham-Kent County), respectively. For significant MDM and SCM development, high (viruliferous) aphidpopulations had to coincide with susceptible growth stages. In normal (early) planted corn, sufficientaphid numbers did not occur until the 10-12 leaf stage allowing plants to escape virus infection. In late-planted corn, higher aphid populations coincided with the susceptible stage (prior to the 8-leaf stage)resulting in infection and visible viral symptoms.
Overall in 2000, common rust and anthracnose stalk rot were more severe than average, likely as aresult of the generally cool and wet conditions. European corn borer caused more damage in southernOntario. Stewart’s wilt was less common than in 1999. MDMV, SCMV, and WSMV were primarily foundon later planted corn.
AcknowledgementsWe greatly appreciate the help and scouting of E. Coles, E. Shaham, and S. Thomas, Eastern Cerealand Oilseed Research Centre, Agriculture and Agri-Food Canada; D. Petri, Direct Seeds; P. Lachance,Ministère de l'Agriculture, des Pêcheries et de l'Alimentation du Quebec and J. Montpetit and G. García,Pioneer Hi-Bred International, Inc.

78
Table 1. The distribution of corn pests in Ontario (ON) and Quebec (QC) in 2000.
COUNTY, PROVINCE
NO. OF LOCATIONS
Total Rust Blight Eyespot
CommonSmut
Headsmut
Stalkrot
Earrot
Wilt Virus ECB CRW
ONTARIO
Chatham-Kent 11 11 2 10 13 5 5 2 9 1
Dufferin 1 1 1 1 1
Durhan 2 2 2 1 2 2
Elgin 2 2 2 1 2 1 1 2
Essex 2 2 1 2 2 1 2 2
Frontenac 4 4 2 3 2 4 1
Hastings 1 1 1 1
Huron 5 5 1 2 1 1 4 5 4
Lambton 1 1 1 1 1
Lanark 2 2 1 1 1 2 1
Leeds and Grenville 11 11 2 4 7 1 1 4 9 4
Middlesex 15 15 3 4 10 9 1 11 5 8 2
Ottawa-Carleton 6 6 1 4 2 2 1 1 1 3 2
Oxford 3 3 1 2 3 2 3 3 2
Peel 1 1 1 1 1
Perth 2 2 2 1 1 2 2 2
Prescott andRussell
6 6 1 1 1
Renfrew 6 6 3 3 1 3 1
Stormont Dundasand Glengarry
7 7 5 6 1 1 2 2
Waterloo 2 2 2 2 2 2 2 2 1
Wellington 2 2 2 2 2 2 2
York 1 1 1 1
QUÉBEC
Argenteuil 1 1 1
Brome Missisquoi 1 1 1
La Rivière-Du-Nord 1 1 1 1 1 1
La Vallée-Du-Richelieu
1 1 1
Lajemmerais 1 1 1 1
Le Haute-Yamaska 1 1
Les Maskoutains 9 9 1 4 1 2 3 5
Montcalm 1 1 1 1
Vaudreuil-Soulanges
5 5 2 3 1
Total 114 114 9 39 69 4 41 17 40 8 74 38
Rust = common rust, Blight = northern leaf blight, Stalk rot = Anthracnose stalk rot and/or Anthracnose top-die back and/orFusarium stalk rot, Wilt = Stewart’s wilt ( ELISA test positive), Virus = Maize dwarf Mosaic Virus (MDMV), and/or Sugarcane MosiacVirus (SCMV) and/or Wheat Streak Mosaic Virus (WSMV), ELISA test positive. ECB = European corn borer, and CRW = CornRootworm.

79
CROP: Oat
LOCATION: Manitoba and eastern Saskatchewan
NAME AND AGENCY:J. ChongCereal Research Centre, Agriculture and Agri-Food Canada, 195 Dafoe Road, Winnipeg, MB,R3T 2M9 Tel: (204) 983-0932; Facsimile: (204) 983-4604; e-mail: [email protected]
TITLE: CROWN RUST OF OAT IN WESTERN CANADA IN 2000
INTRODUCTION AND METHODS: Surveys for oat crown rust (caused by Puccinia coronata Cda f. sp.avenae Eriks.) incidence and severity were conducted in southern Manitoba from early July to lateAugust, and in eastern Saskatchewan in mid-August. Crown rust collections were obtained from wildoat (Avena fatua L.) and commercially grown oat in farm fields, and from susceptible and resistant oatlines and cultivars grown in uniform rust nurseries. The nurseries were located at Brandon, Emerson,and Morden, MB, and at Indian Head, SK. Virulence phenotypes of single-pustule isolates establishedfrom the rust collections were identified, using 16 single-gene backcross lines (Pc38, Pc39, Pc40, Pc45,Pc46, Pc48, Pc50, Pc51, Pc52, Pc54, Pc56, Pc58, Pc59, Pc62, Pc64, Pc68) as the primary differentialhosts. Single-gene lines with Pc94 and Pc96 were included in the differential sets as supplementaldifferentials.
RESULTS AND COMMENTS: Oat crown rust was less severe in southern Manitoba and more severeand widespread in south-eastern Saskatchewan in 2000 than in previous years. Traces of crown rustinfection were first observed on wild oat (Avena fatua L.) near Emerson, MB, on July 9. Subsequentconditions were cool with above average rainfall. This limited the development of the rust during most ofthe growing season. By mid-August, crown rust severities ranging from trace to moderate levels (up to70%) were found on wild oat, and trace to 20% crown rust severities were observed in late seededcommercial oat fields in southern Manitoba. Early seeded fields of susceptible cultivars (e.g., Robertand Riel) escaped damage. Crown rust infections remained at trace levels in field plots of the cultivarAC Assiniboia, and ranged from light to 20% in field plots of Triple Crown. At various locations acrosseastern Saskatchewan from Estevan to Assiniboia, crown rust severities ranging from 20% to 80% werecommonly found on wild oat, and severities ranging from 5% to 40% were found in late seededcommercial oat fields. This was the most severe and widespread occurrence of crown rust in south-eastern Saskatchewan for many years.
To date, 210 single-pustule isolates of P. coronata f. sp. avenae established from the collectionsobtained in Manitoba and Saskatchewan in 2000 have been evaluated for their virulence phenotypesusing the 18 differential hosts. As in recent years, the prairie rust population in 2000 was predominatedby isolates with virulence to genes Pc38 and Pc39; cultivars such as Dumont, Robert, Riel, Belmont, ACMarie and AC Preakness, would have been susceptible to these isolates. Six isolates had virulence toAC Assiniboia and AC Medallion. Thirty-three isolates had virulence to the single-gene line with Pc48, agene found in Triple Crown. One isolate was found to have virulence to lines with the four resistancegenes, Pc38, Pc39, Pc48, and Pc68, combined. This isolate also was virulent to Pc96. None of the 210isolates were virulent to Pc94. Genes Pc48, Pc68, Pc94 and Pc96 are being used in the oat breedingprogram at the Cereal Research Centre to develop new cultivars possessing various combinations ofthese genes for protection against the prairie rust population.

80
CROP / CULTURE: Wheat
LOCATION / RÉGION: Saskatchewan
NAME AND AGENCY / NOM ET ORGANISME:M.R. Fernandez and R.M. DePauwAgriculture and Agri-Food Canada, Semiarid Prairie Agricultural Research Centre, P.O. Box1030, Swift Current SK, S9H 3X2 Telephone: (306) 778-7255; Facsimile: (306) 773-9123; e-mail: [email protected]
TITLE /TITRE: ERGOT IN COMMON AND DURUM WHEAT IN SASKATCHEWAN IN 2000
INTRODUCTION AND METHODS: Wheat entries in regional variety trials (Saskatchewan AdvisoryCouncil on Grain Crops tests) at 22 locations in Saskatchewan were examined for the presence of ergot(Claviceps purpurea) in harvested grain. The 22 locations were distributed among four crop productionareas (CPA) of Saskatchewan (Saskatchewan Agriculture and Food, 2001). The entries, 18 CanadaWestern Red Spring (CWRS), 9 Canada Prairie Spring (CPS), 6 Canada Western Extra Strong (CWES)and 5 Canada Western Amber Durum (CWAD), consisted of registered cultivars and advanced co-oplines. Trials were planted at the following locations: 5 in CPA 1 (Assiniboia, Beverley, Fox Valley,Stewart Valley and Swift Current), 9 in CPA 2 (Carlyle, Elrose, Girvin, Saskatoon, Luseland, Outlook,Regina, Scott and Weyburn), 8 in CPA 3 (Battleford, Indian Head, Jedburgh, Kelvington, Lashburn,Melfort, Rosthern and Wynyard) and 3 in CPA 4 (Loon Lake, Nipawin and Shellbrook). For each entryand location, a composite sample of about 300 g from all replicates was analyzed for the presence ofergot bodies. Percent ergot was calculated as (weight of ergot bodies/total weight of samples) X100.
RESULTS AND COMMENTS: Locations where ergot was detected in common and durum wheat arelisted in Table 1. The percentage of locations where ergot was present at more than trace levels was40% for CPA 1, 78% for CPA 2, 75% for CPA 3 and 100% for CPA 4. Girvin, Weyburn and Shellbrookhad the highest percent ergot. Overall, ergot levels across the province were somewhat lower than in1999 (Fernandez et al., 2000). Locations where one or more entries would have been downgradedbecause of high ergot levels (Canadian Grain Commission, 1991) were Swift Current in CPA 1, Girvin,Outlook and Weyburn in CPA 2, Jedburgh, Kelvington, Lashburn and Melfort in CPA 3, and all locationsin CPA 4. In 1999, all locations with ergot had high enough disease levels to cause downgrading in atleast one entry. Only seven of these locations were common to 1999 and 2000. Average percent ergotwas higher in the CWAD and CWES than in the CWRS or CPS classes.
Average percent ergot of the entries varied from 0.01 to 0.08% (Table 2). As in 1999, the variabilityamong locations precluded any conclusion regarding differences in susceptibility to ergot among entries,although none appeared to be more susceptible than the rest.
REFERENCES:Canadian Grain Commission, 1991. Official Grain Grading Guide. 189 pp.
Fernandez, M.R., DePauw, R.M., and R. Dunbar, 2000. Ergot in common and durum wheat inSaskatchewan in 1999. Can. Plant Dis. Surv. 80: 54-56. (http://res2.agr.ca/london/pmrc/)
Saskatchewan Agriculture and Food, 2001. Varieties of Grain Crops 2001. 24 pp.

81
Table 1. Mean percentage of ergot bodies in Canada Western Red Spring, Canada Prairie Spring,Canada Western Amber Durum and Canada Western Extra Strong wheat cultivars planted inregional variety trials in Saskatchewan in 2000.
CropProductionArea
LocationPERCENT ERGOT1
CanadaWestern Red
Spring
CanadaPrairieSpring
CanadaWestern
Extra Strong
CanadaWestern
Amber Durum
Mean
1 Assiniboia 0.01 0.01 0.02 0.03 0.02
1 SwiftCurrent
0.03 0.01 0.00 0.01 0.02
2 Carlyle 0.00 0.00 0.01 0.01 0.01
2 Elrose 0.01 0.00 0.01 0.01 0.01
2 Girvin 0.04 0.04 0.06 0.06 0.05
2 Saskatoon 0.01 0.00 0.00 0.02 0.01
2 Outlook 0.02 0.04 0.08 0.08 0.04
2 Regina 0.00 0.01 0.01 0.01 0.01
2 Weyburn 0.03 0.04 0.11 0.12 0.06
3 Indian Head 0.04 0.03 0.01 0.00 0.01
3 Jedburgh 0.01 0.02 0.03 0.07 0.02
3 Kelvington 0.04 0.04 0.06 na 0.04
3 Lashburn 0.01 0.02 0.04 0.08 0.03
3 Melfort 0.01 0.00 0.03 0.04 0.02
3 Wynyard 0.00 0.01 0.02 0.03 0.01
4 Loon Lake 0.02 0.06 0.11 na 0.04
4 Nipawin 0.01 0.02 0.04 na 0.02
4 Shellbrook 0.04 0.04 0.14 na 0.06
Mean 0.02 0.02 0.04 0.04 0.03
1 percent ergot by weight.

82
Table 2. Mean percentage of ergot bodies in entries planted in regional variety trials in Saskatchewanin 2000.
CULTIVAR NO. OF TRIAL LOCATIONS PERCENT ERGOT
Canada Western Red Spring by weight S.D.AC Abbey 18 0.01 0.01AC Barrie 18 0.02 0.03AC Intrepid 18 0.02 0.02AC Splendor 18 0.01 0.01Alikat 18 0.01 0.02CDC Bounty 28 0.02 0.03Mackenzie 18 0.02 0.03Prodigy 18 0.01 0.015500HR 18 0.03 0.025600HR 18 0.02 0.03BW243 18 0.01 0.01BW252 18 0.01 0.01BW256 18 0.05 0.06BW259 18 0.02 0.04BW263 18 0.01 0.02BW264 18 0.02 0.02BW754 18 0.01 0.02BW755 18 0.01 0.01
Canada Prairie SpringAC Barrie 18 0.03 0.05AC Crystal 18 0.01 0.01AC Karma 18 0.02 0.03AC Vista 18 0.02 0.01AC 2000 18 0.02 0.025700PR 18 0.01 0.01HY639 18 0.02 0.03HY644 18 0.04 0.04HY962 18 0.02 0.02
Canada Western Extra StrongAC Barrie 18 0.02 0.03Glenlea 18 0.05 0.05Amazon 18 0.06 0.09AC Corrine 18 0.06 0.05AC Glenavon 18 0.05 0.04ES21 18 0.02 0.03
Canada Western AmberAC Morse 14 0.04 0.04AC Navigator 14 0.08 0.07AC Pathfinder 14 0.04 0.03Kyle 14 0.03 0.03DT494 14 0.03 0.04

83
CROP / CULTURE: Wheat
LOCATION / RÉGION: Saskatchewan
NAME AND AGENCY / NOM ET ORGANISME: M.R. Fernandez1, P.G. Pearse2, G. Holzgang2 and G.R. Hughes3
1Agriculture and Agri-Food Canada, Semiarid Prairie Agricultural Research Centre, P.O. Box1030, Swift Current SK, S9H 3X2 Telephone: (306) 778-7255; Facsimile: (306) 773-9123; e-mail: [email protected] Agriculture and Food, 3085 Albert St., Regina SK, S4S 0B13Department of Plant Sciences, University of Saskatchewan, Saskatoon SK, S7N 5A8
TITLE/ TITRE: FUSARIUM HEAD BLIGHT IN COMMON AND DURUM WHEAT INSASKATCHEWAN IN 2000
INTRODUCTION AND METHODS: The incidence and severity of fusarium head blight (FHB) wereassessed in 152 common wheat (Canada Western Red Spring and Canada Prairie Spring) and 61durum wheat (Canada Western Amber Durum) fields from 20 crop districts (CDs) in Saskatchewan.Heads from 50 plants, between milk and dough stages, were collected randomly from each field andsent to the Crop Protection Laboratory in Regina for disease assessment, pathogen isolation andidentification. An FHB index (percent number of heads affected x mean severity of infection/100) wasdetermined for each field. An average FHB index for affected fields in each CD, and for CDs grouped bysoil zone (Zone I=Brown, Zone II=Dark Brown and Zone III=Black/Grey soils) was calculated. Kernelsfrom heads with symptoms were surface sterilized in 10% Javex solution for 1 minute and plated onpotato dextrose agar for identification of Fusarium spp.
RESULTS AND COMMENTS: FHB was found in a total of 60% of the common and durum wheat fieldssurveyed in Saskatchewan, slightly more than in the two previous years (54-55%) (Table 1; Fernandezet al., 1999;2000). Mean FHB indexes were also higher in 2000 (1.7% in common, 1.2% in durumwheat) than in 1999 (1.1% in common, 0.5% in durum wheat) but lower than in 1998 (3.0% in common,2.3% in durum wheat). The percentage of infected fields and FHB index were the lowest in Zone I. Thehighest mean FHB index was found in CDs 1A (south-east), 5A (east-central) and 8B (north-east). Individual durum wheat fields with the highest FHB index (2.2 to 5.8%) were in CDs 1A, 5A and 6A(central). Individual common wheat fields with the highest FHB index (2.0 to 12%) were in CDs 1A, 1B(south-east), 2A, 2B (south-east), 5A, 5B (east-central), 6B (central), 8B (north-east) and 9A and 9B(north-west).
The most commonly isolated Fusarium sp. was F. sporotrichioides, followed by F. poae and F.avenaceum (Table 2). The latter two species were more frequent in Zone III than in the other two zones.Fusarium culmorum and F. graminearum were present in only a few fields. Most of the fields where F.graminearum was found were in CD 1A. Fusarium sporotrichioides was more prevalent in 2000 (75% offields) than in 1999 (33%). Fusarium equiseti, a common soil saprophyte, but rarely isolated fromkernels in the past, was isolated at a frequency of 23% in 2000.
We gratefully acknowledge the participation of Saskatchewan Agriculture and Food extensionagrologists in the survey, and financial support by the Agriculture Development Fund.
REFERENCES:Fernandez, M.R, P. Pearse, G. Holzgang, and G. Hughes, 2000. Fusarium head blight in common anddurum wheat in Saskatchewan in 1999. Can. Plant Dis. Surv. 80: 57-59. ( http://res2.agr.ca/london/pmrc/ )

84
Fernandez, M.R, G. Holzgang, M.J. Celetti, and G. Hughes, 1999. The incidence of fusarium head blightin barley, common wheat and durum wheat grown in Saskatchewan during 1998. Can. Plant Dis. Surv.79: 79-82. ( http://res2.agr.ca/london/pmrc/english/report/disease99.html )
Table 1. Incidence of fusarium head blight and disease severity (FHB index) in common and durumwheat in Saskatchewan in 2000.
SOIL ZONE CROPDISTRICT
COMMON WHEAT DURUM WHEAT
No. fieldsaffected/total
fields
FHB1
IndexNo. fields
affected/totalfields
FHB Index
Zone I
Total or mean:
3A-N3A-S3B-N3B-S 4A4B7A
0 /10 /42 /41 /30 /10 /40 /4
3 /21
--
0.60.2---
0.5
-2 /53 /82 /20 /20 /33 /6
10 /26
-0.20.80.1--
0.50.5
Zone II
Total or mean:
1A2A2B6A6B7B
10 /105 /52 /8
9 /11 6 /10 0 /8 32 /52
3.31.81.60.31.6-
1.8
6 /60 /14 /85 /75 /51 /2
21 /29
4.1-
0.21.10.30.11.5
Zone III
Total or mean:
1B5A5B8A8B9A9B
7 /75 /6
11 /134 /128 /118 /12
16 /1859 /79
1.62.41.50.23.40.91.91.8
-1 /10 /31 /11 /1 - -
3 /6
-2.2-
0.20.2--
0.9
Overall total or mean: 94 /152 1.7 34 /61 1.2
1 FHB index calculated as (percent number of heads affected x mean severity of infection)/100.

85
Table 2. Number of fields where Fusarium spp. were isolated from common and durum wheat inSaskatchewan in 2000.
Soilzone/cropdistricts
No.affected
fields
FUSARIUM SPP.
avena-ceum
culmorum equiseti gramin-earum
poae sporotrich-ioides
Zone I
3A-S 2 0 0 0 0 1 1
3B-N 5 3 0 3 0 0 3
3B-S 3 1 0 0 0 1 3
7A 3 1 0 1 0 1 2
Total 13 5 0 4 0 3 9
% fields 38 0 31 0 23 69
Zone II
1A 16 5 3 4 12 4 11
2A 5 1 0 0 3 0 3
2B 6 1 0 1 0 4 5
6A 14 5 0 1 0 7 12
6B 11 5 0 3 1 3 8
7B 1 1 1 0 0 0 1
Total 53 18 4 9 16 18 40
% fields 34 8 17 30 34 75
Zone III
1B 7 3 0 1 4 4 6
5A 6 4 0 1 2 4 3
5B 11 5 1 2 0 5 9
8A 5 1 0 0 1 4 4
8B 9 7 0 3 0 3 7
9A 8 3 0 1 1 4 6
9B 16 9 0 8 0 7 13
Total 62 32 1 16 8 31 48
% fields 52 2 26 13 50 77
Overall total 128 55 5 29 24 52 97
Overall % fields 43 4 23 19 41 76
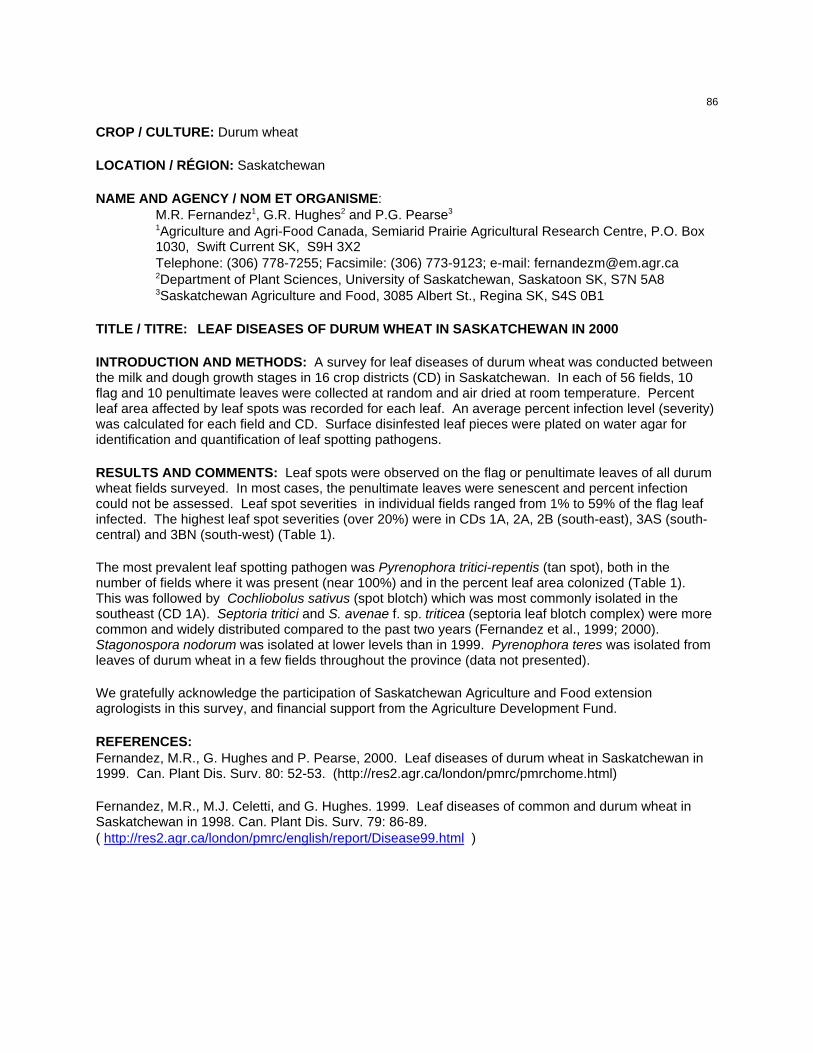
86
CROP / CULTURE: Durum wheat
LOCATION / RÉGION: Saskatchewan
NAME AND AGENCY / NOM ET ORGANISME:M.R. Fernandez1, G.R. Hughes2 and P.G. Pearse3
1Agriculture and Agri-Food Canada, Semiarid Prairie Agricultural Research Centre, P.O. Box1030, Swift Current SK, S9H 3X2Telephone: (306) 778-7255; Facsimile: (306) 773-9123; e-mail: [email protected] of Plant Sciences, University of Saskatchewan, Saskatoon SK, S7N 5A83Saskatchewan Agriculture and Food, 3085 Albert St., Regina SK, S4S 0B1
TITLE / TITRE: LEAF DISEASES OF DURUM WHEAT IN SASKATCHEWAN IN 2000
INTRODUCTION AND METHODS: A survey for leaf diseases of durum wheat was conducted betweenthe milk and dough growth stages in 16 crop districts (CD) in Saskatchewan. In each of 56 fields, 10flag and 10 penultimate leaves were collected at random and air dried at room temperature. Percentleaf area affected by leaf spots was recorded for each leaf. An average percent infection level (severity)was calculated for each field and CD. Surface disinfested leaf pieces were plated on water agar foridentification and quantification of leaf spotting pathogens.
RESULTS AND COMMENTS: Leaf spots were observed on the flag or penultimate leaves of all durumwheat fields surveyed. In most cases, the penultimate leaves were senescent and percent infectioncould not be assessed. Leaf spot severities in individual fields ranged from 1% to 59% of the flag leafinfected. The highest leaf spot severities (over 20%) were in CDs 1A, 2A, 2B (south-east), 3AS (south-central) and 3BN (south-west) (Table 1).
The most prevalent leaf spotting pathogen was Pyrenophora tritici-repentis (tan spot), both in thenumber of fields where it was present (near 100%) and in the percent leaf area colonized (Table 1). This was followed by Cochliobolus sativus (spot blotch) which was most commonly isolated in thesoutheast (CD 1A). Septoria tritici and S. avenae f. sp. triticea (septoria leaf blotch complex) were morecommon and widely distributed compared to the past two years (Fernandez et al., 1999; 2000). Stagonospora nodorum was isolated at lower levels than in 1999. Pyrenophora teres was isolated fromleaves of durum wheat in a few fields throughout the province (data not presented).
We gratefully acknowledge the participation of Saskatchewan Agriculture and Food extensionagrologists in this survey, and financial support from the Agriculture Development Fund.
REFERENCES:Fernandez, M.R., G. Hughes and P. Pearse, 2000. Leaf diseases of durum wheat in Saskatchewan in1999. Can. Plant Dis. Surv. 80: 52-53. (http://res2.agr.ca/london/pmrc/pmrchome.html)
Fernandez, M.R., M.J. Celetti, and G. Hughes. 1999. Leaf diseases of common and durum wheat inSaskatchewan in 1998. Can. Plant Dis. Surv. 79: 86-89. ( http://res2.agr.ca/london/pmrc/english/report/Disease99.html )

87
Table 1. Distribution and severity of leaf spotting diseases, and estimate of the percentage of flag leafarea colonized by leaf spotting fungi, in durum wheat fields in Saskatchewan in 2000.
CropDistrict
No. fields
surveyed
Meanseverity1
LEAF SPOT PATHOGENS
P. tritici-
repentis
S.nodorum
S. tritici
S. avenaef.sp.
triticea
C. sativus
1A 6 36 69 /62 3 /1 12 /1 2 /1 28 /62A 1 22 92 /1 1 - - 8 /12B 8 16 95 /7 1 - 11 /1 6 /43A-S 5 15 96 /5 - - 5 /1 5 /33B-N 8 10 91 /8 5 /2 16 /2 6 /2 2 /23B-S 2 8 100 /2 - 1 /1 - -4A 2 2 96 /2 - - - -4B 3 1 74 /3 22 /1 56 /1 - -5A 1 8 72 /1 11 /1 - - 17 /15B 3 7 91 /3 2 /1 24 /1 - -6A 4 47 94 /4 4 /2 8 /1 8 /1 -6B 4 9 92 /2 - 8 /1 18 /1 1 /17A 6 4 94 /6 16 /1 - 4 /1 3 /17B 1 2 33 /1 4 /1 8 /1 - 22 /18A 1 1 67 /1 - 8 /1 8 /1 15 /18B 1 10 99 /1 - - - 15 /1
Meant/total 56 12 88/56 7/10 16/10 8/9 13/23
1 percent flag leaf area infected.2 percent leaf area colonized by fungus / number of fields where it occurred.
88
CROP / CULTURE: Wheat
LOCATION / RÉGION: Manitoba and eastern Saskatchewan
NAME AND AGENCY / NOM ET ORGANISME:T. Fetch and B. McCallumCereal Research Centre, Agriculture and Agri-Food Canada, 195 Dafoe Road, Winnipeg MB,R3T 2M9 Telephone: (204) 983-1462; Facsimile: (204) 983-4604; email: [email protected]
TITLE / TITRE: STRIPE RUST OF WHEAT IN MANITOBA AND SASKATCHEWAN IN 2000
INTRODUCTION AND METHODS: During annual surveys of wheat fields for incidence and severity ofstem rust (Puccinia graminis Pers. f. sp. tritici Eriks. & E. Henn.) and leaf rust (Puccinia triticina Eriks.)conducted in July, August, and September 2000, stripe rust (P.striiformis Westend. f. sp. tritici), which isvery uncommon in Manitoba and Saskatchewan, was found in many wheat fields over a widegeographic area from eastern Manitoba to eastern Saskatchewan. Leaves infected with stripe rust werecollected to determine pathotypic specialization on appropriate sets of host differential lines.
RESULTS AND COMMENTS: Cool conditions and high humidity in Manitoba during June and Julywere favorable for stripe rust infection. Stripe rust severity in affected wheat fields was mostly at tracelevels. However, in one field of McKenzie wheat, severity was estimated at 5%. Genetic resistance tostripe rust infection is variable among wheat cultivars recommended for Manitoba and Saskatchewan. In 2000 a significant percentage of cereal fields in eastern Manitoba were sprayed with fungicide for thecontrol of foliar and head diseases, and these fungicides also will control the rust pathogens. Late-planted fields had little or no infection due to higher daily temperatures that inhibit stripe rust infection.
Stripe rust is a disease that is favored by low (10°C) temperatures and is usually found in the PacificNorthwestern region of North America on spring-sown crops. Yield losses exceeding 70% in susceptiblewheat cultivars due to stripe rust infection have been reported in the Pacific Northwest (Line andQayoum, 1991). Stripe rust overwinters in northwestern and southern USA. In the winter of 1999-2000,unusually high amounts of stripe rust were found in the southern and southeastern USA and the rustprogressed northward during the spring and summer (Hughes, 2000). Due to unusually coolenvironmental conditions and higher than average amounts of inoculum coming into the region, striperust was commonly found in wheat fields and experimental plots in the Upper Midwestern region of theUSA and in southeastern Manitoba. Higher temperatures in late July and early August reduced oreliminated further spread and infection of stripe rust. In past years, under more normal environmentalconditions, stripe rust was not a threat to wheat production in Manitoba and Saskatchewan. If stripe rustbecomes a serious perennial problem in this region it will be important to determine the relativesusceptibility of the currently registered wheat cultivars and emphasize stripe rust resistance in futurecultivars.
REFERENCES:Hughes, M. 2000. 2000 Cereal rust bulletin final, August, 2000. ( http://www.crl.umn.edu/crb/2000crb/00CRBfin.html )
Line, R. F. and Qayoum, A. 1991. USDA Tech. Bull. 1788.

89
CROP / CULTURE: Wheat
LOCATION / RÉGION: Manitoba and eastern Saskatchewan
NAME AND AGENCY / NOM ET ORGANISME:J. Gilbert, A. Tekauz, J. Gold, R. Kaethler, E. Mueller, U. Kromer, K. Morgan and A. DiCarloCereal Research Centre, Agriculture and Agri-Food Canada, 195 Dafoe Road, Winnipeg MB,R3T 2M9 Telephone: (204) 983-0891; Facsimile: (204) 983-4604; e-mail: [email protected]
TITLE / TITRE: 2000 FUSARIUM HEAD BLIGHT SURVEY OF SPRING WHEAT IN MANITOBA ANDEASTERN SASKATCHEWAN
INTRODUCTION AND METHODS: Spring wheat fields were surveyed for fusarium head blight (FHB) insouthern Manitoba and south-eastern Saskatchewan between 24 July and 3 August 2000. Theincidence and severity of FHB in 126 fields were assessed by sampling 50 to 100 wheat heads at threelocations in each field between watery-ripe and medium dough stages of development (average Zadoksgrowth stage 79.8). Up tp 30 kernels per field from sampled heads were surface-sterilized andincubated on potato dextrose agar under continuous cool white light for 4-5 days to identify the Fusariumspecies present . When more than one Fusarium species were present, single spores were grown oncarnation leaf agar or synthetic nutrient agar to facilitate identification. The FHB index was calculated asfollows: Average incidence X Average severity/100.
RESULTS AND COMMENTS: The disease was present in 96 % of fields. The average FHB index was7.9%, but the disease was not uniform across the region. The most severely affected areas were theRed River Valley north and south of Winnipeg, and further west as far as Portage between Hwys 1 and 2where the average index was 10.8%. Many fields had an FHB index of 20-30% and in one field it was ashigh as 47%. Western Manitoba, including fields near Hwy 3, close to the US border, from Manitou toMelita, and south-eastern Saskatchewan, had low levels of the disease, averaging an FHB Index of3.5% with a range from 0.1 to 29%. This was in contrast to 1999 when the most severe levels of FHBwere found in the Russell area close to the Saskatchewan border. The predominant pathogen wasFusarium graminearum, comprising over 96% of the isolations (Table 1). Other species found includedF. sporotrichioides, F. equiseti, F.avenaceum, and F. culmorum. Yield and quality/grade losses wererelatively high in central Manitoba in 2000. The majority of fields surveyed were of common wheat. Provincial reports indicate durum wheat fields in south-western Manitoba also were severely affected byFHB. These fields may have been at too early a growth stage to be selected in the survey and,therefore, the subsequent severity of the problem was not recognized.
Table 1. Percent Fusarium species isolated from spring wheat in southern Manitoba in 2000.
FUSARIUM SPP. PERCENT ISOLATED
F. graminearum 96.6F. sporotrichioides 0.6F. equiseti 0.1F. avenaceum 0.6F. culmorum 0.3Unknown 1

90
CROP / CULTURE: Wheat
LOCATION / RÉGION: Manitoba and eastern Saskatchewan
NAME AND AGENCY / NOM ET ORGANISME:J. Gilbert, A. Tekauz, J. Gold, R. Kaethler, U. Kromer, K. Morgan, E. Mueller and A. DiCarlo.Cereal Research Centre, Agriculture and Agri-Food Canada, 195 Dafoe Road, Winnipeg MB,R3T 2M9 Telephone: (204) 983-0891; Facsimile: (204) 983-4604; e-mail: [email protected]
TITLE / TITRE: SURVEY OF LEAF SPOT DISEASES OF WHEAT IN MANITOBA - 2000
INTRODUCTION AND METHODS: Spring wheat fields were surveyed for leaf spot diseases insouthern Manitoba and south-eastern Saskatchewan between July 24 and August 3, 2000. Leaveswere collected from 137 spring wheat fields (mostly common wheat) between watery-ripe and soft doughstages of development. Severity of disease on upper and lower leaves was categorized as 0, trace, 1, 2,3 or 4, with 4 describing dead leaves and 1 lightly affected. Samples of diseased leaf tissue weresurface-sterilized and placed in moisture chambers for 5-7 days to promote pathogen sporulation fordisease identification.
RESULTS AND COMMENTS: Higher than average rainfall in July and August favoured development ofleaf spot diseases, which were moderate to severe in southern Manitoba. Foliar fungicides were widelyused in 2000 and disease on the upper leaves was either moderately severe, rating 2.5 to 4, or light,rating trace to 1. Lower leaves were mostly senesced at the time the fields were surveyed. Septoriatritici blotch, caused by Mycosphaerella graminicola, occurred in 93 % of fields and accounted for 48.7 %of isolations of pathogenic fungi from foliar lesions (Table 1). Prevalence and severity of tan spot,caused by Pyrenophora tritici-repentis was higher than in 1999. The pathogen was found in 74% offields, and comprised 20.3 % of fungal isolations. Spot blotch, caused by Cochliobolus sativus had thethird highest prevalence and severity. It was isolated from 71% of fields and accounted for 15.1% ofisolations. As in past years Septoria avenae was the least commonly isolated leaf spot pathogen, butwas found at higher levels than in previous years. Stagonospora nodorum blotch, caused byPhaeosphaeria nodorum was found in 25% of fields and comprised 8.3 % of isolations; therefore bothprevalence and severity were lower than in 1999. Other pathogenic fungi isolated from the leaf tissueincluded Platyspora pentamera, cause of Platyspora leafspot, Fusarium equiseti, F. graminearum and F.sporotrichioides. These were all found at low levels and comprised less than 4% of the total isolations.
Table 1. Prevalence and isolation frequency of leaf spot pathogens in 137 fields of common wheat inManitoba and south-eastern Saskatchewan in 2000.
DISEASE
Septoria spp. (Septoria blotches) Cochliobolussativus
Spot blotch
Pyrenophoratritici-repentis
Tan spotS. nodorum S. tritici S. avenae
Prevalence (% fields)
70 93 25 71 74
Isolations(%)
8.3 48.7 3.7 15.1 20.3
91
CROP / CULTURE: Wheat
LOCATION / RÉGION: Saskatchewan
NAME AND AGENCY / NOM ET ORGANISME:G.R. Hughes1, M.R. Fernandez2 and P.G. Pearse3
1Department of Plant Sciences, University of Saskatchewan, Saskatoon, SK, S7N 5A82Agriculture and Agri-Food Canada, Semiarid Prairie Agricultural Research Centre, P.O. Box1030, Swift Current, SK, S9H 3X23Saskatchewan Agriculture and Food, 3085 Albert St., Regina, SK, S4S 0B1
TITLE / TITRE: LEAF DISEASES OF COMMON WHEAT IN SASKATCHEWAN IN 2000
INTRODUCTION AND METHODS: A survey for leaf diseases of common wheat was conducted infields randomly selected from each crop district (CD) in Saskatchewan. Ten flag and ten penultimateleaves were collected at random from 134 common wheat (CWRS, CPS and CWES classes) fields atthe late-milk to dough stages of development. The percent leaf areas covered by leaf spots and leaf rustwere recorded for each leaf, and an average percent severity calculated for each CD. Identification andquantification of leaf spotting pathogens was done by plating surface-sterilized leaf pieces on water agarfrom leaves selected from most field samples and estimating the relative prevalence of each pathogenidentified for each leaf examined. An average percent prevalence was then calculated for each CD.
RESULTS AND COMMENTS: Leaf spot diseases were found in all fields surveyed (Table 1). Althoughinfection levels of flag leaves for individual fields ranged from ‘trace’ (1-5 % severity) to ‘severe’ (>50 %severity), severity in most fields was slight to moderate. Average leaf spot severity on the flag leavestended to be highest in the north-eastern and central regions of the province (CDs 2B, 5B, 6B, 8A, 8B). This pattern was similar to that in 1999, although leaf spot severities were lower in 2000. Leaf rustoccurred mainly in the south-eastern and east-central regions of the province (CDs 1A, 1B, 2A, 2B and5A) and at trace to slight levels, a severity considerably lower than in 1999.
As in 1999, the most prevalent leaf spot disease was tan spot (Pyrenophora tritici-repentis), both in thenumber of fields where it was present and its relative frequency on infected leaves (Table 2). This wasfollowed by the septoria leaf spot complex (Septoria tritici, Stagonospora nodorum and S. avenae f. sp.triticea). While S. nodorum occurred through the province, it was most common in the central andnorthern regions of the province. S. tritici likewise occurred throughout the province, but was moreprevalent than S. nodorum. This distribution of the septoria leaf spot pathogens was the reverse of thatfound in 1999 and likely resulted from cool weather conditions in the summer of 2000, which favouredS. tritici. Spot blotch (Cochliobolus sativus) also occurred throughout the province, but at relatively lowlevels.
We gratefully acknowledge the participation of Saskatchewan Agriculture and Food extensionagrologists in this survey, and financial support from the Saskatchewan Agriculture Development Fund.

92
Table 1. Distribution and severity of leaf spot diseases and leaf rust in common wheat in Saskatchewanfields surveyed at the late milk to dough stages in 2000.
CropDistrict
LEAF SPOTS LEAF RUST
No. fields affected/surveyed
Severity 1
(%)No. fields affected/
surveyedSeverity
(%)
1A 5 /5 12 5 /5 28
1B 7 /7 7 5 /7 12
2A 5 /5 7 3 /5 2
2B 10 /10 18 1 /10 Trace
3A-N 1 /1 8 1 /1 Trace
3A-S 4 /4 8 1 /4 Trace
3B-N 4 /4 5 0 /4
3B-S 3 /3 2 0 /3
4A 1 /1 2 0 /1
5A 6 /6 9 2 /6 Trace
5B 9 /9 21 0 /9
6A 7 /7 13 0 /7
6B 9 /9 38 0 /9
7A 5 /5 3 0 /5
7B 8 /8 2 0 /8
8A 15 /15 21 0 /15
8B 4 /4 46 0 /4
9A 9 /9 16 0 /9
9B 18 /18 15 0 /18
Total 134 /134 18 /134
Mean 13
1 Percent flag leaf area infected.
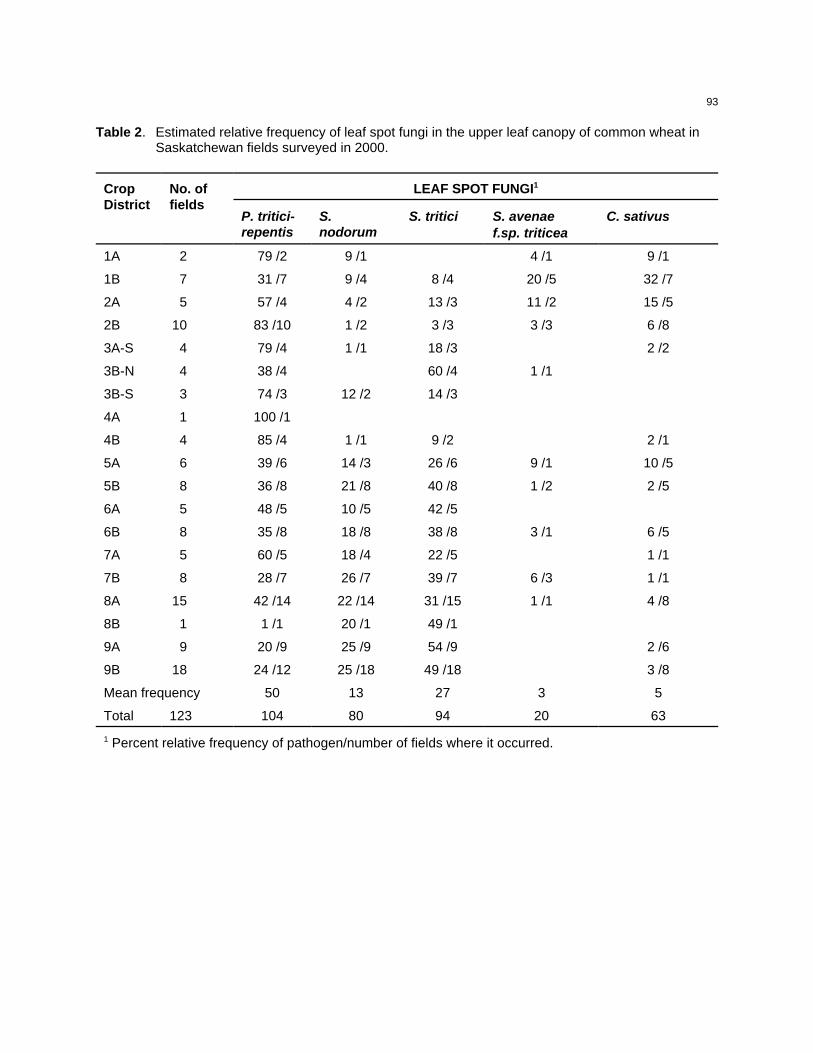
93
Table 2. Estimated relative frequency of leaf spot fungi in the upper leaf canopy of common wheat inSaskatchewan fields surveyed in 2000.
CropDistrict
No. offields
LEAF SPOT FUNGI1
P. tritici-repentis
S.nodorum
S. tritici S. avenaef.sp. triticea
C. sativus
1A 2 79 /2 9 /1 4 /1 9 /1
1B 7 31 /7 9 /4 8 /4 20 /5 32 /7
2A 5 57 /4 4 /2 13 /3 11 /2 15 /5
2B 10 83 /10 1 /2 3 /3 3 /3 6 /8
3A-S 4 79 /4 1 /1 18 /3 2 /2
3B-N 4 38 /4 60 /4 1 /1
3B-S 3 74 /3 12 /2 14 /3
4A 1 100 /1
4B 4 85 /4 1 /1 9 /2 2 /1
5A 6 39 /6 14 /3 26 /6 9 /1 10 /5
5B 8 36 /8 21 /8 40 /8 1 /2 2 /5
6A 5 48 /5 10 /5 42 /5
6B 8 35 /8 18 /8 38 /8 3 /1 6 /5
7A 5 60 /5 18 /4 22 /5 1 /1
7B 8 28 /7 26 /7 39 /7 6 /3 1 /1
8A 15 42 /14 22 /14 31 /15 1 /1 4 /8
8B 1 1 /1 20 /1 49 /1
9A 9 20 /9 25 /9 54 /9 2 /6
9B 18 24 /12 25 /18 49 /18 3 /8
Mean frequency 50 13 27 3 5
Total 123 104 80 94 20 63
1 Percent relative frequency of pathogen/number of fields where it occurred.
94
CROP / CULTURE: Wheat
LOCATION / RÉGION: Manitoba and eastern Saskatchewan
NAME AND AGENCY / NOM ET ORGANISME:B. McCallum, P. Seto Goh and B. MulockCereal Research Centre, Agriculture and Agri-Food Canada, 195 Dafoe Road, Winnipeg MB,R3T 2M9 Tel: (204) 983-0771; Facsimile: (204) 983-4604; email: [email protected]
TITLE / TITRE: LEAF RUST OF WHEAT IN WESTERN CANADA IN 2000
INTRODUCTION AND METHODS: Nurseries and commercial fields of wheat in Manitoba and easternSaskatchewan were surveyed for the incidence and severity of leaf rust (Puccinia triticina Eriks.) duringJuly and August 2000. Infected leaf samples were collected for pathotype identification by inoculatingspores collected from these leaves onto a set of 16 single gene differential host lines.
RESULTS AND COMMENTS: Wheat leaf rust was widespread but relatively light throughout Manitobaand eastern Saskatchewan during the 2000 crop season. Leaf rust infections were first noticed inManitoba on June 14 but cool wet weather slowed the spread and development of the disease duringlate June and early July. In many parts of Manitoba seeding was done earlier than usual, in late Apriland early May, so much of the wheat crop was reaching maturity in late July and early August. Theseearly seeded fields avoided intense leaf rust pressure because they were mature before the diseasedeveloped extensively. Increased use of foliar fungicides in 2000 also decreased the incidence of leafrust from that in previous years. In surveys done during the last week of July and the first week ofAugust leaf rust was found in most fields, but cultivars such as AC Cora and McKenzie continued toshow high levels of resistance. Yield losses were not significant in most fields but late seeded fields ofsusceptible cultivars may have suffered yield losses in the 5-10% range.
The predominant pathotypes of P. triticina isolated from Manitoba and Saskatchewan were MBDS,TGBJ, and THBJ, similar to 1999. Evaluation of isolates from other parts of Canada is in progress.

95
CROP / CULTURE: Winter wheat
LOCATION / RÉGION: Saskatchewan
NAME AND AGENCY / NOM ET ORGANISME:W. McFadden-SmithDepartment of Biological Sciences, Brock University, St. Catharines ON, L2S 3A1Telephone: (905) 688-5550 Ext. 3388; Facsimile: (905) 688-1855; e-mail:[email protected]
TITLE/ TITRE: FUNGI ISOLATED FROM CROWNS OF WINTER WHEAT IN SASKATCHEWAN,1987.
INTRODUCTION AND METHODS: (Note that this report presents data from 1987 not publishedpreviously. It is of interest and potential relevance because of the current focus on Fusarium fungi,particularly the mix of species occurring in the prairie provinces prior to the contemporary epidemic offusarium head blight in Manitoba and parts of Saskatchewan - Ed.)
In July, 1987, 40 plants (cv. Norstar) were collected from each of 49 winter wheat fields throughoutSaskatchewan. A diamond-shaped sampling pattern was used, with each side being approximately 40 m in length. Leaves and roots were removed from crowns. Crowns were rinsed under running water for 1hour then surface sterilized (15 sec. 100% ethanol, 45 sec. 10% commercial bleach, and 2 x1 minutesterile distilled water rinses). Subsequently, one tiller was plated on minimal medium to determine thespectrum of fungi present, and a second tiller was plated on Nash Snyder medium (2). After 10 days ofincubation at room temperature, putative Fusarium colonies were transferred to potato dextrose agar in9 cm diameter petri plates and grown for 10 days at room temperature. Plugs from non-sporulatingcultures were transferred to carnation leaf agar medium (1) and grown under ultraviolet light at 20 C for2 weeks. The original non-sporulating cultures were ‘slashed’ to stimulate sporulation (in the case ofFusarium avenaceum). Sporulating colonies were identified to species according to spore morphologyand colony morphology, pigmentation and rate of growth (fast growing isolates grew to the edge of theplate within 10 days).
RESULTS AND COMMENTS: The most frequent fungi present on crowns plated on minimal mediumwere Fusarium spp. Bipolaris sorokiniana and the opportunistic fungi Penicillium spp. and Alternariaspp. were also found in low frequencies. Fusarium acuminatum was present in crowns at all sitessampled. Fusarium culmorum, F. poae, F. oxysporum and F. equiseti were isolated from 29, 10, 14 and92 % of the fields, with equal distribution across the province. Fusarium avenaceum was present in 37%of the fields, with the majority of these being in the northern part of the province in the gray-black soilzone.
REFERENCES:1. Fisher, N.L., L.W. Burgess, T.A. Toussoun and P.E. Nelson. 1982. Carnation leaves as a substrateand for preserving cultures of Fusarium species. Phytopathology 72:151-153.
2. Nash, S.M. and W.C. Snyder. 1962. Quantitative estimations by plate counts of propagules of thebean root rot Fusarium in field soils. Phytopathology 52:567-572.

96
CROP / CULTURE: Wheat
LOCATION / RÉGION: Ontario
NAME AND AGENCY / NOM ET ORGANISME:L. Tamburic-Ilincic and A. SchaafsmaRidgetown College, University of Guelph, Ridgetown ON, N0P 2C0Telephone: (519) 674-1611; Facsimile: (519) 674-1600, e-mail: [email protected]
TITLE / TITRE: FUSARIUM HEAD BLIGHT SURVEY OF WINTER WHEAT IN 2000 IN ONTARIO
INTRODUCTION AND METHODS: Winter wheat fields were randomly selected at harvest on farmsacross southern Ontario. Mature wheat spikes were harvested using hand shears from 10 areas ofapproximately 2m2 close to the center of each field. The spikes were threshed with an Almaco stationaryplot thresher (model VPT-OSC). Deoxynivalenol (DON) was extracted from a 20-g subsample in 100 mLof methanol and water (1:9), and quantified with the commercial preparation EZ-Quant DON Plate Kit(Beacon Analytical Systems, Inc., Scarborough, ME). The limit of detection was 0.2 ppm. Sixty kernelsper field were surface-sterilized in 0.16% NaOCl (diluted commercial bleach) for three minutes, air driedand placed on acidifed potato dextrose agar. The agar plates were incubated for seven days under a12:12 hr light/dark cycle, at room temperature. Fusarium colonies were subsequently transferred tocarnation-leaf agar, and incubated as above. Species identification was based on Nelson et al. (1983)and Burgess et al. (1988).
RESULTS AND COMMENTS: The highest percentage of F. graminearum, and DON content (ppm)were observed in Grey county (averaging 18.9 %, and 3.4 ppm), followed by Lambton, Middlesex,Essex, and Kent counties (Table 1). Fusarium head blight was present in 91 % of the fields examined.Fusarium graminearum was the predominant species followed by F. poae, F. sporotrichioides, F.subglutinans. Based on these results, fusarium head blight caused significant losses in Ontario in 2000.By contrast, in 1999 only trace levels of F. graminearum and DON were detected (data not shown).
REFERENCES:Burgess, L.W., C. Liddell and B.A. Summerell.1988. Laboratory manual for Fusarium research.University of Sydney, Sydney N.S.W. 156 pp.
Nelson, P.E., T.A. Toussoun and W.F.O. Marasas. 1983. Fusarium species. An illustrated manual foridentification. The Pennsylvania State University Press, University Park and London. 193 pp.

97
Table 1. DON content (ppm) and percent Fusarium species isolated from winter wheat in 2000 inOntario.
County No. offields
examined
DON(ppm)
PERCENT FUSARIUM SPECIES ISOLATED
F. gram.(%)
F. poae(%)
F. spor.(%)
F. subg. (%)
Fusariumspp. (%)
Essex 9 0.5 3.9 0.4 0.4 0 0.2
Kent 2 1.5 1.7 0.9 0.9 0.9 0
Lambton 14 1.6 6.5 0.6 0.2 0.1 0
Middlesex 10 1.4 5.2 0.2 0.5 0.2 0
Grey 3 3.4 18.9 0.6 3.9 0 0

98
CROP / CULTURE: Winter Wheat
LOCATION / RÉGION: Manitoba
NAME AND AGENCY / NOM ET ORGANISME:A. Tekauz, J. Gold, M. Idris, M. Beyene, M. Stulzer, E. Nedohin and B. GeoffroyCereal Research Centre, Agriculture and Agri-Food Canada, 195 Dafoe Road, Winnipeg MB,R3T 2M9 Telephone: (204) 983-0944; Facsimile: (204) 983-4604; e-mail: [email protected]
TITLE / TITRE: FUSARIUM HEAD BLIGHT OF WINTER WHEAT IN MANITOBA IN 2000
INTRODUCTION AND METHODS: The occurrence of fusarium head blight (FHB) in winter wheat insouthern Manitoba was assessed by surveying 47 farm fields from July 13 to 23, 2000. Because winterwheat is not widely grown in Manitoba (in 2000 it was planted on about 2% of the total wheat acreage -Manitoba Crop Insurance Corp.) the fields were not surveyed at random; rather, their locations werespecified by Manitoba Agriculture extension personnel and confirmed by contacting producers. Fusarium head blight in each field was assessed by rating a minimum of 80-100 plants at each of 3locations for percentage of infected spikes (disease incidence), and for the average proportion of thehead affected (severity). Disease levels were calculated as the ‘FHB Index’ (% incidence x % severity /100). Ten affected heads closest to each of the 3 plant clumps sampled were collected from eachlocation, placed in plastic bags and frozen. Subsequently, 50 seeds from blighted portions of heads weresurface-sterilized in 0.3% NaOCl for 3 min., air-dried, and plated onto potato dextrose agar to quantifyand identify the Fusarium spp. present.
RESULTS AND COMMENTS: Conditions initially were cool and relatively dry, and unfavourable fordevelopment of FHB in Manitoba, but by mid-June frequent and above-normal levels of rain ensued, andpersisted for the remainder of the growing season. Winter wheat normally flowers earlier than spring-seeded crops, and because of this is considered to escape FHB infection in some years. Despiteapparent adequate moisture when winter wheat headed/flowered in 2000, levels of FHB in the crop wererelatively low. Possibly, inoculum was not yet abundant due to prior cooler and drier conditions.
Of the 47 fields surveyed, six had no plants with visible symptoms of FHB. Overall, incidence of FHBwas 8.2% (range 0 - 40%), severity 13.6% (range 0 - 38%) and the FHB Index 1.6% (range 0 - 15.2%). As such, FHB was estimated to have caused yield losses in commercial winter wheat of about 0.5%. This yield loss is considerably lower than that estimated in 1998, but higher than that in 1999 (Tekauz etal. 2000).
The Fusarium spp. and their levels on seed are listed in Table 1. As has been normal for all types ofwheat grown in Manitoba, F. graminearum was the principal pathogen.
REFERENCES:Tekauz, A., J. Gold, J. Gilbert, M. Idris, M. Stulzer, M. Beyene and S. Ramanciauskas. 2000. Fusariumhead blight in winter wheat in Manitoba in 1999. Can. Plant Dis. Surv. 80:66. (http://res2.agr.ca/london/pmrc/ pmrchome.html)

99
Table 1. Fusarium spp. isolated from Manitoba winter wheat kernels in 2000.
FUSARIUM SPP. PERCENT OF FIELDS PERCENT OF KERNELS
F. graminearum 87.2 84.4
F. avenaceum 27.7 1.1
F. poae 12.8 0.3
F. sporotrichioides 10.6 0.4
F. equiseti 4.3 0.1
F. culmorum 6.4 0.3
100
CROP / CULTURE: Winter wheat
LOCATION / RÉGION: Manitoba
NAME AND AGENCY / NOM ET ORGANISME:A. Tekauz, J. Gold, J. Gilbert, E. Mueller, M. Idris, M. Stulzer, M. Beyene and B. GeoffroyCereal Research Centre, Agriculture and Agri-Food Canada, 195 Dafoe Road, Winnipeg MB,R3T 2M9 Telephone: (204) 983-0944; Facsimile: (204) 983-4604; e-mail:[email protected]
TITLE / TITRE: LEAF SPOTS OF WINTER WHEAT IN MANITOBA IN 2000
INTRODUCTION AND METHODS: Foliar diseases of winter wheat in Manitoba were assessed bysurveying 47 farm fields from July 13 to 23, when crops were at the early milk to soft dough stage (ZGS68-86). Because winter wheat occupies a small acreage in Manitoba (in 2000 it was planted on about2% of the total wheat acreage - Manitoba Crop Insurance Corp.) the farm fields were not surveyed atrandom; rather, their locations were specified by Manitoba Agriculture extension personnel andconfirmed by contacting producers. Fields surveyed were located in southern Manitoba, in the areabounded by Hwy #16 and the US border, Brandon in the west and Dugald to the east. Disease severitywas recorded by sampling approximately 10 plants along a diamond-shaped transect of about 50 m perside, beginning near the field edge. Severity ratings were taken on both the upper (usually the flag leaf)and lower leaf canopies, using a six-category scale: 0 or nil (no visible symptoms); trace (<1% leaf areaaffected); very slight (1-5%); slight (6-15%); moderate (16-40%); and severe (41-100%). Infected leaveswith typical symptoms were collected at each site and dried and stored in paper envelopes. Surface-sterilized pieces of infected leaf tissue were placed in moist chambers for 3-5 days to identify the causalpathogen(s) and determine the disease(s) present.
RESULTS AND COMMENTS: Conditions in Manitoba in 2000 were generally cool and dry in the earlypart of the growing season (to early June) and then became warmer and quite wet. Thus, winter wheatand early-seeded spring crops suffered relatively little damage from leaf spots, compared to cropsseeded later, which evolved for a longer period during conditions more conducive to leaf spotdevelopment.
Leaf spots were observed in the upper and/or lower leaf canopies of all winter wheat fields surveyed.Disease severities in the upper canopy were nil, trace or very slight in 21 % of fields, slight in 45%,moderate in 17%, severe in 8% and senescent in 9%. Respective severity categories in the lowercanopy were tabulated as 2%, 15%, 21%, 7% and 55%. Based on disease development in the uppercanopy (>60% of fields with only trace to moderate leaf spotting), foliar diseases in winter wheat in 2000caused little damage, likely less than a 2% yield loss. This is less damage than observed in 1999. Spotblotch, caused by Cochliobolus sativus, and tan spot, caused by Pyrenophora tritici-repentis, were themost prevalent diseases (Table 1), but the contribution of tan spot to the leaf spot complex wasconsiderably lower than found in 1999 (Tekauz et al. 2000).
REFERENCES:Tekauz, A., et al. 2000. Leaf spots of winter wheat in Manitoba in 1999. Can. Plant Dis. Surv. 80: 67. ( http://res2.agr.ca/london/pmrc/ )

101
Table 1. Prevalence and isolation frequency of leaf spot pathogens of winter wheat in Manitoba in 2000
PATHOGEN PREVALENCE (% OF FIELDS) DAMAGE (% OF ISOLATIONS)
Cochliobolus sativus 31.9 46.4
Pyrenophora tritici-repentis 21.3 25
Stagonospora nodorum 12.8 16.1
Septoria tritici 8.5 8.9
Septoria avenae f.sp. triticea 4.3 3.6

102
Oilseeds and special crops/oléagineux et cultures spéciales
CROP: Canola
LOCATION: Alberta
NAME AND AGENCY:D. Benard1, R.M. Lange1 and L.M. Harrison2
1Alberta Research Council, Bag 4000, Vegreville, AB T9C 1T42Alberta Agriculture, Food and Rural Development, Box 29, Beaverlodge, AB T0H 0C0
TITLE: SURVEY OF FUSARIUM WILT AND OTHER CANOLA DISEASES IN ALBERTA, 2000
METHODS: A total of 90 Brassica fields, most of which were B. napus (except as noted), weresurveyed between August 2 and August 24 in the important canola production areas of Alberta, includingthe north Peace (20 fields), south Peace (30), central (10), east central (19), and south (11). The fieldswere surveyed before swathing, mostly at crop growth stages 5.1 to 5.3 (Harper and Berkenkamp,1975). Disease assessments were made by rating 100 randomly selected plants from each field. Thepresence or absence of lesions on each plant was determined to give percent disease incidence for thefollowing diseases: sclerotinia stem rot (Sclerotinia sclerotiorum), blackleg (Leptosphaeria maculans),fusarium wilt (Fusarium spp.), foot rot (Fusarium spp., Rhizoctonia solani), brown girdling root rot(Rhizoctonia solani), aster yellows (AY phytoplasma), and staghead (Albugo candida). For sclerotiniastem rot, each plant was scored for either a main stem lesion or an upper stem or pod lesion. Foralternaria pod spot, (Alternaria brassicae, A. raphani), the percent severity of lesions on the pods of eachplant was assessed (Conn et al., 1990). If alternaria pod spot was observed in a field, but at a levelestimated to be below 1%, the disease was recorded as a “trace”. When other diseases were observedin a field, but not in the sample of 100 plants, the disease was also recorded as a “trace”. Whencalculating means, all trace values were recorded as 0.1%. The results for each region were combinedand mean disease incidence or severity values were determined.
RESULTS AND COMMENTS: Fusarium wilt was observed in 14 of the 90 fields, and incidence valuesranged from 0 to 72%. Mean incidence was by far the highest in the east central area while no fusariumwilt was reported in the south or the south Peace (Table 1). Plants with symptoms of both fusarium wiltand blackleg were observed in two fields in the Medicine Hat area; these plants were not included in thecalculations of fusarium wilt incidence due to the difficulty in reliably distinguishing symptoms. Theprovincial average was 2.0%. This disease was first reported in 1999 (Lange et al., 2000), and theincidence observed this season represents a potential spread that should be watched closely.
Sclerotinia stem rot was observed in 68 of the 90 fields and incidence values ranged from 0 to 53% formain stem lesions and from 0 to 67% for upper stem/pod lesions. Mean incidence was highest in theeast central region and lowest in the south, where there was no sclerotinia reported (Table 1). Theprovincial average was 7.3% for main stem lesions and 5.4% for upper stem/pod lesions.
Blackleg was found in 38 of the 90 fields and incidence values ranged from 0 to 66%. Mean incidencewas by far the highest in the east central area, while values in all other areas were low (Table 1). Theprovincial average incidence was 5.6%. In at least two fields, a moderately resistant cultivar was foundto have a high or fairly high level of blackleg. In a field near Sedgewick, 66% of cv. LG3345 plants ratedhad blackleg lesions, while a cv. Quest field near Ryley (Vegreville area) showed a 26% incidence ofblackleg.

103
Foot rot was observed in 17 of the 90 fields, and incidence values ranged from 0 to 47%. Meanincidence was highest in the central region followed by the east central region and lowest in the southPeace, where none was reported (Table 1). The provincial average was 1.6%.
Brown girdling root rot was highest in the Peace, with the north Peace higher (14%) than the southPeace (11%), but negligible (0.2% or less) in the rest of the province (Table 1). It was found in 53 of the90 fields, and incidence values ranged from 0 to 36%.
Aster yellows was observed in 22 of the 90 fields, with incidence values ranging from 0 to 12%, althoughall but one field (near Vegreville) showed values of 3% or less. Low values across the province gave aprovincial average of only 0.3%; however, general field observations indicated that aster yellows wasmore prevalent in 2000 than in previous years. An unusually high amount of purpling of canola wasnoticed in many fields across the province. Preliminary tests indicate that this might be related to asteryellows infection, but further testing is required.
Staghead was found in 15 of the 90 fields, with incidence values ranging from 0 to 20% and a provincialaverage of 0.6%. Usually the fields either contained B. rapa, or the staghead was on volunteer B. rapain B. napus fields. Two B. rapa fields near Beaverlodge showed significant levels (20% each). Thesouth Peace had the only incidence over 1%, with a 1.6% value.
Alternaria pod spot was found in 57 of the 90 fields. The highest severity (8%) was found in a field nearBonnyville. The provincial average was 0.4%, indicating that alternaria severity levels were belowaverage in 2000.
REFERENCES:
Conn, K.L., J.P. Tewari, and R.P. Awasthi. 1990. A disease assessment key for Alternaria black spot inrapeseed and mustard. Can. Plant Dis. Surv. 70:19-22.
Harper, F. R., and B. Berkenkamp. 1975. Revised growth-stage key for Brassica campestris and B.napus. Can. J. Plant Sci. 55:657-58.
Lange, R. M., L. M. Harrison, and P. D. Kharbanda. 2000. A new Fusarium wilt of canola in Alberta,Canada in 1999. Abstracts of papers presented at joint meeting of Can. Phytopathol. Soc. and PacificDivision of Amer. Phytopathol. Soc., June 18-21, 2000, Victoria, BC, Canada, p. 25.

104
Table 1. Canola diseases in Alberta in 2000.
Region1
(No. offields)
% DISEASE INCIDENCE DISEASESEVERITY
%Sclerotinia2 Black-leg
Fusariumwilt
Footrot
Browngirdlingrot rot
Asteryellows
Stag-head
Main Upper/pod
North Peace
-20 8.7 4.6 T3 0.8 0.3 14 0.2 0.2 0.2
South Peace
-30 6.3 1.9 0.4 0 0 11 T 1.6 T
Central
-10 8.2 7.2 1.6 0.6 5.2 0.2 T T 0.3
East Central
-19 11 14 22.0 8.3 4.2 0.2 1.0 T 1.3
South
-11 0 0 2.1 0 0.4 6.9 0.3 0.6 0.4
Overall
-90 7.3 5.4 5.6 2 1.6 6.9 0.3 0.6 0.4
1 The regions surveyed included the following cities and towns: North Peace = Fairview, Grimshaw, Manning, Fort Vermilion, La Crete South Peace = Beaverlodge, Falher, La Glace, Nampa, Spirit River, Wanham, Eaglesham Central = Leduc, Stony Plain East Central = Bonnyville, Sedgewick, Vegreville South = Vulcan, Medicine Hat2 Sclerotinia stem rot lesions were scored either as a main stem lesion or as an upper stem/pod lesion.3 T = Trace amounts of disease (<0.1%) or disease was not found in the 100 plant samples but wasnoted in the field. Trace values were considered as 0.1% for calculating means.

105
CROP: Canola
LOCATION: Saskatchewan
NAME AND AGENCY:P.G. Pearse1, R.A.A. Morrall2, R. Kutcher3, M. Keri3, D. Kaminski4, R. Gugel5, K. Anderson5, C.Trail1, W. Greuel11 Saskatchewan Agriculture and Food, 3085 Albert St., Regina, SK S4S 0B12 Department of Biology, University of Saskatchewan, 112 Science Place, Saskatoon, SK S7N5E23 Agriculture and Agri-Food Canada, Box 1240, Melfort, SK S0E 1A04 702 Lansdowne Avenue, Saskatoon, SK S7N 1E55 Agriculture and Agri-Food Canada, 107 Science Place, Saskatoon, SK S7N 0X2
TITLE: SURVEY OF CANOLA DISEASES IN SASKATCHEWAN, 2000
METHODS: A total of 103 fields of Brassica napus were surveyed between August 14 and 23 in themajor canola production regions of Saskatchewan including the north-east (17), north-central (17), north-west (17), east-central (28), central (8) and south-east (16). Canola fields were surveyed beforeswathing and when the crop was between growth stages 5.2 and 5.3 (Canola Council of Canada). Disease assessments were made in each field by collecting 20 plants at each of 5 sites separated by atleast 20 m and 20 m from the edge of the field. The presence or absence of lesions on each plant wasdetermined to give percent disease incidence for the following diseases: sclerotinia stem rot (Sclerotiniasclerotiorum), blackleg (Leptosphaeria maculans), aster yellows (AY phytoplasma), and foot rot(Rhizoctonia, Fusarium). For sclerotinia stem rot, each plant was scored for either a main stem lesion oran upper branch/pod lesion. For blackleg, each plant was scored for either a severe basal stem cankeror any other type of blackleg stem lesion. For alternaria pod spot (Alternaria brassicae, A. raphani), thepercent severity of lesions on the pods of each plant was assessed. If alternaria pod spot was present ina field, but at a level estimated to be below 1%, the disease was recorded as a “trace”. Similarly, whenthe other diseases were observed in a field, but not in the sample of 100 plants, the disease wasrecorded as a “trace”. When calculating means, all trace values were counted as 0.1%. Field resultswere combined for each region and mean disease incidence or severity values were determined.
RESULTS AND COMMENTS: Sclerotinia stem rot was observed in 81 of the 103 fields surveyed andincidence values ranged from 0 to 44% for main stem lesions and from 0 to 52% for upper branch/podlesions. Mean incidence was highest in the north-central region, followed closely by the north-eastregion and lowest in the east-central and south-east regions (Table 1). The overall mean incidencevalues for the province were 8% main stem lesions and 6% upper branch/pod lesions, indicating a yieldloss to canola producers of approximately 7% (Morrall et al., 1984). Incidence values were lower in2000 than 1999 but were similar to most other years (Pearse et al. 2000; Canola Council of Canada;R.A.A. Morrall, unpublished data). Although weather conditions in some parts of the province wereconducive to sclerotinia stem rot, canola crops were generally less dense and lower yielding this seasonas a result of environmental stresses.
Blackleg was observed in 71 of the 103 fields surveyed. Mean incidence values ranged from 0 to 17%for basal stem lesions and 0 to 24% for lesions occurring elsewhere on the stem. Blackleg incidencevalues were highest in the north-west region, moderate in the north-central region and relatively lowelsewhere in the province (Table 1). The overall mean incidence values for the province were 1% forbasal stem cankers and 3% for lesions found elsewhere on the stem. Approximately 68% of blackleglesions were scored as occurring not as basal stem cankers but elsewhere on the stem, indicatinglimited impact on seed yield and quality.

106
Aster yellows was observed in 92 of the 103 fields surveyed. Overall mean incidence for the provincewas 1.6% (Table 1). Incidence ranged from 0 to 10%. Although aster yellows incidence was highest inthe north-central region, it was prevalent in all regions of the province surveyed. Aster yellowsincidences were slightly higher in 2000 and 1999 than in previous years. This suggests thatenvironmental conditions may have been favourable for the early and abundant migration of leafhoppersinto the province.
Foot rot was observed in 40 of the 103 fields surveyed. Disease incidence ranged from 0 to 14% withthe highest incidence in the north-east region, followed closely by the north-central and central regions(Table 1). The overall mean incidence for the province was 1.2%.
Alternaria pod spot was observed in 86 of the 103 fields surveyed but mostly at trace severity levels. The highest mean severity was observed in the south-east region (Table 1). In late summer, the south-east region experienced periods of high relative humidity, conditions that favour pod spot development. This survey was conducted before swathing so severity may have been lower than at harvest, when podspot development typically increases.
Fusarium wilt (Fusarium avenaceum) was confirmed in one sample collected in the south-east region(Lange et al., 2000). There were no reports of brown girdling root rot or staghead in any of the fieldssurveyed.
REFERENCES:Canola Council of Canada. ( http://www.canola-council.org/manual/Canolaframes.html )
Lange, R.M., L.M. Harrison and P.D. Kharbanda. 2000. A new fusarium wilt of canola in Alberta,Canada in 1999. Abstracts of papers presented at joint meeting of Can. Phytopathol. Soc. and PacificDiv. of Amer. Phytopathol. Soc., June 18-21, 2000, Victoria, B.C. p. 25.
Morrall, R.A.A., J. Dueck and P.R. Verma. 1984. Yield losses due to sclerotinia stem rot in westernCanadian rapeseed. Can. J. Plant Pathol. 6:265 (Abstr.).
Pearse, P.G., R.A.A. Morrall, 2000, R. Kutcher, D.A. Kaminski, L.J. Duczek, R.K. Gugel, S.R. Rimmer,R. Berard. 2000. Survey of canola diseases in Saskatchewan, 1999. Can. Plant Dis. Surv. 80:81-82. ( http://res2.agr.ca/london/pmrc/english/report/disease2000.html )

107
Table 1. Canola diseases in Saskatchewan in 2000.
REGION1
(NO. OFFIELDS)
MEAN % DISEASE INCIDENCES Mean %Severity
Sclerotinia2 Blackleg3 Asteryellows
Foot rot Alternariapod spotMain Upper Basal Other
North-east
-17 14 13 T4 1 1.9 1.8 0.3
North-central
-17 17 14 3 3 2.4 1.6 0.4
North-west
-17 3 3 4 7 0.6 1 0.3
East-central
-28 1 T T 3 1.7 0.4 0.9
Central
-8 8 8 1 3 1.3 1.6 0.1
South-east
-16 3 1 T 2 1.4 0.5 1.1
Overall Mean
-103 8 6 1 3 1.6 1.2 0.5
1 The Rural Municipalities (RM) surveyed in the major canola production regions included:North-east = RM 426, 427, 428, 456, 457, 458North-central = RM 429, 430, 459, 460, 461, 463, 464, 493North-west = RM 347, 379, 406, 437, 438, 470, 471East-central = RM 185, 214, 215, 216, 276, 277, 308, 336, 244, 247, 248, 279Central = RM 285, 313, 373, 342, 343, 403, 405South-east = RM 66, 67, 68, 96, 156, 159, 160, 187, 189
2 Sclerotinia stem rot lesions were scored as either a main stem lesion or as an upper branch/podlesion.
3 Blackleg lesions were scored as either a severe basal stem canker or as any other type of stemlesion.
4 T = trace amounts of disease (< 1%); or, were not found in the 100 plant sample but present in thefield. In calculating means, trace values are 0.1%.

108
CROP: Canola
LOCATION: Manitoba
NAME AND AGENCY: D.L. McLaren1, and R.G. Platford 21 Agriculture and Agri-Food Canada, Research Centre, Box 1000A, R.R.#3, Brandon, Manitoba, R7A 5Y32 Manitoba Agriculture and Food, Soils and Crops Branch, Box 1149, Carman, Manitoba, R0G 0J0
TITLE: DISTRIBUTION, PREVALENCE AND INCIDENCE OF CANOLA DISEASES INMANITOBA (2000)
METHODS: In August and September of 2000, 317 canola crops were surveyed in the eastern/interlake(56), southwest (101), northwest (78) and central (82) regions. All crops were Brassica napus. All cropswere assessed for the prevalence (percent crops infested) and incidence (percent plants infected percrop) of sclerotinia stem rot (Sclerotinia sclerotiorum), aster yellows (phytoplasma), staghead (Albugocandida), foot rot (Fusarium spp. and Rhizoctonia sp.), blackleg (Leptosphaeria maculans) and fusariumwilt (Fusarium spp.). Blackleg lesions that occurred on any part of the canola stem were assessedseparately from basal stem cankers. The prevalence and percent severity of alternaria pod spot(Alternaria spp.) was determined.
In each canola crop, 100 plants were selected in a regular pattern starting at a corner of the field or at aconvenient access point. The edges of the fields were avoided. Twenty plants were removed from eachof five points of a “W” pattern in the field. Points of the “W” were at least 20 paces apart. All plantswere pulled up, removed from the field and examined for the presence of diseases.
RESULTS: A number of diseases were present in each of the four regions of Manitoba. Sclerotinia stemrot and blackleg were the most prevalent diseases throughout the province (Table 1). The prevalence ofsclerotinia-infested crops ranged from a high of 92% in the southwest region to 68% in the eastern/interlake region with a provincial mean of 81%. This increased from a prevalence of 60% in 1999(McLaren and Platford, 2000). Mean disease incidence ranged from 15% in the southwest region to 8%in the eastern/interlake region. The provincial mean of 14% was greater than in 1999 and probablyresulted in about a 7% yield loss. In 2000, moist conditions during late June and July were favourablefor the development of sclerotinia stem rot and produced conditions that increased disease risk in manyareas.
Blackleg basal cankers occurred in 45% of the crops surveyed in 2000 with mean disease incidenceranging from 14% in the southwest region to 3% in the northwest region and a provincial mean of 9%.The average incidence was higher in 1999, with the highest value of 29% occurring in the southwestregion (McLaren and Platford, 2000). When blackleg was detected in the crops surveyed in 2000,severe symptoms were observed in many cases. These caused a yield loss estimated at about 5% on aprovince-wide basis.
The mean prevalence of blackleg stem lesions was less than during the last two field seasons, with72%, 66% and 54% of crops infested with stem lesions in 1998 (McLaren and Platford, 1999), 1999(McLaren and Platford, 2000) and 2000, respectively. The mean incidence in 2000 was 7%, similar tothat in 1999 (McLaren and Platford, 2000).
The severity of alternaria pod spot was low, with means of <3% in the southwest and northwest regions(Table 2). No alternaria was reported on the 100-plant samples from surveyed crops in the central andeastern/interlake regions. The highest prevalence (31%) occurred in the southwest region (Table 1). In

109
the northwest region, 22% of the crops surveyed for alternaria pod spot were infested. These valuesdecreased from prevalences of 97% in the southwest region and 95% in the northwest region in 1999.Although this disease was most prevalent in the western part of the province in both years, abovenormal precipitation was received in western and southwestern Manitoba in 1999.
The prevalence of aster yellows in the 2000 surveyed crops ranged from 70% in the southwest region to5% in the central region with a provincial mean of 40%. This decreased from a prevalence of 56% in1999 (McLaren and Platford, 2000). The average disease incidence was 2% in the central region and3% in all other regions.
Other diseases that were observed in the surveyed crops were foot rot (in 4% of fields) and staghead(on volunteer B. rapa) in 1% of the fields. The mean disease incidence for foot rot was below 5%. Thedisease incidence for staghead was always below 5%.
Fusarium wilt was observed for the first time in 1% of canola fields in Manitoba. The disease incidencewas below 5%.
REFERENCES:1. McLaren, D.L. and Platford, R.G. 1999. Distribution, prevalence and incidence of canola diseases inManitoba (1998). Can. Plant Dis. Surv. 79: 100-101.(http//res2.agr.ca/london/pmrc/report/disease99.html)
2. McLaren, D.L. and Platford, R.G. 2000. Distribution, prevalence and incidence of canola diseases inManitoba (1999). Can. Plant Dis. Surv. 80: 79-80. (http//:res2.agr.ca/london/pmrc/pmrchome.html)
ACKNOWLEDGEMENTS: We thank the Manitoba Canola Growers Association for financial supportand the Manitoba Crop Insurance Corporation for providing a database of canola fields. The assistanceof J.L Lamb in conducting this survey is also gratefully acknowledged as is the technical support of T.Henderson and B. Mitchell.

110
Table 1. Number of canola crops surveyed and disease levels in Manitoba in 2000 1.
CropRegion
No. ofcrops
surveyed
DISEASE LEVELS
Sclerotiniastem rot
Blackleg Asteryellows
Alternaria podspot
basal cankers stem lesions
P1 DI2 P DI P DI P DI P Mean %severity
E/I 56 68 8 50 7 64 10 16 3 0 0
Central 82 73 15 63 7 62 7 5 2 0 0
SW 101 92 15 52 14 55 6 70 3 31 2.6
NW 78 85 12 14 3 37 7 55 3 22 1.5
1 Staghead was observed in two fields in the southwest region; fusarium wilt was observed in two fieldsin the eastern/interlake region. Although not observed in the surveyed crops in this study, fusariumwilt was also noted in one field in the central region.
2 Mean percent prevalence.3 Mean percent disease incidence.
Table 2. Distribution of incidence (sclerotinia stem rot, blackleg, aster yellows, staghead1 and fusariumwilt) and severity (alternaria pod spot) classes in 317 crops of Brassica napus in Manitoba in2000.
PERCENTAGE OF CROPS WITH
Sclerotinia stem rot
Blackleg Alternariapod spot
Aster yellows
Staghead Fusariumwilt
basal stem
0 21 54 46 84 60 99 99
1-5% 27 26 34 14 36 1 1
6-10% 18 8 9 1 3 0 0
11-20% 17 7 7 1 1 0 0
21-50% 15 3 3 0 0 0 0
>50% 2 2 1 0 0 0 0
1 Plants with staghead were volunteer B. rapa.

111
CROPS: Chickpea
LOCATION: Saskatchewan
NAMES AND AGENCIES:R.A.A. Morrall1, B. Carriere2, S. Cronje3., D. Schmeling4 and L. Thomson5.
1 Department of Biology, University of Saskatchewan, 112 Science Place, Saskatoon, Saskatchewan,S7N 5E2. (Tel: 306-966-4410, Fax: 306-966-4461, email: [email protected])
2 Discovery Seed Labs Ltd., 450 Melville Street, Saskatoon, Saskatchewan, S7J 4M23 Priority Lab Services, Box 1180, Nipawin, Saskatchewan, S0E 1E04 Lendon Seeds Ltd., Box 10, Riceton, Saskatchewan, S0G 4E05 Saskatchewan Wheat Pool, Seed Quality Control, 102-407 Downey Road, Saskatoon, Saskatchewan,
S7N 4L8
TITLE: SEED-BORNE PATHOGENS OF CHICKPEA IN SASKATCHEWAN IN 2000
METHODS: The results of agar plate tests conducted by four Saskatchewan companies on seedsamples from the 2000 crop were summarized separately for kabuli and desi chickpea. The tests wereconducted mainly to detect the pathogens causing ascochyta blight (Ascochyta rabiei), botrytis blight[grey mould] (Botrytis cinerea) and sclerotinia stem and pod rot (Sclerotinia sclerotiorum). Not allsamples were tested for Botrytis and Sclerotinia but all were tested for Ascochyta. Figures forAscochyta and Botrytis were classified according to crop districts [CD] of Saskatchewan (1). However,this was not done for S. sclerotiorum because infection levels are generally so low that comparisons ofmeans would be valueless.
It was unknown which of the samples came from crops that had been treated with registered fungicides. Bravo (a.i. chlorothalonil) is widely used as a foliar protectant on chickpea. Apron (a.i. metalaxyl) isgenerally used as a seed treatment on kabuli chickpea.
RESULTS AND COMMENTS: In most areas of Saskatchewan the growing season started withrelatively dry conditions that resulted in early completion of seeding in May. From June to early Augustrainfall amounts varied from about 50% to 200% of normal in different crop districts, with the wettestconditions generally in the northeast, southeast and south central areas. These included some of themain areas of chickpea production in southern Saskatchewan and contributed to extensive spread ofascochyta blight in many crops as well as rank growth that contributed to botrytis blight infection. In lateAugust good harvest weather prevailed throughout the province, but in early September rain and warmhumid weather caused deterioration of crop quality in many areas. The average provincial yield (kabuliand desi combined) was similar to that in 1999, but only about 95% of the seeded area was harvested,largely due to crop failures due to diseases.
By mid-December almost 1200 chickpea seed samples (nearly 900 kabuli, 200 desi and about 100non-specified) had been tested by the four companies. The 40% increase over 1999 (2) reflects a largeincrease in acreage.
Levels of seed-borne Ascochyta varied among crop districts (Table 1), and were generally lowest in CD2A, 4A and 4B. The provincial mean for desi chickpea was lower than that for kabuli, possibly reflectinga difference in leaf types between the two. The majority of kabuli cultivars grown in Saskatchewan haveunifoliolate leaves while the majority of desi cultivars have fern-type leaves. Agronomists and growersnoted during the season that ascochyta blight tended to be more severe on chickpea crops withunifoliolate leaves than on those with fern-type leaves (mainly desi cv. Myles and kabuli cv. B-90). The

112
maximum recorded values of ascochyta seed infection were 46.25% in kabuli for a sample from CD 6Aand 15.25% in desi for a sample from CD 3A-S.
The overall percentages of samples in which no ascochyta was detected were 27 for kabuli and 41 fordesi. Direct comparisons with previous years of mean infection levels or percent samples with noinfection are not possible because in previous years figures were not separated for kabuli and desichickpea (2,3,4). However, the mean infection levels for both kabuli and desi in 2000 were higher thanthe overall mean in 2000; in turn, this figure was higher than the corresponding figures for 1998 and1997. Clearly ascochyta blight was a major problem in chickpea production in 2000, despite widespreaduse of moderately resistant cultivars and applications of Bravo.
Botrytis was detected in 48% of the kabuli samples tested and 72% of the desi samples (Table 2). In1999 the corresponding figure for both types of chickpea combined was 50%, weighted 2/3 towardskabuli (2). Thus, there was probably little change in mean prevalence of Botrytis on kabuli chickpeabetween 1999 and 2000. However, mean provincial infection levels in 2000 were 1.7% for kabuli and2.5% for desi, both substantially higher than the combined mean of 0.7% reported in 1999. The highestindividual values recorded in 2000 were 24.25% in kabuli and 23.5% in desi, both for samples from CD2A.
The difference in Botrytis infection levels between kabuli and desi seed can probably be attributedmainly to the tendency of growers to plant desi cultivars in areas where chickpea is less well adapted(more rainfall and heavier soils). These conditions favor rank growth and Botrytis infection in latesummer. Thus, the provincial average infection level for Botrytis in kabuli is highly influenced by the factthat nearly 30% of the samples came from CD 4A and 4B, where chickpea is well adapted and Botrytislevels were low (Table 2). On the other hand, only 9% of desi samples came from CD 4A and 4B andthis had less effect on the provincial average. However, in contrast to 1999 (2), high Botrytis levels didoccur within some of the area of optimum adaptation of chickpea in Saskatchewan (i.e. CDs 3A-S, 3B-N,3B-S, 4A, 4B, and 7A) because of above-normal rainfall.
Sclerotinia sclerotiorum was isolated from a small percentage of kabuli and desi chickpea seed samplesin 2000 and in these most commonly at levels of 1.0% or less.
REFERENCES:1. Morrall R.A.A., Carriere B., Cronje S., Schmeling D. and Thomson L. 2001. Seed-borne pathogens of
lentil in Saskatchewan in 2000. Can. Plant Dis. Survey 81: (this issue).2. Morrall R.A.A., Carriere B., Thomson L. and Engler C. 2000. Seed-borne pathogens of lentil, pea and
chickpea in Saskatchewan in 1999. Can. Plant Dis. Survey 80: 101-103. ( http://res2.agr.ca./london/pmrc/ )
3. Morrall R.A.A., Engler C., French M. and Carriere B. 1999. Seed-borne pathogens of lentil, pea andchickpea in Saskatchewan in 1998. Can. Plant Dis. Survey 79: 131-133. ( http://res2.agr.ca./london/pmrc/english/report/disease99.html )
4. Morrall R.A.A., Stoner J., French M. and Carriere B. 1998. Seed-borne pathogens of lentil, pea andchickpea in Saskatchewan in 1997. Can. Plant Dis. Survey 78: 103-105 ( http://res2.agr.ca./london/pmrc/ )

113
Table 1. Number of chickpea seed samples tested from August to mid-December, 2000 by fourcommercial companies and mean percent infection with Ascochyta in relation toSaskatchewan Crop Districts.
CropDistrict
KABULI DESI NON-SPECIFIED
No. ofsamplestested
Mean %infection
%sampleswith 0%infection
No. ofsamplestested
Mean %infection
%sampleswith 0%infection
No. ofsamplestested
Mean %infection
1A 2 2.6 0 1 0.3 0 1 1.5
1B 2 2 0 0 - - 0 -
2A 30 0.8 50 11 <0.1 91 3 1.9
2B 59 3.4 24 19 0.9 58 4 4.3
3AN 62 3.5 31 19 2.5 21 6 0.5
3AS 93 3.3 22 28 2.8 14 12 1.1
3BN 160 1.5 26 44 0.6 45 20 0.5
3BS 121 3.5 12 7 1.7 43 39 1.1
4A 187 0.5 34 5 0.2 40 4 0
4B 42 0.4 36 15 0.2 67 7 0.4
5A 7 3.8 29 1 0 100 0 -
5B 0 - - 0 - - 0 -
6A 23 7.9 13 16 3.3 6 2 1.5
6B 21 3 29 28 1.7 21 1 0
7A 71 2.4 32 14 0.6 57 1 9.5
7B 2 3.8 50 2 0 100 0 -
8A 0 - - 0 - - 0 -
8B 0 - - 0 - - 3 0
9A 0 - - 0 - - 0 -
9B 0 - - 0 - - 0 -
TOTAL 882 2.3 27 200 1.5 41 103 1

114
Table 2. Number of chickpea seed samples tested from August to mid-December, 2000 by fourcommercial companies and mean percent infection with Botrytis in relation to SaskatchewanCrop Districts.
CropDistrict
KABULI DESI NON-SPECIFIED
No. ofsamplestested
Mean %infection
%sampleswith 0%infection
No. ofsamplestested
Mean %infection
%sampleswith 0%infection
No. ofsamplestested
Mean %infection
1A 1 4 0 1 12.3 0 0 -
1B 2 0.5 0 0 - - 0 -
2A 25 3.7 32 8 13.2 0 0 -
2B 56 5.7 18 16 4.7 0 3 3
3AN 53 2.3 28 16 1.3 25 2 0
3AS 74 3.5 22 26 2.2 8 6 0.2
3BN 144 1 48 42 0.8 35 9 <0.1
3BS 105 1.8 56 5 0.4 60 33 <0.1
4A 178 0.1 76 4 0 100 2 0.1
4B 40 0.2 70 13 0 100 7 0.4
5A 7 5.1 43 1 0 100 0 -
5B 0 - - 0 - - 0 -
6A 21 2.7 14 17 5.4 0 1 8.8
6B 13 2.2 15 24 2.3 21 0 -
7A 62 0.6 63 14 0.4 43 1 0.8
7B 2 1 0 2 2.1 0 0 -
8A 0 - - 0 - - 0 -
8B 0 - - 0 - - 0 -
9A 0 - - 0 - - 0 -
9B 0 - - 0 - - 0 -
TOTAL 753 1.7 52 186 2.5 28 64 0.4

115
CROP / CULTURE: Chickpea (Cicer arietinum L.)
LOCATION / REGION: Saskatchewan
NAME AND AGENCY / NOM ET ORGANISME:H. Wang1, S. F. Hwang1, G.D. Turnbull1, K.F. Chang2 and R.J. Howard2
1 Alberta Research Council, Vegreville, Alberta T9C 1T42 Crop Diversification Centre South, Brooks, Alberta T1R 1E6 Tel : (780) 632- 8610; Fax : (780) 632 – 8612; Email : [email protected]
TITLE / TITRE: DISEASE SURVEY OF CHICKPEA IN WEST-CENTRAL SASKATCHEWAN IN 2000
INTRODUCTION AND METHODS: A survey for chickpea diseases was conducted in fields randomlyselected near Rosetown, Eatonia, Lemsford, Lancer, Cabri, Pennant, Success, Stewart Valley andDemaine in west-central Saskatchewan (Fig. 1). Five plants in the pod-fill stage were sampled at each offour random sites for each of 59 chickpea fields between July 17 and 21, 2000. Root disease severitywas estimated using a scale of 0 to 4 (0 = no disease, 1 = small lesions, 2 = large lesions, 3 = plantgirdled, and 4 = plant dead). The incidence of ascochyta blight and other diseases was recorded. Alldiseased plant samples were cultured onto various agar media in the laboratory to retrieve causalpathogens. Information on cultivar and seed treatment were obtained from the growers, and the rates ofseed treatment were provided by Gustafson®. Data were analysed using the general linear model withthe SAS System 6.12.
RESULTS AND COMMENTS: Ascochyta blight (Ascochyta rabiei) and root rot (Fusarium spp., Pythiumspp., and Rhizoctonia solani) of chickpea were most the common diseases observed in the fields andcausal pathogens were recovered from plant samples. Alternaria leaf spot (Alternaria spp.) andsclerotinia stem rot (Sclerotinia sclerotiorum) were also present (Table 1).
Overall, ascochyta blight was identified in 57 of the 59 fields surveyed with a fairly high incidence in eachfield. There was no significant difference in the incidence of ascochyta blight across the surveyed area. There was no significant difference (P = 0.22) in incidence of Ascochyta infection between Desi cvs.CDC Anna and Myles and Kabuli cvs. CDC Yuma, Evans, Sanford, B90, Dwelley and CDC Xena (datanot shown). Root rot diseases were observed in 32 of the 59 fields surveyed. In most, Fusarium andPythium were identified as the causal agents. A few of the samples had Rhizoctonia-induced rootdisease (Table 1). However, root rot incidence varied with location and seed types. There was a muchhigher incidence of root rot diseases in the areas of Demaine, Rosetown, Pennant and Success than inthe other areas surveyed. Kabuli cultivars usually had a lower root rot incidence than the Desi cultivars(Table 2), probably because seed treatment was not applied in 7 of the 11 Desi chickpea fields.
Only three cultivars of Kabuli exhibited low root rot with disease incidence ranging from 0 to 5.0% anddisease severity less than 0.1 on the 0 - 4 scale. Chemical seed treatments were applied in 52 of the 59fields by commercial seed suppliers. Three different seed treatments were used, including Crown (92g/L carbathiin + 58 g/L thiabendazole) at 300 mL + Apron (metalaxyl) at 16 mL/100 kg seed, Vitaflo 280(thiram 130 g a.i./L + carbathiin 150 g a.i./L) at 260 mL + Apron (metalaxyl) at 16 mL/100 kg seed, andApron (metalaxyl) alone at 16 mL/100 kg seed. All three treatments significantly (P # 0.01) reduced rootrot diseases compared to non-treated fields, although there was no difference among the three seedtreatments (Table 3).
We gratefully acknowledge the assistance of David Nobbs of Gustafson® at Rosetown, Saskatchewanin carrying out this survey.
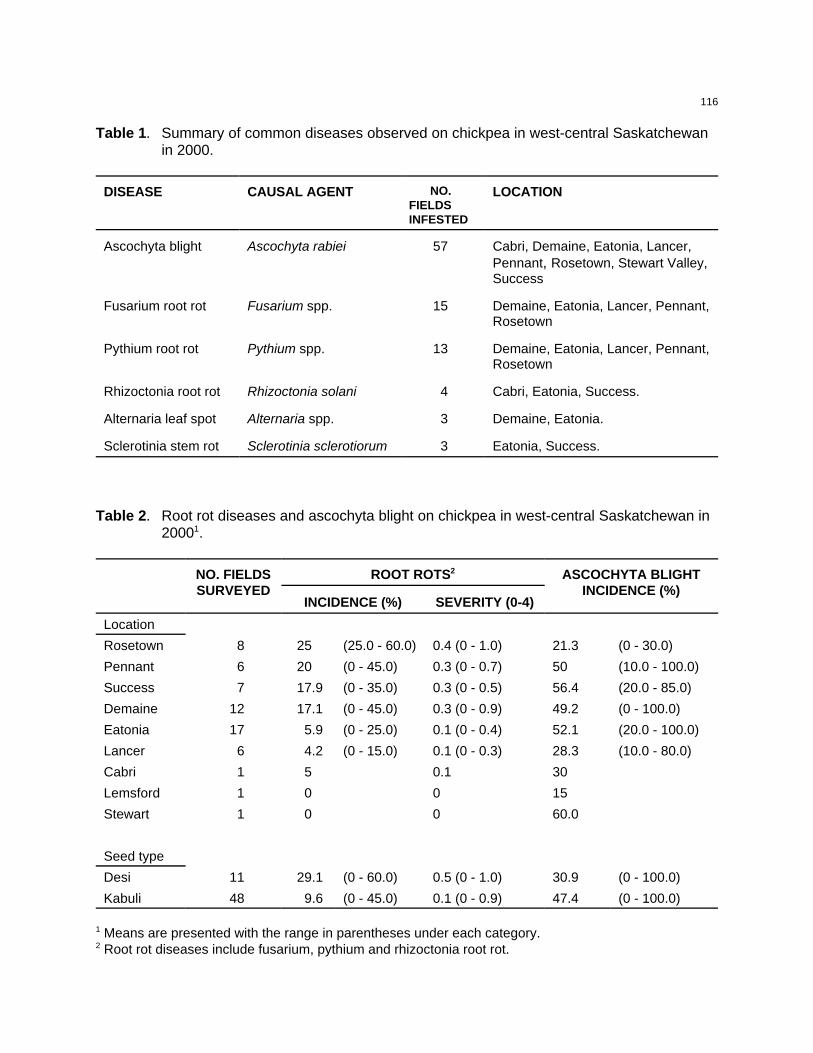
116
Table 1. Summary of common diseases observed on chickpea in west-central Saskatchewanin 2000.
DISEASE CAUSAL AGENT NO.FIELDSINFESTED
LOCATION
Ascochyta blight Ascochyta rabiei 57 Cabri, Demaine, Eatonia, Lancer,Pennant, Rosetown, Stewart Valley,Success
Fusarium root rot Fusarium spp. 15 Demaine, Eatonia, Lancer, Pennant,Rosetown
Pythium root rot Pythium spp. 13 Demaine, Eatonia, Lancer, Pennant,Rosetown
Rhizoctonia root rot Rhizoctonia solani 4 Cabri, Eatonia, Success.
Alternaria leaf spot Alternaria spp. 3 Demaine, Eatonia.
Sclerotinia stem rot Sclerotinia sclerotiorum 3 Eatonia, Success.
Table 2. Root rot diseases and ascochyta blight on chickpea in west-central Saskatchewan in20001.
NO. FIELDSSURVEYED
ROOT ROTS2 ASCOCHYTA BLIGHTINCIDENCE (%)
INCIDENCE (%) SEVERITY (0-4)
Location
Rosetown 8 25 (25.0 - 60.0) 0.4 (0 - 1.0) 21.3 (0 - 30.0)
Pennant 6 20 (0 - 45.0) 0.3 (0 - 0.7) 50 (10.0 - 100.0)
Success 7 17.9 (0 - 35.0) 0.3 (0 - 0.5) 56.4 (20.0 - 85.0)
Demaine 12 17.1 (0 - 45.0) 0.3 (0 - 0.9) 49.2 (0 - 100.0)
Eatonia 17 5.9 (0 - 25.0) 0.1 (0 - 0.4) 52.1 (20.0 - 100.0)
Lancer 6 4.2 (0 - 15.0) 0.1 (0 - 0.3) 28.3 (10.0 - 80.0)
Cabri 1 5 0.1 30
Lemsford 1 0 0 15
Stewart 1 0 0 60.0
Seed type
Desi 11 29.1 (0 - 60.0) 0.5 (0 - 1.0) 30.9 (0 - 100.0)
Kabuli 48 9.6 (0 - 45.0) 0.1 (0 - 0.9) 47.4 (0 - 100.0)
1 Means are presented with the range in parentheses under each category.2 Root rot diseases include fusarium, pythium and rhizoctonia root rot.

117
Table 3. Effect of cultivar and seed treatment on chickpea root rot diseases in west-centralSaskatchewan in 2000.
NO. FIELDSSURVEYED
ROOT ROT DISEASE1
INCIDENCE (%) SEVERITY (0-4)
Cultivar
CDC Yuma 2 32.5 (30.0 - 35.0) 0.5 (0.5 - 0.6)
CDC Anna 1 30 0.5
Myles 10 29 (0 - 60.0) 0.5 (0 - 0.8)
Evans 5 16 (0 - 30.0) 0.2 (0 - 0.5)
Sanford 18 12.8 (0 - 45.0) 0.2 (0 - 0.8)
B90 3 5 (0 - 15.0) 0.1 (0 - 0.4)
Dwelley 18 3.9 (0 - 20.0) 0.1 (0 - 0.4)
CDC Xena 2 0 0.0
Seed treatment2
Non-treated 7 29.3 (0 - 60.0) 0.5 (0 - 1.0)
Crown/Apron 45 11.8 (0 - 45.0) 0.2 (0 - 0.9)
Vitaflo 280/Apron 5 9.0 (0 - 25.0) 0.1 (0 - 0.4)
Apron 2 0 0.0
1 Root rot diseases include fusarium, pythium and rhizoctonia root rots. Means are presented with theirranges in parentheses under each category.
2 The seed treatments were applied by the commercial seed suppliers as Crown at 300 mL + Apron at16 mL/100 kg seed, Vitaflo 280 at 260 mL + Apron at 16 mL/100 kg seed, and Apron alone at 16mL/100 kg seed.

118
Figure 1. Distribution of surveyed chickpea fields in west-central Saskatchewan in 2000. Numbers in parentheses indicate the number of fields surveyed near each town.

119
CROP: Field bean
LOCATION: Manitoba
NAME AND AGENCY:A.G. Xue* and L. YagerAgriculture and Agri-Food Canada Research Centre, Unit 100-101, Route 100,Morden, Manitoba R6M 1Y5. *Current address: Eastern Cereal and Oilseed Research Centre, Agriculture and Agri-Food Canada,Room 2091, K. W. Neatby Building, 960 Carling Avenue, Ottawa, Ontario, Canada K1A 0C6.
TITLE: DISEASES OF FIELD BEAN IN MANITOBA IN 2000
METHODS: Crops of field bean were surveyed for root diseases at 33 different locations and for foliardiseases at 36 locations in Manitoba. The survey for root diseases was conducted in the first week ofJuly when plants were at the second to third trifoliate stages, and for foliar diseases was conducted inthe last week of August when the plants were at the late pod-filling to early maturity stages. The cropssurveyed were chosen at random from regions in southeast and south-central Manitoba, where mostfield bean is grown. Ten plants were sampled at each of three random sites for each crop surveyed. Diseases were identified by symptoms. The severity of root diseases was estimated using a scale of 0(no disease) to 9 (whole roots/lower stem severely diseased). Five to ten roots with disease symptomsper field were collected for isolation of fungi in the laboratory in order to confirm the visual assessment. Severity of foliar diseases was estimated using a scale of 0 (no disease) to 5 (whole plants severelydiseased). White mould was rated as a percentage of plants infected.
RESULTS AND COMMENTS: Root rots were observed in all 33 fields surveyed and a total of fourdiseases was recorded (Table 1). Of the four diseases, rhizoctonia root rot (Rhizoctonia solani) andfusarium root rot (Fusarium solani f. sp. pisi) were the most prevalent, and were observed in 24 and 21of the 33 fields surveyed, respectively. The mean severity for rhizoctonia root rot was 1.9 and forfusarium root rot was 1.8 on the 0-9 scale. Severe infection by either disease was not observed. Otherroot diseases including pythium root rot (Pythium spp.) and aphanomyces root rot (Aphanomyceseuteiches) were minor and each was observed in only three crops.
Four foliar diseases were observed in the 36 fields surveyed (Table 2). Bacterial blights (commonbacterial blight (Xanthomonas campestris pv.phaseoli), halo blight (Pseudomonas syringae pv.phaseolicola) and bacterial brown spot (Pseudomonas syringae pv. syringae) were observed in all 36fields surveyed and were the most severe diseases of field bean in Manitoba in 2000. Yield reductiondue to bacterial blights was estimated to be at least 10%. Anthracnose (Colletotrichum lindemuthianum)was observed in eight crops, but the intensity was generally low for the infested crops. Other diseasesincluding white mold (Sclerotinia sclerotiorum) and rust (Uromyces appendiculatus) were observed intwo and one crops, respectively. These diseases did not appear to cause significant damage to the fieldbean crops.

120
Table 1. Intensity of root diseases in 33 crops of field bean in Manitoba in 2000.
DISEASE NO. FIELDSAFFECTED
DISEASE INTENSITY IN AFFECTED FIELDS1
Mean Range
Rhizoctonia root rot 24 1.9 0.8-3.6
Fusarium root rot 21 1.8 0.8-3.6
Pythium root rot 3 3.7 1.4-7.9
Aphanomyces root rot 3 4.4 1.7-7.9
1 Disease intensity was rated on a scale of 0 (no disease) to 9 (whole roots severely diseased).
Table 2. Intensity of bean diseases in 36 crops of field bean in Manitoba in 2000.
DISEASE NO. FIELDSAFFECTED
DISEASE INTENSITY IN AFFECTED FIELDS1
Mean Range
Bacterial blights 36 2.8 1.5-4.5
Anthracnose 8 2.4 1.0-3.5
White mold 2 10.0 10.0
Rust 1 1.5 1.5
1 White mold was rated as percent plants infected; other diseases were rated on a scale of 0 (nodisease) to 5 (whole plant severely diseased).

121
CROP: Field pea
LOCATION: Manitoba
NAME AND AGENCY:A.G. Xue* and L. YagerAgriculture and Agri-Food Canada Research Centre, Unit 100-101, Route 100,Morden, Manitoba R6M 1Y5. * Current address: Eastern Cereal and Oilseed Research Centre, Agriculture and Agri-Food Canada,Room 2091, K. W. Neatby Building, 960 Carling Avenue, Ottawa, Ontario, Canada K1A 0C6.
TITLE: DISEASES OF FIELD PEA IN MANITOBA IN 2000
METHODS: Crops of field pea were surveyed for foliar diseases at 23 different locations in Manitoba. The survey was conducted in the third week of July when the plants were at the pod-fill to early maturitystages. The crops surveyed were chosen at random from regions in south-west and south-centralManitoba, where most field pea is grown. Ten plants were sampled at each of three random sites foreach crop surveyed. Diseases were identified by symptoms. Fusarium wilt and sclerotinia stem rotwere rated as percentage of plants infected. The severity of other diseases observed was estimatedusing a scale of 0 (no disease) to 9 (whole plants severely diseased).
RESULTS AND COMMENTS: Six diseases were observed in the 23 fields surveyed (Table 1). Mycosphaerella blight (Mycosphaerella pinodes) was the most prevalent disease, observed in all fieldssurveyed. However, severe infection (Intensity >6.0) by mycosphaerella blight was observed in only twocrops. Average yield reduction was estimated at less than 10%. Fusarium wilt (Fusarium oxysporum f.sp. pisi) was observed in 16 of the 23 fields surveyed, and was the second most prevalent disease. Themean incidence of fusarium wilt was less than 4% for all infested crops and the disease did not appearto cause significant yield reduction. Sclerotinia stem rot (Sclerotinia sclerotiorum) was observed inseven fields and infection ranged from 10 to 70%. The yield reduction in sclerotinia stem rot-infestedcrops was estimated at more than 10% on average. Other diseases including powdery mildew(Erysiphe pisi), bacterial blight (Pseudomonas syringae pv. pisi), and anthracnose (Colletotrichum pisi)were observed in two, one, and one of the crops, respectively. Severity of these diseases was low anddid not appear to cause significant damage to the pea crops.
Powdery mildew was the most prevalent disease on pea in Manitoba in previous years. The lower levelof powdery mildew in 2000 may be due to early seeding (before May 10), the greater use of resistantcultivars, and unfavorable weather conditions, or a combination of these factors.

122
Table 1. Intensity of foliar diseases in 23 crops of field pea in Manitoba in 2000.
DISEASE NO. FIELDSAFFECTED
DISEASE INTENSITY IN AFFECTED FIELDS1
Mean Range
Mycosphaerella blight 23 3.9 1.5-8.5
Fusarium wilt 16 3.1 2.0-4.0
Sclerotinia stem rot 7 24.3 10.0-70.0
Powdery mildew 2 2.8 1.0-4.5
Bacterial blight 1 3.0 3.0
Anthracnose 1 3 3
1 Fusarium wilt and sclerotinia stem rot was rated as percent plants infected; other diseases were ratedon a scale of 0 (no disease) to 9 (whole plant severely diseased).

123
CROP: Flax
LOCATION: Manitoba and Saskatchewan
NAME AND AGENCY:K. Y. Rashid1, M. Desjardins2, S. Duguid1, and R. G. Platford3
1 Agriculture and Agri-Food Canada, Research Centre Unit 100-101, Route 100, Morden, Manitoba R6M 1Y5.2 Manitoba Agriculture and Food, Crop Diagnostic Centre. 201-545 University Crescent, Winnipeg, Manitoba R3T 5S6.3 Manitoba Agriculture and Food, Soils and Crops Branch Box 1149, Carman, Manitoba R0G 0J0.
TITLE: DISEASES OF FLAX IN MANITOBA AND SASKATCHEWAN IN 2000
METHODS: A total of 74 flax crops in southern Manitoba and 48 in central and eastern Saskatchewanwas surveyed in 2000. Forty-five crops were surveyed during the third week in July, and 77 crops duringthe third and fourth week in August. Solin flax with low linolenic acid and yellow seed colour wasdistinguished in 10% of the crops surveyed in August, but linseed constituted 90% of the cropssurveyed. Crops surveyed were selected at random along preplanned routes in the major areas of flaxproduction. Each crop was sampled by two persons walking 100 m in opposite directions in the fieldfollowing an "M" pattern. Diseases were identified by symptoms and the incidence and severity of eachdisease were recorded. Stand and vigour were rated on a scale of 1 to 5 ( I = very good, and 5 = verypoor).
In addition, 30 samples of flax plants were submitted for analysis to the Manitoba Agriculture and FoodCrop Diagnostic Centre by agricultural representatives and growers.
RESULTS AND COMMENTS: Seventy-five percent of the flax crops surveyed in 2000 were rated verygood for stand establishment, and 63% had very good vigour. Thirty-two percent of the crops surveyedwere seeded late and were expected to be late for maturity and harvesting. Growing conditions weregenerally good except for abnormally wet conditions towards the end of August in southern Manitobaand eastern Saskatchewan, which resulted in heavy lodging in several crops and noticeable amounts ofdark brown and black seed.
Pasmo (Septoria linicola) was observed in 86% of the crops surveyed (Table 1). The prevalence andseverity of pasmo in 2000 were similar to 1999 but higher than in previous years (1, 2), due perhaps tothe relatively wet weather during the second half of the growing season. In the infested crops, pasmoincidence ranged from 1% to 100% infected plants, and severity ranged from 1% to >60% stem and leafarea affected. Twenty-six percent of the crops had >60% plants severely infected with pasmo.
Heavily lodged plants were observed in 28% of crops, and traces to 80% of the plant area affected byAlternaria and other saprophytic fungi were observed in lodged crops. Frequent visits to some flax fieldsin southern Manitoba towards the end of the season revealed higher levels of pasmo and Alternariainfections than those observed in August.
Flax stems infected by Sclerotinia sclerotiorum were observed in only three crops in 2000 in comparisonto 14 crops in 1999 (1). Typical symptoms were white bleached and shredded stems and tiny cylindricalsclerotia inside infected stems. The Sclerotinia infections were only observed in heavily lodged flax.
Root infections and fusarium wilt (Fusarium oxysporum f.sp. lini) were observed in 54% of flax crops in2000 in comparison to 93% and 86% of crops, respectively in 1999 and 1998 (1, 2). Incidence of

124
fusarium wilt ranged from trace to 10%, except for a few crops in Manitoba and Saskatchewan wherefusarium wilt incidence ranged from 20-30%.
Powdery mildew (Oidium lini) was observed again in 2000 in 10% of the crops surveyed with a severityrange from trace to 40% leaf area affected. The incidence and severity of this disease were low in 2000in spite of the sharp increases in the last three years since it was first reported in western Canada (1, 2). Most of the flax crops affected by powdery mildew were near Regina, Grenfell, Melfort, and Yorkton inSaskatchewan, and near Portage la Prairie and south central areas in Manitoba.Traces to 5% affected plants were observed with aster yellows (phytoplasma) in 11% of the flax crops in2000. The incidence and severity of aster yellows in 2000 were lower than in 1999 when the severity ofthis disease was higher than in any of the last 10 years (1).
Rust (Melampsora lini) was not observed in any of the 122 crops surveyed, nor in the rust-differential flaxnurseries planted at Morden and at Portage la Prairie.
Of the 30 flax samples submitted to the Manitoba Agriculture and Food Crop Diagnostic Centre, one wasaffected by pasmo, two affected by fusarium wilt/root rot (Fusarium oxysporum f.sp. lini and otherFusarium spp.), one affected by seedling blight (Rhizoctonia spp), and two with black seed (Alternariaspp.). In addition to diseases, 16 samples were affected by herbicide injury, two samples by nutrientdeficiencies, and six samples by various environmental factors.
ACKNOWLEDGEMENTS: The assistance of Lawrence Wiebe and Maurice Penner in conducting thissurvey is gratefully acknowledged.
REFERENCES:1. Rashid, K. Y., E. O. Kenaschuk, S. Duguid, and R. G. Platford. 2000. Diseases of flax in Manitobaand eastern Saskatchewan in 1999. Can. Plant Dis. Surv. 80:92-93. ( http://res2.agr.ca/london/pmrc/english/report/repmenu.html ).
2. Rashid, K. Y., E. O. Kenaschuk, and R. G. Platford. 1999. Diseases of flax in Manitoba and easternSaskatchewan in 1998. Plant Dis. Surv. 79:121-122. ( http://res2.agr.ca/london/pmrc/english/report/repmenu.html ).

125
Table 1. Incidence and severity of fusarium wilt, pasmo, and powdery mildew in 122 crops of flax insouthern Manitoba, and central and eastern Saskatchewan in 2000.
CROPS AFFECTED BY
FUSARIUM WILT PASMO POWDERY MILDEW
CROPS DISEASE CROPS DISEASE CROPS DISEASE
No. % Incid.1 Sever2 No. % Incid.1 Sever2 No. % Incid. Sever2
51 42 0 0 9 7 0 0 110 90 0 0
31 25 1 - 5 1 - 5 37 30 1 - 10 1 - 5 7 6 1 - 10 1 - 5
28 23 5 - 20 5 - 10 26 21 10 - 30 5 - 10 1 1 10 - 30 5 - 10
9 7 20-40 10 - 20 24 20 30-60 10 - 20 3 3 30-60 10 - 20
3 3 >40 10-40 26 21 >60 10-50 1 1 >60 10-50
1 Incidence = Percentage of infected plants in each field.2 Severity = Percentage of roots affected by fusarium wilt, stems affected by pasmo, and leaves
affected by powdery mildew.

126
CROP: Lentil
LOCATION: Saskatchewan
NAMES AND AGENCIES:R.A.A. Morrall 1, B. Carriere2, S. Cronje3, D. Schmeling4 and L. Thomson5
1 Department of Biology, University of Saskatchewan, 112 Science Place, Saskatoon, Saskatchewan, S7N 5E2 (Tel: 306-966-4410, Fax: 306-966-4461, email: [email protected])2 Discovery Seed Labs Ltd., 450 Melville Street, Saskatoon, Saskatchewan, S7J 4M23 Priority Lab Services, Box 1180, Nipawin, Saskatchewan, S0E 1E04 Lendon Seeds Ltd., Box 10, Riceton, Saskatchewan, S0G 4E05 Saskatchewan Wheat Pool, Seed Quality Control, 102-407 Downey Road, Saskatoon, Saskatchewan, S7N 4L8
TITLE: SEED-BORNE PATHOGENS OF LENTIL IN SASKATCHEWAN IN 2000
METHODS: The results of agar plate tests conducted by four Saskatchewan companies on seedsamples from the 2000 crop were summarized. The tests were conducted mainly to detect thepathogens causing ascochyta blight (Didymella [Ascochyta] lentis), anthracnose (Colletotrichumtruncatum), grey mould and seedling blight (Botrytis cinerea) and sclerotinia stem and pod rot(Sclerotinia sclerotiorum). Not all samples were tested for Colletotrichum, Botrytis and Sclerotinia but allwere tested for Ascochyta. Figures for A. lentis and B. cinerea were classified according to crop districts[CD] of Saskatchewan (Fig. 1). However, this was not done for C. truncatum and S. sclerotiorumbecause infection levels are generally so low that comparisons of means would be valueless.
It was unknown which of the seed samples came from lentil crops that had been treated with registered fungicides. Bravo (a.i. chlorothalonil) is widely used as a foliar protectant against ascochyta blight andanthracnose, while Crown (a.i. thiabendazole + carbathiin) is often used as a seed treatment againstseed-borne Ascochyta and Botrytis. This was the first year in which the use of new ascochyta-resistantlentil cultivars was widespread. Therefore, mean provincial infection levels for ascochyta in seed werecalculated separately for resistant and susceptible cultivars, when the information was available.
RESULTS AND COMMENTS: In most areas of Saskatchewan the growing season started withrelatively dry conditions that resulted in early completion of seeding in May. From June to early Augustrainfall amounts varied from about 50% to 200% of normal in different crop districts, with the wettestconditions generally in the northeast, southeast and south central areas. In late August good harvestweather prevailed throughout the province, but in early September rain and warm humid weather causeddeterioration of crop quality in many areas. The average provincial lentil yield was similar to the 10-yearaverage, but about 8% below that in 1999.
By mid-December nearly 1200 lentil seed samples had been tested by the four companies. The 10%increase over 1999 in lentil samples tested (1) was probably due to a substantial increase in acreage.Mean levels of seed-borne Ascochyta varied among crop districts (Table 1), but were not necessarilyhighest in districts which received the highest total rainfall in June and July. The highest value was 41%in a sample from CD 2A.
On a provincial basis the mean level of seed infection was 2.5%, while 34% of samples tested 0%ascochyta. The corresponding figures for 1999 were 3.1% and 17%. While this indicates a reduction inlevels of ascochyta blight from 1999 to 2000, the reason is probably related more to the change in lentilcultivars than to weather. Approximately 25% of samples tested in 2000 were new ascochyta-resistantcultivars [CDC Glamis, CDC Grandora, CDC Milestone, CDC Redcap, CDC Redwing, CDC Robin, CDC

127
Sovereign, CDC Vantage, 997-5R]. The mean Ascochyta seed infection in these cultivars was 0.4%.About 50% of all samples tested were known susceptible cultivars [CDC Richlea, Crimson, Eston,French Green and Laird]. In these, the mean Ascochyta seed infection was 3.3%. In the remainingsamples, for which no cultivar was specified, but which were probably mostly susceptible types, themean Ascochyta seed infection was 2.9%. The values of 3.3% and 2.9% are probably the mostappropriate to compare with figures for the previous 3 years (1,2,3).
Botrytis was detected in 80% of all samples tested. The corresponding percentages were 69%[erroneously reported as 31% in reference 1) in 1999 and 73% in 1998 (2). The mean infection level was2.3%, compared with 0.7% in 1999 and 0.3% in 1998. Thus, there was a substantial increase inprevalence and incidence of seed infection compared with the two previous years. The highest level ofseed infection in 2000 was 19.5%.
Colletotrichum truncatum, which is not a highly seed-borne pathogen, was detected in 7.8% of thesamples tested, slightly lower than in the past several years. Most records were from CD 2B, 3A-N, 3B-Nand 6B; however other records from CD 2A, 3A-S, 3B-S, 5A, 5B, 6A, 8A and 9A confirm thatanthracnose has now spread to all major areas of lentil production in Saskatchewan. The highest level ofseed infection detected in 2000 was 5.0%.
As in 1999 (1), S. sclerotiorum was commonly isolated from lentil seed but at low levels. This probablyreflects the cool wet weather in many areas in July and an increasing number of broad-leaved crops inrotations in the major lentil-producing regions.
REFERENCES:1. Morrall R.A.A., Carriere B., Thomson L. and Engler C. 2000. Seed-borne pathogens of lentil, pea andchickpea in Saskatchewan in 1999. Can. Plant Dis. Survey 80: 101-103. ( http://res2.agr.ca./london/pmrc/ )2. Morrall R.A.A., Engler C., French M. and Carriere B. 1999. Seed-borne pathogens of lentil, pea andchickpea in Saskatchewan in 1998. Can. Plant Dis. Survey 79: 131-133. ( http://res2.agr.ca./london/pmrc/english/report/disease99.html )3. Morrall R.A.A., Stoner J., French M. and Carriere B. 1998. Seed-borne pathogens of lentil, pea andchickpea in Saskatchewan in 1997. Can. Plant Dis. Survey 78: 103-105. ( http://res2.agr.ca./london/pmrc/ )

128
Table 1. Number of lentil seed samples tested from August to mid-December, 2000 by fourcommercial companies and mean percent infection with Ascochyta and Botrytis in relation toSaskatchewan Crop Districts.
CropDistrict
ASCOCHYTA BOTRYTIS
No. ofsamplestested
Mean %infection
%sampleswith 0%infection
No. ofsamplestested
Mean %infection
% sampleswith 0%infection
1A 1 0 100 0 - -
1B 3 0 100 3 7.1 0
2A 116 2.4 54 97 3.5 13
2B 258 2.3 43 234 2.3 16
3AN 54 3.6 23 52 2.2 8
3AS 59 2.3 26 55 2.4 15
3BN 167 2.8 34 157 1.7 34
3BS 53 4.5 22 49 1.4 25
4A 17 1.4 13 15 0.2 29
4B 14 0.3 77 12 <0.1 92
5A 33 2.6 0 33 3.9 14
5B 11 0.4 89 11 1.2 33
6A 83 2.3 31 80 3.2 9
6B 119 2.3 23 113 3.6 11
7A 145 2.6 20 136 1.1 33
7B 14 2.4 7 13 2.0 23
8A 3 0 100 2 3.3 0
8B 1 0 100 1 2.5 0
9A 5 5.1 75 3 2.0 0
9B 3 0.4 n/a 2 5.0 n/a
TOTAL 1179 2.5 34 1083 2.3 20
1 n/a = not available

129
Figure 1. Map of crop districts in Saskatchewan.
130
CROP: Pea
LOCATION: Saskatchewan
NAMES AND AGENCIES:R.A.A. Morrall1, B. Carriere2, S. Cronje3, D. Schmeling4 and L. Thomson5
1 Department of Biology, University of Saskatchewan, 112 Science Place, Saskatoon, Saskatchewan, S7N 5E2 (Tel: 306-966-4410, Fax: 306-966-4461, email: [email protected])2 Discovery Seed Labs Ltd., 450 Melville Street, Saskatoon, Saskatchewan, S7J 4M23 Priority Lab Services, Box 1180, Nipawin, Saskatchewan, S0E 1E04 Lendon Seeds Ltd., Box 10, Riceton, Saskatchewan, S0G 4E05 Saskatchewan Wheat Pool, Seed Quality Control, 102-407 Downey Road, Saskatoon, Saskatchewan, S7N 4L8
TITLE: SEED-BORNE PATHOGENS OF PEA IN SASKATCHEWAN IN 2000
METHODS: The results of agar plate tests conducted by four Saskatchewan companies on seedsamples from the 2000 crop were summarized. The tests were conducted mainly to detect thepathogens causing ascochyta blights (Mycosphaerella [Ascochyta] pinodes and A. pisi), botrytis blight(Botrytis cinerea) and sclerotinia stem and pod rot (Sclerotinia sclerotiorum). Not all samples weretested for Botrytis and Sclerotinia but all were tested for the ascochyta blight pathogens. Figures forAscochyta spp. and B. cinerea were classified according to crop districts [CD] of Saskatchewan (1).However, this was not done for S. sclerotiorum because infection levels are generally so low thatcomparisons of means would be valueless.
RESULTS AND COMMENTS: In most areas of Saskatchewan the growing season started withrelatively dry conditions that resulted in early completion of seeding in May. From June to early Augustrainfall amounts varied from about 50% to 200% of normal in different crop districts, with the wettestconditions generally in the northeast, southeast and south central areas. Frost in a large area ofeast-central Saskatchewan on July 16 caused severe damage and yield loss in many pea crops. In lateAugust good harvest weather prevailed throughout the province, but in early September rain and warmhumid weather caused deterioration of crop quality in areas where harvest was not complete. Theaverage provincial pea yield was 10% greater than the 10-year average, but about 17% below theexceptional mean yield of 1999 (2).
By mid-December nearly 500 pea seed samples had been tested by the four companies. Mean levels ofseed-borne Ascochyta spp. varied among crop districts (Table 1), with the highest levels in the northerncrop districts (CD 8 and 9) where there is the longest history of pea growing. The maximum recordedvalue was 24.5% in two samples, one from CD 6A and one from CD 8B.
On a provincial basis mean seed infection was 3.1% and the percentage of samples in which noinfection was detected was 24%. These values were 25% lower and 40% higher, respectively, thancorresponding values for 1999 (2). However, mean provincial seed infection levels were stillconsiderably higher than those recorded 1998 and 1997 (3,4).
Botrytis was detected in 28% of pea samples tested compared with 35% in 1999 (2). However, themean seed infection level was 0.3% for both years. The highest mean seed infection levels were in CD2B, 7B, 8A, 8B and 9B (Table 1) and the highest individual value recorded was 5% in CD 8B. GenerallyBotrytis was not a problem on pea crops in Saskatchewan in 2000. Sclerotinia sclerotiorum was isolatedfrom less than 30% of pea seed samples in 2000 and, in these, most commonly at a level of 0.5 or 1.0%.

131
REFERENCES:1. Morrall R.A.A., Carriere B., Cronje S., Schmeling D. and Thomson L. 2001. Seed-borne pathogens
of lentil in Saskatchewan in 2000. Can. Plant Dis. Survey 81: (this issue).
2. Morrall R.A.A., Carriere B., Thomson L. and Engler C. 2000. Seed-borne pathogens of lentil, peaand chickpea in Saskatchewan in 1999. Can. Plant Dis. Survey 80: 101-103. ( http://res2.agr.ca./london/pmrc/ )
3. Morrall R.A.A., Engler C., French M. and Carriere B. 1999. Seed-borne pathogens of lentil, pea andchickpea in Saskatchewan in 1998. Can. Plant Dis. Survey 79: 131-133. ( http://res2.agr.ca./london/pmrc/english/report/disease99.html )
4. Morrall R.A.A., Stoner J., French M. and Carriere B. 1998. Seed-borne pathogens of lentil, pea andchickpea in Saskatchewan in 1997. Can. Plant Dis. Survey 78: 103-105 (http://res2.agr.ca./london/pmrc/ )

132
Table 1. Number of pea seed samples tested from August to mid-December, 2000 by fourcommercial companies and mean percent infection with Ascochyta and Botrytis in relationto Saskatchewan Crop Districts.
CropDistrict
ASCOCHYTA BOTRYTIS
No. ofsamplestested
Mean %infection
% sampleswith 0%infection
No. ofsamplestested
Mean %infection
% sampleswith 0%infection
1A 5 0.6 60 3 0 100
1B 4 3.5 25 2 0.5 50
2A 9 10 38 8 0.1 8.8
2B 37 2.1 22 27 0.5 60
3AN 6 2.1 0 6 0.1 80
3AS 33 1.8 31 23 0.1 83
3BN 34 2.3 44 32 0.2 73
3BS 13 0.3 82 10 0 100
4A 4 0.4 75 4 0.1 67
4B 8 0 100 7 0.1 86
5A 16 1.4 40 7 0 100
5B 30 1.8 17 25 0.1 88
6A 54 2.7 10 45 0.2 67
6B 45 2.9 12 28 0.3 70
7A 29 1.1 39 20 0.1 85
7B 18 3.7 6 16 0.4 60
8A 32 4.4 18 23 0.5 71
8B 51 7.3 3 20 0.7 47
9A 31 4.9 8 18 0.3 50
9B 25 5.9 0 21 0.5 56
TOTAL 484 3.1 24 343 0.3 72
133
CROP: Soybean
LOCATION: Ontario
NAME AND AGENCY:T. R. Anderson1 and A. U. Tenuta2
1 Agriculture and Agri-Food Canada, Greenhouse and Processing Crops Research Centre, 2585 County Road 20, Harrow, ON N0R 1G02 Ontario Ministry of Agriculture, Food and Rural Affairs, Ridgetown College, Ridgetown, ON N0P 2C0
TITLE: DISEASES OF SOYBEAN IN ONTARIO AND ESTIMATED YIELD LOSSES, 1994,1996-2000
INTRODUCTION: Soybean production has increased dramatically in Ontario during the past 30 years.The increase has occurred in new production areas in central and eastern Ontario in addition to morefrequent cropping of soybean in southwestern Ontario. Cultural practices such as tillage have alsochanged during recent years. Increased production has contributed to an increase in the frequency andseverity of soybean diseases. Reduced tillage may be economical but may contribute to increaseddisease severity by reducing soil temperatures and increasing soil moisture at planting.
There has been no general disease loss survey of soybean in Ontario. Such a survey would be difficultwith over 800 thousand ha of soybean in Ontario in 2000. However, with large acreage crops, it is usefulto estimate losses for the following reasons: 1) to document the presence of diseases, 2) to priorizeresearch on disease management and 3) to provide direction to public and private soybean breeders indeveloping disease resistance. Therefore, disease loss estimates were developed as a guide to thoseinterested in Ontario soybean diseases.
METHODS: Disease loss estimates were derived from non-formal surveys, grower samples submittedfor diagnosis, discussion with extension agents, crop consultants, growers and provincial authorities.Observations of soybean diseases are made during the annual field plot tour of the Ontario Oil andProtein Seed Crop Committee which involves visits in all soybean production areas of Ontario. Thelosses should be considered as only very general conservative estimates. It should also be noted thatalthough some mean Ontario values are minimal, losses can be severe on an individual field, farm orregion basis.
RESULTS AND COMMENTS: Disease loss estimates for 1994 (Wrather et al., 1997) and 1996 to 2000are presented in Table 1. Bacterial diseases (bacterial blight [Pseudomonas savastanoi pv. glycinea]and wildfire [Pseudomonas syringae pv. tabaci]) are found in most soybean production areas but are notconsidered to cause economic losses. Diseases caused by fungi are commonly observed and can besevere. Seedling diseases caused by Pythium sp., Fusarium spp., Rhizoctonia solani, Phomopsis sp.and Phytophthora sojae occur in cool wet weather. The incidence of each pathogen may vary with soiltype and temperature. In 2000, seedling disease was severe because of cool, wet weather. Sclerotiniastem rot (Sclerotinia sclerotiorum) has been a major problem in recent years in Ontario. The severity ofsclerotinia stem rot increases during cool, wet weather in the period from pod fill to maturity andtherefore the severity changes annually. The consistently important disease, phytophthora root rot iscaused by Phytophthora sojae. Although soybean cultivars in Ontario are tolerant or resistant to thisdisease, isolates of the fungus with novel patterns of virulence continue to develop. The fungus is foundin all soil types but most losses occur on poorly drained, fine textured soil. Sudden death syndrome(SDS) (Fusarium solani f. sp. glycinea) has increased in frequency since symptoms of the disease werefirst noted in 1993 (Anderson and Tenuta, 1998). The disease is found on sandy loam soils inassociation with infestations of soybean cyst nematode. The disease has become permanently

134
established in some fields and losses occur each year. Fusarium root rot and wilt (Fusarium solani, F.oxysporum) has increased in severity over the survey period. The disease occurs in hot weatherfollowing periods of heavy rain prior to pod set. It is found in all growing regions and is common inEastern Ontario.
Rhizoctonia root rot (Rhizoctonia solani) may occur at all stages of plant growth but it is frequentlyobserved in July during flowering. A typical zonate canker with alternating dark and light bands developson the lower stem. The disease is frequently associated with high organic matter and hot conditionsfollowing high rainfall. Northern stem canker (Diaporthe phaseolorum var. caulivora) has become morecommon recently. The incidence of this disease is higher under minimum tillage and may affect soybeanprior to flowering under hot humid conditions. Phomopsis seed rot (Phomopsis longicola) and pod andstem blight (Diaporthe phaseolorum var. sojae) are very weather dependent. Seed rot occurs morefrequently with warm wet weather prior to harvest. Charcoal rot (Macrophomina phaseolina) and brownstem rot (Phialophora gregata) appear to be increasing in importance, especially under hot dryconditions in August. Brown spot (Septoria glycines) downy mildew (Peronospora manchurica), purplestain (Cercospora kikuchii), powdery mildew (Microsphaera diffusa) and frogeye leafspot (Cercosporasojina) can be observed in most seasons but rarely cause yield problems. Brown spot is becoming moresevere especially if plants are under moisture or nutritional stress.
Viruses (soybean mosaic virus, tobacco ringspot virus) seldom cause significant yield losses in growers’fields; however, disease symptoms such as pod abortion and green stem are becoming more common.In 2000 random samples of green stem plants tested for bean pod mottle virus proved negative.
The single most important pathogen of soybean in Ontario is soybean cyst nematode (Heteroderaglycines) (SCN). Since it was first found in 1987 (Anderson et al., 1988), the nematode has increased indistribution and abundance. Fortunately, SCN resistant cultivars are available and yield losses arebeginning to decline in areas with a history of SCN. The nematode continues to spread to new areas tothe east and it is probable that SCN will remain the most important pathogen of soybean in Ontario for anumber of years. Yield losses of 20-40% in individual fields have been documented. Foliar symptomsmay or may not be evident in infested fields.
CONCLUSIONS: We expect soybean disease pressure to continue to increase in Ontario withdecreased crop rotation. SCN will increase in importance as the pest spreads to new areas of theprovince. Although resistant cultivars reduce yield losses, soil sampling and crop inspection are neededto identify the pest. The increase in pre and post emergent seedling diseases may be reduced in thefuture with an increased emphasis by industry on new seed treatments. The need for effective broadspectrum seed treatments is still high.
Further research needs to be done on the influence of reduced tillage practices on disease incidence. InOntario, residue-borne soybean diseases are increasing as a result of adoption by growers of goodconservation soil management. A balance between soil management practices and disease control mustbe found. Many early-season diseases are more severe when seed vigour is low. Both public andprivate soybean breeders need to continue to develop cultivars with high seedling vigour and newsources of resistance to the important soybean diseases in Ontario.
REFERENCES:Anderson, T.R., T.W. Welacky, H.T. Olechowski, G. Ablett and B.A. Ebsary. 1988. First report ofHeterodera glycines Ichinohe on soybeans in Ontario, Canada. Plant Dis. 72: 453.
Anderson, T.R., and A.U. Tenuta. 1998. First report of Fusarium solani f. sp. glycines causing suddendeath syndrome of soybean in Canada. Plant Dis. 82: 448.

135
Wrather, J.R., and T.R. Anderson, D.M. Arsyad, J. Gai, F. Lamberti, L.D. Ploper, H.H. Ram and J.T.Yorinori. 1997. Soybean disease loss estimates for the top ten producing countries during 1994. PlantDis. 81: 107-110.
Table 1. Yield loss estimates (%) caused by soybean diseases in 1994, 1996-2000 in Ontario.
DISEASES 1994 1996 1997 1998 1999 2000
Bacteria
1 Bacterial blight, Wildfire 0 0 tr 0 tr tr
Fungi
1 Seedling diseases1 0.5 0.5 0.6 0.7 0.7 12 Sclerotinia stem rot 0.5 0.5 0.4 0.4 0.3 0.93 Phytophthora root rot 0.5 0.5 0.5 0.5 0.5 0.84 Sudden Death Syndrome 0 0 0.02 0.06 0.07 0.35 Rhizoctonia root rot 0.05 0 0.15 0.25 0.03 0.36 Fusarium root rot 0 0.03 0.05 0.25 0.3 0.37 Stem canker 0.05 0.4 0.06 0.1 0.3 0.258 Phomopsis seed rot 0.05 0.2 0.1 0.05 0.05 0.29 Pod and Stem blight 0 0 0.1 0.05 0.05 0.1510 Charcoal rot 0.03 0.03 0.08 0.1 0.2 0.1511 Brown stem rot 0 0.03 0.06 0.1 0.2 0.1512 Brown spot 0.03 0.04 0.03 0.03 0.05 0.0813 Downy mildew 0.02 0.02 0.02 0.01 0.01 0.0114 Purple stain 0 0 0 0 0 0.0115 Powdery mildew 0 tr 0 tr tr 016 Frogeye leaf spot 0 0 0 0 0 017 Rhizoctonia aerial blight 0 0 0 0 0 018 Southern stem canker 0 0 0 0 0 0
Viruses
1 SMV, TRSV 0 0 0 0 0.02 0.01
Nematodes
1 Soybean cyst nematode 0.8 1.2 2.9 3.25 3 32 Root knot and other nematodes 0 0 0 0 0 0
Total yield loss to disease 2.53% 3.45% 5.07% 5.85% 5.48% 7.61%
1 Seedling diseases due to Rhizoctonia, Pythium, Fusarium, Phytophthora and Phomopsis.

136
CROP: Sugar beet
LOCATION: Southern Alberta
NAME AND AGENCY:S. D. Bardin and H.C. HuangAgriculture and Agri-Food CanadaResearch Centre, P.O. Box 3000, Lethbridge, Alberta T1J 4B1
TITLE: SURVEY OF DAMPING-OFF DISEASES OF SUGAR BEET IN SOUTHERN ALBERTA in 2000
INTRODUCTION: With a processing plant in Taber, southern Alberta is the only area of sugar beetproduction in Canada. The area contracted for sugar beet production has increased from 12,150 ha in1986 to 18,220 ha in 1999 with root yield reaching 850,000 tonnes in 1999 (Chaudhary 1998). With theexpansion of the sugar beet processing plant in 1998, sugar beet production is likely to expand further inthis area. Sugar beet is an important crop for rotation with cereals and legumes and for cropdiversification in western Canada. Nevertheless, it is highly susceptible to damping-off pathogens suchas Pythium sp. "group G", which is widespread in southern Alberta (Huang et al. 1992). A survey ofdamping-off diseases of sugar beet in southern Alberta was conducted during the growing season of2000.
METHODS: Twenty-six crops of sugar beet were surveyed for damping-off diseases between May 16and June 7. The survey covered the sugar beet growing area of southern Alberta, from Picture Butte toBow Island and south to Foremost. Emergence within a field was estimated by counting the number ofseedlings at 9 sites. The sites were located in three rows, randomly selected, approximately 30 m apartfrom one another. Each row had three sites, 4.5 m in length, that were 20 m apart in the row. Due to theprecision seeding used in commercial production of sugar beet in Alberta (one seed per 15 cm), a 4.5 msite consisted of 30 plants. Percent emergence was calculated by dividing the number of seedlings by30 and multiplying by 100. Soil samples were collected from the surveyed fields and tested forincidence of damping-off pathogens of sugar beet in the growth chamber. Three pots filled with soil fromeach surveyed crop were planted with seeds of sugar beet c.v. HM Bergen (five seeds per pot). Thepots were watered and put in propagator trays to produce high moisture condition for the development ofthe disease. The propagator trays were kept in a growth cabinet under controlled light and temperatureconditions (16 h day/8 h night; 20oC/15oC). The number of plants emerged was recorded after 14 daysand the percent emergence was calculated for each crop. Non-germinated seeds were collected,washed in sterile water, surface sterilized in 70% ethanol for 2 min, plated on potato dextrose agar(PDA) and incubated for 3 to 5 days. Fungi isolated from the seeds were purified on PDA and the genusof each fungus isolated was determined based on morphological characteristics.
RESULTS and DISCUSSION: The field survey showed that seedling emergence varied among crops.Of the 26 crops surveyed, seedling emergence was less than 50% in four crops, 50 to 65% in 12 crops,66 to 80% in seven crops and over 80% in three crops (Table 1). The four crops that showedemergence lower than 50% were surveyed on May 16 at which time seedling emergence may not havebeen complete, due to the long emergence period of sugar beet. Early June is therefore the best periodto assess seedling emergence in sugar beet seeds. The relationship between seedling emergence inthe field and disease incidence was assessed by testing the soils collected in growth chamberexperiments.
Results of soil testing showed that seedling emergence in soil collected from each field surveyed rangedfrom 26 to 94%. Severe disease was observed in six soils (emergence less than 60%), while 11 soilshad low disease (emergence of 61-80%) and nine soils had no disease (emergence over 80%) (data notshown). Severely diseased crops therefore account for 23 % of the fields surveyed. When comparing

137
indoor and outdoor seedling emergence, four of the soils rated as having severe disease incidence hademergence in the field around 63% ( Table 1). One of the soils with 34% seedling emergence in theindoor experiment also showed very low emergence in the field (36%) (Table 1). Another soil thatshowed low emergence in the indoor experiment (46%) had an emergence level of 72% in the field(Table 1). Pythium sp., likely Pythium ultimum "group G" that is widespread in sugar beet in southernAlberta (H.C. Huang, unpublished data), was isolated from non-germinated seeds from five of the fieldsrated as severely diseased. The fungus Rhizoctonia solani was found in two of the crops, with fieldemergence of 55% and 68%. Both soils had a 74% seedling emergence in the indoor experiment. These data suggest that Pythium is the main cause of poor stands of sugar beet in southern Alberta,while Rhizoctonia is of minor importance. High disease pressure from a pathogen such as Pythium sp.may be due to field history or crop management such as growing sugar beet in rotation with othersusceptible host crops, like canola, safflower and dry pea.
REFERENCESChaudhary, G.N. 1998. The economics of sugar beet production in Alberta 1997. Agdex 171/821-5.25pp.
Huang, H.C., R.J. Morrison, H.-H. Mundel, D.J.S. Barr, G.R. Klassen, and J. Bochko. 1992. Pythium sp."group G", a form of Pythium ultimum causing damping-off of safflower. Can. J. Plant Pathol.14:229-232.
Table 1. Survey of seedling emergence and incidence of pythium damping-off of sugar beet insouthern Alberta in 2000.
%EMERGENCE
# OF FIELDS INCIDENCE OF PYTHIUM SP.IN SOIL
81-100 3 0
66-80 7 1
50-65 12 4
< 50 4 1

138
CROP: Sunflower
LOCATION: Manitoba and Saskatchewan
NAME AND AGENCY:K. Y. Rashid1, M. Desjardins2 and R. G. Platford3
1 Agriculture and Agri-Food Canada, Research Centre Unit 100-101, Route 100, Morden, Manitoba R6M 1Y5.2 Manitoba Agriculture and Food, Crop Diagnostic Centre. 201-545 University Crescent, Winnipeg, Manitoba R3T 5S6.3 Manitoba Agriculture, Soils and Crops Branch Box 1149, Carman, Manitoba R0G 0J0
TITLE: DISEASES OF SUNFLOWER IN MANITOBA IN 2000
METHODS: Forty-nine sunflower crops in southern Manitoba and three crops in southeasternSaskatchewan were surveyed in 2000. Ninety percent of the crops were confectionery hybrids and 10%were oilseed hybrids. Eight crops were surveyed during the last week of July, and 44 crops during thelast week of August. Crops were surveyed along preplanned routes in the major areas of sunflowerproduction. Each crop was sampled by two persons walking 100 m in opposite directions in the fieldfollowing an "M" pattern. Diseases were identified by symptoms and the percent incidence of downymildew (Plasmopara halstedii), sclerotinia wilt or head and stem infections (Sclerotinia sclerotiorum),rhizopus head rot (Rhizopus spp.), and verticillium wilt (Verticillium dahliae) were estimated. Diseaseseverity for rust (Puccinia helianthi), leaf spots (Septoria helianthi and Alternaria spp.), powdery mildew(Erysiphe cichoracearum) and stem infections (Phoma spp. & Phomopsis spp.) were measured aspercent leaf and stem area infected. A disease index was calculated for each disease in every cropbased on disease incidence or disease severity (Table 1).
In addition, 31 samples of sunflower plants were submitted for analysis to the Manitoba Agriculture andFood Crop Diagnostic Centre by agricultural representatives and growers.
RESULTS AND COMMENTS: Seventy percent of the sunflower crops surveyed in 2000 had excellent togood stands and vigour, and only 30% had moderate stands and vigour. Forty-three percent of thecrops were seeded late and were expected to mature very late. Growing conditions were generallygood except for abnormally wet conditions at maturity time which resulted in high incidence of head rotin several crops. Traces to 5% infestation of sunflower midge (Contarinia schulzi) were observed inseveral crops in the Red River Valley, however, the severity of infestation was extremely low incomparison to the last two years (1, 2).
Sclerotinia diseases were more prevalent in 1999 than in 1998 (1). Sclerotinia wilt/basal stem infectionwas present in 67% of the crops surveyed, with incidence ranging from trace to 15% infected plants(Table 1). Sclerotinia head rot and mid-stem breakage caused by ascospore infections were present in65% of the crops surveyed with incidence ranging from trace to 15% infected plants. Visits to somesunflower crops in southern Manitoba towards the end of September revealed higher incidences of headrot than observed during the August survey due, perhaps, to frequent rainfall in late August.
Verticillium wilt was present in 54% of the crops surveyed, with incidence ranging from trace to 30%infected plants (Table 1). The prevalence and incidence of verticillium wilt in 2000 was lower than in1999 (1) in spite of the increased acreage of confectionery hybrids (90% of total acreage).

139
Downy mildew was observed in 20% of the crops surveyed but the incidence was very low (trace to 1%)in most crops (Table 1). This is the third consecutive year where dry soil conditions and above normalsoil temperatures at the seedling stage may have contributed to low incidence of downy mildew.
Rust was present in 40% of the crops surveyed, with severity ranging from trace to 5% leaf area affectedin two-thirds of the crops and up to 60% leaf area affected in one-third of the crops (Table 1). Althoughthe incidence of rust was lower in 2000 than in 1999, the severity in most crops surveyed was higher in2000 than in 1999 (1, 2).
Traces to 10% leaf area covered by spots caused by Septoria helianthi and Alternaria spp. wereobserved in 30% of crops surveyed in 2000. Phoma stem lesions were present in 10% of the crops attrace to 5% stem area affected (Table 1). Trace levels of rhizopus head rot were observed in 10% of thecrops. Trace levels of phomopsis stem lesions were observed in a few crops. Traces to 5% leaf areaaffected by powdery mildew were observed in two crops towards the end of the season.
Of the 31samples submitted to the Manitoba Agriculture and Food Crop Diagnostic Centre, threesamples were identified as root rot caused by Fusarium spp., two phoma black stem caused by Phomaspp., one downy mildew, one aster yellows caused by a phytoplasma, one damping off caused byPythium spp, and one head rot caused by Sclerotinia sclerotiorum. In addition to diseases, threesamples were affected by insects, four by environmental and physiological factors, and 15 were affectedby herbicide injury.
ACKNOWLEDGEMENTS: The assistance of Lawrence Wiebe and Maurice Penner in conducting thissurvey is gratefully acknowledged.
REFERENCES
1. Rashid, K. Y. and R. G. Platford. 2000. Diseases of sunflower in Manitoba in 1999.Can. Plant Dis. Surv. 80:112-113. (http://res2.agr.ca/london/pmrc/english/report/repmenu.html )
2. Rashid, K. Y. and R. G. Platford. 1999. Diseases of sunflower in Manitoba in 1998.Can. Plant Dis. Surv. 79:133-134. (http://res2.agr.ca/london/pmrc/english/report/repmenu.html )

140
Table 1. Prevalence and intensity of diseases and estimated plant stands in sunflower crops insouthern Manitoba and southeastern Saskatchewan in 2000.
DISEASE CROPS AFFECTED DISEASE/STAND INDEX1
NO. % MEAN RANGE
Sclerotinia wilt 35 67 1.0 T-2
Sclerotinia head rot/stem rot 34 65 1.1 T-3
Verticillium wilt 28 54 1.2 T-2
Downy mildew 10 20 0.5 T-1
Rust 21 40 1.6 T-4
Septoria leaf spot 15 30 1.0 T-2
Powdery mildew 2 4 0.5 T-1
Phoma stem lesions 4 10 1.0 T-2
Earliness2 22 46 1.7 1-4
Stand 15 30 1.4 1-3
Vigour 16 30 1.4 1-3
1 Disease index is based on a scale of 1 to 5: Trace (T) = < 1%, 1= 1% to 5% disease, 2= 5% to 20%disease, 3= 20% to 40% disease, 4= 40% to 60% disease, and 5= greater than 60% disease levels. Index is based on disease incidence for downy mildew, verticillium wilt, and sclerotinia infections; andon disease severity measured as percent leaf area affected for rust, leaf spots, powdery mildew andphoma stem infections.
2 Indexes for earliness, stand, and vigour are based on 1-5 scale (1= early/very good and 5= late/very poor). Only 22 crops were late, 15 crops had poor stand, and 16 crops had poor vigour).
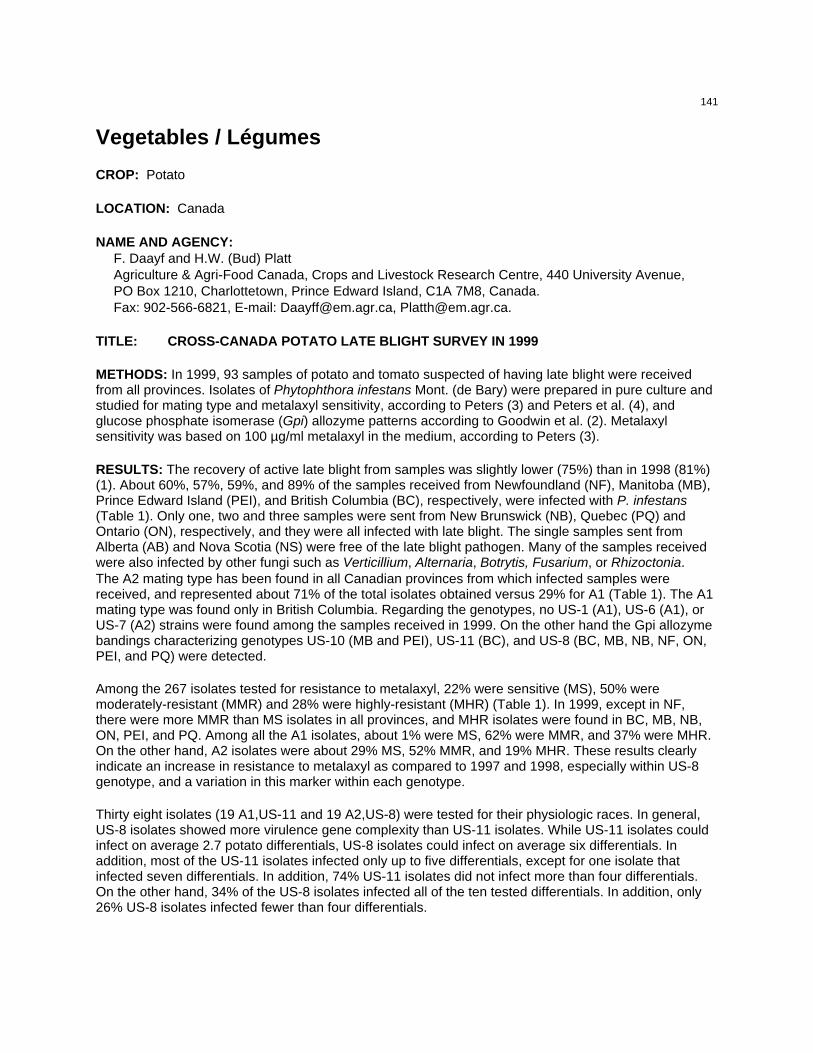
141
Vegetables / Légumes
CROP: Potato
LOCATION: Canada
NAME AND AGENCY:F. Daayf and H.W. (Bud) PlattAgriculture & Agri-Food Canada, Crops and Livestock Research Centre, 440 University Avenue,PO Box 1210, Charlottetown, Prince Edward Island, C1A 7M8, Canada.Fax: 902-566-6821, E-mail: [email protected], [email protected].
TITLE: CROSS-CANADA POTATO LATE BLIGHT SURVEY IN 1999
METHODS: In 1999, 93 samples of potato and tomato suspected of having late blight were receivedfrom all provinces. Isolates of Phytophthora infestans Mont. (de Bary) were prepared in pure culture andstudied for mating type and metalaxyl sensitivity, according to Peters (3) and Peters et al. (4), andglucose phosphate isomerase (Gpi) allozyme patterns according to Goodwin et al. (2). Metalaxylsensitivity was based on 100 µg/ml metalaxyl in the medium, according to Peters (3).
RESULTS: The recovery of active late blight from samples was slightly lower (75%) than in 1998 (81%)(1). About 60%, 57%, 59%, and 89% of the samples received from Newfoundland (NF), Manitoba (MB),Prince Edward Island (PEI), and British Columbia (BC), respectively, were infected with P. infestans(Table 1). Only one, two and three samples were sent from New Brunswick (NB), Quebec (PQ) andOntario (ON), respectively, and they were all infected with late blight. The single samples sent fromAlberta (AB) and Nova Scotia (NS) were free of the late blight pathogen. Many of the samples receivedwere also infected by other fungi such as Verticillium, Alternaria, Botrytis, Fusarium, or Rhizoctonia.The A2 mating type has been found in all Canadian provinces from which infected samples werereceived, and represented about 71% of the total isolates obtained versus 29% for A1 (Table 1). The A1mating type was found only in British Columbia. Regarding the genotypes, no US-1 (A1), US-6 (A1), orUS-7 (A2) strains were found among the samples received in 1999. On the other hand the Gpi allozymebandings characterizing genotypes US-10 (MB and PEI), US-11 (BC), and US-8 (BC, MB, NB, NF, ON,PEI, and PQ) were detected.
Among the 267 isolates tested for resistance to metalaxyl, 22% were sensitive (MS), 50% weremoderately-resistant (MMR) and 28% were highly-resistant (MHR) (Table 1). In 1999, except in NF,there were more MMR than MS isolates in all provinces, and MHR isolates were found in BC, MB, NB,ON, PEI, and PQ. Among all the A1 isolates, about 1% were MS, 62% were MMR, and 37% were MHR.On the other hand, A2 isolates were about 29% MS, 52% MMR, and 19% MHR. These results clearlyindicate an increase in resistance to metalaxyl as compared to 1997 and 1998, especially within US-8genotype, and a variation in this marker within each genotype.
Thirty eight isolates (19 A1,US-11 and 19 A2,US-8) were tested for their physiologic races. In general,US-8 isolates showed more virulence gene complexity than US-11 isolates. While US-11 isolates couldinfect on average 2.7 potato differentials, US-8 isolates could infect on average six differentials. Inaddition, most of the US-11 isolates infected only up to five differentials, except for one isolate thatinfected seven differentials. In addition, 74% US-11 isolates did not infect more than four differentials.On the other hand, 34% of the US-8 isolates infected all of the ten tested differentials. In addition, only26% US-8 isolates infected fewer than four differentials.

142
Thus, variation continues to occur in P. infestans populations causing potato late blight in Canada,especially in levels of resistance to metalaxyl. The cause of the changing nature of the pathogenpopulations and their impact on disease and its control require further study. Also, this year, we receivedtomato samples from BC, from which the A1 mating type was isolated. Since this plant can be apotential source of inoculum for potato, it is important to monitor tomato late blight in crops and homegardens across Canada.
REFERENCES:
1. Daayf, F. and Platt, H. W. 2000. Canadian potato late blight survey in 1998. Can. Plant Dis.Surv. 80: 118-120. ( http://res2.agr.ca./london/pmrc/ )
2. Goodwin, S. B., Schneider, R. E., and Fry, W. E. 1995. Use of cellulose-acetateelectrophoresis for rapid identification of allozyme genotype of Phytophthora infestans. PlantDis. 79: 1181-1185.
3. Peters, R. D. 1998. Characterization of evolving populations of Phytophthora infestanscausing late blight of potato in Canada. Ph.D. thesis, University of Guelph, ON, Canada.
4. Peters, R. D., Platt, H. W., and Hall, R. 1998. Long-term survival of Phytophthora infestanson liquid media prepared from autoclaved seeds. Can. J. Plant Pathol. 20:165-170.
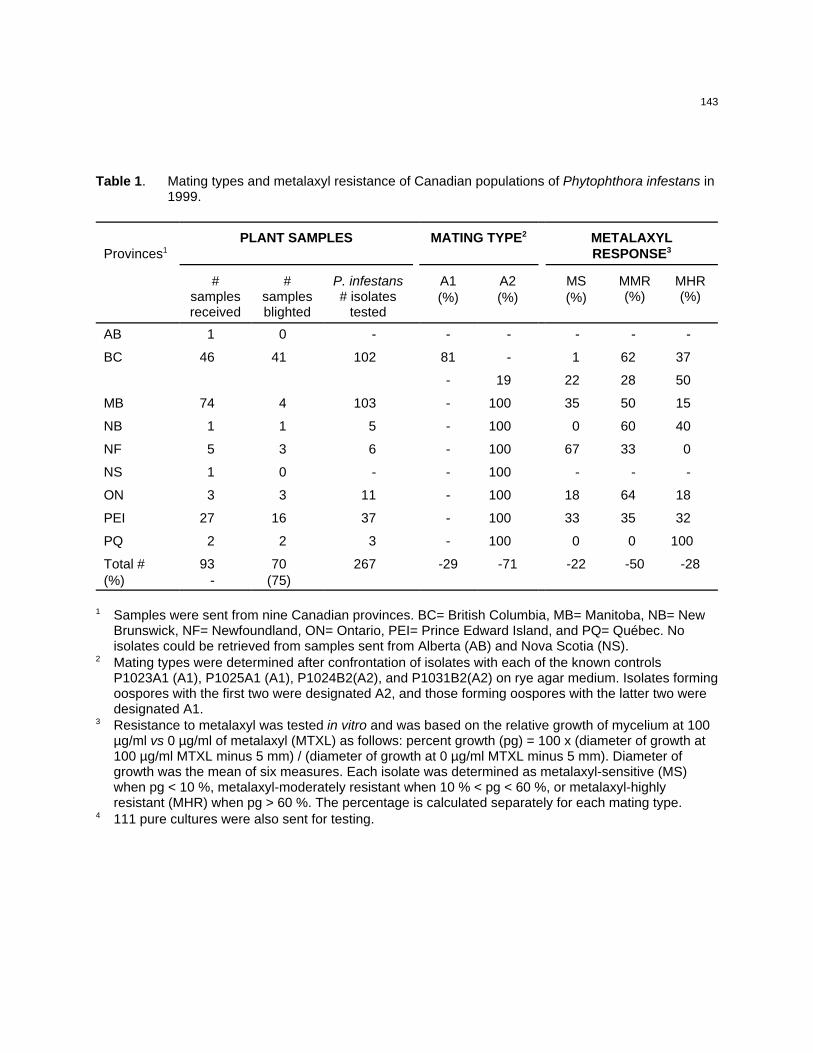
143
Table 1. Mating types and metalaxyl resistance of Canadian populations of Phytophthora infestans in1999.
Provinces1PLANT SAMPLES MATING TYPE2 METALAXYL
RESPONSE3
#samplesreceived
#samplesblighted
P. infestans# isolates
tested
A1(%)
A2(%)
MS(%)
MMR(%)
MHR(%)
AB 1 0 - - - - - -
BC 46 41 102 81 - 1 62 37
- 19 22 28 50
MB 74 4 103 - 100 35 50 15
NB 1 1 5 - 100 0 60 40
NF 5 3 6 - 100 67 33 0
NS 1 0 - - 100 - - -
ON 3 3 11 - 100 18 64 18
PEI 27 16 37 - 100 33 35 32
PQ 2 2 3 - 100 0 0 100
Total #(%)
93-
70(75)
267 -29 -71 -22 -50 -28
1 Samples were sent from nine Canadian provinces. BC= British Columbia, MB= Manitoba, NB= NewBrunswick, NF= Newfoundland, ON= Ontario, PEI= Prince Edward Island, and PQ= Québec. Noisolates could be retrieved from samples sent from Alberta (AB) and Nova Scotia (NS).
2 Mating types were determined after confrontation of isolates with each of the known controlsP1023A1 (A1), P1025A1 (A1), P1024B2(A2), and P1031B2(A2) on rye agar medium. Isolates formingoospores with the first two were designated A2, and those forming oospores with the latter two weredesignated A1.
3 Resistance to metalaxyl was tested in vitro and was based on the relative growth of mycelium at 100µg/ml vs 0 µg/ml of metalaxyl (MTXL) as follows: percent growth (pg) = 100 x (diameter of growth at100 µg/ml MTXL minus 5 mm) / (diameter of growth at 0 µg/ml MTXL minus 5 mm). Diameter ofgrowth was the mean of six measures. Each isolate was determined as metalaxyl-sensitive (MS)when pg < 10 %, metalaxyl-moderately resistant when 10 % < pg < 60 %, or metalaxyl-highlyresistant (MHR) when pg > 60 %. The percentage is calculated separately for each mating type.
4 111 pure cultures were also sent for testing.

144
Fruit, Nuts and Berries, Ornamentals and Turfgrass,/ Fruits,fruits à écale, et baies, plantes ornementales et gazon
CROP: Blueberry (Vaccinium corymbosum L.)
LOCATION: British Columbia
NAME AND AGENCY:E. HudginsBritish Columbia Ministry of Agriculture, Food, and Fisheries, Abbotsford Agriculture Centre,1767 Angus Campbell Rd., Abbotsford, BC, V3G-2M3. email: [email protected]
TITLE: SURVEY OF BLUEBERRY SCORCH VIRUS IN HIGHBUSH BLUEBERRIES IN BRITISHCOLUMBIA, 2000
INTRODUCTION: In June 2000, Blueberry Scorch Virus (BlSV) was identified for the first time in BritishColumbia. The first finding was from mature ‘Berkeley’ highbush blueberry plants exhibiting extensiveblossom blighting and dieback of young leaves and shoots. A week later, the virus was detected in thecultivars ‘June’ and ‘Weymouth’ located at a considerable distance from the infected ‘Berkeley’ field. Asurvey was undertaken to determine the distribution of BlSV in commercial blueberry fields across theLower Mainland.
METHODS: In July and August 2000, 141 blueberry plants were sampled from 25 farms where growersor consultants reported suspicious symptoms. New leaf growth from branches exhibiting symptoms wasused for testing, although some symptomless plants were also sampled. Two neighbouring fields weresampled more intensively in order to determine the field distribution. DAS-ELISA (Agdia Inc.) was usedto detect BlSV. Samples were also tested for blueberry shock virus, which has not been detected in BC.
RESULTS AND COMMENTS: BlSV was detected in many different cultivars and ages of plants (Table1), and it was present in most regions sampled across the Lower Mainland (Figure 1). BlSV wasdetected in both symptomatic and symptomless plants selected in two neighbouring fields (Figure 2),demonstrating that a lack of symptoms should not be used as an indicator for the absence of BlSV. Occasional symptom expression in cultivars reported to be symptomless in Washington State raises thepossibility that the BlSV strain in BC is different from the BlSV in Washington State. Investigation isunderway to determine if BC has the New Jersey (Sheep Pen Hill) strain, the Washington strain, or bothstrains.
The widespread distribution of BlSV was alarming. Research is urgently needed to understand thedisease and its potential impact on BC blueberry production. All samples were negative for blueberryshock virus.

145
Table 1. Cultivar and age of blueberry plant samples testing positive for Blueberry Scorch Virus inBritish Columbia’s Lower Mainland.
LOCATION CULTIVAR APPROXIMATE PLANT AGE (years)
Abbotsford Berkeley >15Bluecrop >15unknown 3unknown >15
Surrey June >15Weymouth >15Duke unknownunknown 5unknown 5unknown >15Toro 5Duke 2Bluecrop 4
Delta Duke unknownMatsqui Duke 4
Bluecrop >15Bluejay >15
Pitt Meadows Dixi >15June >15unknown 8Bluecrop >15unknown >15
Port Coquitlam Dixi >15Richmond Bluecrop >15
Weymouth >15unknown >15June >15Rancocas >15

146
Figure 1. Regions sampled for Blueberry Scorch Virus in Lower Mainland of British Columbia in 2000.Numbers in parentheses indicate number of fields testing positive / total number of fieldssampled.

147
Figure 2. Distribution of Blueberry Scorch Virus in 2 adjacent fields in Lower Mainland of BC.

148
CROP: Grape (Vitis vinifera)
LOCATION: Niagara Peninsula, Ontario
NAME AND AGENCY:W. McFadden-Smith1 and K.W. Ker2
1 Department of Biological Sciences, Brock University, St. Catharines, ON, L2S 3A1 Telephone: (905) 688-5550 ext 4814; Facsimile:(905) 688-1855; e-mail: [email protected] Ker Crop Management Services, Grimsby, ON,
TITLE: SURVEY FOR FLAG LEAF SYMPTOMS OF POWDERY MILDEW IN GRAPE IN NIAGARAPENINSULA, ONTARIO, 1991-1994
INTRODUCTION AND METHODS: Uncinula necator, causal agent of powdery mildew of grapevine, hasbeen reported to overwinter as dormant mycelium in buds and as cleistothecia lodged in trunk bark. Knowledge of the source of primary inoculum is important for making decisions regarding chemicalcontrol early in the growing season. Infections surviving in dormant shoots are expressed as “flagshoots” as early as bud break in most grape growing areas in the world. Sporulation can occur on theseflag shoots almost immediately, providing a source of primary inoculum very early in the growingseason. Ascosporic infections arising from inoculum overwintering in cleistothecia require specificenvironmental conditions for release of ascospores (0.25 mm rain and minimum of 10oC). A survey forflag shoots was conducted when shoots were 15-25 cm in length (mid-June) in commercial vineyards inthe Niagara Peninsula, 1991-1994. All or some of the following cultivars were present at each site andwere sampled separately: Riesling, Chardonnay, S.V. 23-512, Gewurztraminer, Cabernet Sauvignon,Cabernet Franc. A total of 22, 24 23 and 21 sites were included in 1991, 1992, 1993 and 1994,respectively. At each site for each cultivar, all shoots on each of 100 randomly selected vines wereexamined for the presence of flag shoots.
RESULTS AND COMMENTS: No flag shoots were recorded at any of the sites in any cultivar over the4-year period of the survey implying that flag shoots are not the source of primary inoculum for U.necator in the Niagara region. Similar findings have been reported in New York. (1)
1. Pearson, R.C. and D.M. Gadoury. 1987. Cleistothecia, the source of primary inoculum for grapepowdery mildew in New York. Phytopathology 77:1509-1514.

149
CROP / CULTURE: Peach, Nectarine, Apricot, Plum
LOCATION / EMPLACEMENT: Ontario, British Columbia, Quebec, Nova Scotia
NAME AND AGENCY / NOM ET ORGANISATION:Robert FavrinPlant Health Survey Coordinator, Canadian Food Inspection Agency (CFIA)3851 Fallowfield Road, Nepean, ON K2H 8P9
TITLE / TITRE: OUTBREAK INVESTIGATION AND DETECTION SURVEY FOR PLUM POXPOTYVIRUS IN 2000
INTRODUCTION: Plum pox is the most serious disease of plum, apricot and peach in Europe. It iscaused by the plum pox virus (PPV). Different strains of the virus occur with variable host susceptibilityand symptoms. Fruit quality, size and quantity are affected, often requiring removal of infected trees. Yield and overall economic losses have been catastrophic to plum and peach growers in manycountries. On heavily infected trees, fruit can drop 20-30 days before the normal maturity date and fruitthat remains on the tree may lack flavour and be low in sugar content. The main source of PPV isinfected trees or budwood. The virus is spread locally by several species of aphids.
First identified in Bulgaria, plum pox is now reported in most European countries, in parts of Asia andnorthern Africa, and in South America (Chile). In October 1999, the D-strain of PPV was discovered onpeaches grown in Adams County, Pennsylvania. This was the first report of PPV in North America andprompted the CFIA to initiate surveys in Canada in 2000, which are reported here.
METHODS: Initially, the survey targeted orchards which had been planted with material imported fromPennsylvania in the past 3-4 years. This material (all peach or nectarine) was distributed among sevengrowers, one of whom was in Nova Scotia with the remainder in the Niagara region. In blocks where thePennsylvania material could be identified, all trees were sampled individually at 12 leaves per tree andeach tree considered a separate sample. For a few blocks, the trees imported from Pennsylvania wereinter-planted with existing trees and could not be specifically identified. In such cases, the blocks werecomposite sampled according to a systematic random sampling protocol. The starting point for samplinga block was chosen by randomly selecting the start tree from among the first four trees in one corner ofthe block. Each composite sample contained 12 leaves collected from a group of four consecutive treesin a row (3 leaves per tree). Twelve trees were then counted and skipped followed by the collection ofanother composite sample from the subsequent four trees. This pattern was continued throughout theentire block so that 25% of the trees were included in composite samples. The composite samplingprotocol was the principal survey method used for the national detection survey which was implementedafter the discovery of the first PPV positive.
A triple antibody sandwich (TAS-ELISA) was used as the main diagnostic method in the survey(monoclonal antibody: 5B-IVIA, Durvis s.I, Spain). Details of the methodology are described in the CFIACentre for Plant Health test protocol TF0001-01. Samples were tested at three CFIA laboratories(Sidney, B.C., Charlottetown, P.E.I. and Nepean, Ontario). Sample preparation support was provided bylaboratories of Agriculture and Agri-Food Canada in Summerland, British Columbia and Vineland,Ontario.
RESULTS AND COMMENTS: On June 23, 2000, the CFIA confirmed the presence of PPV in the townof Niagara-on-the-Lake, Ontario. PPV was discovered in three ‘Fantasia’ nectarine trees in twocommercial orchard blocks owned by two different growers, located about 3 km apart. Laboratorytesting by the CFIA’s Centre for Plant Health in Sidney, B.C. confirmed the virus was PPV strain-D.

150
A large-scale survey was implemented that included all the main stone fruit production areas in Canada. Cherries were excluded from the survey because they are not susceptible to the common strains ofPPV. Table 1 summarizes the numbers of samples collected in each of the provinces involved. Themajority of the samples were collected as part of a national PPV detection survey or from delimitationsurveys around positive blocks using the composite method described above. In total, 70-100% of thecommercial stone fruit production in Ontario was sampled in most of the production districts. In Quebecand Nova Scotia all commercial stone fruit orchards were sampled and in British Columbia about 30% ofthe production was randomly selected for inclusion in the survey. The figures in Table 1 also include asmall number of individual-tree samples collected from all mother blocks across Canada, as well as asurvey of 15% of the saleable PPV-susceptible nursery stock (fruit tree and ornamentals) within theNiagara region.
Table 1. PPV-susceptible Prunus samples collected in Canada in 2000.
PROVINCE #SAMPLES1
# POSITIVE SITELOCATIONS
# POSITIVE SAMPLES
Ontario 100914 572 947
British Columbia 9043 0 0
Nova Scotia 1377 1 43
Quebec 784 0 0
1 Figures include individual-tree sampling, composite samples, as well as a small number of samplescollected for strain typing and ad hoc inquiries.
2 53 in the Niagara Peninsula, 2 near Blenheim, 1 near Simcoe, and 1 near Fonthill (all sites werecomprised of blocks in commercial fruit orchards with the exception of one sample taken from a blockof fruit tree nursery stock planted within a commercial orchard)
3 In the initial survey in Nova Scotia, a single positive composite was detected. The block containingthe positive was re-sampled on an individual tree basis (each tree being a separate sample) andthree additional trees tested positive.
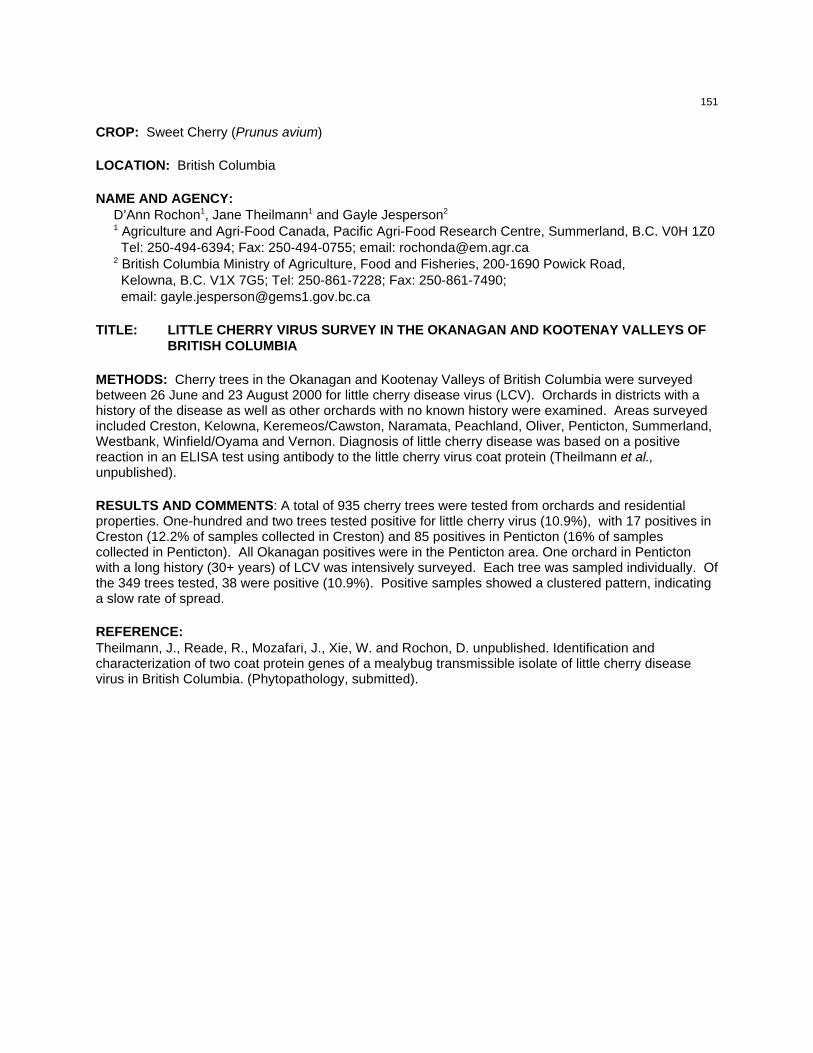
151
CROP: Sweet Cherry (Prunus avium)
LOCATION: British Columbia
NAME AND AGENCY:D’Ann Rochon1, Jane Theilmann1 and Gayle Jesperson2
1 Agriculture and Agri-Food Canada, Pacific Agri-Food Research Centre, Summerland, B.C. V0H 1Z0 Tel: 250-494-6394; Fax: 250-494-0755; email: [email protected] British Columbia Ministry of Agriculture, Food and Fisheries, 200-1690 Powick Road, Kelowna, B.C. V1X 7G5; Tel: 250-861-7228; Fax: 250-861-7490; email: [email protected]
TITLE: LITTLE CHERRY VIRUS SURVEY IN THE OKANAGAN AND KOOTENAY VALLEYS OFBRITISH COLUMBIA
METHODS: Cherry trees in the Okanagan and Kootenay Valleys of British Columbia were surveyedbetween 26 June and 23 August 2000 for little cherry disease virus (LCV). Orchards in districts with ahistory of the disease as well as other orchards with no known history were examined. Areas surveyedincluded Creston, Kelowna, Keremeos/Cawston, Naramata, Peachland, Oliver, Penticton, Summerland,Westbank, Winfield/Oyama and Vernon. Diagnosis of little cherry disease was based on a positivereaction in an ELISA test using antibody to the little cherry virus coat protein (Theilmann et al.,unpublished).
RESULTS AND COMMENTS: A total of 935 cherry trees were tested from orchards and residentialproperties. One-hundred and two trees tested positive for little cherry virus (10.9%), with 17 positives inCreston (12.2% of samples collected in Creston) and 85 positives in Penticton (16% of samplescollected in Penticton). All Okanagan positives were in the Penticton area. One orchard in Pentictonwith a long history (30+ years) of LCV was intensively surveyed. Each tree was sampled individually. Ofthe 349 trees tested, 38 were positive (10.9%). Positive samples showed a clustered pattern, indicatinga slow rate of spread.
REFERENCE:Theilmann, J., Reade, R., Mozafari, J., Xie, W. and Rochon, D. unpublished. Identification andcharacterization of two coat protein genes of a mealybug transmissible isolate of little cherry diseasevirus in British Columbia. (Phytopathology, submitted).

152
Forest trees/ Arbres forestiers
CROP / CULTURE: Balsam Fir
LOCATION / REGION: Québec
NAME AND AGENCY / NOM ET ORGANISME:V. Vujanovic and M. St-ArnaudInstitut de recherche en biologie végétale (IRBV), Université de Montréal & Jardin botanique deMontréal, 4101 est, rue Sherbrooke, Montréal, Québec, Canada H1X 2B2Telephone : (514) 872-0447; Facsimile : (514) 872 9406; e-mail: [email protected]
TITLE/TITRE: PATHOGENIC FUNGAL SPECIES ON BALSAM FIR IN SOUTHERN QUEBEC
METHODS: The incidence of Abies balsamea (L.) Mill. (Balsam Fir) diseases was assessed in fourgroups of three trees with symptomatic branches (branch and needle necrosis and needle cast) in theSherbrooke region, Québec, in 1999. Two small branches (30 cm long) were collected randomly fromeach tree group and used for disease assessment, pathogen isolation on agar media (potato dextroseagar and malt agar) and fungus species identification. Diseases were grouped by their isolationfrequency, on the following scale : +, occasionally present (1-10%), ++ frequent (10-25%) and +++, veryfrequent (>25%).
RESULTS AND COMMENTS: Results are presented in Table 1. Of 13 identified fungal species, seven(54%) have not been reported previously on A. balsamea in Quebec (SPPQ/QSPP, 1996). The needlepathogens Cytospora friesii, Phaeocryptopus nudus and Phyllosticta sp. had the largest incidence(>25%). Furthermore, Fusicoccum abietinum dominated (10-25%) on buds and twigs and the rustpathogen Melampsorella caryophyllacearum was frequently found (10-25%) causing systemic brooms.Other fungal species were occasionally present, including Leptomelanconium abietis on chloroticneedles recently described by Vujanovic and St-Arnaud (2001).
REFERENCES:Société de Protection des plantes du Québec/Quebec Society for the Protection of Plants (SPPQ/QSPP)1996. Names of plant diseases in Canada. Ministère de l’Agriculture, des Pêcheries et de l’Alimentationdu Québec (MAPAQ), Québec. 476 pp.
Vujanovic, V. & St-Arnaud, M. 2001. Leptomelanconium abietis sp. nov. on Abies balsamea. Mycologia93: 211-214.
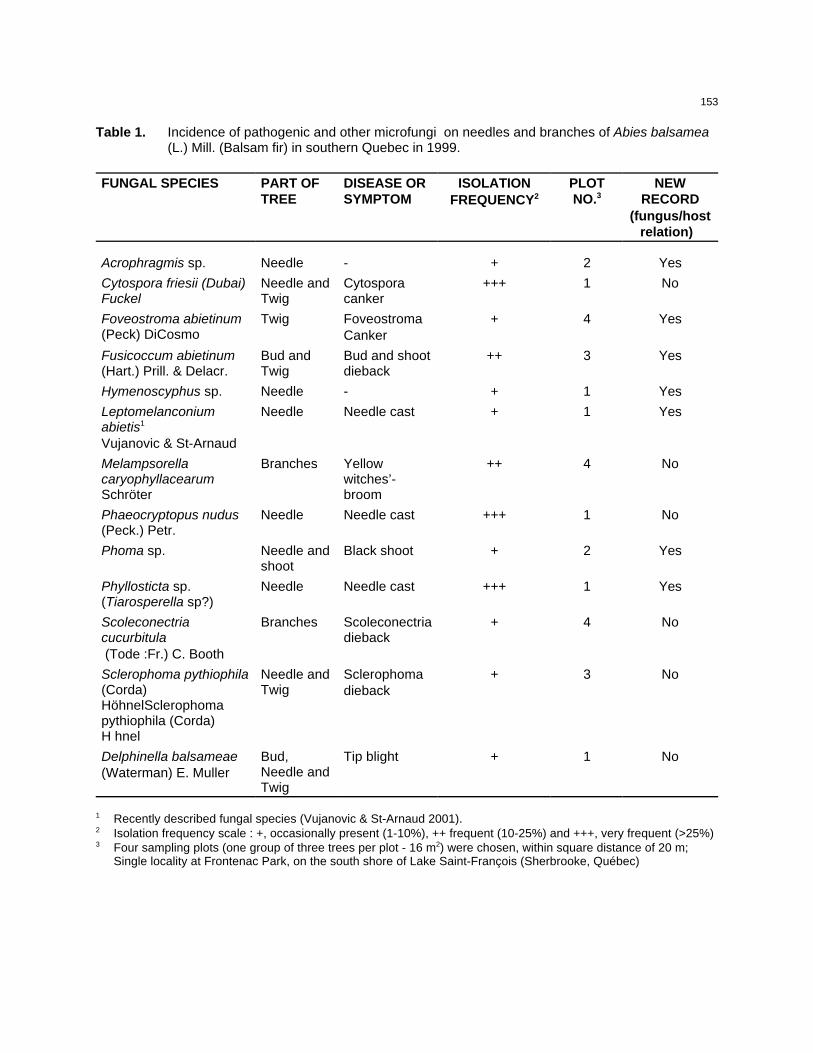
153
Table 1. Incidence of pathogenic and other microfungi on needles and branches of Abies balsamea(L.) Mill. (Balsam fir) in southern Quebec in 1999.
FUNGAL SPECIES PART OFTREE
DISEASE ORSYMPTOM
ISOLATIONFREQUENCY2
PLOTNO.3
NEWRECORD
(fungus/hostrelation)
Acrophragmis sp. Needle - + 2 YesCytospora friesii (Dubai)Fuckel
Needle andTwig
Cytosporacanker
+++ 1 No
Foveostroma abietinum(Peck) DiCosmo
Twig FoveostromaCanker
+ 4 Yes
Fusicoccum abietinum(Hart.) Prill. & Delacr.
Bud andTwig
Bud and shootdieback
++ 3 Yes
Hymenoscyphus sp. Needle - + 1 YesLeptomelanconiumabietis1
Vujanovic & St-Arnaud
Needle Needle cast + 1 Yes
MelampsorellacaryophyllacearumSchröter
Branches Yellowwitches’-broom
++ 4 No
Phaeocryptopus nudus(Peck.) Petr.
Needle Needle cast +++ 1 No
Phoma sp. Needle and shoot
Black shoot + 2 Yes
Phyllosticta sp.(Tiarosperella sp?)
Needle Needle cast +++ 1 Yes
Scoleconectriacucurbitula (Tode :Fr.) C. Booth
Branches Scoleconectriadieback
+ 4 No
Sclerophoma pythiophila(Corda)HöhnelSclerophomapythiophila (Corda)H hnel
Needle andTwig
Sclerophomadieback
+ 3 No
Delphinella balsameae(Waterman) E. Muller
Bud,Needle andTwig
Tip blight + 1 No
1 Recently described fungal species (Vujanovic & St-Arnaud 2001).2 Isolation frequency scale : +, occasionally present (1-10%), ++ frequent (10-25%) and +++, very frequent (>25%)3 Four sampling plots (one group of three trees per plot - 16 m2) were chosen, within square distance of 20 m;
Single locality at Frontenac Park, on the south shore of Lake Saint-François (Sherbrooke, Québec)
154
CROP / CULTURE: Butternut
LOCATION / REGION: Eastern Canada
NAME AND AGENCY / NOM ET ORGANISME:A. Hopkin,1 L. Innes2, and K. Harrison3
1 Canadian Forest Service, Sault Ste. Marie, ON. [email protected] Ministère des ressources naturelle, Quebec, QC.3 Canadian Forest Service, Fredericton, N.B.
TITLE / TITRE: DISTRIBUTION OF BUTTERNUT CANKER (SIROCOCCUS CLAVIGIGNENTI-JUGLANDACEARUM) IN EASTERN CANADA
INTRODUCTION: Butternut (Juglans cinerea L.) in Canada and the United States is endangered bybutternut canker disease. Infection by the fungus Sirococcus clavigignenti-juglandacearum N.B. Nair,Kostichka & Kuntz, causes branch and stem cankers that can result in severe damage to the tree andoften whole tree mortality. It is not known how long this disease has existed in North America, however itisbelieved to have been introduced (Furnier et al 1999). It was first reported from Wisconsin in 1967, but the causal agent was not described until 1979. In Canada, butternut canker was first collected in Quebecin 1990 (Innes and Rainville 1996), and then in Ontario in 1991 (Davis et al 1992), and in NewBrunswick in 1997 (Harrison et al. 1998). It is known from the aging of cankers that the disease hasbeen present in Ontario for at least 20 years. In 1990, the US Forest Service listed butternut as asensitive species in the United States, and in most states where butternut occurs it is listed as a speciesof concern, largely due to this canker disease. The following reports on the distribution of this diseaseacross eastern Canada.
METHODS: Data were collected from routine surveys of hardwoods by the Canadian Forest Service inOntario and New Brunswick, and the Ministry of Natural Resources in Quebec. Butternut is not a veryabundant tree species but occurs in small clumps or as single trees in association with other hardwoods.Because of this low density of potential host trees standard survey methodology utilizing transects couldnot be applied. Field technicians sought out known areas of butternut and conducted, in many instances,single tree evaluations. Locations where dead or dying trees were detected were sampled and routineisolation procedures were used to confirm the presence of S. clavigignenti-juglandacearum. Data werecompiled from the various jurisdictions and mapped using a geographic information system.
RESULTS AND DISCUSSION: The natural range of butternut extends throughout the northern easternUnited States and the southern portion of eastern Canada. In Canada this tree species is found asscattered trees, or in small groups among other hardwoods in the deciduous forest region, thesoutheastern portion of the Great Lakes-St. Lawrence forest region and the western section of theAcadian forest region, from Ontario to New Brunswick (Figure 1). Ecologically, butternut is an importantsource of wildlife mast, especially in the northern part of its range where walnut is not present.
Butternut canker is currently known to exist throughout the range of butternut in Ontario and Quebec,with limited distribution in New Brunswick (Figure 1). The most obvious symptoms of the disease areelongated, sunken cankers on the bark (Figure 2). These cankers are frequently associated withwounds, but also with leaf and bud scars. During the spring and early summer, an inky-black fluidexudes from cracks in the canker. In the summer, the cankers appear as sooty black patches, often withwhitish margins. The cambium layer beneath and surrounding the canker is dark-brown to black in colorand dead. Cankers are perennial, and bordered by successive layers of callus tissue. Infection oftenoriginates in the lower crown and spreads downward as spores from the cankers are washed by rainalong the branches and main stem.
155
Other members of the walnut family (Juglandaceae) also show some susceptibility to the pathogen wheninoculated artificially. In Quebec, seedlings of black walnut (Juglans nigra L.) infected with the diseasehave been reported from tree nurseries. However, damage to black walnut is limited to small branchcankers, and severe infections on black walnut in forests or plantations have not been observed to date.Nevertheless, studies in Quebec have shown that the fungus is associated with the fruits of black walnutand butternut and the disease can be transported to new sites on the fruit (Innes 1998).
REFERENCES:
Davis, C.N., Meyren, D.T. and Czerwinski, E.J.. 1992. First report of butternut canker in Ontario. PlantDis. 76: 972.
Furnier, G.R., Stolz, A.M., Mustaphi, R.M. and Ostry, M.E. 1999. Genetic evidence that butternut cankerwas recently introduced into North America. Can. J. Bot. 77: 783-785.
Harrison, K.J., Hurley, J.E. and Ostry, M.E. 1998. First report of butternut canker caused by Sirococcusclavigignenti-juglandacearum in New Brunswick, Canada. Plant Dis. 82: 11.
Innes, L. 1998. Sirococcus clavigignenti-juglandacerum on butternut and black walnut fruit. Pages 129-132 in Foliage, shoot and stem diseases. Proceedings of the IUFRO WP 7.02.02 meeting, Quebec City,May 25-31, 1997. G. Laflamme, J.A. Bérubé, R.C. Hamelin, editors. Info.Rep. No. LAU-X-122, Nat Res.Can., Canadian –Forest Service, Sainte-Foy, Quebec.
Innes, L. and Rainville, A. 1996. Distribution et détection du Sirococcus clavigignenti-juglandacearum auQuébec. Phytoprotection 77: 75-78.

156
Figure 1. The range of butternut, and known locations of butternut canker in Canada.

157
Figure 2. Active butternut cankers show a symptomatic black exudate (A) and older cankers (B),which the tree has attempted to heal-over, are indicated by seams in the bark.

158
CROP / CULTURE: Chêne rouge (Red oak, Quercus rubra)
LOCATION / REGION: Québec
NAME AND AGENCY / NOM ET ORGANISME:V. Vujanovic1, A. Cogliastro1, A. Paquette2 and D. Gagnon2
1 Institut de recherche en biologie végétal (IRBV), Université de Montréal & Jardin botanique de Montréal, 4101 est, rue Sherbrooke, Montréal, Québec, Canada H1X 2B2 Téléphone : (514) 872-0447; Télécopieur : (514) 872 9406; e-mail :[email protected] Groupe de recherche en écologie forestière (GREF), Université du Québec à Montréal, C.P. 8888, Succursale Centre-Ville, Montréal, Québec, Canada H3C 2P8
TITLE / TITRE : LE CHANCRE FUSARIEN SUR LE CHÊNE ROUGE (QUERCUS RUBRA) AUQUEBEC EN 1999 ET 2000
INTRODUCTION ET METHODES: On retrouve, dans le sud du Québec, plusieurs anciennes terresagricoles abandonnées. Le reboisement de ces terres se fait fréquemment par la plantation de Quercusrubra L. et Q. macrocarpa Michx. après préparation du terrain (Cogliastro et al. 1997). Nous avonsrécemment signalé dans la revue Plant Disease, l'apparition du Fusarium solani dans une plantation dechêne rouge de Cazaville (Vujanovic et al., 1999). Fusarium solani cause des chancres annuels sur letronc et les branches ainsi que le dépérissement d’une partie de la couronne. C'est la première mentionde l'apparition des symptômes dus au fusariose sur les chênes rouges au Québec et au Canada.Auparavant, Fusarium n'a été signalé que sur les chênes rouges et noirs de la section LOBATAE: Q.nuttallii E.J. Palm. , Q. rubra L., Q. phellos L., Q. nigra L. de la côte est américaine (Sinclair 1993). Sonapparition y a eu un impact négatif sur la production commerciale du chêne (Dochinger 1967). EnEurope, le champignon isolé à partir des chênes atteints avait un très haut niveau de pathogénécité etde phyto-toxicité in vitro sur les semis de chênes (Ragazzi 1993).
Afin d'établir et d'estimer le rôle de la diversité des pathogènes dans la symptomatologie du chancre etdu dépérissement du feuillage, quatre méthodes ont été appliquées:Deux méthodes pour le chancre: i) Isolation des souches des parties du chancre sur les milieux d'agar(potato dextrose agar, malt agar) et ii) stimulation de l'exposition des souches, dans une chambrehumide, (formation de sporodochie dans le cas de Fusarium);Deux méthodes pour le dépérissement du feuillage: i) trempage du bois attaqué au niveau du systèmevasculaire (nécrose) dans l'eau en barbotage avec la présence de bouture stérile de chêne rouge et ii)passage du mycélium du pathogène vers des pièces de bois stériles insérées à l'intérieur de parties debois symptomatique.
RESULTATS ET COMMENTAIRES : La maladie a été observée chez les arbres âgés de onze ans(semis 2+0 plantés en 1989). Deux modes d'action de Fusarium (pathogénicité et toxicité) secaractérisent avec des symptômes de chancre sur les tiges et les branches et de flétrissement desfeuilles et des rameaux. On y a observé des symptômes chez plus de 50% des arbres, dont 25% desindividus avaient des dommages jusqu'à 3m de hauteur de fût en 1999 et 27% en 2000. En 2000, letaux d’infection a été plus élevé (34%) dans des parcelles qui ont subi des traitements (paillis deplastique ou herbicide glyphosate) en comparaison avec le témoin (Table 1.). La maladie pourraits'étendre et menacer la production commerciale du chêne. Parmi les autres pathogènes qui causent leschancres et les symptômes d’anthracnose, nous avons isolé occasionnellement (1% des échantillons)les espèces microfongiques (micromycètes) : Apiognomonia, Botryosphaeria, Phomopsis et Valsa.
À cause des connaissances incomplètes concernant les formes et les variétés de Fusarium solani,espèce complexe (O’Donnell, 2000), et en tenant compte de la diversité de la microflore parasite

159
impliqué, il semble difficile de diagnostiquer et de pronostiquer le développement de la pathologie duchêne rouge dans les régions écologiques du Québec et du Canada. L’apparition d’un tel problèmephytosanitaire en plantation de feuillus souligne l’importance de définir et d’adopter des mesures deprécaution.
Nous proposons des travaux de recherche qui permettraient de mieux caractériser le champignon. Cesconnaissances seraient à la base d’un futur programme visant à circonscrire l’aire de répartition duparasite et à examiner la résistance de différentes provenances québécoises et canadiennes de chênerouge. Il est proposé de caractériser la virulence, la toxicité et le profil génétique de Fusarium solani, encinq étapes:Plusieurs isolats pour représenter la diversité de la population : isoler des souches des plantessymptomatiques et asymptomatiques et sélectionner les isolats sur la base de critères morphologiqueset culturaux; une souche américaine serait également incluse aux tests de virulence et de toxicité;
Virulence et toxicité des isolats: étudier la virulence et la toxicité des souches isolées, afin dedéterminer la ou les souches responsables des symptômes de chancre et d’anthracnose in situ;
Profil génétique des isolats: analyser le profil génétique des souches isolées afin de préciserl’identification des isolats et de permettre la reconnaissance ultérieure à l’aide de sondes moléculairesspécifiques;
Comparaison: notre souche avec d’autres au Canada et avec souches des États-Unis; et
Croisement des connaissances: virulence-toxicité-génétique.
REFERENCES:
Cogliastro, A., D. Gagnon and A. Bouchard, 1997. Is site preparation necessary for bur oak receivingpost-planting weed control ? Ann. Sci. For. 54:107-116.
Dochinger, L.S. 1967. Occurrence of poplar cankers caused by Fusarium solani in Iowa. PlantDis.Report. 51:900-903.
O'Donnel, K. 2000. Molecular phylogeny of the Nectria haematococca-Fusarium solani species complex.Mycologia 92:919-938.
Ragazzi A., L. Mugnai, S. Moricca, S. Vagniluca. and I. Dellavalle.1993. Requirements and biologicalaspects of Fusarium eumartii and its possible role in oak decline in North-eastern Italian oak forests. Eur.J. For. Path. 23:171-177.
Sinclair, W.A., H.H. Lyon, and W.T. Johnson 1993. Diseases of Trees and Shrubs. 3th ed.CornellUniversity Press. Ithaca, New York. 575 p.
Vujanovic, V., A.Cogliastro, M. St-Arnaud, P. Neuman, and D. Gagnon, 1999. First report of Fusariumsolani canker and wilt symptoms on red oak (Quercus rubra) in Québec, Canada. Plant Dis. 83:78.

160
Table 1. Présence de fusariose sur le troncs (Quercus rubra) à moins de 3 mètres du sol selon letraitement en 2000, Québec.
TRAITMENT TÉMOIN PAILLIS HERBICIDE TOTAL
Arbres infectés 16 36 34 86
Total 81 123 116 320
Infection (%) 198 293 293 269

161
CROP: Larch
LOCATION: New Brunswick, Nova Scotia, Prince Edward Island, Newfoundland
NAME AND AGENCY:K.J. Harrison1, G.R. Warren2 and A.W. MacKay1
1 Natural Resources Canada, Canadian Forest Service - B Atlantic, P.O. Box 4000, Fredericton, NB E3B 5P7 Tel: 506-452-3513; Fax: 506-452-3525; E-mail: [email protected] Natural Resources Canada, Canadian Forest Service - Atlantic, P.O. Box 960, Corner Brook, NF A2H 6J3
TITLE: STATUS OF EUROPEAN LARCH CANKER IN ATLANTIC CANADA 2000
METHODS: Field surveys for European larch canker (Lachnellula willkommii) were conducted inselected forest stands and plantations with a native or exotic larch (Larix spp.) component at theappropriate time for symptom expression. European larch canker (ELC) is under quarantine regulation inthe Maritime Provinces. ELC surveys were conducted in New Brunswick (NB), Nova Scotia (NS), PrinceEdward Island (PEI), Newfoundland (NF) and Labrador. In 2000, surveys were concentrated along theboundary of the known distribution and in areas outside of the quarantine regulated areas, whichcomprise the southern half of NB (approximately), mainland NS and part of Prince County, PEI. Anextensive survey was conducted to ensure that ELC does not occur in either Newfoundland or Labrador.
RESULTS AND COMMENTS: In Canada, European larch canker is found only in the MaritimeProvinces with a known distribution that includes portions of NB, NS and PEI. A map of the plantquarantine regulated area for European larch canker is available online at the Canadian Food InspectionAgency (CFIA) website ( http://www.cfia-acia.agr.ca/english/ppc/science/pps/1999maps/lwcan99.jpg ).The results of earlier surveys in Atlantic Canada have been reported previously (Hurley et al, 2000).
In 2000, a total of 151 locations were surveyed in the Atlantic Provinces. Locations surveyed in NB, NSand PEI numbered 15, 45 and 32, respectively. All were negative, except for one new location justoutside the previously known distribution in central NB (Figure 1). This is just inside the regulated areaas defined by the CFIA.
In Newfoundland and Labrador, 59 locations were surveyed for ELC. Forty six locations were surveyedon the Island of Newfoundland and 13 in eastern Labrador. No ELC was found in Newfoundland orLabrador during this survey. An ELC distribution map for the Maritime Provinces is included as Figure 1.
ACKNOWLEDGEMENTS: The authors gratefully acknowledge the technical field assistance of ArtDoane, Dave O’Brien and Tom Walsh.
REFERENCES:
Hurley, J.E., Harrison, K.J. and MacKay, A.W. 2000. Status of European larch canker, European race ofScleroderris canker, Butternut canker and Dutch elm disease in Atlantic Canada 1999. Can. Pl. Dis.Surv. 80:141-143. (http://res2.agr.ca/london/pmrc/pmrchome.html)

162
Figure 1. Distribution of European larch canker in Atlantic Canada - 2000.

163
CROP: Lodgepole pine
LOCATION: British Columbia, Northern Interior-Coastal Transition Forests
NAME AND AGENCY:A.J. WoodsRegional Forest Pathologist, Prince Rupert Forest Region, BC Ministry of Forests, Bag 5000,Smithers BC, V0J 2N0Tel: (250) 847-7478
TITLE: FOLIAR DISEASE ASSESSMENT IN YOUNG (1-20 YEAR OLD) LODGEPOLE PINESTANDS IN NORTH-WESTERN BRITISH COLUMBIA
METHODS: Dothistroma needle cast caused by Mycosphaerella pini, a foliar disease of lodgepole pine(Pinus contorta), has become prevalent throughout the north-west interior of BC in the past few years.
This survey focused on determining the incidence and severity of this foliar disease throughout juvenilelodgepole pine stands of the Kispiox Timber Harvesting Landbase (THLB) (Figure 1).
Figure 1. Location of the Kispiox Timber Supply Area, an administrative boundary that encompassesthe THLB study area.

164
The Timber Harvesting Landbase is the area of Crown forest land that is accessible to logging activities. The total area of lodgepole pine leading stands in the Kispiox THLB is approximately 11,000 ha. A list ofall stands aged 1-20 years with > 50% of their stocking comprised of lodgepole pine was compiled fromthe BC Ministry of Forests database. A random number was assigned to each of these candidatestands. The random numbers were then sorted and the first 100 stands were selected for surveys. Thetotal area of surveyed stands was 1,196 ha or approximately 10% of the total population of pine leadingstands.
Each selected stand was then surveyed with 2-m wide, 100 -m long transects up to a survey intensity of0.5 % of the gross plantation area. The location of the transects was established on 1:10,000 scalemaps prior to the field survey. All trees > 1.5m height within the transect were assessed for dothistromaneedle cast. The year of first attack and an estimate of the percentage of the crown affected was madefor all trees infected with foliar disease. The incidence and severity of foliar disease was determined foreach plantation (e.g. 10% of lodgepole pine trees are more than 50% defoliated due to dothistroma foliardisease).
RESULTS AND COMMENTS: Dothistroma needle cast was present in 76% of stands in the study area. The growing season of 1998 was the first in which the majority of the lodgepole pine trees in the Kispioxwere infected. Trees with the greatest amount of foliar disease-induced needle loss, however, had theirfirst infections in the 1997 growing season or earlier. The severity of foliar disease depends on both theincidence of diseased trees and the degree of infestation on those trees. Trees with less than 20% oftheir foliage affected likely do not suffer measurable growth losses. Trees with more than 20% probablybegin to suffer some growth losses. It is clear from some of the stands that were included in this surveyand others I have seen, that once a tree has more than 80% of its foliage affected, significant growthlosses occur.
There was a considerable range in foliar disease severity throughout lodgepole pine stands in theKispiox. The percentage of live crown affected by foliar disease ranged from < 5 % to > 85 %. Thepercentage of trees affected in any one stand ranged from 0 to 100%. I have reported the severity offoliar disease based on the percentage of stands that have foliar disease incidence from < 25% to >75% of their trees suffering from < 20% to > 80% defoliation (Figure 2).
The majority of infested stands have less than 25% of the trees infected (Figure 2). The most seriousconcerns are those stands that have greater than 50% of the trees more than 50% defoliated. Only 2%of the stands have a foliar disease severity of that magnitude. The disease outbreak does not appear tobe subsiding yet so it is quite possible that more of the stands will suffer greater foliage losses.
It is not clear what has led to the current outbreak of foliar disease in the study area. It is likely that theunusually mild winters and wet summers of the past three to five years have contributed, as the sporesof the pathogen are spread by rain splash (Peterson, G. 1981). The mild winters have likely resulted inless of the infected needles being shed during the winter. The spores from the infected needles canthen be spread further up into the crowns of affected trees. If the weather of the past 3-5 years is in partresponsible and the projections of global warming materialise, then the prognosis for the health of thelodgepole pine plantations in the Kispiox is not good.
REFERENCE:
Peterson, G. 1981 Control of Diplodia and Dothistroma blights of pines in the urban environment. J.Arboriculture 7:1-5.

165
Figure 2. Percentage of juvenile lodgepole pine stands in the Kispiox Timber Harvesting Landbasethat are infested with dothistroma needle cast, based on a survey of 100 stands in the 2000field season.

166
CROP / CULTURE: Pine species
LOCATION / REGION: Québec
NAME AND AGENCY / NOM ET ORGANISME:V. Vujanovic and M. St-Arnaud, Institut de recherche en biologie végétale (IRBV), Université deMontréal & Jardin botanique de Montréal, 4101 est, rue Sherbrooke, Montréal, Québec, Canada H1X2B2 Telephone : (514) 872-0447; Facsimile : (514) 872 9406; e-mail:[email protected]
TITLE/TITRE: PATHOGEN BIODIVERSITY IN PINE TREE COLLECTIONS UNDER URBANECOLOGICAL CONDITIONS, QUEBEC
INTRODUCTION AND METHODS: Pine (Pinus L.) species are among the most popular coniferous treesplanted in urban and suburban landscapes and collections. In practice, forestry focuses on ex situmethods for conservation of the genetic resources of particular trees, utilising botanical garden plantations.The Montreal Botanical Garden (MBG) arboretum contains a collection of about 60 pines (species,varieties and cultivars) from around the world. Fungal attacks on various parts of pine crowns can causeserious damage under favourable ecological conditions. In urban areas, some attacks could be favouredby atmospheric impurities which cause the trees to appear chlorotic and thinner than in the surroundinglandscape.
To establish an efficient control strategy for pathogens, a particularly important goal was to assess thephytosanitary condition of pine crown components or ecological niches (Cone = C; Branches = B, Needle= N; Seed = S). From 1996 to 2000, a survey at pathogenic fungi on pine was carried out at the MBG in acollection of 48 pine trees originating from North America, Europe and Asia. Twenty-eight pine taxa (age oftrees > 5 yrs) were selected on the basis of chlorotic and necrotic symptoms in the crown. On average,three specimens from each taxon were sampled. Each taxon was located in a separate tree grouping. Thedistance between the pine groups within the arboretum was approximately 20 m. All samples were insect-free and were selected randomly. Samplings and evaluations were conducted three times per year duringthe growing period. Diagnoses were accomplished by microscopic examination and culturing fungi ontovarious artificial media.
RESULTS AND COMMENTS: A total of 27 fungal taxa were isolated from diseased material in specifichost/ecological niche combinations. Seven species were found on all the CBNS (Cone-Branch-Needle-Seed) niches and six in CBS. Colonization of the CNS niches was associated with four fungal species, CSand N with three, B with two, and CN and S with one species. The most frequently occurring fungalspecies were Sphaeropsis sapinea isolated from 12 hosts, Herpotrichia juniperi and Choanatiara lunatafrom eight, and Truncatella hartigii and Strasseria geniculata from seven hosts each (Table 1). Futureinvestigations will require more attention to the characterization of different fungal strains in order toestablish an adequate sanitary control strategy. Moreover, information on the incidence of pathogenicfungi in arboreta might allow the early recognition of potentially important diseases.
167
REFERENCES:1. Vujanovic, V., and St-Arnaud, M. 2000. Pine crown-shapes relationship with microfungal communities:Evaluation for urban landscape management. Proc. 4th Internat. Sympos. on Trees. Montreal, August 24-26, IRBV/Montreal Botanical Garden (in press).
2. Vujanovic, V., St-Arnaud, M., and Neumann, P. 2000. Susceptibility of cones and seeds to fungalinfection in a pine (Pinus spp.) collection. For. Pathol. 30 (in press).
3. Vujanovic, V., St-Arnaud, M., and Neumann, P. 1998a. First report of Naemacyclus fimbriatus infectingpitch pine (Pinus rigida). Plant Dis. 82 : 959.
4. Vujanovic, V., St-Arnaud, M., and Neumann, P. 1998b. New hosts for Choanatiara lunata. Can. J. Pl.Pathol. 20 : 319-323.
5. Vujanovic, V., St-Arnaud, M., and Neumann, P. 1998c. Seven new Pinus hosts for Strasseria geniculata(Berk. & Br.) Hohn. In: G. Laflamme, J. A. Bérubé, R.C. Hamelin (eds.) Foliage, Shoot and Stem Diseasesof Trees. IUFRO WP 7.02.02, CFS/LFC, Information Report LAU-X-122. pp. 48-54.
6. Vujanovic, V., St-Arnaud, M., Neumann, P. 1997. Biodiversity inventories of fungal taxa associated withthree different pine crown ecological niches in the Jardin Botanique de Montréal. Amer. J. Bot. 84: 128.

168
Table 1. Biodiversity of pine pathogenic fungal species (without Lophodermium and Cyclaneusma-likespecies) in relation to host taxa and colonized pine tissues.
FUNGAL SPECIES COLONIZED PINUS HOSTS ColonizedPine Part
REF.NO.
Alternaria sp. P. sylvestris Fastigiata, P. nigra, P.n. ssp. nigra C, B, N, S1 2
Ceuthospora sp. P. albicaulis, P. tabulaeformis, P. sylvestris, P. n. ssp. laricio,P. leucodermis
C, N, S 2
Choanatiara lunata DiCosmo &Nag
P. albicaulis Eng., P. resinosa Ait., P. tabulaeformis, P.densiflora, P. nigra Laricio, P. n. Pallasiana, P. n. ssp. Nigra
N 4
Cytospora pinastri Fr. P. albicaulis C, B, S 2
Diaporthe sp. P. mugo Galica, P. contorta C, B, S 2
Dothistroma septospora (Dor.)Morelet (Mycosphaerella pini)
P. contorta, P. nigra, P. sylvestris N unp.2
Epicoccum nigrum Link. P. sylvestris, P. nigra C, B, N, S 2
Fusarium sp. P. sylvestris Argentea-Compacta, P. nigra, P. n. ssp. nigra,P. uncinata
C, B, N, S 2
Fusicoccum sp. P. flexilis Glen Dwarf, P. mugo Galica C, B, S 2
Herpotrichia juniperi (Duby) Petr. P. tabulaeformis, P. densiflora, P. sylvestris Argentea-Compacta, P. s. Beuvronensis, P. mugo Galica, P. rigida, P.contorta, P. ponderosa
C, B, N, S 12
Gremmeniella abietina (Lagerb.)Morelet
P. nigra, P. resinosa, P. sylvestris, P. koreaensis B unp.
Naemacyclus fimbriatus (Schw.)Di-Cosmo, Peredo & Minter
P. rigida C, N 3
Pestalotia funerea (Desm.) Stey. P. korainensis, P. mugo Hesse, P. m. var. pumilio C, N, S 2
Phoma sp. P. sylvestris, P. s. Watereri C, B, N, S 2
Phomopsis conorum (Sacc.)Died.
P. sylvestris, P. nigra, P. mugo Galica C, B, S 12
Pleospora laricina Rehm. P. mugo Hesse S 2
Pleospora sp. P. ponderosa C, B, S 2
Sclerophoma pithyophila(Corda) Höhn.
P. xschwerinii (P. strobus x P. wallichiana) C, B, N, S 12
Septoria sp. P. ayacahuite C, S 2
Sirococcus conigenus Preuss P. nigra ssp. laricio, P. ponderosa C, N, S 12
Sphaeropsis sapinea (Fr.) Dyko& Sutton
P. albicaulis, P resinosa, P. sylvestris, P. s. Euro-Asia, P.nigra, P. nigra ssp. laricio, P.n. ssp. nigra, P. leucodermis, P.mugo, P. m. Hesse, P. m. var. pumilio, P. uncinata
C, B, N, S 126
Strasseria geniculata (Berk. &Br.) Höhn
P. albicaulis, P. cembra, P. jerffreyi, P. mugo Hesse, P.rigida, P. strobus Torulosa, P. tabulaeformis
N 5
Therrya fuckelii (Rehm) Kujala P. strobus B 1
Trichothecium roseum Link. P. albicaulis, P. mugo Galica, P. uncinata C, S 2
Truncatella hartigii (Tubeuf)Stey.
P. tabulaeformis, P. densiflora, P. sylvestris Argentea-Compacta, P. s. Beuvronensis, P. s. Fastigiata, P. s.Watereri, P. contorta
C, N, S 12
Tubercularia sp. P. peuce, P. parviflora, P. xschwerinii (P. strobus x P.wallichiana), P. ayacahuite, P. ponderosa
C, S unp.
Valsa pini (Alb. And Schew.) Fr.Rehm.
P. koraiensis, P. flexilis Glen Dwarf C, B, S 126
1 Cone = C; Branches = B, Needle =N ;Seed =S 2 unp. = unpublished

169
CROP: Whitebark pine
LOCATION: British Columbia
NAME AND AGENCY:S. ZeglenVancouver Forest Region, British Columbia Ministry of Forests, Nanaimo, British Columbia
TITLE: WHITEBARK PINE AND WHITE PINE BLISTER RUST IN BRITISH COLUMBIA - 1999
INTRODUCTION: Whitebark pine (Pinus albicaulis) is found in subalpine forests throughout theprovince south of 56 N latitude. The future survival of whitebark pine is threatened by its susceptibility towhite pine blister rust (WPBR), an exotic disease caused by the fungus Cronartium ribicola. This notehighlights the annual progress of a province-wide survey of whitebark pine first reported in CPDS lastyear.
METHODS: High-elevation stands in the Cascade and Coastal Mountain Ranges having a leading orsignificant component of whitebark pine were identified using the provincial forest inventory database. Once a stand was located, the surveyor visually inspected for WPBR on the first 50 live and deadwhitebark pine trees encountered during a strip transect reconnaissance.
RESULTS: Of the 7043 whitebark pine trees examined in 1999, 1219 (17.3%) were dead (Table 1). Mortality on 558 (45.8%) of these dead trees could be directly attributed to WPBR. Due to the difficultyof diagnosing some dead trees, this figure is conservative as dead trees without obvious stem cankerswere classified as dead due to other factors. These other factors include mountain pine beetle(Dendroctonus ponderosae), abiotic factors, and unknown or unidentified causes.
Of the remaining 5824 live trees, 1857 (31.8%) were alive but infected with blister rust. Of theseinfected trees, 1190 (64.1%) have stem cankers and will likely die within a few years. The remaininginfected trees displayed branch cankers that may develop into stem cankers over time. In addition,many trees suffered defects such as basal sweep, forks, crooks, and damage from feeding by squirrels.
COMMENTS: The survey should be completed over the rest of the province in the next year.
REFERENCE:
Zeglen, S. 2000. Whitebark pine and white pine blister rust in British Columbia. British ColumbiaMinistry of Forests. Vancouver Forest Region. Interim Report. 14 pp.

170
Table 1. Summary of 1999 whitebark pine survey results.
Forest Districtor Provincial Park
No. oftrees
TREE STATUS
Live,Uninfected
Live, Infectedby WPBR1
Dead, fromWPBR
Dead, Otheror Unknown
No. % No. % No. % No. %
Bulkley-Cassiar 992 437 44.1 337 34.0 61 6.1 157 15.8
Cathedral PP 591 514 87.0 68 11.5 6 1.0 3 0.5
Chilcotin 400 306 76.5 72 18.0 16 4.0 6 1.5
Garibaldi PP 338 240 71.0 65 19.2 14 4.2 19 5.6
Manning PP 2022 991 49.0 568 28.1 165 8.2 298 14.7
Merritt 600 266 44.3 180 30.0 94 15.7 60 10.0
Mid-Coast 200 133 66.5 39 19.5 19 9.5 9 4.5
Morice 650 325 50.0 236 36.3 47 7.2 42 6.5
Penticton 100 56 56.0 34 34.0 5 5.0 5 5.0
Squamish 300 136 45.3 86 28.7 52 17.3 26 8.7
Tweedsmuir PP 850 563 66.2 172 20.2 79 9.3 36 4.3
Total 7043 3967 56.3 1857 26.4 558 7.9 661 9.4
1 WBPR = white pine blister rust.
171
LIST OF 2001 CPDS AUTHORS IN ALPHABETICAL ORDER
K. Anderson 105T.R. Anderson 133S.D. Bardin 136K. Basu 16D. Benard 102M. Beyene 63, 65, 98, 100B. Carriere 111, 126, 130K.F. Chang 115J. Chong 79T.M. Choo 66A. Cogliastro 158A. Comeau 59, 66S. Cronje 111, 126, 130F. Daayf 141R.M. DePauw 80M. Desjardins 28, 123, 138A. DiCarlo 89, 90S. Duguid 123K. Dunsmore 70R. Favrin 149M.R. Fernandez 61, 68, 80, 83, 86, 91T. Fetch 70, 88D. Gagnon 158B. Geoffroy 98, 100G. Gilbert 40J. Gilbert 63, 65, 89, 90, 100J. Gold 63, 65, 89, 90, 98, 100W. Greuel 105R. Gugel 105S. Haber 71D. Hamel 40K.J. Harrison 161K. Harrison 154L.M. Harrison 102K.M. Ho 66C. Hoeschen 72G. Holzgang 21, 61, 83A. Hopkin 154R.J. Howard 115H.C. Huang 136E. Hudgins 144G.R. Hughes 61, 68, 83, 86, 91S.F. Hwang 115M. Idris 63, 65, 98, 100L. Innes 154G. Jesperson 151V. Joshi 7R. Kaethler 63, 89, 90D. Kaminski 105K.W. Ker 148M. Keri 105U. Kromer 89, 90R. Kurtz 71R. Kutcher 105
M. Lacroix 40, 66R.M. Lange 102A.W. MacKay 161F. Matheson 72S. Mathur 16B. McCallum 88, 94W. McFadden-Smith 95, 148D.L. McLaren 108J.G. Menzies 72K. Morgan 89, 90R.A.A. Morrall 105, 111, 126, 130E. Mueller 63, 65, 89, 90, 100B. Mulock 94E. Nedohin 65, 98D.D. Orr 73A. Paquette 158P. Pearse 21P.G. Pearse 61, 68, 83, 86, 91, 105P.G. Pearse 91B.J. Penner 16R.G. Platford 28, 108, 123, 138H.W. Platt 141D. Presello 75K.Y. Rashid 123, 138L.M. Reid 75Rioux, S. 59 D. Rochon 151C. Saramaga 72A. Schaafsma 96D. Schmeling 111, 126, 130P. Seto Goh 94T.C. Shinners-Carnelley 28M. St-Arnaud 152, 166M. Stulzer 63, 65, 98, 100L. Tamburic-Ilincic 96A. Tekauz 63, 65, 89, 90, 98, 100A.U. Tenuta 133J. Theilmann 151L. Thomson 111, 126, 130C. Trail 105T.K. Turkington 73G.D. Turnbull 115V. Vujanovic 152, 158, 166H. Wang 115G.R. Warren 161T. Woldemariam 75A.J. Woods 163A.G. Xue 119, 121L. Yager 119, 121S. Zeglen 169X. Zhu 75
172
LIST OF FIGURES
Caption Page No.
Distribution of surveyed chickpea fields in west-central Saskatchewan in 2000. Numbers in parentheses indicate the number of fields surveyed near each town.
118
Map of crop districts in Saskatchewan. 129
Regions sampled for Blueberry Scorch Virus in Lower Mainland of British Columbia in2000. Numbers in parentheses indicate number of fields testing positive / total numberof fields sampled.
146
Distribution of Blueberry Scorch Virus in 2 adjacent fields in Lower Mainland of BC. 147
The range of butternut, and known locations of butternut canker in Canada. 156
Active butternut cankers show a symptomatic black exudate (A) and older cankers (B),which the tree has attempted to heal-over, are indicated by seams in the bark.
157
Distribution of European larch canker in Atlantic Canada - 2000. 162
Location of the Kispiox Timber Supply Area, an administrative boundary thatencompasses the THLB study area.
163
Percentage of juvenile lodgepole pine stands in the Kispiox Timber HarvestingLandbase that are infested with dothistroma needle cast, based on a survey of 100stands in the 2000 field season.
165