can speed and tri-axial acceleration measured by biologgers be
TRANSCRIPT
Can speed and tri-axial acceleration measured by biologgers be used to classify Oystercatcher behaviour?
Thesis MSc Ecology and Evolution
Roeland A. Bom
University of Amsterdam
Supervision: Dr. Judy Shamoun-Baranes & Prof. Dr.ir. Willem Bouten Computational Geo-Ecology, University of Amsterdam
Dr. Bruno J. Ens & Drs. Kees Oosterbeek
SOVON Dutch Centre for Field Ornithology
Jeroen Onrust

2
3
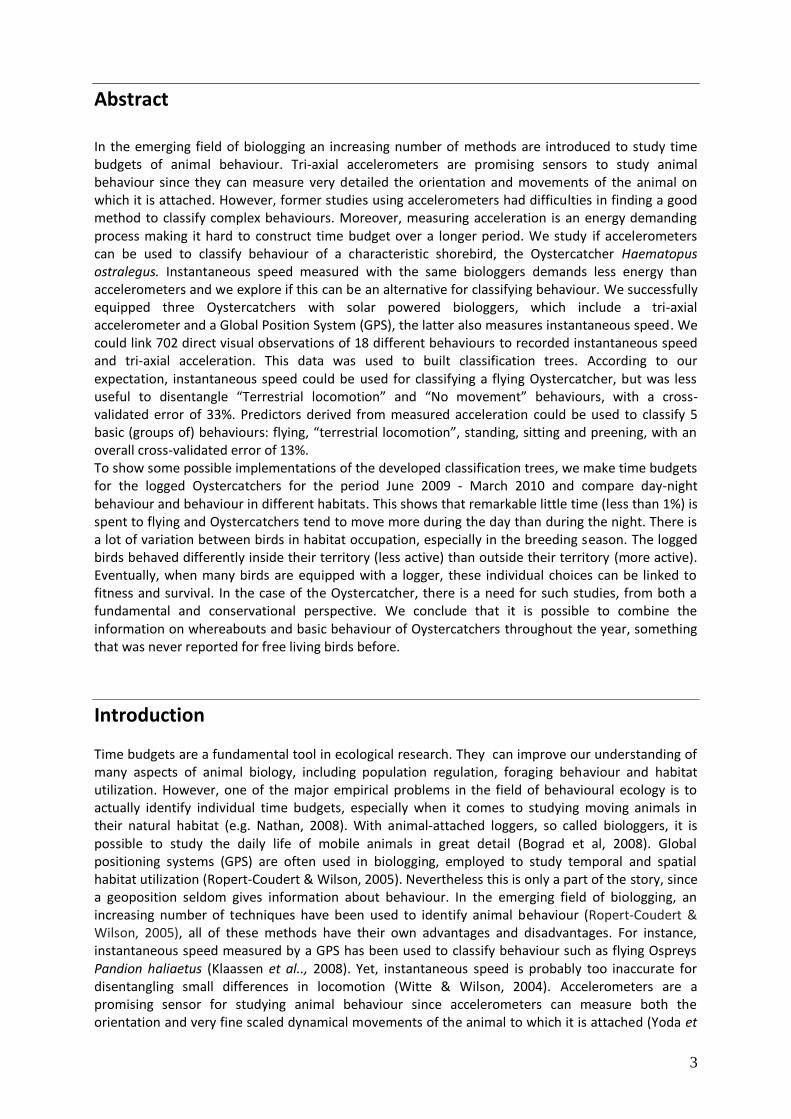
Abstract In the emerging field of biologging an increasing number of methods are introduced to study time budgets of animal behaviour. Tri-axial accelerometers are promising sensors to study animal behaviour since they can measure very detailed the orientation and movements of the animal on which it is attached. However, former studies using accelerometers had difficulties in finding a good method to classify complex behaviours. Moreover, measuring acceleration is an energy demanding process making it hard to construct time budget over a longer period. We study if accelerometers can be used to classify behaviour of a characteristic shorebird, the Oystercatcher Haematopus ostralegus. Instantaneous speed measured with the same biologgers demands less energy than accelerometers and we explore if this can be an alternative for classifying behaviour. We successfully equipped three Oystercatchers with solar powered biologgers, which include a tri-axial accelerometer and a Global Position System (GPS), the latter also measures instantaneous speed. We could link 702 direct visual observations of 18 different behaviours to recorded instantaneous speed and tri-axial acceleration. This data was used to built classification trees. According to our expectation, instantaneous speed could be used for classifying a flying Oystercatcher, but was less useful to disentangle “Terrestrial locomotion” and “No movement” behaviours, with a cross-validated error of 33%. Predictors derived from measured acceleration could be used to classify 5 basic (groups of) behaviours: flying, “terrestrial locomotion”, standing, sitting and preening, with an overall cross-validated error of 13%. To show some possible implementations of the developed classification trees, we make time budgets for the logged Oystercatchers for the period June 2009 - March 2010 and compare day-night behaviour and behaviour in different habitats. This shows that remarkable little time (less than 1%) is spent to flying and Oystercatchers tend to move more during the day than during the night. There is a lot of variation between birds in habitat occupation, especially in the breeding season. The logged birds behaved differently inside their territory (less active) than outside their territory (more active). Eventually, when many birds are equipped with a logger, these individual choices can be linked to fitness and survival. In the case of the Oystercatcher, there is a need for such studies, from both a fundamental and conservational perspective. We conclude that it is possible to combine the information on whereabouts and basic behaviour of Oystercatchers throughout the year, something that was never reported for free living birds before.
Introduction Time budgets are a fundamental tool in ecological research. They can improve our understanding of many aspects of animal biology, including population regulation, foraging behaviour and habitat utilization. However, one of the major empirical problems in the field of behavioural ecology is to actually identify individual time budgets, especially when it comes to studying moving animals in their natural habitat (e.g. Nathan, 2008). With animal-attached loggers, so called biologgers, it is possible to study the daily life of mobile animals in great detail (Bograd et al, 2008). Global positioning systems (GPS) are often used in biologging, employed to study temporal and spatial habitat utilization (Ropert-Coudert & Wilson, 2005). Nevertheless this is only a part of the story, since a geoposition seldom gives information about behaviour. In the emerging field of biologging, an increasing number of techniques have been used to identify animal behaviour (Ropert-Coudert & Wilson, 2005), all of these methods have their own advantages and disadvantages. For instance, instantaneous speed measured by a GPS has been used to classify behaviour such as flying Ospreys Pandion haliaetus (Klaassen et al.., 2008). Yet, instantaneous speed is probably too inaccurate for disentangling small differences in locomotion (Witte & Wilson, 2004). Accelerometers are a promising sensor for studying animal behaviour since accelerometers can measure both the orientation and very fine scaled dynamical movements of the animal to which it is attached (Yoda et
4
al. 1999). Accelerometers were first tested on a large free living animal: the Adélie Penguins Pegoscelis adeliae (Yoda et al. 1999). After visually inspecting their data, this study could successfully use accelerometers to qualify up to seven basic behaviours (Shepard et al. 2008). A more sophisticated technique to analyze acceleration data was presented by Watanbe et al. (2005) who used fast Fourier transformation to characterize acceleration signals. In this way, eight basic behaviours of the Domestic cat Felis catus could be classified. Recently, studies has been looking for a method to classify more complex behaviour using acceleration. Sakamoto et al. (2009) developed a method which could categorize up to 20 different patterns in acceleration of European shags Phalacrocorax aristotelis. However, their approach is based on unsupervised classification, hence it is not sure to which behaviour each group belongs. In fact, many studies on free living animals equipped with accelerometers have difficulties interpreting their data since it is based on unsupervised classification (Sakamoto et al. 2009). What is more, measuring acceleration demands a lot of energy and storage capacity of the biologger, hence up to now, all research with accelerometers is restricted to a time period of less than a week. Aim. This study contributes to the current search for determining how acceleration can be used to classify animal behaviour, in our case the behaviour of a characteristic shorebird; the Oystercatcher Haematopus ostralegus. We do this by linking direct visual observations of behaviour on free living birds to tri-axial acceleration measured with biologgers. This data is used to develop a classification model. We explore if instantaneous speed measured with the same biologgers can be an alternative for classifying behaviour, since measuring instantaneous speed demands less energy. Moreover, we show that the classification model can be used to make time budget over a long time period. In current Oystercatcher studies there is both from a fundamental and conservational perspective a need for this kind of work (see below). Oystercatchers. According to the web of science, Oystercatchers are by far the most studied shorebird in the world (Ilya McLean pers. comm.), presumably because it is a locally abundant, long living, conspicuous animal that lives in open landscapes, feeding on easily identifiable prey. On the Dutch island of Schiermonnikoog (53.26°N, 06.10°W, Figure 1), a population of breeding Oystercatchers has been studied in detail since 1984 by the University of Groningen, recently in cooperation with SOVON Dutch Centre for Field Ornithology. The studies seek to link individual behaviour to population dynamics and the findings go beyond the field of bird research (Sutherland, 1996). Famous is the work of Ens et al.. 1992 who describe the existence of different breeding strategies in Oystercatchers; resident breeding (breeding in high quality territory), leapfrog breeding (breeding in poor quality territory) and queuing. This led to the development of the queue hypothesis, which explains the large number of birds in low quality territories from the trade-off faced by nonbreeding individuals between queuing for a high quality territory or settling quickly in a low quality territory (Ens et al. 1995, van de Pol et al 2007). The Oystercatcher studies on Schiermonnikoog are now at a point where there is a need to map in great detail individual variation in behaviour in space and time. This can help answering the current main questions, which include behaviour of new recruits, territorial behaviour, cooperation and conflict in parental care and mating behaviour. Obviously, biologgers can help answering this questions. The study area on Schiermonnikoog offers good possibilities for a pilot study on biologged Oystercatchers. Throughout the breeding season, resident breeding Oystercatcher stay mostly close to their nests, either for feeding on the mudflats or for incubating and roosting on the saltmarsh (Kersten 1996). It is only after the breeding season that Oystercatcher more frequently leave their territory for feeding further on the mudflats of the Waddensea and start roosting in big social roosts on the salt marshes. This close to the nest behaviour raise the possibility to observe biologged Oystercatchers in a known area. In this way a whole range of behaviours can be observed and linked to acceleration measurement. This data can eventually be used to build a classification model. Such a classification model can be of great help in answering the current main issues for the Schiermonnikoog population, as well as answering ongoing question in animal behaviour, which includes day-night behaviour of shorebirds, estimating energy budgets and calibrating foraging

5
Figure 1. Our study location on the island of Schiermonnikoog, the Netherlands. The coloured circles are geolocations of three biologged Oystercatchers on 1 July 2009. The black circles are nests of the biologged birds with working devices. The coloured circles are geolocations of the logged birds on 1 July 2009. The bird communicate with the antennae’s on the observation towers (blue squares). These antennae’s send the data to the base station where it is stored on a computer. Dark lines represents creeks, dark grey lines are urban infrastructure. models. Furthermore, a quantitative analysis of behaviour can improve our understanding of how birds organize their time in the Wadden Sea, what specific activities take place and how these are divided during the day, season or year. This information can be used to study the impact of climatic and land use variation as well as human disturbance. Here we meet the applied part of the story. Biologgers can be of great help in conservation ecology (Bograd et al., 2008) and could have been of great help in previous conservation studies on Oystercatchers. For instance, experiments where individual Oystercatchers were deliberately disturbed from their preferred foraging site would have yielded more insights, if the behavioural response of the disturbed birds could have been followed with biologgers, both in space and time (Urfi et al 1996; Rutten et al 2010). There is a great need for further conservation studies on Oystercatchers, not only because Oystercatchers are a good model species for conservation ecology, but moreover because the Dutch population of Oystercatchers has declined by 50% since 1990 (van Dijk et al. 2006). Conserving the Dutch population is necessary since
Base stationObservation towers
& antennae's
400 m
Saltmarsh
Mudflat
Schiermonnikoog53.29° N – 06.10° E
the Netherlands
3 km
6
30% of the European population breeds in the Netherlands (Hagemeijer & Blair 1997). It was hypothesized that, among others, the declining Oystercatcher population is caused by a decline of their major food (bivalves such as Cockles Scobicularia and Mussles Mya) in the Waddensea (Ens et al. 2009), which was argued to be due to shellfishery (Piersma et al., 2001, Ens et al. 2006). Model studies using WEBTICS predicted that the carrying capacity of the Waddensea for Oystercatchers depends on the shellfish beds that are least emerged within a tidal cycle (Rappolt et al. 2003). Currently 60 Oystercatcher are equipped with a biologger to test this hypothesis by logging geolocations and acceleration. The results will be incorporated in the recovery programs of the musselbeds (e.g. within de program “Naar een Rijke Waddenzee”) http://www.waddenzee.nl/Naar_een_rijke_Waddenzee.natuurherstelprogramma.0.htm). Our study facilitates this program by serving a model that can be used to interpret the acceleration data.
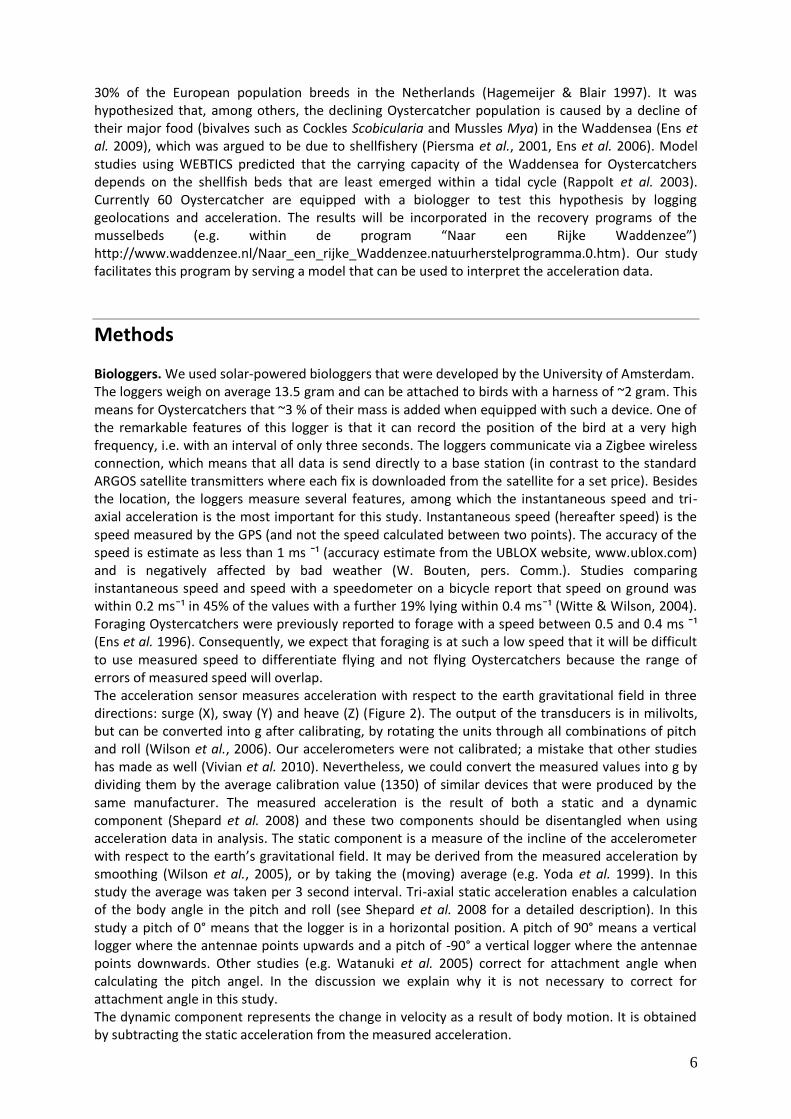
Methods Biologgers. We used solar-powered biologgers that were developed by the University of Amsterdam. The loggers weigh on average 13.5 gram and can be attached to birds with a harness of ~2 gram. This means for Oystercatchers that ~3 % of their mass is added when equipped with such a device. One of the remarkable features of this logger is that it can record the position of the bird at a very high frequency, i.e. with an interval of only three seconds. The loggers communicate via a Zigbee wireless connection, which means that all data is send directly to a base station (in contrast to the standard ARGOS satellite transmitters where each fix is downloaded from the satellite for a set price). Besides the location, the loggers measure several features, among which the instantaneous speed and tri-axial acceleration is the most important for this study. Instantaneous speed (hereafter speed) is the speed measured by the GPS (and not the speed calculated between two points). The accuracy of the speed is estimate as less than 1 ms ¯¹ (accuracy estimate from the UBLOX website, www.ublox.com) and is negatively affected by bad weather (W. Bouten, pers. Comm.). Studies comparing instantaneous speed and speed with a speedometer on a bicycle report that speed on ground was within 0.2 ms¯¹ in 45% of the values with a further 19% lying within 0.4 ms¯¹ (Witte & Wilson, 2004). Foraging Oystercatchers were previously reported to forage with a speed between 0.5 and 0.4 ms ¯¹ (Ens et al. 1996). Consequently, we expect that foraging is at such a low speed that it will be difficult to use measured speed to differentiate flying and not flying Oystercatchers because the range of errors of measured speed will overlap. The acceleration sensor measures acceleration with respect to the earth gravitational field in three directions: surge (X), sway (Y) and heave (Z) (Figure 2). The output of the transducers is in milivolts, but can be converted into g after calibrating, by rotating the units through all combinations of pitch and roll (Wilson et al., 2006). Our accelerometers were not calibrated; a mistake that other studies has made as well (Vivian et al. 2010). Nevertheless, we could convert the measured values into g by dividing them by the average calibration value (1350) of similar devices that were produced by the same manufacturer. The measured acceleration is the result of both a static and a dynamic component (Shepard et al. 2008) and these two components should be disentangled when using acceleration data in analysis. The static component is a measure of the incline of the accelerometer with respect to the earth’s gravitational field. It may be derived from the measured acceleration by smoothing (Wilson et al., 2005), or by taking the (moving) average (e.g. Yoda et al. 1999). In this study the average was taken per 3 second interval. Tri-axial static acceleration enables a calculation of the body angle in the pitch and roll (see Shepard et al. 2008 for a detailed description). In this study a pitch of 0° means that the logger is in a horizontal position. A pitch of 90° means a vertical logger where the antennae points upwards and a pitch of -90° a vertical logger where the antennae points downwards. Other studies (e.g. Watanuki et al. 2005) correct for attachment angle when calculating the pitch angel. In the discussion we explain why it is not necessary to correct for attachment angle in this study. The dynamic component represents the change in velocity as a result of body motion. It is obtained by subtracting the static acceleration from the measured acceleration.

7
Figure 2. A) The biologgers that were used in this study and B) one of the Oystercatchers that was equipped with a biologger. The arrows indicate the direction in which acceleration is measured. Picture B) by Jeroen Onrust
Figure 3. (A) Observation tower and (B) view from the observation tower. Pictures Jeroen Onrust
Study area & Fieldwork. During the breeding season of 2009 (May-July 2009), 11 Oystercatchers breeding adjacent to the mudflats (i.e. resident birds) were selected to be equipped with a logger. The selected birds were breeding long enough (approximately 20 days) to avoid nest desertion after catching. The birds were caught on their nest with a walk-in trap, after which a logger was fitted on their back using a harness. The harness was made in such a way that it would fall off the bird after approximately three years due to deterioration of the cotton rope. The procedure of catching and
Heave (Z)
Sway (Y)
Surge (X)

8
releasing lasted 30-60 minutes. For communication with the loggers, three antennas were set on the two observation towers that were standing within 50m from the nests. Due to technical problems, nine loggers stopped working within several days after they were fitted on the birds. The three birds that carried a working device could be observed daily in the period of 30 June - 14 July by Roeland Bom. Each bird was observed for 30 minutes from either observation tower (Figure 3) through a telescope. When a bird started a new behaviour, this was called out and recorded by a field assistant in a PSION (handheld computer), using the program Observer XT (www.noldus.com). This procedure was practised extensively on non logged birds before performing on the logged birds. The defined behaviours follow the study of Kersten et al., (1996), extended with 17 (sub) behaviours observed in the field. Table 5 (see the appendix) gives the distinct behaviours. Behaviours were defined to be mutually exclusive. For later analysis, the time of the handheld computer was set to GPS-time (by using a handheld GPS) before each observation started. During observations on logged birds, the loggers were set to make a GPS fix with a 10 second interval. Acceleration was measured with a frequency of 20 Hz for 3 seconds, directly following a GPS fix. To avoid exhausting the batteries, after the observations a logger was programmed to log with a conservative program, with a GPS and acceleration fix every 10 minutes in summer. In autumn, winter and spring, solar power is limited and the loggers were set to log every 30 minutes or less, depending on the battery voltage. For the same reason, acceleration could not be measured in winter. Data selection. It is expected that there is a delay between the initiation of a new behaviour (by the bird) and the recording of the change in behaviour (by the field assistant). This delay was calibrated during two days when the loggers were set to record continuous acceleration for 30 minutes. With this data it is possible to distinguish very different behaviours, such as the transition from walking to flying, and thus, to measure the time delay. After the observation time was corrected for the delay time, the observed behaviour was connected to the logger data. This labelled data was used to develop classification models. Two models were developed, one, the speedmodel, is based on speed data only, and the second, the accelerationmodel, is based on speed-, and acceleration data. This distinction in models was made since to test whether speed alone can be an appropriate measure to classify behaviour. Speedmodel. For developing the speedmodel speed was taken as the predictor. We expect that there is no difference in speed in the “no movement” behaviours (e.g sit, stand, body care, handle in situ), and that the differences with speed in the “terrestrial locomotion” behaviours (e.g. walk, forage, handle, walking) can’t be recorded because they are within the accuracy error of the speed sensor. Hence, we suppose that for building the classification tree, we can use the behaviour groups “no movement”, “terrestrial locomotion” and “fly”. Nevertheless, before doing so, we test if there is a significant difference of speed within each group by using a Tukey HSD-test. Accelerationmodel. Table 1 presents the 16 parameters which were used to serve as a predictor for Oystercatcher behaviour. All predictors are calculated from measured acceleration, except instantaneous speed, which was directly measured by the GPS. Instantaneous speed is included in this model to test if it is more powerful predictor for Oystercatcher behaviour than the predictors derived from measured acceleration. We note that in theory surge body pitch and heave body pitch should measure the same value with a difference of 90°, however this is not always obtained (see Shepard et al. 2008 for an explanation). Hence we use both values to determine which appears to be the best predictor. We do not analyze our data by using wavelet transformations as other studies proposed (Sakamoto et al. 2009) as our 3 seconds of acceleration is short enough for a static Fast Fourier transformation instead of a dynamic wavelet analysis. In this way our supervised data can be analyzed using a much more simple method. All the mentioned predictors were used in other studies before (see Watanabe et al. 2005 for a good description), except for the average absolute acceleration, which we consider to be the best measure for the total activity of the bird during three seconds.
9
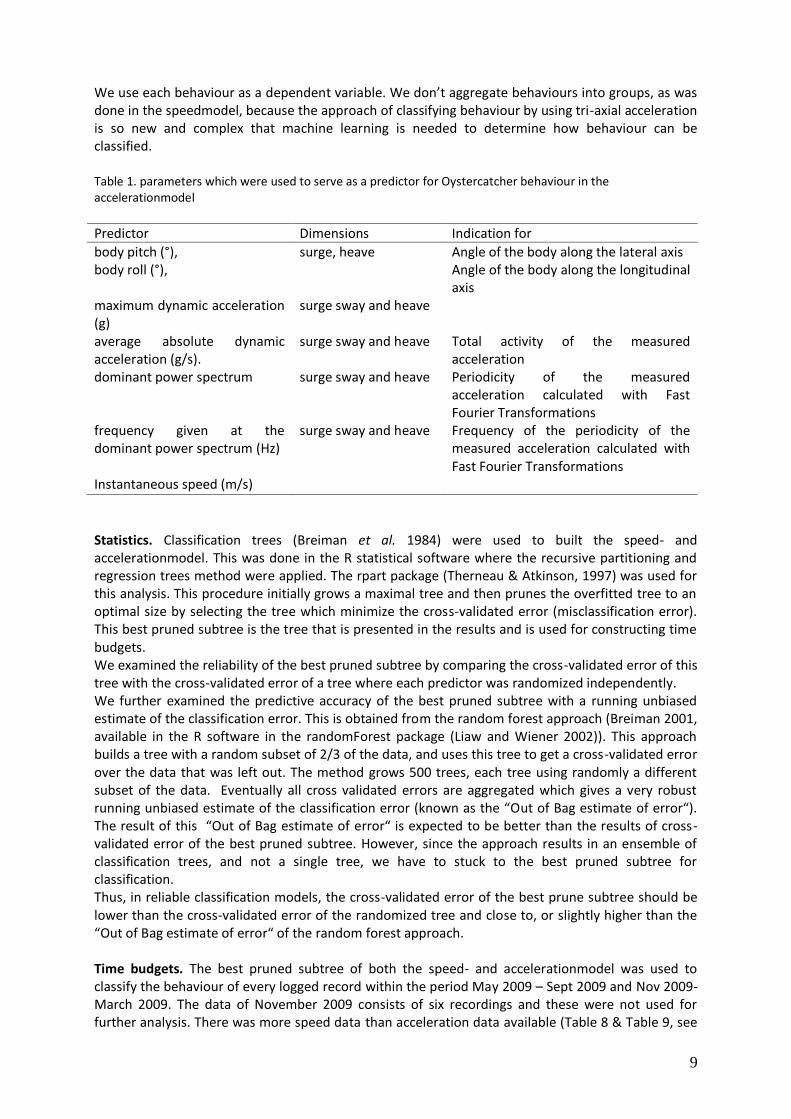
We use each behaviour as a dependent variable. We don’t aggregate behaviours into groups, as was done in the speedmodel, because the approach of classifying behaviour by using tri-axial acceleration is so new and complex that machine learning is needed to determine how behaviour can be classified. Table 1. parameters which were used to serve as a predictor for Oystercatcher behaviour in the accelerationmodel
Predictor Dimensions Indication for body pitch (°), surge, heave Angle of the body along the lateral axis body roll (°), Angle of the body along the longitudinal
axis maximum dynamic acceleration (g)
surge sway and heave
average absolute dynamic acceleration (g/s).
surge sway and heave Total activity of the measured acceleration
dominant power spectrum surge sway and heave Periodicity of the measured acceleration calculated with Fast Fourier Transformations
frequency given at the dominant power spectrum (Hz)
surge sway and heave Frequency of the periodicity of the measured acceleration calculated with Fast Fourier Transformations
Instantaneous speed (m/s) Statistics. Classification trees (Breiman et al. 1984) were used to built the speed- and accelerationmodel. This was done in the R statistical software where the recursive partitioning and regression trees method were applied. The rpart package (Therneau & Atkinson, 1997) was used for this analysis. This procedure initially grows a maximal tree and then prunes the overfitted tree to an optimal size by selecting the tree which minimize the cross-validated error (misclassification error). This best pruned subtree is the tree that is presented in the results and is used for constructing time budgets. We examined the reliability of the best pruned subtree by comparing the cross-validated error of this tree with the cross-validated error of a tree where each predictor was randomized independently. We further examined the predictive accuracy of the best pruned subtree with a running unbiased estimate of the classification error. This is obtained from the random forest approach (Breiman 2001, available in the R software in the randomForest package (Liaw and Wiener 2002)). This approach builds a tree with a random subset of 2/3 of the data, and uses this tree to get a cross-validated error over the data that was left out. The method grows 500 trees, each tree using randomly a different subset of the data. Eventually all cross validated errors are aggregated which gives a very robust running unbiased estimate of the classification error (known as the “Out of Bag estimate of error“). The result of this “Out of Bag estimate of error“ is expected to be better than the results of cross-validated error of the best pruned subtree. However, since the approach results in an ensemble of classification trees, and not a single tree, we have to stuck to the best pruned subtree for classification. Thus, in reliable classification models, the cross-validated error of the best prune subtree should be lower than the cross-validated error of the randomized tree and close to, or slightly higher than the “Out of Bag estimate of error“ of the random forest approach. Time budgets. The best pruned subtree of both the speed- and accelerationmodel was used to classify the behaviour of every logged record within the period May 2009 – Sept 2009 and Nov 2009- March 2009. The data of November 2009 consists of six recordings and these were not used for further analysis. There was more speed data than acceleration data available (Table 8 & Table 9, see
10
appendix) We used each labelled record to calculate for each bird, in a set time period of one month, the percentage of time devoted to a specific behaviour. Since the loggers were programmed to log on a regular time interval (independent from day/night, tide, habitat etc.) the percentage of time devoted to a specific behaviour could be calculated by dividing the number of observations of this behaviour by the total number of observations. To show some possible implementations of how time budgets can be used in Oystercatcher studies, we construct day and night time budgets and make time budgets for different habitats. For the day-night time budgets, day was set to start at sunrise and night was set to start at sunset. Data on sunrise and sunset was calculated from http://www.dekoepel.nl/calculator.html. For the time budgets in different habitats, we distinguish four very basic habitats which we think reflects spatially the key places in the life of resident breeding Oystercatchers on Schiermonnikoog. These habitats are: the social roosts, the mudflats outside the territory, the mudflats inside the territory and the territory on the salt marsh. A bird was set to be in its territory, either on the mudflats or on the salt marshes, when it was within 150 m from its nests. This distance was chosen after visually inspecting the geolocations of each individual in Google Earth (http://earth.google.com) were it appeared that the logged birds either stay within 150m from their nest or go far out to the mudflats. After calculating time budgets for each individual, the average (± Standard deviation (SD)) percentage of time was calculated per month. As this study is based on three loggers, no further statistics are computed.
Results
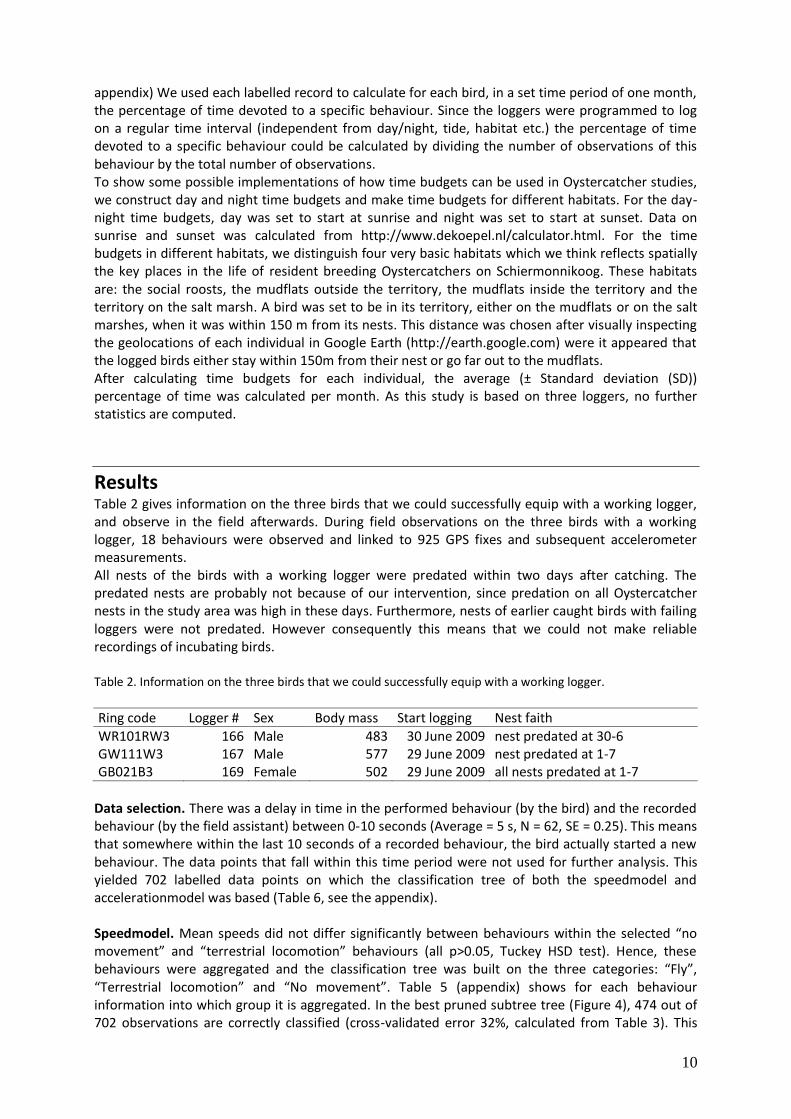
Table 2 gives information on the three birds that we could successfully equip with a working logger, and observe in the field afterwards. During field observations on the three birds with a working logger, 18 behaviours were observed and linked to 925 GPS fixes and subsequent accelerometer measurements. All nests of the birds with a working logger were predated within two days after catching. The predated nests are probably not because of our intervention, since predation on all Oystercatcher nests in the study area was high in these days. Furthermore, nests of earlier caught birds with failing loggers were not predated. However consequently this means that we could not make reliable recordings of incubating birds. Table 2. Information on the three birds that we could successfully equip with a working logger.
Ring code Logger # Sex Body mass Start logging Nest faith
WR101RW3 166 Male 483 30 June 2009 nest predated at 30-6 GW111W3 167 Male 577 29 June 2009 nest predated at 1-7 GB021B3 169 Female 502 29 June 2009 all nests predated at 1-7
Data selection. There was a delay in time in the performed behaviour (by the bird) and the recorded behaviour (by the field assistant) between 0-10 seconds (Average = 5 s, N = 62, SE = 0.25). This means that somewhere within the last 10 seconds of a recorded behaviour, the bird actually started a new behaviour. The data points that fall within this time period were not used for further analysis. This yielded 702 labelled data points on which the classification tree of both the speedmodel and accelerationmodel was based (Table 6, see the appendix). Speedmodel. Mean speeds did not differ significantly between behaviours within the selected “no movement” and “terrestrial locomotion” behaviours (all p>0.05, Tuckey HSD test). Hence, these behaviours were aggregated and the classification tree was built on the three categories: “Fly”, “Terrestrial locomotion” and “No movement”. Table 5 (appendix) shows for each behaviour information into which group it is aggregated. In the best pruned subtree tree (Figure 4), 474 out of 702 observations are correctly classified (cross-validated error 32%, calculated from Table 3). This

11
tree is only slightly better than a tree where speed was randomized (cross-validated error of 35%), indicating that the reliability of the best pruned subtree is low. It has the same cross validated error as the “Out of Bag estimate of error” given by the random forest approach This demonstrates that trees grown with a random subset of the data return the same cross validated error, indicating that the best pruned subtree cannot be improved in either way. Within the selected model, fly is classified correctly in 92% of the cases. Observed behaviours belonging to the “Terrestrial locomotion” group are in 46% of the cases predicted to be in the “No movement” group and vice versa behaviours belonging to the “No movement” group are in 18% of the cases predicted to be in the “Terrestrial locomotion” group. Table 3. Confusion matrix of the speedmodel.
Observed Fly Terrestrial locomotion No Movement
Pred
icted
Fly 12 0 1
Terrestrial locomotion 1 183 85
No Movement 0 141 279
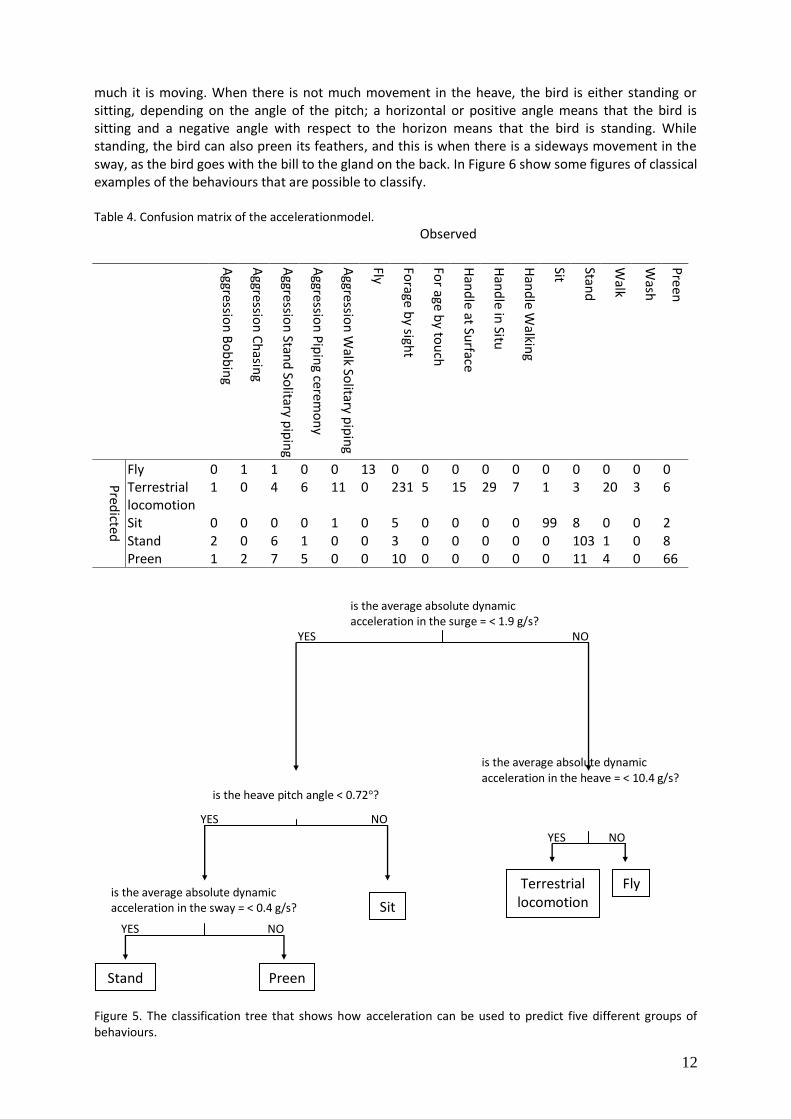
Accelerationmodel. The best pruned subtree that was built on acceleration data can classify five behaviours: fly, forage, sit, stand and wax. The tree uses the average absolute dynamic acceleration in the surge, sway and heave and the pitch angle measured in the heave to classify behaviour. Other predictor derived from measured acceleration and instantaneous speed were not selected and are consequently less useful to classify Oystercatcher behaviour. In the tree, 512 out of 702 observations are correctly classified (cross-validated error of 27%, for detailed information see Table 7 in the appendix). The tree is considerable better than a tree where each predictor was randomized independently (cross-validated error of 35%), indicating a high reliability of the best pruned subtree. The cross-validated error of this tree is slightly higher than the Out of Bag estimate of error (23%) indicating a high reliability of the selected subtree. All active behaviours on ground (e.g. handle, walk, aggressive behaviours) are classified as “forage”. Hence, in further presentation we aggregate these behaviours into one group which we call “terrestrial locomotion”. When aggregating all active behaviours on ground into one “terrestrial locomotion” group, the cross-validated error is reduced to 13% (Figure 5 cross-validated error calculated from Table 4). The way behaviour is predicted by the tree correspond with field observations on the logged birds: when the bird moves actively (in the heave), the bird is either flying or foraging, depending on how
No movement
Fly Terrestrial locomotion
is the speed = > 0.19 m/s?
Is the speed > 3.5 m/s?
NO
NO
YES
YES
Figure 4. The classification tree that shows how speed can be used to predict three different groups of behaviours
12
much it is moving. When there is not much movement in the heave, the bird is either standing or sitting, depending on the angle of the pitch; a horizontal or positive angle means that the bird is sitting and a negative angle with respect to the horizon means that the bird is standing. While standing, the bird can also preen its feathers, and this is when there is a sideways movement in the sway, as the bird goes with the bill to the gland on the back. In Figure 6 show some figures of classical examples of the behaviours that are possible to classify. Table 4. Confusion matrix of the accelerationmodel.
Observed
Aggressio
n B
ob
bin
g
Aggressio
n C
hasin
g
Aggressio
n Stan
d So
litary pip
ing
Aggressio
n P
ipin
g ceremo
ny
Aggressio
n W
alk Solitary p
ipin
g
Fly
Forage
by sigh
t
For age b
y tou
ch
Han
dle at Su
rface
Han
dle in
Situ
Han
dle W
alking
Sit
Stand
Walk
Wash
Pre
en
Pred
icted
Fly 0 1 1 0 0 13 0 0 0 0 0 0 0 0 0 0 Terrestrial locomotion
1 0 4 6 11 0 231 5 15 29 7 1 3 20 3 6
Sit 0 0 0 0 1 0 5 0 0 0 0 99 8 0 0 2 Stand 2 0 6 1 0 0 3 0 0 0 0 0 103 1 0 8 Preen 1 2 7 5 0 0 10 0 0 0 0 0 11 4 0 66
Figure 5. The classification tree that shows how acceleration can be used to predict five different groups of behaviours.
NO YES
is the average absolute dynamic acceleration in the sway = < 0.4 g/s?
Stand
Terrestrial locomotion
Preen
Sit
Fly
is the average absolute dynamic acceleration in the surge = < 1.9 g/s?
is the heave pitch angle < 0.72°?
NO
NO
YES
YES
YES
NO
is the average absolute dynamic acceleration in the heave = < 10.4 g/s?

13
0.0 0.5 1.0 1.5 2.0 2.5 3.0
-1.0
-0.5
0.0
0.5
1.0
time (s)
dynam
ic a
ccele
ration (
g)
0.0 0.5 1.0 1.5 2.0 2.5 3.0
-1.0
-0.5
0.0
0.5
1.0
time (s)
dynam
ic a
ccele
ration (
g)
0.0 0.5 1.0 1.5 2.0 2.5 3.0
-50
510
15
time (s)
heave b
ody p
itch(°
)
0.0 0.5 1.0 1.5 2.0 2.5 3.0
-50
510
15
time (s)
heave b
ody p
itch(°
)
0.0 0.5 1.0 1.5 2.0 2.5 3.0
-1.0
-0.5
0.0
0.5
1.0
time (s)
0.0 0.5 1.0 1.5 2.0 2.5 3.0
-1.0
-0.5
0.0
0.5
1.0
time (s)
dynam
ic a
ccele
ration (
g)
Terrestrial locomotionFly
Preen Stand / Sit
Stand Sit
0.0 0.5 1.0 1.5 2.0 2.5 3.0
-1.0
-0.5
0.0
0.5
1.0
time (s)
dynam
ic a
ccele
ration (
g)
Figure 6. Classical examples of the behaviours that were possible to classify. The upper four figures show figures of dynamic acceleration. Fly, terrestrial locomotion and preen can be classified when using the average
absolute dynamic acceleration respectively in the surge, heave and sway. The plotted lines represent the dynamic acceleration in the Surge, Sway and Heave. Stand and sit cannot be classified using dynamic acceleration, since in both cases the dynamic acceleration is equal to 0. Stand and sit can however, be classified using heave body pitch, which is shown in the lower two figures.

14
Time Budgets Although the accelerationmodel has a considerably smaller cross-validated error than the speedmodel (13% versus 33%), and hence can be considered as a better model for constructing time budgets, figures of both models are presented because acceleration data is scarce for the winter months and we can in this way examine the consequence of the different models. Figure 7 shows average (± SD) time budgets per month for the speed model (A) and the acceleration model (B), where a distinction is made between day and night. For the readability of Figure 7b, stand, sit and preen are aggregated into a “no movement” group. Time budgets of stand, sit and preen are presented in Figure 8. Both Figure 7 and Figure 8 show that Oystercatchers are most of the time inactive. Remarkable little time (less than 1%) is spent to flying. Both figures clearly show that birds tend to move more during the day than during the night. Instead of being active, they devote their night time to standing, as is shown in Figure 8. In the discussion we come back to the differences of classifying behaviour between the speedmodel and the accelerationmodel.
Figure 7. Monthly percentage of time devoted to different behaviour for three Oystercatchers. Each point represents the average time devoted to behaviour (± SD) which was calculated after pooling the data for each individual. Figure A gives the time budgets predicted by the speedmodel and figure B by the Accelerationmodel. The differences between day and night are presented. In figure B, for the readability of the graph, no movement activities are aggregated.
0
25
50
75
100
May-09 Jul-09 Aug-09 Oct-09 Dec-09 Jan-10 Mar-10 May-10
%
B
0
25
50
75
100
%
A
Fly day
Fly night
Terrestrial locomotion day
Terrestrial locomotion night
No movement day
No movement night
B
A

15
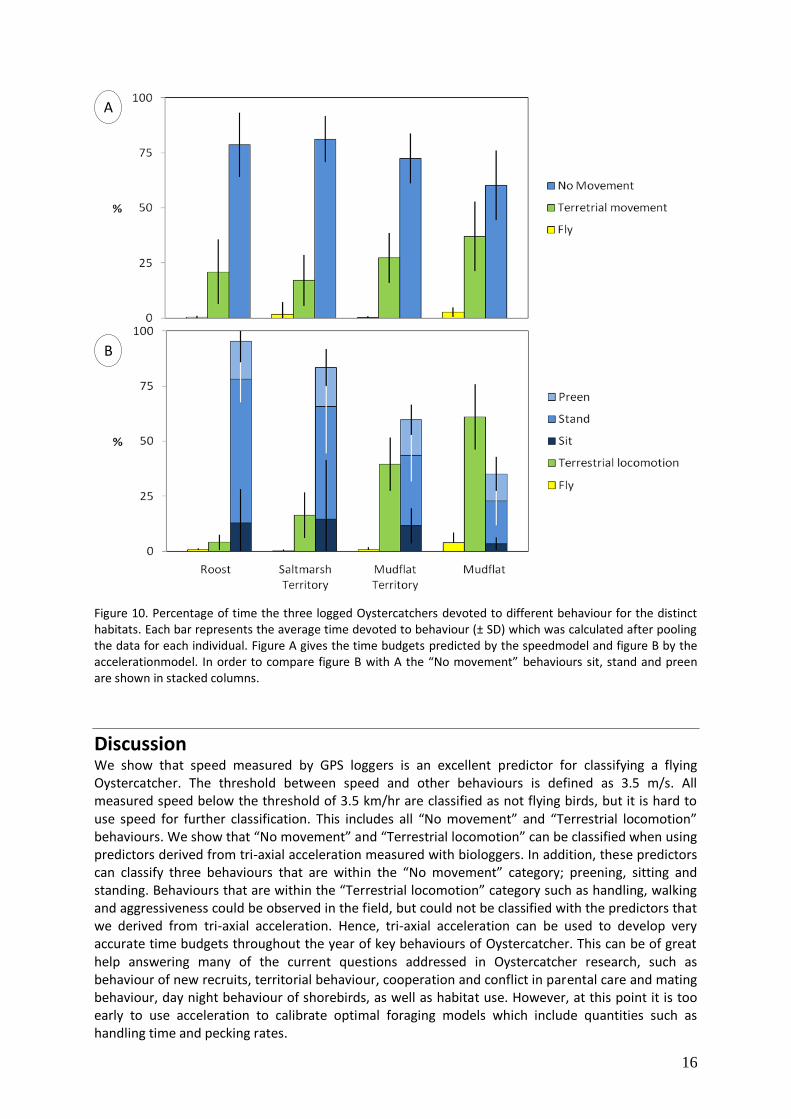
Figure 9 shows the proportion of time the logged Oystercatcher have spent in each habitat per month. The figure shows that outside the breeding season (December-February) the logged Oystercatchers have been most of the time on the mudflats or on roosts outside their territory. With the upcoming breeding season (March), the birds went back to their territory, both on the mudflats (for foraging) and on the saltmarsh (for roosting). The time budgets per habitat over the entire period are presented in Figure 10 for (A) the speedmodel and (B) for the accelerationmodel. The figure shows that, in general, Oystercatchers seems to spend the same amount of time in mudflats in and out of territory but they use their time differently; birds were more active on the mudflats outside then on the mudflats inside their territory.
Figure 9. Monthly percentage of time that the three logged Oystercatchers have spent in different habitats. Each point represents the average time that is spent in a habitat (± SD) which was calculated after pooling the data for each individual.
Figure 8. Percentage of time devoted to different behaviour during day or night for three Oystercatchers. Each bar represents the average time devoted to behaviour (± SD) which was calculated after pooling the data for each individual. Behaviour is predicted using the accelerationmodel.
16
Figure 10. Percentage of time the three logged Oystercatchers devoted to different behaviour for the distinct habitats. Each bar represents the average time devoted to behaviour (± SD) which was calculated after pooling the data for each individual. Figure A gives the time budgets predicted by the speedmodel and figure B by the accelerationmodel. In order to compare figure B with A the “No movement” behaviours sit, stand and preen are shown in stacked columns.
Discussion We show that speed measured by GPS loggers is an excellent predictor for classifying a flying Oystercatcher. The threshold between speed and other behaviours is defined as 3.5 m/s. All measured speed below the threshold of 3.5 km/hr are classified as not flying birds, but it is hard to use speed for further classification. This includes all “No movement” and “Terrestrial locomotion” behaviours. We show that “No movement” and “Terrestrial locomotion” can be classified when using predictors derived from tri-axial acceleration measured with biologgers. In addition, these predictors can classify three behaviours that are within the “No movement” category; preening, sitting and standing. Behaviours that are within the “Terrestrial locomotion” category such as handling, walking and aggressiveness could be observed in the field, but could not be classified with the predictors that we derived from tri-axial acceleration. Hence, tri-axial acceleration can be used to develop very accurate time budgets throughout the year of key behaviours of Oystercatcher. This can be of great help answering many of the current questions addressed in Oystercatcher research, such as behaviour of new recruits, territorial behaviour, cooperation and conflict in parental care and mating behaviour, day night behaviour of shorebirds, as well as habitat use. However, at this point it is too early to use acceleration to calibrate optimal foraging models which include quantities such as handling time and pecking rates.
A
B
17
Speedmodel. Our study is in agreement with other studies that instantaneous speed is a reliable predictor for flying birds (e.g. Klaassen et al. 2008). In line with our study we could not find any study that successfully used instantaneous speed to classify more behaviours on birds. Thus our expectation, based on the given accuracy of speed (Witte & Wilson, 2004) and the reported speed of foraging Oystercatchers (Ens et al., 1996), that instantaneous speed is too inaccurate to separate behaviours other than flying is confirmed. Differential GPS (dGPS), which compares the known position of a fixed receiver with that determined by the GPS device, will probably yield a more accurate speed registration (reported accuracies with a standard deviation of 0.03 ms¯¹, Witte & Wilson, 2004), however the equipment for such a study is both bulky and costly. To come to a more detailed classification of behaviour other than flying/not flying, we recommend to use tri-axial acceleration. Accelerationmodel. Former studies using biologgers measuring acceleration used several techniques to come to a classification model. Many studies build their models after inspecting the data visually because their study object could not directly observed. In this way, Yoda et al. (2001) could classify seven different behaviours on Adélie penguins, Robert-Coudert et al. (2004) could classify six behaviours in Cape Gannets Morus capensis and Laich et al. (2008) (further described by Wilson et al. (2008)) constructed decision trees similar to our study, which could identify eight behaviours for the Imperial cormorant Phalacrocorax atriceps. A more sophisticated technique to analyze acceleration data was presented by Watanbe et al. (2005). They used supervised data and fast Fourier transformation to characterize acceleration signals. In this way they could classify eight basic behaviours of the Domestic cat with a classification accuracy of 57%. In a search to classify more complex behaviours using acceleration, Sakamoto et al. (2009) developed software that could automatically (unsupervised) generate ethograms from acceleration measurements on the European shag, using continuous wavelet transformation. This yielded 20 groups probably belonging to seven behaviours. The approach of Sakamoto et al. (2009) was, among others, applied by Viviant et al. (2010), who could successfully detect prey capture attempts in Stellers sea lions Eumetopias jubatus, and by Whitney et al. 2010 who could distinguish mating events of Nurse sharks Ginglymostoma cirratum. Despite the different methods, all studies, including our study, showed that biologgers measuring acceleration can be used to classify basic behaviours of animals. So far, there are no studies that could derive very complex patterns of behaviour from measured acceleration. It is possible that a classification method for more complex behaviours such as handle, individual pecks and steps can be found with a very fine-scaled analysis of behaviour, using video recordings of birds that are logged at a high frequency. Video recordings have the advantage that they can be played back and played at reduced speed. Moreover, they allow more (independent) observers that can use the ethovision software developed by Noldus (www.noldus.com). Nevertheless, at this stage, when looking by eye at the acceleration data that was linked to observed behaviour of Oystercatchers, it is hard, if not impossible to see any consistent difference within the “Terrestrial locomotion” behaviours. Measured acceleration of a foraging, handling, walking or aggressive bird looks in all aspects similar (Figure 11). We conclude that the selected accelerationmodel can classify 5 basic behaviours quite accurately within a cross-validated error of 13%. It is not expected that the misclassified cases are due to malfunction of the accelerometer, but rather due to the variation in behaviour of Oystercatchers. For example, four times (2%) a standing/sitting Oystercatcher was classified to forage. We explain this by our observations that during sitting/standing, Oystercatchers sometimes shake their feathers, turn around or move from one leg to the other. We considered that these actions were too short to be of a different behaviour. However, it is likely that our classification model classifies this as a different behaviour. Vice versa, there are eight cases (3%) where a bird was observed to be foraging, but was classified to be either sitting or standing. The data of these cases look perfectly like a sitting or standing bird; there is no movement in either direction. We observed that Oystercatchers that forage by sight can stand for several seconds to look at a prey. Although we considered that this behaviour still falls within the foraging by sight category since it is time devoted to foraging, one can argue that

18
Figure 11. Arbitrarily chosen examples of how dynamic acceleration looks for a foraging (left figure) and handling (right figure) bird. When looking through all the figures of acceleration, there was no clear difference to see between a foraging and a handling bird. Hence, the left figure could as well have been a handling bird and the right figure a foraging bird. The plotted lines represent the acceleration in the Surge, Sway and Heave.
0.0 0.5 1.0 1.5 2.0 2.5 3.0
-1.0
-0.5
0.0
0.5
1.0
time (s)
dyn
am
ic a
cce
lera
tio
n (
g)
0.0 0.5 1.0 1.5 2.0 2.5 3.0-1
.0-0
.50
.00
.51
.0
time (s)
this type of behaviour should be classified in a different way. Here we enter a fundamental issue regarding our defined behaviours. Since we observe the bird for a longer time, we determine that the this looking for prey is time devoted to foraging, but –of course- our classification model classifies this behaviour as standing. This is a shortcoming of our method to classify behaviour within a time period of three seconds, without looking to the behaviour that the bird performed just before or afterwards. Future studies that use our method should have this in mind and should adapt their classification system in advance to this way of classifying behaviour. It was argued by Watanuki et al. (2005) that a correction of the attachment angle yields a better measure for pitch angle. We believe that in the case of the Oystercatcher, a correction for attachment angle is not needed. A correction for attachment angle would lead to a slightly different value for body pitch. Body pitch is, in our classification model, used to distinguish a standing bird from a sitting bird. The values of body pitch for standing and sitting are so far apart from each other that a small correction would not lead to a different classification. This includes the eight cases were a sitting birds was classified as a standing bird. Hence, future studies on Oystercatcher that use time-budgets derived from acceleration do not have to go into the field to gather data that can be used to correct for attachment angle. A time saving conclusion. Time budgets. Contrary to our study, all previous studies using accelerometer attached to animals measured acceleration over a short time period (e.g. less than a week) because acceleration demands high battery power and storage capacity. Due to our solar powered devices and our choice to measure three seconds of acceleration on a regular interval, we are able to construct time budget throughout the year. We are not aware of any study that could make time budget in such a way. We constructed time budgets to show some of the possible implementations of the developed method. Indeed, the time budgets already show some interesting aspects of Oystercatcher behaviour on a spatial and temporal scale. For example, we show that Oystercatchers are most of the time
19
inactive and remarkable little time (less than 1%) is spent to flying. In general logged Oystercatcher were more active during the day than at night. Even in the cold winter of 2010, the birds did not forage much during the night (January averaged -0.6°, long term mean 2.8°, www.knmi.nl). We showed differences in behaviour between day and night, but the model can as well be used to study behaviour in relation to the tidal and lunar cycles and how the activity patterns are influenced by weather conditions. Figure 7 shows that there is more variation in behaviour between months when classifying behaviour with the accelerationmodel instead of the speedmodel. This is an important difference which shows that, indeed, the models have different results when classifying the three most basic behaviours of Oystercatchers. Since the accelerationmodel is considerably better in classifying behaviour it is this model that should be used in future studies, even when a classification of the three most basic behaviours is needed The results of the monthly time spent per habitat (Figure 9) shows that in the breeding season (June-July) much time is spend in the territory, either on the mudflats or on the salt marsh (when roosting). However, there is a large variation between individuals (large error bars). This is not due to early failure of the breeding season; all nests of logged birds were predated in the same week. Hence, this represents individual variation (choices) among the logged birds. Eventually, when many Oystercatchers of the Schiermonnikoog population are equipped with a biologger these individual choices can be linked to fitness data. We have no indications that the loggers noticeably affect the behaviour of the Oystercatchers. After the birds were equipped with a logger, they went within several hours back to their territory where they performed normal behaviour such as incubating, foraging and a variety of aggressive behaviours. However, the logged Oystercatcher devote both during day and night surprisingly much time to preening, indicated by Figure 8. Although it is unknown how much time Oystercatcher “normally” spend to preening because it was never measured before (e.g not by Kersten, 1996), it is possible that the attached logger demands more body care such as preening.
Conclusion Overall, we conclude that the current study shows that biologging can be used to distinguish several key behavioural classes. We show that this information can be used to calculate time budgets in a spatial and temporal scale. Such quantitative analysis of behaviour can improve our understanding of how Oystercatchers organize their time. Thus indeed, biologging can help answering many of the questions that are currently addressed concerning fundamental en conservational ecology of Oystercatchers.
20
Acknowledgements Many people have been involved in this project. This leaded to various interesting conversations, most of them by email. I guess everyone sometimes lost track at a certain point, but I believe everybody is back on the track by now. Most help I got from my main supervisors dr. Judy Shamoun-Baranes and dr. Bruno Ens. Judy was of great help to keep me going, especially during the analysis. Bruno could visit me several times during the fieldwork which was very inspiring. He was always willing and happy to comment on graphs and text during the analysis. Kees Oosterbeek was very often with me in the field, and without his unsurpassed experience we certainly couldn’t have done this project. Moreover his attitude during the fieldwork and the drinks we had afterwards was fantastic. Despites his busy life, Prof. Willem Bouten always answered his emails (most of them in the late night), which was of great help to keep to process running, both during the fieldwork and the analysis. Edwin Baaij developed the GPS-loggers and was always “online” to answer questions when we faced technical problems. Emiel van Loon was of value for the statistical analysis and it was nice to work with him again. I was very pleased to be accompanied by several students that had the unthankful task to record the behaviours in the handheld computer that I called out. A special thanks goes to Jeroen Onrust and Hedwig Ens. Thanks to their precise way of working the data was reliable. What’s more is that they were a good company, which makes the fieldwork much more pleasant. Furthermore I thank the fieldworkers: Maaike Ebbinge, Hans Bom, Jelle Abma & Linde Veldhoen. I thank everybody from the field station “Herdershut”, who made life during the fieldwork pleasant. I thank Maaike for spending the last four weeks of the fieldwork together on my boat with me, which was a good adventure.

21
References Bograd, S.J., Block, B.A., Costa, D.P. & Brendan, J.G. (2008). Biologging technologies: new tools for
conservation. Introduction. ESR 10:1-7 Breiman, L. (2001). Random forests. Machine Learning 45:15–32. Breiman, L., Friedman, J.H., Olshen, R.A. & Stone, C.J. (1984). Classification and regression trees.
Wadsworth and Brooks/Cole, Monterey, California, USA. van Dijk, A.J., Dijksen, L., Hustings, F., Koffijberg, K., Oosterhuis, R., van Turnhout, C., van der Weide,
M.J.T., Zoetebier, D., & Plate, C. (2006). Broedvogels in Nederland 2004. SOVON-monitoringrapport 2006/01. SOVON. Vogelonderzoek Nederland, Beek-Ubbergen.
Ens, B. J., Kersten, M., Brenninkmeijer, A. & Hulscher, J. B. (1992). Territory quality, parental effort
and reproductive success of Oystercatcher (Haematopus ostralegus). Journal of Animal Ecology, 61, 703-715.
Ens, B.J., Weissing, F.J., Drent, R.H. (1995). The despotic distribution and deferred maturity: two sides
of the same coin. Am Nat. 146:625-650. Ens, B.J., Aarts, B.L., Oosterbeek, K., Roodbergen, M., Sierdsema, H., Slaterus, R. & Teunissen, W.
(2009). Onderzoek naar de oorzaken van de dramatische achteruitgang van de Scholekster in Nederland. Limosa. 89:83-92.
Ens, B.J. (2006). The conflict between shellfisheries and migratory waterbirds in the Dutch Wadden
Sea. In: Boere GC, Galbraith CA, Stroud DA, editors. Waterbirds around the world. Edinburgh, UK: The Stationery Office. p. 806-811.
Hagemeijer, W.J.M. & Blair, M.J. (1997). The EBCC Atlas of European Breeding Birds: Their
Distribution and Abundance. T & A D Poyser, London. Kersten,M. (1996). Time and energy budgets of Oystercatchers Haematopus ostralegus occupying
territories of different quality. Ardea, 84A, 291-310. Klaassen, R., Strandberg, R., Hake, M. & Alerstam, T. (2008). Flexibility in daily travel routines causes
regional variation in bird migration speed - Behav. Ecol. Sociobiol. 62:1427-1432 Laich, A.G., Wilson, R.P., Quintana, F. & Shepard, E.L.C. (2008) Identification of imperial cormorant
Phalacrocorax atriceps behavior using accelerometer. Endang Species Res. Published online (doi:10.3354/esr00091).
Liaw A, Wiener M. (2002). Classification and regression by Random Forests. R News, 2/3:18–22.
[online] URL http://CRAN.R-project.org/doc/Rnews/. Nathan, R. (2008). An emerging movement paradigm. P. Natl. Acad. Sci. USA 105, 19050 – 19051. van de Pol, M., Pen, I., Heg, D. & Weissing, F.J. (2007). Variation in habitat choice and delayed
reproduction: adaptive queuing strategies or individual quality differences? Am Nat. 170:530-541.
Piersma T., Koolhaas, A., Dekinga, A., Beukema, J.J., Dekker, R. & Essink, K. (2001). Long-term indirect
22
effects of mechanical cockle-dredging on intertidal bivalve stocks in the Wadden Sea. Journal of Applied Ecology 38: 976-990.
Rappoldt, C., Ens, B. J., Dijkman, E., & Bult, T. (2003) Scholeksters en hun voedsel in de Waddenzee.
Rapport voor deelproject B1 van EVA II, de tweede fase van het evaluatieonderzoek naar de effecten van schelpdiervisserij op natuurwaarden in de Waddenzee en Oosterschelde 1999-2003. Alterra rapport 882. Alterra, Wageningen.
Ropert-Coudert, Y., Gremillet, D., Kato, A., Ryan, P.G., Naito, Y. & Le Maho, Y. (2004) A fine-scale time
budget of Cape gannets provides insights into the foraging strategies of coastal seabirds. Animal Behaviour, 67, 985–992.
Ropert-Coudert, Y, & Wilson R.P. (2005). Trends and perspectives in animal-attached remote sensing.
Front Ecol Environ 3: 437–444. R Development Core Team (2010). R: A language and environment for statistical computing. R
Foundation for Statistical Computing, Vienna, Austria. ISBN 3-900051-07-0, URL http://www.R-project.org.
Rutten, A.L., Oosterbeek, K., Verhulst, S. & Ens, B.J. (2010). Experimental evidence for interference
competition in oystercatchers, Haematopus ostralegus. II. Free-living birds. Behav Ecol. In press. Sakamoto, K.Q., Sato, K., Ishizuka, M., Watanuki, Y., Takahashi, A., Daunt, F. & Wanless, S. (2009).
Can ethograms be automatically generated using body acceleration data from freeranging birds? PLoS ONE 4:e5379
Shepard, E.L.C., Wilson, R.P., Quintana, F., Gómez Laich, A., Liebsch, N., Albareda, D.A., Halsey, L.G.,
Gleiss, A., Morgan, D.T., Myers, A.E., Newman, C. & Macdonald, D.W. (2008). Identification of animal movement patterns using tri-axial accelerometry ESR 10:47-60.
Sutherland, W.J. (1996). From Individual Behavior to Population Ecology. Oxford University Press,
Oxford. Therneau, T. M. & Atkinson, E. J. (1997). An introduction to recursive partitioning using the RPART
routines; Technical Report; Department of Health Sciences Research: Mayo Clinic. Urfi, A. J., Goss-Custard, J. D. & Durell SEAL. 1996. The ability of oystercatchers Haematopus
ostralegus to compensate for lost feeding time: Field studies on individually marked birds. J Appl Ecol. 33:873-883.
Viviant, M., Trites, A. W., Rosen, D. A. S., Monestiez, P. & Guinet, C. (2010). Prey capture attempts
can be detected in Steller sea lions and other marine predators using accelerometers. Polar Biol 33:713–719
Watanabe, Y., Izawa, M., Kato, A., Ropert-Coudert, Y. & Naito, Y. (2005). A new technique for
monitoring the detailed behaviour of terrestrial animals: a case study with the domestic cat. Appl Anim Behav Sci 94:117–131.
Watanuki, Y., Takahashi, A., Daunt, F., Wanless, S., Harris, M., Sato, K. & Naito, Y. (2005). Regulation
of stroke and glide in a foot-propelled avian diver. J. Exp. Biol. 208, 2207-2216. Wilson, R.P., Shepard, E.L.C. & Liebsch, N. (2008). Prying into the intimate details of animal lives: use
of a daily diary on animals. Endang. Species Res 4: 123-137

23
Witte, T.H. & Wilson, A.M. (2004). Accuracy of non-differential GPS for the determination of speed
over ground. J. Biomech. 37, 1891-1898. Whitney, N. M. , Pratt, H.L. Jr, Pratt, T.C. & Carrier, J. C. (2010). Identifying shark mating behaviour
using three-dimensional acceleration loggers. Endang Species Res 10:71-82 Yoda, K., Sato, K., Niizuma, Y., Kurita, M., Bost, C.A., Le Maho, Y., Naito, Y. (1999). Precise monitoring
of porpoising behaviour of Adélie penguins determined using acceleration data loggers. J Exp Biol 202:3121–3126.
Yoda, K., Naito. Y., Sato, K., Takahashi, A., Nishikawa, J., Robert-Coudert, Y., Kurita, M., Le Mahor, Y.
(2001). A new technique for monitoring the behavior of free-ranging Adélie penguins. J. Exp. Biol. 204, 685 – 690.

Appendix Table 5. Different (sub) behaviour that we could observe on Oystercatchers. The last two columns show the group in which each behaviour was aggregated for building the speedmodel.
Behaviour sub behaviour Description Speedmodel Fly normal flight Bird is flying from A to B Fly Fly chase flight Bird is chasing other birds (conspecifics / predators) Not observed Fly alarm flight Bird is calling while flying Not observed Fly transporting prey Bird is flying with prey Not observed Fly butterfly flight Bird is flying as a butterfly when it lands in his territory Not observed Fly piping ceremony in flight Bird is flying with conspecifics while calling loudly Not observed Fly “schwirr flug” Bird is flying while moving its wings with high frequency. Not observed Walk Bird is walking from A to B Terrestrial locomotion Stand Bird is standing No movement Sit Bird is sitting No movement Incubate Bird is sitting on the nest, breeding the eggs Not observed Body care Preen Bird is preening its feathers No movement Body care Head scratch Bird is scratching its head with its leg Not observed Body care Wash Bird is washing No movement Aggression Stand Solitary piping Bird is calling loudly while standing, conspecifics are nearby No movement Aggression Walk Solitary piping Bird is calling loudly while walking, conspecifics are nearby No movement Aggression Piping ceremony Bird is calling loudly together with other birds Terrestrial locomotion Aggression Diplomatist attitude / pseudo-sleep Bird is standing straight while aggressive Not observed Aggression Border dispute, including bobbing Bird is walking along its territory border while bobbing No movement Aggression Chasing Bird is chasing conspecifics Terrestrial locomotion Forage By sight Bird is searching for prey by sight Terrestrial locomotion Forage By touch Bird is searching for prey by touch Terrestrial locomotion Handle Handling at surface Bird is handling the prey at the surface No movement Handle Handling in situ Bird is handling the prey beneath the surface No movement Handle Walking with prey Bird is walking with the prey Terrestrial locomotion Chick rear Feeding Bird is feeding its chicks Not observed Chick rear Breeding Bird is breeding its chicks Not observed

Table 6. Number of recordings that could be linked to behaviour and were used for classification trees. Number between brackets refer to data that was used for the accelerationmodel.
Logger#
Behaviour 166 167 169 Aggression Bobbing 0 1 3 Aggression Chasing 1 1 1 Aggression Piping Ceremony 0 7 5 Aggression Stand Solitary 11 2 5 Aggression Walk Solitary 3 9 0 Forage By Sight 100 111 38 Forgage By Touch 5 0 0 Fly Normal Fly 6 5 2 Handle At Surface 5 10 0 Handle In Situ 7 22 3 Handle Walk 5 2 0 Sit 19 81 0 Stand 23 34 65 Walk 1 20 4 Body Care Wash 3 0 0 Body Care Preen 53 7 22 Table 7. Information on the complexity of the best pruned subtree of the accelerationmodel
CP nsplit rel error xerror xstd 0.229581 0 1.00000 1.00000 0.027982 0.200883 1 0.77042 0.77483 0.029244 0.121413 2 0.56954 0.57616 0.028267 0.028698 3 0.44812 0.49227 0.027230 0.010000 4 0.41943 0.48124 0.027064 Table 8. Number of speed recordings per month that were used to classify behaviour.
Logger 166 Logger 167 Logger 169
Month Day Night Day Night Day Night Total Day Total Night Total
Jun 2009 61 23 134 61 53 21 248 105 353 Jul 2009 2051 810 1989 774 2053 813 6093 2397 8490 Aug 2009 316 177 324 190 324 193 964 560 1524
Sept 2009 60 66 73 74 133 140 273 Nov 2009 1 23 10 5 23 16 39 Dec 2009 112 256 102 184 114 259 328 699 1027 Jan 2010 102 203 31 12 102 184 235 399 634 Feb 2010 227 316 60 20 194 267 481 603 1084 Mar 2010 597 617 107 43 525 550 1229 1210 2439
26
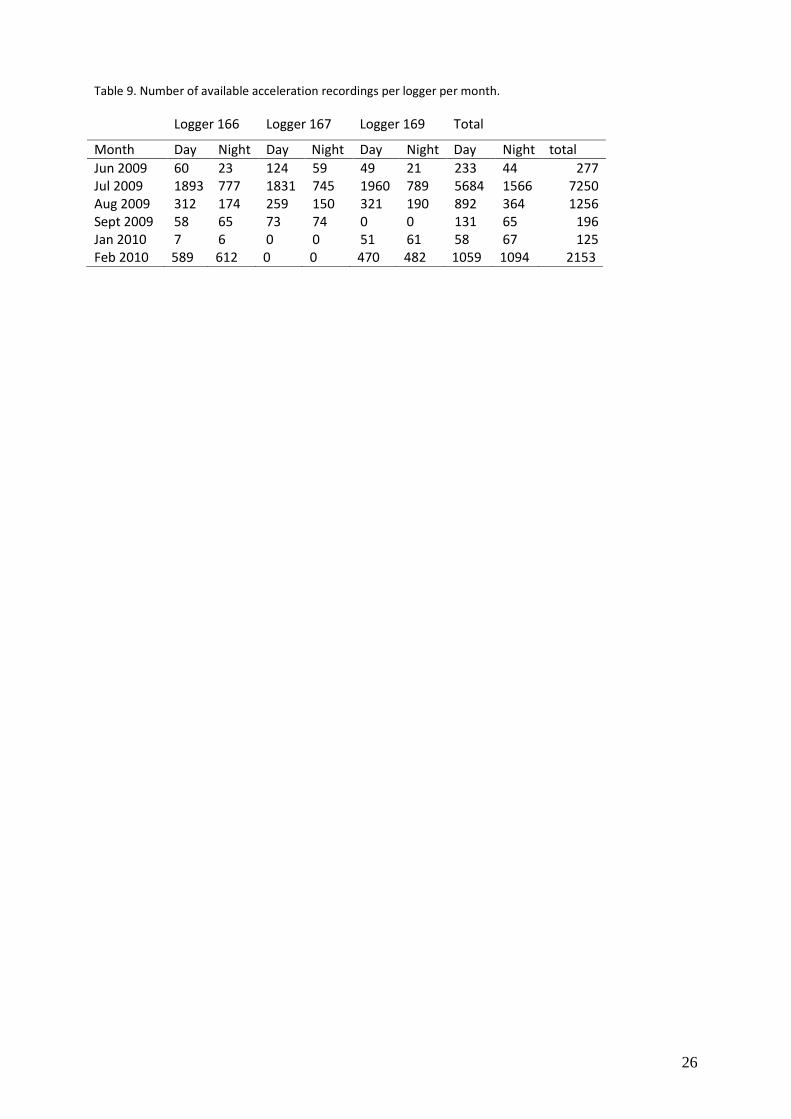
Table 9. Number of available acceleration recordings per logger per month.
Logger 166 Logger 167 Logger 169 Total
Month Day Night Day Night Day Night Day Night total Jun 2009 60 23 124 59 49 21 233 44 277 Jul 2009 1893 777 1831 745 1960 789 5684 1566 7250 Aug 2009 312 174 259 150 321 190 892 364 1256 Sept 2009 58 65 73 74 0 0 131 65 196 Jan 2010 7 6 0 0 51 61 58 67 125 Feb 2010 589 612 0 0 470 482 1059 1094 2153