can colored dissolved organic material protect coral reefs
TRANSCRIPT

University of South Florida University of South Florida
Scholar Commons Scholar Commons
Graduate Theses and Dissertations Graduate School
4-4-2009
Can Colored Dissolved Organic Material Protect Coral Reefs by Can Colored Dissolved Organic Material Protect Coral Reefs by
Reducing Exposure to Ultraviolet Radiation? Reducing Exposure to Ultraviolet Radiation?
Lore Michele Ayoub University of South Florida
Follow this and additional works at: https://scholarcommons.usf.edu/etd
Part of the American Studies Commons
Scholar Commons Citation Scholar Commons Citation Ayoub, Lore Michele, "Can Colored Dissolved Organic Material Protect Coral Reefs by Reducing Exposure to Ultraviolet Radiation?" (2009). Graduate Theses and Dissertations. https://scholarcommons.usf.edu/etd/1839
This Dissertation is brought to you for free and open access by the Graduate School at Scholar Commons. It has been accepted for inclusion in Graduate Theses and Dissertations by an authorized administrator of Scholar Commons. For more information, please contact [email protected].

Can Colored Dissolved Organic Material Protect Coral Reefs by Reducing Exposure to
Ultraviolet Radiation?
by
Lore Michele Ayoub
A dissertation submitted in partial fulfillment of the requirements for the degree of
Doctor of Philosophy College of Marine Science University of South Florida
Co-Major Professor: Paula G. Coble Ph.D. Co-Major Professor: Pamela Hallock-Muller Ph.D.
Susan Bell, Ph.D. Kendall Carder, Ph.D. Gary Mitchum, Ph.D.
Date of Approval: April 4, 2009
Keywords: light attenuation, absorption coefficient, mycosporine-like amino acids, UVR, development, underwater light field
© Copyright 2009, Lore Michele Ayoub

Acknowledgements
I would like to thank Florida Institute of Oceanography/Keys Marine Laboratory,
the Florida Keys National Marine Sanctuary, and Mote Tropical Research Laboratory for
field support. Sample collection and processing was funded by NOAA-NURC
subcontract No. 2004-19B (PI: P. Hallock Muller); NOAA through the Florida Hurricane
Alliance (PI: Thomas Mason); and the U.S. Environmental Protection Agency Gulf
Ecology Division Grant No. X7-96465607-0 (PI: P. Hallock Muller). I also thank the
Edmund J. and Alton S. Greenwell Foundation for funding critical instrumentation.
Sampling permits were issued by NOAA-Florida Keys National Marine Sanctuary
(KLNMS-2003-002, -2005-002, -2007-013
I would like to thank my fellow graduate students and colleagues at the University
of South Florida, especially Robyn Conmy, Jennifer Cannizarro, Chunzi Du and David
English, Dan Otis, the Reef Indicators Lab, Kara Sedwick and Laura Fauver.
I would like to acknowledge my co – advisors Paula G. Coble and Pamela
Hallock Muller, gifted scientists whose mentorship and dedication to marine science
inspired me. Their commitment, support, and guidance served well above their
responsibilities as advisors. I would also like to thank my committee for providing input
into this manuscript, especially Gary Mitchum I would also like to thank Norm Nelson
for guidance throughout my research and academic career.
I acknowledge my family, especially Rosemarie Ayoub, my uncle, Al Ayoub, my
boyfriend, Gerry Growney, and my friends, especially Erica Hudson, whose support,
encouragement and love allowed me to accomplish this goal with dedication.

Dedication
This dissertation is dedicated to my father, Theodore Anthony Ayoub, DDS, and
my grandmother, Sadie Ayoub.

i
Table of Contents
List of Tables iii
List of Figures v
Abstract x
1. Introduction 1 2. Background 5
2.1. Electromagnetic radiation and the solar spectrum 5 2.2. Atmosphere – UV interactions 7 2.3. Annual cycle of UVR 13 2.4. UVR – environment interactions 15 2.5. CDOM composition 18 2.6. CDOM optical properties 20
2.7. CDOM sources, sinks and pathways 21 2.8. Remote sensing of UVR and coral reefs: application of the spectral slope of ag 25
2.9. Photobiology of UVR and effects on aquatic ecosystems 27 2.10. Defenses against UVR: Mycosporine-like amino acids (MAAs) 30 2.11. Stratospheric ozone depletion and bleaching 32 2.12. Statement of hypothesis 34
3. Introduction to the Florida Keys, Study sites, and Methodology 36 3.1. Objectives 36 3.2. Introduction 36
3.2.1. Geomorphology and water circulation patterns of the Florida Keys 36
3.2.2. Rivers and Florida Bay as sources of CDOM and other material to the Florida Keys 39
3.2.3. Annual trends in the Florida Keys 40 3.2.4. Biological Response – Bleaching in the Florida Keys 43
3.3. Methods 46 3.3.1. Sites and sampling dates 46 3.3.2. In situ and incident irradiance measurements 52 3.3.3. Water samples: collection and in lab optical measurements 53 3.3.4. Calculating underwater irradiance
from in lab absorption measurements 54 3.3.5. Sources of Error 55
ii
3.3.5.1. Irradiance and absorption due to particles 55 3.3.5.2. Absorption due to colloids 59
4. Colored dissolved organic material protects coral reefs by controlling exposure to UVR 60 4.1. Introduction 60 4.2. Material and Methods 63 4.3. Results and Discussion 66 4.4. Conclusions 78 5. Mycosporine-like Amino Acids as indicators of photo-oxidative stress 81
5.1. Introduction 81 5.2. Methods 85 5.3. Results and Discussion 85 5.4. Future Work 97
6. Spatial Variability of Inherent and Apparent Optical Properties on Coral Reefs 99
6.1. Background 99 6.2. Objectives 100 6.3. Methods 100 6.3.1. Calculating underwater irradiance 101
6.3.2. The angular distribution of light 102 6.4. Results and Discussion 106 6.5. Conclusions 111
7. Conclusions and Future Research 116 7.1 Conclusions 116 7.2. Future Research 120 References 122 Appendices 133
Appendix A: Map of Florida Keys with waterways, cities, management areas and reefs 134
Appendix B: Important Terms and Abbreviations 135 About the Author end page
iii
List of Tables
Table 3.1. Mote Marine Laboratory / Florida Keys National Marine Sanctuary Coral Bleaching Early Warning
Network, “Bleachwatch”. 45
Table 3.2a. Sites and parameters sampled in 2004 and 2005. a = absorption, R=Rrs, remote sensing reflectance, C = chlorophyll fluorescence (concentration), S = Spectral underwater flow-through optical instrument package, P=PAR underwater, U=UV and PAR_incident, U_u = UV and PAR underwater. 47
Table 3.2b. Sites and samples for Spring/Summer 2006. 49 Table 3.2c. Sites and samples for Spring/Summer 2007 49 Table 3.3a. Tide table for sampling sites (Key Largo 6m (KL6m)
Reef, Algae Reef) on dates sampled in 2004. 51
Table 3.3b. Sampling (water collection) times for Carysfort, Algae and Key Largo 6m (KL6m) Reefs, May, July, and September 2004. 51
Table 3.4. Median at/Kd and 25th – 75th percentile ranges for inshore and offshore reefs. 56 Table 3.5. Median ag/at and ap/at and 25th – 75th percentile ranges for inshore and offshore reefs. 58 Table 4.1. Medians and 25th – 75th percentile ranges for ag 320 at intact shoreline – associated reefs compared to
developed shoreline – associated reefs. 69 Table 4.2 Comparison of Kd between inshore and offshore reefs 71 Table 4.3 Medians and 25th – 75th percentile ranges for Ed6m/Ed0 at 305, 330, 380 nm and PAR 73 Table 4.4 Medians and 25th – 75th percentile ranges for S

iv
(280 – 312 nm) for the Upper, Middle, and Lower Keys, inshore versus offshore sites. 74 Table 4.5 Scaling gradients for % stony coral cover (%cc) and ag 320 77 Table 5.1. Medians, 25th – 75th percentile ranges, and number of samples (n) for relative MAA expression at inshore versus offshore reefs, surface versus bottom. 89 Table 5.2. Medians, 25th – 75th percentile ranges, and number
of samples (n) for relative MAA expression comparing regions, Upper, Middle and Lower Keys. 91
Table 5.3 ag 320 at the surface only for the Florida Keys by region, Upper, Middle and Lower Keys 93 Table 5.4 ag 330 at the bottom and surface for the Florida Keys by region, Upper, Middle and Lower Keys 94 Table 5.5 Medians, 25th and 75th percentiles, and number of
samples (n) for [chl] for the Lower, Middle and Upper Keys 97
Table 6.1. Meteorological data, salinity and bottom type, as well as optical parameters used as input, model bottom type, and output (“modeled”) for Hydrolight© version 5.0 for for Algae Reef and KL6m Reef on September 28, 2004. 107
Table 6.2. Comparison of µd for Algae and KL6m Reef surface
and bottom at 305, 320, 330 and 380 nm. 108 Table 6.3 Inherent and Apparent Optical Properties (IOPs and AOPs) computed by Hydrolight© (version 5) for Algae and KL6m Reef, surface and bottom, at 305, 320, 330 and 380 nm, based upon in situ absorption, a, and scattering, b. 109 Table 6.4 Medians and 25th – 75th percentile ranges for
ag 330 at Algae and KL6m reefs, surface and bottom, for all sampling dates from 2004 – 2007. 111

v
List of Figures
Figure 1.1. Absorption due to CDOM (also known as gelbstoff) (ag) is high in mangrove canals and progressively decreases with distance offshore. 3
Figure 2.1. Spectra of nonionizing solar radiation (A) and
ultraviolet radiation (B) showing main radiation bands, their nomenclature, and approximate wavelength limits. 6
Figure 2.2. Interactions between ozone depletion and climate
change. 8
Figure 2.3. Solar irradiance outside the atmosphere and at sea level. 9 Figure 2.4. Example of an action spectrum for erythemal and
DNA damage (http://www.temis.nl/uvradiation /info/uvaction.html). 10
Figure 2.5. Mean daily UV-B and UVR at the Mote Marine Laboratory in the Lower Keys (latitude 24.5oN, longitude 81.6oW) during 2002 – 2003. 14
Figure 2.6a. Incident spectral irradiance (on land) measured with a
LiCOR-1800 spectroradiometer at 10-minute intervals on May 25, 2005 at NURC, Key Largo, FL. 15
Figure 2.6b. Median incident spectral irradiance (above water) on
May 25, 2004 (15:50 to 16:10) and on July 6, 2004 (16:00), on land (Keys Marine Lab or NURC, Key Largo, FL). 16
Figure 2.7. Incident irradiance (Ed0, 350 – 700 nm) and spectral
absorption due to CDOM (ag), particulate material (ap) and pure water (aw) for Key Largo 6m (KL6m) Reef in May 2004. 18
Figures 2.8. Pathways for the formation of humic substances
(J. Weber in http://www.ar.wroc.pl/~weber/ powstaw2.htm#1). 20

vi
Figure 2.9. Flow chart illustrating sources, sinks and pathways
of Chromophoric Dissolved Organic Matter (CDOM) in aquatic ecosystems (after Zepp 2003 and Morris et al. 1997). 22
Figure 2.10. Diagrammatic representation of the two trophic
pathways in plankton communities (from Wotton 1994 based on Pomeroy and Wiebe 1988). 24
Figure 2.11. Pathways between UV radiation exposure and
cellular stress. 27 Figure 2.12. Monthly hemispheric means and growth rates of
HCFCs from weighted measurements of surface-air collected in flasks at remote locations (Northern Hemisphere (red) > global mean (green) > Southern Hemisphere (blue)). 33
Figure 3.1. Study sites in the Lower, Middle and Upper Florida
Keys included offshore and inshore (patch) reefs that differ in degree of development of associated shoreline. 37
Figure 3.2a. Temperature and precipitation at Key West (Lower
Keys), 2003-2006. (http://www.ncdc.noaa.gov/oa/ climate/research/monitoring.html#ustempprcp). 41
Figure 3.2b. Monthly mean wind speed (WSPD), gust (GST),
air temperature (ATMP) and water temperature (WTMP) at Key West (Lower Keys) for 2005 – 2007. 41
Figure 3.3. Monthly mean wind speed (WSP), gust (D GST), air temperature (ATMP) and water temperature (WTMP) at Molasses Reef (Upper Keys) for 2004 - 2007. 42
Figure 3.4. Monthly mean wind speed (WSP), gust (GST), and air temperature (ATMP) at Sombrero Key (Middle Keys) for 2004 through 2007. 43
Figure 3.5. Overview of BleachWatch Observer reports
submitted from August 9 - August 23, 2005 (http://isurus.mote.org/Keys/bleaching/ CC_20050823.pdf). 46

vii
Figure 3.6. Mean percent stony coral cover in the Florida Keys by region, Upper, Middle and Lower Keys. 50 Figure 3.7. Ratio of in lab at to in situ Kd (at/Kd) for inshore (x) and offshore (o) reef sites, 2005 – 2008. 57 Figure 4.1. Atmospheric, optical, and biological factors affecting
CDOM absorptivity and related biological effects (after Morris and Hargreaves 1997; Zepp et al. 2008). 63
Figure 4.2. Study sites in the Lower, Middle and Upper Florida
Keys included offshore reefs and inshore (patch) reefs that differ in degree of development of associated shoreline. 64
Figure 4.3. Transect of absorption due to CDOM at 320 an (ag 320). 66 Figure 4.4. Ed6m 320 was significantly lower at intact shoreline-
associated reefs compared to developed shoreline- associated reefs (p < 0.05). 67
Figure 4.5. Relative contribution of ag to at in the UV at
305, 320, 330, 380. 68 Figure 4.6. ag 320 at intact shoreline – associated reefs (n = 10) compared to developed shoreline – associated reefs (n = 10). 69 Figure 4.7. Absorption due to CDOM at 330 nm (ag 330) and the attenuation coefficient of downwelling irradiance at 330 nm, Kd 330. 70 Figure 4.8a. Ed6m/Ed0 for 305, 330, and 380 nm for inshore versus offshore reefs sampled 2004 – 2007 (in = inshore, off = offshore). 72 Figure 4.8b. Ed6m/Ed0 for PAR for inshore versus offshore reefs sampled 2004 – 2007 (in = inshore, off = offshore). 72 Figure 4.9 Spectral slope, S, (280 – 312 nm) for the Upper, Middle, and Lower Keys, inshore versus offshore sites. 74 Figure 4.10 The number of occurrences of different combinations of scaled % stony coral cover and

viii
ag 320. 76 Figure 4.11 Percent stony coral cover versus ag 320 for the CREMP sites sampled in 2006 and 2007. 77 Figure 4.12 Relative expression of MAAs declined with increasing ag 320 for intact and developed reefs in 2004 – 2005. 78 Figure 5.1. Absorption spectra for several different MAAAs 83 Figure 5.2. Relative MAA expression is calculated from the spectral absorption due to phytoplankton, aphi or φ. 83 Figure 5.3. Relative MAA expression versus [chl] for all dates sampled from 2004 - 2007 where data for both relative MAA expression and [chl] were available. 86
Figure 5.4. Relative MAA expression versus ag 320 for all sites sampled in 2004 through 2007 where data for both ag 320 and relative MAA expression were available. 87 Figure 5.5 Relative MAA expression for surface samples compared to bottom samples. 88 Figure 5.6 Relative MAA expression comparing surface and bottom samples at inshore versus offshore reefs. 89 Figure 5.7 Relative MAA expression of intact shoreline – associated reefs compared to developed shoreline – associated reefs. 90 Figure 5.8 Relative MAA expression by region, Lower, Middle, and Upper Keys. 91 Figure 5.9 ag 330 at only the surface for the Florida Keys by region, Lower, Middle and Upper Keys. 93 Figure 5.10 ag 330 at the bottom and surface for the Florida Keys by region, Lower, Middle and Upper Keys. 94 Figure 5.11 [chl] by region in the Lower, Middle, and Upper Keys. 97
Figure 6.1. Radiance (L) on a point in a surface, from a given
direction, is the radiant flux in the specified direction per unit solid angle per unit projected area

ix
of the surface (after Kirk 1994). 103 Figure 6.2. Comparison of µd for Algae and KL6m Reef surface and bottom at 305, 320, 330 and 380 nm. 108 Figure 6.3. Although modeled Ed at the surface was not very different at Algae Reef compared to KL6m, due to lower ag and lower µd at the bottom, Ed at the bottom was approximately an order of magnitude higher at KL6m compared to Algae Reef (see Table 6.3). 110 Figure 6.4. ag 330 at Algae and KL6m Reefs, surface and bottom, for all sampling dates from 2004 – 2007. 111 Figure 6.5. Depiction of the pathways of irradiance under clear and
cloudy skies, and in the oceans. 113 Figure 6.6. Spectral surface irradiance just below the sea surface
(after spectral surface reflectance) for clear skies and cloudy skies. 114

x
Can Colored Dissolved Organic Material Protect Coral Reefs by Reducing Exposure to Ultraviolet Radiation
Lore Michele Ayoub
Abstract
Although mass coral bleaching events are generally triggered by high seawater
temperatures, experiments have demonstrated that corals and reef-dwelling foraminifers
bleach more readily when exposed to high energy, short wavelength solar radiation (blue,
violet and ultraviolet [UVR]: λ ~ 280 - 490 nm). In seawater, colored dissolved organic
matter (CDOM), also called gelbstoff, preferentially absorbs these shorter wavelengths,
which consequently bleach and degrade the CDOM. Alteration of watersheds and
destruction of coastal wetlands have reduced natural sources of CDOM to reefal waters.
I tested the null hypothesis that CDOM does not differ between reefs that differ in
coral health, and that water transparency to UVR is not a factor in reef health. I measured
absorption of UVR and UV irradiance at various reefs in the Florida Keys that differ in
distance from shore and degree of anthropogenic development of the adjacent shoreline.
My results show that intact shoreline - associated reefs and inshore reefs tend to be
exposed to lower intensities of UVR, and lower degrees of photic stress, than developed
shoreline - associated reefs and offshore reefs. Absorption due to CDOM (ag320) was
higher, and photic stress, as revealed by increased production of UV-absorbing
compounds, Mycosporine – like Amino Acids (MAAs), was lower at the surface
compared to the bottom.

xi
The following results support my conclusion: ag320 and UV attenuation
coefficients (Kd ‘s) were higher at intact compared to developed shoreline – associated
reefs, and at inshore compared to offshore reefs. Spectral slope, S, was higher at offshore
compared to inshore reefs, indicating a higher degree of photobleaching of CDOM.
Relative expression of MAAs was higher at developed compared to intact shoreline –
associated reefs, at offshore reefs compared to inshore reefs, and at the surface compared
to the bottom. Solar energy reaching the benthos at two inshore reefs of the same depth
(6m) was approximately an order of magnitude higher at the reef near developed
shoreline compared to the reef near intact shoreline, and may be due to greater degree of
diffuseness of the underwater light field combined with lower ag at the developed
shoreline - associated reef.

1
1. Introduction
In the last three decades of the 20th century, scientists, reef managers and the
public witnessed the decline of coral reefs, first locally, then over entire reef tracts and
regions. By the late 1990s, most scientists recognized that reef decline was worldwide
(e.g., Dight and Scherl 1997, Eakin et al. 1997, Risk 1999). Bryant and others (1998)
estimated that more than half of the world's coral reefs were threatened by human
activities such as sewage and industrial pollution, deforestation, and overfishing. Their
report was released as the 1997-98 ENSO event triggered coral mass bleaching events
unprecedented in global scale and intensity (e.g., Hoegh-Guldberg 1999, Wilkinson
2002). Subsequent prognoses on the condition of reefs have not been encouraging (e.g.,
Buddemeier 2001, Birkeland 2004, Hoegh-Guldberg et al. 2007, Baker et al. 2008). For
example, a decline in species richness for all habitat types from 1996 to 2001 and a
general decline in stony coral cover from 1996 to 2003 have been observed in the Florida
Keys National Marine Sanctuary (Somerfield et al. 2008). As a consequence, scientists
and reef managers are increasingly seeking to determine what factors can enhance
resiliency of reef communities (e.g., Nystrom et al. 2000, Knowlton 2001, McClanahan
et al. 2002).
The relationship between coral mass-bleaching events and elevated sea-surface
temperature (SST) is well established (Goreau and Hayes 1994, Brown 1997, Hoegh-
Guldberg 1999). In addition, corals do not bleach in the absence of light (e.g., Lesser and
2
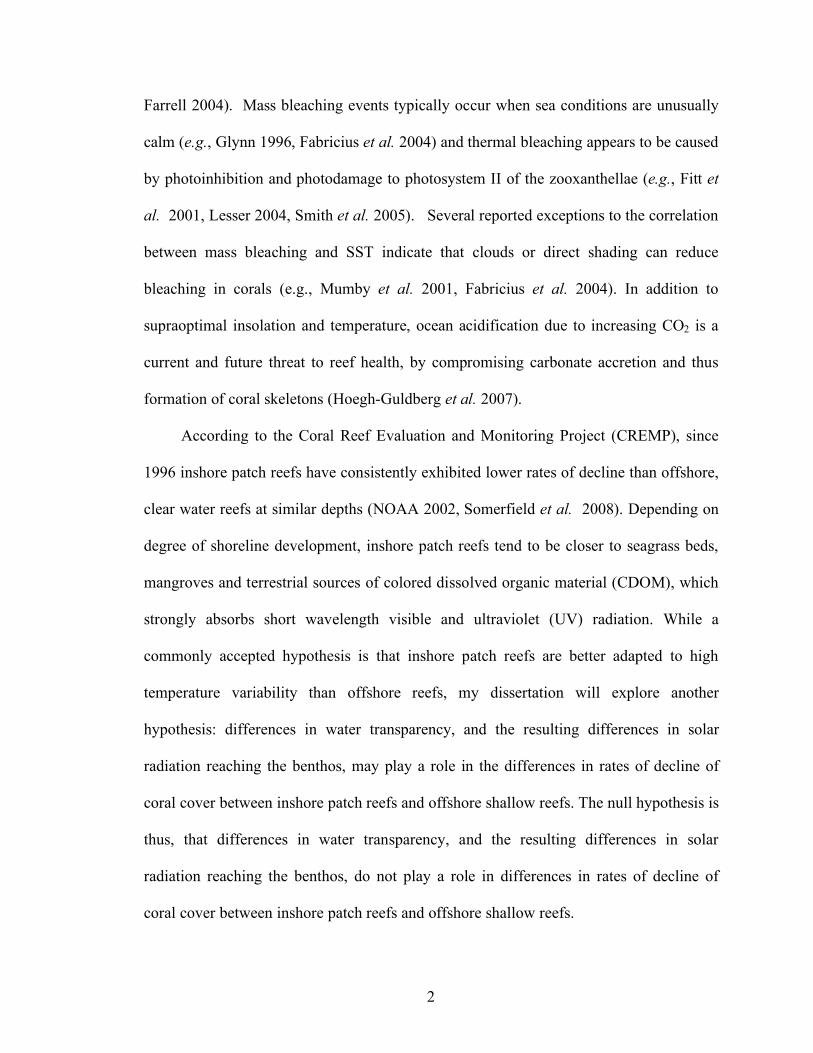
Farrell 2004). Mass bleaching events typically occur when sea conditions are unusually
calm (e.g., Glynn 1996, Fabricius et al. 2004) and thermal bleaching appears to be caused
by photoinhibition and photodamage to photosystem II of the zooxanthellae (e.g., Fitt et
al. 2001, Lesser 2004, Smith et al. 2005). Several reported exceptions to the correlation
between mass bleaching and SST indicate that clouds or direct shading can reduce
bleaching in corals (e.g., Mumby et al. 2001, Fabricius et al. 2004). In addition to
supraoptimal insolation and temperature, ocean acidification due to increasing CO2 is a
current and future threat to reef health, by compromising carbonate accretion and thus
formation of coral skeletons (Hoegh-Guldberg et al. 2007).
According to the Coral Reef Evaluation and Monitoring Project (CREMP), since
1996 inshore patch reefs have consistently exhibited lower rates of decline than offshore,
clear water reefs at similar depths (NOAA 2002, Somerfield et al. 2008). Depending on
degree of shoreline development, inshore patch reefs tend to be closer to seagrass beds,
mangroves and terrestrial sources of colored dissolved organic material (CDOM), which
strongly absorbs short wavelength visible and ultraviolet (UV) radiation. While a
commonly accepted hypothesis is that inshore patch reefs are better adapted to high
temperature variability than offshore reefs, my dissertation will explore another
hypothesis: differences in water transparency, and the resulting differences in solar
radiation reaching the benthos, may play a role in the differences in rates of decline of
coral cover between inshore patch reefs and offshore shallow reefs. The null hypothesis is
thus, that differences in water transparency, and the resulting differences in solar
radiation reaching the benthos, do not play a role in differences in rates of decline of
coral cover between inshore patch reefs and offshore shallow reefs.

3
The UV-absorbing capacity of CDOM can potentially protect inshore patch reefs
from photooxidative stress. As an illustration, absorption due to CDOM decreases going
from mangroves to inshore and offshore reefs and is lowest in offshore, open ocean blue
water (Figure 1.1). The decrease in absorption results in increased
Figure 1.1. Absorption due to CDOM (also known as gelbstoff) (ag) is high in mangrove canals and progressively decreases with distance offshore. Markers: offshore blue water sites (circles), reef sites (diamonds), and sites within mangrove canals (squares).
transparency to short wavelength, high energy blue and UV solar radiation at offshore
sites relative to inshore sites.
To examine my hypothesis, samples of whole water were collected from the
surface (approximately 0.5 to 1 m) and from the depth of coral growth, and downwelling
cosine irradiance profiles of in situ ultraviolet radiation (UVR) and photosynthetically

4
active radiation (PAR), were measured at various locations along the Florida reef tract.
To address my hypothesis (see above), I measured irradiance and absorption due to
CDOM at reefs varying in proximity to shoreline (inshore and offshore reefs) and
compared these results to inshore - offshore site differences in percent coral cover and
rates of decline in coral cover. I compared in situ light (irradiance) measurements and
CDOM absorption and at reefs that differ in type of shoreline (intact and developed). I
also measured absorption due to particulates, and chlorophyll concentration ([chl]). The
attenuation coefficient (Kd), was calculated from in situ irradiance or total absorption (the
sum of absorption due to CDOM, particulates, and pure water). Because Kd is not
affected by the time of day, i.e., the sun angle, this coefficient is a convenient quantitative
expression for comparing water transparency and thus penetrability of UVR and PAR
among sites.
Mycosporine-like amino acids (MAAs) are UV-absorbing compounds found in
photosynthetic organisms. Because they are induced by supraoptimal exposure to UV and
visible radiation, MAAs can be used as an indicator of photooxidative stress. I used
relative MAA expression to compare MAA production by phytoplankton in the water
column among sites.
Considering the angular structure or diffuseness of the underwater light
field, greater diffuseness results in increased scattering, and thus increased likelihood of
an object being irradiated (Kirk 1994). I used a radiative transfer model, Hydrolight©, to
compare the diffuseness of the underwater light field between intact and developed
shoreline - associated reefs.
5
Chapter 2. Background: aspects of in-water optics
2.1. Electromagnetic radiation and the solar spectrum
In this chapter, I shall introduce essential concepts and definitions relating to my
study of water transparency and solar radiation in reef environments. For a more
complete discussion, see Kirk (1994).
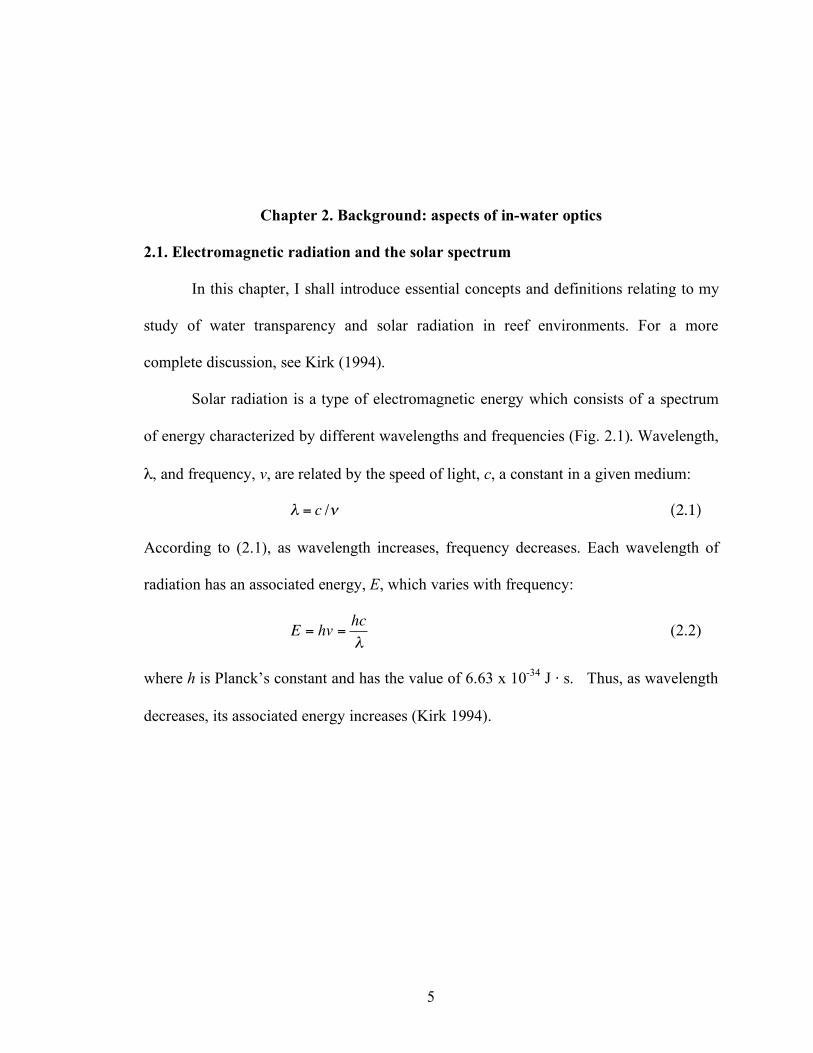
Solar radiation is a type of electromagnetic energy which consists of a spectrum
of energy characterized by different wavelengths and frequencies (Fig. 2.1). Wavelength,
λ, and frequency, v, are related by the speed of light, c, a constant in a given medium:
" = c /# (2.1)
According to (2.1), as wavelength increases, frequency decreases. Each wavelength of
radiation has an associated energy, E, which varies with frequency:
E = hv =hc
" (2.2)
where h is Planck’s constant and has the value of 6.63 x 10⁻³⁴ J ⋅ s. Thus, as wavelength
decreases, its associated energy increases (Kirk 1994).

6
Figure 2.1. Spectra of nonionizing solar radiation (A) and ultraviolet radiation (B) showing main radiation bands, their nomenclature, and approximate wavelength limits. Other synonyms: UV-A, black light; UV-B, sunburn or erythemal radiation; UV-C, germicidal radiation (from Acra et al. 1990, compiled from WHO 1979, Parmeggiani 1983, and Harvey et al. 1984).
Nonionizing solar radiation can be categorized into visible and invisible radiation
(Fig. 2.1). While some organisms, including coral, have the ability to capture UVR and
fluoresce it to wavelengths useable in photosynthesis (Kawaguti 1969, Schlichter et al.
1986), solar radiation in the visible range (400 – 700 nm), commonly referred to as
Photosynthetically Available Radiation (PAR), is the major source of energy for
photosynthesis. Ultraviolet radiation (UVR, 100 – 400 nm) occurs at wavelengths shorter
than visible light, therefore the energy in a photon of UVR is higher than in a photon of
visible radiation. Ultraviolet radiation is energetically differentiated into four categories:
Vacuum UV (100 – 200 nm), UV-C (200 – 280 nm), UV-B (280 – 320 nm, or 315 nm,
depending on source), and UV-A (315 or 320 – 400 nm) (Acra et al. 1990, Kirk 1994).

7
At the other end of the spectrum, infrared radiation (700 – 1400 nm), which is
experienced as heat, occurs at wavelengths longer than visible light.
2.2. Atmosphere – UV interactions
The components of the atmosphere that most strongly absorb UVR are sulfur
dioxide (SO2) and ozone (O3) (Roscoe 2001). UV-C does not reach the earth in
appreciable intensities due to effective absorption by stratospheric ozone (Figs. 2.2, 2.3).
UV-B is less effectively absorbed by ozone, and thus does reach the Earth’s surface in
amounts inversely proportional to stratospheric ozone concentration (Acra et al. 1990).
Methyl halide aerosols, such as anthropogenic methyl bromide and chlorofluorocarbons,
in the presence of sunlight, can break down stratospheric ozone. At the same time as it
absorbs UV, sulfur dioxide promotes the formation of more reactive chlorofluorocarbons
which are more effective at breaking down ozone, and thus indirectly result in increased
UVR reaching the Earth’s surface. The rate of ozone depletion is affected by temperature,
circulation and cloud albedo (Figs. 2.2, 2.3). Explosive volcanism contributes to
atmospheric [SO2] and therefore can cause increases in UVR reaching the Earth’s surface
(Roscoe 2001).

8
Figure 2.2. Interactions between ozone depletion and climate change. The arrows indicate direction of influence. The effects of climate change on ozone and UVR are discussed in the text (adapted from Clark 2001 in UNEP 2003).
9
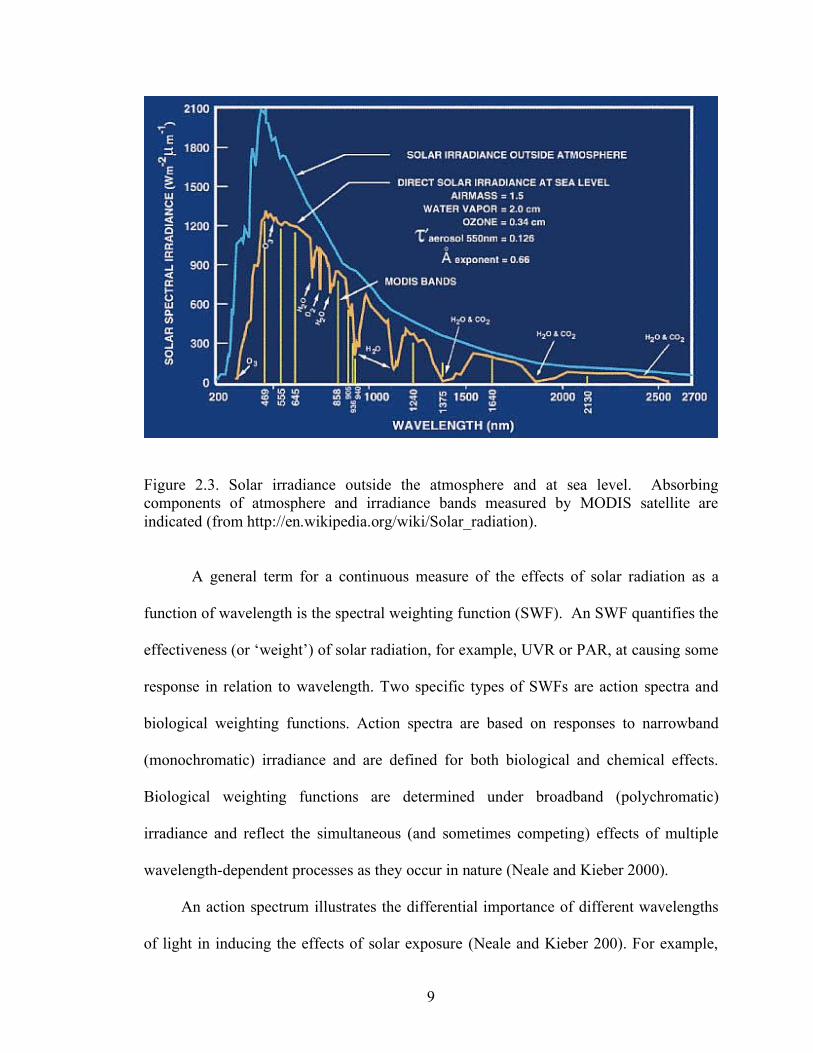
Figure 2.3. Solar irradiance outside the atmosphere and at sea level. Absorbing components of atmosphere and irradiance bands measured by MODIS satellite are indicated (from http://en.wikipedia.org/wiki/Solar_radiation).
A general term for a continuous measure of the effects of solar radiation as a
function of wavelength is the spectral weighting function (SWF). An SWF quantifies the
effectiveness (or ‘weight’) of solar radiation, for example, UVR or PAR, at causing some
response in relation to wavelength. Two specific types of SWFs are action spectra and
biological weighting functions. Action spectra are based on responses to narrowband
(monochromatic) irradiance and are defined for both biological and chemical effects.
Biological weighting functions are determined under broadband (polychromatic)
irradiance and reflect the simultaneous (and sometimes competing) effects of multiple
wavelength-dependent processes as they occur in nature (Neale and Kieber 2000).
An action spectrum illustrates the differential importance of different wavelengths
of light in inducing the effects of solar exposure (Neale and Kieber 200). For example,

10
effectiveness at producing erythemal (skin) and DNA damage (Fig. 2.4) and
photoinhibition of photosynthesis in Arctic phytoplankton increase exponentially with
decreasing wavelength in the UV range (Cullen and Neale 1997). The same effect has
been found for corals. Lesser (2000) examined action spectra for the effect of UV on
photosynthesis at different depths in the coral Montastrea faveolata, finding a steep and
rapid decrease with increasing wavelength. Action spectra and biological weighting
functions are used to determine biological amplification factors and have been used to
assess the environmental impacts of increased surface UV irradiances resulting from
stratospheric ozone depletion (Micheletti et al. 2003).
Figure 2.4. Example of an action spectrum for erythemal and DNA damage (http://www.temis.nl/uvradiation/info/uvaction.html). Changes in UVB reaching the Earth’s surface due to changes in stratospheric ozone
can be expressed in terms of a radiation amplification factor (RAF) (Rundel and

11
Nachtwey 1978, Rundel 1983, Smith and Cullen 1995). Since the relationship between
UVB dose and ozone concentration is nonlinear, the RAF can be most generally
expressed using an equation relating the change in biological effective irradiance, or dose
rate, ΕBe(λ), to the change in total atmospheric column ozone concentration or ozone
thickness, ω (Madronich and Granier 1992, Madronich 1993, Booth and Madronich
1994):
RAF =
("EBe(#))2
(EBe(#))1
$
% &
'
( ) /"*
2
*1
+
, -
.
/ 0 (2.3)
Congruently, the effect of changes in ozone on UV exposures can be expressed as:
RAF =
(UV("))2
(UV("))1
#
$ %
&
' ( /)*
2
*1
+
, -
.
/ 0 (2.4)
Radiation amplification factors can in turn be used to calculate the increase of
biologically effective irradiance in response to ozone depletion. Published values of
RAFs for different processes have been reviewed by Madronich et al. (1998).
As another example, the percent change in absorption due to CDOM, ag, can be
related to the proportional change in ΕBe(λ) by a biological amplification factor, B (Smith
and Cullen 1995):
B =
"agag
#
$ %
&
' (
"EBe())
EBe())
#
$ %
&
' (
(2.5)
Combining these two factors, the percent change in ozone can be related to the biological
effect by the total amplification factor, A:
A = RAF x B (2.6)

12
The total amplification factor can be used to describe the effect of ozone depletion
on a biological or chemical process such as photosynthesis. For example, Lesser (2000)
determined that RAFs for the effect of UV (290 – 400 nm) exposure on photosynthesis in
the coral Montastrea faveolata varied from 0.15 to 0.23, while earlier estimates of RAFs for
DNA damage and for the inhibition of photosynthesis in free-living phytoplankton are
much higher (-2.0 and -0.5 to 0.95, respectively) (Madronich 1993).
Compared to those mentioned above, modeled RAFs for the effects of changing
CDOM concentrations based on in situ CDOM and UV data specifically from the Florida
Keys are much higher: at 6.0 m, RAFs were 1.65 for photosynthesis inhibition and 3.26 for
DNA damage (Zepp et al. 2008). Accordingly, a 30% increase in UV transparency (as
expressed by a 30% decrease in the diffuse attenuation coefficient for UV, KdUV, (see
section 3.2.3.) can result in an 85% increase in photoinhibition and over 200% increase in
DNA damage (Zepp et al. 2008). The RAFs were lower at shallower depths: at 3 m, 30%
decrease in KdUV can result in a 30% increase in UV-induced photosynthesis inhibition and
a nearly 100% increase in DNA damage (Zepp et al. 2008). Zepp et al. (2008) estimated
that DNA damage decreases much more rapidly with depth than does photosynthesis
inhibition due to the spectral dependence of UV dose rates on these effects. Based on
CDOM photobleaching experiments for a water sample from the Florida Keys, Looe
Key, absorption can decrease 7% per day (Zepp 2003).
Osburn et al. (2001) determined spectral weighting functions for the
photobleaching of CDOM in lakes. Based on their model, a 25% increase in UVB
radiation results in an 8% increase in photobleaching of CDOM. Generally,
photobleaching increases with decreasing wavelength: the largest absolute loss of
absorbance occurs at the shortest wavelengths (Kieber et al. 2007). Additionally, history of
exposure affects photobleaching efficiency: with increasing exposure, the wavelength of

13
maximum photobleaching may shift to lower wavelengths (Osburn et al. 2001, Akella and
Uher 2006). Del Vecchio and Blough (2002) found that while the largest losses of
absorption are observed at the irradiation wavelength, monochromatic irradiation (irradiation
with one wavelength) results in absorption loss across the entire spectrum.
2.3. Annual cycle of UVR
The annual cycle of UVR in the Lower Keys is characterized by maxima from
May to August and minima from December to January (Fig. 2.5). Comparing equatorial
regions to other geographic locations, as latitude decreases, UVA exposure increases and
more nearly approximates that seen at the equator (Acra et al. 1990). In the northern
hemisphere, for all UVR wavelengths from 285 to 340 nm, the solar UVR flux decreases as
latitude increases for all times of year except the June solstice, when the relative
irradiance is lowest at the equator (Acra et al. 1990).

14
Figure 2.5. Mean daily UV-B and UVR at the Mote Marine Laboratory in the Lower Keys (latitude 24.5oN, longitude 81.6oW) during 2002 - 2003. The data were measured by Yankee Environmental Systems UVB and UVA pyranometers at one-minute intervals (from Zepp 2003).
This latitude - UV relationship is relevant for the Florida Keys, which lie at
approximately 25° latitude: the highest measured UV irradiance in the subtropical
latitudes of the Keys occurs between May and August (Fig. 2.5). Maximum insolation,
without the influence of the atmosphere, occurs from May to August at the latitude of the
Florida Keys (Figure 2.8 in Kirk 1994; Figure 2.5). Because of the relatively high UV
irradiance at this time of year, we would expect the highest deleterious response to
irradiance, such as bleaching, from May though August. Consequently, this is the optimal
time of year to record the most acute stress associated with solar irradiance.

15
2.4. UVR – environment interactions
In nature, solar radiation is scattered and reflected as well as absorbed by
particulate and dissolved material. The wavelength dependence of scattering in air,
Rayleigh scattering, is 1/λ4. Due to the higher refractive index of water, the wavelength
dependence of Rayleigh scattering in water deviates from the in air value, to 1/λ4.32.
Thus, shorter wavelengths, such as UVR, are more highly scattered compared to longer
wavelengths such as visible light, resulting in increased UV irradiance relative to PAR
(Kirk 1994).
Incident spectral irradiance typically reaches its highest intensity at 480 nm (Figs.
2.3 and 2.6). Although intensity decreases at lower wavelengths, the higher energy
associated with UVR results in higher efficiency in altering the biological, chemical and
physical environment (see Fig. 2.4).
Figure 2.6a. Incident spectral irradiance (on land) measured with a LiCOR-1800 spectroradiometer at 10-minute intervals on May 25, 2005 at NURC, Key Largo, FL.

16
Figure 2.6b. Median incident spectral irradiance (above water) on May 25, 2004 (15:50 to 16:10) and on July 6, 2004 (16:00), on land (Keys Marine Lab or NURC, Key Largo, FL).
Irradiance intensity at any wavelength is determined by the absorbing and
scattering properties of the water column. In highly transparent, relatively shallow waters,
the reflective properties of the bottom can influence irradiance intensity in the overlying
water column. The light-absorbing and -scattering constituents of the water column can
be categorized as dissolved material, particulate material, and water molecules. The most
significant optically active components include phytoplankton, mineral particles and
detritus, and CDOM (Kirk 1994). While pigment-containing particles, and to a lesser
extent, detrital particles, can contribute to UVR absorption (Ayoub et al. 1997, Vincent et
al. 2001, Belzile and Vincent 2002, Frenette et al. 2003, Zepp 2003), CDOM is the
predominant and most consistent attenuator of UVR in most oceanic waters (Kirk 1994,

17
Nelson et al. 1998, Siegel et al. 2002), including reefal waters in the Florida Keys (Zepp
et al. 2008).
Figure 2.7 illustrates absorption and incident downwelling irradiance spectra for a
coral reef site in the Florida Keys in May 2004. As mentioned above, these data illustrate
that particulate matter can play a significant role in UVR attenuation, with absorption
increasing at decreasing wavelengths. These data also show that, even in relatively clear
reefal waters, CDOM is typically the major attenuator of UVR. Pure water absorbs
minimally in the visible wavelengths to 580 nm, but absorbs increasingly strongly in the
red to infrared range (Fig. 2.7 and Kirk 1994). In studies at an offshore reef, Conch Reef
(30 m), in the Florida Keys, Lesser (2000) found that UVR down to 310 nm penetrates
significantly to the depth of coral growth. Thus CDOM can play a vital role in protecting
reefs from UVR.

18
Figure 2.7. Incident irradiance (Ed0, 350 – 700 nm) and spectral absorption due to CDOM (ag), particulate material (ap) and pure water (aw) for Key Largo 6m (KL6m) Reef in May 2004. Note shoulder in the UVR range of ag indicative of dissolved MAAs.
2.5. CDOM composition
Here, I present some essential topics relating the importance of CDOM and ocean
color to water transparency. More detailed reviews of ocean color and CDOM can be
found in Del Castillo (2005) and Coble (2007), from which much of the following is
summarized.
Though the chemical composition, origin and dynamics of CDOM in aquatic
systems are still poorly understood due to their complexity (Coble 2007), CDOM is

19
defined operationally by the method used to separate suspended and dissolved material.
Typically the most common methods are filtration through glass fiber filters (fine, pore
size 0.7 µm) and polycarbonate or polysulfone membranes (0.2 µm pore size). Dissolved
organic matter in seawater is composed of countless organic compounds, the majority of
which are classified as humic substances, due to their original discovery and study in soil
chemistry. Humic substances are typically divided into humic and fulvic acids, which
have been separated based on their different solubilities (McKnight and Aiken 1998) or
molecular weights (Osburn and Morris 2003), though the chemical differences separating
humic and fulvic acids are not clear cut.
There are four pathways associated with the formation of fulvic and humic acids:
1) decomposition products of modified lignins, , 2) microbially decomposed lignin
products, 3) phenols and other plant biochemicals, and 4) polymerization products of
sugars, amino acids, and other small particles (Fig. 2.8). In any given terrestrial
ecosystem, all four pathways may occur, but not to the same extent or in the same order
of importance. Lignin pathways predominate in poorly drained soils and wet sediments
(swamps, etc.) (Waksman 1932). Production from lignins can occur via microbial
decomposition of lignin by aerobic pathways to directly produce humic acids (Stevenson
1982). Synthesis from lignins via polyphenols may be of considerable importance in
certain forest soils. Fluctuations in temperature, moisture and irradiation in terrestrial
surface soils under a harsh continental climate may favor humus synthesis by sugar-
amine condensation (J. Weber in http://www.ar.wroc.pl/~weber/powstaw2.htm#1).

20
Figure 2.8. Pathways for the formation of humic substances (from J. Weber in http://www.ar.wroc.pl/~weber/powstaw2.htm#1).
Nonhumic pigment-like components of marine CDOM, such as amino acid or
protein-like substances, may be an indicator of elevated biological activity (Coble et al.
1998). These proteins and pigments may be truly dissolved or result from disruption of
phytoplankton cells during sample preparation (filtration) (Coble 2007).
2.6. CDOM optical properties
The photochemical properties of CDOM can be ascribed to compositional makeup.
Marine and terrestrial humics differ in the amounts of aliphatic and aromatic groups, and
these differences explain the differences in their optical properties. Marine humics are
less aromatic, have lower C/N ratios, and contain more carboxylic groups and sugars than

21
do terrestrial humics (Coble 2007). Both terrestrial and marine CDOM have absorbance
spectra that increase exponentially toward shorter wavelengths, with no discernible peaks.
This lack of features fits the explanation that CDOM is a complex mixture of compounds
that have overlapping absorption spectra, with no single compound dominating (Coble
2007). The smoothness of the absorption spectrum at wavelengths greater than 350 nm may
also result from intramolecular electronic interactions (Del Vecchio and Blough 2004b).
Terrestrial CDOM is more highly aromatic and molecularly complex than marine
CDOM, resulting in higher absorption and “red-shifted” fluorescence upon analysis of
excitation - emission spectra (“EEMS”, Del Castillo 2005). In addition, most studies have
found that the spectral slope is lower for higher molecular weight (“fresher”) terrestrial
CDOM than for marine CDOM (Del Vecchio and Blough 2004a).
2.7. CDOM sources, sinks and pathways
Sources of CDOM to coral reefs include decomposed terrestrial and wetland plants,
including mangroves, as well as exudates from bacteria, phytoplankton, seagrasses and
coral (Fig. 2.9) (Anderson et al. 2001, Stabenau et al. 2004). Intact shorelines with
coastal mangrove hammocks are a vital source of CDOM to fringing and other nearshore
coral reefs. Comparing coral reefs with differing predominance of seagrass, Boss and
Zaneveld (2003) reported that CDOM absorption of UV and PAR is higher in pore waters
of coral reefs characterized by higher densities of seagrass: grass-covered sediment are
found to be sources of what these authors refer to as CDM (Colored Dissolved Material =
CDOM + nonalgal particles) to the water column. Seagrass roots promote the production
of CDOM via oxidation of sediment POC, by injecting photosynthetically – derived O2 into
the sediments (Burdige et al. 2004).

22
Figure 2.9. Flow chart illustrating sources, sinks and pathways of Colored Dissolved Organic Matter (CDOM) to the Florida reef tract (after Zepp 2003 and Morris and Hargreaves 1997).
As UVR is absorbed by CDOM, the CDOM is broken down, or photobleached,
producing less absorptive forms of CDOM (Morris and Hargreaves 1997, Vodacek et al.
1997, Nelson et al. 1998). In times of drought, photobleaching can be pronounced
because runoff decreases, reducing CDOM supplies. In addition, calm weather increases
stratification of the water column, resulting in increased UV exposure: exponential
degradation of CDOM will occur and UV transparency will increase (Morris and
Hargreaves 1997). The resultant smaller, more labile photoproducts of CDOM are
available for bacterial degradation, allowing more UVR to pass through the water column

23
(Miller and Moran 1997). At some point, CDOM can no longer be broken down and
becomes recalcitrant (Aluwihare et al. 2005). While the cycle of CDOM photobleaching
and increased UV transparency may continue, consistent sources of CDOM can disrupt
this positive feedback loop: mangrove hammocks and seagrasses can provide regular
pulses of CDOM to reef waters (Moran et al. 1991) with each tidal cycle. Also relevant to
coral reefs is the interaction of tidal cycles and CDOM sources offshore from reefs:
CDOM rich plumes from the Bahama Banks may sink to depth after cooling and
subsequently be brought onshore via tidal cyles, and thus potentially protect benthic
organisms from UVR (Otis et al. 2004).
CDOM is an important component of the trophic pathways of plankton
communities, including the microbial loop (Fig. 2.10). CDOM is consumed by bacteria,
at the same time zooplankton and phytoplankton excrete CDOM as waste or exudate
(Steinberg et al. 2004). Bacteria play a dual role in the cycling of CDOM. Bacteria act as
a sink by remineralizing CDOM, and as a source by exuding CDOM metabolically and
breaking down plant material (Nelson et al. 2004). While bacteria consume as well as
produce CDOM, they are in turn consumed by zooplankton (Wotton and Wotton 1994).
In open ocean areas not influenced by highly colored, coastal sources of CDOM such as
rivers and mangroves, exudates of phytoplankton and zooplankton are an important
source of CDOM (Nelson et al. 2004, Steinberg et al. 2004).

24
Figure 2.10. Diagrammatic representation of the two trophic pathways in plankton communities (after Wotton and Wotton 1994 based on Pomeroy and Wiebe 1988).
Especially for coastal ecosystems, rivers are major sources of terrestrial CDOM.
In Chapter 3, I will discuss riverine inputs of CDOM specifically for the Florida Keys.
Land use can have a consequential influence on CDOM delivery to coastal
waters. Water quality studies of storm waters in South Florida have shown that wetlands
and pastures exhibited highest color (235 and 227 Pt-Co units) subsequent to residual
runoff (173 Pt-Co units), while runoff from citrus, row crops, urban, and golf course
areas were appreciably lower (Graves et al. 2004). This difference was attributed to more
rapid runoff at the sites characterized by lower CDOM because grasses at these sites are
more heavily managed and limit both production and leaching of CDOM sources such as
humic and tannic acids. Thus, reduction of sources of CDOM can occur not only by

25
replacing mangroves and coastal hammocks with buildings, but also by replacing
wetlands or forests with sod and other managed vegetation. Extensive development in the
Florida Keys has displaced natural vegetation and thus decreased CDOM runoff to
coastal waters.
2.8. Remote sensing of UVR and coral reefs: application of the spectral slope of ag
Up to now, the application of satellite algorithms for estimating UV irradiance has
relied upon measurements made for PAR. In situ sea-truthing of coral reefs is needed to
formulate algorithms for estimating UVR in oceans. Coastal areas such as coral reefs
possess an additional challenge of being located in shallow waters where bottom
reflectance and terrigenous inputs can complicate satellite-derived estimates of
irradiance. As previously mentioned, absorption due to CDOM, ag, increases
exponentially as wavelength decreases, beginning at approximately 490 nm. The spectral
slope of ag in the UV range, and the relationship between UVR and PAR, can be
elucidated by sea-truthing of ag, which would enable improved estimation of UV
irradiance at greater spatial scales.
Absorption at any wavelength can be derived from spectral shape or slope scaled
from absorption derived from remotely sensed ag. Twardowski et al. (2004) have
evaluated the application and interpretation of a single exponential model describing ag as
a function of wavelength, using 412 nm as the reference wavelength, a wavelength
retrieved by satellites:
ag (") = ag (412)"
412
#
$ %
&
' (
)6 92
(2.7)

26
In general, the spectral slope, S, is used to estimate ag at one wavelength, λ, from
another, satellite-derived wavelength (λ0) using a nonlinear fit of the form:
ag "( ) = ag ("0)eS("0#") (2.8)
(Blough and Del Vecchio 2002).
The traditional usage of S is in the visible light range. Algorithms for
differentiating between terrestrially- and marine-derived organic matter have been
determined (Stedmon and Markager 2001). The spectral slope of ag has been shown to
vary depending on location (Carder et al. 1989, Vodacek et al. 1997, Nelson et al. 1998,
Twardowski et al. 2004). The estimates by Carder et al. (1989) of S for the Gulf of
Mexico are 0.0141 nm-1. Lee et al. (1999) reported a spectral slope of 0.01433 nm-1 for
the range 400 -500 nm in Florida Keys waters based on a model estimating ag from
remote sensing reflectance. The spectral slope for UVR is expected to be much higher
than for the 400 – 500 nm range (see Fig. 2.7, ag). Kopelevich et al. (1989) estimated the
spectral slope for the region 280 – 490 nm in the open ocean to be 0.017 ± 0.001 nm-1.
Because spectral slope increases in surface waters in summer due to increasing
photobleaching (Nelson et al. 1998; Del Vecchio and Blough 2002), it can be used to
compare the degree of photobleaching between water bodies. While CDOM production
by phytoplankton and zooplankton can be especially important in offshore, clear surface
waters and the open ocean, advection and bleaching can balance net production (Nelson
et al. 2004, Steinberg et al. 2004). For example, waters with no significant bacterial
production of CDOM and high transparency typically have higher spectral slopes than
more highly colored waters with fresh or consistent sources of CDOM (Blough and Del
Vecchio 2002).

27
2.9. Photobiology of UVR and effects on aquatic ecosystems
Ultraviolet radiation, including UVA, has been shown to cause stress responses
such as genetic damage to bacteria, phytoplankton and other organisms (Karentz et al.
1994, Huot et al. 2000), decreased growth rate, lethal effects on larvae and adult
organisms (Gleason and Wellington 1995), and photoinhibition in phytoplankton (Smith
and Cullen 1995), as well as bleaching (Lesser 2004, Lesser and Farrel 2004, Vincent and
Neale 2004) (Fig. 2.11). Other effects of UVR include suppressed calcification and
skeletal growth (Roth et al. 1982) and coral bleaching (Glynn 1996, Lesser and Farrell
2004). The increase in DNA damage to bacterioplankton that has resulted from decreases
in stratospheric ozone concentration has been modeled by Huot et al. (2000). Zepp et al.
(2008) estimated that DNA damage decreases much more rapidly with depth than does
inhibition of photosynthesis.
Figure 2.11. Pathways between UV radiation exposure and cellular stress. Damage can occur directly by photochemical degradation of biomolecules (pathway 1 or indirectly via the production of reactive oxygen species such as hydrogen peroxide and superoxide radicals (pathway 2a), which then cause more widespread oxidative damage within the cell (2b). The net stress is manifested in terms of: the increased energy demands of

28
protection and repair; compositional changes (e.g., lipid content), which may affect the nutritional quality of the cells for higher trophic levels; an impairment of growth rate resulting from the photochemical damage and from the increased energy requirements; and, under severe exposures, an increased rate of mortality (from Vincent and Neale in de Mora 2000).
Photooxidation is the conversion of a reduced molecule to an oxidized form in the
presence of molecular oxygen via a set of chemical reactions that are initiated by
photolysis (Glossary of Meteorology 2000). One type of photooxidative damage to the
photoautotrophic symbionts of corals, the zooxanthellae, is known as "bleaching"
(Gleason and Wellington 1993). Coral bleaching is a response to environmental or biotic
stress in which zooxanthellae are expelled or their photosynthetic pigments are lost
(Glynn 1996). One mechanistic explanation is that bleaching is induced by excessive
solar radiation, resulting in photooxidation-induced photoinhibition, that is, decreased
efficiency in the light-harvesting capacity of the photosynthetic apparatus of the
symbionts (Lesser et al. 1990, Jones et al. 1998). Oxidative stress occurs via reactive
oxygen species (ROS), resulting in damage to photosystem II, which in turn leads to
bleaching of zooxanthellae, or zooxanthellae exocytosis (bleaching of coral) (Lesser
2006). ROS formation associated with exposure to elevated temperature and solar
radiation is believed to be an important factor leading to coral bleaching (Lesser 2006).
Thorough reviews of biological effects of UVR on coral reefs have been
published by Shick et al. (1996) and, more recently, by Lesser (2004). These effects
include solar and thermal stress-induced coral bleaching, as well as decreased
photosynthesis and growth in zooxanthellae due to damage to DNA, proteins, and lipids
(Shick et al. 1995). Photoinhibiton of photosynthesis in zooxanthellae can be due to
exposure to elevated temperature alone (Iglesias – Prieto et al. 1992), UVR alone

29
(Lesser and Shick 1989), or temperature and UVR in combination (Lesser 1996, 1997).
Supraoptimal intensities and durations of exposure to visible light, particularly blue light,
also have been shown to induce photoinhibition and loss of photosynthetic symbionts in
corals (Jokiel and York 1982, Fitt and Warner 1995) and benthic Foraminifera (Williams
and Hallock 2004). Stabenau et al. (2006) have shown that increases in UVR intensity on
the coral surface in conjunction with the onset of high sea surface temperatures, due to
stratification and resulting increased photobleaching of CDOM, correlates with decreased
coral photosynthetic efficiency. Exposure to high solar irradiance leads to a lower
bleaching threshold temperature and an overall shorter time to actually ‘‘bleach’’ compared
to corals exposed to lower solar irradiances (Lesser and Farrell 2004).
Production of heat shock proteins (HSPs) in coral host tissue has been observed to
be upregulated in response to thermal stress (Black et al. 1995). Bioindicators of
photooxidative and thermal stress such as MAAs, HSPs, and decrease in photosynthesis,
present parameters for comparing reef health and environmental stressors between reefs
(Fisher 2007). The effects of UVR on gene expression include pyrimidine dimer
formation in DNA, which interferes with DNA replication and transcription, cessation of
cell division, and mutations of essential genes that may cause cell death (Anderson et al.
2001, Moran and Zepp 2000). Sublethal effects include decreased growth and
reproduction, permeability of membranes and transport of molecules into the cell,
disruption of the electron transport chain, inactivation of membrane transport functions,
and RNA damage (Moran and Zepp 2000).
Ultraviolet radiation specifically has been shown to cause DNA damage, DNA
mutations and cell death in marine organisms such as corals (Banaszak and Trench
1995a,b, Shick et al. 1995, Lesser 1996). Although it is generally thought that UVR

30
attenuates quickly, some natural water bodies, especially coral reefs, are characterized by
high transparency to UVR (Gleason and Wellington 1993, Lesser 2004). For example,
the intensities of some higher wavelengths of UVR can approach the intensity of PAR at
depths subsurface to 2m in Kane’ohe Bay, Hawai’i (Gleason and Wellington 1993, Gulko
1995). Other effects of UVR on aquatic biota on the organismal level have been
summarized by Haeder et al. (1998, 2003), Anderson et al. (2001), Vincent and Neale
(2004), Hoogenboom et al. (2006), and many others.
Although UVB has higher energy than UVA and blue light per unit wavelength,
Osburn et al. (2001) reported that UVA and low wavelength PAR are more effective in
photobleaching CDOM because of their greater total energy. On the other hand, Fine et
al. (2002) have shown that UVR (280 – 400 nm) can ultimately shield corals from some
bacterial infections.
While overexposure to both UVR and PAR induces photoinhibition, PAR
intensity must be high enough to support photosynthesis (Yentsch et al. 2002). Thus
there is an optimal depth range where intensity of UVR and PAR are below damaging
levels and intensity of PAR is sufficient for growth and development (Alonso et al.
2004).
2.10. Defenses against UVR: Mycosporine-like amino acids (MAAs)
Mycosporine-like amino acids (MAAs) are UV-absorbing compounds with
maximal absorbance at 310 – 360 nm (Shick et al. 1999). Because MAA production is
induced by exposure to UVR (Dunlap et al. 1986, Banaszak et al. 1998, Lesser 2000),

31
theories on MAA induction are relevant to my study of photobiology, CDOM and coral
reefs.
MAAs can be produced by symbiotic zooxanthellae (Schick et al. 1999) as well
as by phytoplankton (Morrison and Nelson 2004). While exposing corals to UVR can
induce UV-protective mechanisms such as production of MAAs (Shick et al. 1996,
Dunlap and Shick 1998, Morrison and Nelson 2004, Shick 2004), and DNA-repair
enzymes (Banaszak and Lesser 1995, Kuffner et al. 1995, Anderson et al. 2001),
prolonged overexposure to UVR can also reduce photosynthetic rates and simultaneously
reduce MAA production (Lesser and Farrell 2004). In addition, production of MAAs
may decrease with increasing temperature, leaving zooxanthellae more susceptible to
damage caused by exposure to UVR (Lesser et al. 1990). MAAs also may have an
antioxidant activity (Dunlap and Yamamoto 1995, Kim et al. 2001, Suh et al. 2003).
Results from studies monitoring PAR and MAA production have been
ambiguous. While increases in blue wavelengths of PAR can induce production of UV-
absorbing MAAs, since PAR and UVR co-vary, as blue wavelengths of PAR increase,
the concurrent increase in UVR may actually be responsible for MAA induction (Jokiel
et al.1997, Moisan and Mitchell 2001). Other hypotheses propose that photosynthetically
usable energy (PAR) absorbed in excess of the processing capacity of cellular
biochemistry may be passed on to a genetic pathway to induce MAAs (Moisan and
Mitchell 2001), or that disruption of a metabolic pathway may cause MAA accumulation
(Goes et al. 1995).
Other coral defenses against UVR include behavioral defenses or production of
mucus containing MAAs, melanin, fluorescent pigments, antioxidants such as superoxide

32
dismutase (SOD), photoreactivation, and enzymatic photorepair (Shick et al. 1996). See
Chapter 5 for a more detailed discussion of MAAs and their relevance to CDOM and
UVR transparency in the Florida Keys.
2.11. Stratospheric ozone depletion and bleaching
Mass bleaching events in corals have traditionally been attributed to above-
normal water temperature (Atwood et al. 1992, Goreau and Hayes 1994, Glynn 1996,
Lesser 1997). Although estimates of ozone depletion predict stabilization of the ozone
layer for the coming decade, Montza et al (2009) found that the growth (i.e.,
accumulation in the atmosphere) rates for certain CFCs, which destroy ozone, were
approximately two times higher in 2007 than in 2004 due to lack of regulation in
developing countries (Figure 2.12), and that the concentrations of ozone-depleting gases
did not begin to decline until 1998 (Hoffman and Montza 2009).
In addition, the same study (Montza et al. 2009) showed that CFCs emissions
increased in 1998, concurrent with peak bleaching events for coral reefs and large benthic
foraminifers (Amphistegina sp.) (Berkelmans et al. 2004, Hallock 2006a,b).
Amphistegina are particularly sensitive to the shorter (300 - 490 nm) wavelengths of solar
radiation (Williams and Hallock 2004). Thus, the severity of the 1998 peak coral
bleaching event may have been a result of the combined effects of CFC-induced ozone
depletion, allowing more UVR to reach coral reefs, together with supraoptimal
temperatures. From a management perspective, elucidating the roles of UVR and
stratospheric ozone in reef health can support further regulations on CFCs.

33
Figure 2.12. Monthly hemispheric means and growth rates of HCFCs from weighted measurements of surface-air collected in flasks at remote locations (Northern Hemisphere (red) > global mean (green) > Southern Hemisphere (blue)). Tropospheric growth rates are plotted relative to the right hand axis and are derived from 12 month differences in global surface means over the previous 12 months (e.g., Jan 99 – Jan 98; grey plus symbols) or from monthly differences smoothed over annual periods (black line) (from Montzka et al. 2009).

34
2.12. Statement of hypothesis
My study will investigate the distribution of CDOM on coral reefs in the Florida
Keys. The basic idea is that reefs most distal from sources of CDOM experience the
highest intensities of high energy blue and UV wavelengths, reefs with inconsistent
CDOM sources receive variable intensities of the highest energy solar radiation, and reefs
with consistent sources of CDOM experience lowest intensities of highest energy solar
radiation compared to optimal wavelengths for photosynthesis. I further propose that (a)
CDOM-rich reef sites will be characterized by higher coral cover and lower rates of
decline in coral cover than low or highly variable CDOM sites; (b) that relative MAA
expression will be greater on reefs that experience consistently lower and/or more
variable ag; and (c) because absorption decreases diffuseness (see Chapter 6) as well as
increases attenuation in the underwater light field (Kirk 1994, Gregg 2002), that reefs
with lower ag will be characterized by greater exposure to high energy blue and UV
radiation.
Spectral and qualitative differences in photobleaching of CDOM depend on
location (Del Vecchio and Blough 2002). I further suggest that spectral slope from open
ocean (blue water) sites will indicate higher degrees of CDOM photobleaching, i.e.,
higher spectral slopes, due to the higher exposure to low wavelength radiation; coral reefs
will exhibit intermediate degrees of CDOM photobleaching, depending on location,
offshore (higher degree of CDOM photobleaching) or inshore (lower rates of CDOM
photobleaching); and inland waters, which are less transparent than ocean or reef water,
will typically exhibit the lowest degree of CDOM photobleaching. Though spectral slope
has been measured for open-ocean and inland waters, my study is the first to quantify

35
spectral slope for coral reefs.
Mangroves are one of the most significant sources of CDOM to coral reefs (Zepp et
al. 2002, Zepp 2003, Jaffe et al. 2004); they also serve as a physical barrier, protecting
shorelines from the destructive effects of storms, tidal waves and tsunamis (Danielsen et
al. 2005). The results of my study will provide information useful to management on the
importance of protecting and maintaining mangrove shorelines and elucidate the effects
increased UVR and thus, of stratospheric ozone depletion, on coral reefs.

36
3. Introduction to the Florida Keys, Study Sites, and Methodology
3.1. Objectives
The goal of this chapter is to present background information on the study area and
methodology used in subsequent chapters.
3.2. Introduction
3.2.1. Geomorphology and water circulation patterns of the Florida Keys
The general arcuate pattern of the Florida Keys is a consequence of the
bathymetry of the shelf edge and the action of the Florida Current, which controls many
of the environmental parameters (depth, current, and therefore nutrient and light
availability) of this area (Randazzo and Halley 1997). Hawk Channel, an ~10 m deep
topographic depression along the Atlantic side of the Keys, is relatively deeper than the
inner shelf (0 – 3 m) and reef bank (0 – 5 m), and shallower than the seaward shelf break
(30 m) (Lee and Smith 2002) (Fig. 3.1). Hawk Channel transports water from Biscayne
Bay from the north, the Loop Current and Florida Bay from the west, and the Florida
Current from the south and east.
The southwest Florida Shelf and the Atlantic side of the Florida Keys coastal zone
are directly connected by passages between the islands of the Middle and Lower Keys
(Fig. 3.1). CDOM-rich outflows from the Everglades and other areas of South Florida
supply CDOM to coastal reef waters in the Middle and Lower Keys via Florida Bay

37
(Williams 2002). Movement of water between these regions depends on a combination of
local wind-forced currents and gravity-driven transports through the passages, produced
by cross-Key sea level differences on time scales of several days to weeks (Lee and
Smith 2002; Smith and Lee 2003; Johns et al. 2006), which arise because of differences
in physical characteristics (shape, orientation, and depth) of the shelf on either side of the
Keys. In some regions, inshore (patch) reefs may be located adjacent to or within Hawk
Channel (Lidz et al. 2003, Peters et al. in press), and so may receive CDOM rich waters
via Hawk Channel.
Figure 3.1. Study sites in the Lower, Middle and Upper Florida Keys included offshore and inshore (patch) reefs that differ in degree of development of associated shoreline. Algae Reef, near intact, mangrove shoreline, is slightly southwest of Carysfort Reef. Key Largo 6m (KL6m) Reef, offshore the city of Key Largo, is west of Molasses Reef. Onshore to offshore transect through John Pennekamp Park, Algae Reef and Carysfort reef sampled in September 2004 is indicated by double line. Also indicated are the

38
inshore and offshore CREMP study sites in the Lower, Middle and Upper Florida Keys sampled in 2006 and 2007. Inshore sites are circled in green. Others (uncircled) represent offshore sites. Long-term mean volume transport (m3/s) through the Keys passages is represented as yellow arrows (from Johns et al. 2006). Not represented in the map are the following sites: Coral Gardens (Middle Keys) and Long Key (CREMP site, Middle Keys) as well as East Washerwoman (Lower Keys) and West Washerwoman (CREMP site, Lower Keys) and White Banks (Upper Keys) (adapted from Ramirez et al. 2007, Lee and Smith 2002, Randazzo and Halley 1997). The higher mean water level of the eastern Gulf of Mexico and variations in the
strength and location of the Loop Current have important influences on mean transports
through the passages between Keys. The long-term mean volume transports through the
primary channels of the Middle Keys are –55 m3/s each for Channels 2 and 5, –260 m3/s
for Long Key Channel, and –370 m3/s for the Seven-Mile Bridge Channel, where
negative mean values represent outflows from Florida Bay (Lee and Smith 2002; Fig.
3.1a). The Seven-Mile Bridge Channel accounts for about 50% of the flow, Long Key
Channel for about 35%, and Channels 2 and 5 account for about 7% each. Florida Bay is
rich in CDOM from the wetlands of the Everglades. Thus, the general region of the
Middle Keys can potentially receive more CDOM than the Upper or Lower (Williams
2002). Moreover, construction of causeways between islands in the Florida Keys,
beginning in the early 1900s, significantly altered patterns of exchange between Florida
Bay and the Atlantic shelf (Swart et al. 1999).
The Florida Current, with transport of 30 Sv (106 m/s), may serve as a longe range
transport and/or mixing mechanism CDOM along and away from the Florida Keys
(Mitchum, pers. comm.).
The most important local terrestrial sources of CDOM are mangroves and coastal
forests. Comparing regions of the Florida Keys, considering the extent of mangrove and
coastal forests, the most occur in the Lower Keys (Lidz et al. 2006), followed by the

39
Upper Keys, while the Middle Keys are most highly developed and have the least
mangrove and intact forests. At the same time, the Middle Keys are characterized by
higher turbidity than the Upper and Lower Keys, likely due to the passages bringing
water from Florida Bay (Porter 2002), which can also carry CDOM.
3.2.2. Rivers and Florida Bay as sources of CDOM
The closest riverine input to the Florida Keys occurs indirectly through Florida
Bay and Biscayne Bay. Shark River is the major riverine input to the Everglades and
Florida Bay. To the north of the Florida Keys, the major riverine input to Biscayne Bay
is Miami River (Walker et al. 1994). As a result of extreme weather conditions, other
rivers sporadically influence the Florida Keys. Mississippi River plumes can reach the
Florida Keys following episodes of extreme precipitation in the Mississippi watershed
(Walker et al. 1994).
Riverine input of CDOM is accompanied by nutrients, wastewater, pollutants,
agricultural runoff such as pesticides, herbicides, and fertilizer, and suspended material
(Coble 2007). Florida Bay nutrient concentrations and turbidity are typically high compared
to the oligotrophic conditions found offshore. The intrusions of waters carrying higher
nutrient concentrations and suspended material from Florida Bay have been hypothesized as
a potential threat to the health of the Florida Reef Tract (Porter et al. 1999). In addition, land
use in South Florida is dominated by citrus, pasture, urban, natural wetland, row crop, dairy
and golf courses. Such activities rely on large and regular applications of pesticides and
fertilizers (Graves et al. 2004). Storm water runoff increases suspended and dissolved
pollutant, nutrient, and heavy metal concentrations, which in turn can decrease dissolved
oxygen concentration and productivity (Graves et al. 2004), and thus adversely affect the
structure and function of biotic communities (Pait et al. 1992 and Kennish 1999 in Graves

40
et al. 2004). Due to the lack of secondary wastewater treatment in much of the Florida
Keys, fecal coliform bacteria and enterococci have been found to accumulate in coral surface
microlayers, potentially compromising resiliency of coral reef biota (Lipp et al. 2002).
3.2.3. Annual trends in the Florida Keys
For the period 1997 - 2003, maximum incident UV irradiance at Everglades
National Park occurred in July - August (6000 - 6500 DUV), except in 1997 and 1998
where the maximum DUV occurred in May – June (http://www.epa.gov/uvnet
/access.html, Everglades NP, FL “everglade_update_may04.pdf”). Maximum mean daily
UV-B and UVR at the Mote Marine Laboratory in the Lower Keys for the period of
record August 2002 - October 2003 occurred in May through July (Fig. 2.5).
For the period sampled, in the Lower Keys (Key West), maximum water
temperature occurred in July and August coincident with wind speed minima (Fig. 3.2a,b,
http://www.ncdc.noaa.gov/oa/climate/research/monitoring.html#ustempprcp,
http://www.ndbc.noaa.gov/station_history.php?station=kywf1). During this time period,
precipitation tended to be highest between June and September (Fig. 3.2a). In the Upper
Keys (Molasses Reef) as well as the Middle Keys (Sombrero Key), mean monthly air and
wind temperature over the time period 2004 – 2007 occurred in August, coincident with
wind speed minima (Fig. 3.3, http://www.ndbc.noaa.gov/station_history.php?station
=mlrf1; Fig. 3.4, http://www.ndbc.noaa.gov/station_history.php?station =smkf1).

41
Figure 3.2a. Temperature and precipitation at Key West (Lower Keys), 2003-2006 (http://www.ncdc.noaa.gov/oa/climate/research/monitoring.html#ustempprcp).
Figure 3.2b. Monthly mean wind speed (WSPD), gust (GST), air temperature (ATMP) and water temperature (WTMP) at Key West (Lower Keys) for 2005 – 2007. Wind and temperature data were not available for January and March 2005, and November and December 2007. Wind data not available from March through August 2005, July through December 2006 and January through June 2007; water temperature data were not available for July 2005 (http://www.ndbc.noaa.gov/station_history.php?station=kywf1).

42
Figure 3.3. Monthly mean wind speed (WSP), gust (D GST), air temperature (ATMP) and water temperature (WTMP) at Molasses Reef (Upper Keys) for 2004 - 2007. Water temperature data not available for January and March 2005 (http://www.ndbc.noaa.gov /station_history.php?station=mlrf1).

43
Figure 3.4. Monthly mean wind speed (WSP), gust (GST), and air temperature (ATMP) at Sombrero Key (Middle Keys) for 2004 through 2007. Temperature is in degrees Celsius. Water temperature data were not available for all of 2004 except March and January, February and March 2005 (http://www.ndbc.noaa.gov/station_history.php? station=smkf1).
3.2.4. Biological Response – Bleaching in the Florida Keys
When the sea surface temperature is warmer than the bleaching threshold
temperature, corals experience thermal stress. The commonly accepted cause of mass
coral bleaching is thermal stress, thus NOAA’s Coral Reef Watch uses sea surface
temperature to monitor the threat of coral bleaching in the FKNMS. Corals are vulnerable
to bleaching when the SST exceeds the temperatures they would normally experience in
the hottest month. Temperature thresholds for coral bleaching are based on the amount of
44
time a reef is subjected to supraoptimal temperatures. NOAA defines the bleaching
threshold temperature (“HotSpot” value) as one degree Celsius (1oC) above the
maximum monthly mean (Goreau et al. 2000). The maximum monthly mean in the
Florida Keys for the sampling period 2005 - 2007 was typically 31oC but reached
approximately 36oC in Key West in 2007 (Figs. 3.2 - 4).
In addition, because normal temperature range differs depending on location, to
determine the risk of coral bleaching for any given location, NOAA has devised the
“degree heating week” (DHW). The DHW product accumulates any coral bleaching
“HotSpots” greater than 1 °C over a 12 - week window, thus showing how stressful
conditions have been for corals in the last three months. It is a cumulative measurement
of the intensity and duration of thermal stress, and is expressed in the unit °C-weeks.
DHWs over 4 °C-weeks have been shown to cause significant coral bleaching, and values
over 8 °C-weeks can cause widespread bleaching and some mortality.
Based on climate predictions, NOAA’s Coral Reef Watch, current conditions, as well
as visual field observations of bleaching, Mote Marine Laboratory of Summerland Key
determines and publishes reports on the threat for mass coral bleaching within the FKNMS
(Table 3.1, http://isurus.mote.org/Keys /current_ conditions.phtml). For the time period
of sampling (2005 – 2007), bleaching in the Florida Keys was most severe from July
through the beginning of September, with maximum severity typically in mid to late
August (e.g., Fig. 3.5). Widespread mass bleaching was not reported along the Florida
reef tract in 2005 – 2007.

45
Table 3.1. Mote Marine Laboratory / Florida Keys National Marine Sanctuary Coral Bleaching Early Warning Network, “Bleachwatch”. Threat of mass coral bleaching within the FKNMS based on current remote sensing and environmental monitoring data, field observations, and climate predictions for sampling years 2005 – 2007 (http://isurus.mote.org/Keys/current_conditions.phtml; reports for 2004 are not available):
2007 October 30, 2007 - LOW October 1, 2007 - LOW September 10, 2007 - HIGH August 27, 2007 - MODERATE August 13, 2007 - HIGH July 30, 2007 - HIGH July 16, 2007 - MODERATE June 29, 2007 - LOW June 1, 2007 - LOW 2006 October 19, 2006 - LOW September 19, 2006 - LOW August 28, 2006 - MODERATE August 14, 2006 - MODERATE July 31, 2006 - MODERATE June 30, 2006 - LOW June 1, 2006 - LOW 2005 October 18, 2005 - LOW September 27, 2005 - LOW September 13, 2005 - MEDIUM August 30, 2005 - MEDIUM August 23, 2005 - HIGH August 16, 2005 - MEDIUM August 9, 2005 - HIGH July 26, 2005 - MEDIUM June 28, 2005 - LOW June 1, 2005 – LOW
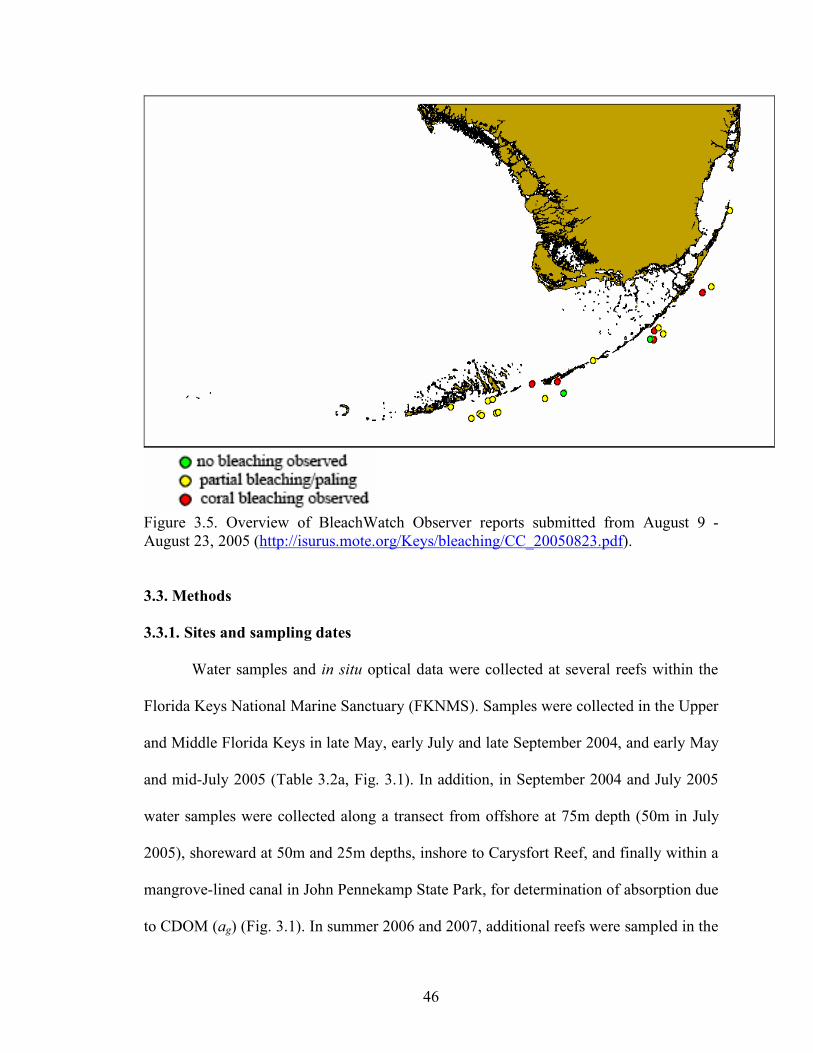
46
Figure 3.5. Overview of BleachWatch Observer reports submitted from August 9 - August 23, 2005 (http://isurus.mote.org/Keys/bleaching/CC_20050823.pdf).
3.3. Methods
3.3.1. Sites and sampling dates
Water samples and in situ optical data were collected at several reefs within the
Florida Keys National Marine Sanctuary (FKNMS). Samples were collected in the Upper
and Middle Florida Keys in late May, early July and late September 2004, and early May
and mid-July 2005 (Table 3.2a, Fig. 3.1). In addition, in September 2004 and July 2005
water samples were collected along a transect from offshore at 75m depth (50m in July
2005), shoreward at 50m and 25m depths, inshore to Carysfort Reef, and finally within a
mangrove-lined canal in John Pennekamp State Park, for determination of absorption due
to CDOM (ag) (Fig. 3.1). In summer 2006 and 2007, additional reefs were sampled in the

47
Upper, Middle and Lower Keys that are annually assessed by the Coral Reef Evaluation
and Monitoring Program (CREMP) (Table 3.2b,c; Fig. 3.1).
Table 3.2a. Sites and parameters sampled in 2004 and 2005. a = absorption, R=Rrs, remote sensing reflectance, C= chlorophyll fluorescence (concentration), S = Spectral underwater flow-through optical instrument package, P=PAR underwater, U=UV and PAR_incident, U_u = UV and PAR underwater. BIC underwater spectroradiometer (BSI) was used for all measurements of underwater irradiance. Flow through optical package profile (overnight) at KL6m and Key Largo 3m, July 04. * = surface absorption sample only. Only surface samples were collectd at open water sites (z > 27 m). Italics = intact shoreline-associated reef, bold case = mangrove canal, regular case = impacted or developed shoreline-associated reef. In July 2005, only bottom samples were collected at 27 m. The SoDoPF measures chlorophyll fluorescence, backscattering, CDOM fluorescence, transmission of red, green, and blue light, salinity, temperature and depth.

48
Site 2004 2005 5/25 7/6-8 9/28-30 1/19-22 5/9-12 6/~18 7/21-23 Algae Reef (6 m) aRCPUS aRCPUS aRCPUS aCP aRCPS aRCP
U_uS Carysfort Reef (10m) aRCPUS aRCPS aRCP
U_uS offshore Carysfort (45 m)
aRCPS aRCP U_uS
offshore Carysfort (30 m)
aRCUS aRCPS
offshore Carysfort (27 m)
aRCP U_uS
offshore Carysfort (25,75m)
aRCPUS aCP
offshore Carysfort (50m)
aRCPUS
Pennekamp- South Creek 2 sites
aC aRCPS
Pennekamp North Creek -- 2 sites
aRCPU aRCP U_uS
KL6m (6 m) aRCPUS aRCPUS aRCPUS aCP aCP aRCPS aRCP U_uS
Molasses 10m, 25 m aRCPU aCP White Banks Reef aRCPUS aRCPUS Molasses (KL) 18 m aRCPUS aRCPUS Alina’s Reef a 5/28 aP Dome Reef a 5/28 aP Molasses 12 m, 45 m aRCPS aRCP
U_uS Molasses 27 m aRCPS Molasses offshore aP Key Largo 9m aRCPUS Key Largo 3m A aRCPUS aRCPUS aP Long Key viaduct- Post 73
aRCP U_uS
Tennessee 6m aP aRCPS aRCP U uS
Tennessee 10m aRCPUS aP aRCPS aRCP U_uS
Tennessee 18m aRCPUS Tennessee 25m, 75 m aP Tennessee 27 m aRCPS Tennessee 45 m aRCPS aRCP
U_uS Conch 10 m, 30m aRCPU Looe Key 6, 10, 25, 50, 75 m
aP
Marquesas shallow (3 m) & deep (9 m)
aCP

49
Table 3.2b. Sites and samples for Spring/Summer 2006. Measurements at all deep sites: a, C, P, U_u; all shallow sites, unless otherwise noted: see Table 3.1a for description. * = surface absorption sample only. Italics = intact shoreline-associated reef, regular case = impacted or developed shoreline-associated reef. May 28–June 2, 2006 (Middle & Lower Keys) June 28 -29, 2006 (Upper Keys) Sand Key deep (8.6 m) & shallow (4.6 m) betw. Carysfort deep & shallow (6.7 m) Rock Key deep (12.5 m) & shallow (4.3 m) blue water off Carysfort (30.5 m) Key West Offshore (blue water) (76 m) Turtle (4.6 m) (Patch) Western Head (11 m) (Patch) Algae (4 m) Cliff Green (6 m) (Patch) Grecian Rocks (7 m) Seagrass Patch between Eastern and W. Sambo (4.3 m) Porter Patch (4 m) (Patch) W.Sambo deep (14.3 m) & shallow (6.8 m) Admiral Patch (5 m) (Patch) E. Sambo deep (15.3 m) & shallow (6.4 m) Conch Deep (15.2) offshore (blue water) (65 m) Molasses Deep (13.7 m) West Washerwoman (4.3 m) (Patch) White Banks (3.7) Jaap (a k.a. Mystery) (2.4 m) (Patch) KL6m (6.1 m) Sombrero deep (13.5 m) & shallow (4.2 m) Rodriguez Key (3.4 m) Alligator deep (12 m) & shallow (6.5 m) W. Turtle Shoal (4.1 m) (Patch) Dustan Rocks (3.6 m) (Patch) East Washerwoman (5.1 m) Looe Key deep (15.2 m) & shallow (6.8 m) Blue Water off Looe Key (90 m) Coral Gardens (3.7 m) Tennessee Deep (14 m) Tennessee Shallow (6.1 m) – (+ a, C ) Long Key Patch (3.7 m) Table 3.2c. Sites and samples for Spring/Summer 2007. Measurements at all deep sites: a, C, P, U_u; all sites, unless otherwise noted: see Table 3.1a for description and Table 3.1c for depths. * = surface absorption sample only. Italics = intact shoreline-associated reef, regular case = impacted or developed shoreline-associated reef. June 5 - 6, 2007 (Upper & Middle Keys) June 18 - 20, 2007 (Middle & Lower Keys) Tennessee Shallow * Sand Key Deep * Tennessee Deep * - no U_u Sand Key Shallow bottom - no U_u Alligator Deep * - no U_u Rock Key Deep * Conch Deep * - no U_u Blue Water * Molasses Deep * - no U_u W. Head Patch Reef * betw. Carysfort-shallow&deep – no U_u Cliff Green Patch * Blue Water - no U_u Sea Grass Patch Reef * Turtle Reef - no U_u Sombrero Deep * Algae Reef - no U_u W. Turtle Shoal * Grecian Rocks - no U_u Dustan Rocks * Porter Patch - no U_u E. Washerwoman Shoal * Admiral Patch - no U_u Blue Water off Looe Key * Molasses Shallow - no U_u Looe Key Deep * White Banks - no U_u W. Sambo Shallow * Three Sisters (KL6m) - no U_u E. Sambo Deep * Blue Water off Sambo * W. Washerwoman Shoal * Jaap a.k.a. Mystery Reef * no U_u

50
Key Largo 6m (KL6m) Reef and Algae Reef (also 6 m depth) were selected for
comparison basd on data for coral health reported by Fisher et al. (2007). Algae Reef is
located offshore from the intact mangrove-lined, and thus CDOM-rich, coastline of John
Pennekamp Park, while KL6m Reef lies offshore from the more developed coastline of
the town of Key Largo. I used this contrast in location to elucidate the influence of
CDOM from terrestrial sources on coral reef resilience. Fisher (2007) found that the
regenerative capacity of corals, coral cover, and abundances of larger foraminifers were
all higher at Algae Reef than KL6m Reef. In addition, studies comparing percent coral
cover have revealed that corals overall are faring better at inshore reefs compared to
offshore reefs (NOAA 2002, Somerfield et al. 2008). In addition, for the period 1996 –
2006, the Upper and Lower Keys show the greatest loss in mean percent stony coral
cover (Fig. 3.6, NOAA 2006).
Figure 3.6. Mean percent stony coral cover in the Florida Keys by region, Upper, Middle and Lower Keys. The Upper and Lower Keys stations continue to show the greatest loss in mean percent stony coral cover since the beginning of the project. Mean percent coral cover in the Middle Keys has not changed significantly since 1999. Between 2005 and 2006, a notable decline in mean percent stony coral cover at CREMP stations Sanctuary-

51
wide occurs in all three regions (from Callahan et al. 2006). Because CDOM is carried reefward from terrestrial sources during low tide, and
is diluted by ocean water during high tide, the timing of sampling with respect to the tidal
cycle was recorded (Tables 3.3a,b). Tidal tables were obtained from the websites:
http://www.ndbc.noaa.gov/station_page.php?station=mlrf1 for Molasses Reef and
http://co-ops.nos.noaa.gov/tides04/tab2ec3d.html for Carysfort Reef and Largo Sound,
Key Largo.
Table 3.3a. Tidal information for sampling sites (Key Largo 6m (KL6m) Reef, Algae Reef) on dates sampled in 2004.
Molasses Reef
high low
Largo Sound
25o08.4’N 80 o23.7W
high low
Carysfort Reef
25o13.3’ N 80 o12.7’ W
high low
May 25, 2004 1:14 am 7:24 am
1:22 pm 7:34 pm
3:36 am 10:19 am
3:44pm 10:29 pm
July 6, 2004 12:09 am 6:21 am
12:30 pm 6:33 pm
2:31 am 9:16 am
2:52 pm 9:36 pm
00:37 am 6:51 am
12:58 pm 7:11 pm
July 7, 2004 10:02 am 17:34 pm
Sept. 28, 2004 2:46 am 9:02 am
3:10 pm 9:18 pm
9:30 am 3:41 pm
9:46 pm 3:58 pm
Sept. 30, 2004 4:38 am
10:55 am 5:03 pm
Table 3.3b. Sampling (water collection) times for Carysfort, Algae and Key Largo 6m (KL6m) Reefs, May, July, and September 2004. sampling times May July September Key Largo 6m (KL6m) 25 o01.0 92’N 80 o23.844’ W
13:05 May 25 high tide
10:35 July 7 high tide
17:20 September 28 close to high tide
Algae 25 o08.799’N 80 o17.579’ W
10:35 May 25 between tides
12:04 July 6 high tide
11:03 September 28 between tides
Carysfort 10m 25 o13.160’N 80 o12.428’ W
13:45 September 30 between tides (low)

52
3.3.2. In situ and incident irradiance measurements
On most sampling dates in 2004 and before July 2005, the underwater light field
was quantified using hand-lowered in-situ instruments, including a Licor 192SA
underwater quantum sensor for measuring PAR (400-700 nm). Above water incident
spectral irradiance, Ed0+(λ), was measured using a LICOR 1800 Spectroradiometer from
8:30 am to 6:30 pm on most days of sampling in 2004 (280-850 nm, 1.5 nm intervals,
sampling frequency 10-20 minutes).
Beginning in July 2005, a Biospherical Instruments BIC© submersible radiometer
was used to measure in situ irradiance, Edz(λ). The BIC© was equipped to measure 10 nm
wavebands of downwelling cosine irradiance centered at 305, 330, 380 nm
(µW/cm<=/nm), recording the center wavelength, and integrated PAR (400-700nm)
(µEinsteins/m<=/s). A “dark reading”, which measured the signal at each wavelength
with the BIC© on deck and the black cap covering the sensor, was made each day of
sampling. The dark reading is subtracted from each light measurement at all wavelengths,
to correct for the background (voltage) measurement by the BIC©. The dark reading is
especially important for the UV measurements at 305 and 330 nm, because this
correction could make a substantial difference in irradiance when correcting low signals
at these wavelengths. These in situ irradiance data were used to calculate the attenuation
coefficient Kd and to calibrate my model for calculating UV irradiance from absorption
measurements (see section 3.3.3).

53
3.3.3. Water samples: collection and in lab optical measurements
During all cruises, water samples were collected from the surface and bottom by
SCUBA divers or use of Niskin bottles; additional water samples were collected if
stratification was observed. Simultaneous measurements of conductivity and temperature
were made on some dates (see Tables 3.2a,b, and c). Sampling typically occurred
sometime intermediate between high and low tide, for example in September 2004,
sampling occurred between high and low tide, therefore during falling tide (Tables
3.3a,b).
For absorption measurements, discrete water samples (2-3 l) collected just below
the surface and at depth of coral growth were filtered through glass fiber/fine (GFF) and
0.2 µm filters to determine the separate contributions of absorption due to dissolved and
particulate material. The 0.2 µm filtrate and the GFF filters were analyzed on a UV-
Visible spectrophotometer (Perkin Elmer Lambda 18, Hitachi U 3300) respectively for
spectral ag(λ), and spectral absorption due to particles (ap(λ)), from 300-800 nm. The
quantitative filter pad method was used to determine ap(λ) (Mitchell 1990, Mitchell et al.
2000). Spectral absorption due to phytoplankton, aphi (λ), was determined by methanol –
extraction of the filter pads, and spectral absorption due to detritus, ad (λ), was
determined as the difference between the whole minus methanol extracted filter pad
absorption:
ad (λ)= ap (λ) - aphi (λ) (3.1)
To estimate the between - site compositional differences in ag, I compared the
slope of ag (λ) in the UV region (Del Vecchio and Blough 2002) for inshore reefs to
offshore, clear water reefs. Spectral slope of ag(λ) for the the UVB region (280 – 312 nm)
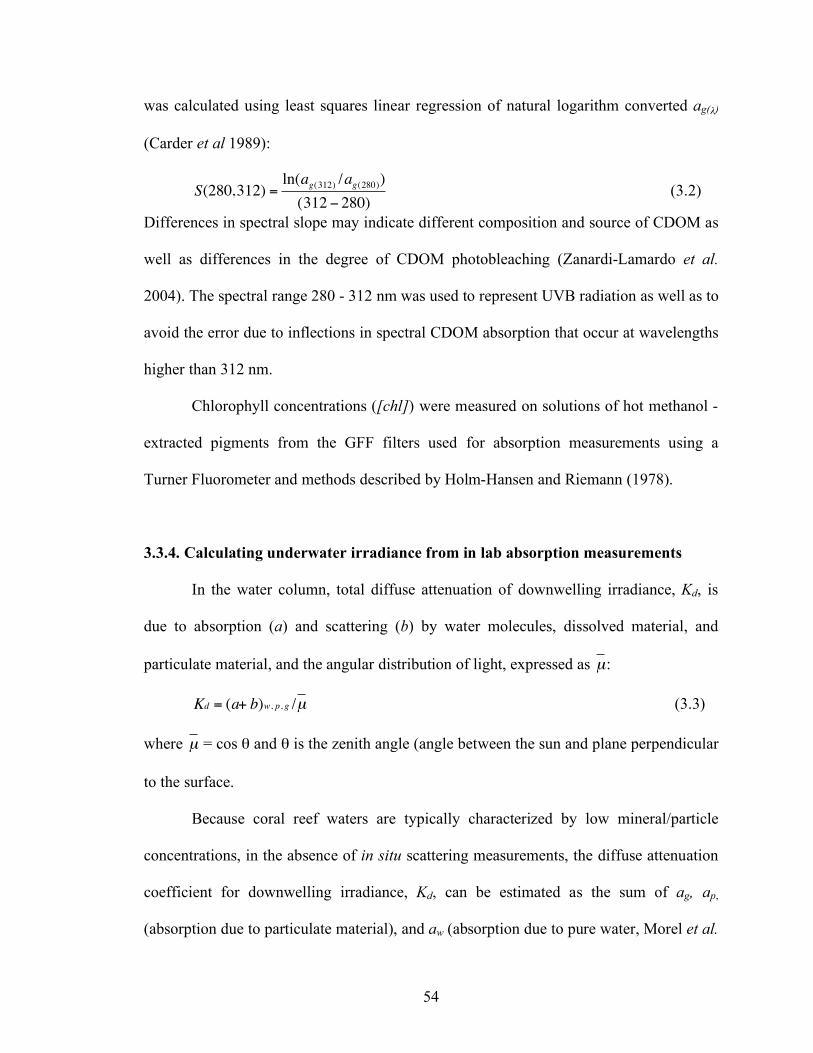
54
was calculated using least squares linear regression of natural logarithm converted ag(λ)
(Carder et al 1989):
S(280,312) =ln(ag(312) /ag(280))
(312 " 280) (3.2)
Differences in spectral slope may indicate different composition and source of CDOM as
well as differences in the degree of CDOM photobleaching (Zanardi-Lamardo et al.
2004). The spectral range 280 - 312 nm was used to represent UVB radiation as well as to
avoid the error due to inflections in spectral CDOM absorption that occur at wavelengths
higher than 312 nm.
Chlorophyll concentrations ([chl]) were measured on solutions of hot methanol -
extracted pigments from the GFF filters used for absorption measurements using a
Turner Fluorometer and methods described by Holm-Hansen and Riemann (1978).
3.3.4. Calculating underwater irradiance from in lab absorption measurements
In the water column, total diffuse attenuation of downwelling irradiance, Kd, is
due to absorption (a) and scattering (b) by water molecules, dissolved material, and
particulate material, and the angular distribution of light, expressed as
µ:
Kd = (a+ b)w, p, g /µ (3.3)
where
µ = cos θ and θ is the zenith angle (angle between the sun and plane perpendicular
to the surface.
Because coral reef waters are typically characterized by low mineral/particle
concentrations, in the absence of in situ scattering measurements, the diffuse attenuation
coefficient for downwelling irradiance, Kd, can be estimated as the sum of ag, ap,
(absorption due to particulate material), and aw (absorption due to pure water, Morel et al.

55
2007, Fry 2008). When scattering is constant and light measurements are made within
two hours of solar noon, the effect of
µ is negligible and the total diffuse attenuation of
downwelling irradiance can be estimated solely from absorption:
Kd = ag + ap + aw (3.4)
Irradiance reaching the sea floor (Edz) can then be estimated as:
Edz(λ)= Ed0+ (λ)e - K_d*z , where z = depth (3.5)
(Kirk 1994). The intensity of irradiance reaching the benthos, Edz, decreases
exponentially as a function of depth (z) and Kd , where Ed0+ is the irradiance intensity
above the water surface.
The relationship in equation (11) can be used to evaluate the discrepancy between
measured Kd and calculated total absorption, at (where at = ag + ap + aw), see Table 3.4,
Fig. 3.9) and to compare
µ between sites (see Chapter 6):
Kd = (a)w, p, g /µ =>
Kd = at/µ or
µ = at/Kd (3.6)
For collimated light,
µ equals one and thus Kd = at (Kirk 1994). As light becomes more
diffuse (or scattered),
µ decreases. The relationship between absorption, at, scattering, b,
and the average cosine,
µ, and its importance to UV exposure on coral reefs, is discussed
in Chapter 6.
3.3.5. Sources of Error
3.3.5.1. Irradiance and absorption due to particles
In 2004 and 2005, Ed0+ measured using a Li-COR 1800 spectroradiometer,
combined with in lab absorption measurements, at, were used to estimate Kdz according to
Equations (3.4) and (3.6). On all subsequent sampling dates, in situ irradiance (UVR and

56
PAR), measured using a BIC® radiometer (Biospherical Instruments, San Diego, CA)
were used to calculate Kdz as well as to test the model for calculating Kd from at and Ed0+.
Variations of in lab at from in situ Kd may be due to the angular structure of the light field
(
µ) or errors in measuring at (see below). Overestimation of at would result in
overestimation of Kd. Considering inshore and offshore sites together, the median ratio
at:Kd ranged from 0.866 to 0.959 for the UV wavelengths (305, 330 and 380 nm) but was
markedly lower, namely 0.274, for PAR (Table 3.4, Fig. 3.7). Thus, because the mean
at:Kd is close to unity for the UV dataset but not for PAR, at is a good estimate of Kd for
the UV but not for the PAR dataset.
Table 3.4. Median at/Kd and 25th – 75th percentile ranges for inshore and offshore reefs.
at/Kd 305
nm 330 nm
380 nm
PAR
Median at/Kd inshore 0.909 0.890 0.842 0.270 25th percentile 0.784 0.749 0.714 0.208 75th percentile 0.990 0.975 0.924 0.324
Median at/Kd offshore 1.019 1.038 0.981 0.274 25th percentile 0.246 0.475 0.586 0.229 75th percentile 1.147 1.234 1.203 0.382
Median at/Kd inshore and offshore 0.959 0.911 0.886 0.274 25th percentile 0.832 0.804 0.737 0.191 75th percentile 1.098 1.130 1.100 0.355

57
Figure 3.7. Ratio of in lab at to in situ Kd (at/Kd) for inshore (x) and offshore (o) reef sites, 2005 – 2008. Dashes represent medians. Highest outliers occurred at offshore sites
Considering inshore and offshore reef sites separately, at:Kd was higher for
offshore reefs than for inshore reefs (see Table 3.4). This could be because particles play
a slightly greater role in total absorption at offshore sites (see Table 3.5) and thus cause
more scatter in measuring absorption on the filter pad, and consequently, higher at. In
addition, the pathlength corrections using the QFT for ap may cause the overestimate of
ap and thus proportionately overestimate at (Finkel & Irwin 2001). Although the
quantitative filter technique is the accepted and widely used method for measuring
absorption due to particles (ap), the coefficients used for correcting for the pathlength
may vary based on the size and type of particles as well as type of measurement

58
equipment (spectrophotometer) and sample preparation techniques (Finkel & Irwin
2001).
Table 3.5. Median ag/at and ap/at and 25th – 75th percentile ranges for inshore and offshore reefs.
305 nm 330 nm 380 nm PAR Median ag/at inshore 0.892 0.852 0.753 0.509 25th percentile 0.867 0.799 0.684 0.346 75th percentile 0.928 0.899 0.841 0.638 Median ag/at offshore 0.871 0.7809 0.678 0.347 25th percentile 0.825 0.758 0.605 0.212 75th percentile 0.903 0.851 0.764 0.465 Median ap/at inshore 0.090 0.104 0.116 0.192 25th percentile 0.0583 0.0741 0.0787 0.126 75th percentile 0.109 0.141 0.158 0.263 Median ap/at offshore 0.106 0.135 0.155 0.268 25th percentile 0.082 0.107 0.126 0.216 75th percentile 0.134 0.174 0.195 0.339
Recent studies have shown that freezing the filter pads may result in exaggeration
of the MAA peak due to extracellular release of MAAs, compared to lower absorption in
their normal, intact shape (Laurion et al. 2003). Using a ratio such as relative MAA
expression (see Chapter V) can cancel out this exaggeration, but large MAA peaks may
affect ap, especially ap330. Also, the MAA absorption observed using the frozen filter –
QFT method may not represent in vivo absorption by MAAs, where the pigments would
be intact in the cells (Laurion et al. 2003). Large colloids (diameter ~ 0.4 – 1 µm) can be
captured on the GFF filters (nominal pore size 0.7 µm) and thus can also be a source of
measurement error, because they play a significant role in particulate scattering: in the
water column, scattering by large colloids can exceed that of pure water by an order of
magnitude.
59
3.3.5.2. Absorption due to colloids
Small colloids range from 0.01 – 0.02 µm, and thus can be present in the 0.2 µm
filtrate used to determine absorption due to CDOM (ag). Small colloids can play an
important role in the overall colloidal backscattering in the ocean. The combined
backscattering of small and large colloids is typically higher than that of pure seawater
over most of the visible spectrum: the scattering coefficient of large colloids from 350 –
700 nm can be up to two orders of magnitude higher than that due to pure water
(Stramski and Wozniak 2005). Small colloids can contribute 44% to total backscattering
at 350 nm (Stramski and Wozniak 2005) and thus can be a significant cause of pathlength
amplification (error in ag) in the UVR. Thus, the contribution of colloids to particulate
backscattering may result in overestimation of ag.
Optimally, to account for all size components in the water column, the 0.2 µm
filtrate used in this study to measure ag should be subtracted from the 0.7 µm filtrate
(from ap preparation) to determine absorption due to particulate material and colloids (ap)
between 0.2 and 0.7 µm. This size fraction has not been accounted for in my dataset.
Typical organisms in the 0.2 to 0.7 µm size fraction include prochlorophytes, very small
green phytoplankton, as well as some small cyanobacteria (blue – green algae) (Carder et
al. 1986), thus their exclusion could also result in underestimates of [chl].
The warm, oligotrophic water - loving cyanobacteria Trichodesmium sp. was
visually observed in the water column at many sampling sites, and was also often
observed as “puffs” and “tufts”, referring to their shape, on the GFF filter upon
measuring ap, in turn resulting in higher ap as well as [chl] (see section 3.3.3.).

60
4. Colored dissolved organic material protects coral reefs by controlling
exposure to UVR 1
4.1. Introduction
Corals worldwide have been declining since the 1970’s and the prognosis for the
future is not improving (Birkeland 2004, Hoegh-Guldberg et al. 2007). Coral bleaching
has become a worldwide phenomenon, and the frequency and intensity of bleaching is
increasing (Hoegh-Guldberg 1999, Wilkinson 2002). While the relationship between
coral mass-bleaching events and elevated sea-surface temperature (SST) is well
established (Hoegh-Guldberg 1999), increasing numbers of studies are revealing that
light plays a vital role in coral bleaching. For example, Lesser and Farrell (2004) found
that corals do not bleach in the absence of light. Low wavelength ultraviolet radiation
(UVR) and blue light can stimulate production of reactive oxygen species causing gene
mutation and other damaging consequences to marine invertebrates (Lesser 2006, Levy et
al. 2006).
Mass bleaching events typically occur when sea conditions are unusually calm (e.g.,
Fabricius et al. 2004) and thermal bleaching appears to be caused by photoinhibition and
photodamage to photosystem II of the zooxanthellae (e.g., Lesser and Farrell 2004, Smith *Much of this chapter will be published by Ayoub L, Hallock P, Coble P as “Colored Dissolved Organic Material Increases Resiliency of Coral Reefs by Controlling Exposure to UVR”, in the Proceedings of the 11th International Coral Reef Symposium, Ft. Lauderdale, Florida, 7-11 July 2008.

et al. 2005). The fact that clouds or direct shading can reduce bleaching in corals
provides more evidence for the necessary role of light (e.g., Mumby et al. 2001; Fabricius
et al. 2004). More recent studies are linking coral disease and photooxidative stress
(Lesser 2006).
UVR specifically has been shown to cause DNA damage, DNA mutations or cell
death in marine organisms such as corals (Shick et al. 1996). Although it is generally
thought that UVR attenuates quickly, some natural water bodies are characterized by high
transparency to UVR (Gleason and Wellington 1993).
Pure water absorbs minimally at wavelengths below 490 nm, thus attenuation of the
shorter wavelengths of light is primarily due to dissolved and particulate matter (Kirk
1996). Light absorption by colored dissolved organic matter (CDOM) is highest at the
shortest wavelengths and exponentially decreases with increasing wavelength.
Moreover, the absorption of high-energy radiation causes bleaching and degradation of
CDOM (Zepp et al. 2008). Spectrally, photobleaching of CDOM increases with
decreasing wavelength from 500 to 280 nm, with the most effective photobleaching
occurring in the UV-A region (320 – 400 nm) (Osburn et al. 2001). While an increase in
rates of CDOM breakdown may not be biologically significant in turbid, CDOM-rich
waters, it may be a major reason why corals in clear waters are reportedly more
susceptible to bleaching (e.g., West and Salm 2003) and possibly also to diseases that are
not directly related to pollution. For example, as a consequence of the 4% global
reduction in stratospheric ozone following the Mt. Pinatubo eruption (Randel et al. 1995),
the resultant approximately 8% increase in UV-B reaching the sea surface (Schick et al.
1996) could have increased the rate of CDOM degradation by as much as 24% (Zepp

62
2003). Other studies estimate a lower percentage change, for example, a 25% increase in
UV-B results in a 10% increase in photobleaching according to studies on temperate
lakes (Osburn et al. 2001).
As a defense against UVR, corals and other aquatic organisms produce UV-absorbing
pigments called mycosporine-like amino acids (MAAs) (Shick et al. 1996). Maximum
absorption for MAAs occurs between 305 and 360 nm. Thus, the presence of MAAs can
indicate photic stress (Morrison and Nelson 2004).
Exposure to UVR has been increasing in recent decades due to stratospheric ozone
depletion, resulting in increased photobleaching of CDOM and, in turn, deleterious
effects on marine biota (Fig. 4.1). We propose that CDOM is protecting inshore patch
reefs from exposure to the most extreme solar radiation and damaging effects of
photooxidative stress.

63
Figure 4.1. Atmospheric, optical, and biological factors affecting CDOM absorptivity and related biological effects (after Morris and Hargreaves 1997; Zepp et al. 2008). 4.2. Material and Methods
In late May, early July and late September 2004, and early May and mid-July
2005, water samples and in situ optical data were collected at several reefs in the upper
and middle Florida Keys. In addition, in September 2004, absorption due to CDOM (ag)
was measured along a transect (red arrow in Fig. 4.2) from offshore at 75 m depth,
shoreward to 50 m and 25 m depths, inshore to Carysfort and Algae Reefs, and finally
within a mangrove-lined canal in John Pennekamp State Park. In summer 2006 and 2007,
sampling sites included inshore and offshore coral reefs in the Upper, Middle and Lower

64
Keys that lie within the Florida Keys National Marine Sanctuary (FKNMS) and are part
of the Coral Reef Evaluation and Monitoring Program (CREMP) (Fig. 4.2).
Figure 4.2. Study sites in the Lower, Middle and Upper Florida Keys included offshore reefs and inshore (patch) reefs that differ in degree of development of associated shoreline. In 2006 and 2007, study sites also included inshore and offshore CREMP study sites in the Lower, Middle and Upper Florida Keys (image adapted from A. Ramirez).
Total absorption can be partitioned into absorption due to dissolved material, ag,
particulate material, aPM, and pure water, aw (Kirk 1994). Using measured ag and ap, and
published values of aw (Morel et al. 2007):
at (λ) = ag + ap+ aw (4.1)
65
In natural systems, light is not collimated but diffuse. Measuring irradiance
consistently within 2 hours of solar noon minimizes the effect of sun angle and thus
pathlength on light attenuation. Total attenuation is due to scattering as well as
absorption. Scattering is small compared to absorption for this study (Ivey, unpubl. data).
Thus, the diffuse attenuation coefficient of downwelling irradiance (Kd) can be estimated
from total absorption (Kirk 1994):
Kd = ag + aPM+ aw (4.2)
Water samples were collected from the subsurface (~ 0.5 m) and at the depth of
coral growth by SCUBA divers or using Niskin bottles. After filtration, water samples
were frozen and transported back to the lab, where spectral absorption (300-800 nm) for
CDOM (ag(λ)) was measured according to the method described in Mitchell et al. (2000)
and aPM(λ) was measured according to Mitchell (1990) using a UV-Visible
spectrophotometer (Perkin Elmer Lambda 18 or Hitachi U 3300). Spectral absorption due
to detritus, ad (λ), was determined by methanol extraction of pigments and subtracted
from aPM(λ) to determine spectral absorption due to phytoplankton, aphi (λ):
ad (λ) = ap (λ) - aphi (λ) (4.3)
(Kirk 1994). Relative MAA expression was determined using the method of Morrison
and Nelson (2004).
In July 2004, incident solar irradiance reaching the sea surface was measured using a
LiCor - 1800 Spectroradiometer (280-850 nm) at a nearby land site at 10-20 minute
intervals from 8:30 am – 6:30 pm daily. Intensity of irradiance reaching the benthos was
calculated from measurements of in-lab absorption at (λ) and the in situ incident
downwelling irradiance Ed0 (λ) according to eqn. (4.3) and:

66
Edz(λ)= Ed0 (λ) * e -Kd(λ)* z (4.4)
where z represents depth in meters (Kirk 1994). After July 2005, Kd was calculated from
in situ underwater downwelling cosine irradiance (Ed(λ)) measured at 305, 330, 380 nm
(10 nm wavebands, recorded at maximum wavelength minus 5 nm) and the visible
wavelengths (integrated from 400 – 700 nm) using a BIC (Biospherical Instruments,
Inc.) radiometer.
4.3. Results and Discussion
Absorption due to CDOM decreased going offshore from mangroves to inshore
reefs, offshore reefs and finally blue water (Fig. 4.3), exhibiting the progressive dilution
of land-sourced CDOM.
Figure 4.3. Transect of absorption due to CDOM at 320 an (ag 320). ag 320 decreased going from mangrove canals in John Pennekamp Park to inshore and offshore reefs to offshore blue water.
Downwelling UV irradiance at 320 nm at depth = 6m (Ed6m 320nm), modeled from at320
and incident irradiance (Ed0), was higher at reefs associated with developed shoreline,
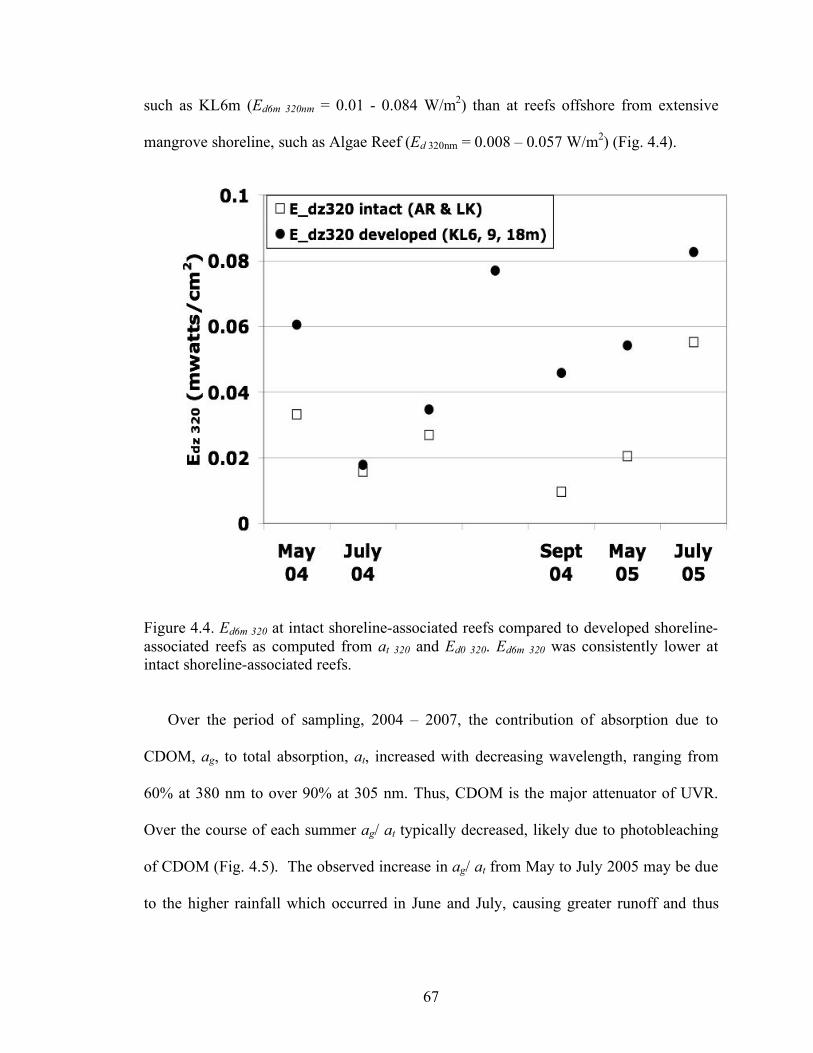
67
such as KL6m (Ed6m 320nm = 0.01 - 0.084 W/m2) than at reefs offshore from extensive
mangrove shoreline, such as Algae Reef (Ed 320nm = 0.008 – 0.057 W/m2) (Fig. 4.4).
Figure 4.4. Ed6m 320 at intact shoreline-associated reefs compared to developed shoreline-associated reefs as computed from at 320 and Ed0 320. Ed6m 320 was consistently lower at intact shoreline-associated reefs.
Over the period of sampling, 2004 – 2007, the contribution of absorption due to
CDOM, ag, to total absorption, at, increased with decreasing wavelength, ranging from
60% at 380 nm to over 90% at 305 nm. Thus, CDOM is the major attenuator of UVR.
Over the course of each summer ag/ at typically decreased, likely due to photobleaching
of CDOM (Fig. 4.5). The observed increase in ag/ at from May to July 2005 may be due
to the higher rainfall which occurred in June and July, causing greater runoff and thus

68
increased CDOM over the reef (http://www.ncdc.noaa.gov/oa/climate/research
/monitoring.html#ustempprcp).
Figure 4.5. Relative contribution of ag to at in the UV at 305, 320, 330, 380 nm. Relative contribution of ag to at in the UV at 305, 320, 330, 380 nm ranged from 62% at 380 nm to 91% at 305 nm and from 18 – 62 % for visible light; mean ag/at typically declined at all wavelengths as the summer progressed.
The difference in Ed6m (ex: Ed6m 320) between intact and developed reefs may be due
to ag (ex: ag 320), which was higher at intact shoreline-associated reefs compared to
developed shoreline – associated reefs considering all dates sampled in 2004 – 2007 (Fig.
4.6, Table 4.1).
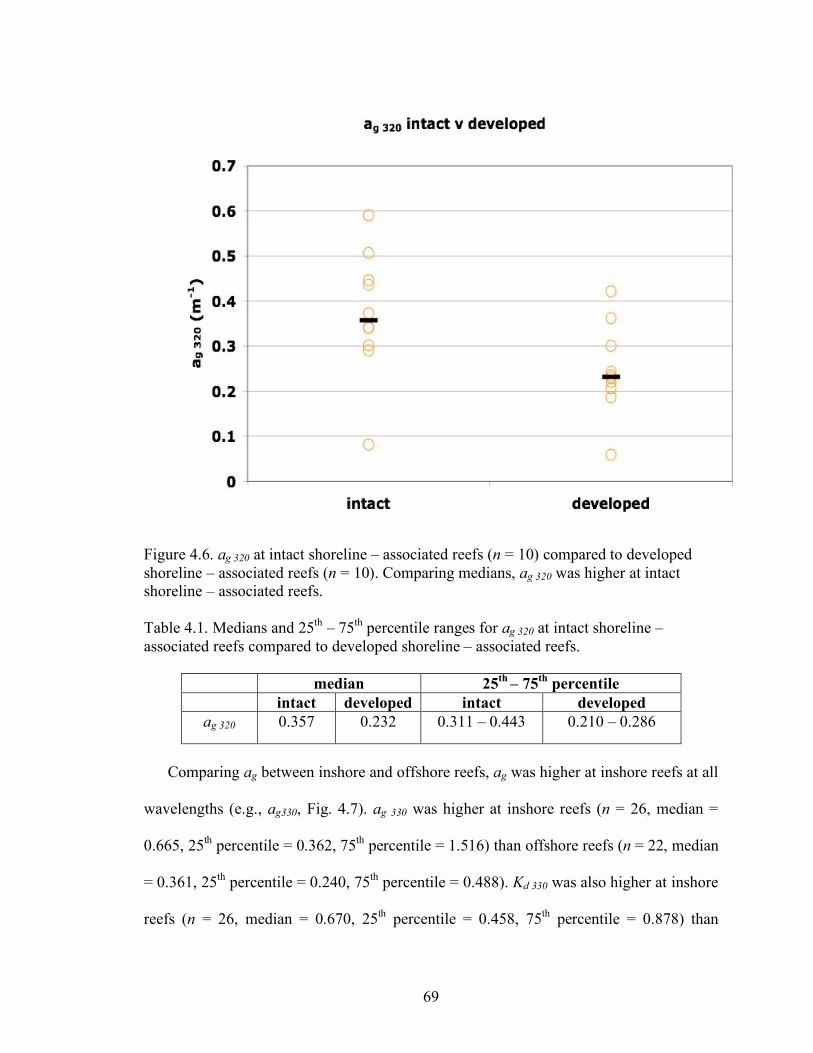
69
Figure 4.6. ag 320 at intact shoreline – associated reefs (n = 10) compared to developed shoreline – associated reefs (n = 10). Comparing medians, ag 320 was higher at intact shoreline – associated reefs. Table 4.1. Medians and 25th – 75th percentile ranges for ag 320 at intact shoreline – associated reefs compared to developed shoreline – associated reefs.
median 25th – 75th percentile intact developed intact developed
ag 320 0.357 0.232 0.311 – 0.443 0.210 – 0.286
Comparing ag between inshore and offshore reefs, ag was higher at inshore reefs at all
wavelengths (e.g., ag330, Fig. 4.7). ag 330 was higher at inshore reefs (n = 26, median =
0.665, 25th percentile = 0.362, 75th percentile = 1.516) than offshore reefs (n = 22, median
= 0.361, 25th percentile = 0.240, 75th percentile = 0.488). Kd 330 was also higher at inshore
reefs (n = 26, median = 0.670, 25th percentile = 0.458, 75th percentile = 0.878) than

70
offshore reefs (n = 22, median = 0.419, 25th percentile = 0.254, 75th percentile = 0.548).
Concurrently, Kd calculated from in situ measurements using a BIC radiometer was
higher at inshore reefs (ex: Kd 330, Fig. 4.7; Table 4.2). The difference in Kd between
inshore and offshore reefs decreased with increasing wavelength, excepting discrepancy
from this trend at 305 nm due to immeasurably low irradiance intensities (Table 4.2).
Thus, difference in water transparency between inshore and offshore reefs was greater
for UVR than for PAR. Results for both ag and Kd, two independent measures of UV
transparency, illustrate that coral reef biota are exposed to lower intensities of UV
irradiance at inshore reefs compared to offshore reefs in the Florida Keys.
Figure 4.7. Absorption due to CDOM at 330 nm (ag 330) and the attenuation coefficient of downwelling irradiance at 330 nm, Kd 330. ag 330 was higher at inshore reefs (n = 26, median = 0.665, 25th percentile = 0.362, 75th percentile = 1.516) than offshore reefs (n = 22, median = 0.361, 25th percentile = 0.240, 75th percentile = 0.488). Kd 330 was higher at inshore reefs (n = 26, median = 0.670, 25th percentile = 0.458, 75th percentile = 0.878)
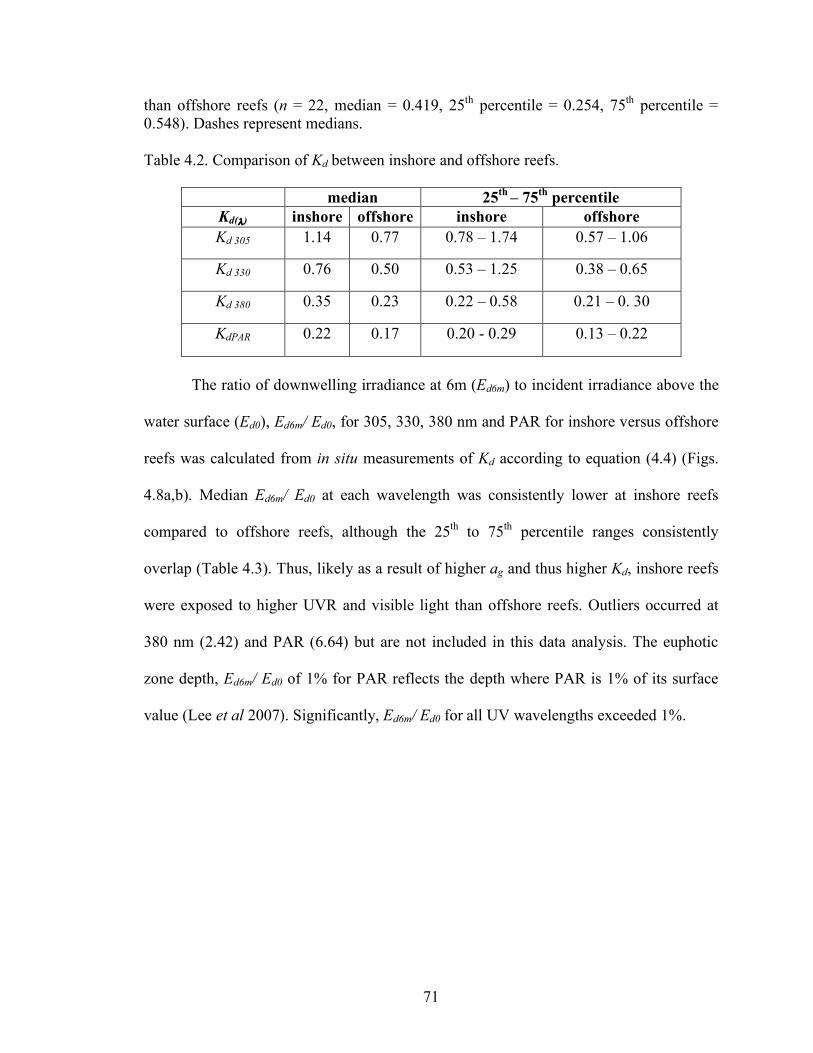
71
than offshore reefs (n = 22, median = 0.419, 25th percentile = 0.254, 75th percentile = 0.548). Dashes represent medians. Table 4.2. Comparison of Kd between inshore and offshore reefs.
median 25th – 75th percentile
Kd(λ) inshore offshore inshore offshore Kd 305 1.14 0.77 0.78 – 1.74 0.57 – 1.06
Kd 330 0.76 0.50 0.53 – 1.25 0.38 – 0.65
Kd 380 0.35 0.23 0.22 – 0.58 0.21 – 0. 30
KdPAR 0.22 0.17 0.20 - 0.29 0.13 – 0.22
The ratio of downwelling irradiance at 6m (Ed6m) to incident irradiance above the
water surface (Ed0), Ed6m/ Ed0, for 305, 330, 380 nm and PAR for inshore versus offshore
reefs was calculated from in situ measurements of Kd according to equation (4.4) (Figs.
4.8a,b). Median Ed6m/ Ed0 at each wavelength was consistently lower at inshore reefs
compared to offshore reefs, although the 25th to 75th percentile ranges consistently
overlap (Table 4.3). Thus, likely as a result of higher ag and thus higher Kd, inshore reefs
were exposed to higher UVR and visible light than offshore reefs. Outliers occurred at
380 nm (2.42) and PAR (6.64) but are not included in this data analysis. The euphotic
zone depth, Ed6m/ Ed0 of 1% for PAR reflects the depth where PAR is 1% of its surface
value (Lee et al 2007). Significantly, Ed6m/ Ed0 for all UV wavelengths exceeded 1%.

72
Figure 4.8a. Ed6m/Ed0 for 305, 330, and 380 nm for inshore versus offshore reefs sampled 2004 – 2007 (in = inshore, off = offshore). Dashes represent medians.
Figure 4.8b. Ed6m/Ed0 for PAR for inshore versus offshore reefs sampled in 2004 – 2007 (in = inshore, off = offshore). Dashes represent medians.

73
Table 4.3. Medians and 25th to 75th percentile ranges for Ed6m/Ed0 at 305, 330, 380 nm and PAR.
median 25th – 75th percentile Ed6m/Ed0 (λ) inshore offshore inshore Offshore Ed6m/Ed0 305
0.00105
0.0192
n 26 32
8.31E-06 – 0.0102 0.00457 – 0.0580
Ed6m/Ed0 330 0.0104 0.0678
n 27 32
2.09E-04 – 0.0463 0.0337 – 0.215
Ed6m/Ed0 380 0.123 0.245
n 27 31
0.0243 – 0.272 0.188 – 0.460
Ed6m/Ed0 PAR 0.267 0.390
n 27 31
0.169 – 0.287 0.272 – 0.474
Spectral slope of ag in the UV, S (280 – 312 nm), was higher at offshore sites compared to
inshore sites (Fig. 4.9, Table 4.4). Comparing inshore reefs by region, median S was the
same in the Lower and Middle Keys, and higher in the Upper Keys. Comparing offshore
reefs by region, median S for was lowest in the Lower Keys and increased going from the
Middle to Upper Keys. Thus, in addition to higher exposure to UVR (Fig. 4.8, Table 4.3),
because S increases with increasing photobleaching of CDOM (Del Vecchio and Blough
2002), CDOM at offshore reefs was more highly photobleached.

74
Figure 4.9. Spectral slope, S, (280 – 312 nm) for the Upper, Middle, and Lower Keys, inshore versus offshore sites. Dashes represent medians. Medians for inshore reefs in the Lower and Middle Keys were equal, and lower than that for the Upper Keys. Median for offshore reefs was lowest in the Lower Keys and increased going from the Middle to Upper Keys.
Table 4.4. Medians and 25th to 75th percentile ranges for S (280 – 312 nm) for inshore versus offshore reefs by region (Lower, Middle, and Upper Keys).
median 25th – 75th percentile S inshore offshore inshore offshore
Lower Keys
0.0253 0.0282
n 10 10
0.0240 – 0.0270 0.0262 – 0.0292
Middle Keys
0.0253 0.0294
n 3 6
0.0251 – 0.0256 0.0272 – 0.0317
Upper Keys
0.0271 0.0314
n 34 10
0.0249 – 0.0293 0.0306 – 0.0333

75
As presented in section 4.1, we propose that declining percent stony coral cover in the
Florida Keys may be exacerbated by increased exposure to UVR. Comparing percent
stony coral cover and ag 320, low percent stony coral cover co-occurs most frequently with
low ag 320 (Fig. 4.10) and the sites where this occurs are mostly offshore sites where ag is
low (Fig. 4.11). Co-occurrence of low percent stony coral cover with low ag 320 was high
(17 (1 – 1) and 15 (1 -2)), while co-occurrence of higher scaled combinations were
relatively low (between 0 and 5). In all but two cases (combination 1 – 3), low % coral
cover was consistently accompanied by low ag 320 (Table 4.5). Percent stony coral cover
was consistently higher at inshore reef sites compared to offshore reefs, and did not
always co-occur with high ag 320 (Fig. 4.9). An explanation of the negative relationship
between ag 320 and percent stony coral cover may be that corals need light for
photosynthesis, so the inshore reefs may be light limited at high ag. Inshore reefs are
more often exposed to high ag than low ag, suggesting that longer term light history has
greater influence on percent coral cover than instantaneous ag measurements.

76
Figure 4.10. The number of occurrences of different combinations of scaled % stony coral cover and ag 320. There were large numbers of low % stony coral cover – low ag 320, (17 (1 – 1) and 15 (1 -2), while occurrences of higher scaled combinations were relatively low (between 0 and 5). In all but 2 cases (combination 1 – 3), low % coral cover was consistently accompanied by low ag 320.

77
Figure 4.11. Percent stony coral cover versus ag 320 for the CREMP sites sampled in 2006 and 2007. Low percent stony coral cover (% coral cover) co-occurs most frequently with low ag 320. High percent coral cover occurs only at inshore reefs. Percent coral cover data courtesy of M. Callahan, CREMP, FWRI, St. Petersburg, FL. Table 4.5. Scaling gradients for % stony coral cover (%cc) and ag 320.
1 2 3
%CC < 0.1 0.1 < %CC < 0.2 %CC > 0.2
ag 320 < 0.4 0.4 < ag 320 <0.8 ag 320 > 0.8
Relative expression of MAAs declined with increasing ag 320 (Fig. 4.12). Throughout
the sampling period 2004 – 2007, relative MAA expression was significantly higher at
reefs associated with developed than at reefs associated with intact shoreline (see Chapter
5, Fig. 5.7).

78
Figure 4.12. Relative expression of MAAs declined with increasing ag 320 for intact and developed reefs in 2004 – 2005.
4.4. Conclusions
Though traditionally it has been thought that corals require clear water for
photosynthesis, recent trends show that the clearer water reefs are experiencing higher
rates of coral decline. In the Florida Keys, distance from shoreline as well as shoreline
quality may influence reef health as recent declines in percent coral cover and coral
biodiversity have been greater at offshore reefs than inshore reefs (Somerfield et al.
2008) and coral-lesion recovery rates are higher at inshore (patch) reefs near intact
shoreline than developed shoreline (Fisher et al. 2007). Inshore reefs may be closer to
seagrass beds, mangroves, wetlands, and other terrestrial sources of CDOM. Our work
shows that differences in water transparency, and the resulting spectral differences in

79
solar radiation reaching the benthos, may contribute to different rates of decline in coral
cover between inshore patch reefs and offshore shallow reefs.
This study helps to support/explain previous observations in the Florida Keys: 1)
lower rates of decline at inshore reefs than offshore reefs (e.g., Somerfield et al. 2008); 2)
consistently higher bleaching in larger foraminifers at a reef associated with clearer water
(Conch Reef) than at a reef influenced by Florida Bay water (Tennessee Reef) (Williams
2002); 3) occurrence of bleaching in benthic foraminifers (Amphistegina gibbosa) in the
Florida Keys follows solar cycle, not SST cycle, and increases with increasing UV:PAR
(Williams 2002); and 4) higher coral cover, coral-lesion recovery rates and abundances of
larger foraminifers at a reef associated with intact shoreline (Algae Reef) compared to a
reef associated with developed shoreline (KL6m Reef) (Fisher 2007).
Prior studies also show deleterious effects of UVR on reef organisms. Lab
experiments have shown that bleaching in A. gibbosa is exacerbated by exposure to blue
or UV wavelengths (Williams and Hallock 2004). Studies of bleaching in corals indicate
that decline in zooxanthellate photosynthetic capacity follows increase in daylight and
precedes temperature peak (Warner et al. 2002), and that UVR and PAR exacerbate
supraoptimal temperature effects (Lesser and Farrell 2004). Although MAAs are
photoprotective, the energetic cost of MAA production may inhibit growth and recovery
from stress (Hoogenboom et al. 2006), and high solar radiation may depress MAA
production (Lesser and Farrell 2004).
Based on modeled entire water column photobleaching in lakes, photobleaching can
cause 0.6 to 1.4% decrease in CDOM light absorption over the timescale of tidal flushing
(12 hours) (Reche et al. 2000). Offshore reefs and developed shoreline-associated reefs

80
that do not receive consistent, tidally flushed pulses of CDOM are particularly
susceptible to increased UV transparency due to photobleaching of CDOM.
In conclusion, UV irradiance may contribute to photooxidative stress and reef decline
in the Florida Keys. Management of shorelines to protect sources of photo-protective
CDOM such as mangroves, seagrasses, and wetlands may reduce susceptibility to
bleaching in corals.

81
5. Mycosporine-like Amino Acids as indicators of photo-oxidative stress
5.1 Introduction
Mycosporine-like amino acids (MAAs) are UV-absorbing compounds with
maximal absorbance at 310 – 360 nm (Shick et al. 1999). MAAs also may have an
antioxidant activity (Dunlap and Yamamoto 1995, Kim et al. 2001, Suh et al. 2003).
Because MAAs are induced by exposure to UVR (Dunlap et al. 1986, Banaszak et al.
1998, Lesser 2000), theories on MAA induction are relevant to my study of photobiology
and photochemistry of CDOM and coral reefs.
MAAs can be produced by symbiotic zooxanthellae (Shick et al. 1999) as well as
by phytoplankton (Morrison and Nelson 2004). While exposing corals to UVR can
induce UV-protective mechanisms such as production of MAAs (Shick et al. 1996,
Dunlap and Shick 1998, Morrison and Nelson 2004, Shick 2004) and DNA-repair
enzymes (Banaszak and Lesser 1995, Kuffner et al. 1995, Anderson et al. 2001),
prolonged overexposure to UVR can also reduce photosynthetic rates and simultaneously
reduce MAA production (Lesser and Farrell 2004). In addition, production of MAAs may
decrease with increasing temperature, leaving zooxanthellae more susceptible to damage
caused by exposure to UVR (Lesser et al. 1990).
Results from studies monitoring visible light (400 - 700 nm) and MAA production
have been ambiguous (Jokiel et al.1997, Moisan and Mitchell 2001). Increases in blue
wavelengths of light can induce production of UV-absorbing MAAs, however, visible

82
and UVR co-vary, thus as blue wavelengths of light increase, the concurrent increase in
UVR may actually be responsible for MAA induction. Another hypothesis proposes that
photosynthetically usable energy (PUR) absorbed in excess of the processing capacity of
cellular biochemistry may be passed on to a genetic pathway to induce MAAs (Moisan
and Mitchell 2001). Goes et al. (1995) suggest that disruption of a metabolic pathway
may cause MAA accumulation.
According to Hader, MAAs, which are located in the outer cytoplasmic layers of
the algal cell, prevent up to 7 out of 10 UV photons from reaching the central targets
(e.g., the DNA in the nucleus) (http://www.photobiology.info/Hader.html). MAAs are a
diverse group of compounds and as such display a range of absorption maxima
(http://www.photobiology.info/Hader.html). The MAAs can be extracted from the cells
and separated by HPLC. The absorption spectra of the separated MAAs show different
absorption maxima spread out over the UV-A region
(http://www.photobiology.info/Hader.html; Figure 5.1). Light absorption by MAAs
occurs between 310 to 360 nm and depends on the organisms sampled (Dunlap and Shick
1998). Other compounds, such as DNA and amino acids, absorb at lower UV
wavelengths (Fig. 5.2).

83
Figure 5.1. Absorption spectra for several different MAAs. The absorption spectra of the separated MAAs show different absorption maxima spread out over the UV-A region (http://www.photobiology.info/Hader.html).
Figure 5.2. Relative MAA expression is calculated from the spectral absorption due to phytoplankton, aphi or φ. It is the ratio of the peak to the trough in the UV range.
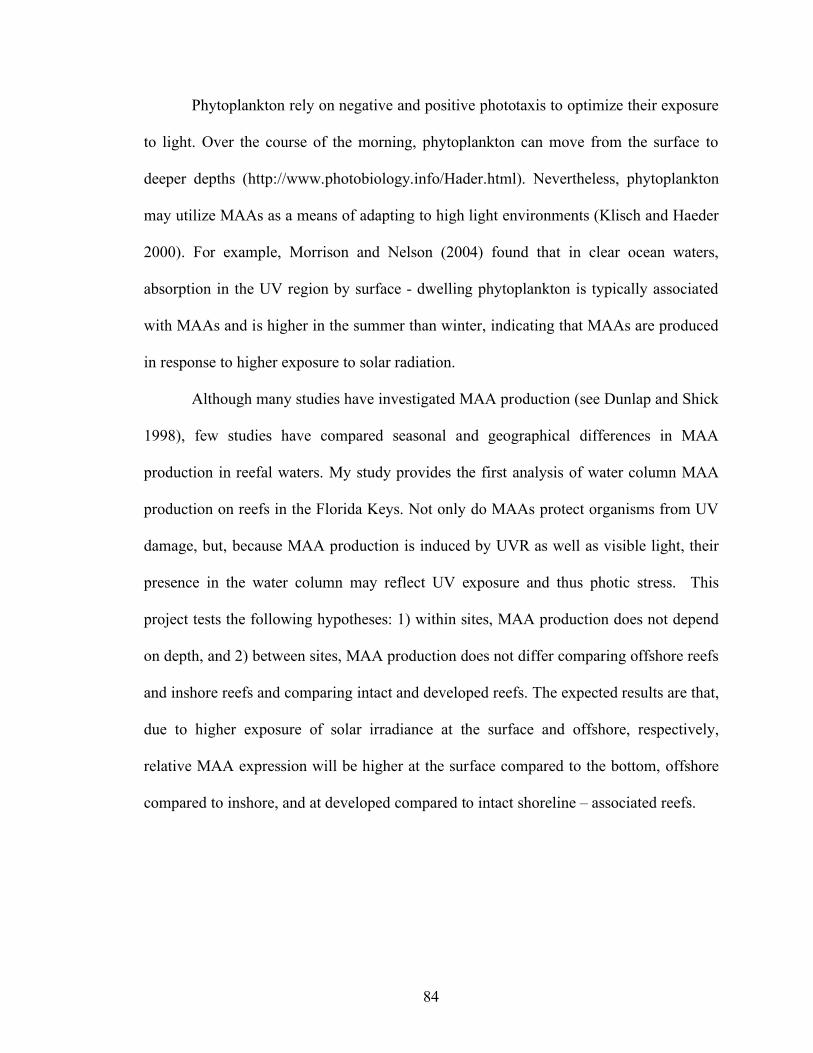
84
Phytoplankton rely on negative and positive phototaxis to optimize their exposure
to light. Over the course of the morning, phytoplankton can move from the surface to
deeper depths (http://www.photobiology.info/Hader.html). Nevertheless, phytoplankton
may utilize MAAs as a means of adapting to high light environments (Klisch and Haeder
2000). For example, Morrison and Nelson (2004) found that in clear ocean waters,
absorption in the UV region by surface - dwelling phytoplankton is typically associated
with MAAs and is higher in the summer than winter, indicating that MAAs are produced
in response to higher exposure to solar radiation.
Although many studies have investigated MAA production (see Dunlap and Shick
1998), few studies have compared seasonal and geographical differences in MAA
production in reefal waters. My study provides the first analysis of water column MAA
production on reefs in the Florida Keys. Not only do MAAs protect organisms from UV
damage, but, because MAA production is induced by UVR as well as visible light, their
presence in the water column may reflect UV exposure and thus photic stress. This
project tests the following hypotheses: 1) within sites, MAA production does not depend
on depth, and 2) between sites, MAA production does not differ comparing offshore reefs
and inshore reefs and comparing intact and developed reefs. The expected results are that,
due to higher exposure of solar irradiance at the surface and offshore, respectively,
relative MAA expression will be higher at the surface compared to the bottom, offshore
compared to inshore, and at developed compared to intact shoreline – associated reefs.

85
5.2. Methods
Spectral absorption due to phytoplankton (aphi) (see Chapter 3) for intact and
developed shoreline - associated reefs was examined for MAA peaks in the UV range. I
used relative MAA expression (relative UV pigment peak height, Morrison and Nelson
2004; see Figure 5.2) as an expression of organismal stress due to exposure to solar
radiation, especially UVR. Using chlorophyll as an indicator of phytoplankton biomass, I
compared the absorption peak at 320 nm to chlorophyll concentration ([chl], µg/l) (see
Chapter 3), to determine whether MAA production is proportional to phytoplankton
biomass. I also examined the ratio maximum MAA absorption: maximum absorption by
chlorophyll (aphi 683) to determine the amount of MAA produced relative to absorption
due to chlorophyll.
5.3 Results and Discussion
Chlorophyll concentration [chl], an indicator of phytoplankton biomass, did not
correlate with relative MAA expression (Fig. 5.3). Relative MAA expression tended to
range from 1 – 2 regardless of [chl]. Relative MAA expression values above 2 were due
to surface samples (blue box in Fig. 5.3) and in one case, the lowest value above 2, due to
a bottom sample at a developed shoreline – associated reef (KL6m). Thus, MAA
production does not increase with increasing [chl]. Because [chl] is an index of
phytoplankton biomass (Huot et al. 2007), it can be deduced that relative MAA
production is not solely dependent on phytoplankton biomass, and low relative MAA
production is not indicative of low phytoplankton biomass.

86
Figure 5.3. Relative MAA expression versus [chl] for all dates sampled from 2004 - 2007 where data for both relative MAA expression and [chl] were available.
Figure 5.4 illustrates relative MAA expression versus ag 320 for all sites sampled in
2004 through 2007. The highest values for relative MAA expression occurred at low (<
0.5 m-1) ag 320. I determined from the number of observations of relative MAA expression
greater than 2 (n = 8) and the number of observations of ag 320 less than 0.5 (n = 34)
compared to the total number of observations (n = 63), that the probability of all eight
relative MAA values greater than 2 occurring by chance is (34/63)8 = 0.007 or 0.7%.
Therefore, there is high probability that high relative MAA production is associated with
low ag 320. In addition, while many samples, surface and bottom, had lower values of
relative MAA production co-occurring with ag 320 less than 0.5 m-1, all relative MAA

87
expression values greater than 2 were surface samples with ag 320 less than 0.5 m-1. Thus
depth, i.e. exposure to light, as well as ag,plays an important role in MAA production.
Figure 5.4. Relative MAA expression versus ag 320 for all sites sampled in 2004 through 2007 where data for both ag 320 and relative MAA expression were available. The chance of all eight relative MAA values greater than 2 occurring by chance is 0.007 (0.7%).
Because the surface is exposed to higher intensities of solar irradiance compared
to the bottom (see Chapter 2), it would be expected that, within sites, relative MAA
expression would be higher for surface samples compared to bottom samples. Relative
MAA expression tended to be higher and more variable for surface samples (median =
1.346, 25th to 75th percentile range = 1.195 to 1.615) than for bottom samples (median =
1.208, 25th to 75th percentile range =1.125 to 1.356, Figure 5.5).
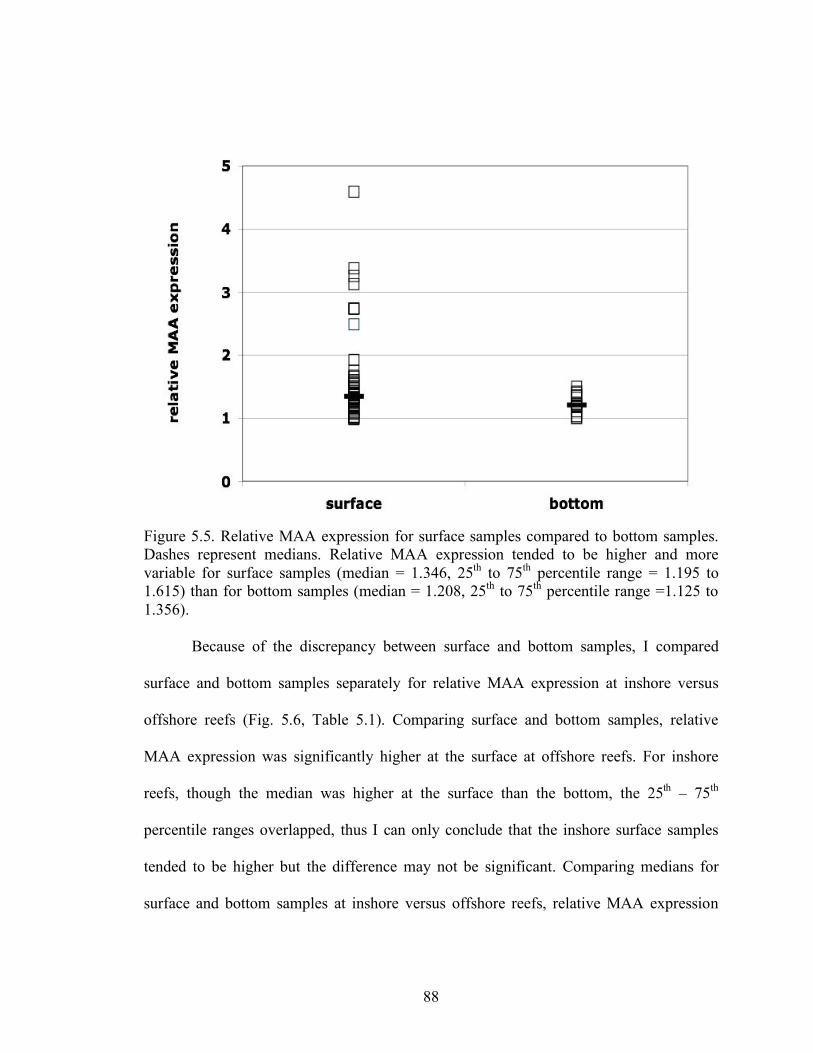
88
Figure 5.5. Relative MAA expression for surface samples compared to bottom samples. Dashes represent medians. Relative MAA expression tended to be higher and more variable for surface samples (median = 1.346, 25th to 75th percentile range = 1.195 to 1.615) than for bottom samples (median = 1.208, 25th to 75th percentile range =1.125 to 1.356). Because of the discrepancy between surface and bottom samples, I compared
surface and bottom samples separately for relative MAA expression at inshore versus
offshore reefs (Fig. 5.6, Table 5.1). Comparing surface and bottom samples, relative
MAA expression was significantly higher at the surface at offshore reefs. For inshore
reefs, though the median was higher at the surface than the bottom, the 25th – 75th
percentile ranges overlapped, thus I can only conclude that the inshore surface samples
tended to be higher but the difference may not be significant. Comparing medians for
surface and bottom samples at inshore versus offshore reefs, relative MAA expression

89
tended to be higher at offshore surface compared to inshore surface and at offshore
bottom compared to inshore bottom.
Figure 5.6. Relative MAA expression comparing surface and bottom samples at inshore versus offshore reefs. Dashes represent medians. Table 5.1. Medians, 25th – 75th percentile ranges, and number of samples (n) for relative MAA expression at inshore versus offshore reefs, surface versus bottom. Relative MAA
expression inshore surface inshore bottom offshore surface offshore bottom
median 1.290 1.000 1.506 1.115 25th percentile 1.082 1.050 1.354 1.001 75th percentile 1.371 1.322 1.922 1.233
N 30 14 21 10
Relative expression of MAAs decreased with increasing ag 320 for intact and
developed shoreline associated reefs in 2004 – 2005 (Figure 4.7). Throughout the
sampling period 2004 – 2007, relative MAA expression was significantly higher at reefs

90
associated with developed shoreline (median = 1.190, 25th to 75th percentile range =
1.109 to 1.220, than at reefs associated with intact shoreline (median = 1.353, 25th to
75tth percentile range = 1.337 – 1.650, Fig. 5.7). Values of relative MAA expression
above 2 were for surface samples, and were higher for developed shoreline – associated
reefs. At the same time, ag 320 was significantly higher and had a lower range at intact
shoreline – associated reefs (see Fig. 4.6, Table 4.1) where relative MAA expression was
lower. Thus ag 320 may be playing a photo-protective role against UVR.
Figure 5.7. Relative MAA expression of intact shoreline – associated reefs compared to developed shoreline - associated reefs. Dashes represent medians.
Comparing medians for relative MAA expression for surface samples only by
region, Upper, Middle and Lower Keys, relative MAA expression tended to be highest in
the Middle Keys, and the 25th – 75th percentile ranges all overlap (Fig. 5.8, Table 5.2).
The Lower Keys has the lowest 25th to 75th percentile range. The outliers for the Upper

91
Keys are as follows: the highest outlier is an offshore reef near developed shoreline
(Molasses), the second highest outlier is an inshore reef near developed shoreline (KL6m
Reef); and the third highest outlier is an inshore reef near intact shoreline (Algae Reef).
The two outliers in the Middle Keys occurred at an offshore site, Tennessee Reef (deep
and shallow site, sampled on the same date).
Figure 5.8. Relative MAA expression by region, Lower, Middle, and Upper Keys. Dashes represent medians. Table 5.2. Medians, 25th – 75th percentile ranges, and number of samples (n) for relative MAA expression comparing regions, Lower, Middle and Upper Keys.
Relative MAA expression Lower Keys Middle Keys Upper Keys median 1.325 1.625 1.315
25th percentile 1.220 1.294 1.178 75th percentile 1.466 1.751 2.487
n 13 3 11

92
At the same time, mean ag 330 at the surface was significantly lower and had a
lower range in the Upper Keys compared to the Lower Keys (Fig. 5.9, Table 5.3). ag 330
for the Middle Keys tended to be lower than the Lower Keys and higher than the Upper
Keys. Thus, in the Lower Keys, low relative MAA expression co-occurred with high ag
330. The Lower Keys have more extensive of mangroves compared to the Upper Keys
(Lidz et al. 2003), and while the Middle Keys receive CDOM – rich waters from Florida
Bay, the constancy and proximity of terrestrial-sourced, locally produced CDOM with
each tidal cycle might play a bigger role in UV photo-protection in the Lower Keys than
the pulses of CDOM-rich water from Florida Bay in the Middle Keys. Although median
relative MAA expression as well as ag 330 were low in the Upper Keys, the Upper Keys
had more and higher outliers compared to the Lower Keys.
93
Figure 5.9. ag 330 at only the surface for the Florida Keys by region, Lower, Middle and Upper Keys. Table 5.3. ag 330 at the surface only for the Florida Keys by region, Lower, Middle and Upper Keys.
ag 330 surface only Lower Keys Middle Keys Upper Keys
ag 330 median (m-1) 0.539 0.352 0.272 25th percentile 0.364 0.272 0.214 75th percentile 0.614 0.593 0.311
n 19 12 29
Considering surface and bottom samples together, the trends in ag 330 between
Upper, Middle and Lower Keys are the same as for surface samples only (Fig. 5.10,
Table 5.4), while the median ag 330 considering surface and bottom samples together were
slighting higher. Thus, ag 330 for surface samples are generally lower than bottom
samples.

94
Figure 5.10. ag 330 at the bottom and surface for the Florida Keys by region, Lower, Middle and Upper Keys. Table 5.4. ag 330 at the surface and bottom for the Florida Keys by region, Lower, Middle and Upper Keys.
ag 330 surface & bottom Lower Keys Middle Keys Upper Keys
ag 330 median (m-1) 0.543 0.419 0.281 25th percentile 0.421 0.427 0.270 75th percentile 0.635 0.870 0.386
n 52 23 28
In conclusion, relative MAA expression was higher at the surface than at the
bottom, at offshore reefs compared to inshore reefs, and at developed shoreline –
associated reefs compared to intact shoreline – associated reefs. In general, high relative
MAA expression co-occurred with lower ag 320 or 330.
95
The species composition at the surface may produce higher amounts of MAAs as
a means of adapting to the high intensities and durations of low wavelength radiation at
the surface. Surface - dwelling phytoplankton may accumulate higher amounts of MAAs
compared to bottom – dwelling phytoplankton, in response to high irradiance, allowing
them to adapt to conditions of high irradiance at the surface (Klisch and Haeder 2000).
MAA production may also decrease in nitrogen deficient waters, making organisms in N
poor waters more susceptible to UV damage (Klisch and Haeder 2008).
Variability in relative MAA expression increased going from the Lower to Upper
Keys. Given the degree of shoreline development in the Key Largo area of the Upper
Keys, in contrast with the significant amount of mangrove shoreline at John Pennekamp
Park, the high variance in the Upper Keys may be due to greater variability in the degree
of shoreline development in this region (Appendix A). While the Middle Keys receive
substantial input from CDOM- and particle-rich Florida Bay (Lidz et al. 2006, Porter
2002), the lowest relative MAA expression was seen in the Lower Keys, which has the
highest amount of intact shoreline.
Because surface samples, offshore sites, and sites near developed shoreline have
higher amounts of MAAs compared to bottom samples, inshore sites, and sites near intact
shoreline, where ag UV is higher, I deduced that offshore sites and sites near developed
shoreline sites are exposed to higher levels of photic stress. The phytoplankton apparently
have acclimated to high light by producing more MAAs. Photic stress compromises
resistance to other biotic and abiotic stressors on reefs, and can contribute to the relative
decline in offshore, clearer water reefs, relative to inshore, less transparent reefs (see
Chapter 4). Combined with CREMP’s observations of higher rates of decline at offshore

96
reefs, these results on MAA production allow me to reject the hypothesis that UVR does
not play an important role in coral reef decline. CDOM, as a photoprotective barrier to
UVR, may protect coral reefs from photooxidative stress.
Chlorophyll concentration ([chl], µg/l) was significantly lower in the Upper Keys
(mean=0.252, SD=0.111) compared to the Middle (mean=0.326, SD=0.109) and Lower
Keys (mean=0.342, SD=0.079) (p = 0.0313 and 0.00168, respectively). Comparing the
Middle and Lower Keys, [chl] was not significantly different (p = 0.597) (Figure 5.11,
Table 5.5). At the same time, ag 320 was lowest and relative MAA expression was
relatively high in the Upper Keys, especially compared to the Lower Keys. Thus, high
CDOM co-occurs with lower production of UV-protecting compounds (MAAs) and
higher production of chlorophyll, an indicator of phytoplankton biomass. These results
support the hypothesis that CDOM may be protecting organisms, as exhibited here by
phytoplankton, from photo-oxidative stress.

97
Figure 5.11. [chl] by region in the Lower, Middle, and Upper Keys. Dashes represent medians. Table 5.5. Medians, 25th and 75th percentiles, and number of samples (n), for [chl] for the Lower, Middle, and Upper Keys.
[ chl] µg/l lower middle upper median 0.345 0.334 0.239
25th percentile 0.286 0.263 0.177 75th percentile 0.398 0.403 0.323
n 22 16 35
5.4 Future Work
The dynamic nature of exposure to solar radiation, behavioral and
physiological species acclimations to solar radiation, and the time scales of these
processes are an exciting aspect that this project did not address. While some studies have

98
investigated the time scales of MAA production at one depth in culture, other studies
have investigated MAA production over seasonal time scales, in situ analysis of
phytoplankton number and species, together with time scales of phototaxis and MAA
production, should be explored further.

99
Chapter 6. Spatial Variability of Inherent and Apparent Optical Properties on Coral Reefs
6.1. Background
Coral reefs in the Florida Keys, as well as worldwide, are experiencing decline in
coral cover, increase in disease and bleaching, and associated stresses that result in
overall decline in coral health (see Chapter 3). Among factors that have been implicated
in the cause of coral reef decline are temperature and solar radiation (Lesser and Farrell
2004).
The underwater light field is a result of incident irradiance interacting with the
absorption and scattering processes that occur in the water column, as well as the
pathlength (depth). Gregg (2002) describes the angular structure of the underwater light
field: “The direct downwelling stream contains the irradiance directly transmitted by the
sun, traversing the air-sea interface, and proceeding forward at an angle described by the
solar zenith angle modified by the refractive index of seawater. Each scattering and
absorbing event in the water column removes irradiance from the direct downwelling
stream.
“Whereas the downwelling direct irradiance receives no contributions in the water
column and steadily decreases as the result of absorption and scattering processes, the
downwelling diffuse irradiance gains forward-scattered downwelling direct irradiance and
backscattered upwelling diffuse irradiance in the water column. This irradiance stream

100
travels along a path defined as the average cosine for downwelling diffuse irradiance”
(Gregg 2002, p. 6). Thus, diffuse irradiance is amplified by scattering and the
downwelling light stream is enhanced by forward scattering. A coral reef where overlying
water is characterized by relatively lower absorption may incur higher irradiances due to
the angular distribution of light through the water column until it ultimately reaches the
bottom. The reflective properties of the bottom may also increase the amount of upward
scattering of light, and thus light, reaching the benthos (Lee et al. 1998, 1999; Boss and
Zanefeld 2003).
6.2. Objectives
The goal of this chapter is to use field data from two Upper Keys patch (inshore)
reefs to compare differences in the amount of light reaching the benthos based on
modeled radiance distribution determined using Hydrolight©.
6.3. Methods
See Chapter 3 for sample collection and field measurements. Scattering, b, was
measured using an ac-9 (WET labs ©) according to Voss et al. (2003). Methods for in lab
measurements of absorption (ag, ap) and chlorophyll concentration [chl] are also detailed
in Chapter 3, as are field site locations and characteristics. KL6m is located near
developed shoreline, while Algae Reef is located near intact mangrove shoreline (Fig
3.1).
Hydrolight (© Sequoia Scientific), a radiance distribution modeling program, was
used to derive radiance distribution parameters Kd and
!
µd from in lab measurements of

101
total absorption, at, and in situ measurements of scattering, b, for two inshore reefs KL6m
Reef and Algae Reef differing in UV transparency as a result of differences in ag.
Because in situ scattering, b, was measured only on September 28, 2004, this analysis is
limited to one dataset collected at each site on this date. Hydrolight© - derived (modeled)
attenuation coefficients for downwelling irradiance, Kd, and the average cosine of
downwelling irradiance, µd, at four different UV wavelengths, 305, 320, 330 and 380 nm,
were compared between sites. Also, modeled Kd was compared to estimates of Kd based
on in lab measurements of at.
6.3.1. Calculating underwater irradiance
The natural light field is not collimated but diffuse. In the water column, total
diffuse attenuation of downwelling irradiance, Kd, is due to absorption (a) and scattering
(b) by water molecules, dissolved material, and particulate material, and the angular
distribution of light, the average cosine of downwelling irradiance,
µd:
Kd = (a+ b)w, p, g /µd (6.1)
where
µd = (Ed-Eu)/Ed0 = cos θ and θ is the zenith angle (angle between the sun and
plane perpendicular to the surface; see following section for derivation). When scattering
is constant and light measurements are made within two hours of solar noon, the effect of
µd is negligible and the total diffuse attenuation of downwelling irradiance can be
estimated solely from absorption.
Kd = ag + ap + aw (6.2)
where ap is absorption due to particulate material and aw is absorption due to pure water.
Irradiance reaching the sea floor (Edz) can then be estimated as:

102
Edz(λ)= Ed0 (λ)e - K_d*z , where z = depth (6.3)
(Kirk 1994).
When
µ is not constant and b << a, the following is true:
Kd = (a)w, p, g /µ or
Kd = at/µ (6.4)
where at is total absorption due to water molecules, particulate material and gelbstoff.
6.3.2. The angular distribution of light
According to Kirk (1994, p. 9 – 10), “Irradiance (at a point of a surface), E, is the
radiant flux incident on an infinitesimal element of a surface, containing the point under
consideration, divided by the area of that element; it is the radiant flux per unit area of a
surface:
E =dΦ/dS (6.5)
Irradiance has the units W m-2, or quanta (or photons) s-1 m-2 where one mol photons is
6.02 x 10²³ (Avogadro’s number) photons. One mole of photons is frequently referred to
as an einstein.
The relationship between E, radiant flux per unit surface area, and radiance, L, is
shown in my Figure 6.1. “The projected area of the element of surface is dS cos θ and the
corresponding element of solid angle is dω. Thus, the radiant flux on the element of
surface within the solid angle dω is:
dΦ = L(θ,φ) dS cos θ dω (6.6)

103
Figure 6.1. Radiance (L) on a point in a surface, from a given direction, is the radiant flux in the specified direction per unit solid angle per unit projected area of the surface (after Kirk 1994).
“Then, Irradiance, E, can be expressed as:
E =dΦ/dS = L(θ,φ) dS cos θ dω/dS = = L(θ,φ) cos θ dω. The total downward irradiance
at that point in the surface is obtained by integrating with respect to solid angle over the
whole upper hemisphere:
Ed
= L(",#)cos"d2$
% & (6.7)
The scalar irradiance, E0, is the integral of the radiance distribution at a point over all

104
directions about that point:
E0
= L(",#)d4$
% & (6.8)
Scalar irradiance is thus a measure of the radiant intensity at a point, which treats
radiation from all directions equally. In the case of irradiance, on the other hand, the
contribution of the radiation flux at different angles varies in proportion to the cosine of
the zenith angle of incidence of the radiation: a phenomenon based on purely geometrical
relations (Figure 6.1, eqn. 6.9) and sometimes referred to as the Cosine Law. The
downward scalar irradiance, E0d, is the integral of the radiance distribution over the upper
hemisphere” (Kirk 1994, pp. 9 – 10):
E0d
= L(",#)d2$
% & (6.9)
Because the object of my study is to estimate the amount of light reaching the
bottom, or benthos, the parameter of concern is the average cosine, µ, in the downward
direction, µd. Again, quoting Kirk (1994, p. 10), “The average cosine for downwelling
light, µd, at a particular point in the radiation field, may be regarded as the mean value, in
an infinitesimally small volume element at that point in the field, of the cosine of the
zenith angle of all the downwelling photons in the volume element. It can be calculated
by summing (i.e., integrating) for all elements of solid angle (dω) comprising the upper
hemisphere, the product of the radiance in that element of solid angle and the value of cos
θ (i.e. L(θ,φ) cos θ), and then dividing by the total radiance originating in that
hemisphere”:
µd =
Ed
E0d
=
L(",#)cos"d$2%
&
L(",#)d$2%
& (6.10)

105
Thus, µd is related to the cosine of the zenith angle as the downward irradiance at a point
compared to the radiance distribution over the upper hemisphere. Consequently, µd is
also called the average cosine for downwelling light and is unitless. The average cosine
of light describes the angular structure of the light field ranging from collimated light
plane perpendicular to the surface, where the zenith angle (θ) is 0 (cos 0 = 1 and thus µd =
1) to maximally diffuse light, where θ = 90°(cos 90 = 0 and thus µd = 0). Multispectral Kd
and µd can be estimated or modeled from single-wavelength estimates of ag and b using
Hydrolight© (version 5). The ratio of in lab measurements of total absorption, at, to
independently measured, in situ Kd is an estimate of the average cosine of light, µ,
µ = at/Kd (6.11)
(Kirk 1994).
Except when the single-scattering albedo is very low (less than 0.1), which only
occurs in very clear oceanic water at long wavelengths (greater than 650nm), scattering
dominates µd. Otherwise the effect of absorption dominates µd: light that does not have
the shortest pathlength is more rapidly removed (absorbed), so that the light that is
traveling vertical to the surface of the water penetrates most deeply; secondarily scattered
light results in increase of light in the forward direction, leaving the underwater light field
more vertical and making µd closer to 1 (Berwald et al. 1995; Kirk 1994).
For optically clear waters, where absorption dominates light attenuation, µd will
be close to one for the entire depth profile and at infinite depths µd would be close to one
as well, consistent with the absorption effect. Thus, light becomes more vertical or
collimated at deeper depths, and µd increases (becomes closer to unity). In more highly

106
scattering, low absorbing waters, scattering plays a greater role, light becomes more
diffuse and µd decreases (deviates from unity).
6.4. Results and Discussion
Table 6.1 compares calculated estimates of Kd and µd at 330 nm (Kd330nm) using
Hydrolight© (version 5), laboratory measurements of absorption, in situ measurements of
scattering (b), as well as other meteorological and optical parameters for KL6m and
Algae Reefs. µd can also be estimated as the ratio of measured total absorption coefficient
(at) to modeled Kd (see Eqn. 6.5). Comparing modeled (Hydrolight©- derived) µd between
sites, modeled µd was lower at the reef site with the lower ag, developed shoreline –
associated KL6m Reef (Table 6.1, Table 6.2, Figure 6.2), showing that the light field is
more diffuse at KL6m Reef compared to intact shoreline – associated Algae Reef. In
addition, modeled reflectance, R, was also consistently higher at KL6m (Table 6.3).
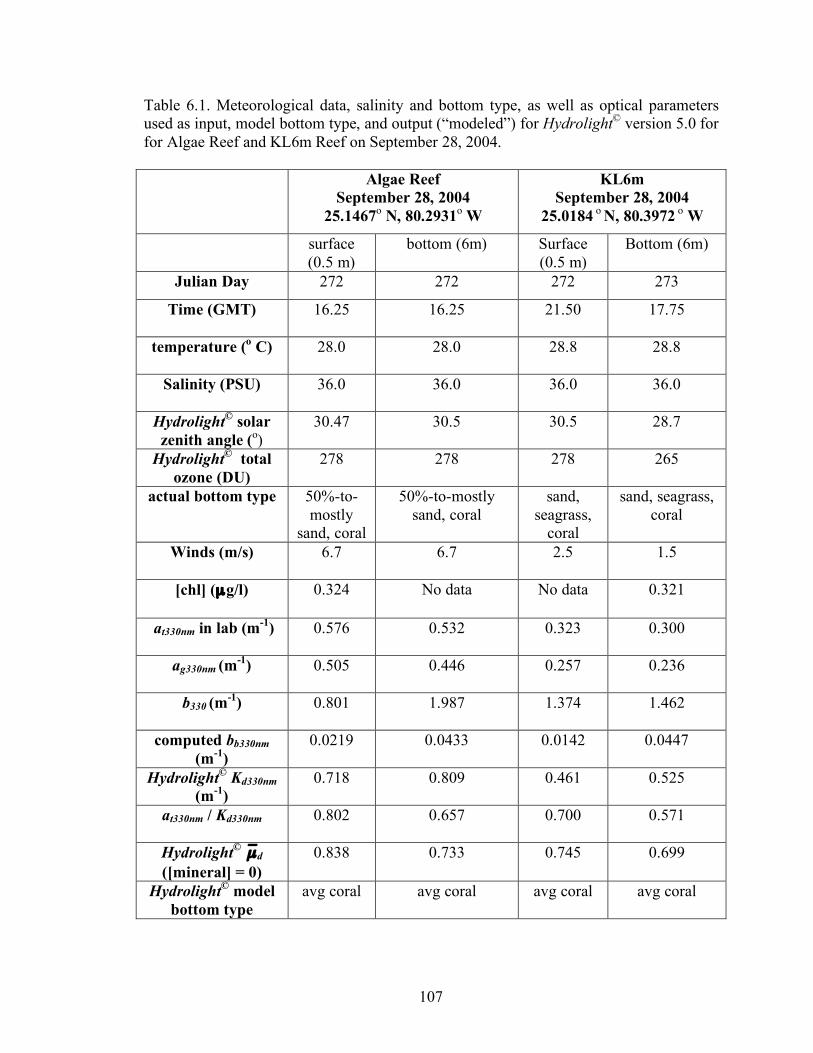
107
Table 6.1. Meteorological data, salinity and bottom type, as well as optical parameters used as input, model bottom type, and output (“modeled”) for Hydrolight© version 5.0 for for Algae Reef and KL6m Reef on September 28, 2004. Algae Reef
September 28, 2004 25.1467o N, 80.2931o W
KL6m September 28, 2004
25.0184 o N, 80.3972 o W
surface (0.5 m)
bottom (6m) Surface (0.5 m)
Bottom (6m)
Julian Day 272 272 272 273
Time (GMT) 16.25 16.25 21.50 17.75
temperature (o C) 28.0 28.0 28.8 28.8
Salinity (PSU) 36.0 36.0 36.0 36.0
Hydrolight© solar zenith angle (o)
30.47 30.5 30.5 28.7
Hydrolight© total ozone (DU)
278 278 278 265
actual bottom type 50%-to-mostly
sand, coral
50%-to-mostly sand, coral
sand, seagrass,
coral
sand, seagrass, coral
Winds (m/s) 6.7 6.7 2.5 1.5
[chl] (µg/l) 0.324 No data No data 0.321
at330nm in lab (m-1) 0.576 0.532 0.323 0.300
ag330nm (m-1) 0.505 0.446 0.257 0.236
b330 (m-1) 0.801 1.987 1.374 1.462
computed bb330nm (m-1)
0.0219 0.0433 0.0142 0.0447
Hydrolight© Kd330nm (m-1)
0.718 0.809 0.461 0.525
at330nm / Kd330nm 0.802 0.657 0.700 0.571
Hydrolight© µd ([mineral] = 0)
0.838 0.733 0.745 0.699
Hydrolight© model bottom type
avg coral avg coral avg coral avg coral

108
Figure 6.2. Comparison of µd for Algae and KL6m Reef surface and bottom at 305, 320, 330 and 380 nm. µd at Algae Reef is higher at all wavelengths than at KL6m, at the surface as well as bottom. See Table 6.3 for values and 25th – 75th percentile ranges.
Table 6.2. Comparison of µd for Algae and KL6m Reef surface and bottom at 305, 320, 330 and 380 nm. Medians and 25th – 75th percentile ranges.
µd Algae surface KL6m surface Algae bottom KL6m bottom 305 nm 0.84650 0.72930 0.73580 0.69470 320 nm 0.83970 0.72480 0.72930 0.69360 330 nm 0.83830 0.76625 0.73370 0.69840 380 nm 0.83020 0.77305 0.73720 0.72640
median 0.83900 0.74778 0.73475 0.69655 25th percentile 0.836275 0.728175 0.7326 0.694425 75th percentile 0.8414 0.76795 0.73615 0.7054
Table 6.3. Inherent and Apparent Optical Properties (IOPs and AOPs) computed by Hydrolight© (version 5) for Algae and KL6m Reef, surface and bottom, at 305, 320, 330

109
and 380 nm, based upon in situ absorption, a, and scattering, b. m_bar_d = µd. . Ed for Algae and KL6m Reef, surface and bottom, as computed by Hydrolight © (version 5), was higher at the surface but lower at the bottom at Algae Reef.
Although Ed was not appreciably different at the surface comparing KL6m Reef
and Algae Reef, downwelling irradiance reaching the bottom, Ed6m, was consistently one
order of magnitude higher at KL6m Reef than at Algae Reef, and this effect increased
with decreasing wavelength, due to the combined effect of lower ag and lower µd at
KL6m Reef relative to Algae Reef (Figs. 6.3, 6.4, Table 6.4).

110
Figure 6.3. Although modeled Ed at the surface was not very different at Algae Reef compared to KL6m, due to lower ag and lower µd at the bottom, Ed at the bottom was approximately an order of magnitude higher at KL6m compared to Algae Reef (see Table 6.2). Because ag was lower at KL6m Reef than Algae Reef for all sampling dates (2004 –
2007) (for example, ag 330, Figure 6.4, Table 6.3), these results for µd for one day in
September 2004, where ag was lower at KL6m Reef, can be considered generally
representative for these sites. Sources of error include measurement of ap and ag (see
Chapter 3), sky conditions, and in situ scattering (b).

111
Figure 6.4. ag 330 at Algae and KL6m Reefs, surface and bottom, for all sampling dates from 2004 – 2007. ag 330 was lower at KL6m than Algae Reef, considering surface and bottom samples separately. Dashes represent medians. Table 6.4. Medians and 25th – 75th percentile ranges for ag 330 at Algae and KL6m reefs, surface and bottom, for all sampling dates from 2004 – 2007.
ag 330 median 25th – 75th percentile range Algae surface 0.313 0.291 – 0.374 KL6m surface 0.211 0.184 – 0.272 Algae bottom 0.296 0.266 – 0.364 KL6m bottom 0.203 0.177 – 0.232
6.5. Conclusions
Higher diffuseness of the light field (lower µd) increases the amount of UV
irradiance reaching the corals, beyond the increase in scattering with decreasing
wavelength according to λ-4.32 (Kirk 1994). Particle scattering by phytoplankton, detritus
or minerals also increases with decreasing wavelength (Gregg 2002). This study shows

112
that UVR reaching the benthos can be higher at reefs with lower ag due to both the lower
absorptivity and higher diffuseness of light, and these effects increase with decreasing
wavelength. Fisher et al. (2007) reported that lesion recovery in corals, which is a
bioindicator of coral condition, was significantly faster at Algae Reef, where ag, as well
as ap (absorption due to particulate material, ap = at - ag) (Table 6.1), are greater than at
KL6m reef. Thus, the recovery of corals from physical damage may be enhanced under
lower UV conditions.
A typical value for µd at 400 nm for natural waters illuminated by sun and sky is
0.71 (Mobley 1994, p. 551). At lower wavelengths µd would be lower. Thus, to check the
accuracy of at330nm / Kd330nm in estimating µd, at 330 nm, one can multiply by
approximately a value lower than 0.71, because µd decreases as wavlength decreases.
However, because at330nm / Kd330nm is already lower than modeled µd, there is either an
error (underestimation) in measuring at330nm, an error (overestimation) in modeled
Kd330nm, or an error (overestimation) in modeling µd. It is not likely that ap has been
underestimated, because typically, it is overestimated due to scattering in the cuvette or in
the filter pad (see Chapter 3). The error in modeling the apparent optical properties
Kd330nm and µd, which are dependent upon the angular structure of the light field as well
as the components of the water column, therefore may be due to sky conditions.
Thus, differences in actual versus modeled cloud cover could also account for some
of the difference between modeled and measured µd (see Table 6.1, at330nm / Kd330nm
compared to µd). Modeled µd is consistently higher than measured µd. Modeled µd
accounts for sky conditions, while measured µd does not. In the case of increased cloud
cover, light is scattered through the atmosphere and the incident light on the ocean
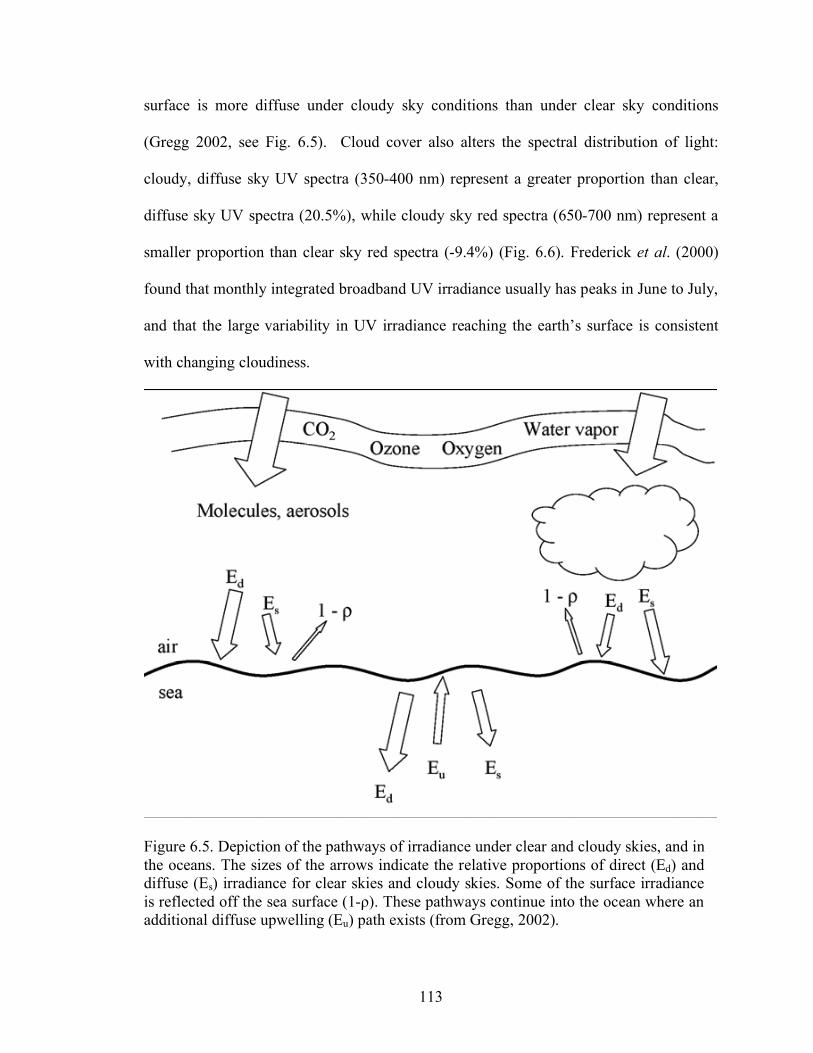
113
surface is more diffuse under cloudy sky conditions than under clear sky conditions
(Gregg 2002, see Fig. 6.5). Cloud cover also alters the spectral distribution of light:
cloudy, diffuse sky UV spectra (350-400 nm) represent a greater proportion than clear,
diffuse sky UV spectra (20.5%), while cloudy sky red spectra (650-700 nm) represent a
smaller proportion than clear sky red spectra (-9.4%) (Fig. 6.6). Frederick et al. (2000)
found that monthly integrated broadband UV irradiance usually has peaks in June to July,
and that the large variability in UV irradiance reaching the earth’s surface is consistent
with changing cloudiness.
Figure 6.5. Depiction of the pathways of irradiance under clear and cloudy skies, and in the oceans. The sizes of the arrows indicate the relative proportions of direct (Ed) and diffuse (Es) irradiance for clear skies and cloudy skies. Some of the surface irradiance is reflected off the sea surface (1-ρ). These pathways continue into the ocean where an additional diffuse upwelling (Eu) path exists (from Gregg, 2002).

114
Figure 6.6. Spectral surface irradiance just below the sea surface (after spectral surface reflectance) for clear skies and cloudy skies. The cloudy sky simulation represents the effects of 80 g m-2 liquid water path, which produces about half the total surface solar irradiance as the clear sky model for the same solar zenith angle and atmospheric optical properties (from Gregg 2002).
Because cloudy, diffuse sky conditions present a greater amount of irradiance to
the surface than clear, diffuse sky conditions (Gregg 2002), corals at the benthos “see”
relatively higher intensity low wavelength, more damaging UVR. Thus, the danger of
photo-oxidative stress is potentially greater (Lesser and Farrell 2004) under cloudy,
diffuse sky conditions compared to clear, diffuse sky conditions (Fig. 6.6).
In conclusion, the spectral quality of light reaching the benthos on coral reefs is
affected by atmospheric variables (clouds, aerosols) as well as by water column
properties (pathlength, absorption and scattering by minerals, phytoplankton, and
CDOM). Understanding the variables affecting the diffuse nature of light is important in

115
studying the effects of solar radiation on coral reef biota. Observations of the coincidence
of maximum bleaching with maximum solar radiation in the Keys, especially UV
radiation, found in my study (Chapters 3, 4, and 5) indicate the necessity of
understanding radiative transfer processes, including apparent optical properties such as
µd.
The cumulative effects of high irradiance over the course of the summer increase
coral reef susceptibility to photo-oxidative stress when later summer temperatures peak.
Atmospheric and water column effects on the diffuseness of the underwater light field
may exacerbate incident solar and temperature stress. Algae Reef, the intact shoreline,
higher ag associated reef, was characterized by higher ag and µd and lower Ed bottom. Thus,
these results agree those presented previously (see Chapters 3, 4 and 5). Diffuseness
increases with decreasing wavelength (Kirk 1994). The results in this chapter show that
increased diffuseness may cause increase in short wavelength solar radiation reaching the
benthos. In conclusion intact shoreline can be an important source of CDOM, protecting
coral reefs from photooxidative stress.

116
Chapter 7. Conclusions and Future Research 7.1. Conclusions
Coral reefs have long been characterized by their remarkable productivity and
diversity while thriving in the clearest, most nutrient-poor oceanic regions (e.g., Odum
and Odum 1955; Wells 1957). Thus, a major paradox of the response of Florida’s coral
reefs to ongoing environmental change is that offshore reefs have declined much faster
than inshore reefs (Somerfield et al. 2008).
Coral disease and bleaching are considered among the most important causes of
decline in coral populations and percent coral cover on reefs. Mass coral bleaching is so
strongly correlated with elevated temperature that NOAA has developed a hotspot
bleaching warning system (http://coralreefwatch.noaa.gov/satellite/methodology/
methodology.html). Yet the physiological mechanism of bleaching is actually photo-
oxidative stress (Lesser 2006). This means that sunlight is required for bleaching to
occur. Fitt and Warner (1995) and others have shown that shorter wavelengths of light,
either visible or UV, trigger bleaching at lower temperatures than does higher wavelength
visible light.
Thus, the underlying goal that prompted my study is to provide evidence that can
help to resolve the paradox of why coral populations, in what historically were the best
environments, have declined the fastest over the past several decades. My working
hypothesis is that CDOM in reef waters can protect corals from the photic component of

117
photo-oxidative stress that causes mass bleaching, and that human activities have resulted
in reduced CDOM concentrations in reef-tract waters.
Major ways that human activities have influenced CDOM distributions in coastal
waters is by widespread alteration of watersheds and coastlines, including removal of
coastal vegetation and changes in coastal hydrology (e.g., construction of causeways
between islands in south Florida). An undeveloped watershed slowly releases its colored
(i.e., higher CDOM) freshwater; a developed watershed sheds more and muddier runoff
during the rainy season, and minimal runoff during the dry season. This is in contrast
with undeveloped shorelines with coastal hammocks and mangroves, which trap
sediments coming from both land and offshore, while releasing CDOM with every tidal
cycle. While increased CDOM can be photoprotective, sediments, which can smother and
block visible light needed for photosynthesis from corals, are not beneficial to coral reefs.
Therefore when coastal vegetation is replaced by seawalls and urban or agricultural
development, depending upon local weather, coastal waters are alternatively more turbid
and more transparent, properties that are stressful for corals and other benthic organisms.
Thus, undeveloped and intact shorelines with mangrove and coastal hammocks can
support coral reefs by supplying photoprotection via CDOM and reducing smothering
and blocking of visible light by sediments.
My study investigated distribution of CDOM in waters of the Florida reef tract. In
general, UV-absorbing CDOM was more prevalent on inshore reefs and reefs near intact
shorelines, compared to offshore reefs and reefs with developed shorelines. Intact
shoreline – associated reefs and inshore reefs were characterized by lower photic stress as
illustrated by lower production of UV-absorbing substances in the water column, lower

118
UVR reaching the benthos, lower rates of CDOM photobleaching and higher percent
coral cover compared to developed shoreline – associated reefs and offshore reefs.
Individual findings can be summarized as follows:
1. In reef areas near intact shoreline, where mangroves are a major source
of CDOM, absorption due to CDOM (ag) decreases going offshore from
mangrove coastline to ocean waters beyond the reef. Absorption due to
CDOM in the UV (ag UV) is higher at inshore reefs compared to offshore
reefs, for example, absorption due to CDOM at 320 nm (ag 320) at
offshore reefs is only 64% of that at inshore reefs.
2. CDOM is the major attenuator of UVR: for all reefs sampled, ag UV/at UV
ranged from 62% at 380 nm to 91% at 305 nm; over the course of each
summer ag UV/at UV decreased, likely due to photobleaching of CDOM.
3. In very shallow waters, less UVR is reaching the bottom at intact
shoreline-associated reefs compared to developed shoreline – associated
reefs.
4. Considering inshore and offshore reefs together, ag UV is higher in the
Lower Keys, which are characterized by larger amounts of mangrove
coastline, and Middle Keys, which receive CDOM – rich water inputs
from Florida Bay, compared to the Upper Keys.
5. The attenuation coefficient for downwelling irradiance in the UV (Kd
UV) is higher at inshore reefs compared to offshore reefs, while the
difference in Kd PAR between inshore and offshore reefs is not as great.

119
6. Considering each site individually, for the CREMP sites sampled in
2006 and 2007, on a 3 - tiered scale of low to high coral cover and low
to high ag 320, the predominant combination is low % stony coral cover
accompanied by low ag 320. Percent stony coral cover as well as ag 320
were generally higher at inshore reefs compared to offshore reefs
7. Relative expression of the UV - absorbing MAAs was lower at intact
shoreline-associated reefs compared to developed shoreline-associated
reefs and tended to be lower at inshore reefs compared to offshore reefs.
8. Considering the Florida Keys by region, relative MAA expression was
higher in the Upper Keys compared to the Lower Keys, at the same
time ag 320 was lower in the Upper Keys compared to the Lower Keys
and Middle Keys.
9. Spectral slope, S, was higher in offshore reef waters, indicating
extensive photobleaching of CDOM, compared to inshore reefs.
10. Diffuseness of the underwater light field increases the probability of
light exposure for benthic organisms. Diffuseness was lower at the
higher CDOM, intact - shoreline associate reef compared to the
developed shoreline – associated reef.
Thus, all of the measured parameters indicate that the inshore reefs,
especially those near undeveloped shoreline, are more photo-protected by CDOM
than are more developed shoreline and offshore reefs, consistent with my working
hypothesis.

120
The results of this study show that intact shoreline such as mangroves, and other
terrestrial sources of CDOM, such as wetlands influencing Florida Bay, play an important
role in limiting photo-oxidative stress on Florida Keys reefs. Increasing restrictions on
shoreline development to preserve mangrove sources of CDOM to reef-tract waters, and
protecting wetlands that through estuaries, bays, and rivers may provide CDOM-rich
waters to the reef tract, are an important strategy for reducing photo-oxidative stress and
thus increasing resiliency of coral reefs.
The Florida reef tract is well-monitored, but monitoring in itself has not slowed
the decline of coral populations. Increased focus on protection of CDOM sources will
enhance efforts to protect Florida’s coral reefs, and coral reefs worldwide, from
degrading in the face of ocean warming and acidification projected for the future (Hoegh-
Guldberg et al. 2007, Baker et al. 2008).
7.2 Future research
To further quantify the role of mangroves and other terrestrial sources of CDOM
in protecting coral reefs, controlled lab experiments should continue to study CDOM
breakdown rates and processes in response to increasing temperature and acidification.
Moreover, ecosystem – based studies should more closely examine the role of CDOM
(ag) in coral reef health as expressed by indicators of coral health, such as coral cover,
disease and bleaching. Sources of CDOM can be quantified using fluorescence
spectroscopy and fluorescence Excitation – Emission Matrices (EEMS) (Moran et al.
1991, Coble 2007).

121
In addition to local management and monitoring, global networking and
monitoring is essential to protecting reefs for the future. Satellite sensors that can
measure UVR and CDOM for large spatial areas are planned for future deployment, and
algorithms for shallow, reflective coastal waters are continually being improved. The
spectral slopes found in this study can be used with existing satellite measurements of
PAR irradiance to estimate UVR in these coastal regions, where satellite images are
difficult to correct due to bottom reflectance (Lee et al. 1998). With cooperation between
optical, physical, and biological oceanographers, current products can be improved and
expanded upon, so that, hopefully, the delicate balance of coral reefs and other ocean
ecosystems can be maintained.

122
References
Acra A, Jurdi M, Mu'allem H, Karahagopian Y, Raffoul Z (1990) Water Disinfection by Solar Radiation: Assessment and Application. International Development Research Centre (IDRC - Canada). http://almashriq.hiof.no/lebanon/600/610/614/solarwater/idrc/01-09.html Akella S, Uher G (2006) Quantification of CDOM and FDOM photobleaching rates in UK coastal waters. Geophysical Research Abstracts, Vol. 8, 00593, © European Geosciences Union 2006 Alonso C, Rocco V, Barriga JP, Battini MA, Zagarese H (2004) Surface avoidance by
freshwater zooplankton: field evidence on the role of ultraviolet radiation. Limnol Oceanogr 49(1):225-232
Aluwihare LI, Repeta DJ, Pantoja S, Johnson, CG (2005) Two chemically distinct pools of organic nitrogen accumulate in the ocean. Science 308(5724):1007-1010
Anderson S, Zepp R, Machula J, Santavy D, Hansen L, Mueller E (2001) Indicators of UV exposure in corals and their relevance to global climate change and coral bleaching. Human and Ecological Risk Assessment 7(5):1271-1282
Atwood DK, Hendee JC, Mendez A (1992) An assessment of global warming stress on Caribbean coral reef ecosystems. Bull Mar Sci 51:118-130
Ayoub LM, Hargreaves BR, Morris DP (1997) UVR attenuation in lakes: relative contributions of dissolved and particulate material. Society of Photographic Instrumentation Engineers (SPIE) – The International Society for Optical Engineering 2963: 338-343
Baker AC, Glynn PW, Riegl B (2008) Climate change and coral reef bleaching: An ecological assessment of long-term impacts, recovery trends and future outlook. Estuar Coast Shelf Sci 80:435-471
Banaszak AT, Lesser MP (1995) Survey of mycosporine-like amino acids in macrophytes of Kane'ohe Bay. In Ultraviolet Radiation and Coral Reefs, D. Gulko and P. L. Jokiel (eds.). Sea Grant Cooperative Report. Hawaii Institute of Marine Biology Technical Report Number 41:171-179
Banaszak AT, Trench RK (1995a) Effects of ultraviolet (UV) radiation on marine microalgal- invertebrate symbioses. I. Response of the algal symbionts in culture and in hospite. J Exp Mar Biol Ecol 194:213-232
Banaszak AT, Trench RK (1995b) Effects of ultraviolet (UV) radiation on marine microalgal-invertebrate symbioses. II. The synthesis of mycosporine-like amino acids in response to UV in Anthopleura elegantissima and I Cassiopeia xamachana. J Exp Mar Biol Ecol 194:233-250
Banaszak AT, Lesser MP, Kuffner IB, Ondrusek M (1998) Relationship between ultraviolet (UV) radiation and mycosporine-like amino acids (MAAs) in marine organisms. Bull Mar Sci 63:617-628
Belzile C, Vincent WF (2002) Contribution of absorption and scattering to the attenuation of UV and photosynthetically available radiation in Lake Biwa,

123
Limnol Oceanogr 47(1):95-107 Berkelmans R, Dersquoath G, Kininmonth S, Skirving WJ (2004) A comparison of the
1998 and 2002 coral bleaching events on the Great Barrier Reef: spatial correlation, patterns, and predictions. Coral Reefs 23(1):74-83
Berwald, J., Stramski, D., Mobley, C.D., Kiefer, D.A. 1995. Influences of absorption and scattering on vertical changes in the average cosine of the underwater light field. Limnol Oceanogr 40(8):1347-1357
Birkeland C (2004) Ratcheting down the coral reefs. Bioscience 54(11):1021-1027 Black NA, Voellmy R, Szmant AM (1995) Heat shock protein induction in
Montastraea faveolata and Aiptasia pallida to elevated temperatures. Biol Bull 188:234–240
Blough NV, Del Vecchio R (2002) Chromophoric DOM in the coastal environment. In: Hansell DA, Carlson CA (eds) Biogeochemistry of Marine Dissolved Organic Matter. Academic Press, San Diego, pp 509-546
Booth RR, Madronich S (1994) Radiation amplification factors: improved formulation accounts for large increases in ultraviolet radiation associated with Antarctic ozone depletion. In Weiler CS, Penhale PA, (eds) Ultraviolet radiation in Antarctica: measurements and biological effects. American Geophysical Union Antarctic Research Series 62, pp 39-42
Boss E, Zaneveld JRV (2003) The effect of bottom substrate on inherent optical properties: Evidence of biogeochemical processes. Limnol Oceanogr 48(1, part 2): 346–354 Brown BE (1997) Coral bleaching: causes and consequences. Coral Reefs 16:S129-S138 Bryant D, Burke L, McManus J, Spalding M (1998) Reefs at Risk: A map-based
indicator of potential threats to the world’s coral reefs. World Resources Institute, Washington, D.C.
Buddemeier RW (2001) Is it time to give up? Bulletin of Marine Science 69(2):317-326. Burdige DJ, Kline SW, Chen W (2004) Fluorescent dissolved organic matter in marine sediment pore waters. Mar Chem 89:289-311 Carder KL, Steward RG, Paul JH, Vargo GA (1986) Relationships between chlorophyll and ocean color constituents as they affect remote-sensing reflectance models. Limnol Oceanogr 31:403-412 Carder KL, Steward RG, Harvey GR, Ortner PB (1989) Marine humic and fulvic acids:
their effects on remote sensing of ocean chlorophyll. Limnol Oceanogr 34(1): 68-81
Callahan M, Wheaton J, Beaver C, Brooke S, Johnson D, Kidney J, Kupfner S, Porter JW, Meyers M, Wade S, Colella M, Bertin M (2006) CREMP Executive Summary EPA Steering Committee Meeting July 2007, Florida Fish and Wildlife
Conservation Commission, Fish and Wildlife Research Institute Clark ED (2001) Ozone depletion and global climate change: linkages and interactive
threats to the cetacean environment, in International Whaling Commission Scientific Committee, July 2001, International Whaling Commission
Coble PG (2007) Marine Optical Biogeochemistry: The Chemistry of Ocean Color. Chem Rev 107:402- 418 Coble PG, Del Castillo CE, Avril B (1998) Distribution and optical properties of CDOM in the Arabian Sea during the 1995 Southwest Monsoon. Deep-Sea Res Part II 45:2195-2223

124
Cullen JJ, Neale PJ (1997) Biological weighting functions for describing the effects of ultraviolet radiation on aquatic systems. In: D-P Hader (ed) Effects of ozone depletion on aquatic ecosystems. RG Landes, Austin, pp 97-118
Danielsen F, Sorensen MK, Olwig MF, Selvam V, Parish F, Burgess ND, Hiraishi T, Karunagaran VM, Rasmussen MS, Hansen LB, Quarto A, Suryadiputra N (2005) The Asian tsunami: a protective role for coastal vegetation. Science 310:643
Del Castillo C (2005) Remote sensing of organic matter in coastal waters. In Miller FL, Del Castillo E, McKee BA (eds) Remote sensing of coastal aquatic environments: technologies, techniques, and applications. Springer, Dordrecht, pp 157-180
Del Vecchio R, Blough NV (2002) Photobleaching of chromophoric dissolved organic matter in natural waters: kinetics and modeling. Mar Chem 78: 231-253
Del Vecchio R, Blough NV (2004a) Spatial and seasonal distribution of chromophoric dissolved organic matter and dissolved organic carbon in the Middle Atlantic Bight Mar Chem 89:169-187
Del Vecchio R, Blough NV (2004b) On the Origin of the Optical Properties of Humic Substances. Environ Sci Technol 38(14):3885–3891
Dight IJ, Scherl LM (1997) The international coral reef initiative (ICRI): Global priorities for the conservation and management of coral reefs and the need for partnerships. Coral Reefs 15(Suppl.): S319-S147
Dunlap WC, Chalker BE, Oliver JK (1986) Bathymetric adaptations of reef-building corals at Davies Reef, Great Barrier Reef, Australia: III. UV-B absorbing
compounds. J Exp Mar Biol Ecol 104: 239–248 Dunlap WC, Yamamoto Y (1995) Small-molecule antioxidants in marine organisms:
antioxidant activity of mycosporine-glycine. Comp Biochem Physiol 112B:106– 114
Dunlap WC, Shick JM (1998) Ultra-violet radiation-absorbing mycosporine-like amino acids in coral reef organisms: a biochemical and environmental perspective. J Phycol 34: 418-430
Eakin CM, McManus JW, Spalding MD, Jameson SC (1997) Coral reef status around the world: Where do we go from here? Proceedings, 8th International Coral Reef Symposium, Panama, June 24-29, 1996, I:277-282
Fabricius K, Mieog JC, Colin PL, Idip D, Van Oppen, MJH (2004) Identity and diversity of coral endosymbionts (zooxanthellae) from three Palauan reefs with contrasting
bleaching, temperature and shading histories. Mol Ecol 13(8): 2445-2458 Fine M, Banin, E, Israely T, Rosenberg E, Loya Y (2002) Ultraviolet radiation prevents
bleaching in the Mediterranean coral Oculina patagonica. Mar Ecol Prog Ser 226: 249-254
Finkel ZV, Irwin AJ (2001) Light absorption by phytoplankton and the filter amplification correction: cell size and species effects. J Exp Mar Biol Ecol 259(1): 51-61
Fisher EM (2007) Assessing the health of coral reef ecosystems in the Florida Keys at community, individual, and cellular scales. Ph.D. thesis, University of South Florida.
Fisher EM, Fauth JE, Hallock P, Woodley CM (2007) Lesion regeneration rates in reef – building corals (Montastraea spp.) as indicators of colony condition: strengths and caveats. Mar Ecol Prog Ser 339:61-71
Fitt W, Brown B, Warner M, Dunne R (2001) Coral bleaching: interpretation of thermal

125
tolerance limits and thermal thresholds in tropical corals. Coral Reefs 20:51-65 Fitt WK, Warner ME (1995) Bleaching patterns of four species of Caribbean reef corals.
Biol Bull 189:298-307 Frederick JE, Slusser JR, Bigelow DS (2000) Annual and interannual behavior of solar ultraviolet irradiance revealed by broadband measurements. Photochem Photobiol 72(4): 488-496 Frenette JJA, Arts MTA, Morin JA (2003) Spectral gradients of downwelling light in a
fluvial lake (Lake Saint-Pierre, St-Lawrence River). Aquat Ecol 37(1):77-85 Gleason DF, Wellington GM (1993) Ultraviolet radiation and coral bleaching. Nature
365:836-838 Gleason DF, Wellington GM (1995) Composition of ultraviolet light absorbing compounds in adults and larvae of Caribbean reef corals. Am Zool 33:18A Glossary of Meteorology (2000). American Meteorological Society. 885 pp, or
http://amsglossary.allenpress.com/glossary/browse Glynn PW (1996) Coral reef bleaching: facts, hypotheses and implications. Global
Change Biology 2: 495-509 Goes J, Handa N, Taguchi S, Hama T (1995) Changes in the patterns of biosynthesis and
composition of amino acids in a marine phytoplankter exposed to ultra-violet-b radiation: nitrogen limitation implicated. J Photochem Photobiol 62:703-710.
Goreau TJ, Hayes RL (1994) Coral bleaching and ocean ‘hot spots’. Ambio 23: 176-180 Goreau T, McClanahan T, Hayes R, and Strong A (2000) Conservation of Coral Reefs
after the 1998 Global Bleaching Event. Conservation Biology 14(1): 5-15 Graves GA, Wan Y, Fike DL (2004) Water quality characteristics of storm water from
major land uses in South Florida. Journal of the American Water Resources Association. December 2004:1405-1419
Gregg, W.W., 2000. A coupled ocean general circulation, biogeochemical, and radiative model of the global oceans: seasonal distributions of ocean chlorophyll and nutrients. NASA Technical Memorandum 2000-209965, 33pp. (Available online from anonymous ftp at salmo.gsfc.nasa.gov, directory location pub/outgoing/reprints/nasatm2000.pdf) Gulko D (1995) The ultraviolet radiation environment of Kane’ohe Bay, O’ahu. In:
Gulko D, Jokiel PL (eds) Ultraviolet radiation and coral reefs. HIMB Technical Report #41. UNIHI-Sea Grant-CR-95-03
Haeder D, Kumar H, Smith R, Worrest R (1998) Effects on aquatic ecosystems. J Photochem Photobiol B: Biol 46:53-68 Haeder DP, Kumar HD, Smith RC, Worrest RC (2003) Aquatic ecosystems: effects of
solar ultraviolet radiation and interactions with other climatic change factors. J Photochem Photobiol 2(1):39-50
Hallock P, Williams DE, Toler SK, Fisher EM, Talge HK (2006a) Bleaching in reef- dwelling foraminifers: implications for reef decline. Proc 10th Int Coral Reef Symp 1:729-737
Hallock P, Williams DE, Fisher EM, Toler SK (2006b) Bleaching in Foraminifera with algal symbionts: implications for reef monitoring and risk assessment. Anuário do Instituto de Geosciências - UFRJ 29(1):108-128
Hoegh-Guldberg O (1999) Climate change, coral bleaching and the future of the world’s coral reefs. Mar Freshw Res 50:839-66
Hoegh-Guldberg O, Mumby PJ, Hooten AJ, Steneck RS, Greenfield P, Gomez E, Harvell

126
CD, Sale PF, Edwards AJ, Caldeira K, Knowlton N, Eakin CM, Iglesias-Prieto R, Muthiga N, Bradbury RH, Dubi A, Hatziolos ME (2007) Coral reefs under rapid climate change and ocean acidification. Science 318:1737-1742 Hofmann DJ, Montzka SA (2009) Recovery of the ozone layer: the ozone-depleting gas
index. EOS 90(1):1-12 Holm-Hansen O, Riemann B (1978) Chlorophyll a determination: improvements in methodology. Oikos 30:438-447 Hoogenboom MO, Anthony KRN, Connelly SR (2006) Energetic cost of photoinhibition in corals. Mar Ecol Prog Ser 313:1-12 http://denali.gsfc.nasa.gov/research/so2/article.html http://www.photobiology.info/Hader.html http://www.unep.org/OZONE/Public_Information/eeapfaq2002.pdf Huot Y, Jeffrey WH, Davis RF, Cullen JJ (2000) Damage to DNA in bacterioplankton: a
model of damage by ultraviolet radiation and its repair as influenced by vertical mixing. Photochem Photobiol 72(1):62-74
Huot Y, Babin M, Bruyant F, Grob C, Twardowski MS, Claustre H (2007) Does chlorophyll a provide the best index of phytoplankton biomass for primary productivity studies? Biogeosciences Discussions 4(2):707-745
Iglesias-Prieto R, Matta JL, Robins WA, Trench RK (1992) Photosynthetic response to elevated temperature in the symbiotic dinoflagellate Symbiodinium microadriaticum in culture. Proc Natl Acad Sci USA 89:10302-10305
Jaffe R, Boyer JN, Lu X, Maie N, Yang C, Scully NM (2004) Source characterization of dissolved organic matter in a mangrove dominated estuary by fluorescence analysis. Mar Chem 84:195-210
Johns E, Ortner PB, Lee TN (2006) Circulation and Exchange of Florida Bay and South Florida Coastal Waters: Interdisciplinary Coastal Ocean Observations in the
Florida Keys National Marine Sanctuary with Real-time Data Links in http://floridakeys.noaa.gov/research_monitoring/circulation_exchange.pdf Johnson FS, Mo T, Green AE (1976) Mean latitudinal ultraviolet radiation at the earth's
surface. Photochem Photobiol 23:179-188 Jokiel PL, York HR (1982) Solar ultraviolet photobiology of the reef coral Pocillopora
damicornis and symbiotic zooxanthellae. Bull Mar Sci 32:301-315 Jokiel PL, Lesser MP, Ondrusek ME (1997) UV-absorbing compounds in the coral
Pocillopora damicornis: interactive effects of UV radiation, photosynthetically active radiation, and water flow. Limnol Oceanogr 42:1468-1473
Jones R, Hoegh-Guldberg O, Larkum AWL, Schreiber U (1998) Temperature-induced bleaching of corals begins with impairment of dark metabolism in zooxanthellae. Plant Cell Env 21:1219-30
Karentz D, Bothwell ML, Coffin RB, Hanson A, Herndl GJ, Kilham SS, Lesser, MP, Lindell M, Moeller RE, Morris DP, Neale PJ, Snaders RW, Weiler CS, Wetzel RG (1994) Impact of UV-B radiation on pelagic freshwater ecosystems: report of working group on bacteria and phytoplankton. Ergeb Limnol 43:31-69
Kawaguti S (1969) Effect of the green fluorescent pigment on the productivity of the reef corals. Micronesica 5:313
Kennish MJ (1999) Estuary restoration and maintenance: the National Estuary Program. CRC Press, Boca Raton. 359 pp Kieber RJ, Wiley JD, Whitehead RF, Reid SN (2007) Photobleaching of chromophoric
dissolved organic matter (CDOM) in rainwater. J Atmos Chem 58(3):219-235

127
Kim CS, Lim WA, Cho YC (2001) Mycosporine-like amino acids as the UV sunscreen with oxygen radical scavenging activity. Bull Nat Fish Res Dev Instit (Korea) 60: 65– 71
Kirk JTO (1994) Light and photosynthesis in aquatic ecosystems, 2nd ed. Cambridge University Press, Bristol. 509 pp
Klisch M, Haeder DP (2000) Mycosporine-like amino acids in the marine dinoflagellate Gyrodinium dorsum: induction by ultraviolet irradiation. J Photochem Photobiol B: Biol 55(2-3):178-182
Klisch M, Haeder DP (2008) Mycosporine-Like Amino Acids and Marine Toxins - The Common and the Different. Mar Drugs 6:147-163; DOI: 10.3390/md20080008
Knowlton N (2001) The future of coral reefs. Proc Natl Acad Sci USA 98: 5419-5425 Kopelevich OV, Lutsarev SV, Rodionov VV (1989) Light spectral absorption by yellow
substance of ocean water. Oceanology 29:409-414 Kuffner I, Ondrusek ME, Lesser M (1995) Horizontal and vertical distribution of
MAAs in Hawaiian corals; a depth profile and a survey. In ultraviolet radiation and coral reefs. Gulko, D. and Jokiel P.L. eds., University of Hawai’I, Hawai’I Institute of Marine Biology, Honolulu, Hawai’i Technical report no. 41. Dec. 1995. Sea Grant Publication UNIHI-Seagrant-CR-95-03
Laurion I, Blouin F, Roy S (2003) The quantitative filter technique for measuring phytoplankton absorption: Interference by MAAs in the UV waveband Limnol Oceanogr: Methods 1:1-9
Lee Z, Carder KL, Mobley CD, Steward RG, Patch JS (1998) Hyperspectral remote sensing for shallow waters. I. A semianalytical model. Appl Opt 37(27):6329-6338
Lee Z, Carder KL, Mobley CD, Steward RG, Patch JS (1999) Hyperspectral remote sensing for shallow waters. 2. Deriving bottom depths and water properties by optimization. Appl Opt 38:3831-3843
Lee TN, Rooth C, Williams E, McGowan M, Szmant A, Clarke ME (1992) Influence of Florida current, gyres and wind-driven circulation on transport of larvae and recruitment in the Florida Keys coral reefs. Cont Shelf Res 12(7/8):971-1002
Lee Z, Weidemann A, Kindle J, Arnone R, Carder KL, Davis C (2007) Euphotic zone depth: its derivation and implication to ocean-color remote sensing. J Geophys Res 112, C03009.11, doi:10.1029/2006JC003802
Lesser MP (1996) Elevated temperatures and ultraviolet radiation cause oxidative stress and inhibit photosynthesis in symbiotic dinoflagellates. Limnol Oceanogr 41: 271-283
Lesser MP (1997) Oxidative stress causes coral bleaching during exposure to elevated temperatures. Coral Reefs 16:187-192
Lesser MP (2000) Depth-dependent effects of ultraviolet radiation on photosynthesis in the Caribbean coral, Montastraea faveolata. Mar Ecol Prog Ser 192:137-151
Lesser MP (2004) Experimental Coral Reef Biology. J Exp Mar Biol Ecol 300:217-252 Lesser M P (2006) Oxidative stress in marine environments: biochemistry and
physiological ecology. Annu Rev Physiol 68:253-78 Lesser MP, Farrell JH (2004) Exposure to solar radiation increases damage to both host
tissues and algal symbionts of corals during thermal stress. Coral Reefs 23:367-377 Lesser MP, Shick JM (1989) Effects of irradiance and ultraviolet radiation on
photoadaptation in the zooxanthellae of Aiptasia pallida: primary production,

128
photoinhibition and enzymatic defenses against oxygen toxicity. Mar Biol 102: 243-255
Lesser MP, Stochaj WR, Tapley DW, Shick JM (1990) Bleaching in coral reef anthozoans: effects of irradiance, ultraviolet radiation, and temperature on the activities of protective enzymes against active oxygen. Coral Reefs 16:187-92
Levy O, Achituv Y, Yacobi YZ, Dubinsky Z, Stambler N (2006) Diel ‘tuning’ of coral metabolism: physiological responses to light cues. J Exp Biol 209:273-283
Lidz BH, Reich CD, Shinn EA (2003) Regional Quaternary submarine geomorphology in the Florida Keys. GSA Bulletin 115 (7): 845–866
Lidz BH, Reich CD, Peterson RL, Shinn EA (2006) New maps, new information: coral reefs of the Florida Keys. J Coastal Res 22(2):260-282
Lipp EK, Jarrell JL, Griffin DW, Lukasik J, Jacukiewicz J, Rose JB (2002) Evidence of human microbial contamination in corals of the Florida Keys. Mar Poll Bull 44:666-670
Madronich S (1993) Chapter 1: The atmosphere and UV-B radiation at ground level. In: Young AR, Bjorn LO, Moan J, Nultsch, W. (eds) Environmental UV photobiology. Plenum Press, New York pp 1-39
Madronich S, Granier C (1992) Impact of recent total ozone changes on tropospheric ozone photodissociation, hydroxyl radicals, and methane trends. Geophys Res Lett 19:465-467
Madronich S, McKenzie RE, Bjoern LO, Caldwell MM (1998) Changes in biologically active ultraviolet radiation reaching the earth’s surface. J Photochem Photobiol B Biol: 46:5-19
McClanahan T, Polunin N, Done T (2002) Ecological status and the resilience of coral reefs. Conserv Ecol 6(2):18
McKnight DM, Aiken GR (1998) Sources and age of aquatic humus. In: Hessen, T (ed) Aquatic Humic Substances. Springer, Berlin Heidelberg, Ecological Studies, 133:9-39
Micheletti MI, Piacentini RD, Madronich S (2003) Sensitivity of biologically active UV radiation to stratospheric ozone changes: effects of action spectrum shape and wavelength ranges. J Photochem Photobiol 78(5):456-461
Miller WL, Moran MA (1997) Interaction of photochemical and microbial processes in the degradation of refractory dissolved organic matter from a coastal marine environment. Limnol Oceanogr 42(6):1317-1324
Mitchell BG (1990) Algorithms of determining the absorption coefficients for aquatic particulates using the Quantitative Filter Technique, in Ocean Optics X,
Proceedings of the International Society of Optical Engineering (SPIE) 1302: 137-148 Mitchell BG, Bricaud A, Carder K, Cleveland J, Ferrari G, Gould R, Kahru M, Kishino M, Maske H, Moisan T, Moore L, Nelson N, Phinney D, Reynolds R, Sosik H, Stramski D, Tassan S, Trees C, Weidemann A, Wieland J, Vodacek A (2000) Chapter 12: Determination of spectral absorption coefficients of particles,
dissolved material and phytoplankton for discrete water samples. In: Fargion GS Mueller JL (eds) Ocean Optics Protocols For Satellite Ocean Color Sensor Validation NASA/TM-2000-209966, NASA Tech Memo
Moisan TA, Mitchell BG (2001) UV absorption by mycosporine-like amino acids in

129
Phaeocystis antarctica Karsten induced by photosynthetically available radiation. Marine Biology 138: 217-227
Montzka SA, Hall BD, Elkins JW 2009 Accelerated increases observed for hydrochloro- fluorocarbons since 2004 in the global atmosphere Geophys Res Lett 36:L03804, doi:10.1029/2008GL036475
Moran MA, Wicks RJ, Hodson RE (1991) Export of dissolved organic matter from a mangrove swamp ecosystem: evidence from natural fluorescence, dissolved lignin phenols, and bacterial secondary production Mar Ecol Prog Ser 76:175-184
Moran MA, Zepp RG (2000) UV Radiation Effects on Microbes and Microbial Processes. In: Kirchman DL (ed) Microbial ecology of the oceans. Wiley, New
York, pp 201-228 Morel A, Gentili B, Claustre H, Babin M, Bricaud A, Ras J, Tieche F (2007) Optical properties of the “clearest” natural waters. Limnol Oceanogr 52:217-229 Morris DP, Hargreaves BR (1997) The role of photochemical degradation of dissolved
organic carbon in regulating the UV transparency of three lakes on the Pocono Plateau. Limnol Oceanogr 42(2):239-249
Morrison JR, Nelson NB (2004) Seasonal cycle of phytoplankton UV absorption at the Bermuda Atlantic Time-series Study (BATS) site. Limnol Oceanogr 49:215-224
Mumby PJ, Chisholm JRM, Edwards AJ, Andrefouet S, Jaubert J (2001) Cloudy weather may have saved Society Island reef corals during the 1998 ENSO event. Mar Ecol Prog Ser 222:209-216
National Oceanic and Atmospheric Administration (2002) Florida Keys National Marine Sanctuary, U.S. Environmental Protection Agency State of Florida Sanctuary. Science Report 2001: An Ecosystem Report Card
Neale PJ (2004) Spectral weighting functions for quantifying effects of UV radiation in marine ecosystems. In de Mora S, Demers S, Vernet M (eds) The Effects of UV radiation in the marine environment. Cambridge University Press, Cambridge, pp 72-100
Neale PJ, Kieber DJ (2000) Assessing biological and chemical effects of UV in the marine environment: Spectral weighting functions. In Hester RE, Harrison RM eds), Causes and environmental implications of increased UV-B Radiation. Issues in Environmental Science and Technology, R Soc Chem, London, pp 61-83
Nelson NB, Siegel DA, Michaels AF (1998) Seasonal dynamics of colored dissolved material in the Sargasso Sea. Deep-Sea Res 45:931-957
Nelson NB, Carlson CA, Steinberg DK (2004) Production of chromophoric dissolved organic matter by Sargasso Sea microbes. Mar Chem 89:273-287
Nystrom M, Folke C, Moberg F (2000) Coral reef disturbance and resilience in a human- dominated environment. Trends in Ecology and Evolution. 15:413- 417
Odum HT, Odum EP (1955) Trophic structure and productivity of a windward coral reef community on Eniwetok Atoll. Ecological Monographs 25(3):291-320
Osburn CL, Morris DP (2003) in Helbling EH, Zagarese H (eds) UV Effects in Aquatic Organisms and Ecosystems 1st Edition, (Comprehensive Series in Photochemical & Photobiological Sciences), Royal Society of Chemistry
Osburn CL, Zagarese HE, Morris DP, Hargreaves BR, Cravero WE (2001) Calculation of spectral weighting functions for the solar photobleaching of chromophoric dissolved organic matter in temperate lakes. Limnol Oceanogr 46(6):1455-1467
Otis DB, Carder KL, English DC, Ivey JE (2004) CDOM transport from the Bahamas

130
Banks. Coral Reefs 23:152-160 Pait AS, DeSouza AE, Farrow DRG (1992) Agricultural pesticide use in coastal areas: a national summary. Strategic Environmental Assessments Division, NOAA, Maryland Peters M, Palandro D, Hallock P, Shinn E (in press) Assessing patterns of patch reef
distribution in the Lower Florida Keys, USA, using IKONOS satellite imagery. Proc 11th Int Coral Reef Symp
Pomeroy LR, Wiebe JJ (1988) Energetics of microbial food webs. Hydrobiologia 159:7-18 Pope RM, Fry ES (1997) Absorption spectrum (380-700 nm) of pure water. II. Integrating cavity measurements. Appl Opt 36:8710-8723
Porter JW, Lewis SK, Porter KG (1999) The effect of multiple stressors on the Florida Keys coral reef ecosystem: a landscape hypothesis and a physiological test. Limnol Oceanogr 44:941-949
Porter KG (2002) Water Quality in the FKNMS. In: Porter JW, Porter KG (eds) The Everglades, Florida Bay, and Coral Reefs of the Florida Keys: An Ecosystem Sourcebook. p 625
Ramirez A, Ayoub LM, Duncan Baker R, Hallock P (2007) Foraminifers as indicators of photo-oxidative stress: comparing bleaching prevalence in foraminifers with rates of decline in coral cover in the Florida Keys, USA. GSA Denver Annual Meeting (28–31 October 2007), paper no. 154-1
Randazzo AF, Halley RB (1997) The Geology of the Florida Keys. In: Randazzo AF, Jones DS (eds) The geology of Florida. University Press of Florida, Gainesville
Randel WJ, Wu F, Russell JM III, Waters JW, Froidevaux L (1995) Ozone and temperature changes following the eruption of Mt. Pinatubo. J Geophys Res
100:16753-16764 Reche I, Pace ML, Cole JJ (2000) Modeled effects of dissolved organic carbon and solar
spectra on photobleaching in lake ecosystems. Ecosystems 3:419-432 Risk MJ (1999) Paradise lost: how marine science failed the world’s coral reefs. Mar
Freshw Res 50:831-837 Roscoe HK (2001) The risk of large volcanic eruptions and the impact of this risk on
future ozone depletion. Natural Hazards 23:231-246 Roth AA, Clausen CD, Yahiku PY, Clausen VE, Cox WW (1982) Some effects of light on coral growth. Pac Sci 36(1):65-82 Rundel R (1983) Action spectra and estimation of biologically effective UV radiation. Physiologia Plantarum 58:360-366 Rundel RD, Nachtwey DS (1978) Skin cancer and ultraviolet radiation. Photochem
Photobiol 28(3):345-356 Schlichter D, Fricke HW, Weber W (1986) Light harvesting by wavelength transformation
in a symbiotic coral of the Red Sea twilight zone. Mar Biol 91, 403–407 Shick JM (2004) The continuity and intensity of ultraviolet irradation affect the kinetics
of biosynthesis, accumulation, and conversion of mycosporine-like amino acids (MAAs) in the coral Stylophora pistillata. Limnol Oceanogr 49(2):442-4458
Shick JM, Lesser MP, Dunlap WC, Stochaj WR, Chalker BE, Wu Won J (1995) Depth- dependent responses to solar ultraviolet radiation and oxidative stress in the zooxanthellate coral Acropora microphthalma. Mar Biol 122:41-51
Shick JM, Lesser MP, Jokiel PL (1996) Effects of ultraviolet radiation on corals and other coral reef organisms. Global Change Biol 2(6):527-545

131
Shick JM, Romaine-Lioud S, Ferrier-Page ́s C, Gattuso J-P (1999) Ultraviolet-b radiation stimulates shikimate pathway-dependent accumulation of mycosporine- like amino acids in the coral Stylophora pistillata despite decreases in its population of symbiotic dinoflagellates. Limnol Oceanogr 44:1667-1682 Siegel DA, Maritorena S, Nelson NB, Hansell DA, Lorenzi-Kayser M (2002) Global
distribution and dynamics of colored dissolved and detrital organic materials. J Geophys Res 107(12):3228
Smith RC, Cullen JJ (1995) Effects of UV radiation on phytoplankton. Rev Geophys 33: 1211-1223
Smith NP, Lee TN (2003) Volume transport through tidal channels in the Middle Florida Keys. J Coastal Res 10(2):254-260
Smith DJ, Suggett DJ, Baker NR (2005) Is photoinhibition of zooxanthellae photosynthesis the primary cause of thermal bleaching in corals? Global Change Biol 11:1-11
Somerfield PJ, Jaap WC, Clarke KR, Callahan M, Hackett K, Porter J, Lybolt M, Tsoko C, Yanev G (2008) Changes in coral reef communities among the Florida Keys,
1996 – 2003. Coral Reefs [doi 10.1007/s00338-008-0390-7] Stabenau ER, Zepp RG, Bartels E, Zika RG (2004) Role of the seagrass Thalassia
testudinum as a source of chromophoric dissolved organic matter in coastal south Florida. Mar Ecol Prog Ser 282:59-72
Stabenau ER, Hendee JC, Floritt L (2006) Investigating the Interactive Effects of Light and Temperature on Coral Photosynthetic Health. Ocean Sciences Meeting 2006. Abstract OS46L-09. http://www.agu.org/meetings/os06/os06sessions/os06_OS46L.html Stedmon C, Marager S (2001) The optics of chromophoric dissolved organic matter
(CDOM) in the Greenland Sea: an algorithm for differentiation between marine and terrestrially derived organic matter. Limnol Oceanogr 46(8):2087-2093
Steinberg DK, Nelson NB, Carlson CA, Prusak AC (2004) Production of chromophoric dissolved organic matter (CDOM) in the open ocean by zooplankton and the colonial cyanobacterium Trichodesmium spp. Mar Ecol Prog Ser 267: 45-56
Stevenson FJ (1982) Humus chemistry: genesis, composition, reactions. Wiley, New York
Stramski, D., and S. B. Wozniak. 2005. Light scattering by marine colloids. ASLO 2005 Aquatic Sciences Meeting, Salt Lake City, Utah, USA. Abstract Book, p. 107.
Suh H, Lee H, Jung J (2003) Mycosporine glycine protects biological systems against photodynamic damage by quenching singlet oxygen with a high efficiency. Photochem Photobiol 78:109-113
Swart PK, Healy G, Greer L, Lutz M, Saied A, Anderegg D, Dodge RE, Rudnick D (1999) The use of proxy chemical records in coral skeletons to ascertain past environmental conditions in Florida Bay. Estuaries 22(B)384-397
Twardowski MS, Boss E, Sullivan JM, Donaghay, PL (2004) Modeling the spectral shape of absorption by chromophoric dissolved organic matter. Mar Chem 89:69 –88
United Nations Environment Programme (UNEP) (2003) Environmental Effects of Ozone Depletion: 2002 Assessment. The Secretariat for The Vienna Convention for the Protection of the Ozone Layer and The Montreal Protocol on Substances that Deplete the Ozone Layer, ISBN 92-807-2312-X

132
Vincent WF, Kumagai M, Belzile C, Ishikawa K, Hayakawa K (2001) Effects of seston on ultraviolet attenuation in Lake Biwa, Limnology 2(3):179-184
Vincent WF, Neale PJ (2004) Mechanisms of UV damage to aquatic organisms. In: de Mora S, Demers S, Vernet M (eds) The effects of UV radiation in the marine environment. Cambridge University Press, Cambridge, pp 149-176
Vodacek A, Blough NV, DeGrandpre MD, Peltzer, ET, Nelson RK (1997) Seasonal variation of CDOM and DOC in the Middle Atlantic Bight: terrestrial inputs and photooxidation. Limnol Oceanogr 42:674-686
Voss KJ, Mobley CD, Sundman LK, Ivey JE, Mazel CH (2003) The spectral upwelling radiance distribution in optically shallow waters. Limnol Oceanogr 48(2):364-373 Walker ND, Rouse Jr LJ, Fargion GS (1994) The Great Flood of Summer 1993: Mississippi River Discharge Studied. Earth in Space 7(3):11-14
Waksman SA (1932) Humus. Williams and Wilkins, Baltimore Warner ME, Chilcoat GC, McFarland FK, Fitt WK (2002) Seasonal fluctuations in the
photosynthetic capacity of photosystem II in symbiotic dinoflagellates in the Caribbean reef-building coral Montastrea. Mar Biol 141:31-38
Wells JW (1957) Coral Reefs. Geological Society of America, Memoir 67(1):609-631 West JM, Salm RV (2003) Resistance and resilience to coral bleaching: implications for coral reef conservation and management. Conserv Biol 17:956-967 Wilkinson C (2002) Status of coral reefs of the world: 2002. Global Coral Reef Monitoring Network, Australian Institute of Marine Science, Townsville http://www.aims.gov.au/ pages/research/coralbleaching/s2/ scr-00.html Williams DE (2002) Population ecology of bleaching-stressed Amphistegina gibbosa in
the Florida Keys (1991-1999): influence of solar radiation on reef-dwelling foraminifera. Ph.D. thesis, University of South Florida
Williams DE, Hallock P (2004) Light requirements and bleaching in Amphistegina gibbosa: observations from laboratory experiments. Mar Biol 145:641-649
Wotton RS, Wotton WS (1994) The Biology of Particles in Aquatic Systems. CRC Press. Yentsch CS, Yentsch CM, Cullen JJ, Lapointe B, Phinney DA, Yentsch SW (2002)
Sunlight and water transparency: cornerstones in coral research. J Exp Mar Biol Ecol 268(2):171-183
Zanardi-Lamardo E,Moore CA, Zika RG (2004) Seasonal variation in molecular mass and optical properties of chromophoric dissolved organic material in coastal waters of southwest Florida. Mar Chem 89(1):37-54
Zepp RG (2003) UV exposure of coral assemblages in the Florida Keys. EPA Report: EPA/600/R-03/095 September 2003. http://www.epa.gov/athens/publications/
Zepp RG, Callaghan TV, Erickson III DJ (2002) Interactive effects of ozone depletion and climate change on biogeochemical cycles. Photochem Photobiol Sci 2:51-61
Zepp RG, Moran MA, Stabenau E,White EM (2002) Photochemical and biological degradation of CDOM in waters from selected coastal regions of the southeastern United States. EOS Trans AGU 83:OS278. American Geophysical Union, Washington, D.C.
Zepp RG, Shank GC, Stabenau E, Patterson KW, Cyterski M, Fisher W, Bartels E, Anderson, SL (2008) Spatial and temporal variability of solar ultraviolet exposure
of coral assemblages in the Florida Keys: importance of colored dissolved organic matter. Limnol Oceanogr 53:109-1922

133
Appendices

134
Appendix A: Map of Florida Keys with waterways, cities, management areas and reefs

135
Appendix B: Appendix of Important Terms and Abbreviations
(source: http://www.epa.gov/uvnet/glossary.html#totalcolumn) I. Irradiance - related terms: Irradiance The power transferred to a unit area of a surface by radiation from all directions within a hemisphere, measured in watts per square meter (W/m²). Ultraviolet (UV) / Ultraviolet Radiation (UVR) A portion of the electromagnetic spectrum with wavelengths shorter than visible light. The sun produces UV, commonly split into three bands: UV-A, UV-B, and UV-C. Solar UV Index The solar UV index (UVI) describes the level of solar UV radiation at the Earth’s surface. The values of the index range from zero upward – the higher the index value, the greater the potential for damage to the skin and eye, and the less time it takes for harm to occur. The UV index is computed using forecasted ozone levels, a computer model that relates ozone levels to UV incidence on the ground, forecasted cloud amounts, and the elevation of the forecast cities. Some countries also use ground observations (UNEP 2002). Spatial and Temporal Variation in UV Exposure The combination of total ozone and solar zenith angle, which is determined by the geographical position, season and time of the day, can lead to a variety of UV exposure situations (UNEP 2002). Diffey Weighting A weighting function that indicates which UV wavelengths are most efficient at burning human skin. When the weighting is multiplied by spectral irradiance and the product is integrated over all wavelengths, the result is diffey-weighted irradiance, a single number indicating the rate at which fair skin will redden. DUV Diffey-weighted UV irradiance (watts/m²) Direct Sun Refers to a measurement based only on direct radiation from the sun's disk and excluding indirect radiation from the remainder of the sky.

136
II. Ozone - related terms: O3 (Ozone) A molecule consisting of three oxygen atoms. Ozone strongly absorbs short wavelength ultraviolet light and consequently protects life on earth from the damaging effects of this radiation. It is also a very reactive compound, which makes it a harmful air pollutant at the surface. Repeated exposure to ozone can make people more susceptible to respiratory infection and lung inflammation, and can aggravate preexisting respiratory diseases, such as asthma. Sometimes people refer to "good" (stratospheric) ozone and "bad" (surface) ozone. Ozone layer That level of the atmosphere which encompasses a peak in ozone concentrations, roughly 12 to 30 km above the surface. Total Column Ozone The total amount of ozone in a column of air stretching from the earth's surface to space. More than 90% of the ozone is in the ozone layer at high altitude. Dobson Unit (DU) The unit of measure for total ozone or other gases. If you were to take all the ozone in a column of air stretching from the surface of the earth to space, and bring all that ozone to standard temperature (0 Celsius) and pressure (1013.25 millibars, or one atmosphere (atm)), the column would be about 0.3 centimeters thick. Thus, the total ozone would be 0.3 atm-cm, or 300 Dobson Units (DU). III. Photospectroscopic and optical terms and abbreviations: ag absorption due to CDOM (gelbstoff) ap absorption due to particulate material aphi – absorption due to pigmented material or phytoplankton aw absorption due to pure water µd - average cosine of downwelling irradiance E - irradiance I - radiance b - scattering Kd – attenuation coefficient for downwelling irradiance φ - azimuth angle Φ - radiant flux ω - solid angle θ - zenith angle [chl] – chlorophyll concentration CDOM – colored dissolved organic matter gelbstoff or gilvin – yellow substance, also referred to as CDOM
137
IV. Biological Response Terms MAAs - Mycosporine-like Amino Acids - UVR-absorbing compounds with broadband
absorption from 310–360 nm (Lesser 2006) HSP – Heat Shock Proteins - generalized stress response that is evolutionarily conserved; under stressful conditions, HSPs interact with proteins to maintain their conformation and function or in targeting damaged proteins for degradation (Lesser 2004)

About the Author
Lore M. Ayoub received her Bachelor’s degree in Biology from Bloomsburg
University in 1982. She attended Lehigh University where she completed a M.S. Degree in
Aquatic Ecosystems/Environmental Science, studying the relative contributions of dissolved
and particulate material to UV attenuation in temperate lakes. Thereafter she was employed
in Bermuda as a scientist and educator.
Her graduate work at the University of South Florida with Dr. Pamela Hallock Muller
and Dr. Paula Coble in the College of Marine Science has focused on factors controlling
UV attenuation in the Florida Keys, and its influence on coral reef health. Her other
projects at USF included population assemblages of fossil foraminifera, literature research
on storm water runoff in South Florida, teaching assistantship in Population Ecology and
public outreach. She led one scientific field mission using SCUBA for her doctoral
research, and received advanced SCUBA certifications including AAUS Scientific Diver and
NAUI Nitrox.