california’s elementary school truancy crisis what we can do to solve it #everykidcounts in school...
TRANSCRIPT

California’s ElementarySchool Truancy Crisis
What We Can DoTo Solve it
#EveryKidCounts
IN SCHOOL + ON TRACK 2014
+

Methodology
• School District Leadership Survey—158 school district leaders completed our survey providing detailed information about current attendance rates, practices, and procedures, as well as plans they have to improve their present systems.
• Aeries Survey—35 Aeries client districts provided us with attendance rates disaggregated by grade, ethnicity, and other subgroup categories. Overall sample size was 147,749 California students.
• California Department of Education—CDE provided us with census
enrollment, cumulative enrollment, number of truant students, ADA and revenue limit data. This allowed us to calculate the elementary school truancy rates and determine lost revenues.

IN SCHOOL + ON TRACK 2014
LESSON 1: BIG PROBLEM
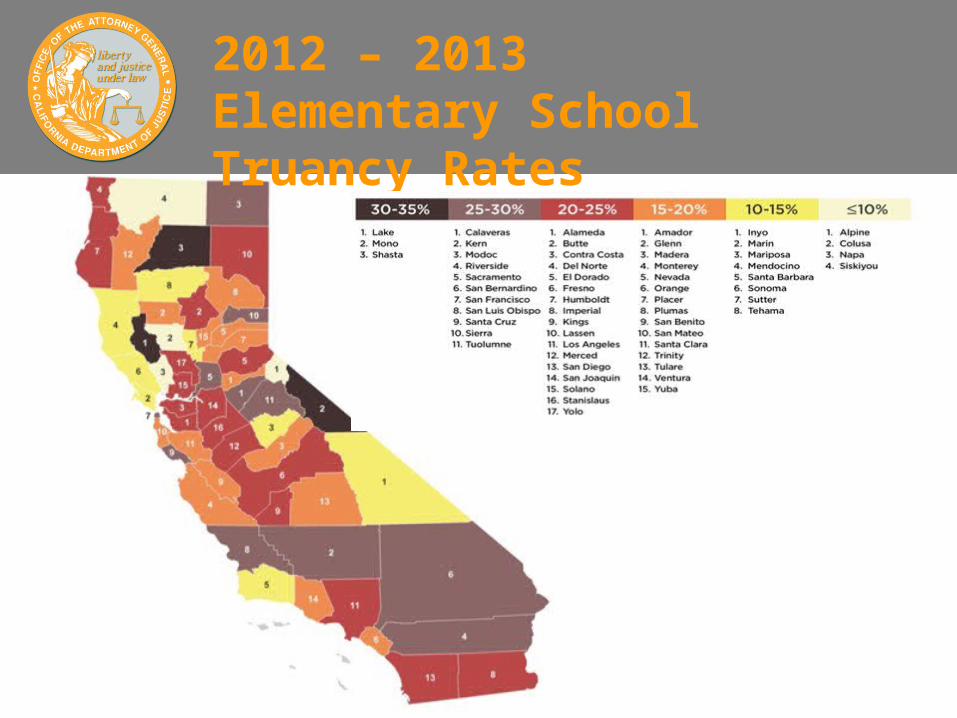
2012 – 2013 Elementary School Truancy Rates
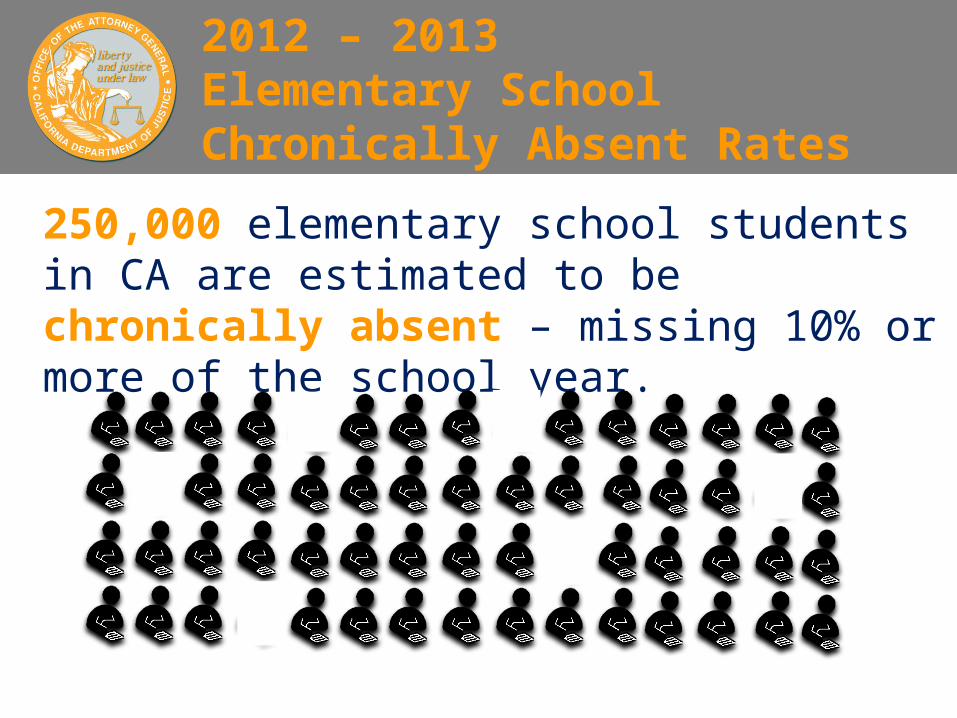
2012 – 2013 Elementary School Chronically Absent Rates
250,000 elementary school students in CA are estimated to be chronically absent – missing 10% or more of the school year.

2012 – 2013 Elementary School Truancy Rates
• 50,000 elementary school students are chronically truant (10% or more of the school year missed for unexcused absences)
• 40,000 elementary school students are severely chronically absent (missing 20% or more of the school year, or approximately 36 days)
IN SCHOOL + ON TRACK 2014
Disadvantaged Youth Suffer Greater Disparities

Low-Income Students
• 2,064,742 K-6 in CA
• 1 in 10 chronically absent in 2013-2014
• 45,000 chronically truant
• 35,000 severely chronically absent
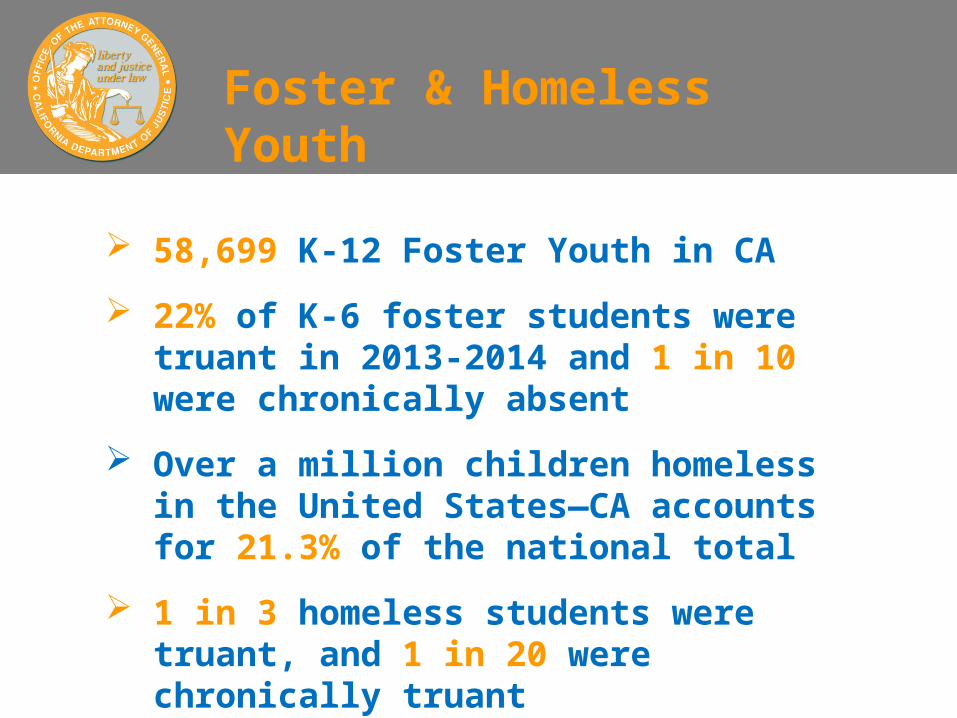
58,699 K-12 Foster Youth in CA
22% of K-6 foster students were truant in 2013-2014 and 1 in 10 were chronically absent
Over a million children homeless in the United States—CA accounts for 21.3% of the national total
1 in 3 homeless students were truant, and 1 in 20 were chronically truant
Foster & Homeless Youth

Truancy Rates
Truancy = 3+ unexcused
absences/tardies
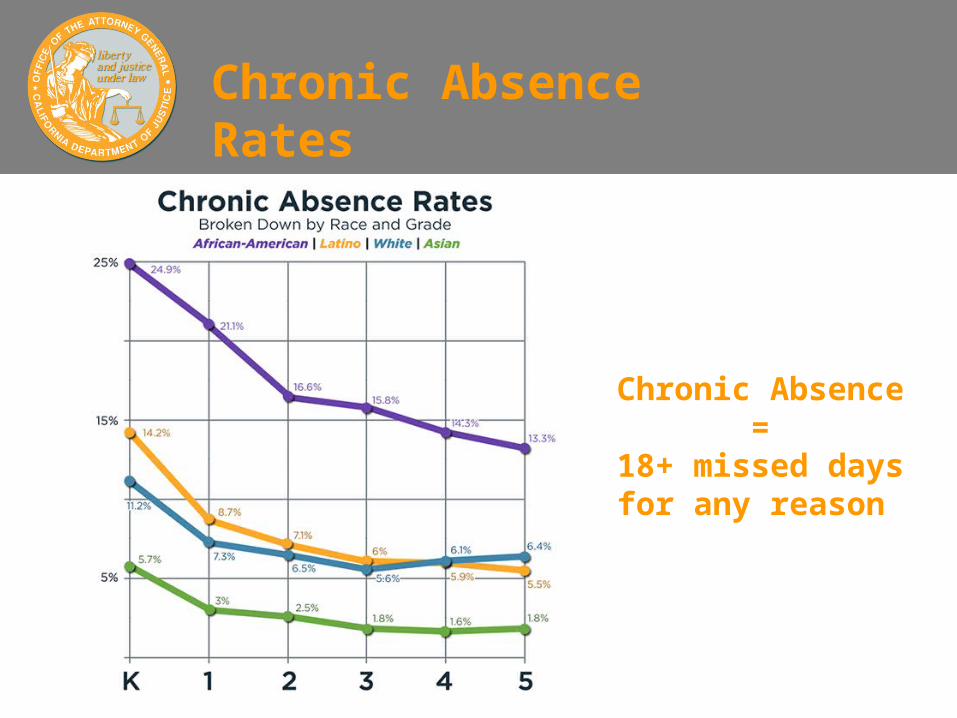
Chronic Absence Rates
Chronic Absence =
18+ missed days for any reason
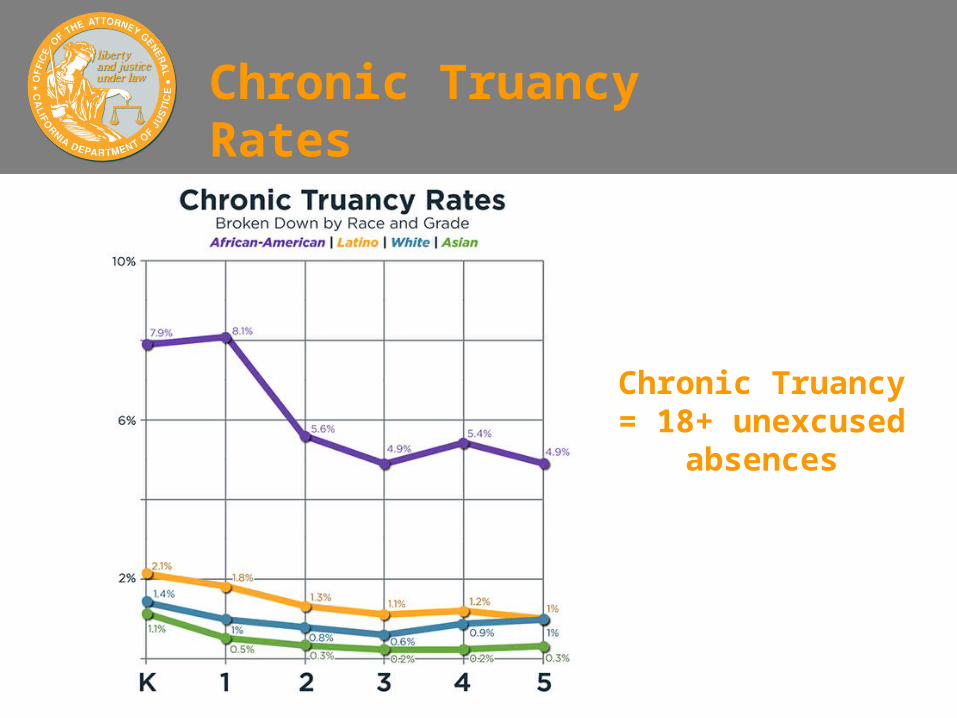
Chronic Truancy Rates
Chronic Truancy = 18+
unexcused absences

Severe Chronic Absence
Severe Chronic Absence =
36+ missed days for any reason

• African American youth have the biggest problems with attendance.
• Absenteeism is the worst in Kindergarten and 1st grade for all racial/ethnic groups.
TAKEAWAYS

Long-Term Effects of Absenteeism
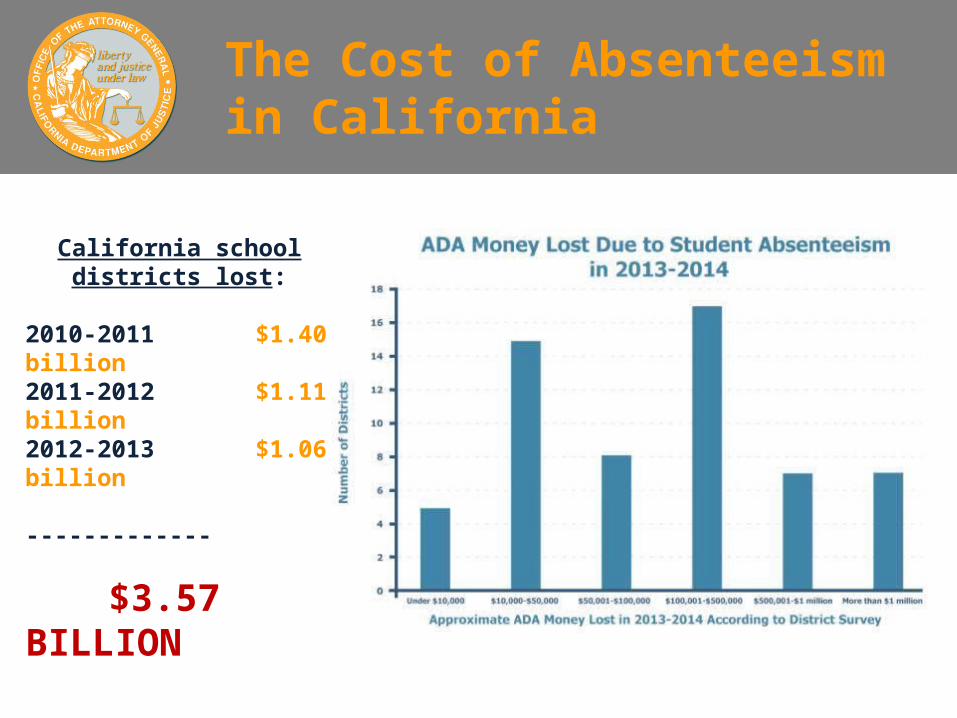
The Cost of Absenteeism in California
California school districts lost:
2010-2011 $1.40 billion2011-2012 $1.11 billion2012-2013 $1.06 billion -------------
$3.57 BILLION

IN SCHOOL + ON TRACK 2014
LESSON 2: HIDDEN PROBLEM
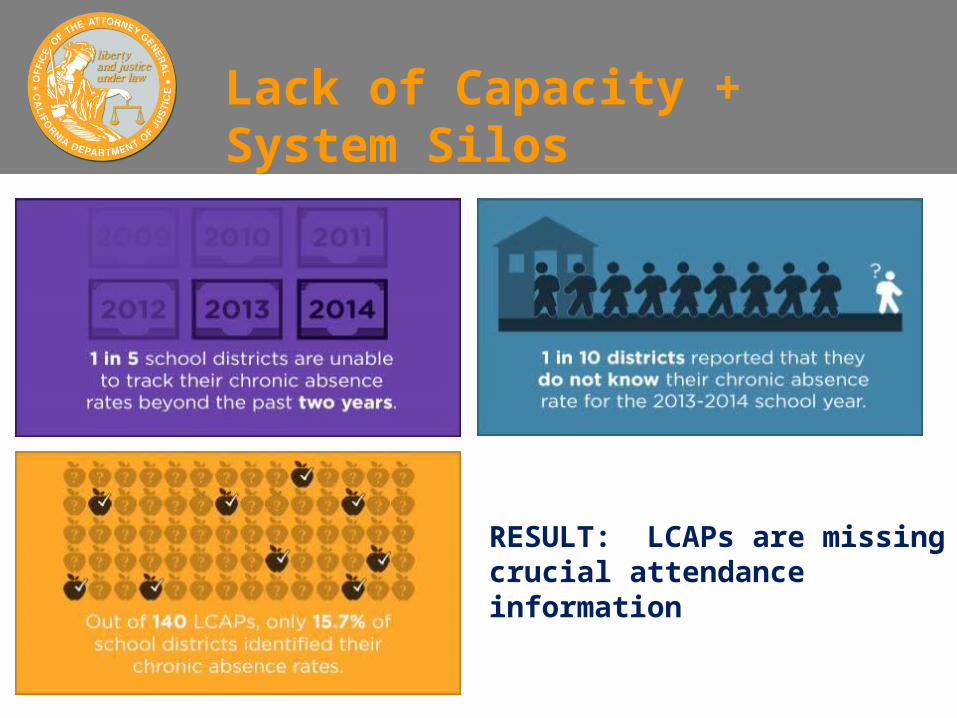
Lack of Capacity + System Silos
RESULT: LCAPs are missing crucial attendance information

LESSON 3: WE CAN SOLVE THIS
IN SCHOOL + ON TRACK 2014

Investments Pay Off
Approximate Amount Spent on Truancy Prevention Annually Number of Districts/Schools
Under $10,000 29
$10,000-$50,000 22
$50,001-$100,000 7
$100,001-$500,000 7
$500,001-$1 million 3
More than $1 million 0
No Money Spent 19
Unknown 27
TOTAL 114
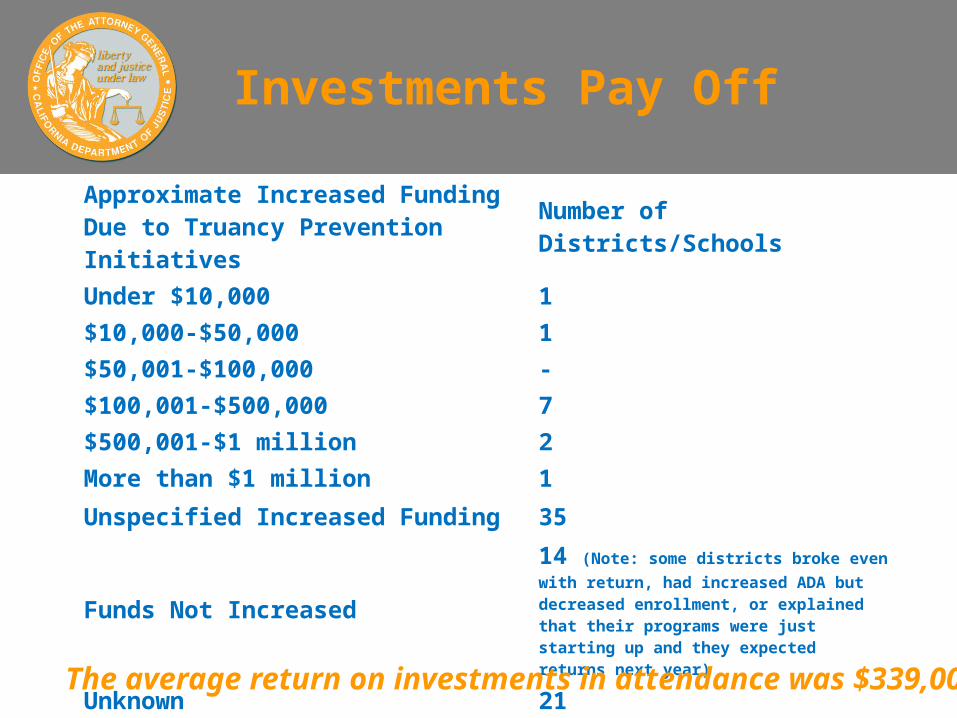
Approximate Increased Funding Due to Truancy Prevention Initiatives Number of Districts/Schools
Under $10,000 1$10,000-$50,000 1$50,001-$100,000 -$100,001-$500,000 7$500,001-$1 million 2More than $1 million 1Unspecified Increased Funding 35
Funds Not Increased14 (Note: some districts broke even with return, had increased ADA but decreased enrollment, or explained that their programs were just starting up and they expected returns next year)
Unknown 21TOTAL 82
The average return on investments in attendance was $339,000
Investments Pay Off

• LCFF gives school districts a base funding grant calculated by ADA
• Additional funds are allocated based on the number disadvantaged youth
• Every school district must adopt a Local Control & Accountability Plan (LCAP), which specifies annual goals/plans to address all eight state priorities
• One of the state’s 8 priorities is “pupil engagement,” which is to be measured in part by school attendance rates, chronic absenteeism rates
• LCAPs must address all 8 state priorities for the entire student body, as well as for certain pupil subgroups (racial/ethnic subgroups, low-income pupils, English Learners, pupils with disabilities, and foster youth)
Overview of the Local Control Funding Formula
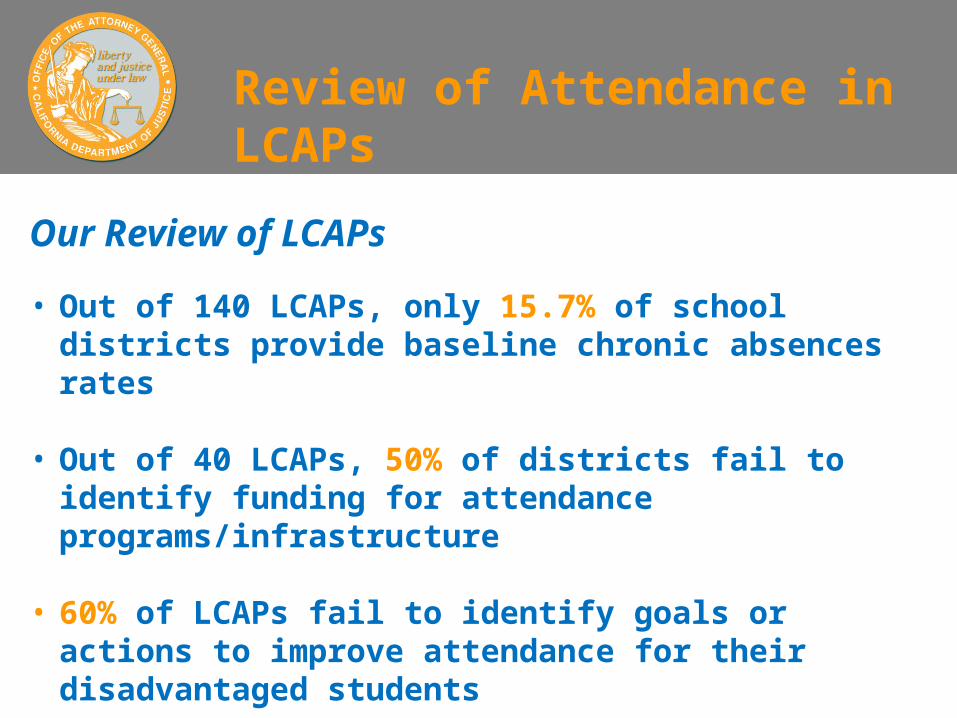
Our Review of LCAPs
• Out of 140 LCAPs, only 15.7% of school districts provide baseline chronic absences rates
• Out of 40 LCAPs, 50% of districts fail to identify funding for attendance programs/infrastructure
• 60% of LCAPs fail to identify goals or actions to improve attendance for their disadvantaged students
Review of Attendance in LCAPs

• 33% of LCAPs do not mention chronic absence at all
• 15% merely reference chronic absence as a metric they consider, without setting forth any goals regarding chronic absence
• Only 30% include specific annual goals for reducing chronic absence
• Only 18% include baseline data on the current chronic absence rate
• Only 5% set forth chronic absence goals disaggregated by subgroup
80 LCAP Review by Nonprofit Coalition

1. Modernize the state’s student records system for attendance
2. Use LCFF to ensure accountability for attendance
3. Expand, Improve, and Measure Outcomes for School Attendance Review Boards (SARBs)
4. Critically assess any school policies that remove students from the classroom
5. Design and implement programs to communicate that school attendance is important, and it’s the law
6. Assess and Improve District Attorney and other law enforcement officials’ participation on SARBs and other informal or formal attendance collaborations; prosecute only the most recalcitrant cases of truancy when all prior interventions fail
Recommendations Moving Forward

Thank You!
Please read the entire In School + On Track 2014 report at:
www.oag.ca.gov/truancy/2014
IN SCHOOL + ON TRACK 2014