california phase ii lid sizing tool documentation manual
TRANSCRIPT

CALIFORNIA PHASE II LID SIZING TOOL
DOCUMENTATION MANUAL
Prepared for: State Water Resources Control Board
Proposition 84 Stormwater Grant Agreement # 12-432-550
Prepared by: California State University Sacramento
Office of Water Programs 6000 J Street. Modoc Hall Room 1001
Sacramento, CA 95819-6025 www.owp.csus.edu
March 2016

i
Funding for this project has been provided in full or in part through an agreement with the State Water Resources Control Board. The contents of this document do not necessarily reflect the
views and policies of the State Water Resources Control Board, nor does mention of trade names or commercial products constitute endorsement or recommendation for use.

DOCUMENTATION MANUAL FOR THE CALIFORNIA PHASE II LID SIZING TOOL
ii
TABLE OF CONTENTS
1.0 INTRODUCTION............................................................................................................. 1
2.0 PURPOSE AND NEED .................................................................................................... 1
3.0 PHASE II NPDES REGULATORY CONTEXT........................................................... 2
3.1 Design Storm Method ........................................................................................... 2
3.2 Percent Capture Method ...................................................................................... 3
3.3 Baseline Bioretention or Equivalent Performance Method .............................. 3
4.0 TOOL DEVELOPMENT ................................................................................................. 5
4.1 Parameter Selection .............................................................................................. 5
4.2 Sizing Factor and Design Curve Derivation ..................................................... 10
4.3 LID BMP Area Calculations .............................................................................. 13
5.0 TOOL INTERFACE ...................................................................................................... 15
5.1 Tool Input ............................................................................................................ 15
5.2 Tool Output ......................................................................................................... 17
6.0 REFERENCES ................................................................................................................ 24
APPENDICES
Appendix A – LID BMP Fact Sheets
Appendix B – SWMM 5 Input Parameter Values
Appendix C – Results of Tool Testing
CALIFORNIA PHASE II LID SIZING TOOL DOCUMENTATION MANUAL
1
1.0 INTRODUCTION
This manual documents background information for the California Phase II Low Impact Development (LID) Sizing Tool. This is a web-based tool that assists stormwater practitioners in selecting and sizing LID Best Management Practices (BMPs) that meet the sizing requirements set forth in California’s National Pollutant Discharge Elimination System (NPDES) permit for stormwater discharges from small municipal separate storm sewer systems (MS4s, SWRCB 2013). The tool allows users to input their location, soil type, and impervious areas, and then queries a database containing pre-solved sizing factors and design curves for a variety of BMP types, performs permit-based sizing calculations, and tabulates allowable sizes for each BMP type. Sizing results are provided based on three different sizing methods allowed by the Phase II permit: a Design Storm Method, a Percent Capture Method, and a Baseline Bioretention or Equivalent Performance Method. Sizing results are also provided for the Central Coast Regional Water Quality Control Board (RWQCB) simple sizing method adopted via resolution R3-2013-0032 (CA RWQCB Central Coast 2013). Users are also provided references for considering BMP feasibility factors beyond sizing, such as site topography and geometry and BMP maintenance requirements and costs. The tool includes training videos to visually instruct users on various aspects of the tool’s interface, input, and output.
Development of this tool was funded by the California State Water Resources Control Board’s (SWRCB) Proposition 84 Stormwater Grant Program (SWGP). The tool was developed by California State University, Sacramento’s Office of Water Programs and is hosted on their website at: https://www.owp.csus.edu/specialized/tools.php.
2.0 PURPOSE AND NEED
Although a variety of LID BMP types are available, selecting and sizing them to meet permit requirements under site-specific conditions is difficult for many small MS4s due to the lack of an accurate and consistent means to compare their potential performance. Most tools that are available for statewide application simulate runoff based only on depth of precipitation for a single design storm and do not incorporate factors such as region-specific precipitation intensity, back-to-back storms (including antecedent moisture conditions), evaporation, etc. When these mechanisms are not simulated on a small (e.g., hourly), continuous time-step, it can result in inappropriate designs, which in the field either do not perform adequately or are oversized, and thus a waste of resources. The few continuous simulation models that do exist require extensive training and understanding of the base model, provide only conceptual methods for choosing and sizing BMPs, and/or apply only to fragmented locations and particular site conditions. These problems constitute a significant barrier to successful implementation of LID, particularly by small MS4s. The California Phase II LID Sizing Tool includes results from design storm calculations as well as continuous simulation. This improves the selection of cost-effective LID BMPs and increases LID implementation by supplying a simple and easily accessed application.

CALIFORNIA PHASE II LID SIZING TOOL DOCUMENTATION MANUAL
2
3.0 PHASE II NPDES REGULATORY CONTEXT
The Phase II permit requires implementation of LID standards for all new development and redevelopment projects that create and/or replace 5,000 square feet or more of impervious surface (regulated projects; with some exceptions for non-traditional permittees – see permit Section F.5.g.2.ii). All regulated projects must include LID BMPs that meet specific hydraulic sizing criteria.
The methods allowed for achieving permit criteria vary in complexity and can result in a wide variety of designs, and, as a result, costs. The CA Phase II LID Sizing Tool was developed to provide designers, planners, and regulators with a simplified process for selecting and sizing LID BMPs that comply with the permit sizing criteria. The tool includes relatively simple and land-intensive LID BMPs alongside more traditional and smaller-footprint designs so that the most cost-effective LID BMPs can be selected based on site-specific conditions such as land costs and topography.
The CA Phase II LID Sizing Tool provides three sizes (in area) for each LID BMP type based on the volumetric sizing criteria established in the Phase II permit. A fourth size is provided based on requirements adopted via resolution by the Central Coast RWQCB (Region 3): The four methods presented by the tool include the following:
1. Design Storm Method 2. Percent Capture Method 3. Baseline Bioretention or Equivalent Performance Method 4. Central Coast Simple Method
The Design Storm Method and Central Coast Simple Method are intended to allow easy sizing calculations, but may be a little conservative (i.e., result in over-sized LID BMPs). The Percent Capture Method requires continuous simulation – a much more complicated analysis – so a more precise (less conservative) result might be expected. As a backstop to these approaches, the Phase II permit also allows a very simple bioretention approach, where the size and other bioretention characteristics are pre-established without regard to local precipitation data. An equivalence criteria for this “permit-prescribed” bioretention approach is also allowed by the permit, but the method for determining equivalence is left up to the reader. The CA Phase II LID Sizing Tool’s Baseline Bioretention or Equivalent Performance Method addresses this additional permit sizing option.
The following subsections describe the specific permit or resolution sections from which the tool’s sizing methods were based. Section 4.2 of this manual describes the conceptual and mathematical derivations for these methods.
3.1 Design Storm Method
The Design Storm Method is based on Section E.12.e.ii.c.1.a of the permit, which allows LID stormwater retention and treatment facilities that evapotranspire, infiltrate, harvest/use, and biotreat stormwater to be designed as follows (SWRCB 2013):
“The maximized capture storm water volume for the tributary area, on the basis of historical precipitation records, determined using the formula and volume capture coefficients in Urban Runoff Quality Management, WEF Manual of Practice No. 23/ASCE Manual of Practice No. 87 (1998) pages 175-178 (that is, approximately the 85th percentile 24-hour storm runoff event)”.
CALIFORNIA PHASE II LID SIZING TOOL DOCUMENTATION MANUAL
3
3.2 Percent Capture Method
The Percent Capture Method is based on Section E.12.e.ii.c.1.b of the permit, which allows LID BMPs to be designed as follows (SWRCB 2013):
“The volume of annual runoff required to achieve 80 percent or more capture, determined in accordance with the methodology in Section 5 of the CASQA’s Stormwater Best Management Practice Handbook, New Development and Redevelopment (2003), using local precipitation data.”
3.3 Baseline Bioretention or Equivalent Performance Method
The Baseline Bioretention or Equivalent Performance Method is based on Section E.12.e.ii.f of the Phase II permit. This permit section allows use of a stormwater treatment measure designed to: 1) infiltrate, evapotranspire, and/or bioretain runoff based on the sizing criteria from Section E.12.e.ii.c.1, and 2) be as effective as a bioretention system with the following permit-specified design parameters (SWRCB 2013):
1) Maximum surface loading rate of 5 inches per hour, based on the flow rates calculated. A sizing factor of 4% of tributary impervious area may be used.
2) Minimum surface reservoir volume equal to surface area times a depth of 6 inches. 3) Minimum planting medium depth of 18 inches. The planting medium must sustain a
minimum infiltration rate of 5 inches per hour throughout the life of the project and must maximize runoff retention and pollutant removal. A mixture of sand (60%-70%) meeting the specifications of American Society for Testing and Materials (ASTM) C33 and compost (30%-40%) may be used.
4) Subsurface drainage/storage (gravel) layer with an area equal to the surface area and having a minimum depth of 12 inches.
5) Underdrain with discharge elevation at top of gravel layer. 6) No compaction of soils beneath the facility, or ripping/loosening of soils if compacted. 7) No liners or other barriers interfering with infiltration. 8) Appropriate plant palette for the specified soil mix and maximum available water use.
The equivalence standard is found in Section E.12.e.ii.g of the permit and allows designs to differ from the E.12.e.ii.f specification if all of the following may be demonstrated (SWRCB 2013):
1) Equal or greater amount of runoff infiltrated or evapotranspired. 2) Equal or lower pollutant concentrations in runoff that is discharged after biotreatment. 3) Equal or greater protection against shock loadings and spills. 4) Equal or greater accessibility and ease of inspection and maintenance.
The CA Phase II LID Sizing Tool’s areas reported for the Baseline Bioretention or Equivalent Performance Method are based on a conservative interpretation of the second requirement concerning concentrations. Instead of quantifying the pollutant removal of any filtration or sedimentation mechanisms within an equivalent LID BMP, the tool only accounts for pollutant removal via evapotranspiration and infiltration losses. The assumption is that these latter mechanisms result in pollutant losses that are superior to the filtration mechanism in the permit-specified bioretention. This approach also means that all equivalent LID BMPs are sized to retain on site the same volume of runoff that would be discharged after biotreatment through the permit-specified bioretention.
CALIFORNIA PHASE II LID SIZING TOOL DOCUMENTATION MANUAL
4
3.4 Central Coast Simple Method
In lieu of adopting the methods listed in the Phase II permit, the Central Coast RWQCB has adopted other methods for sizing LID BMPs. One of the methods, the Simple Method, is included in the CA Phase II LID Sizing Tool. The Simple Method is similar to the Design Storm Method, except that for LID BMPs with an underdrain, any storage volume above the underdrain is not credited. The LID BMP areas resulting from the Central Coast Simple Method are therefore larger than those resulting from the Design Storm Method due to the decreased storage. Either the 85th or 95th percent, 24-hour storm is required depending on the project location within the Central Coast. The Central Coast Simple Method is documented in the post-construction requirements (Attachment 1, Appendix D) of Resolution R3-2013-0032 (CA RWQCB Central Coast 2013).

CALIFORNIA PHASE II LID SIZING TOOL DOCUMENTATION MANUAL
5
4.0 TOOL DEVELOPMENT
The tool consists of a website that is linked to a database through a server. The database stores precipitation and evaporation data for multiple geographic locations throughout California, pre-defined parameters for multiple LID BMP types and soil types, and pre-solved design curves. After the user enters project information into the tool’s website, the server queries the database, performs calculations, and tabulates the areas required for various LID BMP types. LID BMP areas are provided for each of three sizing methods based on various sizing criteria specified in the Phase II permit as well as for the Central Coast Simple Method (see Section 3.0). Figure 1 provides graphical details of the tool’s components and how they are linked.
Figure 1. Components of the CA Phase II LID Sizing Tool
The following discussions present how the database parameters were selected, how the LID BMP sizing factors and design curves were derived, and how the tool calculates LID BMP areas for the user-defined project.
4.1 Parameter Selection
The tool results are dependent on the project location’s climate and soil properties, as well as the design characteristics of the LID BMP types being assessed. The following subsections describe the climate locations, project sites soil properties, and LID BMP types represented by the tool.
4.1.1 Climate Locations
The tool currently provides sizing results based on precipitation and evaporation data from 15 climate stations located throughout California (Figure 2). These locations were chosen based on a variety of criteria, including: 1) statewide representation, 2) available climate data exceeding

CALIFORNIA PHASE II LID SIZING TOOL DOCUMENTATION MANUAL
6
30 years and 80% completeness, and 3) region-specific requests. Table 1 presents details about each climate station. Additional climate stations can be added to the tool in the future.
Figure 2. Climate Data Locations for the CA Phase II LID Sizing Tool
Table 1. Climate Station Information
Station Name Coop ID Elevation (ft) Years on Record
Boron 040979 2,450 36 Chico Univ Farm 041715 185 36 Colusa 2 SSW 041498 36 36 Corcoran Irrig Dist 042012 200 36 Eureka WFO Woodley IS 042910 20 36 Grass Valley #2 043573 2,400 36 Modesto 2 045741 89 36 Red Bluff Muni AP 047292 353 36 San Miguel Wolf Ranch 047867 738 33 Santa Barbara Muni AP 047905 9 36 Santa Ynez 047976 600 36 Sebastopol 048072 68 36 Sunset State Beach 048680 80 36 Tehachapi AP 048832 3.960 36 Victorville Pump PT 049325 2,858 36

CALIFORNIA PHASE II LID SIZING TOOL DOCUMENTATION MANUAL
7
4.1.2 Project Site Soil Properties
The areas reported for the tool rely on soil characteristics for the project site. Six different soil types were modeled using the following soil parameters: suction head, saturated conductivity, and initial deficit. The tool’s soil types are categorized by the Hydrologic Soil Groups established by the Department of Agriculture (USDA) National Resource Conservation Service (NRCS) as follows: one representing Hydrologic Soil Group A, one representing Soil Group B, two representing Soil Group C, and two representing Soil Group D. Table 2 presents the parameter values associated with each soil type modeled.
Table 2. Soil Parameter Values
Parameter Unit A B Chigh Clow Dhigh Dlow Suction Head in 0.4 3.3 5.5 7.4 9.1 11.6
Saturated Conductivity in/hr 5.0 1.0 0.3 0.1 0.04 0.01 Initial Deficit fraction 0.45 0.39 0.34 0.30 0.26 0.21
The saturated conductivity values were selected based on the ranges established by the USDA NRCS for the different Hydrologic Soil Groups (Table 3).
Table 3. Soil Parameter Values
Soil Hydrologic Group A B C D Saturated Conductivity (in/hr) >1.42 0.57-1.42 0.06-0.57 <0.06
1USDA NRCS 2007
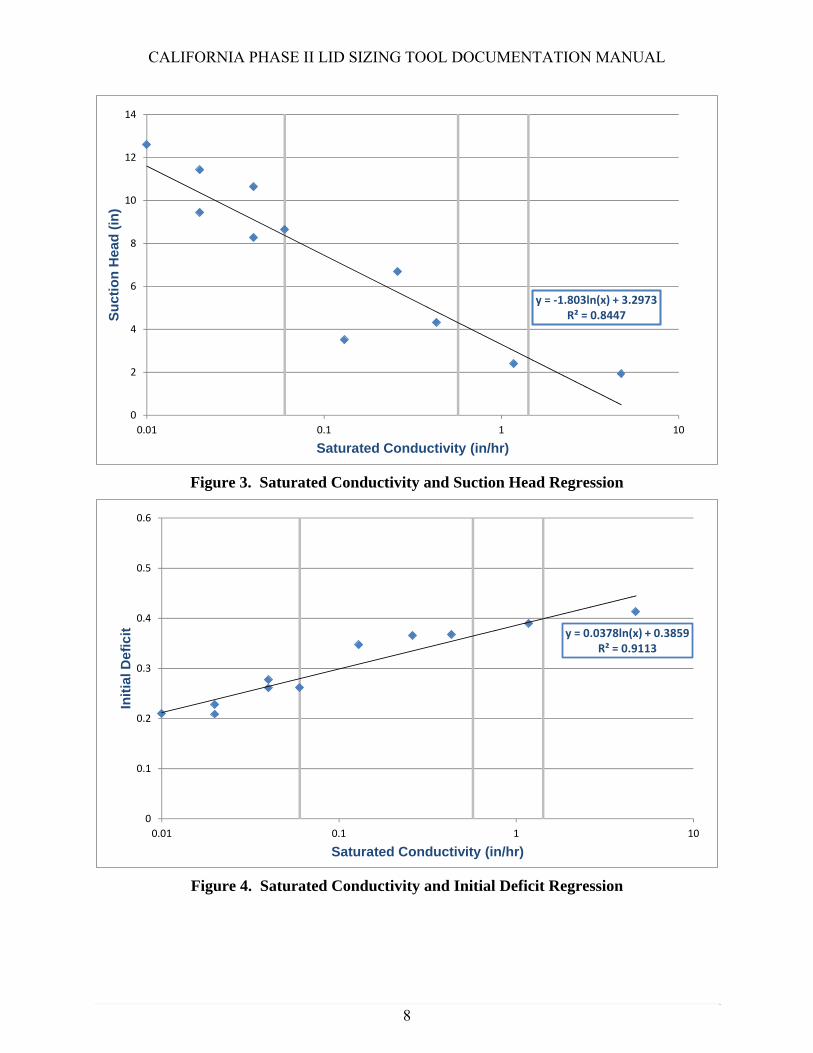
The suction head and initial deficit values were chosen based on regressions established from literature values (EPA 2010). The regressions are shown in Figures 3 and 4.
For soil types with characteristics other than those modeled, the tool allows the user to input a project-specific saturated conductivity value and interpolates between the results from the modeled values. Impacts from suction head and initial deficit values that differ from the modeled values are assumed to be negligible.
CALIFORNIA PHASE II LID SIZING TOOL DOCUMENTATION MANUAL
8
Figure 3. Saturated Conductivity and Suction Head Regression
Figure 4. Saturated Conductivity and Initial Deficit Regression
y = ‐1.803ln(x) + 3.2973R² = 0.8447
0
2
4
6
8
10
12
14
0.01 0.1 1 10
Su
ctio
n H
ead
(in
)
Saturated Conductivity (in/hr)
y = 0.0378ln(x) + 0.3859R² = 0.9113
0
0.1
0.2
0.3
0.4
0.5
0.6
0.01 0.1 1 10
Init
ial D
efic
it
Saturated Conductivity (in/hr)

CALIFORNIA PHASE II LID SIZING TOOL DOCUMENTATION MANUAL
9
4.1.3 LID BMP Types
The tool’s LID BMP types were selected based on the site design measures, stormwater treatment measures, and allowable alternative designs described in the Phase II permit. The tool’s LID BMP names are based on conventional terminology being adopted by practitioners statewide, as observed by the tool developers. Table 1 presents a list of the LID BMP types selected for the tool and the relevant permit-specified measures.
Table 4. Phase II Permit Measures and Sizing Tool LID BMP Types
Phase II Permit Measure
Phase II Permit BMP CA Phase II LID Tool
LID BMP Types
Site Design Measures
(E.12.e.ii.d)
Soil Quality Improvement and Maintenance
Strip, Amended 6” Strip, Amended 12” Strip, Amended 18”
Soil Quality Improvement and Maintenance; Vegetated Swales
Swale, Amended 6” Swale, Amended 12” Swale, Amended 18”
Rain Barrels and Cisterns Capture and Use Storage Porous Pavement Porous Pavement
Storm Water Treatment Measures
(E.12.e.ii.f) Bioretention System
Bioretention Cell - 18” Soil - 12” StorageBioretention Cell - 18” Soil - 24” StorageBioretention Cell - 18” Soil - 36” StorageBioretention Cell - 24” Soil - 12” StorageBioretention Cell - 24” Soil - 24” StorageBioretention Cell - 24” Soil - 36” StorageBioretention Cell - Soil Depth Varies* -
No Storage
Alternative Designs (E.12.e.ii.g)
Infiltration
Overland Flow (no amendment) Infiltration Trench Infiltration Gallery
Vegetated Infiltration Basin *Soil depth is a function of the underlying native soil’s saturated conductivity
Figure 5 shows a conceptual profile template for the LID BMPs modeled by the tool. Each LID BMP includes up to four different components: 1) ponding, 2) soil mix/porous pavement, 3) gravel storage, and 4) underlying native soil. The ponding component provides temporary surface storage of precipitation and runoff intended to hold the water in place and promote infiltration into the lower components. The component directly beneath the ponding zone consists of a bioretention mix, amended soils, top soil, planting material, or porous pavement (collectively referred to as soil mix/porous pavement). This component allows for initial surface storage as well as treatment via filtration and, in some cases, volatilization, biological uptake, media adsorption, and/or vegetative transpiration. The third LID BMP component consists of an aggregate compartment that provides additional storage and promotes infiltration into the native soils below. The storage component may or may not include an underdrain, which allows discharge in the occasional case that the storage and volumetric losses (infiltration and evapotranspiration) are insufficient to retain all precipitation and runoff. The final component,

CALIFORNIA PHASE II LID SIZING TOOL DOCUMENTATION MANUAL
10
which is included in every LID BMP modeled, is the underlying native soil. All LID BMPs are unlined to allow infiltration to whatever degree the underlying soil allows.
Appendix A provides fact sheets for each LID BMP. The fact sheets include profile schematics (including parameter values for each relevant component of the conceptual LID BMP shown in Figure 5), descriptions, and assumptions. These characteristics apply to all sizing methods provided by the tool.
dp = max depth of ponding storage
dm = depth of bioretention mix, planting mix, soil amendment, or porous pavement
ηme = effective porosity of bioretention mix, planting mix, soil amendment, or porous pavement (= total porosity – field capacity)
ds = depth of gravel storage
ηme = effective porosity of gravel storage (= total porosity – field capacity)
ksat, N = saturated conductivity of native soil
Note: Some components may not be applicable to certain LID BMP types. For example, amended swales do not have gravel storage components and infiltration trenches do not have ponding or soil mix components.
Figure 5. Conceptual LID BMP Profile
4.2 Sizing Factor and Design Curve Derivation
For each possible combination of climate location, soil type, and LID BMP type, the tool provides LID BMP areas based on the four different methods that meet the Phase II permit and Central Coast resolution sizing criteria: the Design Storm Method, the Percent Capture Method, the Baseline Bioretention or Equivalent Performance Method, and the Central Coast Simple Method.
Figure 6 presents the conceptual water balance associated with each of these sizing methods. The water balance consists of equating the total amount of rain that fell onto the drainage management area (DMA) with the total amount of water losses (including runoff discharge) from the DMA. The DMA consists of an impervious area and the area of the LID BMP. The water losses across the DMA include infiltration and evaporation from, and storage within the impervious area, as well as infiltration and evapotranspiration from, storage within, bypass of, and discharge from the LID BMP. The water balance for the DMA may be mathematically represented by two equations, one for the impervious area and one for the LID BMP area:
EQN 1
EQN 2

CALIFORNIA PHASE II LID SIZING TOOL DOCUMENTATION MANUAL
11
The following subsections present how these general equations were used to derive the specific calculations for each of the tool’s sizing methods.
AIMP = Impervious area of DMA
ALID = LID BMP area of the DMA
PIMP = Precipitation onto AIMP
PLID = Precipitation onto ALID
EIMP = Evaporation from AIMP
ETLID = Evapotranspiration from ALID
SIMP = Storage within AIMP
SLID = Storage within ALID
IIMP = Infiltration through AIMP
ILID = Infiltration through ALID
ROIMP = Runoff discharged from AIMP to ALID
ROLID = Runoff bypassing ALID
TLID = Treated discharge from ALID underdrain
Figure 6. Conceptual Plan View of Drainage Management Area Water Balance
4.2.1 Design Storm Method
The tool’s Design Storm Method combines the infiltration, evaporation, and storage losses from the impervious area such that they are a fraction of the precipitation that fell onto the impervious area. The fraction is equivalent to one minus the impervious area’s volumetric runoff coefficient, which is based on the percent of the DMA that is impervious. The resulting equation is:
1 ∗ EQN 3
where:
Rv = Volumetric runoff coefficient for the impervious area = 0.858*(i)3 – 0.78*(i)2 + 0.774*(i) + 0.04 (WEF and ASCE 1998) (i = impervious fraction = 1.0)
Substituting EQN 3 into EQN 1 results in the following:
1 ∗ EQN 4
EQN 4 can be rearranged to calculate the runoff discharged from the impervious area to the LID BMP area (ROIMP):
∗ EQN 5

CALIFORNIA PHASE II LID SIZING TOOL DOCUMENTATION MANUAL
11
The Design Storm Method assumes that this runoff, along with the rain that fell onto the LID BMP, must be stored within the LID BMP (losses due to infiltration, evapotranspiration, and discharge through an underdrain from the LID BMP are neglected):
EQN 6
Storage provided by the LID BMP may be calculated based on the depths and porosities of the LID BMP’s ponding, soil mix/porous pavement, and gravel storage components (Figure 5) multiplied by the LID BMP area:
∗ ∗ ∗ EQN 7
Substituting EQN 5 and EQN 7 into EQN 6 results in the following:
∗ ∗ ∗ ∗ EQN 8
Precipitation onto the impervious and LID BMP areas may be represented by the design storm depth multiplied by the respective areas:
∗ EQN 9
∗ EQN 10
Substituting EQN 9 and EQN 10 into EQN 8 and rearranging the equation results in a sizing factor that represents the percentage of the LID BMP area relative to the impervious area:
∗
∗ ∗
EQN 11 is then used to calculate the LID BMP area based on the user-specified impervious area (see Section 4.3.1).
4.2.2 Percent Capture Method
For the tool’s Percent Capture Method, design curves were developed for each location-soil type-LID BMP type scenario. The design curves correlate sizing factors (the percent of LID BMP area relative to the impervious area) with the amount of runoff infiltrated, captured, and/or biotreated by the LID BMP. The design curves were developed using the Environmental Protection Agency’s (EPA) Storm Water Management Model Version 5.0.022 (SWMM 5, EPA 2013). SWMM 5 is a dynamic, hydrologic model that can run long-term (continuous) simulations to estimate the quantity and quality of urban runoff over time.
A code was developed to load data into SWMM 5 and run simulations for all possible location-soil type-LID BMP type scenarios for a one acre impervious area and a variety of LID BMP areas. The uploaded data included hourly precipitation data, monthly evaporation data, LID BMP type characteristics, native soil properties, and various LID BMP areas. Appendix B provides the input parameter values used for SWMM 5 modeling to demonstrate how each LID BMP was modeled, including values for the impervious portion of the DMA. The SWMM 5 simulations were run at hourly time-steps across the entire time period of the climate data (30+ years). For each simulation, SWMM 5 tracked the hourly water balance across the DMA, including volumes associated with total precipitation onto the DMA, total abstraction within the impervious area, total infiltration through the LID BMP, total evapotranspiration from the DMA, total runoff that bypasses the LID BMP, and total runoff that was discharged through the LID BMP underdrain (where applicable). SWMM 5 then reported the total volumes associated with
EQN 11

CALIFORNIA PHASE II LID SIZING TOOL DOCUMENTATION MANUAL
12
each of these elements across the 30+ year simulation, and the code was used to download these values into the tool’s database. The values are used to calculate the percent of the runoff and precipitation that was captured by the LID BMP through infiltration, evapotranspiration, and discharge from an underdrain. The percent capture is derived from the water balance for the LID BMP area (EQN 2), where storage within the LID BMP is neglected:
EQN 12
Both sides of EQN 12 can be divided by ROIMP + PLID. The resulting equation is:
EQN 13 can be rearranged:
EQN 14 therefore represents the percent of runoff from the impervious area and precipitation onto the LID BMP area that was capture (i.e., evapotranspired, infiltrated, and treated) by the LID BMP area and can be simplified to:
%
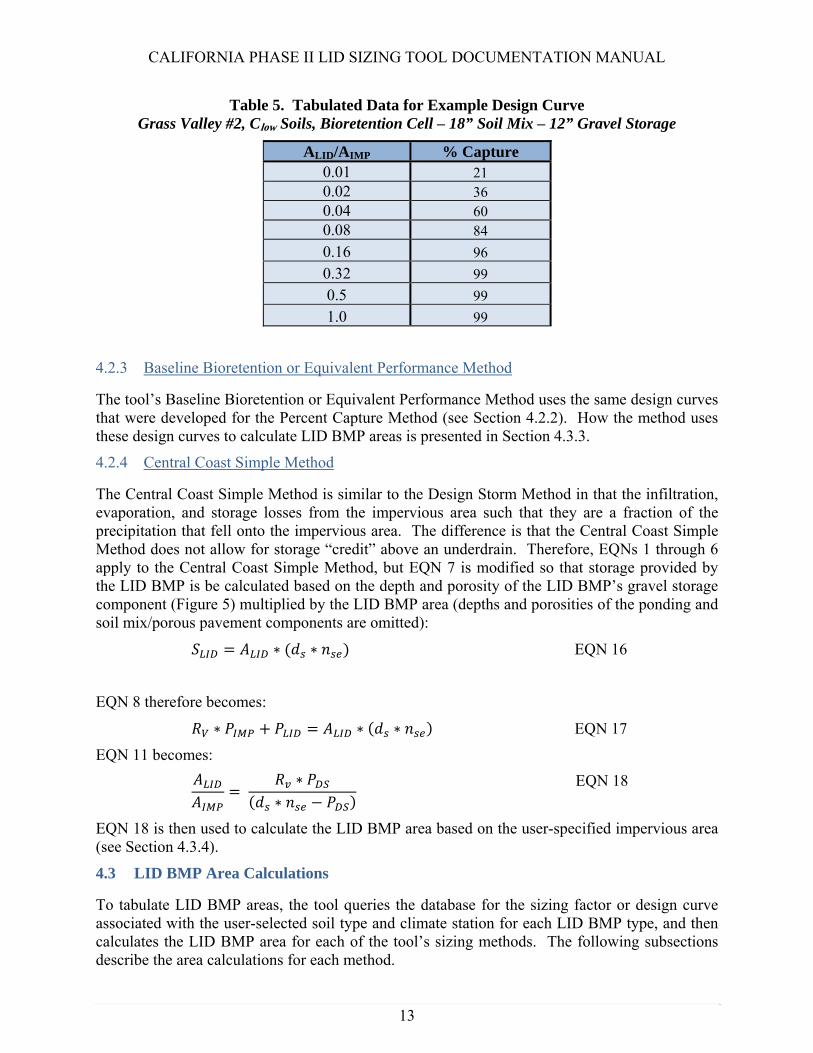
For each location-soil type-LID BMP type scenario, the design curve stored in the tool’s database consists of the calculated percent capture and its associated sizing factor (i.e., the fraction of LID BMP area to impervious area). The database stores the design curve in a tabular format. Figure 7 and Table 5 show an example curve and its tabulated values, respectively. These curves are then used to calculate the LID BMP area based on the user-specified impervious area (see Section 4.3.2).
Figure 7. Example Design Curve
0102030405060708090100
0 0.2 0.4 0.6 0.8 1
% Cap
ture
ALID/AIMP
Climate Station: Grass Valley #2Project Soil Type: Clow
Bioretention Cell ‐ 18" Soil ‐ 12" Storage
EQN 13
EQN 14
EQN 15
CALIFORNIA PHASE II LID SIZING TOOL DOCUMENTATION MANUAL
13
Table 5. Tabulated Data for Example Design Curve Grass Valley #2, Clow Soils, Bioretention Cell – 18” Soil Mix – 12” Gravel Storage
ALID/AIMP % Capture 0.01 21 0.02 36 0.04 60 0.08 84
0.16 96
0.32 99
0.5 99
1.0 99
4.2.3 Baseline Bioretention or Equivalent Performance Method
The tool’s Baseline Bioretention or Equivalent Performance Method uses the same design curves that were developed for the Percent Capture Method (see Section 4.2.2). How the method uses these design curves to calculate LID BMP areas is presented in Section 4.3.3.
4.2.4 Central Coast Simple Method
The Central Coast Simple Method is similar to the Design Storm Method in that the infiltration, evaporation, and storage losses from the impervious area such that they are a fraction of the precipitation that fell onto the impervious area. The difference is that the Central Coast Simple Method does not allow for storage “credit” above an underdrain. Therefore, EQNs 1 through 6 apply to the Central Coast Simple Method, but EQN 7 is modified so that storage provided by the LID BMP is be calculated based on the depth and porosity of the LID BMP’s gravel storage component (Figure 5) multiplied by the LID BMP area (depths and porosities of the ponding and soil mix/porous pavement components are omitted):
∗ ∗ EQN 16
EQN 8 therefore becomes:
∗ ∗ ∗ EQN 17
EQN 11 becomes:
∗
∗
EQN 18 is then used to calculate the LID BMP area based on the user-specified impervious area (see Section 4.3.4).
4.3 LID BMP Area Calculations
To tabulate LID BMP areas, the tool queries the database for the sizing factor or design curve associated with the user-selected soil type and climate station for each LID BMP type, and then calculates the LID BMP area for each of the tool’s sizing methods. The following subsections describe the area calculations for each method.
EQN 18

CALIFORNIA PHASE II LID SIZING TOOL DOCUMENTATION MANUAL
14
4.3.1 Design Storm Method
To calculate the LID BMP areas for the Design Storm Method, the tool queries the database for the sizing factors (ALID/AIMP) associated with the 85th percentile, 24-hour storm for each LID BMP type. The sizing factors are then multiplied by the user-defined impervious area and the LID BMP areas are tabulated.
Some regions are adopting design storm requirements based on criteria other than the 85th
percentile design storm. For example, the Central Coast Regional Water Quality Control Board (RWQCB) includes design storm sizing requirements based on the 95th percentile storm. To accommodate these situations, the tool allows the user to input an alternate design storm depth. The tool queries the database for each LID BMP’s characteristics and calculates sizing factors using EQN 11. These alternative sizing factors are then multiplied by the user-defined impervious area to determine the LID BMP area. Note that while the tool’s database contains the 85th percentile design storm depth, it does not currently contain depths for other design storms, so users would need to check with their local resources to obtain them.
4.3.2 Percent Capture Method
To calculate the LID BMP areas for the Percent Capture Method, the tool queries the database for the design curves discussed in Section 4.2.2. The Phase II permit allows LID BMP sizing based on 80% capture, so the tool multiplies the sizing factor associated with this 80% capture by the user-defined impervious area to calculate the LID BMP area. In the case that 80% capture is not a defined point on the design curve, the tool interpolates to obtain the appropriate sizing factor.
4.3.3 Baseline Bioretention or Equivalent Performance Method
The Phase II permit allows implementation of LID BMPs that are designed to be at least as effective as a bioretention system with permit-specified characteristics, one of which is a sizing factor of 4% of the tributary impervious area. The tool’s Baseline Bioretention or Equivalent Performance Method addresses this sizing option. For the user-defined climate station, the tool queries the percent capture database for the “permit-prescribed” bioretention LID BMP type having a sizing factor of 4%, and looks up the respective percent capture. The tool then determines the sizing factors for all other LID BMP types for the permit-prescribed bioretention percent capture, multiples the factors by the user-defined impervious area, and tabulates the resulting LID BMP areas for each LID BMP type.
4.3.4 Central Coast Simple Method
For the Central Coast Method, the tool queries the database for the sizing factors (ALID/AIMP) associated with the 85th percentile, 24-hour storm for each LID BMP type. Other, user-specified design storms may be used as is allowed for the Design Storm Method (see Section 4.3.1). The sizing factors are then multiplied by the user-defined impervious area and the LID BMP areas are tabulated.
CALIFORNIA PHASE II LID SIZING TOOL DOCUMENTATION MANUAL
15
5.0 TOOL INTERFACE
This section describes the interface of the tool, including the project information that the user must input and the results and output provided by the tool.
5.1 Tool Input
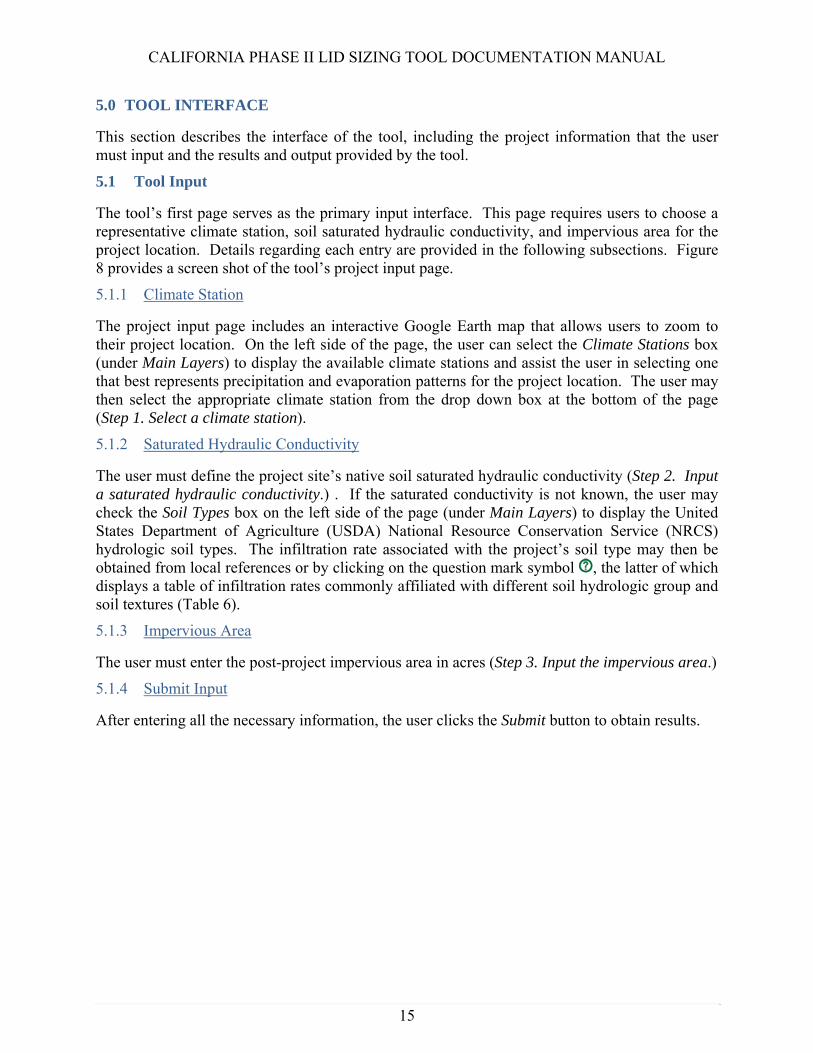
The tool’s first page serves as the primary input interface. This page requires users to choose a representative climate station, soil saturated hydraulic conductivity, and impervious area for the project location. Details regarding each entry are provided in the following subsections. Figure 8 provides a screen shot of the tool’s project input page.
5.1.1 Climate Station
The project input page includes an interactive Google Earth map that allows users to zoom to their project location. On the left side of the page, the user can select the Climate Stations box (under Main Layers) to display the available climate stations and assist the user in selecting one that best represents precipitation and evaporation patterns for the project location. The user may then select the appropriate climate station from the drop down box at the bottom of the page (Step 1. Select a climate station).
5.1.2 Saturated Hydraulic Conductivity
The user must define the project site’s native soil saturated hydraulic conductivity (Step 2. Input a saturated hydraulic conductivity.) . If the saturated conductivity is not known, the user may check the Soil Types box on the left side of the page (under Main Layers) to display the United States Department of Agriculture (USDA) National Resource Conservation Service (NRCS) hydrologic soil types. The infiltration rate associated with the project’s soil type may then be obtained from local references or by clicking on the question mark symbol , the latter of which displays a table of infiltration rates commonly affiliated with different soil hydrologic group and soil textures (Table 6).
5.1.3 Impervious Area
The user must enter the post-project impervious area in acres (Step 3. Input the impervious area.)
5.1.4 Submit Input
After entering all the necessary information, the user clicks the Submit button to obtain results.

CALIFORNIA PHASE II LID SIZING TOOL DOCUMENTATION MANUAL
16
Figure 8. Project Input Page of the CA Phase II LID Sizing Tool

CALIFORNIA PHASE II LID SIZING TOOL DOCUMENTATION MANUAL
17
Table 6. Suggested Infiltration Rates
Soil Hydrologic Group Infiltration
Rate1 (in/hr) Soil Texture
Infiltration Rate2 (in/hr)
A >1.42 Sand 4.74 B 0.57 – 1.42 Loamy Sand 1.18 C 0.06 – 0.57 Sandy Loam 0.43 D <0.06 Silt Loam 0.26
1USDA NRCS 2007 Loam 0.13 Sandy Clay Loam 0.06 Clay Loam 0.04 Silty Clay Loam 0.04 Sandy Clay 0.02 Silty Clay 0.02 Clay 0.01
2EPA 2010
5.2 Tool Output
Tool results are provided in two different output forms: 1) the LID BMP Area Tables, and 2) the LID BMP Summary Page. These outputs are intended to be used as an output package for pre-development meetings, applications, and discussions with local regulators. The following subsections describe each of these outputs.
5.2.1 LID BMP Area Tables
There are two types of LID BMP Area Tables, those for Site Design Measures (SDMs) and those for Storm Water Treatment Measures (SWTMs). To comply with the Phase II permit, SDMs must first be implemented to the extent technically feasible before implementing SWTMs. SDMs must be sized using the 85th percentile, 24-hour design storm, or other design storm as adopted by the local regulators. The following LID BMPs for the CA Phase II LID Sizing Tool are considered SDMs: porous pavement, amended strips and swales, and capture and use storage. Figure 9 presents a screenshot of tabulated areas for SDMs resulting from a 1.0 acre impervious catchment located near Chico, California on soils having an infiltration rate of 1.0 in/hr. The table provides LID BMP areas only for the Design Storm Method; this is the only method allowed by the permit for SDM sizing. The result is based on a default 85th percentile design storm (the permit-specified design storm), but the user may override this design storm by entering an alternative depth in the Select a design storm depth in inches cell located below the table and clicking the Submit button.
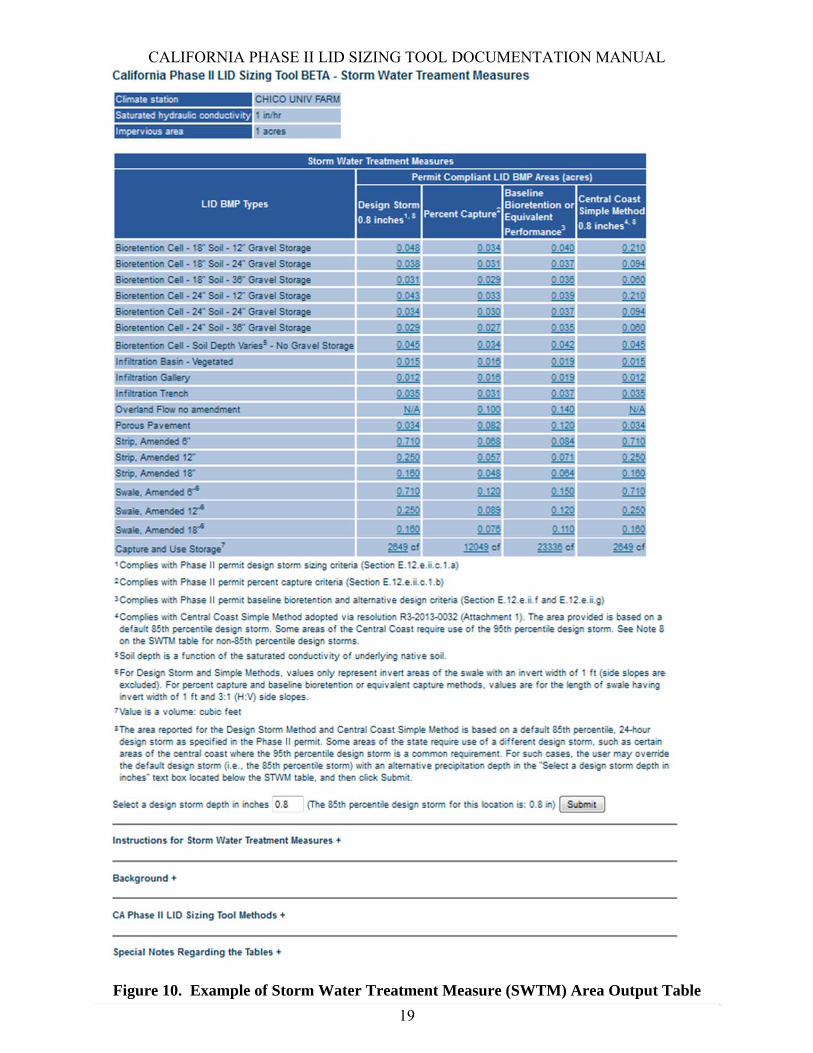
If 100% of the design storm runoff cannot be reduced by a single SDM, a combination of SDMs should be considered. Directions for doing so are available by clicking Instructions for Site Design Measures below the table. If a combination of SDMs cannot achieve 100% reduction, SWTMs may be used. To view areas for SWTMs, the user clicks the Next button below the SDM table. Figure 10 presents a screenshot of the SWTMs page. SWTMs may be sized using a variety of methods specified in the Phase II Permit. Any of the LID BMPs and sizing methods from the CA Phase II LID Sizing Tool may be used (subject to approval by local regulators). Users can override the default 85th percentile design storm by inputting a depth in the Select a design storm depth in inches cell located below the table and clicking the Submit button. Instructions are provided for calculating reduced SWTM areas based on pre-selected SDM areas (click on Instructions for Storm Water Treatment Measures below the table).

CALIFORNIA PHASE II LID SIZING TOOL DOCUMENTATION MANUAL
18
Figure 9. Example of Site Design Measure (SDM) Area Output Table
CALIFORNIA PHASE II LID SIZING TOOL DOCUMENTATION MANUAL
19
Figure 10. Example of Storm Water Treatment Measure (SWTM) Area Output Table

CALIFORNIA PHASE II LID SIZING TOOL DOCUMENTATION MANUAL
20
5.2.2 LID BMP Summary Page
From either the SDM or SWTM Area Tables, users can click on the area for the LID BMP type and sizing method of their choice, which directs them to an LID BMP summary page. Figure 11 provides an overview screen shot of the LID BMP Summary Page for the 0.034 acre Bioretention Cell – 18” soil – 12” Gravel Storage of Figure 9. The summary page provides the following information:
Tabulation of the project information (including the input values, resulting areas, and sizing method) (Figure 12; Area 1 on Figure 11)
Narrative description of the LID BMP, profile schematic of the LID BMP and associated characteristics (ponding depth, soil mix depth, storage depth, porosities), and notes on the design assumptions and references for the LID BMP (Figure 13; Area 2 on Figure 11)
Narrative description of the sizing methodology (Figure 14; Area 3 on Figure 11) Links for the user to evaluate other selection criteria, such as relevant design,
construction, maintenance, costs, water quality performance, and feasibility assessments (Figure 15; Area 4 on Figure 11).

CALIFORNIA PHASE II LID SIZING TOOL DOCUMENTATION MANUAL
21
Figure 11. Example of LID BMP Summary Page – Overview (See Figures 12 through 15 for detailed views)
Figure 12. Example of LID BMP Summary Page - Tabulation of the Project Information

CALIFORNIA PHASE II LID SIZING TOOL DOCUMENTATION MANUAL
22
Figure 13. Example of LID BMP Summary Page – LID BMP Description

CALIFORNIA PHASE II LID SIZING TOOL DOCUMENTATION MANUAL
23
Figure 14. Example of LID BMP Summary Page – Sizing Methodology
Figure 15. Example of LID BMP Summary Page – Links for Construction, Cost, Maintenance, and other Relevant Information

CALIFORNIA PHASE II LID SIZING TOOL DOCUMENTATION MANUAL
24
6.0 REFERENCES
California Regional Water Resources Control Board Central Coast Region (CA RWQCB Central Coast). Post-Construction Stormwater Management Requirements for Development Projects in the Central Coast Region. Attachment 1. Resolution No. R3-2013-0032. July 12, 2013. Environmental Protection Agency (EPA). 2010. Storm Water Management Model User’s Manual Version 5.0. EPA/600/R-05/040. Revised July 2010.
Environmental Protection Agency (EPA). 2013. Storm Water Management Model Version 5.0.022 with Low Impact Development (LID) Controls. Accessed April 2013. http://www.epa.gov/nrmrl/wswrd/wq/models/swmm/
State Water Resources Control Board (SWRCB). 2013. State Water Resources Control Board Water Quality Order No. 2013-0001-DWQ National Pollutant Discharge Elimination System (NPDES) General Permit No. CAS000004 Waste Discharge Requirements (WDRS) for Storm Water Discharges From Municipal Separate Storm Sewer Systems (MS4s) (General Permit). February 2013.
United State Department of Agriculture National Resource Conservation Service (USDA NRSC). 2007. National Engineering Handbook. Part 630 Hydrology. Chapter 7 Hydrologic Soil Groups. May 2007.
Water Environment Federation and American Society of Civil Engineers (WEF and ASCE). 1998. Urban Runoff Quality Management. WEF Manual of Practice No. 23/ASCE Manual of Practice No. 87. Pages 175-178.

Appendix A CA Phase II LID Sizing Tool
LID BMP Fact Sheets

This page left blank intentionally

CA Phase II LID Sizing Tool LID BMP Fact Sheet: Bioretention Cells
Page 1 of 4
Description
Bioretention cells are depressed landscapes into which runoff is directed and allowed to pond, filter, and infiltrate. Some bioretention cells modeled by the CA Phase II LID Sizing Tool consist of the design parameters specified in Section E.12.e.ii.f.3 of the Phase II permit, including a 6” ponding depth underlain by 18” of bioretention soil mix and 12”, 24”, or 36” of gravel storage. (The Phase II permit requires a minimum storage depth of 12”). The ponding zone allows for temporary storage of runoff and promotes percolation into the bioretention mix, where runoff is also stored in the mix’s pore structure, as well as filtered and biotreated. The runoff eventually drains into the gravel layer below which provides a third storage component. A perforated underdrain is located at the top of the gravel storage component to prevent overflow of the system. This system is unlined to allow infiltration into the underlying native soils. The Central Coast Regional Water Quality Control Board (Region 3) has adopted a variation on the permit‐prescribed bioretention cell, where the soil mix depth is to be 24”, and so the tool includes bioretention cells having 6” of ponding, 24” of soil mix, and 12”, 24”, or 36” of gravel storage (with an underdrain).
1. SWRCB, 2013; LID standard for Bioretention page 54. CCRWQCB, 2013; post‐construction requirement for water quality treatment page 4.
2. Effective porosity (total porosity ‐ field capacity): VA DCR 2011, 25%; District DOE, 30%; WI DNR 2010 27%; Prince George 2013 30%; NC State 2009, 30% . LID Center 2010, 30%. Assume Total porosity = 30% + field capacity
3. Caltrans 2010, 35% for infiltration trenches. City of Santa Barbara 2008, 30‐40% commonly 32%; WI DNR 2010 33%; NC State 2009, effective porosity 25%. Assume field capacity = 0
4. USEPA 2010. Field Capacity for Loamy Sand = 0.105 5. Excavation depths should consider root uplift and expansion within the soil mix layer

CA Phase II LID Sizing Tool LID BMP Fact Sheet: Bioretention Cells
Page 2 of 4
Alternative Design
In cases where native soils are highly permeable and no underdrain is necessary, the tool includes an alternative bioretention cell consisting only of a ponding zone and soil (bioretention) mix zone, both having depths dependent on the native soil’s saturated conductivity. These alternative bioretention cells do not have a gravel storage component or an underdrain.
1. City of Sacramento et al. 2007, used for design of infiltration trench depth 2. City of Sacramento et al. 2007, 72 hours. However, provides a factor of safety for open‐
atmosphere ponding and vector issues. 3. Chosen as a more feasible alternative for well‐draining soil 4. 24 hours selected to avoid over ponding 5. Excavation depths should consider root uplift and expansion within the soil mix layer

CA Phase II LID Sizing Tool LID BMP Fact Sheet: Bioretention Cells
Page 3 of 4
Design, Cost, Maintenance, and Other Resources
EPA Fact Sheet: http://cfpub.epa.gov/npdes/stormwater/menuofbmps/index.cfm?action=browse&Rbutton=det
ail&bmp=72&minmeasure=5 Construction http://www.lid‐stormwater.net/bio_schedule.htm Costs http://www.lid‐stormwater.net/bio_costs.htm Maintenance http://www.lid‐stormwater.net/bio_maintain.htm Specifications http://www.lid‐stormwater.net/biolowres_specs.htm http://www.lid‐stormwater.net/biohighres_specs.htm http://www.lid‐stormwater.net/biocomind_specs.htm http://www.lid‐stormwater.net/biotrans_specs.htm Watershed Benefits http://www.lid‐stormwater.net/bio_benefits.htm
General References
LID Feasibility Screening Tool, Contech – coming soon CASQA LID Portal https://www.casqa.org/resources/california‐lid‐portal Central Coast LID Initiative http://centralcoastlidi.org/Central_Coast_LIDI/Technical_Guidance.html EPA National Stormwater Calculator http://water.epa.gov/polwaste/green/ Low Impact Development (LID) Urban Design Tools Website http://www.lid‐stormwater.net/ EPA BMP Fact Sheets for Post‐Construction Stormwater Management in New and Redevelopment http://cfpub.epa.gov/npdes/stormwater/menuofbmps/index.cfm?action=min_measure&min_
measure_id=5 http://cfpub.epa.gov/npdes/stormwater/menuofbmps/index.cfm?action=factsheet_results&vie
w=specific&bmp=81

CA Phase II LID Sizing Tool LID BMP Fact Sheet: Bioretention Cells
Page 4 of 4
This page left blank intentionally

CA Phase II LID Sizing Tool LID BMP Fact Sheet: Porous Pavement
Page 1 of 2
Description
Porous pavement is a paved pervious surface underlain by a gravel storage zone. The pavement consists of less fine aggregates than traditional concrete or asphalt, and the larger pore spaces that result allow for temporary storage of runoff. The runoff eventually drains into the gravel layer below which provides an additional storage component and allows infiltration into the underlying native soils. The porous pavement modeled by the CA Phase II LID Sizing Tool assumes a pavement thickness of 5” with a gravel storage depth dependent on the saturated conductivity of the underlying native soils.
1. City of Sacramento et al. 2007, 5” for personal vehicles or pickups. Thicker for heavier vehicles 2. NRMCA 2004, 15%; City of Sacramento et al. 2007, 15‐21%; CA SEAGRANT et al. 2009, 15‐25%
for pervious concrete and 30‐40% for open graded aggregate; USEPA 2010, void ratios 12‐21% (η = e/(1+e)); CO RMCA 2009, 15‐25%
3. NRMCA 2013, 270‐450 in/hr; CA SEAGRANT et al. 2009, 480 in/hr for pervious concrete and thousands of inches/hr for open graded aggregate
4. City of Sacramento et al. 2007, used for design of infiltration trench depth. Add 6” freeboard. 5. Caltrans 2009, 72 hours; City of Santa Barbara 2008, 72 hours for infiltration BMPs. Storage is
covered so not a vector concern. Use 72 hours for soils with a saturated conductivity less than 0.33 in/h (most C and D soils). Higher conductivity soils will result in gravel storage depths greater than the maximum, so use 55” of gravel storage for A and B soils.
6. NRMCA 2004, 40%; Cahill Associates 2006, 40%; CoRC 2013, 38‐40% 7. ASCE 2007, 0.013; Rameriz, A. 0.03 8. Assumes overflow is accomplished at the surface. If a subsurface overflow is used under the
pavement layer, the gravel storage depth should be increased by the vertical distance from the surface to the subsurface spill or underdrain..

CA Phase II LID Sizing Tool LID BMP Fact Sheet: Porous Pavement
Page 2 of 2
Design, Cost, Maintenance, and Other Resources
EPA Factsheet for Pervious Concrete Pavement http://cfpub.epa.gov/npdes/stormwater/menuofbmps/index.cfm?action=browse&Rbutton=detail&bmp=137&minmeasure=5
EPA Factsheet for Pervious Asphalt Pavement
http://cfpub.epa.gov/npdes/stormwater/menuofbmps/index.cfm?action=browse&Rbutton=detail&bmp=135&minmeasure=5
Construction http://www.lid‐stormwater.net/permpavers_schedule.htm Costs http://www.lid‐stormwater.net/permpaver_costs.htm Maintenance http://www.lid‐stormwater.net/permpavers_maintain.htm Specifications http://www.lid‐stormwater.net/permpaver_specs.htm Watershed Benefits http://www.lid‐stormwater.net/permpavers_benefits.htm General References
LID Feasibility Screening Tool, Contech – coming soon CASQA LID Portal https://www.casqa.org/resources/california‐lid‐portal Central Coast LID Initiative http://centralcoastlidi.org/Central_Coast_LIDI/Technical_Guidance.html EPA National Stormwater Calculator http://water.epa.gov/polwaste/green/ Low Impact Development (LID) Urban Design Tools Website http://www.lid‐stormwater.net/ EPA BMP Fact Sheets http://cfpub.epa.gov/npdes/stormwater/menuofbmps/index.cfm?action=min_measure&min_
measure_id=5 http://cfpub.epa.gov/npdes/stormwater/menuofbmps/index.cfm?action=factsheet_results&vie
w=specific&bmp=81
CA Phase II LID Sizing Tool LID BMP Fact Sheet: Capture and Use Storage
Page 1 of 2
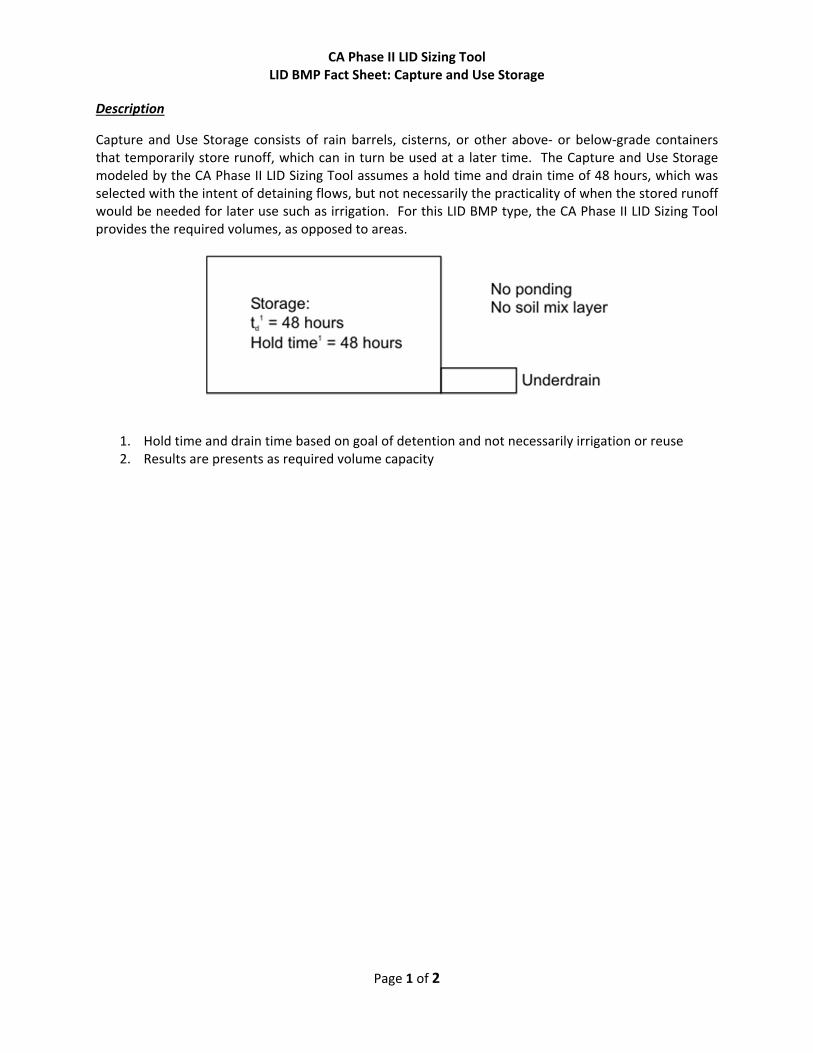
Description
Capture and Use Storage consists of rain barrels, cisterns, or other above‐ or below‐grade containers that temporarily store runoff, which can in turn be used at a later time. The Capture and Use Storage modeled by the CA Phase II LID Sizing Tool assumes a hold time and drain time of 48 hours, which was selected with the intent of detaining flows, but not necessarily the practicality of when the stored runoff would be needed for later use such as irrigation. For this LID BMP type, the CA Phase II LID Sizing Tool provides the required volumes, as opposed to areas.
1. Hold time and drain time based on goal of detention and not necessarily irrigation or reuse 2. Results are presents as required volume capacity

CA Phase II LID Sizing Tool LID BMP Fact Sheet: Capture and Use Storage
Page 2 of 2
Design, Cost, Maintenance, and Other Resources
Construction http://www.lid‐stormwater.net/raincist_construct.htm Costs http://www.lid‐stormwater.net/raincist_cost.htm Maintenance http://www.lid‐stormwater.net/raincist_maintain.htm Specification http://www.lid‐stormwater.net/raincist_specs.htm Watershed Benefits http://www.lid‐stormwater.net/raincist_benefits.htm General References
LID Feasibility Screening Tool, Contech – coming soon CASQA LID Portal https://www.casqa.org/resources/california‐lid‐portal Central Coast LID Initiative http://centralcoastlidi.org/Central_Coast_LIDI/Technical_Guidance.html EPA National Stormwater Calculator http://water.epa.gov/polwaste/green/ Low Impact Development (LID) Urban Design Tools Website http://www.lid‐stormwater.net/ EPA BMP Fact Sheets http://cfpub.epa.gov/npdes/stormwater/menuofbmps/index.cfm?action=min_measure&min_
measure_id=5 http://cfpub.epa.gov/npdes/stormwater/menuofbmps/index.cfm?action=factsheet_results&vie
w=specific&bmp=81

CA Phase II LID Sizing Tool LID BMP Fact Sheet: Amended Strip
Page 1 of 2
Description
An amended strip consists of a gently sloped, vegetated surface over which runoff is allowed to sheet flow. The soil underlying the strip is amended with compost to increase its porosity and infiltration capacity, thereby increasing the storage volume within the underlying soils and the infiltration rates into the native soil below. The strips modeled by the CA Phase II LID Sizing Tool include amended depths of 6”, 12”, and 18”, and apply for slopes ranging in grade from 1‐15%.
1. SWRCB, 2013; LID standard for Bioretention page 54. CCRWQCB, 2013; post‐construction requirement for water quality treatment page 4.
2. Effective porosity (total porosity ‐ field capacity): VA DCR 2011, 25%; District DOE, 30%; WI DNR 2010 27%; Prince George 2013 30%; NC State 2009, 30% . LID Center 2010, 30%. Assume Total porosity = 30% + field capacity
3. Soil amendment allows for enhanced infiltration into the native soil below 4. Assumes vegetation does not hinder infiltration into the amendment

CA Phase II LID Sizing Tool LID BMP Fact Sheet: Amended Strip
Page 2 of 2
Design, Cost, Maintenance, and Other Resources
EPA Factsheet http://cfpub.epa.gov/npdes/stormwater/menuofbmps/index.cfm?action=factsheet_results&view=specific&bmp=76
Construction http://www.lid‐stormwater.net/soilamend_construct.htm Cost http://www.lid‐stormwater.net/soilamend_costs.htm Maintenance http://www.lid‐stormwater.net/soilamend_maintain.htm Specification http://www.lid‐stormwater.net/soilamend_specs.htm Watershed Benefits http://www.lid‐stormwater.net/soilamend_benefits.htm
General References
LID Feasibility Screening Tool, Contech – coming soon CASQA LID Portal https://www.casqa.org/resources/california‐lid‐portal Central Coast LID Initiative http://centralcoastlidi.org/Central_Coast_LIDI/Technical_Guidance.html EPA National Stormwater Calculator http://water.epa.gov/polwaste/green/ Low Impact Development (LID) Urban Design Tools Website http://www.lid‐stormwater.net/ EPA BMP Fact Sheets for Post‐Construction Stormwater Management in New and Redevelopment http://cfpub.epa.gov/npdes/stormwater/menuofbmps/index.cfm?action=min_measure&min_
measure_id=5 http://cfpub.epa.gov/npdes/stormwater/menuofbmps/index.cfm?action=factsheet_results&vie
w=specific&bmp=81

CA Phase II LID Sizing Tool LID BMP Fact Sheet: Amended Swale
Page 1 of 2
Description
An amended swale consists of a gently sloped, vegetated channel through which runoff is allowed to sheet flow. The soil underlying the swale is amended with compost to increase its porosity and infiltration capacity, thereby increasing the storage volume within the underlying soils and the infiltration rates into the native soil below. The amended swales modeled by the CA Phase II LID Sizing Tool include amended depths of 6”, 12”, and 18” with a 2% longitudinal slope (in the direction of flow) and side slopes of 3:1 (run:rise).
1. SWRCB, 2013; LID standard for Bioretention page 54. CCRWQCB, 2013; post‐construction requirement for water quality treatment page 4.
2. Effective porosity (total porosity ‐ field capacity): VA DCR 2011, 25%; District DOE, 30%; WI DNR 2010 27%; Prince George 2013 30%; NC State 2009, 30% . LID Center 2010, 30%. Assume Total porosity = 30% + field capacity
3. Soil amendment allows for enhanced infiltration into the native soil below 4. Assumes vegetation does not hinder infiltration into the amendment

CA Phase II LID Sizing Tool LID BMP Fact Sheet: Amended Swale
Page 2 of 2
Design, Cost, Maintenance, and Other Resources
EPA Factsheet http://cfpub.epa.gov/npdes/stormwater/menuofbmps/index.cfm?action=browse&Rbutton=det
ail&bmp=75&minmeasure=5 Construction http://www.lid‐stormwater.net/soilamend_construct.htm Cost http://www.lid‐stormwater.net/soilamend_costs.htm Maintenance http://www.lid‐stormwater.net/soilamend_maintain.htm Specifications http://www.lid‐stormwater.net/soilamend_specs.htm Watershed Benefits http://www.lid‐stormwater.net/soilamend_benefits.htm
General References
LID Feasibility Screening Tool, Contech – coming soon CASQA LID Portal https://www.casqa.org/resources/california‐lid‐portal Central Coast LID Initiative http://centralcoastlidi.org/Central_Coast_LIDI/Technical_Guidance.html EPA National Stormwater Calculator http://water.epa.gov/polwaste/green/ Low Impact Development (LID) Urban Design Tools Website http://www.lid‐stormwater.net/ EPA BMP Fact Sheets for Post‐Construction Stormwater Management in New and Redevelopment http://cfpub.epa.gov/npdes/stormwater/menuofbmps/index.cfm?action=min_measure&min_
measure_id=5 http://cfpub.epa.gov/npdes/stormwater/menuofbmps/index.cfm?action=factsheet_results&vie
w=specific&bmp=81

CA Phase II LID Sizing Tool LID BMP Fact Sheet: Overland Flow
Page 1 of 2
Description
Overland flow consists of an existing vegetated strip with no soil amendment. Runoff is allowed to sheet flow across the strip, where the vegetation provides filtration and attenuation. The LID BMP type may be ideal where there is a large amount of available space or where the native soils are highly conductive. Overland flows modeled by the CA Phase II LID Sizing Tool apples to strips having 1‐15% slopes.
1. This LID BMP is an alternative to the more engineered LID BMPs

CA Phase II LID Sizing Tool LID BMP Fact Sheet: Overland Flow
Page 2 of 2
Design, Cost, Maintenance, and Other Resources
EPA Factsheet http://cfpub.epa.gov/npdes/stormwater/menuofbmps/index.cfm?action=factsheet_results&view=specific&bmp=76
General References
LID Feasibility Screening Tool, Contech – coming soon CASQA LID Portal https://www.casqa.org/resources/california‐lid‐portal Central Coast LID Initiative http://centralcoastlidi.org/Central_Coast_LIDI/Technical_Guidance.html EPA National Stormwater Calculator http://water.epa.gov/polwaste/green/ Low Impact Development (LID) Urban Design Tools Website http://www.lid‐stormwater.net/ EPA BMP Fact Sheets for Post‐Construction Stormwater Management in New and Redevelopment http://cfpub.epa.gov/npdes/stormwater/menuofbmps/index.cfm?action=min_measure&min_
measure_id=5 http://cfpub.epa.gov/npdes/stormwater/menuofbmps/index.cfm?action=factsheet_results&view=specific&bmp=81

CA Phase II LID Sizing Tool LID BMP Fact Sheet: Infiltration Trench
Page 1 of 2
Description
Infiltration trenches are engineered structures that provide storage and facilitate infiltration of runoff into the subsurface. Infiltration trenches are typically long and narrow and filled with aggregate. The trenches modeled by the CA Phase II LID Sizing Tool were modeled having a depth dependent on the saturated conductivity of the underlying native soils.
1. City of Sacramento et al. 2007, used for design of infiltration trench depth 2. City of Santa Barbara 2008, 72 hours for infiltration BMPs. Storage is covered so not a vector
concern 3. Caltrans 2010, 35% for infiltration trenches; City of Santa Barbara 2008, 30‐40% commonly 32%;
WA DOE 2012, 30‐40%; WI DNR 2010, 33%; NC State 2009, effective 25%. Assume field capacity = 0

CA Phase II LID Sizing Tool LID BMP Fact Sheet: Infiltration Trench
Page 2 of 2
Design, Cost, Maintenance, and Other Resources
EPA Factsheet http://cfpub.epa.gov/npdes/stormwater/menuofbmps/index.cfm?action=browse&Rbutton=det
ail&bmp=70&minmeasure=5
General References
LID Feasibility Screening Tool, Contech – coming soon CASQA LID Portal https://www.casqa.org/resources/california‐lid‐portal Central Coast LID Initiative http://centralcoastlidi.org/Central_Coast_LIDI/Technical_Guidance.html EPA National Stormwater Calculator http://water.epa.gov/polwaste/green/ Low Impact Development (LID) Urban Design Tools Website http://www.lid‐stormwater.net/ EPA BMP Fact Sheets for Post‐Construction Stormwater Management in New and Redevelopment http://cfpub.epa.gov/npdes/stormwater/menuofbmps/index.cfm?action=min_measure&min_
measure_id=5

CA Phase II LID Sizing Tool LID BMP Fact Sheet: Infiltration Gallery
Page 1 of 2
Description
Infiltration galleries are engineered structures that provide storage and facilitate infiltration of runoff into the subsurface. They consist of one or more horizontal or vertical perforated containers. The galleries modeled by the CA Phase II LID Sizing Tool were modeled having depths dependent on the saturated conductivity of the underlying native soils.
1. City of Sacramento et al. 2007, used for design of infiltration trench depth 2. City of Santa Barbara 2008, 72 hours for infiltration BMPs. Storage is covered so not a vector
concern.

CA Phase II LID Sizing Tool LID BMP Fact Sheet: Infiltration Gallery
Page 2 of 2
Design, Cost, Maintenance, and Other Resources
EPA Factsheet http://cfpub.epa.gov/npdes/stormwater/menuofbmps/index.cfm?action=browse&Rbutton=det
ail&bmp=70&minmeasure=5
General References
LID Feasibility Screening Tool, Contech – coming soon CASQA LID Portal https://www.casqa.org/resources/california‐lid‐portal Central Coast LID Initiative http://centralcoastlidi.org/Central_Coast_LIDI/Technical_Guidance.html EPA National Stormwater Calculator http://water.epa.gov/polwaste/green/ Low Impact Development (LID) Urban Design Tools Website http://www.lid‐stormwater.net/ EPA BMP Fact Sheets for Post‐Construction Stormwater Management in New and Redevelopment http://cfpub.epa.gov/npdes/stormwater/menuofbmps/index.cfm?action=min_measure&min_
measure_id=5

CA Phase II LID Sizing Tool LID BMP Fact Sheet: Vegetated Infiltration Basin
Page 1 of 2
Description
Vegetated Infiltration Basins are shallow, vegetated basins designed to provide storage and promote infiltration of runoff into the underlying native soils. The basins modeled by the CA Phase II LID Sizing Tool assumed a surface storage depth dependent on the saturated conductivity of the underlying native soils.
1. City of Sacramento et al. 2007, used for design of infiltration trench depth 2. City of Sacramento et al. 2007, could use 72 hours but 48 provides a factor of safety for open‐
atmosphere ponding and vector issues. 3. Assumes vertical slopes. If slopes are laid back, areas must be recalculated manually.

CA Phase II LID Sizing Tool LID BMP Fact Sheet: Vegetated Infiltration Basin
Page 2 of 2
Design, Cost, Maintenance, and Other Resources
EPA Factsheet http://cfpub.epa.gov/npdes/stormwater/menuofbmps/index.cfm?action=browse&Rbutton=detail&bmp=69&minmeasure=5
General References
LID Feasibility Screening Tool, Contech – coming soon CASQA LID Portal https://www.casqa.org/resources/california‐lid‐portal Central Coast LID Initiative http://centralcoastlidi.org/Central_Coast_LIDI/Technical_Guidance.html EPA National Stormwater Calculator http://water.epa.gov/polwaste/green/ Low Impact Development (LID) Urban Design Tools Website http://www.lid‐stormwater.net/ EPA BMP Fact Sheets for Post‐Construction Stormwater Management in New and Redevelopment http://cfpub.epa.gov/npdes/stormwater/menuofbmps/index.cfm?action=min_measure&min_
measure_id=5

CA Phase II LID Sizing Tool LID BMP Fact Sheet References
Page 1 of 2
American Society of Civil Engineers (ASCE) 2007. Restoring Our Natural Habitat Proceedings of the 2007 World Environmental and Water Resources Congress. May 2007.
Cahill Associates 2006. Porous Asphalt with Subsurface Infiltration/Storage Bed. Retrieved October 2009. http://www.thcahill.com/pasphalt.html.
California Department of Transportation (Caltrans) 2009. Draft Fully Permeable Pavement Design Study Technical Memorandum. CTSW‐TM‐09‐0172.55.1D. January 2009.
California Department of Transportation (Caltrans) 2010. Stormwater Quality Handbooks Project Planning and Design Guide. CTSW‐RT‐10‐254.03. July 2010.
California Regional Water Quality Control Board Central Coast Region (CCRWQCB) 2013. Post‐Construction Stormwater Management Requirements for Development Projects in the Central Coast Region. Resolution No. R3‐2013‐0032. Attachment 1. July 2013.
California Seagrant Extension University of California Cooperative Extension (CA SEAGRANT et al.) 2009. Permeable Paving. June 2009. Retrieved November 2013. http://www‐csgc.ucsd.edu/BOOKSTORE/documents/GS6_Permeable_Paving.pdf .
City of Redwood City Stormwater Pollution Prevention Program (CoRC) 2013. Design Guidelines for Permeable Pavements. Retrieved November 2013.. http://www.redwoodcity.org/bit/infrastructure/pdf/DesignGuidelinesforPermeablePavements.pdf.
City of Sacramento, City of Citrus Heights, City of Elk Grove, City of Folsom, City of Galt, City of Rancho Cordova, City of Roseville, County of Sacramento 2007. Stormwater Quality Design Manual for the Sacramento and South Placer Regions. May 2007.
City of Santa Barbara 2008. Storm Water BMP Guidance Manual. June 2008.
District of Columbia Department of the Environment (District DOE) 2013. The River Smart Rain Garden Rebate. Retrieved November 2013. http://ddoe.dc.gov/sites/default/files/dc/sites/ddoe/publication/attachments/Rebate%20Rain%20Garden%20Design%20Specs.pdf.
Colorado Ready Mixed Concrete Association (CO RMCA) 2009. Specifiers Guide for Pervious Concrete Pavement Design – Version 1.2. August 2009.
Low Impact Development Center, Inc. (LID Center) 2010. Low Impact Development Manual for Southern California. April 2010.
National Ready Mixed Concrete Association (NRMCA) 2004. Pervious Concrete Pavement. 2004.
National Ready Mixed Concrete Association (NRMCA) 2013. Pervious Pavement An Infiltration BMP – A LID Technique. Retrieved December 2013. http://www.epa.gov/region9/water/tribal‐CWA‐workshop/docs/ProtectingWaterQualityWithLID.pdf
North Carolina Cooperative Extension (NC Co‐op) 2009. Designing Bioretention with an Internal Water Storage (IWS) Layer Design Guidance for an Innovative Bioretention Feature. November 2009.

CA Phase II LID Sizing Tool LID BMP Fact Sheet References
Page 2 of 2
State Water Resources Control Board (SWRCB) 2013. State Water Resources Control Board Water Quality Order No. 2013‐0001‐DWQ National Pollutant Discharge Elimination System (NPDES) General Permit No. CAS000004 Waste Discharge Requirements (WDRS) for Storm Water Discharges From Municipal Separate Storm Sewer Systems (MS4s) (General Permit). February 2013.
Prince George’s County, Maryland 2013. Bioretention Design Specifications and Criteria. Retrieved November 2013. http://www.leesburgva.gov/modules/ShowDocument.aspx?documentid=5057.
Rameriz, A. 2008. Untitled Presentation, with Objective to “Evaluate Various Surface Materials in Urban Parking Areas to Reduce Stormwater Runoff and Annual Pollutant Loads”. Retrieved December 2013. http://www.google.com/url?sa=t&rct=j&q=&esrc=s&source=web&cd=2&ved=0CC4QFjAB&url=http%3A%2F%2Fwww.ce.utexas.edu%2Fprof%2Fmaidment%2FGradHydro2008%2FApr24%2FRamirez.ppt&ei=TCieUtmwIcXzoATZ94KwBA&usg=AFQjCNGjFqYyWMQPU6GD6AKlvEk‐FoNtEQ&bvm=bv.57155469,d.cGU
United States Environmental Protection Agency (USEPA) 2010. USEPA Storm Water Management Model User’s Manual Version 5.0. July 2010.
Virginia Department of Conservation and Recreation (VA DCR), 2011. VIRGINIA DCR Stormwater Design Speicification No. 9 Bioretention Version 1.9. March 2011.
Washington State Department of Ecology Water Quality Program (WA DOE) 2012. Stormwater Management Manual for Western Washington Volume III Hydrologic Analysis and Flow Control BMPs. August 2012
Wisconsin Department of Natural Resources (WI DNR) 2010. Conservation Practice Standard Bioretention for Infiltration (1004). November 2010.

Appendix B CA Phase II LID Sizing Tool
SWMM Input Parameters

This page left blank intentionally

CA Phase II LID Sizing Tool SWMM Input Parameters: Amended Strip, Overland Flow, Vegetated Swale
Page 1 of 4
LID BMP:
amended stripoverland flow w/no
amendmentamended swale
SWMM LID:
vegetated swale
Rain gage ‐ Name of the ra in gage associated with the subcatchment. Gage name Gage name Gage name
Outlet ‐ Name of the node or subcatchment that recieves the subcatchment's runoff. outlet name outlet name outlet name
Area acre Area of the subcatchment, including any LID control s (acres or hectares ). varies varies varies
Width ftCharacteris tic width of the overland flow path for sheet flow runoff (feet or
meters). (More)area/100 area/100 area/100
% slope % Average percent s lope of the subcatchment. 5 2 2
% impervious % Percent of the l and area (not including any LIDs ) which i s impervious . 0 0 0
N‐imp ‐Manning's n for overland flow over the impervious portion of the subcatchment
(Typica l Values).0.01 0.01 0.01
N‐perv ‐Manning's n for overland flow over the pervious portion of the subcatchment
(Typica l Values).
0.4 0.13
assume bermuda
grass for amended
strips , natura l for
overland flow
0.02assume bermuda
grass
Dstore‐Imperv inDepth of depress ion s torage on the impervious portion of the subcatchment
(inches or mil l imeters ) (Typica l Values).0.05 0.05 0.05
Dstore‐perv in
Depth of depress ion s torage on the pervious portion of the subcatchment
(inches or mil l imeters ) (Typica l Values).
(6", 12",
18")*effective
poros i ty of 0.30
0.2
For Amended s trip,
assume amended
soi l has same
effective poros i ty
as bioretention
soi l mix
(6", 12",
18")*effective
poros i ty of 0.30
For Amended s trip,
assume amended
soi l has same
effective poros i ty
has bioretention
soi l mix
%Zero‐Imperv % Percent of the impervious area with no depress ion storage. 0 0 0
Subarea Routing ‐
Choice of internal routing of runoff between pervious and impervious areas :
imperv ‐ runoff from pervious area flows to impervious area
; perv ‐ runoff from impervious flows to pervious area ; outlet ‐ runoff from both
areas flows directly to outlet
outlet outlet outlet
Percent Routed % Percent of runoff routed between subareas 100 100 100
Infiltration ‐Cl ick the el l ips is button (or press Enter) to edit infi l tration parameters for the
subcatchmentGreen Ampt Green Ampt Green Ampt
LID Controls ‐Cl ick the el l ips is button (or press Enter) to edit the use of low impact
development controls in the subcatchment.NA NA vegetated swale
GW ‐Cl ick the el l ips is button (or press Enter) to edit groundwater flow parameters
for the subcatchment.NA NA NA
SnowPack ‐ Name of snow pack parameter set (i f any) ass igned to the subcatchment. NA NA NA
LandUses ‐Cl ick the el l ips is button (or press Enter) to ass ign land uses to the
subcatchment.NA NA NA
Initial Buildup ‐Cl ick the el l ips is button (or press Enter) to speci fy ini tia l quanti ties of pol lutant
bui ldup over the subcatchment.NA NA NA
Curb Length ‐Tota l length of curbs in the subcatchment (any length uni ts ). Used only when
pol lutant bui ldup i s normal ized to curb l ength. NA NA NA
paramenter description
sub‐catchment vegetated swale
Notes Notessubcatchment
input parameterunit
sub‐catchment
SWMM LID:
LID BMP:

CA Phase II LID Sizing Tool SWMM Input Parameters: Amended Strip, Overland Flow, Vegetated Swale
Page 2 of 4
surface storage depth in
When confining wal ls or berms are present this i s the maximum depth to which
water can pond above the surface of the unit before overflow occurs (in inches
or mm). For LIDs that experience overland flow i t i s the height of any surface
depress ion storage. For swales , i t i s the height of i ts trapezoidal cross section.
NA NAsubcatchment i s
modeled as BMP6
height of
trapezoidal cross
section
surface vegetation
volume fraction
volume
fraction
The fraction of the volume within the storage depth fi l led with vegetation. This
i s the volume occupied by stems and leaves , not thei r surface area coverage.
Normal ly this volume can be ignored, but may be as high as 0.1 to 0.2 for very
dense vegetative growth.
NA NAsubcatchment i s
modeled as BMP0.15
surface roughness
(Manning's n)
Manning's
n
Manning's n for overland flow over the surface of porous pavement or a
vegetative swale (see this table for suggested values ). Use 0 for other types of
LIDs
NA NAsubcatchment i s
modeled as BMP0.4
assume bermuda
grass
surface slope %Slope of porous pavement surface or vegetative swale (percent). Use 0 for other
types of LIDs .NA NA
subcatchment i s
modeled as BMP2
swale side slope run/riseSlope (run over rise) of the s ide wal ls of a vegetative swale's cross section. This
value i s ignored for other types of LIDs .NA NA
subcatchment i s
modeled as BMP3
top width of overland
flow surfacein ft or m
width of the outflow face of each identica l LID unit. Only appl ies to LID
processes such as PP and veg swales that use overland flow to convery suface
runoff off of the unit. (the other LID processes such as bioretention cel ls and
infi l tration trenches s imply spi l l any excess captured runoff over thier berms
NA NAsubcatchment i s
modeled as BMP4
6" depth @ 3:1
(run:rise) ‐ 1.5+1.5 =
3 feet; add 1 foot
bottom width
soil thickness in
The thickness of the soi l layer (inches or mm). Typica l values range from 18 to 36
inches (450 to 900 mm) for ra in gardens, street planters and other types of l and‐
based bio‐retention units , but only 3 to 6 inches (75 to 150 mm) for green roofs .
NA NAsubcatchment i s
modeled as BMPNA NA for swales
soil porosityvolume
fractionThe volume of pore space relative to tota l volume of soi l (as a fraction). NA NA
subcatchment i s
modeled as BMPNA NA for swales
soil field capacityvolume
fraction
Volume of pore water relative to tota l volume after the soi l has been al lowed
to dra in ful l y (as a fraction). Below thi s level , vertica l dra inage of water through
the soi l layer does not occur.
NA NAsubcatchment i s
modeled as BMPNA NA for swales
soil wilting pointvolume
fraction
Volume of pore water relative to tota l volume for a wel l dried soi l where only
bound water remains (as a fraction). The moisture content of the soi l cannot
fa l l below this l imit.
NA NAsubcatchment i s
modeled as BMPNA NA for swales
soil conductivity in/hr Hydraul i c conductivi ty for the ful ly saturated soi l (in/hr or mm/hr) NA NAsubcatchment i s
modeled as BMPNA NA for swales
soil conductivity slope ‐Slope of the curve of log(conductivi ty) versus soi l moisture content
(dimens ionless). Typica l values range from 5 for sands to 15 for s i l ty clay.NA NA
subcatchment i s
modeled as BMPNA NA for swales
soil suction head inThe average value of soi l capi l lary suction along the wetting front (inches or
mm). This i s the same parameter as used in the Green‐Ampt infi l tration model .NA NA
subcatchment i s
modeled as BMPNA NA for swales
paramenter description Notes Notesamended swaleLID input
parameterunit amended strip
overland flow w/no
amendment

CA Phase II LID Sizing Tool SWMM Input Parameters: Amended Strip, Overland Flow, Vegetated Swale
Page 3 of 4
storage height in
This i s the height of a ra in barrel or thickness of a gravel layer (inches or mm).
Crushed s tone and gravel l ayers are typica l ly 6 to 18 inches (150 to 450 mm) thick
whi le s ingle fami ly home ra in barrel s range in height from 24 to 36 inches (600
to 900 mm).
NA NAsubcatchment i s
modeled as BMPNA NA for swales
storage void ratiovoids/solid
s
The volume of void space relative to the volume of sol ids in the l ayer. Typica l
values range from 0.5 to 0.75 for gravel beds . Note that poros i ty = void ratio / (1 +
void ratio). Does not apply to ra in barrel s
NA NAsubcatchment i s
modeled as BMPNA NA for swales
storage conductivity in/hr
The rate at which water infi l tra tes into the native soi l below the layer (in
inches/hour or mm/hour).This would typica l l y be the Saturated Hydraul ic
Conductivi ty of the surrounding subcatchment i f Green‐Ampt infi l tration i s used
or the Minimum Infi l tration Rate for Horton infi l tration. If there i s an
impermeable floor or l iner below the layer then use a value of 0. does not
apply to ra in barrels
NA NAsubcatchment i s
modeled as BMPNA NA for swales
storage cloggin factor ‐
Tota l volume of treated runoff i t takes to completely clog the bottom of the
layer divided by the void volume of the layer. Use a value of 0 to ignore clogging.
Clogging progress ively reduces the Infi l tration Rate in direct proportion to the
cumulative volume of runoff treated and may only be of concern for infi l tration
trenches with permeable bottoms and no under dra ins . Refer to the Pavement
Layer page for more discuss ion of the Clogging Factor. Does not apply to ra in
barrels
NA NAsubcatchment i s
modeled as BMPNA NA for swales
underdrain coefficient in/hr NA NAsubcatchment i s
modeled as BMPNA NA for swales
underdrain exponent ‐ NA NAsubcatchment i s
modeled as BMPNA NA for swales
underdrain offset height inHeight of any underdra in piping above the bottom of a s torage layer or ra in
barrel (inches or mm).NA NA
subcatchment i s
modeled as BMPNA NA for swales
underdrain delay hrs
The number of dry weather hours that must elapse before the dra in l ine in a
ra in barrel i s opened (the l ine i s assumed to be closed once ra infa l l begins).
This parameter i s ignored for other types of LIDs
NA NAsubcatchment i s
modeled as BMPNA NA for swales
overland flow w/no
amendmentNotes amended swale Notes
LID input
parameterunit paramenter description amended strip
Coeffi cient C and exponent n that determines the rate of flow through the
underdra in as a function of height of s tored water above the dra in height. The
fol lowing equation i s used to compute this flow rate (per unit area of the LID
unit):q = C(h‐Hd)n where q i s outflow (in/hr or mm/hr), h height of stored water
(inches or mm), and Hd i s the dra in height. If the l ayer does not have an
underdra in then set C to 0. A typica l value for n would be 0.5 (making the dra in
act l i ke an ori fice). A rough estimate for C can be based on the time T required
to dra in a depth D of stored water. For n = 0.5, C = 2D1/2/T does not apply to ra in
barrels

CA Phase II LID Sizing Tool SWMM Input Parameters: Amended Strip, Overland Flow, Vegetated Swale
Page 4 of 4
pavement thickness inThe thickness of the pavement layer (inches or mm). Typica l values are 4 to 6
inches (100 to 150 mm). NA NA
subcatchment i s
modeled as BMPNA NA for swales
pavement void ratiovoids/solid
s
The volume of void space relative to the volume of sol ids in the pavement for
continuous sys tems or for the fi l l materia l used in modular sys tems . Typica l
values for pavements are 0.12 to 0.21. Note that poros i ty = void ratio / (1 + void
ratio).
NA NAsubcatchment i s
modeled as BMPNA NA for swales
pavement impervious
surface fraction‐
Ratio of impervious paver materia l to tota l area for modular sys tems; 0 for
continuous porous pavement systems .NA NA
subcatchment i s
modeled as BMPNA NA for swales
pavement permeability in/hr
Permeabi l i ty of the concrete or asphalt used in continuous systems or hydraul ic
conductivi ty of the fi l l materia l (gravel or sand) used in modular sys tems (in/hr
or mm/hr). The permeabi l i ty of new porous concrete or aspha lt i s very high (e.g.,
hundreds of in/hr) but can drop off over time due to clogging by fine
particulates in the runoff (see below).
NA NAsubcatchment i s
modeled as BMPNA NA for swales
pavement clogging
factor‐
Number of pavement layer void volumes of runoff treated i t takes to completely
clog the pavement. Use a value of 0 to i gnore clogging. Clogging progress ively
reduces the pavement's permeabi l i ty in direct proportion to the cumulative
volume of runoff treated. If one has an estimate of the number of years i t takes
to ful ly clog the system (Yclog), the Clogging Factor can be computed as: Yclog *
Pa * CR * (1 + VR) * (1 ‐ ISF) / (T * VR) where Pa i s the annual ra infa l l amount over
the s i te, CR i s the pavement's capture ratio (area that contributes runoff to the
pavement divided by area of the pavement i tsel f), VR i s the sys tem's Void Ratio,
ISF i s the Impervious Surface Fraction, and T i s the pavement layer Thickness .
As an example, suppose i t takes 5 years to clog a continuous porous pavement
sys tem that serves an area where the annual ra infa l l i s 36 inches/year. If the
pavement i s 6 inches thick, has a void ratio of 0.2 and captures runoff only from
i ts own surface, then the Clogging Factor i s 5 x 36 x (1 + 0.2) / 6 / 0.2 = 180.
NA NAsubcatchment i s
modeled as BMPNA NA for swales
LID input
parameterunit paramenter description amended strip
overland flow w/no
amendmentNotes amended swale Notes

CA Phase II LID Sizing Tool SWMM Input Parameters: Infiltration Trench, Infiltration Gallery, Rain Barrel
Page 1 of 4
LID BMP:
sand bed/infiltration
trenchinfiltration gallery
reuse storage ‐> hold
& release
SWMM LID:
rain barrel
Rain gage Gage name Gage name Gage name
Outlet outlet name outlet name outlet name
Area varies varies varies
Width area/100 area/100
% slope 2 2 2
% impervious 0 0 0
N‐imp 0.01 0.01 0.01
N‐perv 0.02 0.02 0.02
Dstore‐Imperv 0.05 0.05 0.05
Dstore‐perv 0.2 0.2 0.2
%Zero‐Imperv 0 0 0
Subarea Routing outlet outlet outlet
Percent Routed 100 100 100
Infiltration Green Ampt Green Ampt Green Ampt
LID Controls infi l tration trench infi l tration trench rain barrel
GW NA NA NA
SnowPack NA NA NA
LandUses NA NA NA
Initial Buildup NA NA NA
Curb Length NA NA NA
subcatchment
input parameter
LID BMP:
infiltration trench
Notes
rain barrel
NotesSWMM LID:
infiltration trench

CA Phase II LID Sizing Tool SWMM Input Parameters: Infiltration Trench, Infiltration Gallery, Rain Barrel
Page 2 of 4
surface storage depth 0 0No ponding for
Infi l tration trench
or ga l lery
NA NA for ra in barrel s
surface vegetation
volume fractionNA NA
NA for infi l tration
trenchNA NA for ra in barrel s
surface roughness
(Manning's n)0 0
0 for non porous
pavement or swale0
0 for non porous
pavement or swale
surface slope 0 00 for non porous
pavement or swale0
0 for non porous
pavement or swale
swale side slope NA NANA for infi l tration
trenchNA NA for ra in barrel s
top width of overland
flow surfaceNA NA
NA for infi l tration
trenchNA NA for ra in barrel s
soil thickness NA NANA for infi l tration
trenchNA NA for ra in barrel s
soil porosity NA NANA for infi l tration
trenchNA NA for ra in barrel s
soil field capacity NA NANA for infi l tration
trenchNA NA for ra in barrel s
soil wilting point NA NANA for infi l tration
trenchNA NA for ra in barrel s
soil conductivity NA NANA for infi l tration
trenchNA NA for ra in barrel s
soil conductivity slope NA NANA for infi l tration
trenchNA NA for ra in barrel s
soil suction head NA NANA for infi l tration
trenchNA NA for ra in barrel s
LID input
parameterNotesNotes
sand bed/infiltration
trenchinfiltration gallery
reuse storage ‐> hold
& release

CA Phase II LID Sizing Tool SWMM Input Parameters: Infiltration Trench, Infiltration Gallery, Rain Barrel
Page 3 of 4
storage heightksat(native)*td/ηs; min
of 6"2*[ksat(native)*td/ηs]
for trench and
ga l lery: td = 72
hours ; for trench ns
= 0.35; for ga l lery,
ns = 1 and multiple
depth by 2 to
account for void
ratio of 0.999
36
storage void ratio 0.54 0.99
poros ity of trench=
0.35 = e/(1+e) so e
= 0.54; poros ity of
ga l lery = .75 so e =
3=n/(1‐n) but
SWMM doesn't
take e>1, so
Assumee= 0.99
multiply storage
height by 2/3 to
s imulate
NA NA for ra in barrel s
storage conductivityvaries depending
on underlying soi l
varies depending
on underlying
soi l
native soi l
dependetNA NA for ra in barrel s
storage cloggin factor 0 0
Assume BMPs are
wel l mainta ined
with no clogging
NA NA for ra in barrel s
underdrain coefficient 0 5.0000no underdra in for
trench 0.1
NA for ra in barrels ,
but requi res an
input value
underdrain exponent 0 0.5
no underdra in for
trench; for gal lery,
assume
underdra in acts
l ike ori fi ce, so UD
exp (n) = 0.5
0.1
NA for ra in barrels ,
but requi res an
input value
underdrain offset height 0storage height ‐
1"
no underdra in for
trench; for
ga l lery,SWMM
doesn't l et UD go
at top of storage
0
underdrain delay NA NANA for infi l tration
trench48
LID input
parameterNotes
sand bed/infiltration
trenchinfiltration gallery Notes
reuse storage ‐> hold
& release
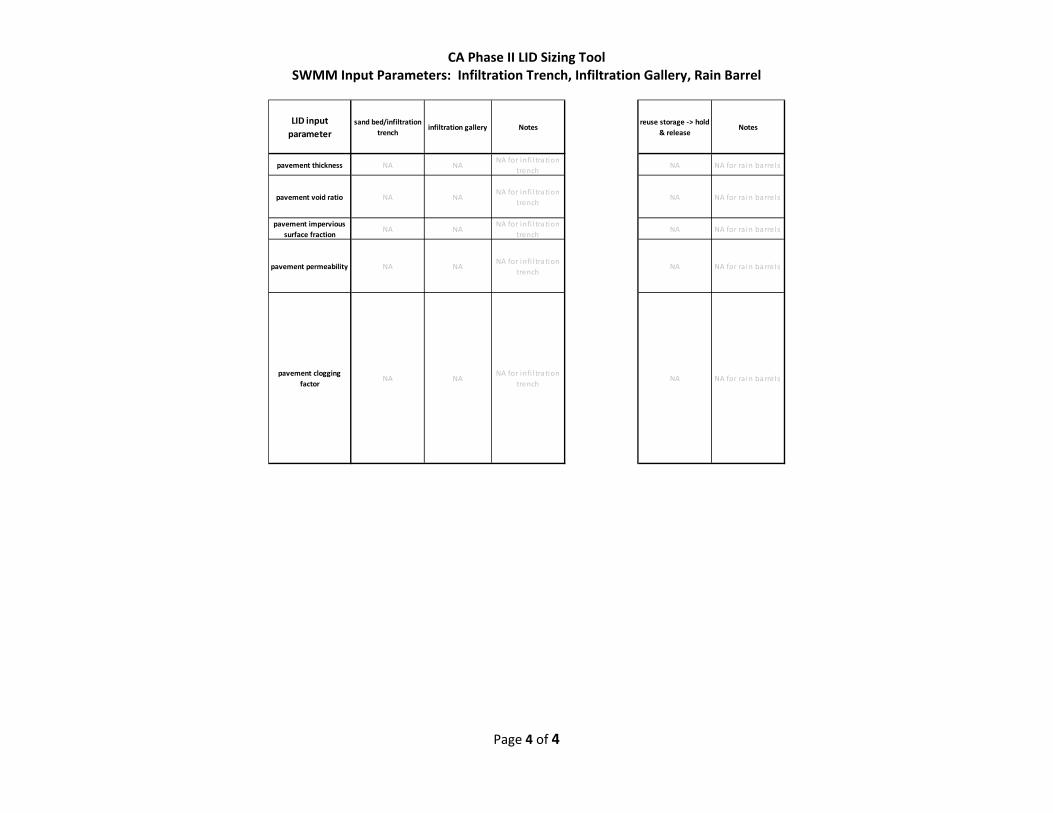
CA Phase II LID Sizing Tool SWMM Input Parameters: Infiltration Trench, Infiltration Gallery, Rain Barrel
Page 4 of 4
pavement thickness NA NANA for infi l tration
trenchNA NA for ra in barrel s
pavement void ratio NA NANA for infi l tration
trenchNA NA for ra in barrel s
pavement impervious
surface fractionNA NA
NA for infi l tration
trenchNA NA for ra in barrel s
pavement permeability NA NANA for infi l tration
trenchNA NA for ra in barrel s
pavement clogging
factorNA NA
NA for infi l tration
trenchNA NA for ra in barrel s
sand bed/infiltration
trenchinfiltration gallery Notes
reuse storage ‐> hold
& releaseNotes
LID input
parameter

CA Phase II LID Sizing Tool SWMM Input Parameters: Bioretention Cells, Vegetated Infiltration Basin, Porous Pavement
Page 1 of 4
LID BMP:Bioretention Cell
18 in. Soil Mix
12, 24, or 36 in.
Gravel Storage
Bio Retention Cell
24 in. Soil Mix
12, 24, or 36 in.
Gravel Storage
Bioretention Cell
Soil Depth Varies
No Gravel Storage
vegetated infiltration
basinporous pavement
SWMM LID:
porous pavement
Rain gage Gage name Gage name Gage name Gage name Gage name
Outlet outlet name outlet name outlet name outlet name outlet name
Area varies varies varies varies varies
Width area/100 area/100 area/100 area/100 area/100
% slope 2 2 2 2 0.5
% impervious 0 0 0 0 0
N‐imp 0.01 0.01 0.01 0.01 0.01
N‐perv 0.02 0.02 0.02 0.02 0.02
Dstore‐Imperv 0.05 0.05 0.05 0.05 0.05
Dstore‐perv 0.2 0.2 0.2 0.2 0.1
%Zero‐Imperv 0 0 0 0 0
Subarea Routing outlet outlet outlet outlet outlet
Percent Routed 100 100 100 100 100
Infiltration Green Ampt Green Ampt Green Ampt Green Ampt Green Ampt
LID Controls bioretention cel l bioretention cel l bioretention cel l bioretention cel l porous pavement
GW NA NA NA NA NA
SnowPack NA NA NA NA NA
LandUses NA NA NA NA NA
Initial Buildup NA NA NA NA NA
Curb Length NA NA NA NA NA
LID BMP:
Notessubcatchment
input parameter
bioretention cell porous pavement
Notes
SWMM LID:
bioretention cell
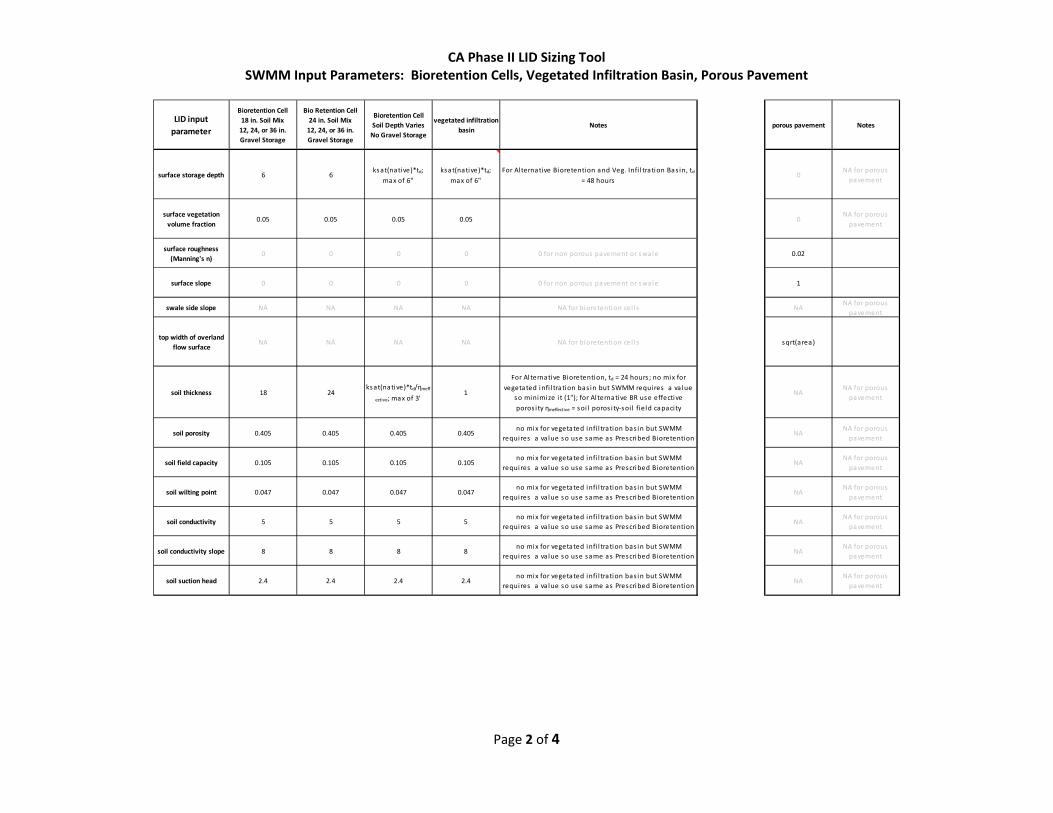
CA Phase II LID Sizing Tool SWMM Input Parameters: Bioretention Cells, Vegetated Infiltration Basin, Porous Pavement
Page 2 of 4
surface storage depth 6 6ksat(native)*td;
max of 6"
ksat(native)*td;
max of 6"
For Alternative Bioretention and Veg. Infi l tration Bas in, td
= 48 hours0
NA for porous
pavement
surface vegetation
volume fraction0.05 0.05 0.05 0.05 0
NA for porous
pavement
surface roughness
(Manning's n)0 0 0 0 0 for non porous pavement or swale 0.02
surface slope 0 0 0 0 0 for non porous pavement or swale 1
swale side slope NA NA NA NA NA for bioretention cel l s NANA for porous
pavement
top width of overland
flow surfaceNA NA NA NA NA for bioretention cel l s sqrt(area)
soil thickness 18 24ksat(native)*td/ηmeff
ective; max of 3'1
For Alternative Bioretention, td = 24 hours ; no mix for
vegetated infi l tration bas in but SWMM requires a va lue
so minimize i t (1"); for Alternative BR use effective
poros i ty ηmeffective = soi l poros i ty‐soi l field capaci ty
NANA for porous
pavement
soil porosity 0.405 0.405 0.405 0.405no mix for vegetated infi l tration bas in but SWMM
requires a va lue so use same as Prescribed BioretentionNA
NA for porous
pavement
soil field capacity 0.105 0.105 0.105 0.105no mix for vegetated infi l tration bas in but SWMM
requires a va lue so use same as Prescribed BioretentionNA
NA for porous
pavement
soil wilting point 0.047 0.047 0.047 0.047no mix for vegetated infi l tration bas in but SWMM
requires a va lue so use same as Prescribed BioretentionNA
NA for porous
pavement
soil conductivity 5 5 5 5no mix for vegetated infi l tration bas in but SWMM
requires a va lue so use same as Prescribed BioretentionNA
NA for porous
pavement
soil conductivity slope 8 8 8 8no mix for vegetated infi l tration bas in but SWMM
requires a va lue so use same as Prescribed BioretentionNA
NA for porous
pavement
soil suction head 2.4 2.4 2.4 2.4no mix for vegetated infi l tration bas in but SWMM
requires a va lue so use same as Prescribed BioretentionNA
NA for porous
pavement
Notesporous pavementNotesLID input
parameter
Bioretention Cell
Soil Depth Varies
No Gravel Storage
vegetated infiltration
basin
Bioretention Cell
18 in. Soil Mix
12, 24, or 36 in.
Gravel Storage
Bio Retention Cell
24 in. Soil Mix
12, 24, or 36 in.
Gravel Storage

CA Phase II LID Sizing Tool SWMM Input Parameters: Bioretention Cells, Vegetated Infiltration Basin, Porous Pavement
Page 3 of 4
storage height 12 12 0 1
Assume no storage or underdra in for al ternative
bioretention; For Veg. Infi l tration Bas in assume 1" to
s imulate infi l tration below
Ksat(native)*td/ns+6,
min of 6", Max of 5'
Assume ns = 0.40.
td = 48 hours for
A&B soi l s , 72 hours
for C&D soi l s
storage void ratio 0.54 0.54 0 0.54
Assume no storage or underdra in for al ternative
bioretention; For Veg. Infi l tration Bas in assume
Prescribed Bioretention to s imulate infi l tration below
0.67
storage conductivityvaries depending
on underlying soi l
varies depending
on underlying soi l
varies depending
on underlying soi l
varies depending
on underlying soi lnative soi l dependet
varies depending
on underlying soi l
native soi l
dependet
storage cloggin factor 0 0 0 0
Assume no storage or underdra in for al ternative
bioretention or inf bas in; assume BMPs are wel l
mainta ined with no clogging
0 ignore
underdrain coefficient 1.021 1.021 0 0Assume no storage or underdra in for al ternative
bioretention or inf bas in0
Assume no
underdra in
underdrain exponent 0.5 0.5 0 0
Assume no storage or underdra in for al ternative
bioretention or inf bas in; assume underdra in acts l i ke
ori fi ce, so UD exp (n) = 0.5
0Assume no
underdra in
underdrain offset
height11 11 0 0
Assume no storage or underdra in for al ternative
bioretention or inf bas in0
Assume no
underdra in
underdrain delay NA NA NA NA NA for bioretention cel l s NANA for porous
pavement
Notes porous pavementvegetated infiltration
basinNotes
Bioretention Cell
18 in. Soil Mix
12, 24, or 36 in.
Gravel Storage
Bio Retention Cell
24 in. Soil Mix
12, 24, or 36 in.
Gravel Storage
Bioretention Cell
Soil Depth Varies
No Gravel Storage
LID input
parameter

CA Phase II LID Sizing Tool SWMM Input Parameters: Bioretention Cells, Vegetated Infiltration Basin, Porous Pavement
Page 4 of 4
pavement thickness NA NA NA NA NA for bioretention cel l s 5
pavement void ratio NA NA NA NA NA for bioretention cel l s 0.18assume poros i ty of
0.15, e = n/(1‐n)
pavement impervious
surface fractionNA NA NA NA NA for bioretention cel l s 0
pavement permeability NA NA NA NA NA for bioretention cel l s 200
pavement clogging
factorNA NA NA NA NA for bioretention cel l s 0
Assume well
mainta ined BMP
with no clogging
Notes
Bio Retention Cell
24 in. Soil Mix
12, 24, or 36 in.
Gravel Storage
Bioretention Cell
Soil Depth Varies
No Gravel Storage
vegetated infiltration
basinNotes
LID input
parameter
Bioretention Cell
18 in. Soil Mix
12, 24, or 36 in.
Gravel Storage
porous pavement

CA Phase II LID Sizing Tool SWMM Input Parameters: Impervious Catchment
Page 1 of 1
Assume 100% impervious area running off to:
amended
strip
amended
swale
sand
bed/infi l trat
ion trench
reuse
s torage ‐>
hold &
release
prescribed
bioretention
cel l
a l ternative
bioretention
cel l
overland
flow w/no
amendment
infi l tration
ga l lery
porous
pavement
vegetated
infi l tration
bas in
sub‐
catchment
vegetated
swale
infi l tration
trenchrain barrel
bioretention
cel l
bioretention
cel l
sub‐
catchmentra in barrel
porous
pavement
bioretention
cel l
Rain gage ‐ Gage name Gage name Gage name Gage name Gage name Gage name Gage name Gage name Gage name Gage name
Outlet ‐ sub‐catchmentsub‐catchmentsub‐catchmentsub‐catchmentsub‐catchmentsub‐catchmentsub‐catchmentsub‐catchmentsub‐catchmentsub‐catchment
Area acre 1 1 1 1 1 1 1 1 1 1
Width of overland flow ft 435.6 435.6 435.6 435.6 435.6 435.6 435.6 435.6 435.6 435.6
% slope % 2 2 2 2 2 2 2 2 2 2
% impervious % 100 100 100 100 100 100 100 100 100 100
N‐imp ‐ 0.01 0.01 0.01 0.01 0.01 0.01 0.01 0.01 0.01 0.01
N‐perv ‐ 0.02 0.02 0.02 0.02 0.02 0.02 0.02 0.02 0.02 0.02
Dstore‐Imperv in 0.05 0.05 0.05 0.05 0.05 0.05 0.05 0.05 0.05 0.05
Dstore‐perv in 0.2 0.2 0.2 0.2 0.2 0.2 0.2 0.2 0.2 0.2
%Zero‐Imperv % 25 25 25 25 25 25 25 25 25 25
Subarea Routing ‐ outlet outlet outlet outlet outlet outlet outlet outlet outlet outlet
Percent Routed % 100 100 100 100 100 100 100 100 100 100
Infiltration ‐ Green Ampt Green Ampt Green Ampt Green Ampt Green Ampt Green Ampt Green Ampt Green Ampt Green Ampt Green Ampt
LID Controls ‐sub‐
catchment
vegetated
swale
infi l tration
trenchrain barrel
bioretention
cel l
bioretention
cel l
sub‐
catchmentra in barrel
porous
pavement
bioretention
cel l
GW ‐ NA NA NA NA NA NA NA NA NA NA
SnowPack ‐ NA NA NA NA NA NA NA NA NA NA
LandUses ‐ NA NA NA NA NA NA NA NA NA NA
Initial Buildup ‐ NA NA NA NA NA NA NA NA NA NA
Curb Length ‐ NA NA NA NA NA NA NA NA NA NA
N‐perv will not be used ‐ 100% imperv
Dstore‐perv will not be used ‐ 100% imperv
LID BMP:
SWMM LID:
unitsubcatchment input
parameter

Appendix C CA Phase II LID Sizing Tool
Results of Tool Testing

APPENDIX C – RESULTS OF TOOL TESTING
C-1
1.0 INTRODUCTION
This appendix presents the activities and findings for testing of the California Phase II LID Sizing Tool. The following activities were conducted to test the tool’s output:
Comparing the tool results and those from independent SWMM 5 runs
Comparing tool results against those from other established models for three select locations
Comparison of tool results for 85th percentile design storm and those for the tool’s 80% capture requirement
2.0 COMPARISONS TO RESULTS FROM INDEPENDENT RUNS
Independent SWMM 5 runs were conducted for 11 different combinations of LID BMP types and site characteristics. The results from these independent runs were compared to the results obtained from the California Phase II LID Sizing Tool. Table 1 presents the 11 combinations that were tested, along with the volume reductions and differences between the two sources. The results for all combinations differed by less than 1 percent, indicating that the tool’s code (including the input, output, and calculation components) is working properly. Table 1. Comparisons of CA Phase II LID Tool and Independent SWMM 5 Runs
LID BMP Type Native Soil Ksat
a
(in/hr) Climate Station
ALID/AIMPb
Volume Reduction
Difference CA Phase II LID Sizing
Tool
Independent SWMM 5 Simulation
Bioretention Cell ‐ 18" Soil ‐ 12" Gravel Storage
0.3 Chico Univ
Farm 4% 82.21% 82.21% 0%
Bioretention Cell ‐ 24" Soil ‐ 12" Gravel Storage
0.01 Santa Barbara Muni AP
32% 100% 100% 0%
Bioretention Cell ‐ Soil Depth Varies4 ‐ No Gravel Storage
0.1 Eureka WFO
8% 56.32% 56.32% 0.00%
Infiltration Basin ‐ Vegetated 0.04 Grass
Valley #2 16% 88.39% 88.39% 0.00%
Infiltration Gallery 5.0 Modesto 2 50% 100% 100% 0.00%
Infiltration Trench 0.1 Sebastopol 16% 65.19% 65.22% ‐0.03%
Overland Flow 1.0 Red Bluff Muni AP
50% 99.17% 99.17% 0.00%
Porous Pavement 1.0 Boron 2% 41.32% 41.34% ‐0.02%
Strip, Amended 12" 0.01 Victorville Pump PT
4% 28.44% 28.40% 0.04%
Swale, Amended 12" 0.04 Tehachapi
AP 8% 37.21% 37.18% 0.02%
Capture and Use Storage 0.3 San Miguel
Wolf Ranch
32% 100% 100% 0%
a Native soil’s saturated hydraulic conductivity b Ratio of LID BMP area to impervious area
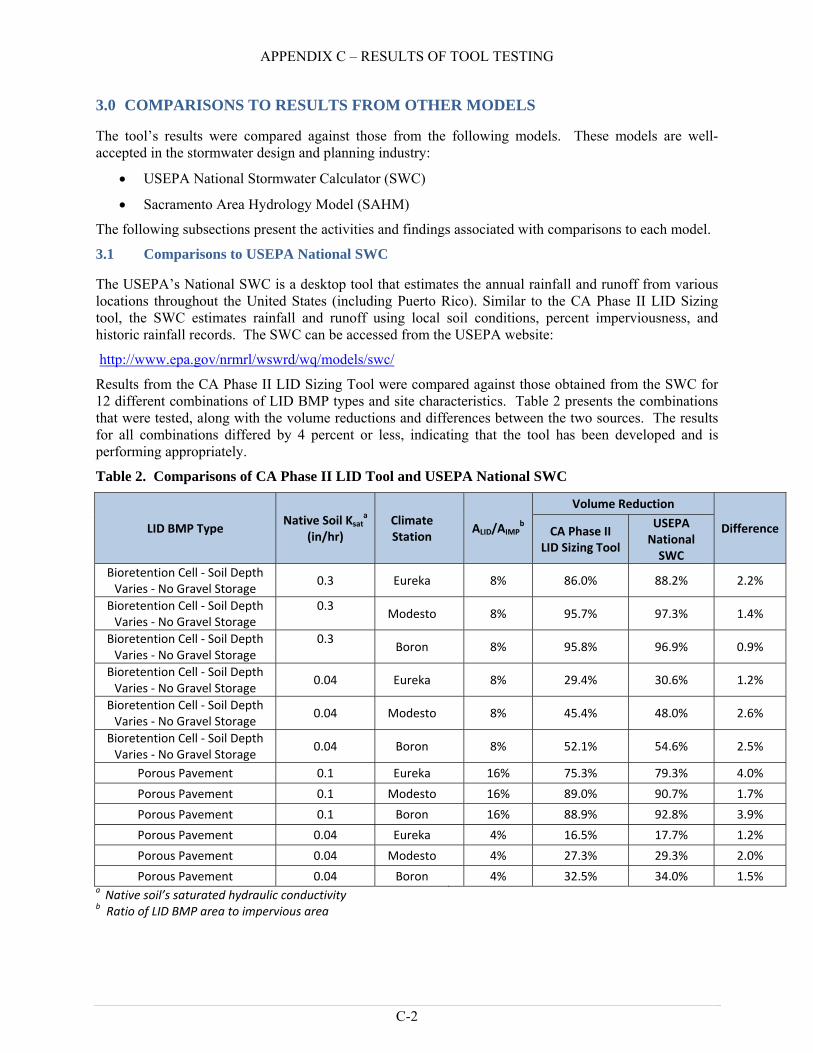
APPENDIX C – RESULTS OF TOOL TESTING
C-2
3.0 COMPARISONS TO RESULTS FROM OTHER MODELS
The tool’s results were compared against those from the following models. These models are well-accepted in the stormwater design and planning industry:
USEPA National Stormwater Calculator (SWC)
Sacramento Area Hydrology Model (SAHM)
The following subsections present the activities and findings associated with comparisons to each model.
3.1 Comparisons to USEPA National SWC
The USEPA’s National SWC is a desktop tool that estimates the annual rainfall and runoff from various locations throughout the United States (including Puerto Rico). Similar to the CA Phase II LID Sizing tool, the SWC estimates rainfall and runoff using local soil conditions, percent imperviousness, and historic rainfall records. The SWC can be accessed from the USEPA website:
http://www.epa.gov/nrmrl/wswrd/wq/models/swc/
Results from the CA Phase II LID Sizing Tool were compared against those obtained from the SWC for 12 different combinations of LID BMP types and site characteristics. Table 2 presents the combinations that were tested, along with the volume reductions and differences between the two sources. The results for all combinations differed by 4 percent or less, indicating that the tool has been developed and is performing appropriately.
Table 2. Comparisons of CA Phase II LID Tool and USEPA National SWC
LID BMP Type Native Soil Ksat
a
(in/hr) Climate Station
ALID/AIMPb
Volume Reduction
Difference CA Phase II LID Sizing Tool
USEPA National SWC
Bioretention Cell ‐ Soil Depth Varies ‐ No Gravel Storage
0.3 Eureka 8% 86.0% 88.2% 2.2%
Bioretention Cell ‐ Soil Depth Varies ‐ No Gravel Storage
0.3
Modesto 8% 95.7% 97.3% 1.4%
Bioretention Cell ‐ Soil Depth Varies ‐ No Gravel Storage
0.3
Boron 8% 95.8% 96.9% 0.9%
Bioretention Cell ‐ Soil Depth Varies ‐ No Gravel Storage
0.04 Eureka 8% 29.4% 30.6% 1.2%
Bioretention Cell ‐ Soil Depth Varies ‐ No Gravel Storage
0.04 Modesto 8% 45.4% 48.0% 2.6%
Bioretention Cell ‐ Soil Depth Varies ‐ No Gravel Storage
0.04 Boron 8% 52.1% 54.6% 2.5%
Porous Pavement 0.1 Eureka 16% 75.3% 79.3% 4.0%
Porous Pavement 0.1 Modesto 16% 89.0% 90.7% 1.7%
Porous Pavement 0.1 Boron 16% 88.9% 92.8% 3.9%
Porous Pavement 0.04 Eureka 4% 16.5% 17.7% 1.2%
Porous Pavement 0.04 Modesto 4% 27.3% 29.3% 2.0%
Porous Pavement 0.04 Boron 4% 32.5% 34.0% 1.5% a Native soil’s saturated hydraulic conductivity b Ratio of LID BMP area to impervious area

APPENDIX C – RESULTS OF TOOL TESTING
C-3
3.2 Comparisons to SAHM
SAHM is a tool that was established for designing LID BMPs in the greater Sacramento area. SAHM was used to simulate the bioretention systems modeled by the CA Phase II LID Sizing Tool and compare results. As with the USEPA National SWC and the CA Phase II LID Sizing Tool, SAHM estimates rainfall and runoff using LID BMP characteristics, local soil conditions, percent imperviousness, and historic rainfall records. SAHM may be accessed from the Sacramento Stormwater Quality Partnership website: http://www.beriverfriendly.net/Newdevelopment/
Results from the CA Phase II LID Sizing Tool Percent Capture sizing method were compared against those obtained from SAHM for multiple LID BMP bioretention facilities and sizes, and two soil types. Although the CA Phase II LID Sizing Tool does not include a Sacramento area climate station, climate data from a Sacramento rain gauge was temporarily uploaded into the tool to make these comparisons. Table 3 presents the combinations of LID BMPs, sizes, and soil types that were tested, along with the volume reductions and differences between the two sources. For all scenarios tested with well-draining soils (saturated hydraulic conductivity of 1.0 in/hr), the results differed by less than 10%. However, for poorer-draining soils (saturated hydraulic conductivity of 0.1 in/hr) the results differed by up to 24%. The larger differences are primarily attributed to the different ways the two models simulate discharge through an underdrain. In SWMM 5, the background model for the CA Phase II LID Tool’s Percent Capture sizing method, discharge through an underdrain is calculated merely as a function of elevation head above the orifice using a form of the following equation:
∗ ∗ 2 ∗ ∗
where:
Q = discharge through the orifice (cfs)
C = coefficient of discharge, representing friction and contraction through orifice (0.6)
A = cross section area of orifice (sf)
g = gravitational acceleration (32.2 ft/sec2)
z = effective elevation head above orifice = elevation head * porosity (ft)
It is unclear exactly how discharge through an underdrain is calculated by SAHM, but it appears to be dependent on the depth of gravel storage below the underdrain. This is demonstrated by comparing the stage-discharge relationships reported by SAHM for two different bioretention cells. Figure A-1 presents a schematic of the cells. Both bioretention cells have 6 inches of ponding, 18 inches of bioretention media, and an underdrain at the top of the gravel storage layer, and runoff is allowed to infiltrate into underlying soils having a saturated conductivity of 0.1 in/hr. One cell has a gravel storage depth of 12 inches, while the other has a gravel storage depth of 36”. Figure A-2 plots the height above the gravel storage layer (a surrogate of stage) against discharge through the underdrain based on SAHM modeling of each bioretention cell. For the cell having 12 inches of gravel storage, runoff does not discharge through the underdrain until the water within the cell is approximately 0.4 feet (4.8 inches) above the top of the gravel storage. For the 36 inch storage cell, runoff does not discharge until the water is approximately 1.2 feet (14.4 inches) above the top of the gravel storage. The fact that the stage-discharge relationships differ indicates that discharge through the underdrain dependent on the depth of the cell’s gravel storage, and not merely the elevation head above the point of discharge.

APPENDIX C – RESULTS OF TOOL TESTING
C-4
Table 3. Comparisons of CA Phase II LID Tool and SAHM
LID BMP Type Native Soil
Ksata
(in/hr)
Climate Station
ALID/AIMPb
Volume Infiltrated, Evaporated, and
Treated Difference
CA Phase II LID Sizing
Tool SAHM
Bioretention Cell ‐ 18" Soil ‐ 12" Gravel Storage
1.0 Sacramento
5 ESE
1% 42% 47% 4%
2% 68% 74% 6%
4% 90% 94% 4%
8% 99% 99% 1%
16% 100% 100% 0%
Bioretention Cell ‐ 18" Soil ‐ 36" Gravel Storage
1.0 Sacramento
5 ESE
1% 49% 46% ‐3%
2% 75% 75% 0%
4% 94% 94% 0%
8% 99% 100% 0%
16% 100% 100% 0%
Bioretention Cell ‐ 24" Soil ‐ 12" Gravel Storage
1.0 Sacramento
5 ESE
1% 43% 49% 6%
2% 69% 77% 8%
4% 91% 95% 4%
8% 99% 100% 1%
16% 100% 100% 0%
Bioretention Cell ‐ 24" Soil ‐ 36" Gravel Storage
1.0 Sacramento
5 ESE
1% 50% 47% ‐4%
2% 76% 75% ‐1%
4% 95% 95% 0%
8% 99% 100% 0%
16% 100% 100% 0%
Bioretention Cell ‐ 18" Soil ‐ 12" Gravel Storage
0.1 Sacramento
5 ESE
1% 35% 43% 8%
2% 59% 71% 12%
4% 84% 92% 9%
8% 97% 99% 2%
16% 100% 100% 0%
Bioretention Cell ‐ 18" Soil ‐ 36" Gravel Storage
0.1 Sacramento
5 ESE
1% 39% 21% ‐18%
2% 63% 41% ‐22%
4% 87% 65% ‐22%
8% 98% 89% ‐9%
16% 100% 99% ‐1%
Bioretention Cell ‐ 24" Soil ‐ 12" Gravel Storage
0.1 Sacramento
5 ESE
1% 37% 48% 10%
2% 61% 75% 14%
4% 85% 95% 9%
8% 97% 99% 2%
16% 100% 100% 0%
Bioretention Cell ‐ 24" Soil ‐ 36" Gravel Storage
0.1 Sacramento
5 ESE
1% 40% 21% ‐19%
2% 65% 41% ‐24%
4% 88% 66% ‐22%
8% 98% 89% ‐9%
16% 100% 99% ‐1% a Native soil’s saturated hydraulic conductivity b Ratio of LID BMP area to impervious area

APPENDIX C – RESULTS OF TOOL TESTING
C-5
Figure 1. Profile of Bioretention Cells Compared for Stage-Discharge Relationships
Figure 2. Comparison of SAHM Stage-Discharge Relationship for Bioretention, C Soils
4.0 COMPARISONS OF DESIGN STORM AND PERCENT CAPTURE RESULTS
The CA Phase II LID Sizing Tool’s results for 85th percentile design storm were compared against those for the tool’s 80% capture requirement. It was anticipated that the Percent Capture Sizing Method would generally result in smaller LID BMP areas than the Design Storm Sizing Method, particularly for well-draining soils (saturated hydraulic conductivity ≥ 1.0 in/hr). This is because the Percent Capture Sizing Method analyzes all storms, including the more frequent, smaller storms that account for most of the annual precipitation. The Percent Capture Sizing Method also accounts for volume reduction and treatment mechanisms through infiltration into the underlying soils, evapotranspiration, and filtration through bioretention media (if applicable) during and after a storm event. In contrast, the Design Storm Sizing Method is based solely on the storage of a static volume (i.e, there is no consideration of volume
0.00
0.05
0.10
0.15
0.20
0.25
0.00 0.50 1.00 1.50 2.00
Discharge (cfs)
Height above top of gravel storage (ft)
Stage‐Discharge Comparisons in SAHM
12" Gravel Storage,Underdrain at 8"
36" Gravel Storage,Underdrain at 32"
dp = 6”
dm = 18”
ds = 12” or 36”
Ksat,N = 0.1 in/hr

APPENDIX C – RESULTS OF TOOL TESTING
C-6
routing) within the LID BMP – the capacity of the underlying soils to provide any volume reduction is not included. For well-draining soils, a good amount of infiltration is anticipated, and so, for the Percent Capture Sizing Method, this allows for reduction in the LID BMP size. Table 4 presents the required areas for several types of LID BMPs for a 1-acre impervious catchment for a relatively wet, Northern California region (Chico). As was expected, the Percent Capture Method results in smaller LID BMP areas than the Design Storm Method for well- draining soils. This trend, however, does not hold for Southern California climates which tend to have storms of higher intensity (flash storms) even though the frequency is less. Table 5 presents the required areas for a Southern California region (Boron) subject to such storms. For poor-draining and even some well-draining soils (saturated hydraulic conductivity ≤ 5 in/hr), the Percent Capture Method results in LID BMP areas that are equivalent to or larger than those resulting from the Design Storm Method. This is primarily because the rainfall intensities often exceed 1.0 in/hr and exceed the infiltration rates of most soils.
Additional anomalies in the results, that are not immediately intuitive, are discussed below.
Strip vs. Swale: Design Storm Sizing Method
The design storm result is identical for strips and swales of the same amendment depth because infiltration into the side-slopes of the swale is not considered. The side slopes are not included because the flow depths along the swale change with distance along the swale, and simulating this requires a more sophisticated model than a design storm approach. In reality, some infiltration through the side slopes can occur on the influent side of the swale, thus making the swale design storm calculation conservative.
Strip vs. Swale: Percent Capture
The percent capture area values for swales are always larger than those strips of the same amendment depth. This is due to the tool’s definition of capture for strips and swales. The capture mechanisms for these LID BMPs only include evapotranspiration, infiltration, and storage; any surface water discharge is not considered captured. For strips, 100% of the amended soil is available for evapotranspiration, infiltration, and/or storage as water sheet flows evenly across the strip. For swales, only a portion of the swale’s amended surface area is available for capture because the runoff depths vary along the length of the swale. The swale cross section modeled by the tool includes a depth of 6 inches, width of 4 ft, and side slope of 3:1, which results in an invert width of 1 ft. For this cross-section, the side slopes dominate the surface area of the swale. To make 100% of the swale’s amended surface area available for capture, the depth of runoff must be 6 inches throughout the entire length of the swale. However, an event that causes this amount of inundation would be quantified by the tool as having very little capture because of the predominance of surface flow. The swale and storm size combination that maximizes infiltration with no surface discharge is one that completely inundates the swale at the influent, but at the effluent the runoff depth approaches zero. In this idealized scenario, only a portion of the swale’s total amended surface swale area is inundated. Therefore swales will require more area to accomplish the same percent capture as a strip.
Strip vs. Bioretention: Percent Capture at Ksat =5.0 in/h
At very high saturated conductivities (e.g. 5.0 in/hr), strips with a 12-inch amended depth require less area than bioretention cells. This is not intuitive, since bioretention cells have more dead storage below their underdrain than strips have in their amendment soil depth. The explanation is due to how SWMM models flow through media transitions. Bioretention has more media layers so those layers start to play a limiting factor when the native infiltration is very high.

APPENDIX C – RESULTS OF TOOL TESTING
C-7
Table 4. Comparison of Area Results for Different CA Phase II LID Tool Methods - Chico
LID BMP Type Native Soil Ksat
a (in/hr) Climate Station
ALIDb (acres)
Difference (acres) Design Storm
Method Percent Capture
Method
Bioretention Cell ‐ 18" Soil –
12" Gravel Storage
5.0
Chico
0.048 0.022 +0.026
1.0 0.048 0.034 +0.014
0.4 0.048 0.038 +0.010
0.1 0.048 0.040 +0.008
0.04 0.048 0.043 +0.005
0.01 0.048 0.045 +0.003
Bioretention Cell ‐ 18" Soil –
36" Gravel Storage
5.0
Chico
0.031 0.022 +0.009
1.0 0.031 0.029 +0.002
0.4 0.031 0.033 ‐0.002
0.1 0.031 0.037 ‐0.006
0.04 0.031 0.039 ‐0.008
0.01 0.031 0.043 ‐0.012
Bioretention Cell ‐ 24" Soil –
12" Gravel Storage
5.0
Chico
0.043 0.020 +0.023
1.0 0.043 0.033 +0.010
0.4 0.043 0.036 +0.007
0.1 0.043 0.038 +0.005
0.04 0.043 0.039 +0.004
0.01 0.043 0.041 +0.002
Bioretention Cell ‐ 24" Soil –
36" Gravel Storage
5.0
Chico
0.029 0.019 +0.010
1.0 0.029 0.027 +0.002
0.4 0.029 0.032 ‐0.003
0.1 0.029 0.036 ‐0.007
0.04 0.029 0.038 ‐0.009
0.01 0.029 0.040 ‐0.011
Infiltration Trench
5.0
Chico
0.035 0.013 +0.022
1.0 0.035 0.031 +0.004
0.4 0.035 0.049 ‐0.014
0.1 0.110 0.150 ‐0.040
0.04 0.300 0.460 ‐0.160
0.01 0.550 >1 <‐0.450
Strip, Amended 12"
5.0
Chico
0.250 0.018 +0.232
1.0 0.250 0.057 +0.193
0.4 0.250 0.110 +0.140
0.1 0.250 0.210 +0.040
0.04 0.250 0.320 ‐0.070
0.01 0.250 0.890 ‐0.640
Swale, Amended 12"
5.0
Chico
0.250 0.028 +0.222
1.0 0.250 0.089 +0.161
0.4 0.250 0.190 +0.060
0.1 0.250 0.390 ‐0.140
0.04 0.250 0.780 ‐0.530
0.01 0.250 >1 <‐0.750 a Native soil’s saturated hydraulic conductivity b Required area of LID BMP area for a 1 acre impervious area c Bold values indicate Design Storm Method area > Percent Capture Method area

APPENDIX C – RESULTS OF TOOL TESTING
C-8
Table 5. Comparison of Area Results for Different CA Phase II LID Tool Methods - Boron
LID BMP Type Native Soil Ksat
a (in/hr) Climate Station
ALIDb (acres)
Difference (acres)c Design Storm
Method Percent Capture
Method
Bioretention Cell ‐ 18" Soil –
12" Gravel Storage
5.0
Boron
0.026 0.019 +0.007
1.0 0.026 0.026 0.000
0.4 0.026 0.029 ‐0.003
0.1 0.026 0.030 ‐0.004
0.04 0.026 0.031 ‐0.005
0.01 0.026 0.032 ‐0.006
Bioretention Cell ‐ 18" Soil –
36" Gravel Storage
5.0
Boron
0.017 0.019 ‐0.002
1.0 0.017 0.019 ‐0.002
0.4 0.017 0.022 ‐0.005
0.1 0.017 0.025 ‐0.008
0.04 0.017 0.027 ‐0.010
0.01 0.017 0.030 ‐0.013
Bioretention Cell ‐ 24" Soil –
12" Gravel Storage
5.0
Boron
0.024 0.018 +0.006
1.0 0.024 0.024 0.000
0.4 0.024 0.026 ‐0.002
0.1 0.024 0.028 ‐0.004
0.04 0.024 0.029 ‐0.005
0.01 0.024 0.030 ‐0.006
Bioretention Cell ‐ 24" Soil –
36" Gravel Storage
5.0
Boron
0.016 0.018 ‐0.002
1.0 0.016 0.019 ‐0.003
0.4 0.016 0.020 ‐0.004
0.1 0.016 0.022 ‐0.006
0.04 0.016 0.025 ‐0.009
0.01 0.016 0.028 ‐0.012
Infiltration Trench
5.0
Boron
0.020 0.011 +0.009
1.0 0.020 0.020 0.000
0.4 0.020 0.028 ‐0.008
0.1 0.058 0.081 ‐0.023
0.04 0.150 0.240 ‐0.090
0.01 0.240 0.460 ‐0.220
Strip, Amended 12"
5.0
Boron
0.130 0.017 +0.113
1.0 0.130 0.040 +0.090
0.4 0.130 0.069 +0.061
0.1 0.130 0.120 +0.010
0.04 0.130 0.150 ‐0.020
0.01 0.130 0.250 ‐0.120
Swale, Amended 12"
5.0
Boron
0.130 0.026 +0.104
1.0 0.130 0.072 +0.058
0.4 0.130 0.130 0.000
0.1 0.130 0.230 ‐0.100
0.04 0.130 0.310 ‐0.180
0.01 0.130 0.570 ‐0.440 a Native soil’s saturated hydraulic conductivity b Required area of LID BMP area for a 1 acre impervious catchment c Bold values indicate Design Storm Method area > Percent Capture Method area