california - otis college of art and design · prepared and researched by: project managed by:...
TRANSCRIPT

Prepared for Otis College of Art and Design by theINSTITUTE FOR APPLIED ECONOMICS Los Angeles County Economic Development Corporation 2017
blue 3115
Pantone Blue072
pantone3955
401000
pantone381
cool grey 10
Light cool grey
2017 2017
SECONDARY TREATMENT FOR DATE WHEN USEDFOR EBLASTS
CALIFORNIA

THANK YOU
REPORT SPONSORS
MEDIA PARTNERS
ALAN ZAFRAN

2017 OTIS REPORT on the Creative Economy of CALIFORNIA
May 2017
Prepared for Otis College of Art and Design by theINSTITUTE FOR APPLIED ECONOMICS Los Angeles County Economic Development Corporation
2017
blue 3115
Pantone Blue072
pantone3955
401000
pantone381
cool grey 10
Light cool grey
2017 2017
SECONDARY TREATMENT FOR DATE WHEN USEDFOR EBLASTS
PREPARED AND RESEARCHED BY:
Somjita Mitra, Ph.D. Senior Economist
Kimberly Ritter-MartinezEconomist
Rafael DeAnda Associate Economist
ABOUT THE KYSER CENTER FOR ECONOMIC RESEARCH
The LAEDC Institute for Applied Economics specializes in objective and unbiased economic and public policy research in order to foster informed decision-making and guide strategic planning. In addition to commissioned research and analysis, the Institute conducts foundational research to ensure LAEDC’s many programs for economic development are on target. The Institute focuses on economic impact studies, regional industry and cluster analysis and issue studies, particularly in workforce development and labor market analysis. Every reasonable effort has been made to ensure that the data contained herein reflect the most accurate and timely information possible and they are believed to be reliable. The report is provided solely for informational purposes and is not to be construed as providing advice, recommendations, endorsements, representations or warranties of any kind whatsoever.
© 2017 Los Angeles County Economic Development Corporation. All rights reserved.Los Angeles County Economic Development Corporation 444 S. Flower Street, 37th Floor Los Angeles, CA 90071Tel: 213-622-4300, 888-4-LAEDC-1 Fax: 213-622-7100www.LAEDC.org [email protected]
PROJECT MANAGED BY: Christine LeaheyDirector of Stategic Partnerships
Claudia Beinkinstadt KrumlaufDevelopment & Special Events Manager Chelsey SobelCoordinator, Institutional Advancement Anne Swett-Predock Creative Direction
Sean Yoon Design and Production
ABOUT OTIS COLLEGE OF ART AND DESIGN
Established in 1918, Otis College of Art and Design offers undergraduate and graduate degrees in a wide variety of visual and applied arts, media, and design. Core programs in liberal arts, business practices, and community-driven projects support the College’s mission to prepare diverse students to enrich our world through their creativity, skill, and vision. The renowned Creative Action program has been recognized by the Carnegie Foundation for Community Engagement, and the Otis Report on the Creative Economy is a powerful advocacy tool for creative industries. The College serves the Greater Los Angeles Area through compelling public programming, as well as year-round Continuing Education courses for all ages. More information is available at www.otis.edu.
Otis College of Art and Design9045 Lincoln BoulevardLos Angeles, CA 90045
Prepared for Otis College of Art and Design by the INSTITUTE FOR APPLIED ECONOMICS Los Angeles County Economic Development Corporation
Version published on May 18, 2017

REPORT CONTENTS
Introduction: Now, More Than Ever by Bruce W. Ferguson, President, Otis College of Art and Design 6
1. Executive Summary 112. What is the Creative Economy? 173. National and Global Economic Context 194. Creative Industry Trends 215. Economic Contribution of the Creative Industries 296. Looking Ahead: The Creative Economy in 2020 317. Industry Snapshots 338. Occupations in the Creative Economy 459. Nonprofit Sector of the Creative Economy 5110. K-12 Arts Education 5511. California Regional Snapshot 6012. Statistical Appendix 77
Addendum: Affordable Artist Housing by Artspace 87
NOW, MORE THAN EVER.
2017 Otis Report on the Creative Economy of California www.otis.edu/otisreport6 CA
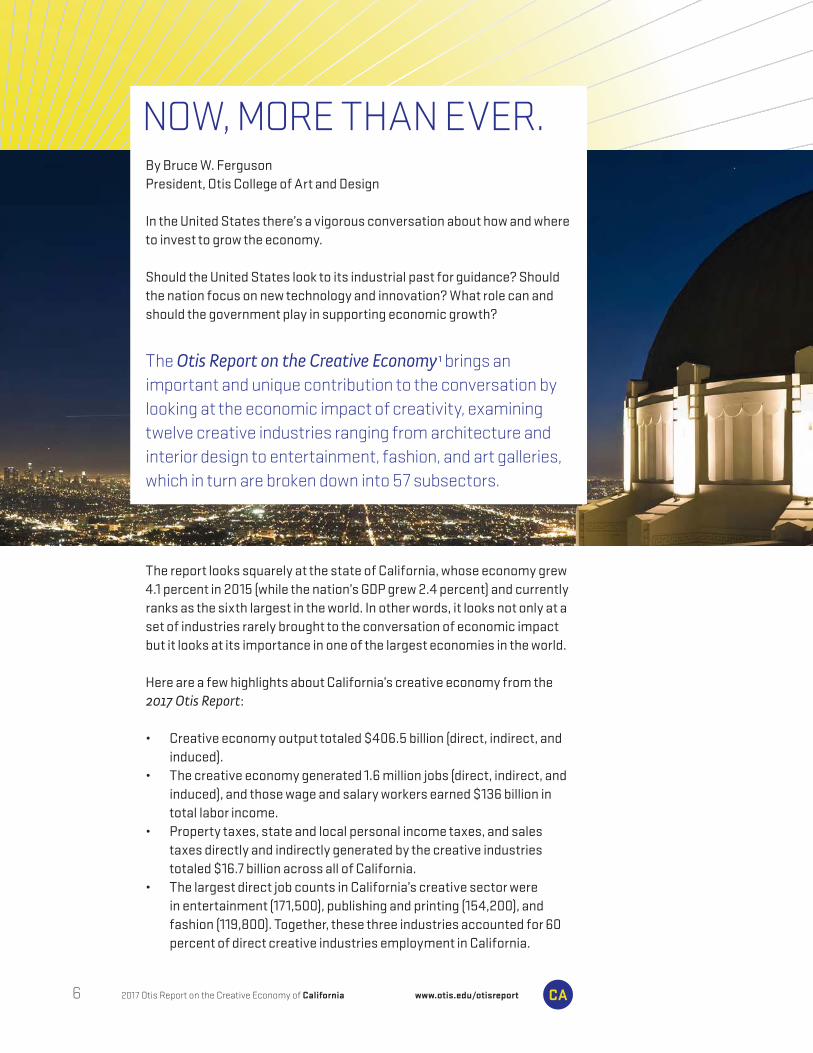
The report looks squarely at the state of California, whose economy grew 4.1 percent in 2015 (while the nation’s GDP grew 2.4 percent) and currently ranks as the sixth largest in the world. In other words, it looks not only at a set of industries rarely brought to the conversation of economic impact but it looks at its importance in one of the largest economies in the world.
Here are a few highlights about California’s creative economy from the 2017 Otis Report:
• Creative economy output totaled $406.5 billion (direct, indirect, and induced).
• The creative economy generated 1.6 million jobs (direct, indirect, and induced), and those wage and salary workers earned $136 billion in total labor income.
• Property taxes, state and local personal income taxes, and sales taxes directly and indirectly generated by the creative industries totaled $16.7 billion across all of California.
• The largest direct job counts in California’s creative sector were in entertainment (171,500), publishing and printing (154,200), and fashion (119,800). Together, these three industries accounted for 60 percent of direct creative industries employment in California.
By Bruce W. FergusonPresident, Otis College of Art and Design
In the United States there’s a vigorous conversation about how and where to invest to grow the economy.
Should the United States look to its industrial past for guidance? Should the nation focus on new technology and innovation? What role can and should the government play in supporting economic growth?
The Otis Report on the Creative Economy 1 brings an important and unique contribution to the conversation by looking at the economic impact of creativity, examining twelve creative industries ranging from architecture and interior design to entertainment, fashion, and art galleries, which in turn are broken down into 57 subsectors.

2017 Otis Report on the Creative Economy of Californiawww.otis.edu/otisreport 7CA
SCALE OF CALIFORNIA ECONOMY IN 2015
WAGES EARNED
6th LARGEST ECONOMY
IN THE WORLD
TOTAL CREATIVE ECONOMY OUTPUT
$406.5 Billion(DIRECT, INDIRECT, AND INDUCED)
TAX REVENUE
$16.7 BillionProperty taxes, state and local personal income taxes, and sales taxes directly and indirectly generated by the creative industries totaled $16.7 billion across all of California.
CREATIVE OCCUPATIONS REQUIRING AT LEAST A BA
NEARLY
50% Creative occupations often require high levels of education or skills training, with close to 50 percent of those examined requiring a bachelor’s degree or higher.
1.6 Million(DIRECT, INDIRECT, AND INDUCED)
$136 BillionIN TOTAL LABOR INCOME
The creative economy generated 1.6 million jobs (direct, indirect, and induced), and those wage and salary workers earned $136 billion in total labor income.
JOBS GENERATED
ENTERTAINMENT PUBLISHING AND PRINTING
FASHION
171,500JOBS
154,200JOBS
119,800JOBS
TOP JOB COUNTS BY SECTOR
The largest direct job counts in California’s creative sector were in entertainment (171,500), publishing and printing (154,200), and fashion (119,800). Together, these three industries accounted for 60 percent of direct creative industries employment in California.
CALIFORNIA GDP OUTPACES U.S. GDP IN 2015
4.1%CA GPD
2.4%U.S. GPD
HIGHLIGHTS ABOUT CALIFORNIA’S CREATIVE ECONOMY FROM THE 2017 OTIS REPORT:
THIS GROWTH IS AGAINST THE BACKDROP OF A GLOBAL SURGE IN ECONOMIES CONNECTED TO ART AND DESIGN.

2017 Otis Report on the Creative Economy of California www.otis.edu/otisreport8 CA
• Creative occupations often require high levels of education or skills training, with close to 50 percent of those examined requiring a bachelor’s degree or higher.
This growth is against the backdrop of a global surge in economies connected to art and design.
The global economy in the art market has hovered between $50 and $60 billion in the past decade, of which 40 percent was generated in the United States in 2016.2 The expansion of galleries, museums, and auctions and sales in Los Angeles supports the argument that the art market is adding employment in California through industries that support the art trade, exhibitions, and events.
CALIFORNIA LEADS THE NATION
Included in this year’s Otis Report includes a comparison of the number of wage and salary workers in the creative industries in California and the rest of the nation. With 747,600 jobs, California far surpasses New York State, which has 478,100 jobs, followed by Texas at 230,600 jobs.
Furthermore, the report provides information on location quotients (LQ), which are used to quantify the concentration of a particular industry, industry cluster, occupation, or demographic group in a region compared to the nation. It reveals what makes a region unique and gives an indication of where a region has a competitive advantage. In California, seven of the ten occupations with the highest LQ are creative. This means that our state has a higher concentration of those occupations than the nation as a whole. These include actors, artists’ agents, fabric and apparel patternmakers, film and video editors, makeup artists, and media and communications workers.
The Otis Report demonstrates that creativity and innovation thrives in Los Angeles and throughout the state of California. New businesses, motion picture and television studios, restaurants, museums, start-ups, and tech hubs show how the creative economy is intimately tied to the health and well-being of our citizens and communities.
Included in this year’s report are regional snapshots, each providing a dashboard of the creative economies of eight regions in California. Inspired by the map used by the Governor’s Office of Business and Economic Development (GO-Biz), the regions are defined as follows:
STATES WITH MOST CREATIVE JOBS
747,600CA
478,100NY
230,600TX
Bay Area Capital Region Central Coast Central Valley
Inland Empire San Diego-Imperial Valley Southern California Upstate California

2017 Otis Report on the Creative Economy of Californiawww.otis.edu/otisreport 9CA
Each snapshot provides data on creative industry employment and trends, as well as job count comparisons between creative industries and noncreative industries, such as construction, financial activities, or state and local government.
The strength of the creative economy is reliant on the ability of creative workers to find adequate housing, especially as these creative industries continue to grow.
SUPPORTING THE CREATIVE ECONOMY: HOUSING
In this year’s report we have included a special white paper, “Affordable Artist Housing: Retaining and Supporting California Artists and Creative Workers,” prepared by Artspace, a nonprofit organization dedicated to the creation of affordable spaces where artists can live and work.
In it, they say, importantly that “Every city, town, and business that relies on the output and impact of the creative economy and access to a healthy creative workforce should be concerned about the availability of affordable and appropriate space to incubate emerging talent and retain a competitive pool of creative workers.”
The white paper, funded by the California Arts Council, provides an important primer for those interested in understanding this issue in more depth, including best practices and three case studies of housing projects in California.
THE STATE OF CREATIVITY
In a postindustrial society, activities based on creativity are an essential feature of a flourishing economy, and the data in the Otis Report leaves no doubt that creativity is one of California’s most important economic assets. When one sees the data, a persuasive case for the beneficial and essential role that creative enterprise plays in the lives of Californians becomes clear. It is my hope that cities and counties throughout California

1
The 2017 Otis Report on the Creative Economy of California is available for download at www.otis.edu/otis-report-creative-economy.
2
The Art Market 2017 by Dr. Clare McAndrew (Art Basel and UBS) is available at www.artbasel.com/about/initiatives/the-art-market)
2017 Otis Report on the Creative Economy of California www.otis.edu/otisreport10 CA
can leverage the Otis Report to encourage further investments in arts education, economic development, and cultural planning.
Just this spring Culver City, which is home to Otis College’s MFA graduate studios, released its own creative economy report to document that city’s share of the creative growth in Los Angeles County. The report, produced in partnership with the LAEDC, includes testimonials by people across that city who understand the importance of the creative economy or have helped its growth in Culver City as well as objective statistics to verify their assertions.
It is critical that leaders from the public, private, and nonprofit sectors work together to support this type of examination in order for the larger creative economy to continue to flourish and thrive.
THE ACKNOWLEDGMENTS
On behalf of Otis College of Art and Design, I would like to express thanks to the Kyser Center for Economic Research at the Los Angeles County Economic Development Corporation for generating both the Los Angeles Regional Report and the California Report.
The 2017 Otis Report on the Creative Economy of California would not have been possible without the generous support of individuals and organizations that have joined together to affirm the value of the creative economy.
I would also like to thank our report sponsors for their incredible generosity. The California Arts Council has been an invaluable partner on this project, providing lead sponsorship of the California report and exclusive sponsorship of the addendum on artist housing. Additional support was provided by BrightView, City National Bank, City of Los Angeles Department of Cultural Affairs, DPR Construction, Arthur J. Gallagher & Co., Marsh, Mattel, Moss Adams, SignCentrix, Sony Pictures, and Alan Zafran, and our media partners, Arts for LA, Arts Orange County, Californians for the Arts, and the LAX Coastal Chamber of Commerce has enabled this conversation to evolve and grow, bringing stakeholders together to advance art and culture in their communities.
Bruce W. FergusonPresidentOtis College of Art and Design
View the Culver City
ReportHere

EXECUTIVE SUMMARY
1
“You can’t use up creativity. The more you use, the more you have.”— Maya Angelou
2017 Otis Report on the Creative Economy of Californiawww.otis.edu/otisreport 11CA
INTRODUCTION
In the 19th century, the Industrial Revolution reshaped American society. Technological innovations like the steam engine, the sewing machine, and the telegraph transformed manufacturing and communications. As industry mechanized, demand for factory labor increased dramatically, prompting millions of workers to leave farms and small towns in rural America to try their fortunes in the nation’s rapidly expanding cities. This mass internal migration changed not only how and where Americans worked, but also how they lived. The rise of the postindustrial economy in the late 20th century may mark an equally fundamental shift in American society. Innovation, human capital, and creativity have become crucial drivers of economic growth, leading to new ideas about how and where people live and work.
While creativity and new ideas can occur anywhere, a handful of the largest metropolitan regions in the U.S. have become the nation’s innovation hubs. Perhaps the best known among these are technology in the San Francisco Bay Area, biotech in San Diego and Boston, aircraft production and design in Seattle, and entertainment in Los Angeles. California has long had a reputation as a place where divergent thinking and risk-taking is encouraged. There being three major innovation hubs in California is a testament of the state’s creative culture. Creativity is not confined to California’s urban areas – it also flourishes in the state’s rural, mountain, and desert regions. The purpose of this report is explore the creative economy of California in all its diversity and to put real numbers to the business of creativity.
WHAT THE NUMBERS SAY
The creative industries of California turned in another solid performance in 2015 in terms of employment, labor income, and output. Over the five-year period covered in this report (2010 to 2015), direct wage and salary employment in California’s creative industries increased by 88,600 jobs to 747,600, an increase of 13.5 percent.
Based on the creative industries as defined in this report, the state of California was home to the largest number of creative wage and salary workers (747,600) in the nation. New York followed with 478,100 workers. Rounding out the top states were Texas (230,600 workers), Florida (175,800), and Illinois (171,000).

2017 Otis Report on the Creative Economy of California www.otis.edu/otisreport12 CA
Although California had a higher absolute number of workers in the creative industries, creative employment in New York represented a greater share of total wage and salary jobs, 6.2 percent versus 5.4 percent in California.
Total direct labor income in the creative industries of California amounted to $84.4 billion in 2015 or 9.9 percent of annual private sector wage and salary payrolls in the state. The publishing and printing sector, which includes Internet publishing and broadcasting, contributed $27.7 billion, followed by entertainment at $18.8 billion and digital media at $12.7 billion.
In addition to wage and salary employment, talented self-employed individuals also drive growth in the creative industries. In 2014 (the latest year for which data is available), there were over 340,500 self-employed persons working in California’s creative industries earning revenues of $13.9 billion. Between 2009 and 2014, the number of self-employed workers in California increased at an average annual rate of 3.6 percent (55,518 firms in total), outpacing the state’s average annual increase of 2.6 percent in self-employment across all industries.
While direct job counts in the creative industries of California were notable, they were just one part of a much larger employment effect. Direct employees are those who work for a firm in one of the designated creative industries. Indirect jobs are created when firms in these industries make purchases from their suppliers and vendors. Additional induced jobs are generated when direct and indirect workers spend their wages on consumer goods and services. This means that every job within the creative industries supports or sustains a large number of other jobs in the region that are outside the creative sector. Direct, indirect, and induced employment in the creative industries of California totaled over 1.6 million jobs in 2015. The labor income earned by these workers was $136.0 billion.
Activity in the creative sectors triggers not only jobs and spending, but also generates tax revenues for state and local governments that help fund local services like education and public safety. Property taxes, state and local personal income taxes, and sales taxes generated through direct, indirect, and induced effects by the creative industries totaled $16.7 billion across the state in 2015.
California’s creative industries generated $406.5 billion in economic output. Of that, $240.1 billion was value-added (corporate profits and labor income). This net economic contribution was the equivalent of 10.9 percent of the state’s gross product ($2.2 trillion) in 2015.
As long as the national economy continues to expand, growth is also expected to continue in California. The Los Angeles County Economic Development Corporation (LAEDC) projects that employment in California’s creative industries will increase by 3.3 percent over the next five years, adding 24,340 additional jobs by 2020, bringing the total up to 760,400.3
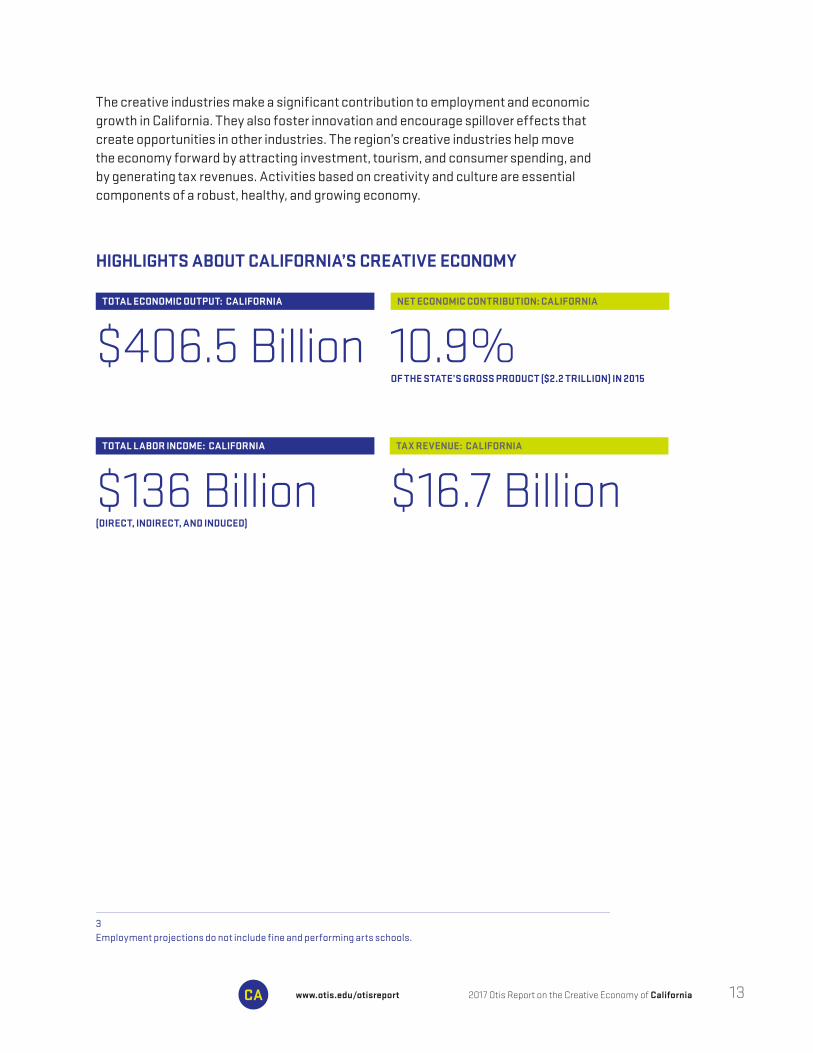
TOTAL LABOR INCOME: CALIFORNIA
TOTAL ECONOMIC OUTPUT: CALIFORNIA NET ECONOMIC CONTRIBUTION: CALIFORNIA
TAX REVENUE: CALIFORNIA
$136 Billion(DIRECT, INDIRECT, AND INDUCED)
$406.5 Billion 10.9%OF THE STATE’S GROSS PRODUCT ($2.2 TRILLION) IN 2015
$16.7 Billion
HIGHLIGHTS ABOUT CALIFORNIA’S CREATIVE ECONOMY
3 Employment projections do not include fine and performing arts schools.
2017 Otis Report on the Creative Economy of Californiawww.otis.edu/otisreport 13CA
The creative industries make a significant contribution to employment and economic growth in California. They also foster innovation and encourage spillover effects that create opportunities in other industries. The region’s creative industries help move the economy forward by attracting investment, tourism, and consumer spending, and by generating tax revenues. Activities based on creativity and culture are essential components of a robust, healthy, and growing economy.

HIGHLIGHTS ABOUT CALIFORNIA’S CREATIVE ECONOMY DIRECT EMPLOYMENT
DIGITAL MEDIA PUBLISHING AND PRINTING
ARCHITECTURE AND INTERIOR
DESIGN
+37.7%
+ 27%+23%
TOP SECTOR JOB GROWTH - CALIFORNIA: 2015
2010 – 2015 EMPLOYMENT: CALIFORNIA
+13.5%California’s creative industries increased by 88,600 jobs to 747,600, an increase of 13.5 percent.
CREATIVE ECONOMY EMPLOYMENT: CALIFORNIA
1,636,800 Jobs (DIRECT, INDIRECT, AND INDUCED)
2015 –2020 JOB GROWTH: CALIFORNIA
3.3 %CREATIVE INDUSTRY EMPLOYMENT
2015 CREATIVE ECONOMY EMPLOYMENT: CALIFORNIA
747,600 JobsDIRECT JOBS
2017 Otis Report on the Creative Economy of California www.otis.edu/otisreport14 CA
2007 PRE-RECESSION
PEAK
2010 2015 2020
767,000747,600
760,400
659,000
2007–2020 JOB GROWTH: CALIFORNIA

SELF-EMPLOYMENT EARNINGS: 2014
$13.9 BillionSELF-EMPLOYED PERSONS: 2014
340,567IN CALIFORNIA’S CREATIVE INDUSTRIES
HIGHLIGHTS ABOUT CALIFORNIA’S SELF-EMPLOYED
2017 Otis Report on the Creative Economy of Californiawww.otis.edu/otisreport 15CA
VISUAL AND PERFORMING
ARTS
COMMUNICATIONARTS
ENTERTAINMENT
4.3%3.9% 3.9%
SELF-EMPLOYMENT GROWTH - TOP SECTORS: 2014
+3.6%FOR CREATIVE INDUSTRIES
+2.6%FOR ALL INDUSTRIES
2009 2014 ANNUAL % INCREASE: 2009–2014
285, 182
340,567+19.5%
INCREASE
GROWTH OF SELF-EMPLOYED WORKERS: 2009–2014
Between 2009 and 2014, the number of self-employed workers in California increased at an average annual rate of 3.6 percent (55,518 firms in total), outpacing the state’s average annual increase of 2.6 percent in self-employment across all industries.
2017 Otis Report on the Creative Economy of California www.otis.edu/otisreport16 CA
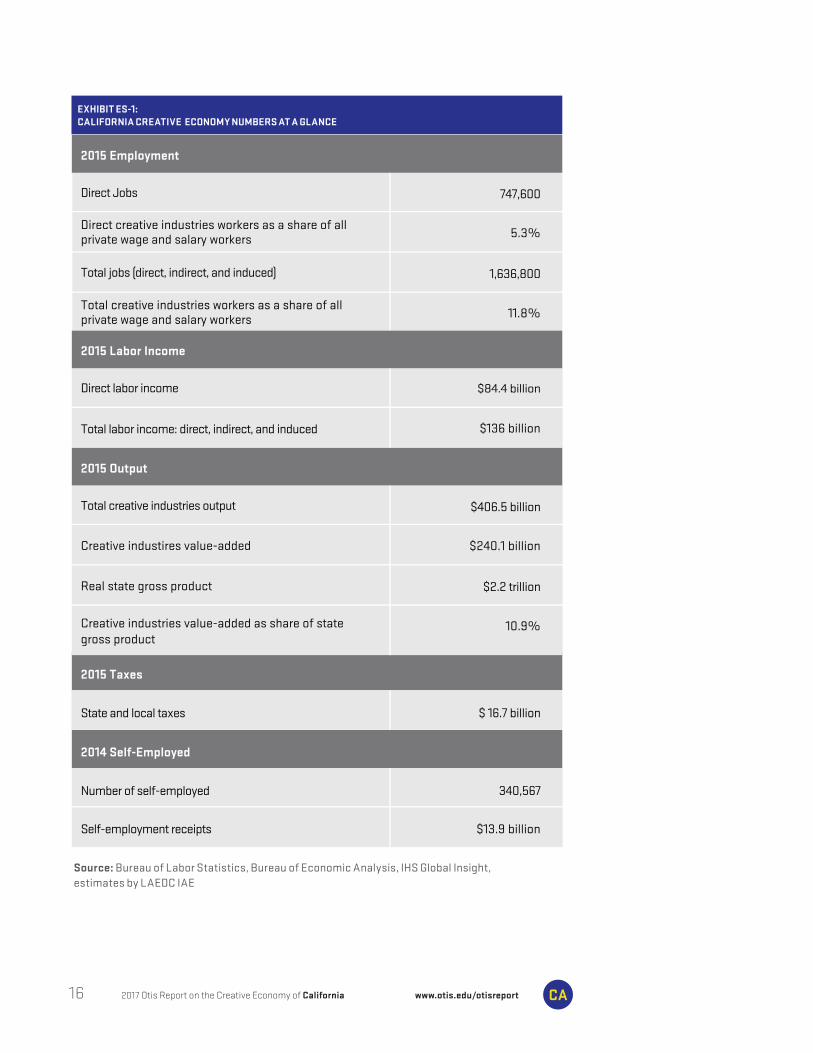
Direct Jobs 747,600
Total jobs (direct, indirect, and induced) 1,636,800
5.3%Direct creative industries workers as a share of allprivate wage and salary workers
11.8%Total creative industries workers as a share of allprivate wage and salary workers
2015 Employment
Total creative industries output $406.5 billion
$2.2 trillion
$240.1 billionCreative industires value-added
Real state gross product
10.9%Creative industries value-added as share of state gross product
2015 Output
Direct labor income
Total labor income: direct, indirect, and induced
$84.4 billion
$136 billion
2015 Labor Income
Number of self-employed
Self-employment receipts
340,567
$13.9 billion
2014 Self-Employed
State and local taxes $ 16.7 billion
2015 Taxes
Source: Bureau of Labor Statistics, Bureau of Economic Analysis, IHS Global Insight, estimates by LAEDC IAE
EXHIBIT ES-1:CALIFORNIA CREATIVE ECONOMY NUMBERS AT A GLANCE

2017 Otis Report on the Creative Economy of Californiawww.otis.edu/otisreport 17CA
As the creative economy expands to encompass innovative new activities and industries, its definition continues to evolve. Although often used interchangeably, there is a distinction between the creative economy and the creative industries. The creative economy comprises many kinds of creative activities whether expressed as art or innovation. The creative economy is largely made up of the creative industries – a designated set of industries that depend upon individual creativity to generate employment and wealth.
The following creative industries are explored in this report:
WHAT IS THE CREATIVE ECONOMY?
2
These 12 “super sectors” are further broken down into 57 subsectors. Please see EXHIBIT A-2 in the appendix for a full list of creative industries and their subsectors.
What unifies this dissimilar set of industries is the fact that they all trade creative assets in the form of intellectual property – the medium through which creativity is transformed into something with economic value. Within these industries, we find the intersection of art, culture, business, and technology.

2017 Otis Report on the Creative Economy of California www.otis.edu/otisreport18 CA
In addition to the industries designated as “creative,” the creative economy of California also includes organizations that provide a venue for artists to share their work with the public such as museums, art galleries, and theaters. The creative economy must also include a system that teaches, nurtures, and sustains creative activity: arts programs in K–12 schools and postsecondary arts institutions to develop talent, skills, and training. The long-term vitality of the creative economy also depends on philanthropic foundations and other nonprofit organizations to provide financial resources, incentives, and services to the creative community.
There are several ways to measure the size and economic contribution of the creative sectors to California’s economy. In this report, employment, wages, and output are the primary indicators. The value of intellectual property is also an important indicator but measuring intangibles such as ideas, design, brands, and style is challenging and beyond the scope of this report.
Creativity and the innovations that flow from creative activity contribute extensively to California’s economic growth. California’s creative sector attracts talented workers seeking an environment where innovation and new ideas are rewarded and one rich in cultural amenities. Art and cultural assets such as festivals, museums, historical monuments, or regional culinary traditions help to build the unique identity of California’s many regions and attract tourism dollars, an important part of the state’s economy.
The creative economy is a vibrant and vital force in society. Intellectual and aesthetic sensibilities lead individuals to express themselves through the arts, solve problems through design, and seek out what is beautiful and original. California holds a rich combination of resources, human and geographical diversity, and an open attitude toward new ideas. This openness to new ideas and the ability to make associations and connections not readily apparent to others is one of the defining characteristics of creativity. In California, new ideas are constantly given form and brought to life by creative people.

This section briefly summarizes recent and anticipated economic conditions and their likely effects on California’s creative economy.
At the start of 2017, the current U.S. economic expansion has taken place for seven and a half years, surpassing the postwar average of just under five years. After averaging 2.2 percent annual growth since 2011, gross domestic product (GDP) slowed to 1.6 percent in 2016. In 2017, U.S. economic growth is expected to accelerate to 2.3 percent. Consumer and business confidence, which rebounded after the November 2016 election, have further strengthened as the economy continued to improve through the first quarter of 2017.
Even with the slowdown in real GDP growth in 2016, the economy continued to add jobs at a steady pace. The unemployment rate ended the year at 4.7 percent (the lowest since 2007), a rate consistent with or very near to full employment. However, slack remains in the labor market in the form of underemployment and a multi-decade-long decline in labor force participation.
Boosted by stronger job and income growth, real personal consumption expenditures are expected to increase at a pace of 2.6 percent in 2017. Household finances are in good shape mostly as a result of rising home prices and gains in the stock market.
Business fixed investment is expected to improve modestly as the pull-back in energy-related investment that occurred in 2016 reverses course in response to rising energy prices. Cuts in corporate tax rates, should they occur, and a dialing back of regulation could also help drive investment in new plants and equipment. On the other hand, rising labor costs could also encourage firms to invest in labor-saving equipment.
The outlook for the housing market shows slow improvement. Sales of single-family homes lost momentum in 2016 as tight inventories pushed home prices higher. The shock to affordability is apparent nationwide, but is especially evident in California. Rising mortgage rates will present an additional challenge in 2017.
The outlook for fiscal and monetary policy is less certain. With the return of full employment, the Federal Reserve took a step toward normalizing interest rates with a 0.25 percent increase in the federal funds rate in December 2016 and again in March 2017. At least two more rate hikes are expected in 2017. This year may also be the year in which inflation reaches the Federal Reserve’s target rate of two percent (This is one
2017 Otis Report on the Creative Economy of Californiawww.otis.edu/otisreport 19CA
NATIONAL AND GLOBAL ECONOMIC CONTEXT
3

of the sign posts the Fed useds to gauge the rate at which it will normalize interest rates.
California has outpaced the nation in terms of both economic growth and job creation over the past few years. Nearly all of California’s major industries added jobs in 2016 and will do so again in 2017. With improvements across most of the state, California’s unemployment rate fell to 5.2 percent in December. While California is doing well overall, growth across the state has been uneven with the large coastal metropolitan areas accounting for the bulk of employment and wage growth.
What does this mean for California’s creative industries? The creative industries are subject to the same market forces as any other industry. Rising employment and higher wages will benefit sectors that rely on consumer spending, including art galleries, fashion, entertainment, toys, the visual and performing arts, and digital media. Likewise, improvements in the housing market will boost activity for architectural firms and interior designers, and will increase demand for furniture and the decorative arts. Moreover, a significant amount of California’s creative output is exported (movies, TV shows, and architectural and design services), so the improving fortunes of the state’s major trading partners will also stimulate growth.4
While the overall outlook is bright, there are some challenges ahead for California’s creative economy. For example, countries such as China and India have invested heavily in their domestic entertainment industries, increasing competition in those nations for the films produced in the Los Angeles region. Some of the creative industries, especially those with a large manufacturing component (fashion, toys, publishing) will continue to see declines in employment due to increased automation, new technologies, and pressures for lower cost labor. These are structural changes that are not tied to the business cycle and they are still evolving. Finally, the new administration’s plans to revise the tax code might hurt nonprofit arts organizations. Several proposed provisions – a lower cap on itemized deductions and a lower top tax rate – would reduce incentives for charitable giving. Federal grant programs that provide funding for the arts also remain in question.
The economic expansion should remain on track at least through 2017. Beyond that, until we have a better read on how the new administration’s policy goals will be implemented, the outlook is more opaque. Although subject to the ebb and flow of the economy as a whole, the creative industries of California form a nexus of culture, business, and technology that will continue to encourage innovation and economic growth throughout the state.
“There is a vitality, a life force, an energy, a quickening that is translated through you into action, and because there is only one of you in all time, this expression is unique. And if you block it, it will never exist through any other medium and will be lost.” — Martha Graham
4 IMF World Economic Outlook Update, January 2017
2017 Otis Report on the Creative Economy of California www.otis.edu/otisreport20 CA
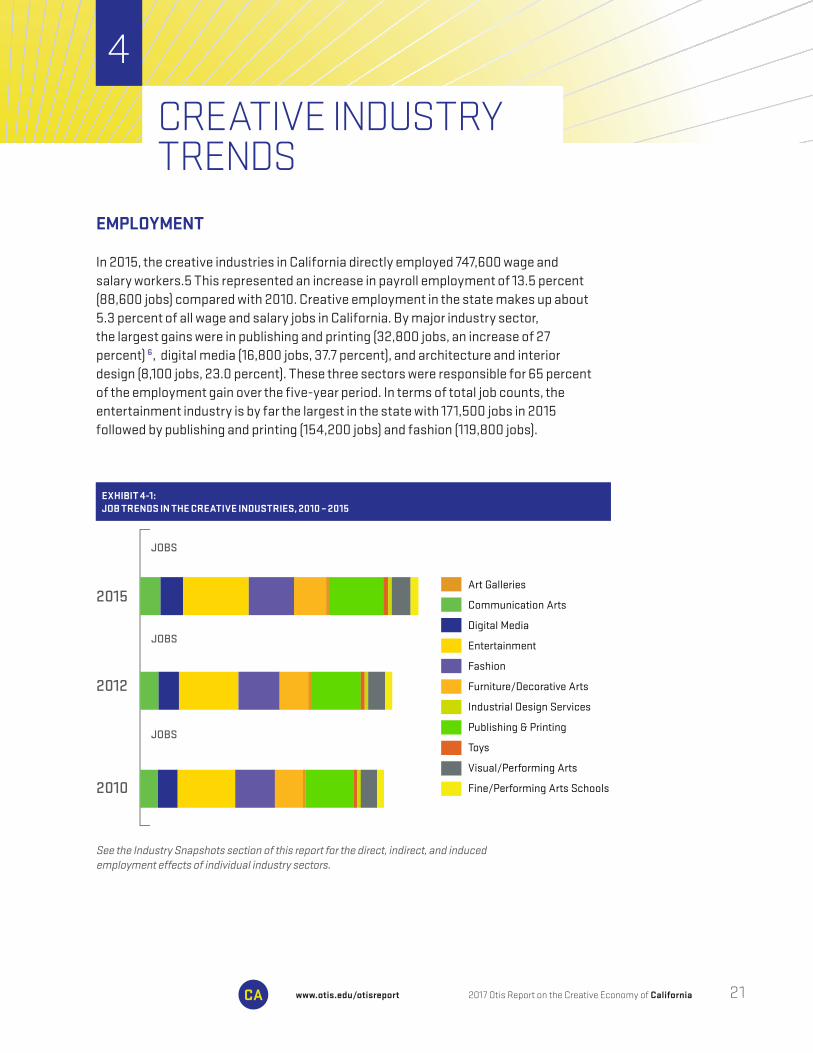
EMPLOYMENT
In 2015, the creative industries in California directly employed 747,600 wage and salary workers.5 This represented an increase in payroll employment of 13.5 percent (88,600 jobs) compared with 2010. Creative employment in the state makes up about 5.3 percent of all wage and salary jobs in California. By major industry sector, the largest gains were in publishing and printing (32,800 jobs, an increase of 27 percent) 6, digital media (16,800 jobs, 37.7 percent), and architecture and interior design (8,100 jobs, 23.0 percent). These three sectors were responsible for 65 percent of the employment gain over the five-year period. In terms of total job counts, the entertainment industry is by far the largest in the state with 171,500 jobs in 2015 followed by publishing and printing (154,200 jobs) and fashion (119,800 jobs).
Art Galleries
Communication Arts
Digital Media
Entertainment
Fashion
Furniture/Decorative Arts
Industrial Design Services
Publishing & Printing
Toys
Visual/Performing Arts
Fine/Performing Arts Schools
Source: Bureau of Labor Statistics, QCEW
2015
2012
2010
JOBS
747,600
JOBS
675,400
JOBS
659,000
See the Industry Snapshots section of this report for the direct, indirect, and induced employment effects of individual industry sectors.
2017 Otis Report on the Creative Economy of Californiawww.otis.edu/otisreport 21CA
CREATIVE INDUSTRY TRENDS
4
EXHIBIT 4-1:JOB TRENDS IN THE CREATIVE INDUSTRIES, 2010 – 2015

All but two of the major industry sectors recorded job gains between 2010 and 2015 ranging from 3.0 percent for entertainment up to 37.7 percent for digital media. The two industries that experienced a decline in employment were industrial design services (-0.9 percent, 20 jobs) and toys (-1.3 percent, 100 jobs).
Analyzing the component parts of the major industry sectors shows that by subsector, the largest job gains occurred in Internet publishing and broadcasting (43,300 jobs, an increase of 128.3 percent), motion picture and video production (9,600 jobs, 8.9 percent), and apparel wholesaling (9,200 jobs, 30.2 percent). (Please see Exhibit A-2 in the appendix for more detail.)
Direct employment in California’s creative industries peaked in this cycle in 2007 at 767,000 jobs. In spite of steady growth over the last five years of economic recovery and expansion, as of 2015, creative industries employment in California was still below the 2007 peak by 19,400 jobs. Total wage and salary employment in California surpassed prerecession job counts in 2014. There are a number of reasons for this. One is that the number of creative industry manufacturing jobs in California plunged by almost 61,000 from 2007 to 2015, while the number of service sector creative jobs increased by 41,000. While notable gains have been made in digital media and Internet publishing, and the visual and performing arts, entertainment employment has still not returned to prerecession levels. This was likely caused by runaway production (production leaving California for other states that offered generous incentives), which now appears to be returning due at least in part to the California Film Tax Credit. Another factor contributing to the failure of creative wage and salary employment to regain prerecession levels could be the increase in self-employment, which will be examined in a later section of this report.
CREATIVE CALIFORNIA: A NATIONAL COMPARISON
With 747,600 wage and salary workers in the creative industries, California had the largest number of creative workers of any state. However, California has a much larger population and a significantly higher employment base from which to draw creative workers. New York was next with 478,100 workers followed by Texas, Florida, and Illinois.
The state of New York, however had a greater share of creative workers relative to total wage and salary employment, 6.3 percent compared with 5.4 percent for California.
Interestingly, when comparing metropolitan (metro) areas the results are actually reversed. In this case, the New York metro area had both a higher number of creative jobs and a larger employment base. The Los Angeles area (Los Angeles and Orange counties), on the other hand, had a much higher concentration of creative workers compared to the other top five metro areas.
2017 Otis Report on the Creative Economy of California www.otis.edu/otisreport22 CA

LABOR INCOME
The distribution of labor income across the creative industries provides a sense of how they compare in size and economic contribution. Direct labor income in the creative industries of California reached $84.4 billion in 2015. At $27.7 billion the publishing and printing industry contributed the largest share (32.8 percent), most of which ($23.3 billion) was Internet publishing and broadcasting. The entertainment industry was next with 22.3 percent ($18.8 billion), followed by digital media with 15.1 percent ($12.7 billion).Every major creative industry sector in California, even those that posted a decline in employment, recorded an increase in labor income from 2010 to 2015. This is
2017 Otis Report on the Creative Economy of Californiawww.otis.edu/otisreport 23CA
Source: Bureau of Labor Statistics, QCEW Data 2015
Source: Bureau of Labor Statistics, QCEW Data 2015
California 747,600 13,915,900 5.4%
Texas 230,600 9,845,800 2.3%
478,100 7,694,900 6.2%New York
175,800 7,005,900 2.5%Florida
Illinois 171,000 5,063,200 3.4%
States Creative Jobs Total Wage and Salary Employment
Total Wage and Salary Employment
Creative Share of Total Wage and
Salary Jobs
New York 489,500 7,648,800 6.4%
Bay Area 193,200 3,474,800 5.6%
433,100 5,060,800 8.6%Los Angeles
138,100 3,872,500 3.6%Chicago
Seattle 106,800 1,578,400 6.8%
Metro Area Creative JobsCreative Share of
Total Wage and Salary Jobs
EXHIBIT 4-2:TOP FIVE CREATIVE STATES IN THE U.S. BY EMPLOYMENT, 2015
EXHIBIT 4-3:TOP FIVE CREATIVE METRO AREAS IN THE U.S. BY EMPLOYMENT, 2015

encouraging because it implies total income is increasing because both more people are working and they are earning higher wages. This is also true across many industries that are not in the creative sector, which is to be expected given the economy is at or near full employment.
Creative industries payroll income totals in 2015 were equal to nearly 10 percent of all wage and salary income earned in California that year.
TOTAL
$84.4 Billion
4.1%0.8% 0.3%
32.8% Publishing and Printing22.3% Entertainment15.1% Digital Media8.6% Visual/Performing Arts6.4% Fashion4.9% Communication Arts4.2% Furniture/Decorative Arts4.1% Architecture/Interior Design0.8% Toys0.3% Fine/Performing Arts Schools0.2% Industrial Design Services0.1% Art Galleries
32.8%
22.3%15.1%
8.6%
6.4%
4.9%
4.2%
$131,245$205,545
$206,545
$90,281
$86,767
$61,281
$49,147$45,125
$23,395
$109,918
$89,447
$80,715
$53,795
Digital Media
Publishing/Printing
Visual/Performing Arts
Entertainment
Toys
Communication Arts
Industrial Design Services
Architecture/Interior Design
Average All Industries
Art Galleries
Furniture/Decorative Arts
Fashion
Fine/Performing Arts Schools
Source: Bureau of Labor Statistics, QCEW Series
Eight of the 12 creative industries had a higher average annual wage in 2015 than the statewide average. The highest paying industry was digital media, followed by publishing and printing (driven by Internet publishing), and the visual and performing arts (primarily independent artists, writers, etc.). Because these are industry-wide averages, they include all workers in that industry from the receptionist up to the CEO, that is, people engaged in both creative and noncreative occupations.
2017 Otis Report on the Creative Economy of California www.otis.edu/otisreport24 CA
Source: Bureau of Labor Statistics, QCEW
Source: Bureau of Labor Statistics, QCEW Series
EXHIBIT 4-4:DIRECT LABOR INCOME OF THE CREATIVE INDUSTRIES OF CALIFORNIA, 2015
EXHIBIT 4-5:AVERAGE ANNUAL WAGE IN CALIFORNIA BY INDUSTRY, 2015

COUNTING THE SELF-EMPLOYED
A large and growing portion of creative industries employment is comprised of talented individuals who are self-employed. Although their contribution to the creative economy is significant, their activities are not captured in the federal and state employment data used to develop most of the job numbers in this report. However, the IRS collects data on people who are classified as “nonemployer firms.” These are firms consisting of one person with revenues but no additional employees. The latest nonemployer data from the IRS is for tax year 2014. It is important to note that some individuals may work on the payroll of an employer and be self-employed as well, so the two data sets (Quarter Census of Employment and Wages [QCEW] and nonemployer statistics) are not additive.
In 2014, there were 340,567 creative nonemployer firms in California representing 10.9 percent of total self-employment in the state. Over the five-year period 2009 through 2014, creative self-employment in California increased by almost 19.5 percent. That equates to an average annual growth rate of 3.6 percent. In contrast, the average annual growth rate of creative wage and salary employment over this same period was 2.5 percent.
Visual and performing arts providers continue to make up the largest sector of nonemployer firms in the state, particularly the subsector of independent artists, writers, and performers. This sector was also the fastest growing – averaging 4.3 percent per year (2009–2014). A large number of self-employed individuals also appeared in the communication arts sector as freelance designers, advertising professionals, and commercial or portrait photographers.
Revenues earned by nonemployer firms in California totaled $13.9 billion in 2015 with 39 percent of that generated by independent artists, writers, and performers. Since 2009, revenues across all creative sectors among the self-employed have increased at an average annual rate of 5.5 percent.
Self-employment and revenues were up across all major creative sectors in California. In some sectors, self-employment is actually more common than wage and salary employment. In the visual and performing arts, for example, there were nearly three self-employed individuals for every salary worker in the state. The communication arts also had a high number of self-employed workers relative to salaried employees. In 2014, there were almost two self-employed persons for every salaried employee.
2017 Otis Report on the Creative Economy of Californiawww.otis.edu/otisreport 25CA
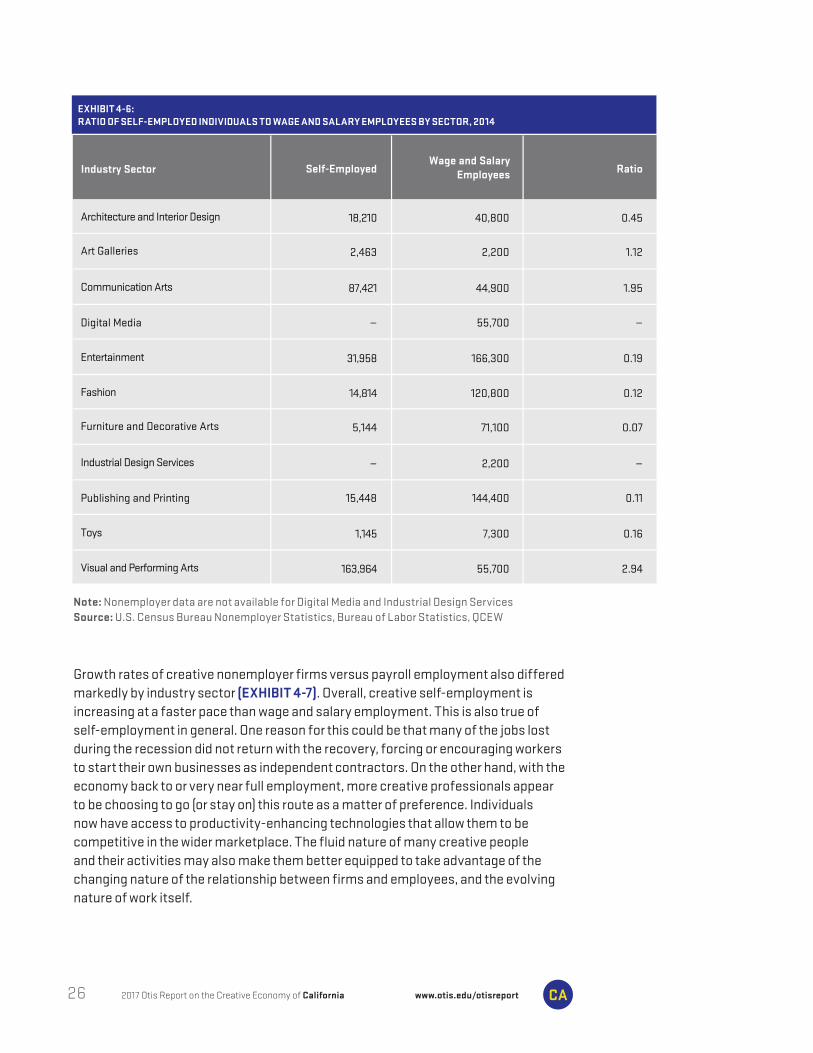
Growth rates of creative nonemployer firms versus payroll employment also differed markedly by industry sector (EXHIBIT 4-7). Overall, creative self-employment is increasing at a faster pace than wage and salary employment. This is also true of self-employment in general. One reason for this could be that many of the jobs lost during the recession did not return with the recovery, forcing or encouraging workers to start their own businesses as independent contractors. On the other hand, with the economy back to or very near full employment, more creative professionals appear to be choosing to go (or stay on) this route as a matter of preference. Individuals now have access to productivity-enhancing technologies that allow them to be competitive in the wider marketplace. The fluid nature of many creative people and their activities may also make them better equipped to take advantage of the changing nature of the relationship between firms and employees, and the evolving nature of work itself.
2017 Otis Report on the Creative Economy of California www.otis.edu/otisreport26 CA
Note: Nonemployer data are not available for Digital Media and Industrial Design ServicesSource: U.S. Census Bureau Nonemployer Statistics, Bureau of Labor Statistics, QCEW
Architecture and Interior Design 18,210 40,800 0.45
Communication Arts 87,421 44,900 1.95
2,463 2,200 1.12Art Galleries
— 55,700 —Digital Media
Entertainment 31,958 166,300 0.19
Fashion 14,814 120,800 0.12
Industrial Design Services — 2,200 —
5,144 71,100 0.07Furniture and Decorative Arts
15,448 144,400 0.11Publishing and Printing
Toys 1,145 7,300 0.16
Visual and Performing Arts 163,964 55,700 2.94
Industry Sector Self-Employed RatioWage and Salary
Employees
EXHIBIT 4-6:RATIO OF SELF-EMPLOYED INDIVIDUALS TO WAGE AND SALARY EMPLOYEES BY SECTOR, 2014

Architecture and Interior Design 1.8% 5.2%
Communication Arts 3.9% 10.7%
1.3% -26.7%Art Galleries
— 25.8%Digital Media
Entertainment 3.9% 0.9%
Fashion 2.2% 0.8%
Industrial Design Services — -7.0%
0.4% -1.1%Furniture and Decorative Arts
0.4% 12.6%Publishing and Printing
Toys 1.3% -7.8%
Visual and Performing Arts 4.3% 13.8%
Total Employment Growth 3.6% 6.3%
Industry SectorSelf-Employment
GrowthWage and Salary
Employment Growth
Note: Nonemployer data are not available for Digital Media and Industrial Design ServicesSource: U.S. Census Bureau Nonemployer Statistics, Bureau of Labor Statistics, QCEW
5 Wage and salary workers are employed by a firm; self-employed workers are not included in this figure.
6 All of the gain in the publishing and printing industry was Internet publishing and broadcasting. A gain of 43,300 jobs offset losses in traditional printing, newspaper and periodical publishing, and book publishing.
2017 Otis Report on the Creative Economy of Californiawww.otis.edu/otisreport 27CA
EXHIBIT 4-7:COMPARATIVE GROWTH RATES OF SELF-EMPLOYED INDIVIDUALS TO SALARIED EMPLOYEES, 2009–2014
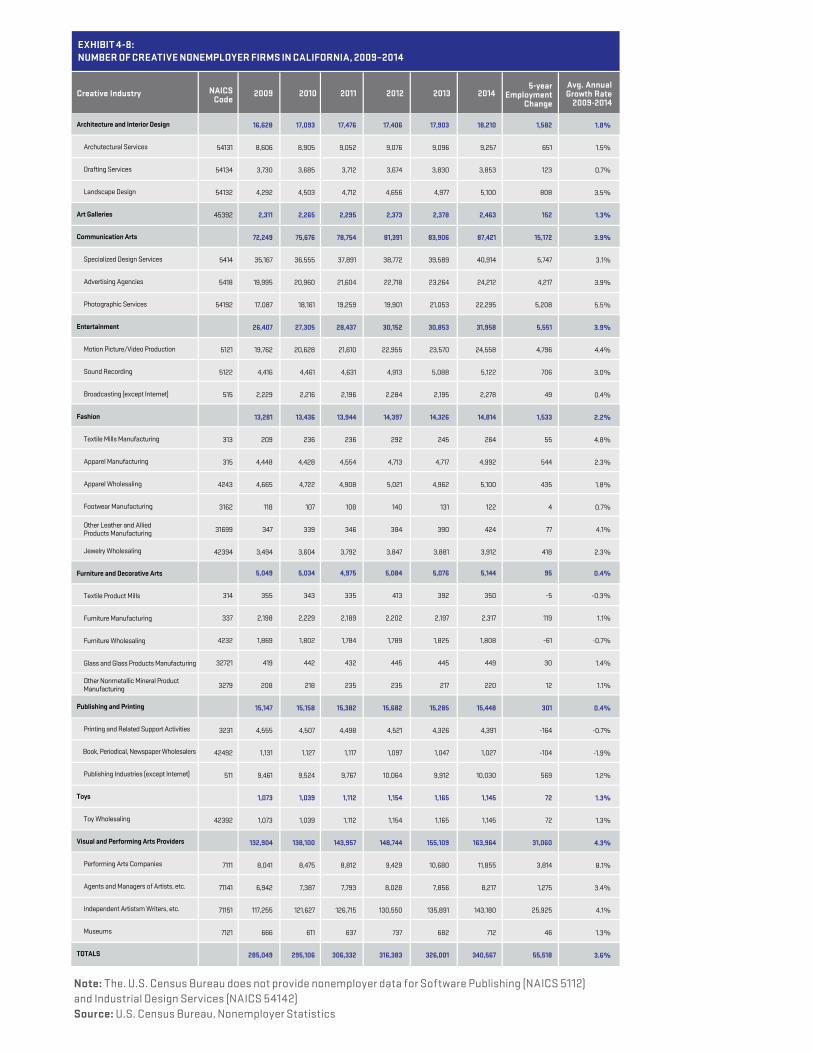
Note: The. U.S. Census Bureau does not provide nonemployer data for Software Publishing (NAICS 5112) and Industrial Design Services (NAICS 54142)Source: U.S. Census Bureau, Nonemployer Statistics
Architecture and Interior Design
Archutectural Services
Drafting Services
Landscape Design
Art Galleries
Communication Arts
Specialized Design Services
Advertising Agencies
Photographic Services
Entertainment
Motion Picture/Video Production
Sound Recording
Broadcasting (except Internet)
Fashion
Textile Mills Manufacturing
Apparel Manufacturing
Apparel Wholesaling
Footwear Manufacturing
Other Leather and Allied Products Manufacturing
Jewelry Wholesaling
Furniture and Decorative Arts
Textile Product Mills
Furniture Manufacturing
Furniture Wholesaling
Glass and Glass Products Manufacturing
Other Nonmetallic Mineral Product Manufacturing
Publishing and Printing
Printing and Related Support Activities
Book, Periodical, Newspaper Wholesalers
Publishing Industries (except Internet)
Toys
Toy Wholesaling
Visual and Performing Arts Providers
Performing Arts Companies
Agents and Managers of Artists, etc.
Independent Artistsm Writers, etc.
Museums
TOTALS
54131
54134
54132
45392
5414
5418
54192
5121
5122
515
313
315
4243
3162
31699
42394
314
337
4232
32721
3279
3231
42492
511
42392
7111
71141
71151
7121
16,628
8,606
3,730
4,292
2,311
72,249
35,167
19,995
17,087
26,407
19,762
4,416
2,229
13,281
209
4,448
4,665
118
347
3,494
5,049
355
2,198
1,869
419
208
15,147
4,555
1,131
9,461
1,073
1,073
132,904
8,041
6,942
117,255
666
285,049
17,093
8,905
3,685
4,503
2,265
75,676
36,555
20,960
18,161
27,305
20,628
4,461
2,216
13,436
236
4,428
4,722
107
339
3,604
5,034
343
2,229
1,802
442
218
15,158
4,507
1,127
9,524
1,039
1,039
138,100
8,475
7,387
121,627
611
295,106
17,476
9,052
3,712
4,712
2,295
78,754
37,891
21,604
19,259
28,437
21,610
4,631
2,196
13,944
236
4,554
4,908
108
346
3,792
4,975
335
2,189
1,784
432
235
15,382
4,498
1,117
9,767
1,112
1,112
143,957
8,812
7,793
126,715
637
306,332
17,406
9,076
3,674
4,656
2,373
81,391
38,772
22,718
19,901
30,152
22,955
4,913
2,284
14,397
292
4,713
5,021
140
384
3,847
5,084
413
2,202
1,789
445
235
15,682
4,521
1,097
10,064
1,154
1,154
148,744
9,429
8,028
130,550
737
316,383
17,903
9,096
3,830
4,977
2,378
83,906
39,589
23,264
21,053
30,853
23,570
5,088
2,195
14,326
245
4,717
4,962
131
390
3,881
5,076
392
2,197
1,825
445
217
15,285
4,326
1,047
9,912
1,165
1,165
155,109
10,680
7,856
135,891
682
326,001
18,210
9,257
3,853
5,100
2,463
87,421
40,914
24,212
22,295
31,958
24,558
5,122
2,278
14,814
264
4,992
5,100
122
424
3,912
5,144
350
2,317
1,808
449
220
15,448
4,391
1,027
10,030
1,145
1,145
163,964
11,855
8,217
143,180
712
340,567
1,582
651
123
808
152
15,172
5,747
4,217
5,208
5,551
4,796
706
49
1,533
55
544
435
4
77
418
95
-5
119
-61
30
12
301
-164
-104
569
72
72
31,060
3,814
1,275
25,925
46
55,518
1.8%
1.5%
0.7%
3.5%
1.3%
3.9%
3.1%
3.9%
5.5%
3.9%
4.4%
3.0%
0.4%
2.2%
4.8%
2.3%
1.8%
0.7%
4.1%
2.3%
0.4%
-0.3%
1.1%
-0.7%
1.4%
1.1%
0.4%
-0.7%
-1.9%
1.2%
1.3%
1.3%
4.3%
8.1%
3.4%
4.1%
1.3%
3.6%
Creative Industry 2009 2010 2011 2012 2013 2014NAICSCode
5-yearEmployment
Change
Avg. Annual Growth Rate
2009-2014
EXHIBIT 4-8:NUMBER OF CREATIVE NONEMPLOYER FIRMS IN CALIFORNIA, 2009–2014

EMPLOYMENT AND WAGES
While direct job counts in California’s creative industries are quite large (747,600 in 2015), they are only one part of a much larger employment picture. Direct employees are those who actually work in the creative industries of California. Indirect jobs are created when firms in these industries make purchases from their suppliers and vendors. Additional induced jobs are generated when the direct and indirect employees spend their wages on consumer goods and services. In that sense, every job within the creative sector supports or sustains other jobs in the region.
The ripple effect is substantial, giving rise to job gains and increases in income across a wide range of industries throughout the regional economy. In addition to the 747,600 direct jobs, California’s creative industries generated 889,200 indirect and induced jobs for a total of 1.6 million jobs in 2015.7 Labor income earned by these workers was $136 billion.
Source: Bureau of Labor Statistics, Estimates by LAEDC IAE
Direct 747,600
Labor Income ($ billions) 136.0
889,200Indirect and Induced
84.4Direct
Indirect and Induced 51.6
Output ($ billions) 406.5
Indirect and Induced 139.2
267.3Direct
16.7State/Local Taxes ($ billions)
Employment 1,636,800
ECONOMIC CONTRIBUTION OF THE CREATIVE INDUSTRIES
5
EXHIBIT 5-1: ECONOMIC CONTRIBUTION OF THE CREATIVE INDUSTRY IN CALIFORNIA, 2015
2017 Otis Report on the Creative Economy of Californiawww.otis.edu/otisreport 29CA

TAX EFFECTS
Activity in the creative sectors triggers not only jobs and spending, but also results in tax revenues for state and local governments that help to fund local services. As with jobs, there is a ripple effect with tax revenues because the initial direct effects give rise to indirect and induced effects.
In California, property taxes, state and local personal income taxes, and sales taxes generated directly and indirectly by the creative industries totaled $16.7 billion in 2015, as calculated by the LAEDC. The largest three sectors were publishing and printing, which generated tax revenues of $4.5 billion, followed by entertainment at $3.8 billion, and fashion at $2.9 million.
THE ECONOMIC CONTRIBUTION OF THE CREATIVE INDUSTRIES
In terms of their overall contribution to the regional economy, the creative industries in California generated $406.5 billion in economic output in 2015, an increase of $32 billion (8.8 percent) over the previous year, the combined result of economic growth, employment growth, and increased labor productivity. Of the $406.5 billion in economic output, $240.1 billion was value-added (corporate profits and labor income). This net economic contribution of $240.1 billion was the equivalent of 10.9 percent of the state’s gross product of $2.2 trillion in 2015.
7 Total job counts include full- and part-time workers, wage and salary employment, and self-employment.
2017 Otis Report on the Creative Economy of California www.otis.edu/otisreport30 CA

Employment moves with the business cycle, declining during recessions and growing again when the economy expands. California recorded another year of employment growth in 2015 in step with the expansion of the national economy. Nearly all major industry sectors experienced job gains, and after a long period of near stagnation, wage growth also began to pick up.
The LAEDC projects that creative industry employment in California will grow by 3.3 percent from 2015 to 2020. Creative industry wage and salary job counts will climb from 736,100 in 2015 to 760,400 in 2020, an increase of 24,300 jobs over the period.8 Growth is anticipated across the entire set of creative industries, but the pace will vary by industry. The largest percentage gains will occur in industries with a strong technology component like digital media and communication arts. The revolution in how media content is created and delivered will continue to fuel demand for digital media workers across a number of industries including entertainment, publishing, and advertising.
As employment and wages increase, household incomes rise. This allows workers to spend more of their disposable income on entertainment, apparel, home furnishings, and other consumer goods. With their links to real estate and construction, architecture and interior design will also see robust growth. Stronger economic growth and higher household incomes will mean more workers are hired at art galleries and in the entertainment, furniture and decorative arts, and the visual and performing arts industries.
LOOKING AHEAD: THE CREATIVE ECONOMY IN 2020
6
8 Employment at fine and performing arts schools is not included in this forecast so the total employment number reported for 2015 in this section differs from the figure reported elsewhere in this report.
2017 Otis Report on the Creative Economy of Californiawww.otis.edu/otisreport 31CA

EXHIBIT 6-1:CALIFORNIA CREATIVE INDUSTIRES EMPLOYMENT FORECAST, 2015–2010
Architecture and Interior Design 43,200
Communication Arts 46,000
2,300Art Galleries
61,500Digital Media
Entertainment 171,500
Fashion 119,800
Industrial Design Services 2,200
72,700Furniture and Decorative Arts
154,200Publishing and Printing
Toys 7,300
Visual and Performing Arts Providers 55,400
Totals 736,100
45,500
50,800
2,400
63,100
175,700
121,500
2,400
77,400
156,000
7,300
58,300
760,400
2300
48,00
100
1,600
4,200
1,700
200
4,700
1,800
0
2,900
24,300
5.3%
10.4%
4.3%
2.6%
2.4%
1.4%
9.1%
6.5%
1.2%
0.0%
5.2%
3.3%
1.0%
2.0%
0.9%
0.5%
0.5%
0.3%
1.8%
1.3%
0.2%
0.0%
1.0%
0.7%
Creative IndustryNumber of Jobs (Thousands)
2015 2020f Number Percent
Change 2015–2020Average Annual
Growth Rate
Source: Bureau of Labor Statistics, QCEW; Forecasts by LAEDC IAE
2017 Otis Report on the Creative Economy of California www.otis.edu/otisreport32 CA

2017 Otis Report on the Creative Economy of Californiawww.otis.edu/otisreport 33CA
INDUSTRY SNAPSHOTS
7

Establishments
Jobs
Labor Income ($ billions)
Nonemployer Establishments, 2014
DIRECT EFFECTS
6,264
43,200
3.5
18,210
Output ($ billions)
Total Jobs
Total Labor Income ($ billions)
Total Taxes ($ millions)
TOTAL EFFECTS (Direct, Indirect and Induced)
13.5
84,000
5.8
506.2
PERCENT CHANGENUMBER OF JOBS
2010 2015
43,200
23%
5.3%
35,100
45,500
2020F
INDUSTRYSNAPSHOTS
ARCHITECTURE AND INTERIOR DESIGNThis sector includes firms that specialize in architectural services, interior design, landscape design, and drafting services.
NAICS DESCRIPTION54131 Architectural services 54132 Landscape design54134 Drafting services54141 Interior design332323 Ornamental and architectural metal work manufacturing
EXHIBIT 7-1: ARCHITECTURE AND INTERIOR DESIGN JOB GROWTH IN CALIFORNIA
EXHIBIT 7-2: ECONOMIC CONTRIBUTION OF THE ARCHITECTURE AND INTERIOR DESIGN INDUSTRY, 2015
Source: Bureau of Labor Statistics, U.S. Census, Estimates by LAEDC IAE
2017 Otis Report on the Creative Economy of California www.otis.edu/otisreport34 CA

Establishments
Jobs
Labor Income ($ millions)
Nonemployer Establishments, 2014
DIRECT EFFECTS
633
2,300
123
2,463
Output ($ millions)
Total Jobs
Total Labor Income ($ millions)
Total Taxes ($ millions)
TOTAL EFFECTS (Direct, Indirect and Induced)
234.3
3,100
167.7
26.3
PERCENT CHANGENUMBER OF JOBS
2010 2015
2,300
11%
3%
2,100
2,400
2020F
Source: Bureau of Labor Statistics, U.S. Census, Estimates by LAEDC IAE
INDUSTRYSNAPSHOTS
ART GALLERIESThe presence of artists and art galleries throughout the state, whether fine art or local arts and crafts, enhance the quality of life for residents and are a major draw for cultural tourists.
NAICS DESCRIPTION45392 Art galleries
EXHIBIT 7-3: ART GALLERIES JOB GROWTH IN CALIFORNIA
EXHIBIT 7-4: ECONOMIC CONTRIBUTION OF ART GALLERIES, 2015
2017 Otis Report on the Creative Economy of Californiawww.otis.edu/otisreport 35CA

Establishments
Jobs
Labor Income ($ billions)
Nonemployer Establishments, 2014
DIRECT EFFECTS
5,977
46,000
4.1
87,421
Output ($ billions)
Total Jobs
Total Labor Income ($ billions)
Total Taxes ($ millions)
TOTAL EFFECTS (Direct, Indirect and Induced)
14.7
83,500
6.2
586.0
PERCENT CHANGENUMBER OF JOBS
2010 2015
46,000
16.6%
10.5%
39,400
50,800
2020F
Source: Bureau of Labor Statistics, U.S. Census, Estimates by LAEDC IAE
INDUSTRY SNAPSHOTS
INDUSTRYSNAPSHOTS
COMMUNICATION ARTS Individuals working in communication arts combine art and technology to communicate ideas through images and other communications media. This diverse sector is dominated by advertising agencies and firms that specialize in graphic design. It also includes commercial and portrait photographers.
NAICS 5414354181
DESCRIPTIONGraphic designAdvertising agencies
NAICS541921541922
DESCRIPTIONPhotography studios, portraitCommercial photography
EXHIBIT 7-5: COMMUNICATION ARTS JOB GROWTH IN CALIFORNIA
EXHIBIT 7-6: ECONOMIC CONTRIBUTION OF COMMUNICATION ARTS, 2015
2017 Otis Report on the Creative Economy of California www.otis.edu/otisreport36 CA

Establishments
Jobs
Labor Income ($ billions)
Nonemployer Establishments, 2014
DIRECT EFFECTS
1,711
61,500
12.7
–
Output ($ billions)
Total Jobs
Total Labor Income ($ billions)
Total Taxes ($ billions)
TOTAL EFFECTS (Direct, Indirect and Induced)
47.9
153,100
17.7
1.7
PERCENT CHANGENUMBER OF JOBS
2010 2015
61,500
37.7%
2.6%
44,700
63,100
2020F
Note: The U.S. Census Bureau does not provide nonemployer data for Digital MediaSource: Bureau of Labor Statistics, U.S. Census, Estimates by LAEDC IAE
INDUSTRYSNAPSHOTS
DIGITAL MEDIAThe digital media industry is concentrated in the Bay Area, but it has a growing presence in the Los Angeles region where it is closely connected to the entertainment and gaming industries. The true size of the digital media industry is difficult to calculate using publicly available data sources because there is no set of NAICS codes designed to specifically capture these activities, which may be included in entertainment and publishing as well as other sectors. Software publishing is the industry that best fits this activity and is used to produce the figures below.
NAICS DESCRIPTION5112 Software publishers
EXHIBIT 7-7: DIGITAL MEDIA JOB GROWTH IN CALIFORNIA
EXHIBIT 7-8: ECONOMIC CONTRIBUTION OF DIGITAL MEDIA INDUSTRY, 2015
2017 Otis Report on the Creative Economy of Californiawww.otis.edu/otisreport 37CA

INDUSTRY SNAPSHOTS
INDUSTRYSNAPSHOTS
Establishments
Jobs
Labor Income ($ billions)
Nonemployer Establishments, 2014
DIRECT EFFECTS
8,861
171,500
18.8
31,958
Output ($ billions)
Total Jobs
Total Labor Income ($ billions)
Total Taxes ($ billions)
TOTAL EFFECTS (Direct, Indirect and Induced)
113.8
333,600
28.2
3.8
PERCENT CHANGENUMBER OF JOBS
2010 2015
171,500
3%
2.5%
166,400
175,700
2020F
Source: Bureau of Labor Statistics, U.S. Census, Estimates by LAEDC IAE
ENTERTAINMENTEntertainment is the cornerstone of the creative economy of the Los Angeles region, but activity related to the industry can be found throughout the state. The motion picture and sound-recording industry generates huge economic benefits for California and strongly influences the content and design elements developed by other creative industries including digital media, fashion, toys, and publishing.
NAICS 51211
212
51219
5122
DESCRIPTION
Motion picture/video production
Motion picture distribution
Post production services
Sound recording
NAICS
515112
515120
5152
DESCRIPTION
Radio stations
Television broadcasting
Cable broadcasting
EXHIBIT 7-9: ENTERTAINMENT INDUSTRY JOB GROWTH IN CALIFORNIA
EXHIBIT 7-10: ECONOMIC CONTRIBUTION OF ENTERTAINMENT INDUSTRY, 2015
2017 Otis Report on the Creative Economy of California www.otis.edu/otisreport38 CA

Establishments
Jobs
Labor Income ($ billions)
Nonemployer Establishments, 2014
DIRECT EFFECTS
9,406
119,800
5.4
14,814
Output ($ billions)
Total Jobs
Total Labor Income ($ billions)
Total Taxes ($ billions)
TOTAL EFFECTS (Direct, Indirect and Induced)
42.4
208,100
10.9
2.9
PERCENT CHANGENUMBER OF JOBS
2010 2015
119,800
3.3%
1.4%
115,900
121,500
2020F
Source: Bureau of Labor Statistics, U.S. Census, Estimates by LAEDC IAE
INDUSTRYSNAPSHOTS
FASHION Apparel design, manufacturing, and wholesaling activities are concentrated in the Los Angeles region, but there is a significant fashion industry presence in San Francisco as well. Although apparel manufacturing in the state has declined, design-related activity strongly contributes to maintaining the apparel industry’s presence in California. The many apparel design and merchandizing schools that are located in the state attract talented students from all over the world.
NAICS
313
315
4243
3162
42434
DESCRIPTION
Textile mills manufacturing
Apparel manufacturing
Apparel wholesaling
Footwear manufacturing
Footwear wholesaling
NAICS
316992
32562
33991
42394
54149
DESCRIPTION
Women’s handbag manufacturing
Cosmetics manufacturing
Jewelry manufacturing
Jewelry wholesaling
Other specialized design services
EXHIBIT 7-11: FASHION INDUSTRY JOB GROWTH IN CALIFORNIA
EXHIBIT 7-12: ECONOMIC CONTRIBUTION OF FASHION INDUSTRY, 2015
2017 Otis Report on the Creative Economy of Californiawww.otis.edu/otisreport 39CA

Establishments
Jobs
Labor Income ($ billions)
Nonemployer Establishments, 2014
DIRECT EFFECTS
4,487
72,700
3.6
5,144
Output ($ billions)
Total Jobs
Total Labor Income ($ billions)
Total Taxes ($ billions)
TOTAL EFFECTS (Direct, Indirect and Induced)
26.2
127,200
6.7
1.4
PERCENT CHANGENUMBER OF JOBS
2010 2015
72,700
8.9%
6.6%
66,800
77,400
2020F
Source: Bureau of Labor Statistics, U.S. Census, Estimates by LAEDC IAE
INDUSTRY SNAPSHOTS
INDUSTRYSNAPSHOTS
FURNITURE AND DECORATIVE ARTSThis industry group includes firms that manufacture, warehouse, import, and export furniture. It also includes textiles mills (sheets, towels, and fabric window treatments), and china and pottery producers. California is also home to hundreds of small artisans who produce handcrafted and one-of-a-kind pieces. Additionally, universities and colleges located throughout the state offer a number of top-rated design programs that attract students from around the world.
NAICS
314
337
4232
33512
DESCRIPTION
Textiles mills manufacturing
Furniture manufacturing
Furniture wholesaling
Electric lighting fixtures
NAICS
327111
327112
327212
327999
DESCRIPTION
China plumbing fixtures, China, earthenware manufacturing
Other China, fine earthenware, pottery manufacturing
Pressed, blown glass, glassware manufacturing
Other miscellaneous nonmetallic mineral product manufacturing
EXHIBIT 7-13: FURNITURE AND DECORATIVE ARTS JOB GROWTH IN CALIFORNIA
EXHIBIT 7-14: ECONOMIC CONTRIBUTION OF FURNITURE AND DECORATIVE ARTS INDUSTRY, 2015
2017 Otis Report on the Creative Economy of California www.otis.edu/otisreport40 CA
FURNITURE AND DECORATIVE ARTSThis industry group includes firms that manufacture, warehouse, import, and export furniture. It also includes textiles mills (sheets, towels, and fabric window treatments), and china and pottery producers. California is also home to hundreds of small artisans who produce handcrafted and one-of-a-kind pieces. Additionally, universities and colleges located throughout the state offer a number of top-rated design programs that attract students from around the world.
NAICS
314
337
4232
33512
DESCRIPTION
Textiles mills manufacturing
Furniture manufacturing
Furniture wholesaling
Electric lighting fixtures
NAICS
327111
327112
327212
327999
DESCRIPTION
China plumbing fixtures, China, earthenware manufacturing
Other China, fine earthenware, pottery manufacturing
Pressed, blown glass, glassware manufacturing
Other miscellaneous nonmetallic mineral product manufacturing
Establishments
Jobs
Labor Income ($ billions)
Nonemployer Establishments, 2014
DIRECT EFFECTS
335
2,200
194.0
–
Output ($ billions)
Total Jobs
Total Labor Income ($ billions)
Total Taxes ($ billions)
TOTAL EFFECTS (Direct, Indirect and Induced)
437.2
3,600
269.9
25.2
PERCENT CHANGENUMBER OF JOBS
2010 2015
2,200
-0.9%
8%
2,300
2,400
2020F
Note: The U.S. Census Bureau does not provide nonemployer data for Industrial Design ServicesSource: Bureau of Labor Statistics, U.S. Census, Estimates by LAEDC IAE
INDUSTRYSNAPSHOTS
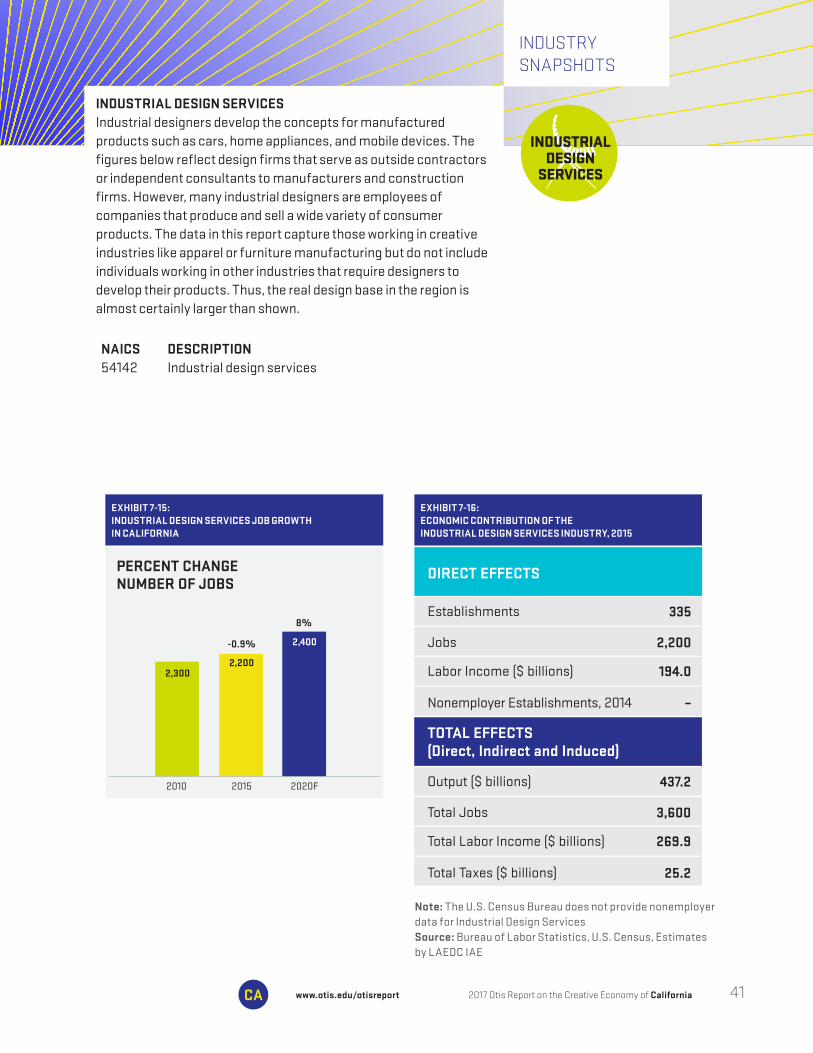
INDUSTRIAL DESIGN SERVICESIndustrial designers develop the concepts for manufactured products such as cars, home appliances, and mobile devices. The figures below reflect design firms that serve as outside contractors or independent consultants to manufacturers and construction firms. However, many industrial designers are employees of companies that produce and sell a wide variety of consumer products. The data in this report capture those working in creative industries like apparel or furniture manufacturing but do not include individuals working in other industries that require designers to develop their products. Thus, the real design base in the region is almost certainly larger than shown.
NAICS 54142
DESCRIPTIONIndustrial design services
EXHIBIT 7-15: INDUSTRIAL DESIGN SERVICES JOB GROWTH IN CALIFORNIA
EXHIBIT 7-16: ECONOMIC CONTRIBUTION OF THEINDUSTRIAL DESIGN SERVICES INDUSTRY, 2015
2017 Otis Report on the Creative Economy of Californiawww.otis.edu/otisreport 41CA

INDUSTRYSNAPSHOTS
Establishments
Jobs
Labor Income ($ billions)
Nonemployer Establishments, 2014
DIRECT EFFECTS
7,142
154,200
27.7
15,448
Output ($ billions)
Total Jobs
Total Labor Income ($ billions)
Total Taxes ($ billions)
TOTAL EFFECTS (Direct, Indirect and Induced)
128.4
505,100
48.2
4.5
PERCENT CHANGENUMBER OF JOBS
2010 2015
154,200
27%
1.2%
121,500
156,000
2020F
Source: Bureau of Labor Statistics, U.S. Census, Estimates by LAEDC IAE
PUBLISHING AND PRINTING The traditional publishing and printing sector includes two distinct functions. Publishers produce and disseminate literature, artwork, or information through books, newspapers and periodicals, directories and mailing lists, greeting cards, and other materials. Printers engage in printing text and images on paper, metal, glass, and apparel using traditional and digital methods. This sector also includes libraries and archives, and Internet publishing.
NAICS
3231
424920
511110
511120
511130
DESCRIPTION
Printing and support activities
Book, periodical, newspaper wholesalers
Newspaper publishers
Periodical publishers
Book publishers
NAICS
511191
511199
519120
519130
DESCRIPTION
Greeting card publishers
All other publishers
Libraries and archives
Internet publishing and broadcasting
EXHIBIT 7-17: PUBLISHING AND PRINTING JOB GROWTH IN CALIFORNIA
EXHIBIT 7-18: ECONOMIC CONTRIBUTION OF THEPUBLISHING AND PRINTING INDUSTRY, 2015
2017 Otis Report on the Creative Economy of California www.otis.edu/otisreport42 CA

Establishments
Jobs
Labor Income ($ millions)
Nonemployer Establishments, 2014
DIRECT EFFECTS
494
7,300
658.1
1,145
Output ($ billions)
Total Jobs
Total Labor Income ($ billions)
Total Taxes ($ millions)
TOTAL EFFECTS (Direct, Indirect and Induced)
3.5
15,300
1.1
301.3
PERCENT CHANGENUMBER OF JOBS
2010 2015
7,300
-1.3%
-0.1%
7,400
7,300
2020F
Source: Bureau of Labor Statistics, U.S. Census, Estimates by LAEDC IAE
INDUSTRYSNAPSHOTS
TOYSThe job numbers may be modest, but California (Southern California in particular) is a major force in the toy industry. Much of the actual manufacturing of toys takes place outside the region but most design and marketing functions have been retained in California because of the creative talent pool and supportive training programs at many of the state’s art and design educational institutions. The toy industry also benefits from its close ties to the state’s entertainment industry through licensing agreements with the major film studios.
NAICS
33993
42392
DESCRIPTION
Toy manufacturing
Toy wholesaling
EXHIBIT 7-17: TOY INDUSTRY JOB GROWTH IN CALIFORNIA
EXHIBIT 7-20: ECONOMIC CONTRIBUTION OF THETOY INDUSTRY, 2015
2017 Otis Report on the Creative Economy of Californiawww.otis.edu/otisreport 43CA

INDUSTRYSNAPSHOTS
Establishments
Jobs
Labor Income ($ billions)
Nonemployer Establishments, 2014
DIRECT EFFECTS
12,667
55,400
7.3
163,964
Output ($ billions)
Total Jobs
Total Labor Income ($ billions)
Total Taxes ($ millions)
TOTAL EFFECTS (Direct, Indirect and Induced)
14.6
106,300
10.1
841.5
PERCENT CHANGENUMBER OF JOBS
2010 2015
55,400
14.3%
5.3%
48,500
58,300
2020F
Source: Bureau of Labor Statistics, U.S. Census, Estimates by LAEDC IAE
VISUAL AND PERFORMING ARTS California is home to an impressive number of internationally renowned arts institutions, world-class symphonies, opera and ballet companies, and theater troupes, many of which are housed in concert halls and theaters that are works of art in their own right. This sector includes these theater and dance companies, musical groups, other performing arts companies and museums, as well as independent artists, writers, entertainers, and their agents and managers. Many of these firms are nonprofit organizations.
NAICS
71111
71112
71113
71119
DESCRIPTION
Theater companies
Dance companies
Musical groups
Other performing arts companies
NAICS
71141
71151
71211
339992
DESCRIPTION
Agents and managers of artists, etc.
Independent artists, writers, etc.
Museums
Musical instrument manufacturing
EXHIBIT 7-21: VISUAL AND PERFORMING ARTS JOB GROWTH IN CALIFORNIA
EXHIBIT 7-22: ECONOMIC CONTRIBUTION OF THEVISUAL AND PERFORMING ARTS INDUSTRY, 2015
2017 Otis Report on the Creative Economy of California www.otis.edu/otisreport44 CA
EMPLOYMENT
There are two ways to think about employment in the creative economy: individuals who work in a creative industry and individuals working in creative occupations. The previous sections of this report described creative industries. These are the firms that produce and distribute cultural consumer, and commercial goods and services. This section turns from industry analysis to an examination of creative occupations. Many of these occupations are found within the creative industries, but they are also present in significant numbers in industries that are outside the designated creative sector.
The Bureau of Labor Statistics collects data pertaining to occupations, which makes it possible to identify and measure creative occupations throughout the economy. This data can also shed light on the extent to which creative industries employ people in functions outside of creative occupations. The occupational data used in this report are based on the Standard Occupational Classification (SOC) system.
These creative occupations can be found across a wide array of organizational functions.9 For example, within the major group, management occupations, creative occupations include advertising, marketing, and public relations managers. In computer and mathematical occupations, there are software developers and in production-related occupations, there are tailors, cabinet makers, and engravers. One may find a marketing manager or graphic designer working in any number of industries, those identified as creative or otherwise. This illustrates the fact that creative people are often found outside of what we typically think of as the creative sectors of the economy.
In 2015, there were 654,300 workers in California employed in creative occupations. This represented 42 percent of total occupation-based employment in the state. These could be jobs within the defined set of creative industries described in this report or they might be in a noncreative industry. The largest shares of individuals employed in creative occupations worked in art, design, entertainment, sports, and media (38.8 percent); followed by computer and mathematical occupations (31.5 percent) and in a distant third, education, training, and library occupations (8.7 percent).
OCCUPATIONS IN THE CREATIVE ECONOMY
8
2017 Otis Report on the Creative Economy of Californiawww.otis.edu/otisreport 45CA

The numerous creative occupations found across so many industries, creative and noncreative alike, are evidence of the importance of creativity to the economy. It is a highly valued attribute essential to the success of many different kinds of firms and business activities. The further implication is that it is in the state’s economic interest to maintain, nurture, and grow its deep pool of creative talent.
38.8%
31.5%
8.7%
6.6%
4.4%
9.9%
Art, Design, Entertainment, Sports, and Media Occupations
Computer and Mathematical Occupations
Education, Training, and Library Occupations
Management Occupations
Architecture and Engineering Occupations
All Other Occupations
38.8%
31.5%
8.7%
6.6%
4.4%
9.9%
Source: Bureau of Labor Statistics, OES
EXHIBIT 8-1: DISTRIBUTION OF CREATIVE OCCUPATIONS BY MAJOR CATEGORY, 2015
2017 Otis Report on the Creative Economy of California www.otis.edu/otisreport46 CA

HOW MUCH DO CREATIVE WORKERS EARN?
Creativity is a highly valued and recognized professional attribute. Along with the ability to collaborate with coworkers and to communicate effectively, creativity is one of the most sought-after qualities in a prospective employee. The salaries received by many creative individuals working in California bear this out.
In 2015, the creative occupation receiving the highest annual median wage in California was software developers at $123,900. The lowest was fabric/apparel patternmakers at $48,860. The median wage across all occupations in California was $39,830. Out of the 77 creative occupations analyzed in this report, 57 had a median annual wage greater than the state-wide median (Note: Wage data was unavailable for actors, dancers, choreographers, and musicians and singers).
Software Developers
Producers and Directors
Film/Video Editors
Architects
Art/Drama/Music Teachers
Multimedia Artists/Animators
Writers/Authors
Commerical/Industrial Designers
Fashion Designers
Interior Designers
Sound and Engineering Technicians
Graphic Designers
Fabric/Apparel Patternmakers
Median Wage All California Occupations
$88,170$89,900
$123,900
$80,590
$71,750
$65,060
$61,770$54,070
$48,860$39,830
$88,030
$80,400
$69,420
$64,410
Source: Bureau of Labor Statistics, OES
EXHIBIT 8-2: SELECTED ANNUAL MEDIAN WAGES FOR CREATIVE OCCUPATIONS IN CALIFORNIA, 2015
2017 Otis Report on the Creative Economy of Californiawww.otis.edu/otisreport 47CA

Bachelor’s degree or higher
High school or equivalent
Some college or Associate’s degree
Less than high school
Unspecified
49.4%
27.3%
10.4%
7.8%
5.2%
Exhibit 8-3 demonstrates why we see relatively high wages in creative occupations – almost half require a bachelor’s degree or higher, while another 10 percent require at least an AA or some college. Additionally, slightly more than half of the occupations that did not require a bachelor’s degree paid a higher median annual wage than the statewide median. So even for less educated workers, the creative sector can provide a pathway to better paying jobs.
EXHIBIT 8-3: ENTRY LEVEL EDUCATION REQUIREMENTS TO CREATIVE OCCUPATIONS
Source: California EDD, LMID
Throughout the current expansion period, the lack of wage growth across many industries and occupations has been a concern. Lingering slack in the labor markets (low labor force participation and underemployment dating back to the Great Recession) has acted as a check on wage growth. Now that the economy is at or near full employment, several measures of wage growth indicate that more workers can expect to see a bump in their paychecks. Competition among firms for skilled employees is becoming more intense, putting upward pressure on wages, and in many states and municipalities, higher minimum wage laws are increasing pay for many workers.
Compared with 2014, the median wage across all occupations in California increased by 2.3 percent. Exhibit 8-4 shows that wage gains in many creative occupations rose at a much faster pace, although a few experienced a small decline or increased only slightly. There are many reasons why some of these occupations might have experienced a decline in wages. The first possibility is the trend in shifting wage and salary employment to self-employment (it may take time for a new independent contractor to build a clientele base). Some of these occupations may also be concentrated in industries that are declining or are in the process of transforming through technological change. Declining wages might also be attributable to an oversupply of workers in a particular occupation. Another possibility that reflects trends in the labor markets at large is that more people in creative occupations may be working part-time, which would certainly cause a decline in median annual wage.
EXHIBIT 8-3: ENTRY LEVEL EDUCATION REQUIREMENTS TO CREATIVE OCCUPATIONS
SEE EXHIBIT A-4 IN THE APPENDIX FOR A DETAILED LIST OF CREATIVE OCCUPATIONS, PROJECTED JOB OPENINGS OVER THE NEXT FIVE YEARS, EDUCATIONAL REQUIREMENTS, AND MEDIAN WAGES.
2017 Otis Report on the Creative Economy of California www.otis.edu/otisreport48 CA

EXHIBIT 8-4: EMPLOYMENT AND EARNINGS FOR SELECTED CREATIVE OCCUPATIONS, 2014 AND 2015
EMPLOYMENT
MEDIAN ANNUAL WAGE
2014 2015 # Change 2014 2015 % Change
Architects 10,250 12,070 1,820 $85,030 $88,030 3.5%
Art/Drama/Music Teachers 13,830 14,600 770 $78,290 $80,590 2.9%
Commercial/Industrial Designers 3,950 4,110 160 $67,600 $69,420 2.7%
Fabric/Apparel Patternmakers 1,970 1,680 -290 $47,220 $48,860 3.5%
Fashion Designers 5,570 6,180 610 $66,320 $65,060 -1.9%
Film/Video Editors 10,080 11,250 1,170 $79,250 $88,170 1.3%
Graphic Designers 27,180 28,940 1,760 $53,710 $54,070 0.7%
Interior Designers 5,860 6,770 910 $55,010 $64,410 17.1%
Multimedia Artists/Animators 9,560 10,110 550 $79,790 $80,400 0.8%
Producers and Directors 24,400 25,510 1,110 $93,380 $89,900 -3.7%
Software Developers 106,660 123,950 17,290 $115,590 $123,900 7.2%
Sound and Engineering Technicians 4,060 4,260 200 $57,890 $61,770 6.7%
Writers/Authors 7,370 7,890 520 $73,370 $71,750 -2.2%
Source: Bureau of Labor Statistics, OES
2017 Otis Report on the Creative Economy of Californiawww.otis.edu/otisreport 49CA

LOCATION QUOTIENTS IN CALIFORNIA
A location quotient (LQ) can be used to quantify the concentration of a particular industry, industry cluster, occupation, or demographic group in a region and compare it with the nation. It reveals what makes a region unique.
An LQ of 1.0 for an occupation means that a region has the same (or average) concentration of that occupation as the nation as a whole. If the LQ of an occupation is above 1.0, the region has a higher-than-average concentration of that occupation. Higher-than-average LQs for a given occupation or industry suggests a competitive advantage for that region with respect to that occupation or industry as compared to the nation and other regions.
As indicated in the figure below, California has high LQs in a number of creative occupations. Of the 10 occupations with the highest LQs in the state, seven are creative occupations. Indicative of California’s other strengths, occupations in agriculture, solar energy, and technology are also among the top ten.
3.553.62
5.82
3.45
3.30
3.01
3.47
3.38
3.17
2.97
Farmworkers/Laborers, Crop, Nursery, Greenhouse
Film and Video Editors
Media and Communication Workers, All Other
Media and Communication Equipment Workers
Solar Photovoltaic Installers
Makeup Artists, Theatrical and Performance
Agents, Business Mgrs of Artists, Performers, Athletes
Computer Hardware Engineers
Actors
Multimedia Artists, Animators
Source: Bureau of Labor Statistics, OES
EXHIBIT 8-5: OCCUPATIONS WITH THE HIGHEST LQS IN CALIFORNIA
9The list of creative occupations used in this report draws on the work of Ann Markusen, et al., (2008). Defining the Creative Economy: Industry and Occupation Approaches. Economic Development Quarterly, 22; 24–25
2017 Otis Report on the Creative Economy of California www.otis.edu/otisreport50 CA

The nonprofit sector plays an indispensable role in the economy as a major source of employment and income. Many nonprofit organizations are run similarly to for-profit entities and require workers with specialized skills to ensure the smooth running of their operations. Nonprofits also purchase goods and services from third-party suppliers. Like their for-profit counterparts, nonprofits also need computers, utilities, and office supplies. This generates revenues and creates jobs for the companies who supply goods and services to nonprofit organizations. In addition to paid workers, nonprofits also utilize unpaid volunteers who annually contribute millions of hours of their time and expertise, both of which have economic value.
Nonprofits, as defined by U.S. tax law, are “organizations for charitable or mutual benefit purposes.” Nonprofits are not restricted in how much income they can generate, which can be substantial in the case of a concert hall, museum, or hospital, but in how that income is distributed. Profits cannot be paid to owners or anyone else associated with the organization but must instead be devoted to the tax-exempt purpose of the organization.
The need for nonprofits grows from the limitations of the private and public sectors. In the case of the private sector, society may demand a good or service that a private firm cannot profitably provide, quite often because the desired good or service is a collective good. In the public sector, the provision of certain goods or services may lack the support of the majority of the people. Therefore, nonprofits are the means by which citizens who want more of some collective good or service, such as concert halls or after-school arts education, can supply that need.
This section describes the nonprofit sector in California using data from the IRS Statistics of Income (SOI) Program. While these data show a rich and deep ecosystem of arts-related nonprofits in the region, these figures are based on a sample of nonprofits and are not meant to represent the sector in its entirety. As such, the number of organizations shown here understates the size and contribution of arts-related nonprofits in California.
The SOI data set compiled in 2016 contained a total of 10,210 nonprofit organizations in California that were classified as arts, culture, and humanities organizations representing over 40 different types of organizations. The three largest segments of
NONPROFIT SECTOR OF THE CREATIVE ECONOMY
9
2017 Otis Report on the Creative Economy of Californiawww.otis.edu/otisreport 51CA
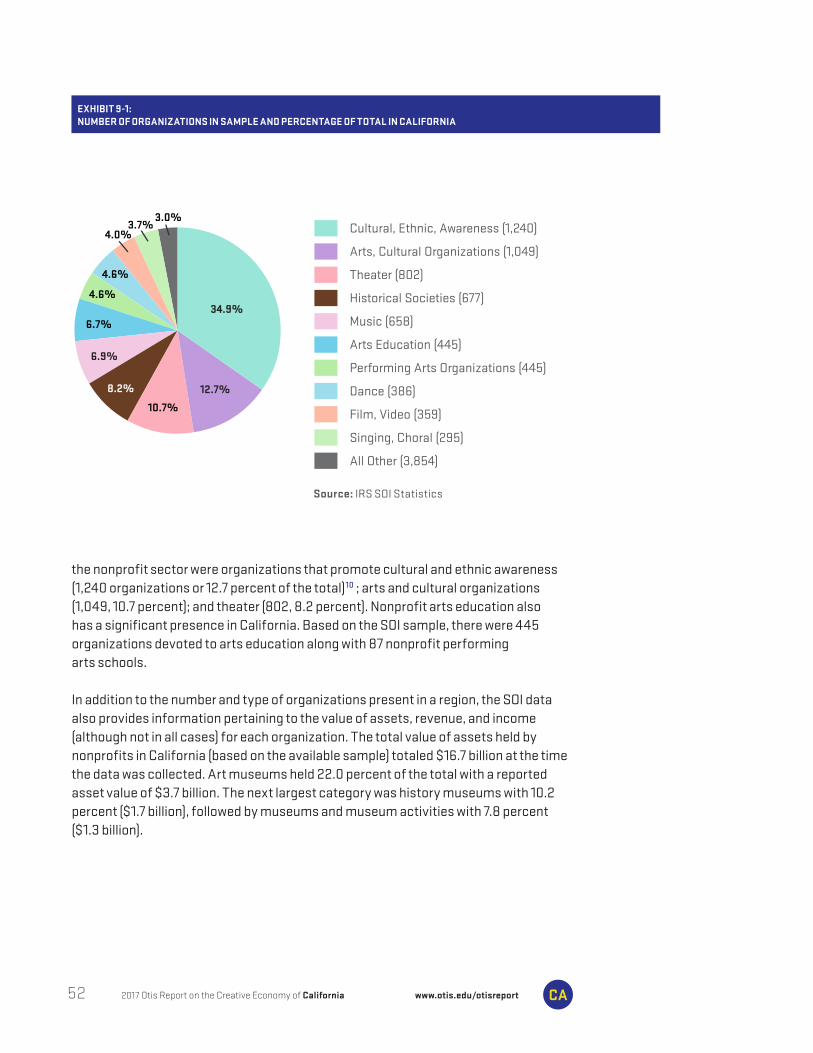
the nonprofit sector were organizations that promote cultural and ethnic awareness (1,240 organizations or 12.7 percent of the total)10 ; arts and cultural organizations (1,049, 10.7 percent); and theater (802, 8.2 percent). Nonprofit arts education also has a significant presence in California. Based on the SOI sample, there were 445 organizations devoted to arts education along with 87 nonprofit performing arts schools.
In addition to the number and type of organizations present in a region, the SOI data also provides information pertaining to the value of assets, revenue, and income (although not in all cases) for each organization. The total value of assets held by nonprofits in California (based on the available sample) totaled $16.7 billion at the time the data was collected. Art museums held 22.0 percent of the total with a reported asset value of $3.7 billion. The next largest category was history museums with 10.2 percent ($1.7 billion), followed by museums and museum activities with 7.8 percent ($1.3 billion).
Cultural, Ethnic, Awareness (1,240)
Arts, Cultural Organizations (1,049)
Theater (802)
Historical Societies (677)
Music (658)
Arts Education (445)
Performing Arts Organizations (445)
Dance (386)
Film, Video (359)
Singing, Choral (295)
All Other (3,854)
34.9%
12.7%
10.7%
8.2%
6.9%
6.7%
4.6%
4.6%
4.0%3.7%
4.0%
3.0%
TOTAL: 10,210
Source: IRS SOI Statistics
EXHIBIT 9-1: NUMBER OF ORGANIZATIONS IN SAMPLE AND PERCENTAGE OF TOTAL IN CALIFORNIA
2017 Otis Report on the Creative Economy of California www.otis.edu/otisreport52 CA
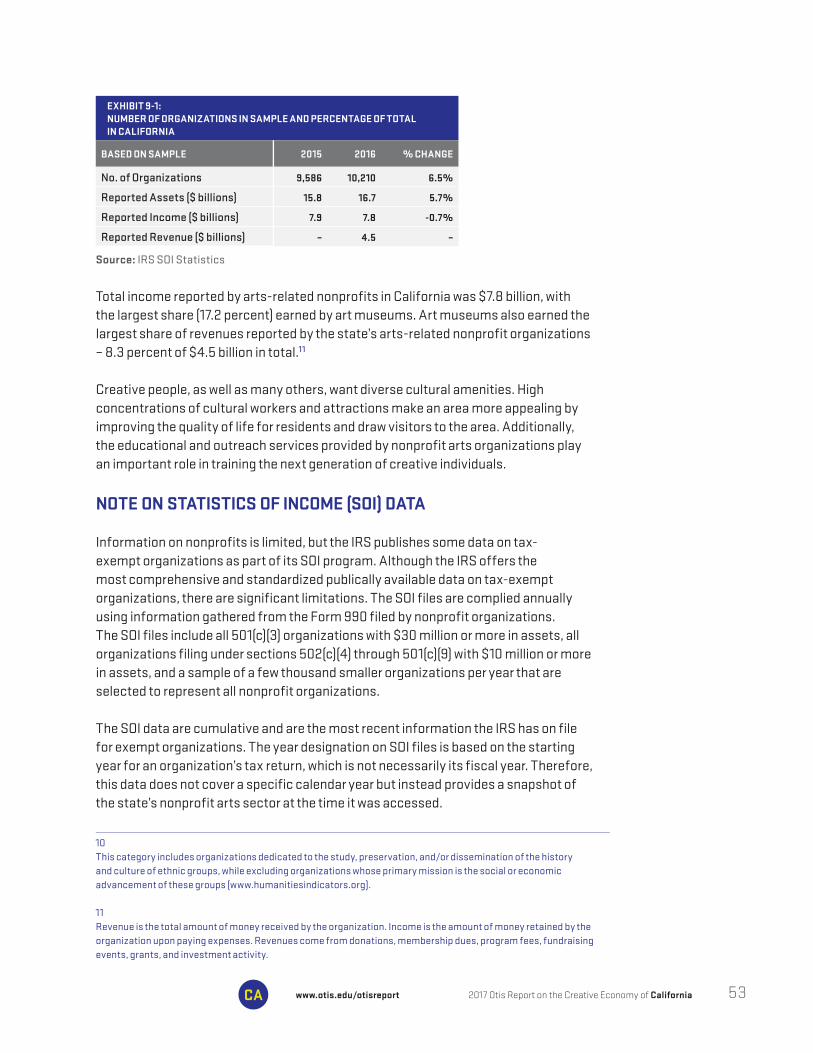
Total income reported by arts-related nonprofits in California was $7.8 billion, with the largest share (17.2 percent) earned by art museums. Art museums also earned the largest share of revenues reported by the state’s arts-related nonprofit organizations – 8.3 percent of $4.5 billion in total.11
Creative people, as well as many others, want diverse cultural amenities. High concentrations of cultural workers and attractions make an area more appealing by improving the quality of life for residents and draw visitors to the area. Additionally, the educational and outreach services provided by nonprofit arts organizations play an important role in training the next generation of creative individuals.
NOTE ON STATISTICS OF INCOME (SOI) DATA
Information on nonprofits is limited, but the IRS publishes some data on tax-exempt organizations as part of its SOI program. Although the IRS offers the most comprehensive and standardized publically available data on tax-exempt organizations, there are significant limitations. The SOI files are complied annually using information gathered from the Form 990 filed by nonprofit organizations. The SOI files include all 501(c)(3) organizations with $30 million or more in assets, all organizations filing under sections 502(c)(4) through 501(c)(9) with $10 million or more in assets, and a sample of a few thousand smaller organizations per year that are selected to represent all nonprofit organizations.
The SOI data are cumulative and are the most recent information the IRS has on file for exempt organizations. The year designation on SOI files is based on the starting year for an organization’s tax return, which is not necessarily its fiscal year. Therefore, this data does not cover a specific calendar year but instead provides a snapshot of the state’s nonprofit arts sector at the time it was accessed.
Source: IRS SOI Statistics
EXHIBIT 9-1: NUMBER OF ORGANIZATIONS IN SAMPLE AND PERCENTAGE OF TOTAL IN CALIFORNIA
BASED ON SAMPLE 2015 2016 % CHANGE
No. of Organizations 9,586 10,210 6.5%
Reported Assets ($ billions) 15.8 16.7 5.7%
Reported Income ($ billions) 7.9 7.8 -0.7%
Reported Revenue ($ billions) – 4.5 –
10This category includes organizations dedicated to the study, preservation, and/or dissemination of the history and culture of ethnic groups, while excluding organizations whose primary mission is the social or economic advancement of these groups (www.humanitiesindicators.org).
11Revenue is the total amount of money received by the organization. Income is the amount of money retained by the organization upon paying expenses. Revenues come from donations, membership dues, program fees, fundraising events, grants, and investment activity.
2017 Otis Report on the Creative Economy of Californiawww.otis.edu/otisreport 53CA
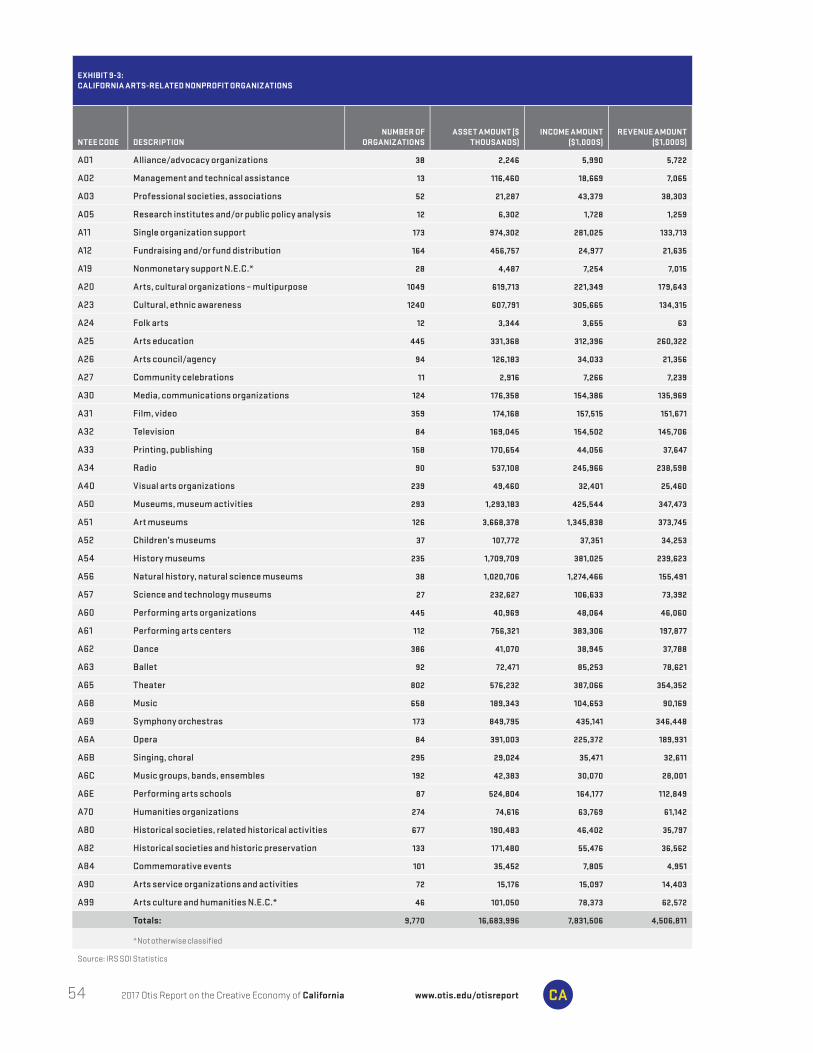
EXHIBIT 9-3: CALIFORNIA ARTS-RELATED NONPROFIT ORGANIZATIONS
NTEE CODE DESCRIPTIONNUMBER OF
ORGANIZATIONSASSET AMOUNT ($
THOUSANDS)INCOME AMOUNT
($1,000S)REVENUE AMOUNT
($1,000S)
A01 Alliance/advocacy organizations 38 2,246 5,990 5,722
A02 Management and technical assistance 13 116,460 18,669 7,065
A03 Professional societies, associations 52 21,287 43,379 38,303
A05 Research institutes and/or public policy analysis 12 6,302 1,728 1,259
A11 Single organization support 173 974,302 281,025 133,713
A12 Fundraising and/or fund distribution 164 456,757 24,977 21,635
A19 Nonmonetary support N.E.C.* 28 4,487 7,254 7,015
A20 Arts, cultural organizations – multipurpose 1049 619,713 221,349 179,643
A23 Cultural, ethnic awareness 1240 607,791 305,665 134,315
A24 Folk arts 12 3,344 3,655 63
A25 Arts education 445 331,368 312,396 260,322
A26 Arts council/agency 94 126,183 34,033 21,356
A27 Community celebrations 11 2,916 7,266 7,239
A30 Media, communications organizations 124 176,358 154,386 135,969
A31 Film, video 359 174,168 157,515 151,671
A32 Television 84 169,045 154,502 145,706
A33 Printing, publishing 158 170,654 44,056 37,647
A34 Radio 90 537,108 245,966 238,598
A40 Visual arts organizations 239 49,460 32,401 25,460
A50 Museums, museum activities 293 1,293,183 425,544 347,473
A51 Art museums 126 3,668,378 1,345,838 373,745
A52 Children’s museums 37 107,772 37,351 34,253
A54 History museums 235 1,709,709 381,025 239,623
A56 Natural history, natural science museums 38 1,020,706 1,274,466 155,491
A57 Science and technology museums 27 232,627 106,633 73,392
A60 Performing arts organizations 445 40,969 48,064 46,060
A61 Performing arts centers 112 756,321 383,306 197,877
A62 Dance 386 41,070 38,945 37,788
A63 Ballet 92 72,471 85,253 78,621
A65 Theater 802 576,232 387,066 354,352
A68 Music 658 189,343 104,653 90,169
A69 Symphony orchestras 173 849,795 435,141 346,448
A6A Opera 84 391,003 225,372 189,931
A6B Singing, choral 295 29,024 35,471 32,611
A6C Music groups, bands, ensembles 192 42,383 30,070 28,001
A6E Performing arts schools 87 524,804 164,177 112,849
A70 Humanities organizations 274 74,616 63,769 61,142
A80 Historical societies, related historical activities 677 190,483 46,402 35,797
A82 Historical societies and historic preservation 133 171,480 55,476 36,562
A84 Commemorative events 101 35,452 7,805 4,951
A90 Arts service organizations and activities 72 15,176 15,097 14,403
A99 Arts culture and humanities N.E.C.* 46 101,050 78,373 62,572
Totals: 9,770 16,683,996 7,831,506 4,506,811
*Not otherwise classified
Source: IRS SOI Statistics
2017 Otis Report on the Creative Economy of California www.otis.edu/otisreport54 CA

ARTS EDUCATION IN THE 21ST CENTURY
Education in the arts is a necessary part of preparing students to meet the demands of the 21st century workplace. Decades of research show strong and consistent links (although research has not yet established causal proof) between high-quality arts education and a wide range of impressive educational outcomes.12 Among these are increased student engagement, improved attendance, focused attention, heightened educational aspirations, and development of habits of mind such as problem solving, critical and creative thinking, dealing with complexity, and integration of multiple skill sets. The arts are also linked to the development of social competencies including collaboration and team work skills, social tolerance, and self-confidence.13
The challenge for K–12 educators throughout California is to find new ways to engage a culturally diverse student body in a meaningful learning experience when students are increasingly turning to digital devices and away from teachers and texts for information and to express ideas. Research points to the success of schools that are “arts-rich.” Often students who may have fallen by the wayside find themselves re-engaged in learning when their interest in film, design, or music is given an outlet for expression.
The call for more rigorous academic standards is insufficient to improve student performance without an attendant focus on developing creativity and imagination. While no one questions the necessity of mastering language, math, and science skills, a singular focus on these subjects ignores the needs of students whose talents run in a different direction. Many graduating high school seniors are products of a narrow curricula, lacking the creative and critical thinking skills needed for success in postsecondary education and the workforce. Studies have demonstrated that students who attend schools where the arts are integrated into the classroom curriculum outperform their peers who did not have an arts-integrated background in math and reading.14 Additionally, the study of the performing and the visual arts helps students “explore realities, relationships and ideas that cannot be conveyed simply in words or numbers.”15
K–12 ARTS EDUCATION
10
2017 Otis Report on the Creative Economy of Californiawww.otis.edu/otisreport 55CA

As stated by the Arts Policy Council16 in its Platform in Support of the Arts:
“To remain competitive in the global economy, America needs to reinvigorate the kind of creativity and innovation that has made this country great. To do so, we must nourish our children’s creative skills. In addition to giving our children the science and math skills they need to compete in the new global context, we should also encourage the ability to think creatively that comes from a meaningful arts education...”
The arts are a vital part of the culture and life of this country and are essential to a complete education. Decades of research and experience show that a high-quality arts education may play an important part in achieving a range of educational objectives including graduating students who are college or workforce ready.
TRACKING ARTS EDUCATION IN CALIFORNIA
The California Department of Education tracks student enrollment in course subject areas. These data provide a count of students enrolled in arts-related courses in K–12 schools from year-to-year and the number of classes that meet UC/CSU entrance requirements, but does not provide information pertaining to outcomes or the level of arts integration in California schools. The data are also limited in that it was collected on a single day in the fall of the academic year. Courses that are only offered later in the year are not included. Course enrollment totals may also duplicate counts of students (a single student may be enrolled in more than one creative course and should not be mistaken as an official enrollment figure.
It is also important to look at this data in the context of official K–12 enrollment figures. Even though California’s total population is rising, its child population is declining. According to the California Department of Finance, if current fertility and migration trends hold over the next decade (2015 to 2025), K–12 enrollment in California is projected to decline by 2.6 percent (or by 162,700 students). In the 2014–15 academic year (AY), total K–12 student enrollment was flat compared with the previous year.
CREATIVE COURSE ENROLLMENT IN CALIFORNIA
During AY 2014–15, the number of students taking creative courses in California increased by 1.5 percent and the number of classes offered rose by 2.8 percent. Looking back over the previous five academic years, the ratio of creative course enrollment to total course enrollment averaged 6.8 percent. The number of creative courses meeting UC/CSU entrance requirements increased by 5.2 percent over the year (AY 2014–15) and comprised 52 percent of all creative course offerings.
2017 Otis Report on the Creative Economy of California www.otis.edu/otisreport56 CA
Course subject areas that saw the largest gains in student enrollment in AY 2014–15 were music (11,990 students, up by 2.4 percent); engineering and architecture (5,841 students, 12.9 percent); arts, media, and entertainment (5,417 students, 3.5 percent); and art (4,129 students, 0.7 percent). Declines in course enrollment occurred in English language arts (journalism); fashion and interior design; building trades and construction; and computer education. (See Exhibit 10-1 for additional details.)
Looking at enrollment in creative subject areas by sex, the distribution between male and female students has been consistent over the last five years with females averaging just over 51 percent of creative course enrollment while accounting for 49 percent of total course enrollment. The ratios for female enrollment were highest in dance (86.5 percent), and fashion and interior design (83.9 percent), while males enrolled at higher rates in building trades and construction (78.3 percent); engineering and architecture (75.7 percent); and manufacturing and product development (66.8 percent). Males also constituted the majority in technology-related courses. Clearly there is still a division along traditional gender lines in the arts and other creative subject courses.
12Scheuler, Leslie (2010). Arts Education Makes a Difference in Missouri Schools. Missouri Alliance for Arts Education; See also Americans for the Arts at www.americansforthe arts.org/research and Preparing Students for the Next America, Arts Education Partnership (2013).
13Reinvesting in Arts Education, President’s Committee on the Arts and Humanities (May 2011).
14Arts integration is the practice of using arts to create relationships between different disciplines to build skills across subjects such as math, science, history, and literature. Stated more simply, arts integration is to teach through and with the arts.
15
Reinvesting in Arts Education, President’s Committee on the Arts and Humanities (May 2011).
16The Arts Policy Council was created by President Barack Obama during his 2008 campaign and is made up of artists, cultural leaders, educators, and advocates to advise on policy matters related to the arts.
2017 Otis Report on the Creative Economy of Californiawww.otis.edu/otisreport 57CA

EX
HIB
IT 10
-1:
CA
LIFO
RN
IA K
–12
CR
EA
TIV
E C
OU
RS
E EN
RO
LLM
ENT
BY
SE
X
Aca
dem
ic Y
ear
2014
–20
1520
13–2
014
2012
–20
1320
11–2
011
220
10–2
011
Cou
rse
Sub
ject
Are
aFe
mal
eM
ale
Tota
lFe
mal
eM
ale
Tota
lFe
mal
eM
ale
Tota
lFe
mal
eM
ale
Tota
lFe
mal
eM
ale
Tota
l
Agr
icul
ture
and
Nat
ural
Res
ourc
es9,
616
4,41
914
,035
9,65
94,
744
14,4
03
---
---
---
---
---
---
---
---
---
Art
289,
276
282,
818
572,
094
286,
059
281,
906
567,
965
285,
684
281,
600
567,
284
282,
214
280,
598
562,
812
301,
116
301,
539
602,
655
Art
s, M
edia
, and
Ent
erta
inm
ent
70,7
94
91,
302
162,
096
68,6
928
7,98
715
6,6
7963
,442
79,9
84
143,
426
59,9
9975
,917
135,
916
48,2
5859
,60
710
7,86
5
Bui
ldin
g Tr
ades
and
Con
stru
ctio
n5,
859
21,1
67
27,0
266,
395
22,0
6228
,457
5,68
120
,258
25,9
395,
596
22,6
7228
,268
6,14
422
,90
729
,051
Com
pute
r Edu
cati
on1,
302
2,52
63,
828
1,58
92,
909
4,49
81,
445
2,88
14,
326
2,0
343,
707
5,74
12,
387
4,48
46,
871
Dan
ce43
,677
6,79
750
,474
42,8
026,
389
49,1
91
38,2
455,
788
44,
033
39,9
4846
,856
86,8
04
39,9
396,
194
46,1
33
Dra
ma/
Thea
ter
76,1
03
57,0
0013
3,10
376
,478
56,2
0613
2,68
46
7,8
3448
,371
116,
205
71,4
44
52,6
2912
4,0
7375
,76
756
,90
713
2,6
74
Engi
neer
ing
and
Arc
hite
ctur
e12
,439
38,8
4851
,28
710
,831
34,6
1545
,446
6,63
919
,482
26,1
216,
800
21,6
1628
,416
5,6
1018
,679
24,2
89
Engl
ish
Lang
uage
Art
s57
,298
50,5
03
107,
801
59,0
2452
,648
111,
672
54,0
2448
,00
110
2,02
560
,571
54,2
8811
4,85
96
1,75
054
,60
111
6,35
1
Fash
ion
and
Inte
rior
Des
ign
6,4
481,
239
7,68
78
,428
1,45
09,
878
3,77
154
34,
314
4,36
982
55,
194
3,99
774
54,
742
Info
rmat
ion
and
Com
mun
icat
ions
Te
chno
logy
5,6
108
,90
414
,514
4,89
57,
186
12,0
81
2,49
74,
679
7,17
62,
724
4,48
27,
206
2,10
23,
495
5,59
7
Man
ufac
turi
ng a
nd P
rodu
ct
Dev
elop
men
t2,
738
5,51
38
,251
2,15
14,
812
6,96
31,
627
3,80
15,
428
1,95
44,
661
6,6
151,
750
4,05
25,
802
Mus
ic27
0,1
1923
9,8
1650
9,93
526
2,42
623
5,51
949
7,9
4524
8,64
023
0,8
81
479,
521
264,
782
245,
456
510
,238
240,
859
231,
382
472,
241
CR
EA
TIV
E C
OU
RS
E TO
TALS
:85
1,27
98
10,8
521,
662,
131
839
,429
798
,433
1,63
7,86
277
9,52
974
6,26
91,
525,
798
802,
435
813
,70
71,
616
,142
789,
679
764,
592
1,55
4,27
1
All
Cou
rses
Tot
als:
11,0
91,
159
11,6
66,2
7622
,757
,435
11,0
09,8
3811
,539
,705
22,5
49,5
4310
,800
,648
11,3
81,
715
22,1
82,3
6310
,324
,273
10,8
36,8
07
21,1
61,
080
11,2
04,
716
11,7
02,4
07
22,9
07,
123
Sou
rce:
Cal
ifor
nia
Dep
artm
ent o
f Edu
catio
n, D
ataQ
uest
2017 Otis Report on the Creative Economy of California www.otis.edu/otisreport58 CA

EXHIBIT 10-2: CALIFORNIA K–12 CREATIVE COURSES MEETING UC/CSU REQUIREMENTS
Academic Year 2014–2015 2013–2014 2012–2013 2011–2012 2010–2011
Course Subject Area Classes
Classes Meeting UC/CSU
Requirements Classes
Classes Meeting UC/CSU
Requirements Classes
Classes Meeting UC/CSU
Requirements Classes
Classes Meeting UC/CSU
Requirements Classes
Classes Meeting UC/CSU
Requirements
Agriculture and Natural Resources 651 261 703 240 --- --- --- --- --- ---
Art 28,466 17,722 28,352 17,499 23,924 14,612 25,304 14,065 24,234 14,305
Arts, Media, and Entertainment 7,068 3,828 6,680 3,360 5,524 2,786 5,417 2,414 4,094 2,242
Building Trades and Construction 1,254 11 1,280 9 1,092 13 1,228 22 1,230 16
Computer Education 198 13 244 15 208 9 285 34 336 37
Dance 2,038 1,175 1,988 1,081 1,584 861 1,685 895 1,608 951
Drama/Theater 5,816 3,336 5,507 3,169 4,412 2,492 4,816 2,620 4,880 2,784
Engineering and Architecture 2,171 1,008 1,949 796 1,080 339 1,196 332 993 219
English Language Arts 5,964 3,883 5,896 3,612 4,707 2,773 5,003 2,627 5,113 2,870
Fashion and Interior Design 609 60 757 61 255 32 344 27 273 18
Information and Communications Technology 665 226 549 150 265 87 266 80 207 68
Manufacturing and Product Development 400 76 347 60 227 110 281 129 258 135
Music 18,586 6,789 17,641 6,423 15,460 5,977 17,877 6,390 15,354 5,989
CREATIVE COURSE TOTALS: 73,886 38,388 71,893 36,475 58,738 30,091 63,702 29,635 58,580 29,634
All Courses Totals: 1,056,050 332,392 1,028,919 324,509 916,230 298,064 881,252 282,779 912,895 275,467
Source: California Department of Education, DataQuest
2017 Otis Report on the Creative Economy of Californiawww.otis.edu/otisreport 59CA

The following is a series of “snapshots” that divide California into eight regions based on geography and economic linkages. The results reveal significant differences in the size and character of the creative industries throughout the state, highlighting the diversity of California’s creative economy.
THE REGIONS:
CALIFORNIA REGIONAL SNAPSHOTS
11
2017 Otis Report on the Creative Economy of California www.otis.edu/otisreport60 CA

BAY AREAThe Bay Area includes the counties of Alameda, Contra Costa, Marin, Napa, San Benito, San Francisco, San Joaquin, San Mateo, Santa Clara, Santa Cruz, Solano, and Sonoma.
$145,169$228,950
$292,744
$105,130
$89,902
$58,549
$50,332$48,244
$20,606
$106,661
$101,329
$85,479
$53,310
Publishing/Printing
Digital Media
Entertainment
Communication Arts
Toys
Industrial Design Services
Architecture/Interior Design
Average Wage All Industries
Furniture/Decorative Arts
Visual/Performing Arts
Art Galleries
Fashion
Fine/Performing Arts Schools
Source: Bureau of Labor Statistics, QCEW Series
EXHIBIT 11-1: BAY AREA AVERAGE ANNUAL WAGE BY INDUSTRY, 2015
2017 Otis Report on the Creative Economy of Californiawww.otis.edu/otisreport 61CA

EXHIBIT 11-2BAY AREA CREATIVE INDUSTRY EMPLOYMENT
INDUSTRY SECTOR
NUMBER OF JOBS (1,000S) 2010–2015 CHANGE
2010 2015 Number Percent
Architecture and Interior Design 10,700 13,400 2,700 25.2%
Art Galleries 500 500 0 0.0%
Communication Arts 9,200 11,400 2,200 23.9%
Digital Media 26,900 38,000 11,100 41.3%
Entertainment 14,600 9,700 -4,900 -33.6%
Fashion 5,600 7,600 2,000 35.7%
Furniture and Decorative Arts 9,300 12,400 3,100 33.3%
Industrial Design Services 600 600 0 0.0%
Publishing and Printing 39,500 77,100 37,600 95.2%
Toys 700 400 -300 -42.9%
Visual and Performing Arts Providers 8,000 8,200 200 2.5%
Fine and Performing Arts Schools 2,600 3,400 800 30.8%
Totals: 128,200 182,700 54,500 42.5%
Source: Bureau of Labor Statistics, QCEW Series; Estimates by IAE
EXHIBIT 11-3BAY AREA CREATIVE NONEMPLOYER FIRMS, 2014
INDUSTRY SECTOR
FIRMS
REVENUE
($ THOUSANDS)
Art Galleries 651 48,061
Communication Arts 23,426 1,066,253
Architecture and Interior Design 4,948 282,552
Fashion 2,216 133,014
Entertainment 4,591 187,361
Visual and Performing Arts Providers 34,284 864,255
Furniture and Decorative Arts 966 68,473
Publishing and Printing 4,203 172,499
Toys 213 11,784
Totals: 75,498 2,834,252
Source: U.S. Census Bureau, Nonemployer Statistics
2017 Otis Report on the Creative Economy of California www.otis.edu/otisreport62 CA

CAPITAL REGIONThe Capital Region includes of the counties of El Dorado, Nevada, Placer, Sacramento, and Yolo.
$72,639$76,119
$95.677
$52,733
$49,822
$43,585
$34,163$15,638
$13,380
$71,621
$51,622
$46,264
$42,066
Digital Media
Entertainment
Architecture/Interior Design
Toys
Communication Arts
Publishing/Printing
Average Wage All Industries
Art Galleries
Fashion
Furniture/Decorative Arts
Visual/Performing Arts
Fine/Performing Arts Schools
Industrial Design Services
Source: Bureau of Labor Statistics, QCEW Series
EXHIBIT 11-4: CAPITAL REGION AVERAGE ANNUAL WAGE BY INDUSTRY, 2015
2017 Otis Report on the Creative Economy of Californiawww.otis.edu/otisreport 63CA

EXHIBIT 11-5CAPITAL REGION CREATIVE INDUSTRY EMPLOYMENT
INDUSTRY SECTOR
NUMBER OF JOBS (1,000S) 2010–2015 CHANGE
2010 2015 Number Percent
Architecture and Interior Design 1,800 1,900 100 5.6%
Art Galleries 10 90 80 777.0%
Communication Arts 1,200 1,100 -100 -8.3%
Digital Media 800 900 100 12.5%
Entertainment 1,200 2,300 1,100 91.7%
Fashion 300 300 0 0.0%
Furniture and Decorative Arts 2,200 1,900 -300 -13.6%
Industrial Design Services 25 80 55 220.0%
Publishing and Printing 4,300 3,700 -600 -14.0%
Toys 200 200 0 0.0%
Visual and Performing Arts Providers 700 800 100 14.3%
Fine and Performing Arts Schools 200 300 100 50.0%
Totals: 12,935 13,570 635 4.9%
Source: Bureau of Labor Statistics, QCEW Series; Estimates by IAE
EXHIBIT 11-6CAPITAL REGION CREATIVE NONEMPLOYER FIRMS, 2014
INDUSTRY SECTOR
FIRMS
REVENUE
($ THOUSANDS)
Art Galleries 135 5,449
Communication Arts 4,198 151,813
Architecture and Interior Design 901 39,078
Fashion 478 16,812
Entertainment 730 23,185
Visual and Performing Arts Providers 5,918 114,325
Furniture and Decorative Arts 220 13,990
Publishing and Printing 901 32,716
Toys 47 1,464
Totals: 13,528 398,832
Source: U.S. Census Bureau, Nonemployer Statistics
2017 Otis Report on the Creative Economy of California www.otis.edu/otisreport64 CA

CENTRAL COASTThe Central Coast includes of the counties of Monterey, San Luis Obispo, Santa Barbara, and Ventura.
$82,389$104,897
$133,721
$74,138
$65,601
$50,221
$47,712$47,001
$27,964
$77,832
$66,775
$58,843
$48,443
Toys
Digital Media
Industrial Design Services
Entertainment
Visual/Performing Arts
Architecture/Interior Design
Communication Arts
Publishing/Printing
Art Galleries
Fashion
Furniture/Decorative Arts
Average Wage All Industries
Fine/Performing Arts Schools
Source: Bureau of Labor Statistics, QCEW Series
EXHIBIT 11-7: CENTRAL COAST AVERAGE ANNUAL WAGE BY INDUSTRY, 2015
2017 Otis Report on the Creative Economy of Californiawww.otis.edu/otisreport 65CA

EXHIBIT 11-8CENTRAL COAST CREATIVE INDUSTRY EMPLOYMENT
INDUSTRY SECTOR
NUMBER OF JOBS (1,000S) 2010–2015 CHANGE
2010 2015 Number Percent
Architecture and Interior Design 1,200 1,500 300 25.0%
Art Galleries 200 100 -100 -50.0%
Communication Arts 800 900 100 12.5%
Digital Media 1,460 2,500 1,040 71.2%
Entertainment 1,100 1,200 100 9.1%
Fashion 1,500 1,700 200 13.3%
Furniture and Decorative Arts 1,800 2,200 400 22.2%
Industrial Design Services 120 200 80 66.7%
Publishing and Printing 5,000 3,300 -1,700 -34.0%
Toys 200 100 -100 -50.0%
Visual and Performing Arts Providers 1,300 1,200 -100 -7.7%
Fine and Performing Arts Schools 400 400 0 0.0%
Totals: 15,100 15,300 220 1.5%
Source: Bureau of Labor Statistics, QCEW Series; Estimates by IAE
EXHIBIT 11-9CENTRAL COAST CREATIVE NONEMPLOYER FIRMS, 2014
INDUSTRY SECTOR
FIRMS
REVENUE
($ THOUSANDS)
Art Galleries 203 17,809
Communication Arts 4,516 185,025
Architecture and Interior Design 1,124 53,712
Fashion 631 29,031
Entertainment 1,199 47,692
Visual and Performing Arts Providers 7,101 184,564
Furniture and Decorative Arts 243 13,063
Publishing and Printing 898 38,907
Toys 20 1,120
Totals: 15,935 570,923
Source: U.S. Census Bureau, Nonemployer Statistics
2017 Otis Report on the Creative Economy of California www.otis.edu/otisreport66 CA

CENTRAL VALLEYThe Central Valley includes the counties of Alpine, Amador, Calaveras, Fresno, Inyo, Kern, Kings, Madera, Mariposa, Merced, Mono, Stanislaus, Tulare, and Tuolumne.
$62,863$63,955
$111,626
$43,506
$38,609
$36,242
$32,981$19,897
$14,511
$57,492
$41,731
$38,019
$33,891
Entertainment
Digital Media
Industrial Design Services
Architecture/Interior Design
Visual/Performing Arts
Publishing/Printing
Average Wage All Industries
Communication Arts
Furniture/Decorative Arts
Art Galleries
Fashion
Toys
Fine/Performing Arts Schools
Source: Bureau of Labor Statistics, QCEW Series
EXHIBIT 11-10: CENTRAL VALLY AVERAGE ANNUAL WAGE BY INDUSTRY, 2015
2017 Otis Report on the Creative Economy of Californiawww.otis.edu/otisreport 67CA

EXHIBIT 11-11CENTRAL VALLEY CREATIVE INDUSTRY EMPLOYMENT
INDUSTRY SECTOR
NUMBER OF JOBS (1,000S) 2010–2015 CHANGE
2010 2015 Number Percent
Architecture and Interior Design 800 1,000 200 25.0%
Art Galleries 60 25 -35 -58.3%
Communication Arts 800 500 -300 -37.5%
Digital Media 30 50 20 66.7%
Entertainment 2,100 1,900 -200 -9.5%
Fashion 800 300 -500 -62.5%
Furniture and Decorative Arts 1,400 2,100 700 50.0%
Industrial Design Services 50 40 -10 -20.0%
Publishing and Printing 3,000 2,000 -1,000 -33.3%
Toys 100 200 100 100.0%
Visual and Performing Arts Providers 700 400 -300 -42.9%
Fine and Performing Arts Schools 300 500 200 66.7%
Totals: 10,140 9,015 -1,125 -11.1%
Source: Bureau of Labor Statistics, QCEW Series; Estimates by IAE
EXHIBIT 11-12CENTRAL VALLEY CREATIVE NONEMPLOYER FIRMS, 2014
INDUSTRY SECTOR
FIRMS
REVENUE
($ THOUSANDS)
Art Galleries 85 3,472
Communication Arts 2,693 75,555
Architecture and Interior Design 820 28,899
Fashion 436 15,098
Entertainment 374 10,538
Visual and Performing Arts Providers 3,755 60,161
Furniture and Decorative Arts 192 9,262
Publishing and Printing 645 21,296
Toys 62 1,955
Totals: 9,062 226,236
Source: U.S. Census Bureau, Nonemployer Statistics
2017 Otis Report on the Creative Economy of California www.otis.edu/otisreport68 CA

INLAND EMPIREThe Central Valley includes the counties of Riverside and San Bernardino.
$64,249$70,530
$104,476
$59,636
$42,243
$40,677
$39,566$39,458$14,746
$64,249
$43,058
$41,279
$40,436
Digital Media
Entertainment
Industrial Design Services
Publishing/Printing
Architecture/Interior Design
Furniture/Decorative Arts
Art Galleries
Toys
Fashion
Average Wage All Industries
Visual/Performing Arts
Communication Arts
Fine/Performing Arts Schools
Source: Bureau of Labor Statistics, QCEW Series
EXHIBIT 11-13: INLAND EMPIRE AVERAGE ANNUAL WAGE BY INDUSTRY, 2015
2017 Otis Report on the Creative Economy of Californiawww.otis.edu/otisreport 69CA

EXHIBIT 11-14INLAND EMPIRE CREATIVE INDUSTRY EMPLOYMENT
INDUSTRY SECTOR
NUMBER OF JOBS (1,000S) 2010–2015 CHANGE
2010 2015 Number Percent
Architecture and Interior Design 1,400 1,900 500 35.7%
Art Galleries 60 100 40 66.7%
Communication Arts 1,400 1,300 -100 -7.1%
Digital Media 100 300 200 200.0%
Entertainment 2,100 1,300 -800 -38.1%
Fashion 2,600 3,700 1,100 42.3%
Furniture and Decorative Arts 8,200 9,800 1,600 19.5%
Industrial Design Services 10 100 90 900.0%
Publishing and Printing 4,500 3,900 -600 -13.3%
Toys 300 300 0 0.0%
Visual and Performing Arts Providers 1,700 1,900 200 11.8%
Fine and Performing Arts Schools 400 200 -200 -50.0%
Totals: 22,770 24,800 2,030 8.9%
Source: Bureau of Labor Statistics, QCEW Series; Estimates by IAE
EXHIBIT 11-15INLAND EMPIRE CREATIVE NONEMPLOYER FIRMS, 2014
INDUSTRY SECTOR
FIRMS
REVENUE
($ THOUSANDS)
Art Galleries 149 7,538
Communication Arts 5,214 185,453
Architecture and Interior Design 1,427 52,758
Fashion 1,128 55,565
Entertainment 965 25,965
Visual and Performing Arts Providers 7,702 155,293
Furniture and Decorative Arts 512 36,531
Publishing and Printing 1,147 50,407
Toys 138 8,500
Totals: 18,382 578,010
Source: U.S. Census Bureau, Nonemployer Statistics
2017 Otis Report on the Creative Economy of California www.otis.edu/otisreport70 CA

SAN DIEGO AND THE IMPERIAL VALLEYThis region includes the counties of San Diego and Imperial.
$80,486$100,967
$146,760
$75,181
$60,871
$48,152
$44,396$33,989$17,973
$76,296
$62,302
$55,717
$47,466
Digital Media
Industrial Design Services
Toys
Entertainment
Architecture/Interior Design
Publishing/Printing
Communication Arts
Average Wage All Industries
Fashion
Furniture/Decorative Arts
Visual/Performing Arts
Art Galleries
Fine/Performing Arts Schools
Source: Bureau of Labor Statistics, QCEW Series
EXHIBIT 11-16: SAN DIEGO/IMPERIAL AVERAGE ANNUAL WAGE BY INDUSTRY, 2015
2017 Otis Report on the Creative Economy of Californiawww.otis.edu/otisreport 71CA

EXHIBIT 11-17SAN DIEGO/IMPERIAL VALLEY CREATIVE INDUSTRY EMPLOYMENT
INDUSTRY SECTOR
NUMBER OF JOBS (1,000S) 2010–2015 CHANGE
2010 2015 Number Percent
Architecture and Interior Design 3,200 3,800 600 18.8%
Art Galleries 200 200 0 0.0%
Communication Arts 2,300 2,600 300 13.0%
Digital Media 4,200 4,200 0 0.0%
Entertainment 4,800 3,100 -1,700 -35.4%
Fashion 3,300 3,600 300 9.1%
Furniture and Decorative Arts 3,700 3,800 100 2.7%
Industrial Design Services 230 200 -30 -13.0%
Publishing and Printing 8,600 7,300 -1,300 -15.1%
Toys 300 300 0 0.0%
Visual and Performing Arts Providers 4,000 3,700 -300 -7.5%
Fine and Performing Arts Schools 500 800 300 60.0%
Totals: 35,330 33,600 -1,730 -4.9%
Source: Bureau of Labor Statistics, QCEW Series; Estimates by IAE
EXHIBIT 11-21SOUTHERN CALIFORNIA CREATIVE NONEMPLOYER FIRMS, 2014
INDUSTRY SECTOR
FIRMS
REVENUE
($ THOUSANDS)
Art Galleries 197 10,298
Communication Arts 8,260 317,879
Architecture and Interior Design 1,614 70,268
Fashion 1,038 54,970
Entertainment 1,297 40,153
Visual and Performing Arts Providers 10,545 222,627
Furniture and Decorative Arts 387 25,104
Publishing and Printing 1,365 60,730
Toys 68 3,690
Totals: 24,771 805,719
Source: U.S. Census Bureau, Nonemployer Statistics
2017 Otis Report on the Creative Economy of California www.otis.edu/otisreport72 CA
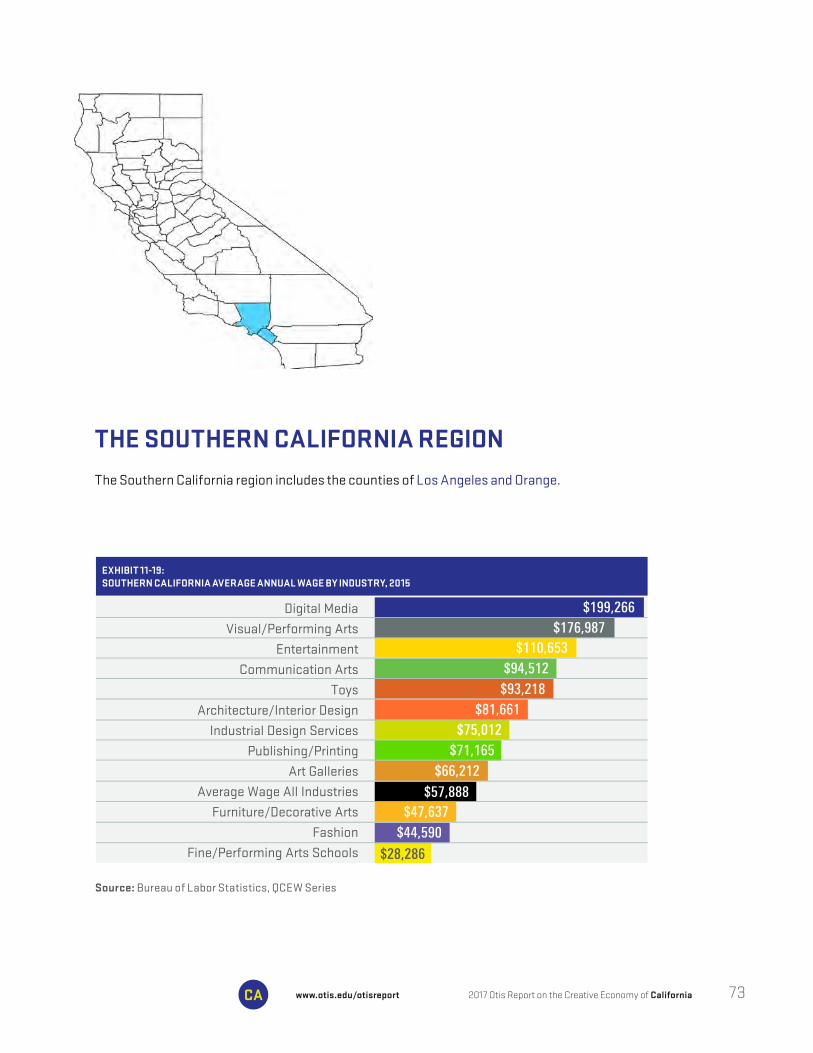
THE SOUTHERN CALIFORNIA REGIONThe Southern California region includes the counties of Los Angeles and Orange.
$110,653$176,987
$199,266
$93,218
$75,012
$66,212
$47,637$44,590
$28,286
$94,512
$81,661
$71,165
$57,888
Digital Media
Visual/Performing Arts
Entertainment
Communication Arts
Toys
Architecture/Interior Design
Industrial Design Services
Publishing/Printing
Art Galleries
Average Wage All Industries
Furniture/Decorative Arts
Fashion
Fine/Performing Arts Schools
Source: Bureau of Labor Statistics, QCEW Series
EXHIBIT 11-19: SOUTHERN CALIFORNIA AVERAGE ANNUAL WAGE BY INDUSTRY, 2015
2017 Otis Report on the Creative Economy of Californiawww.otis.edu/otisreport 73CA

EXHIBIT 11-20SOUTHERN CALIFORNIA CREATIVE INDUSTRY EMPLOYMENT
INDUSTRY SECTOR
NUMBER OF JOBS (1,000S) 2010–2015 CHANGE
2010 2015 Number Percent
Architecture and Interior Design 14,700 18,400 3,700 25.2%
Art Galleries 900 1,000 100 11.1%
Communication Arts 21,300 25,100 3,800 17.8%
Digital Media 9,700 13,200 3,500 36.1%
Entertainment 134,000 143,200 9,200 6.9%
Fashion 97,600 98,100 500 0.5%
Furniture and Decorative Arts 35,200 37,700 2,500 7.1%
Industrial Design Services 1,100 1,000 -100 -9.1%
Publishing and Printing 46,900 46,600 -300 -0.6%
Toys 5,000 5,200 200 4.0%
Visual and Performing Arts Providers 27,200 34,800 7,600 27.9%
Fine and Performing Arts Schools 4,200 5,100 900 21.4%
Totals: 397,800 429,400 31,600 7.9%
Source: Bureau of Labor Statistics, QCEW Series; Estimates by IAE
EXHIBIT 11-21SOUTHERN CALIFORNIA CREATIVE NONEMPLOYER FIRMS, 2014
INDUSTRY SECTOR
FIRMS
REVENUE
($ THOUSANDS)
Art Galleries 901 63,361
Communication Arts 37,280 1,705,056
Architecture and Interior Design 6,776 324,419
Fashion 8,198 800,695
Entertainment 22,383 1,081,459
Visual and Performing Arts Providers 91,084 3,748,982
Furniture and Decorative Arts 2,138 179,081
Publishing and Printing 5,722 293,125
Toys 508 46,949
Totals: 174,990 8,243,127
Source: U.S. Census Bureau, Nonemployer Statistics
2017 Otis Report on the Creative Economy of California www.otis.edu/otisreport74 CA

UPSTATE CALIFORNIAThe Upstate region includes the counties of Butte, Colusa, Del Norte, Glenn, Humboldt, Lake, Lassen, Mendocino, Modoc, Plumas, Shasta, Sierra, Sisikyou, Sutter, Tehama, Trinity, and Yuba.
$54,481$71,560
$107,569
$42,955
$36,400
$28,385
$19,727$14,850
$49,123
$37,104
$36,361
$24,520
Digital Media
Entertainment
Toys
Visual/Performing Arts
Architecture/Interior Design
Furniture/Decorative Arts
Communication Arts
Average Wage All Industries
Publishing/Printing
Fashion
Art Galleries
Fine/Performing Arts Schools
Source: Bureau of Labor Statistics, QCEW Series
EXHIBIT 11-22: UPSTATE CALIFORNIA AVERAGE ANNUAL WAGE BY INDUSTRY, 2015
2017 Otis Report on the Creative Economy of Californiawww.otis.edu/otisreport 75CA

EXHIBIT 11-23UPSTATE CALIFORNIA CREATIVE INDUSTRY EMPLOYMENT
INDUSTRY SECTOR
NUMBER OF JOBS (1,000S) 2010–2015 CHANGE
2010 2015 Number Percent
Architecture and Interior Design 200 300 100 50.0%
Art Galleries 30 30 0 0.0%
Communication Arts 200 100 -100 -50.0%
Digital Media 300 300 0 0.0%
Entertainment 300 1,600 1,300 433.3%
Fashion 600 600 0 0.0%
Furniture and Decorative Arts 600 600 0 0.0%
Industrial Design Services 0 0 0 0.0%
Publishing and Printing 800 700 -100 -12.5%
Toys 90 50 -40 -44.4%
Visual and Performing Arts Providers 300 200 -100 -33.3%
Fine and Performing Arts Schools 100 100 0 0.0%
Totals: 3,520 4,580 1,060 30.1%
Source: Bureau of Labor Statistics, QCEW Series; Estimates by IAE
EXHIBIT 11-24UPSTATE CALIFORNIA CREATIVE NONEMPLOYER FIRMS, 2014
INDUSTRY SECTOR
FIRMS
REVENUE
($ THOUSANDS)
Art Galleries 71 2,151
Communication Arts 1,219 33,510
Architecture and Interior Design 307 12,407
Fashion 250 9,463
Entertainment 183 3,883
Visual and Performing Arts Providers 2,498 38,480
Furniture and Decorative Arts 183 6,724
Publishing and Printing 335 12,379
Toys 0 0
Totals: 5,046 118,997
Source: U.S. Census Bureau, Nonemployer Statistics
2017 Otis Report on the Creative Economy of California www.otis.edu/otisreport76 CA

STATISTICAL APPENDIX
12
NOTES ON METHODOLOGY AND DATA
In 2007, Otis College of Art and Design commissioned the LAEDC to undertake the first comprehensive analysis of the creative economy in the Los Angeles region and evaluate its contribution to the regional economies. The Otis Report on the Creative Economy of California was added in 2013.
In 2013, the research methodology utilized in this report was changed in three ways. The first two changes involved revisions in the definition of the creative economy. First, additional subsectors within the creative industries were added to the existing creative industries. Second, a new sector was added: publishing and printing. Both of these changes better align the creative industry definitions used in this research with the definitions that are increasingly being adopted elsewhere in the literature. The creative sectors or industries in this report encompass the following:
• Architecture and interior design• Art galleries• Arts education• Communication arts• Digital media• Entertainment• Fashion• Furniture and decorative arts• Industrial design services• Publishing and printing• Toys• Visual and performing arts
The data collected for this report include employment, establishments, payroll activity, and other measures for all the creative economy’s sectors in California, which come from the following sources:
• U.S. Bureau of the Census• U.S. Bureau of Labor Statistics (BLS)• U.S. Bureau of Economic Analysis (BEA)• California Employment Development Department (EDD)• California Department of Education• Internal Revenue Service (IRS)
2017 Otis Report on the Creative Economy of Californiawww.otis.edu/otisreport 77CA

Much of the industry-level information in this report comes directly from the Bureau of Labor Statistics’ Quarterly Census of Employment and Wages (QCEW Series). These data are based on unemployment tax payments that all firms with employees are required to make into the state unemployment insurance fund. Because the coverage is so comprehensive, this source is the best available for employment and wage information.
The third change relates to data used in the contribution analysis portion of this study. The IMPLAN model was used to assess the economic contribution of the creative industries to the overall economy. In conceptual terms, economic contribution analysis evaluates the ripple effect of a specific economic activity throughout the rest of the economy. Contribution analysis captures the direct impact as well as the indirect and induced impacts of that activity on employment, output, and taxes.
However, in a departure from past years, beginning in 2013, the contribution analysis began using employment and payroll data from the QCEW, rather than the estimated sales, shipments, and revenues that were based on data from the Economic Census.
Because the definitions used in this study were expanded and because the methodology for calculating the economic contribution has been altered from previous years, the figures contained in this report and those after 2013 are not directly comparable to the studies conducted by Otis College and the LAEDC in the years prior to these changes.
2017 Otis Report on the Creative Economy of California www.otis.edu/otisreport78 CA

EX
HIB
IT A
-1:
ECO
NO
MIC
CO
NTR
IBU
TIO
N O
F C
ALI
FOR
NIA
’S C
RE
ATI
VE
IND
US
TRIE
S, 2
015
Indu
stry
Es
tabl
ishm
ents
Jo
bs
P
ayro
ll ($
bill
ions
)
S
elf-
Empl
oyed
Tota
l Con
trib
utio
n (D
irec
t, In
dire
ct, I
nduc
ed)
Out
put
($ b
illio
ns)
Tota
l J
obs
Labo
r In
com
e ($
bill
ions
)Ta
xes
($ m
illio
ns)
Arc
hite
ctur
e an
d In
teri
or D
esig
n6,
264
43,2
003.
4918
,210
13.5
8
4,00
05.
850
6.2
Art
Gal
leri
es63
32,
300
0.12
2,46
30.
23,
100
0.2
26.3
Com
mun
icat
ion
Art
s5,
977
46,0
004.
118
7,42
114
.783
,500
6.2
586.
0
Dig
ital
Med
ia1,
711
61,5
0012
.71
---
47.9
153,
100
17.7
1,70
4.1
Ente
rtai
nmen
t8,
861
171,
500
18.8
531
,958
113.
833
3,60
028
.23,
776.
6
Fash
ion
9,40
611
9,80
05.
4114
,814
42.4
208,
100
10.9
2,91
7.7
Furn
itur
e an
d D
ecor
ativ
e A
rts
4,48
772
,700
3.57
5,14
426
.212
7,20
06.
91,
441
.6
Indu
stri
al D
esig
n S
ervi
ces
335
2,20
00.
19--
-0.
43,
600
0.3
25.2
Pub
lishi
ng a
nd P
rint
ing
7,14
215
4,20
027
.71
15,4
4812
8.4
505,
100
48.3
4,52
8.4
Toys
494
7,30
00.
661,
145
3.5
15,3
001.
130
1.3
Vis
ual a
nd P
erfo
rmin
g A
rts
Pro
vide
rs12
,667
55,4
007.
2716
3,96
414
.610
6,30
010
.18
41.5
Fine
and
Per
form
ing
Art
s S
choo
ls1,
496
11,5
000.
27--
-0.
913
,900
0.4
34.8
Tota
ls:
59,4
7374
7,60
08
4.35
340,
567
406.
51,
636,
800
136.
016
,689
.6
(Tot
als
may
not
add
due
to ro
undi
ng)
Sour
ce: B
urea
u of
Lab
or S
tatis
tics,
U.S
. Cen
sus
Bur
eau,
est
imat
es b
y LA
EDC
IAE
2017 Otis Report on the Creative Economy of Californiawww.otis.edu/otisreport 79CA

EXHIBIT A-2: CALIFORNIA CREATIVE INDUSTRY EMPLOYMENT, 2010–2015
Avg. Number of Jobs 2010–2015 Change
Creative Industry NAICS Code 2010 2015 Number Percent
Architecture and Interior Design: 35,100 43,200 8,100 23.0%
Architectural Services 54131 21,600 26,200 4,600 21.2%
Landscape Design 54132 5,400 6,500 1,100 20.1%
Drafting Services 54134 800 700 -100 -7.7%
Interior Design 54141 4,300 6,400 2,100 49.4%
Ornamental/Architectural Metal Work Mfg. 332323 3,000 3,300 300 11.0%
Art Galleries: 45392 2,100 2,300 200 11.0%
Communication Arts: 39,400 46,000 6,500 16.6%
Graphic Design 54143 10,100 10,800 700 6.1%
Advertising Agencies 54181 21,900 28,800 6,900 31.7%
Photography Studios, Portrait 541921 6,200 5,100 -1,100 -17.2%
Commercial Photography 541922 1,200 1,300 100 4.6%
Digital Media: 44,700 61,500 16,800 37.7%
Software Publishers 5112 44,700 61,500 16,800 37.7%
Entertainment: 166,400 171,500 5,100 3.1%
Motion Picture/Video Production 51211 107,500 117,200 9,700 9.0%
Motion Picture Distribution 51212 2,300 2,300 0 -0.9%
Post Production Services 51219 11,300 9,600 -1,700 -15.1%
Sound Recording 5122 3,900 3,600 -300 -8.0%
Radio Stations 515112 6,900 6,200 -700 -9.5%
Television Broadcasting 515120 17,100 20,100 3,000 17.4%
Cable Broadcasting 5152 17,200 12,400 -4,800 -27.8%
Fashion: 115,900 119,800 3,900 3.3%
Textile Mills Manufacturing 313 9,000 8,200 -800 -8.8%
Apparel Manufacturing 315 58,700 50,900 -7,800 -13.3%
Apparel Wholesaling 4243 30,500 39,800 9,300 30.2%
Footwear Manufacturing 3162 900 600 -300 -26.6%
Footwear Wholesaling 42434 5,400 6,100 700 13.0%
Women’s Handbag Manufacturing 316992 100 100 0 20.6%
Cosmetics Manufacturing 32562 5,800 7,200 1,400 24.5%
Jewelry Manufacturing 33991 2,600 3,000 400 12.2%
Jewelry Wholesaling 42394 5,700 6,800 1,100 18.9%
Other Specialized Design Services 54149 2,500 3,100 600 24.0%
Furniture and Decorative Arts: 66,800 72,700 5,900 8.9%
Textile Product Mills 314 9,500 8,800 -700 -7.4%
Furniture Manufacturing 337 31,300 34,700 3,400 10.8%
Furniture Wholesaling 4232 16,700 20,000 3,300 19.7%
Electric Lighting Fixtures 33512 6,400 6,900 500 7.1%
China Plumbing Fixtures, China, Earthenware 327111 50 0 -50 ---
Other China, Fine Earthenware and PotteryManufacturing 327112 700 0 -700 ---
Pressed and Blown Glass and Glassware Manufacturing 327212 800 900 100 16.3%
Other Misc. Nonmetallic Mineral Product Mfg. 327999 1,300 1,400 100 6.6%
Industrial Design Services: 54142 2,300 2,200 -100 -0.9%
2017 Otis Report on the Creative Economy of California www.otis.edu/otisreport80 CA

EXHIBIT A-2: CALIFORNIA CREATIVE INDUSTRY EMPLOYMENT, 2010–2015
Avg. Number of Jobs 2010–2015 Change
Creative Industry NAICS Code 2010 2015 Number Percent
Architecture and Interior Design: 35,100 43,200 8,100 23.0%
Architectural Services 54131 21,600 26,200 4,600 21.2%
Landscape Design 54132 5,400 6,500 1,100 20.1%
Drafting Services 54134 800 700 -100 -7.7%
Interior Design 54141 4,300 6,400 2,100 49.4%
Ornamental/Architectural Metal Work Mfg. 332323 3,000 3,300 300 11.0%
Art Galleries: 45392 2,100 2,300 200 11.0%
Communication Arts: 39,400 46,000 6,500 16.6%
Graphic Design 54143 10,100 10,800 700 6.1%
Advertising Agencies 54181 21,900 28,800 6,900 31.7%
Photography Studios, Portrait 541921 6,200 5,100 -1,100 -17.2%
Commercial Photography 541922 1,200 1,300 100 4.6%
Digital Media: 44,700 61,500 16,800 37.7%
Software Publishers 5112 44,700 61,500 16,800 37.7%
Entertainment: 166,400 171,500 5,100 3.1%
Motion Picture/Video Production 51211 107,500 117,200 9,700 9.0%
Motion Picture Distribution 51212 2,300 2,300 0 -0.9%
Post Production Services 51219 11,300 9,600 -1,700 -15.1%
Sound Recording 5122 3,900 3,600 -300 -8.0%
Radio Stations 515112 6,900 6,200 -700 -9.5%
Television Broadcasting 515120 17,100 20,100 3,000 17.4%
Cable Broadcasting 5152 17,200 12,400 -4,800 -27.8%
Fashion: 115,900 119,800 3,900 3.3%
Textile Mills Manufacturing 313 9,000 8,200 -800 -8.8%
Apparel Manufacturing 315 58,700 50,900 -7,800 -13.3%
Apparel Wholesaling 4243 30,500 39,800 9,300 30.2%
Footwear Manufacturing 3162 900 600 -300 -26.6%
Footwear Wholesaling 42434 5,400 6,100 700 13.0%
Women’s Handbag Manufacturing 316992 100 100 0 20.6%
Cosmetics Manufacturing 32562 5,800 7,200 1,400 24.5%
Jewelry Manufacturing 33991 2,600 3,000 400 12.2%
Jewelry Wholesaling 42394 5,700 6,800 1,100 18.9%
Other Specialized Design Services 54149 2,500 3,100 600 24.0%
Furniture and Decorative Arts: 66,800 72,700 5,900 8.9%
Textile Product Mills 314 9,500 8,800 -700 -7.4%
Furniture Manufacturing 337 31,300 34,700 3,400 10.8%
Furniture Wholesaling 4232 16,700 20,000 3,300 19.7%
Electric Lighting Fixtures 33512 6,400 6,900 500 7.1%
China Plumbing Fixtures, China, Earthenware 327111 50 0 -50 ---
Other China, Fine Earthenware and PotteryManufacturing 327112 700 0 -700 ---
Pressed and Blown Glass and Glassware Manufacturing 327212 800 900 100 16.3%
Other Misc. Nonmetallic Mineral Product Mfg. 327999 1,300 1,400 100 6.6%
Industrial Design Services: 54142 2,300 2,200 -100 -0.9%
EXHIBIT A-2: CALIFORNIA CREATIVE INDUSTRY EMPLOYMENT, 2010–2015 CONTINUED
Avg. Number of Jobs 2010–2015 Change
Creative Industry NAICS Code 2010 2015 Number Percent
Publishing and Printing: 121,500 154,200 32,800 27.0%
Printing and Related Support Activities 3231 45,000 41,600 -3,400 -7.5%
Book, Periodical, Newspaper Wholesalers 424920 4,700 3,800 -900 -18.3%
Newspaper Publishers 511110 17,700 13,400 -4,300 -24.1%
Periodical Publishers 511120 10,900 8,900 -2,000 -18.2%
Book Publishers 511130 6,400 5,800 -600 -9.7%
Greeting Card Publishers 511191 60 90 30 51.6%
All Other Publishers 511199 1,100 1,300 200 13.7%
Libraries and Archives 519120 1,900 2,300 400 19.1%
Internet Publishing and Broadcasting 519130 33,800 77,100 43,300 128.3%
Toys: 7,400 7,300 -100 -1.3%
Toy Manufacturing 33993 2,400 2,500 100 3.1%
Toy Wholesaling 42392 5,000 4,800 -200 -3.5%
Visual and Performing Arts Providers: 48,500 55,400 6,900 14.3%
Theater Companies 71111 6,500 7,000 500 7.1%
Dance Companies 71112 900 1,000 100 6.6%
Musical Groups 71113 5,600 5,800 200 3.9%
Other Performing Arts Companies 71119 400 300 -100 -23.8%
Agents & Managers of Artists, etc. 71141 7,100 9,600 2,500 35.1%
Independent Artists, Writers, etc. 71151 16,000 17,200 1,200 7.9%
Museums 71211 9,100 11,400 2,300 24.6%
Musical Instrument Manufacturing 339992 2,800 3,100 300 10.9%
Fine and Performing Arts Schools 61161 9,100 11,500 2,500 27.3%
TOTALS: 659,000 747,600 88,600 13.5%
(Totals and percentages may not add due to rounding)
Source: Bureau of Labor Statistics, QCEW Series; Estimates by LAEDC IAE
2017 Otis Report on the Creative Economy of Californiawww.otis.edu/otisreport 81CA

EX
HIB
IT A
-3:
CR
EA
TIV
E IN
DU
STR
IES
EMP
LOYM
ENT
YEA
R-T
O-Y
EA
R C
OM
PAR
ISO
NS
, 20
10–2
015
Cre
ativ
e In
dust
ry20
1020
1120
1220
1320
1420
1520
1020
1120
1220
1320
1420
15
Arc
hite
ctur
e an
d In
teri
or D
esig
n35
,100
35,2
0036
,700
37,4
0040
,800
43,2
00-9
.5%
0.3%
4.3%
1.9%
9.1%
5.9%
Art
Gal
leri
es2,
100
2,00
02,
200
2,20
02,
200
2,30
0-2
9.8%
-4.8
%10
.0%
0.0%
0.0%
4.5%
Com
mun
icat
ion
Art
s39
,400
41,3
0043
,400
44,
200
44,
900
46,0
00-3
.0%
4.8%
5.1%
1.8%
3.5%
4.1%
Dig
ital
Med
ia4
4,70
047
,300
51,2
0053
,500
55,8
0061
,500
0.9%
5.8%
8.2%
4.5%
9.0%
15.0
%
Ente
rtai
nmen
t16
6,40
016
5,90
016
5,00
016
4,10
016
6,80
017
1,50
01.
0%-0
.3%
-0.5
%-0
.5%
1.1%
4.5%
Fash
ion
115,
900
114,
900
114,
000
120,
000
120,
700
119,
800
-3.3
%-0
.9%
-0.8
%5.
3%5.
9%-0
.2%
Furn
itur
e an
d D
ecor
ativ
e A
rts
66,8
0065
,000
65,8
0068
,600
71,1
0072
,700
-7.0
%-2
.7%
1.2%
4.3%
8.1%
6.0%
Indu
stri
al D
esig
n S
ervi
ces
2,30
02,
300
1,90
02,
100
2,20
02,
200
-2.8
%0.
0%-1
7.4%
10.5
%15
.8%
4.8%
Pub
lishi
ng a
nd P
rint
ing
121,
500
122,
100
125,
200
135,
400
144,
300
154,
200
-5.2
%0.
5%2.
5%8.
1%15
.3%
13.9
%
Toys
7,40
06,
900
7,10
07,
400
7,30
07,
300
-7.2
%-6
.8%
2.9%
4.2%
2.8%
-1.4
%
Vis
ual a
nd P
erfo
rmin
g A
rts
Pro
vide
rs48
,500
51,0
0052
,100
54,1
0055
,500
55,4
00-0
.8%
5.2%
2.2%
3.8%
6.5%
2.4%
Fine
and
Per
form
ing
Art
s S
choo
ls9,
100
9,60
09,
900
10,4
0011
,100
11,5
002.
9%5.
5%3.
1%5.
1%12
.1%
10.6
%
TOTA
L65
9,00
066
3,50
067
4,50
069
9,40
072
2,70
074
7,60
0-3
.0%
0.7%
1.7%
3.7%
7.1%
6.9%
(Tot
als
may
not
add
due
to ro
undi
ng)
Sour
ce: B
urea
u of
Lab
or S
tatis
tics,
QC
EW
2017 Otis Report on the Creative Economy of California www.otis.edu/otisreport82 CA

EXHIBIT A-4: CALIFORNIA EMPLOYMENT BY CREATIVE OCCUPATION, 2015
Occupational TitleSOC
Code2015
Employment
Projected Openings
Over 5 Years
Location Quotient
Education Needed
for Entry Level
Work Experience Needed for Entry Level
On-the-Job Training to
Attain Competency
2015 Median Wage ($)
Management Occupations Advertising and Promotions Managers 11-2011 3,950 1,050 1.20 3 < 5 years None 97,510
Marketing Managers 11-2021 32,800 6,550 1.51 3 ≥ 5 years None 153,000
Public Relations and Fundraising Managers 11-2031 6,660 12,000 0.98 3 ≥ 5 years None 117,260
Business and Financial Operations Occupations
Agents and Business Managers of Artists, Performers, and Athletes 13-1011 4,910 1,350 3.30 3 < 5 years None 74,090
Computer and Mathematical Occupations:
Software Developers, Applications 15-1132 123,950 20,100 1.48 3 None None 123,900
Software Developers, System Software 15-1133 82,370 14,600 1.88 3 None None 126,560
Architecture and Engineering Occupations
Architects, Except Landscape and Naval 17-1011 12,070 2,400 1.15 --- --- --- 88,030
Landscape Architects 17-1012 3,340 600 1.50 3 None I/R 72,140
Architectural and Civil Drafters 17-3011 13,650 800 1.27 4 None None 56,630
Education, Training, and Library Occupations
Architecture Teachers, Postsecondary 25-1031 510 26 ** --- --- --- 81,190
Anthropology and Archeology Teachers, Postsecondary 25-1061 530 27 0.79 1 None None 95,090
Area, Ethnic, and Cultural Studies Teachers, Postsecondary 25-1062 700 35 0.67 1 None None 82,190
Library Science Teachers, Postsecondary 25-1082 300 15 0.54 --- --- --- 100,040
Art, Drama, and Music Teachers, Postsecondary 25-1121 14,600 1,950 1.32 2 None None 80,590
Communications Teachers, Postsecondary 25-1122 3,110 400 0.95 1 None None 83,320
English Language and Literature Teachers, Postsecondary 25-1123 7,750 950 0.91 1 None None 82,990
Foreign Language and Literature Teachers, Postsecondary 25-1124 3,620 600 1.07 1 None None 76,480
History Teachers, Postsecondary 25-1125 1,650 250 0.62 1 None None 88,350
Archivists 25-4011 520 26 0.84 2 None None 48,070
Curators 25-4012 1,050 200 0.79 2 None None 64,780
Museum Technicians and Conservators 25-4013 1,400 250 1.16 3 None None 44,730
Librarians 25-4021 9,540 1,550 0.65 2 None None 70,960
Library Technicians 25-4031 9,820 3,200 0.93 5 None None 41,870
Audio-Visual and Multimedia Collections Specialists 25-9011 1,860 50 1.62 3 < 5 years None 42,080
ENTRY LEVEL EDUCATION: WORK EXPERIENCE CODES:1 – Doctoral or professional degree ≥ 5 years – 5 years’ or more experience in a related occupation 2 – Master’s degree < 5 years – Less than 5 years’ experience in a related occupation or field is common 3 – Bachelor’s degree None – No work experience is typically required 4 – Associate’s degree5 – Postsecondary non-degree award On-the-Job Training:6 – Some college, no degree I/R – Internship/residency MT OJT – Moderate-term on-the-job training7 – High school diploma or equivalent APP – Apprenticeship ST OJT – Short-term on-the-job training8 – Less than high school LT OJT – Long-term on-the-job training
2017 Otis Report on the Creative Economy of Californiawww.otis.edu/otisreport 83CA

EXHIBIT A-4: CALIFORNIA EMPLOYMENT BY CREATIVE OCCUPATION, 2015, CONTINUED
Occupational Title SOC Code2015
Employment
Projected Openings
Over 5 Years
Location Quotient
Education Needed
for Entry Level
Work Experience Needed for Entry Level
On-the-Job Training to
Attain Competency
2015 Median
Wage ($)
Arts, Design, Entertainment, Sports, and Media Occupations
Art Directors 27-1011 6,270 2,150 1.61 3 ≥ 5 years None 110,410
Craft Artists 27-1012 370 200 0.63 7 None LT OJT 42,900
Fine Artists, Including Painters, Sculptors, and Illustrators 27-1013 3,100 1,200 2.25 7 None LT OJT 61,100
Multimedia Artists and Animators 27-1014 10,110 4,050 2.97 3 None MT OJT 80,400
Artists and Related Workers, All Other 27-1019 720 40 ** 7 None LT OJT 58,700
Commercial and Industrial Designers 27-1021 4,110 850 1.17 3 None None 69,420
Fashion Designers 27-1022 6,180 1,500 2.89 3 None None 65,060
Floral Designers 27-1023 3,230 550 0.65 7 None MT OJT 29,730
Graphic Designers 27-1024 28,940 6,700 1.26 3 None None 54,070
Interior Designers 27-1025 6,770 1,650 1.18 3 None None 64,410
Merchandise Displayers and Window Trimmers 27-1026 10,050 1,900 0.89 7 None MT OJT 27,660
Set and Exhibit Designers 27-1027 2,910 600 2.17 3 None None 49,140
Designers, All Other 27-1029 1,530 350 2.07 3 None None 67,480
Actors 27-2011 17,090 7,500 3.01 --- --- --- **
Producers and Directors 27-2012 25,510 6,350 2.17 3 < 5 years None 89,900
Dancers 27-2031 1,470 450 1.30 7 None LT OJT **
Choreographers 27-2032 570 600 1.00 7 ≥ 5 years LT OJT **
Music Directors and Composers 27-2041 2,650 750 1.10 3 < 5 years None 55,670
Musicians and Singers 27-2042 6,380 2,150 1.53 7 None LT OJT **
Radio and Television Announcers 27-3011 3,060 400 0.90 3 None None 42,200
Public Address System and Other Announcers 27-3012 880 300 0.98 7 None ST OJT 27,280
Broadcast News Analysts 27-3021 530 29 1.00 3 None None 55,800
Reporters and Correspondents 27-3022 3,630 1,050 0.79 3 None None 39,390
Public Relations Specialists 27-3031 22,820 3,050 0.93 3 None None 65,180
Editors 27-3041 9,920 2,200 0.91 3 < 5 years None 63,320
Technical Writers 27-3042 7,300 1,800 1.31 3 < 5 years None 85,800
Writers and Authors 27-3043 7,890 3,350 1.62 3 None MT OJT 71,750
Media and Communication Workers, All Other 27-3099 8,870 1,750 3.55 7 None ST OJT 45,770
Audio and Video Equipment Technicians 27-4011 13,060 1,800 1.86 5 None ST OJT 47,670
Broadcast Technicians 27-4012 3,950 550 1.24 4 None ST OJT 51,470
Sound Engineering Technicians 27-4014 4,260 500 2.74 5 None ST OJT 61,770
Photographers 27-4021 6,360 900 1.13 7 None LT OJT 39,140
Camera Operators, Television, Video, and Motion Picture 27-4031 5,110 350 2.27 3 None None 59,500
Film and Video Editors 27-4032 11,250 800 3.62 3 None None 88,170
Media and Communication Equipment Workers, All Other 27-4099 6,900 600 3.47 7 None ST OJT 74,050
2017 Otis Report on the Creative Economy of California www.otis.edu/otisreport84 CA

EXHIBIT A-4: CALIFORNIA EMPLOYMENT BY CREATIVE OCCUPATION, 2015, CONTINUED
Occupational TitleSOC
Code2015
Employment
Projected Openings
Over 5 Years
Location Quotient
Education Needed
for Entry Level
Work Experience
Needed for Entry
Level
On-the-Job Training to
Attain Competency
2015 Median Wage ($)
Personal Care and Service Occupations
Motion Picture Projectionists 39-3021 490 78 0.78 8 None ST OJT 22,870
Costume Attendants 39-3092 1,800 500 2.61 7 None ST OJT 49,820
Makeup Artists, Theatrical and Performance 39-5091 1,160 100 3.38 5 None None 76,590
Sales and Related Occupations
Advertising Sales Agents 41-3011 18,520 3,250 1.10 7 None MT OJT 59,010
Office and Administrative Support Occupations
Library Assistants, Clerical 43-4121 9,600 2,700 0.85 7 None ST OJT 28,840
Desktop Publishers 43-9031 1,520 100 1.02 4 None ST OJT 45,590
Installation, Maintenance, and Repair Occupations
Electronic Home Entertainment Equipment Installers and Repairers
49-2097 2,310 450 0.76 5 None None 40,080
Camera and Photographic Equipment Repairers
49-9061 650 46 1.64 --- --- --- 40,300
Musical Instrument Repairers and Tuners 49-9063 540 38 0.62 7 None APP 36,530
Watch Repairers 49-9064 240 17 0.96 --- --- --- 36,390
Production Occupations
Sewers, Hand 51-6051 1,340 200 1.73 8 None MT OJT 22,740
Tailors, Dressmakers, and Custom Sewers 51-6052 2,140 400 0.95 8 None MT OJT 29,200
Fabric and Apparel Patternmakers 51-6092 1,680 150 2.91 7 None MT OJT 48,860
Cabinetmakers and Bench Carpenters 51-7011 9,650 350 0.92 7 None MT OJT 31,950
Jewelers and Precious Stone and Metal Workers 51-9071 2,870 400 1.01 7 None LT OJT 34,080
Painting, Coating, and Decorating Workers 51-9123 1,390 200 0.77 8 None MT OJT 28,300
Photographic Process Workers and Processing Machine Operators
51-9151 3,160 700 1.17 7 None ST OJT 29,120
Etchers and Engravers 51-9194 810 12 0.76 7 None MT OJT 33,690
TOTALS 654,300 137,600
**Indicates data was unavailableColumns may not add due to roundingSource: Bureau of Labor Statistics, Occupational Employment Statistics: California EDD; Estimates by LAEDC IAE
ENTRY LEVEL EDUCATION: WORK EXPERIENCE CODES:1 – Doctoral or professional degree ≥ 5 years – 5 years’ or more experience in a related occupation 2 – Master’s degree < 5 years – Less than 5 years’ experience in a related occupation or field is common 3 – Bachelor’s degree None – No work experience is typically required 4 – Associate’s degree5 – Postsecondary non-degree award On-the-Job Training:6 – Some college, no degree I/R – Internship/residency MT OJT – Moderate-term on-the-job training7 – High school diploma or equivalent APP – Apprenticeship ST OJT – Short-term on-the-job training8 – Less than high school LT OJT – Long-term on-the-job training
2017 Otis Report on the Creative Economy of Californiawww.otis.edu/otisreport 85CA

EXHIBIT A-5: CALIFORNIA K–12 CREATIVE COURSE BY SUBJECT AREA
Agriculture and Natural ResourcesFloriculture and floral designIntroduction to ornamental horticultureLandscape design
ArtAdvertising designAP Art historyAP Studio art: drawingAP Studio art: three dimensionalAP Studio art: two dimensionalArt appreciation (elementary school)Art appreciation (secondary school)Art historyCeramics (beginning and advanced)Cinematography/artistic videos (beginning)CraftsDesignDigital art/Computer artDrawingFashion designFibers and textilesFundamentals of art (elementary school)Fundamental of art (secondary school)IB Visual artsJewelryLettering/CalligraphyMulticultural art/Folk artMYP (IB) Visual artsOther art coursePaintingPhotography (beginning or advanced)PrintmakingSculpture
Arts, Media, and EntertainmentAdvanced cinema/Film/Video productionAdvanced dance/ChoreographyAdvanced game designAdvanced graphic communicationsAdvanced professional musicAdvanced theater performanceArts managementBroadcast productionBroadcasting technologyCommercial artCommercial photographyFilm makingFilm/Cinema/Video productionGame designIntermediate animationIntermediate dance performanceIntermediate game designIntermediate graphic technologyIntermediate musical performanceIntermediate state technologyIntermediate theater performanceInternet publishingIntro to animationIntro to multimedia productionIntro to professional musicIntro to professional theaterIntro to graphic artsIntro to media artsIntro to stage technology
Other arts, media, and entertainmentPhotographic laboratory and darkroomPhotography production and technologyRadio production Stage design and productionStage productionTelevision productionThree-dimensional designTwo-dimensional designVisual art and related careers
Building and Construction TradesCabinet makingFurniture makingIntroduction to woodworking principlesMillwork and cabinet manufacturing
Computer EducationMYP (IB) Design technologyWeb design
DanceAdvanced dance studyBallet, modern, jazz, world danceDance choreography and productionDance, movement and rhythmic fund. (elementary)Dance, movement and rhythmic fund. (secondary)Folk/Traditional danceOther dance course
Drama/TheaterAdvanced theaterHistory/appreciation of theater artIB TheaterMedia/Film/Video/Television productMYP (IB) DramaOther drama/theater courseTechnical theater/StagecraftTheater/Creative dramatics (elementary)Theater/Creative dramatics (secondary)
Engineering and ArchitectureArchitectural and structural engineeringComputer-aided drafting/DesignEngineering design level 2Engineering technology level 2Environmental engineering level 2Principles of designPrinciples of engineering designPrinciples of engineering technologyPrinciples of environmental and natural resourcesTechnical drafting
English Language ArtsAdvanced compositionCompositionJournalism
Fashion and Interior DesignApparel design and constructionApparel manufacturing, productionEnvironmental designFashion and textile designFashion merchandisingFashion, textiles and apparelHousing and furnishingsInterior design, furnishings
Information and Communication Technologies3D Media and constructionComputer graphics and media technologyComputer programming and game designGame design and developmentGraphic communicationsMultimedia and animation
Manufacturing and Product DevelopmentAdvanced/Specialized graphic productionsAdvanced/Specialized product designDrafting/Computer aided DesignExploring manufacturing and designGraphic production technologiesJewelry design, fabricationPrinciples of manufacturing and designProduct developmentSilk screen making and printing
MusicAP Music theoryBankChorus/Choir/Vocal ensembleComposition/SongwritingComputers and electronics/Digital musicGeneral/Exploratory/Introduction to MusicIB MusicInstrumental ensembleInstrumental music lessons (elementary school)Instrumental music lessons (secondary school)Music appreciation/history/literatureMusic theoryMusical theater
Orchestra/SymphonyOther music courseVoice class
AP = Advanced PlacementIB = International BaccalaureateMYP = IB Middle Years Program
Source: California Department of Education
2017 Otis Report on the Creative Economy of California www.otis.edu/otisreport86 CA
2017 Otis Report on the Creative Economy of Californiawww.otis.edu/otisreport 87CA
EXHIBIT A-5: CALIFORNIA K–12 CREATIVE COURSE BY SUBJECT AREA
Agriculture and Natural ResourcesFloriculture and floral designIntroduction to ornamental horticultureLandscape design
ArtAdvertising designAP Art historyAP Studio art: drawingAP Studio art: three dimensionalAP Studio art: two dimensionalArt appreciation (elementary school)Art appreciation (secondary school)Art historyCeramics (beginning and advanced)Cinematography/artistic videos (beginning)CraftsDesignDigital art/Computer artDrawingFashion designFibers and textilesFundamentals of art (elementary school)Fundamental of art (secondary school)IB Visual artsJewelryLettering/CalligraphyMulticultural art/Folk artMYP (IB) Visual artsOther art coursePaintingPhotography (beginning or advanced)PrintmakingSculpture
Arts, Media, and EntertainmentAdvanced cinema/Film/Video productionAdvanced dance/ChoreographyAdvanced game designAdvanced graphic communicationsAdvanced professional musicAdvanced theater performanceArts managementBroadcast productionBroadcasting technologyCommercial artCommercial photographyFilm makingFilm/Cinema/Video productionGame designIntermediate animationIntermediate dance performanceIntermediate game designIntermediate graphic technologyIntermediate musical performanceIntermediate state technologyIntermediate theater performanceInternet publishingIntro to animationIntro to multimedia productionIntro to professional musicIntro to professional theaterIntro to graphic artsIntro to media artsIntro to stage technology
Other arts, media, and entertainmentPhotographic laboratory and darkroomPhotography production and technologyRadio production Stage design and productionStage productionTelevision productionThree-dimensional designTwo-dimensional designVisual art and related careers
Building and Construction TradesCabinet makingFurniture makingIntroduction to woodworking principlesMillwork and cabinet manufacturing
Computer EducationMYP (IB) Design technologyWeb design
DanceAdvanced dance studyBallet, modern, jazz, world danceDance choreography and productionDance, movement and rhythmic fund. (elementary)Dance, movement and rhythmic fund. (secondary)Folk/Traditional danceOther dance course
Drama/TheaterAdvanced theaterHistory/appreciation of theater artIB TheaterMedia/Film/Video/Television productMYP (IB) DramaOther drama/theater courseTechnical theater/StagecraftTheater/Creative dramatics (elementary)Theater/Creative dramatics (secondary)
Engineering and ArchitectureArchitectural and structural engineeringComputer-aided drafting/DesignEngineering design level 2Engineering technology level 2Environmental engineering level 2Principles of designPrinciples of engineering designPrinciples of engineering technologyPrinciples of environmental and natural resourcesTechnical drafting
English Language ArtsAdvanced compositionCompositionJournalism
Fashion and Interior DesignApparel design and constructionApparel manufacturing, productionEnvironmental designFashion and textile designFashion merchandisingFashion, textiles and apparelHousing and furnishingsInterior design, furnishings
Information and Communication Technologies3D Media and constructionComputer graphics and media technologyComputer programming and game designGame design and developmentGraphic communicationsMultimedia and animation
Manufacturing and Product DevelopmentAdvanced/Specialized graphic productionsAdvanced/Specialized product designDrafting/Computer aided DesignExploring manufacturing and designGraphic production technologiesJewelry design, fabricationPrinciples of manufacturing and designProduct developmentSilk screen making and printing
MusicAP Music theoryBankChorus/Choir/Vocal ensembleComposition/SongwritingComputers and electronics/Digital musicGeneral/Exploratory/Introduction to MusicIB MusicInstrumental ensembleInstrumental music lessons (elementary school)Instrumental music lessons (secondary school)Music appreciation/history/literatureMusic theoryMusical theater
Orchestra/SymphonyOther music courseVoice class
AP = Advanced PlacementIB = International BaccalaureateMYP = IB Middle Years Program
Source: California Department of Education
AFFORDABLE ARTIST HOUSING Retaining and supporting California artists and creative workers
TERI DEAVERVice PresidentConsulting and Strategic PartnershipsArtspace Projects
Funding for this white paper provided by
ADDENDUM

2017 Otis Report on the Creative Economy of California www.otis.edu/otisreport88 CA
TABLE OF CONTENTS
Introduction 89
Answers to Fundamental Questions 92 Who is an artist or creative? What is affordable artist housing? Why is it important to California? 94
Elements of a Successful Affordable Artist Housing Project 96 Affordability and sustainability Appropriate space, amenities, and management 97 Meeting community and stakeholder objectives 98
Artist Retention Strategies and Innovations 99
Conclusion 103
Case Studies 104
2017 Otis Report on the Creative Economy of Californiawww.otis.edu/otisreport 89CA
INTRODUCTION
“Without the creation and retention of affordable housing and live/work space for the creative sector, California businesses that rely on a steady pool of artistic and creative talent will suffer the loss. Educational institutions that seek to train the next generation of California creatives will watch graduates leave and invest their talents elsewhere. Every city, town, and business that relies on the output and impact of the creative economy and access to a healthy creative workforce should be concerned about the availability of affordable and appropriate space to incubate emerging talent and retain a competitive pool of creative workers.”
California’s creative industries are an economic powerhouse and a source of brand identity for many cities, towns, and neighborhoods throughout the state. Yet, the individuals who participate directly as artists, creatives, makers, cultural practitioners, and educators, no matter how different their work or background, have in common the need for affordable and appropriate space for their creative practice. For many, it is a lifetime struggle to balance an unpredictable and varied income stream with the ever-rising cost of creative work space and housing. For others, it is the critical but short-term affordable space opportunities that provide needed stability to launch and advance a successful entrepreneurial creative enterprise or creative workforce-based career. Many artists and creatives and their families have household incomes that qualify them for publicly funded affordable housing.1 These artists that make up the creative industries both reflect the deep diversity of California and a cross-section of the Low-Income Housing Tax Credit Allocation Committee’s affordable housing target populations (families, seniors, veterans, etc.). Many are workforce professionals with significant trade-specific training or bachelor’s and/or graduate degrees but find that income is often not commensurate with education. Seen as an unwelcome precursor to gentrification, or simply a low-priority workforce population in the face of extremely limited housing resources, artists and creatives too often have few housing options. Adding to the challenge, many are doubly encumbered by a need for both live and work space. Across California, artists are repeatedly left out of local and state strategies to ensure affordable, appropriate, and safe housing, even though they are at the foundation of California’s creative industries and its economy.
This issue of affordable live and work space availability is particularly relevant to California’s urban core and first-ring communities. In these areas, artists and creative workers increasingly face residential and workspace displacement amid what is

2017 Otis Report on the Creative Economy of California www.otis.edu/otisreport90 CA
“The elements of a successful artist housing project are determined in part by the needs and goals that lead to its creation. In California, the overarching goals are to address the low inventory of affordable housing options, support the existing creative workforce, and ensure a pipeline of creative workers and innovators into the future.”
a widely recognized affordable housing crisis. The San Francisco Bay Area and Los Angeles and Orange Counties, while centerpieces of the creative industry ecosystem, have some of the highest real estate costs in the country. These expenses leave many artists and creatives (along with the rest of the workforce) cost burdened and evicted in the wake of new development, consequently seeking alternate locations to live, work, practice, and produce. Sometimes the alternative is illegal housing, which can have deadly consequences as with the 2016 Ghost Ship fire in Oakland; sometimes it is flight from their home cities, or from the state entirely.
The San Francisco Arts Commission conducted a survey in 2015 and found that 72% of a total 579 surveyed creatives had or were facing housing and/or workspace displacement2; 39% reported their workspace lease had not or would not be renewed; 32% reported their home lease had not or would not be renewed; and, 21% confirmed a rent increase would accompany a home lease renewal that was being offered. Many stated that they had already or would be pursuing in the future the option of relocating from the Bay Area and the state of California.
Similarly, a 2016 space needs study conducted by the city of San Jose to quantify demand for new live/work space found that 69% of 231 non-homeowner artist respondents were concerned about housing displacement with 76% (120) of those concerned pointing to the burden of cost of as an underlying factor for their future displacement concerns. Further, 31% of the total 368 respondents revealed they had been displaced from housing one or more times.
Suburban and rural communities are not exempt from affordable space struggles. These communities often lack the infrastructure necessary to support artists and creatives and the decreased cost of living does not always compensate for reduced productivity and fewer opportunities. In California specifically, rural communities and small towns with strong tourism-based economies and high quality of life indicators around arts and culture can also have low vacancy rates and surprisingly high real estate costs.3
Adding to the issues of high rents, low inventory, and displacement, recent events have brought safety issues to the forefront. In response to the tragic Ghost Ship fire in Oakland, fire and safety officials across the state and country have intensified enforcement of building code violations of all degrees. Common among violations is unlawful building occupation, such as using commercial buildings as a dwelling space. This effort to prevent similar tragedies has led to a spate of evictions of artists in “do-it-yourself” buildings and non-compliant housing situations. While artists may have an understanding with building owners to live in their non-residentially zoned
or non-compliant live/work spaces, residential tenant rights do not extend to them. In California, as in other states, artists have been ordered to immediately vacate the most precarious buildings. In less extreme examples, they receive 30-day eviction notices from commercial buildings doubling in an unofficial capacity as live/work and work/live spaces. Either way, these situations offer little or no time for renters to gather belongings or find alternative housing. Landlord relocation assistance is not an option and they are not guaranteed a right of first refusal to return if or when code violations are rectified. These artists and creatives are at high risk of homelessness, and with few alternative affordable options, are likely to exit California’s highest-cost creative industry centers.
For the past several years, the Otis Report on the Creative Economy has provided compelling data to support the conviction that “given the large economic contribution of the creative industries to California’s economy, it is important to ask how stakeholders can nurture, support and grow the creative economy” and that a purpose of the report is “to develop strategies for attracting and retaining creative talent.”4 Yet with few exceptions, there is a persistent statewide and local lack of systems in place for the creation, retention, and protection of permanently affordable housing and creative work space – which are so fundamental to achieving these goals.
The intent of this paper is to help close this gap. The common language, references, and project models outlined are included as a jumping off point for those developing innovative public and private solutions to solve a severe deficiency in affordable housing and workspace options for creative workers across the state.
1Artspace Projects, Inc., has conducted over 40 project-specific artist space needs surveys nationally. In each survey, 30%–70% of the artists expressing interest in affordable live/work space reported incomes that were at or below 60% of the area median income (AMI) for their geographic area. Recent studies in Los Angeles (2012) and Santa Rosa, CA (2016), revealed that 59% and 67% of responding artist households, respectively, qualified for affordable housing per their reported annual income.
2The San Francisco Arts Commission public report of findings can be found at http://ww2.kqed.org/arts/wp-content/uploads/sites/2/2015/09/Individual-Artists-Space-Need-Analysis_FINAL.pdf
3Example communities in California that have attracted artists and experience a relative high cost of living include Ojai, Nevada City, Mendocino, and Sebastopol. These and similar profile towns and hamlets around the state rely heavily on the creative sector and would benefit from infrastructure that supports long-term affordability and artist retention.
4
2015 Otis Report on the Creative Economy of California
2017 Otis Report on the Creative Economy of Californiawww.otis.edu/otisreport 91CA

2017 Otis Report on the Creative Economy of California www.otis.edu/otisreport92 CA
ANSWERS TO FUNDAMENTAL QUESTIONS
WHO IS AN ARTIST OR CREATIVE?
When local municipalities adopt housing, revitalization, and economic development strategies targeting the arts and creative industries, they often focus on visual and performing artists. By the virtue of their craft these artists are called upon to help activate public and private space and drive tourism.5 Some strategies embrace technology-oriented creatives like video game developers, postproduction firms, graphic designers, and product developers to pave the way for creative business attraction and growth. Others place greater value on the culture bearers and practitioners, educators, and arts nonprofit workers who can be essential to proliferating equitable social practices and retaining a community’s authentic identity. Their creative work is often in the form of art and cultural interventions in underserved communities, such as a community mural projects with at-risk youth, effort that is less commercially visible, but widely and sustainably impactful.
Artists and creatives of all disciplines play a different but equally significant role in the creative industry ecosystem. For all their differences, each share a need for housing and space in which to work. It is for this reason Artspace, a national nonprofit developer and owner of artist and creative industry worker-occupied projects, defines artists and creatives as broadly as possible in order to serve them equally:
• A person who works in, or is skilled in any of the fine arts, including but not limited to painting, drawing, sculpture, book arts, printmaking, and mixed media
• A person who creates imaginative works of aesthetic value, including but not limited to literature, poetry, photography, music composition, choreography, architecture, film, and video
• A person who creates functional art including but not limited to metal, textiles, paper, wood, ceramic, glass, or plastic objects
• A performer or theatrical artist, including but not limited to singers, dancers, musicians, actors, performance artists, and costume, lighting, sound, and set designers
• In all arts disciplines a designer, technician, craftsperson, teacher, or administrator who is dedicated to using their expertise within the community [the community within the project and/or broader] to support, promote, present, and/or teach and propagate their art form through events, activities, performances, and classes.

2017 Otis Report on the Creative Economy of Californiawww.otis.edu/otisreport 93CA
Artist housing projects and policy in California and across the country have extensively borrowed this definition, due to its inclusivity. When using this definition in the context of housing and live/work space, inevitable questions follow:
How are artists selected for space when demand for affordable space is high? Is artwork juried? Is demonstrating income from art critical to consider? Are units designed for specific art disciplines? Does that become a factor in selection?
Depending on the goals for a specific project, developers, city planners, and economic development staff likely have different answers to these questions. However, the intensity of California’s affordable housing crisis suggests a rejection of efforts to prioritize one type of artist or creative over another, at least in the absence of a clear market-driven concept (such as senior artist housing, or discipline-specific housing, akin to the housing Actors Fund creates in entertainment-dominant cities like New York and Los Angeles, for professionals in the performing arts and entertainment industry).
One consistent criterion, regardless of market objective, is the deep need for distinct, safe, and affordable space. Creating affordable artist housing communities that do not discriminate based on discipline or quality of work is an effective and equitable way to address this need and to benefit the greatest number of artists and creatives. It also supports the prevalent multi-genre artists whose work is evolving and defying both commercialization and categorization. In other words, those artists who may have a very difficult time paying for market rate space, but whose work may change the field in the future. Introducing safe affordable spaces where artists and creatives of all ages, ethnicities, gender identifications, life experiences, creative practices, and career stages can live and work together, also fosters multi-genre collaborations and opportunities for professional growth and developing new skills through mentorships, and for sharing expertise, networks, tools, and equipment. In this respect, affordable artist housing not only offers financial stability to artists and their families, but acts as an informal incubator and career accelerator.
In the Artspace model of residentially zoned, affordable live/work facilities, artists are asked to self-identify as an artist and to demonstrate a need for space and a commitment to their work or practice and to the community in which they will reside. Spaces are uniformly flexible to be easily adapted to various art forms. Free shared flexible spaces for practice, collaboration, exhibition/presentation, and public interaction are integrated into the projects. Work is not juried and income from art is unnecessary. In Artspace’s national artist surveys, only a small percentage of artists earn 100% of their income from their art or creative work.6 The Artspace model seeks to serve many, recognizes fluctuations in income from creative work, honors the challenge of comparing the integrity of work across disciplines, and results in highly diverse and dynamic communities. For this reason, Artspace’s selection process has often been replicated in full or in part by others offering affordable artist housing and live/work space.

2017 Otis Report on the Creative Economy of California www.otis.edu/otisreport94 CA
WHAT IS AFFORDABLE ARTIST HOUSING? WHY IS IT IMPORTANT TO CALIFORNIA?
Artists and creatives commonly have difficulty securing and thriving in traditional affordable housing projects or relatively affordable, but market driven, residential apartments. In the case of publicly funded affordable housing, property managers must “income certify” potential tenants by annualizing reported income and comparing to federal income limits. This protocol presents a large obstacle for self-employed and short-term employed workers because their income is not uniformly received and annualizing periodic or occasional salaried payments can overstate income and leave many in the entertainment workforce, for example, unable to qualify. For standard market leases or to qualify for a home mortgage, these artists face similar difficulty demonstrating a reliable source of income. Once housing is secured, artists and creatives may find their creative work restricted by the building’s design, or rules prohibiting music practice or use of art materials in units and common areas. Artists and creatives must then seek additional commercial rental space where they can create and collaborate if they are to continue to pursue their creative work.
Successful affordable artist housing seeks to equalize the experience of the low- to moderate-income creative worker with the non-artist.7 The goal is to provide safe, appropriate space that is conducive to living and working. This is achieved through design, arts-friendly common area spaces and amenities, and rules that cater to an artist’s or creative’s family and workspace needs. It also aims to elevate the experience of housing by fostering the artist’s and creative’s professional advancement through the benefits of co-location. Artists and creatives often express frustration over a lack of centralized areas for collaborating and networking. The concept of an “open-office,” “co-working space,” or “multi-tenant nonprofit center” is not unlike the concept of artist housing: a place where inspiration, materials, contacts, and resources are more easily shared, leading to artistic, economic, and professional growth.8 The combination of an artist residential community plus spaces for displaying, exhibiting, and performing can create a critical mass that raises the visibility and credibility of an individual’s art or creative product.
Without the creation and retention of affordable housing and live/work space for the creative sector, California’s unique culture and businesses, which rely on a steady pool of artistic and creative talent, will suffer. Educational institutions that seek to train the next generation of California creatives will watch graduates leave and invest their talents elsewhere. Every city, town, and business that relies on the output and impact of the creative economy and access to a healthy creative workforce should be concerned about the availability of affordable and appropriate space to incubate emerging talent and retain a competitive pool of creative workers.
2017 Otis Report on the Creative Economy of Californiawww.otis.edu/otisreport 95CA
There are a variety of successful artist housing typologies in California. No one model is appropriate for all situations. Some are new construction and others adaptive reuse. Some are urban infill and others sprawling campuses. Some use affordable housing resources to ensure affordability while others are funded with private investment and offer a variety of price points for creatives of all income levels. Some are mixed-use and some are housing or live/work only. The suitability and viability of each is relative to available funding sources; geography; the built environment and zoning of the area; need of local creatives; real estate costs; and civic and private industry stakeholder goals for the development. Successful typology examples in California include the following:
• Live/work: space that is residentially zoned and offers flexibility for creative work through open space design and durable surfaces
• Housing-only: standard dwelling units with an abundance of shared spaces that support arts activity
• Work/live: space that prioritizes work space over residential space and is most common in industrially zoned areas with a work/live ordinance
• Housing above commercial: common in business or commercial districts
• Co-housing: dormitory or communal style living spaces with common kitchens and other shared creative space amenities
5 Collectively this strategy of changing the physical and social character of a place through art intervention is referred to as Creative Placemaking. For more information consult the 2010 Creative Placemaking white paper authored by Ann Markusen, Markusen Economic Research Services and Anne Gadwa, Metris Arts Consulting, https://www.arts.gov/sites/default/files/CreativePlacemaking-Paper.pdf
6Recent studies in Los Angeles (2012) and Santa Rosa, CA (2016), revealed that 28% and 54% of responding artists, respectively, made 10% or less of their income from their art/creative work. Most artists supplement their income with other sources.
7Low to moderate income households earn 80% or below the AMI are frequently cost burdened (spending more than one-third of their income on housing) and often qualify per their income for affordable housing and homeownership opportunities.
8 A 2011 study “How Art Spaces Matter” commissioned by Artspace and conducted by Metris Arts Consulting documented the benefits of affordable artist space on artists and communities through a series of identified and tested metrics. The full report is available at Artspace.org.

2017 Otis Report on the Creative Economy of California www.otis.edu/otisreport96 CA
ELEMENTS OF A SUCCESSFUL AFFORDABLE ARTIST HOUSING PROJECT
The elements of a successful artist housing project are determined in part by the needs and goals that lead to its creation. In California, the overarching goals are to address the low inventory of affordable housing options, support the existing creative workforce, and ensure a pipeline of creative workers and innovators into the future. In the context of these goals, these three elements will promote long-term viability and return on investment:
• A permanent commitment to affordability and financial self-sustainability of the housing model
• Spaces designed with amenities and management practices that are appropriate for the needs of the artists and creatives
• Alignment with community stakeholder objectives, which may extend beyond affordable and usable space for the creative community and may form the basis for additional funding and support
The following are best practices for ensuring that new artist housing projects and initiatives are poised for success in the face of an aggressive real estate market and limited public capital resources.
AFFORDABILITY AND SUSTAINABILITY
a. Substantiate a developer’s commitment to permanent affordability and financial sustainability through
• Real estate deals that involve low-cost acquisition or long-term land leases. Successful and replicable models for new projects and preservation of existing artist-occupied buildings often involve public/private partnerships in which publicly held real estate is committed for the project at a below market rate in return for public benefit. Other strategies include land swaps, long-term inclusionary housing requirements, and nonprofit community land trust property being dedicated to a project through a long-term low cost lease.
2017 Otis Report on the Creative Economy of Californiawww.otis.edu/otisreport 97CA
• Committed philanthropic and other socially directed funding sources that minimize debt. This is third-party funding that supports community benefit over financial return, including CDFI (Community Development Financial Institution) program funds, impact investing, private grants, donor gifts, and public subsidy.
• Commitment to fifty or more years of affordability in funding regulatory agreements.
• An ownership structure that gives a mission-based nonprofit organization, a social enterprise, or public entity a meaningful ownership position in the project and a feasible right-of-first refusal.
• A cooperative structure that gives resident artists and creatives an equity stake in their space and a right-of-first refusal after debt retirement. This should be coupled with technical assistance and financial training to help the cooperative attain their goal of sole ownership.
• A mixed-use and/or mixed-income project model that maximizes commercial and market rate housing operating income in order to subsidize affordable artist-occupied spaces within the project.
• A commitment to green/sustainable design, which can result in lower operating costs over the long-term.
• Deed restrictions that ensure long-term affordability and perpetual use as a creative space facility even in the event of a sale.
APPROPRIATE SPACE, AMENITIES, AND MANAGEMENT
b. Substantiate appropriateness of space and management protocols by
• Engaging artists and creatives early in the design and development process through qualitative and quantitative data collection and in an ongoing advisory capacity.
• Designing live/work and work-only space flexibly so that it may be adapted to a variety of creative practices and family needs.
• Empowering the residents with self-management responsibilities.
• Including a program line item in the operating budget that may be used for events, marketing, and professional advancement workshops.
• Incorporating shared creative spaces that offer public access for tenant-sponsored events.
• Incorporating space for retail sales and creative commercial activity if commercial uses are not allowed in dwelling units.
• Using layman terminology to clarify zoning and permitted uses in work/live and nonresidential leases, so that creatives are fully informed of restrictions and obligations before signing.
• Offering pre-leasing information sessions to educate applicants about income restrictions and income certification protocols in publicly subsidized projects.

2017 Otis Report on the Creative Economy of California www.otis.edu/otisreport98 CA
• Ensuring management is trained in artist selection and income certification protocols, if relevant to the type of project financing used.
• Adhering to all fire and safety codes.
“FUNDAMENTAL LIVE/WORK DESIGN STANDARDS” ADAPTED FROM ARTSPACE High ceilings (10 ft. standard)
Open floor plans
Movable walls to open bedroom into larger space
Large storage closets and lofted storage space
Maximize natural light
Universal design
Sub-metered utilities
Wide residential doors (42 in. min.)
Operable windows
VCT, concrete, or wood flooring
Track lighting
Large units, 150 sq. ft. or greater additional floor space (600–1500 sq. ft. for studio to 3 bedroom)
MEETING COMMUNITY STAKEHOLDER OBJECTIVES
c. Meet ancillary community and stakeholder objectives and increase community benefit by
• Engaging public and private stakeholders early in the planning and development phase in order to identify points of intersection between local community and public sector goals.
• Ensuring that all outreach practices are inclusive and aimed at achieving stakeholder diversity at all stages of project development.
• Incorporating publicly accessible programmable community space into the project’s design.
• Creating mixed-use facilities and including spaces for small businesses, nonprofit service providers, arts and cultural organizations, and other community-based end users.
• Aligning the project with adopted community planning document priorities and strategies. For example, addressing transit-oriented (e.g. projects located within ½ mile of a transit hub or light rail) affordable housing, job creation, historic and cultural preservation, environmental sustainability, small business development, and/or corporate relocation and employee attraction goals.
• Forming nontraditional partnerships among those who have an equal stake in the attraction and retention of creative works, but who do not often work together directly (public/private and corporate/non-profit, for example).
• Drafting a community benefits agreement that requires permanent affordability and that prioritizes the creative sector when appropriate.

2017 Otis Report on the Creative Economy of Californiawww.otis.edu/otisreport 99CA
ARTIST RETENTION STRATEGIES AND INNOVATIONS
Securing a future for artists and creatives in California is a statewide concern, as it is tied to the long-term health of the expanding and economically essential creative industries. Though no singular artist housing model or artist retention strategy will meet the diversity of every community need and objective, all types of California communities – urban, first ring, small, midsize, rural, mountain, and desert – would benefit from implementing traditional and innovative strategies.
Policy adaptations that public agencies can pursue in support of affordable space and creative and cultural industry worker retention include the following:
• Extend rent stabilization initiatives to work/live and live/work spaces. Include those in industrial and other traditionally nonresidential areas where long-standing and organically formed artist spaces and communities have developed.
• Create Arts Overlay Zones in areas where informal art spaces have been established to preserve and expand affordable housing, live/work, and work/live space, while protecting the local character of neighborhoods at risk of future gentrification. Overlay zones should have strong anti-speculative measures to dissuade market rate development and preserve affordable rents.
• Extend tenant protection rights to artists and creatives currently living in nonresidential compliant structures and zones and who are at the greatest risk of immediate evictions and homelessness.
• Encourage the creation of affordable artist housing, live/work, and work/live space in market rate developments in Arts Overlay Zones and locally or state adopted arts districts such as state-certified cultural districts, through the use of inclusionary zoning and public benefit agreements.
• Identify affordable artist housing, live/work, and work/live spaces as several housing models in general plans and housing elements to help house the local creative workforce.
• Include the creation of affordable spaces dedicated to the consumption, production, and demonstration of art within artist housing facilities as an appropriate approach to satisfying public percent-for-art ordinance requirements and for related program funds.
• Reduce the prohibitive burden of rezoning for the adaptive reuse of buildings into work/live spaces within light industrial and commercial areas. California building code provides for work/live spaces and municipalities can proactively amend local

2017 Otis Report on the Creative Economy of California www.otis.edu/otisreport100 CA
planning and land-use documents to allow for work/live developments, thereby reducing development costs and supporting affordability. Statewide, safe work/live space may be incentivized by allowing the development of work/live spaces in light industrial and commercial districts without a zoning change, if a commitment to permanent affordability is made and reasonable development standards are met.
• Create a special use permit program that would make a set number of work/live and live/work permits available in industrial warehouse or Production, Distribution and Repair (PDR) zones. This would allow existing and nonconforming work/live and live/work artist communities to continue without rezoning to residential.
• Adapt first-time homebuyer loan program qualifications and protocols to the unique earning patterns of the self-employed and temporarily employed creative sector.
• Advance new affordable artist housing opportunities and support existing artist housing facility upgrades through development and land-use incentives. For example, waiving permit and inspection fees; extending property tax abatements to affordable work/live space; abating sales tax for approved renovation and construction costs.
When interventions like these are adopted at the municipal level and supported by state laws, local leaders gain the ability to protect and grow their community of artists, creatives, and cultural workers in a way that best aligns with their local priorities and unique situations.
Strategic and precise policy adaptations and general affordable housing funding reforms will all help to relieve pressures, but there is a need to move beyond existing paradigms. The following are some “big-ideas” for laying the groundwork for innovating future affordable artist housing projects and strategies. Some replicate tested practices and can pave the way for permanently affordable space for the creative sector. Others have seen success in limited regions of California or outside of the state. Others yet deserve a first-time pilot program in California. At the very least, each should serve as conversation starter.
• De-silo funding for pilot programs and encourage interagency collaboration. Funding and incentive programs for housing and economic development tend to focus on singular objectives and obvious players, yet the most interesting and effective projects are more complex and more diverse. For example, public affordable housing resources that only reward project concepts that fit squarely into a category of need (e.g., senior, large family, veteran, special needs) may address pressing priorities but limit the ability of the private sector to innovate solutions that address community and social issues. If there was a set-aside for pilot affordable housing projects and if interagency collaboration could leverage economic development funding and incentives to assist in capitalizing the project, what might result? For artist housing, it could open opportunities for ancillary incubator programs; or intentional intergenerational communities with state-

2017 Otis Report on the Creative Economy of Californiawww.otis.edu/otisreport 101CA
sanctified service contracts for artist residents who live and work among aging adult populations, in line with the tested principles of the nonprofit EngAGE1;9 or projects serving formerly homeless youth, who if housed in an artist community could receive onsite training to prepare them for a career in the creative industries.
• Open municipal Request for Proposal requirements to nonlocal and nontraditional developers. Cities with property to dispose of for a public benefit like affordable housing may require or prioritize local development experience when scoring and selecting a development team. This may ensure greater efficiency and inspire confidence, but by effectively closing the door to new teams and concepts, also dampens opportunities for innovation.
• Expand the state’s economic and business development toolbox to consider the totality of the creative industries. While the Otis Report on the Creative Economy has demonstrated the impact of the entire creative industry ecosystem on the state of California, the state’s resources continue to focus primarily on the return on investment of the entertainment subsector through the California Film Commission. The health and viability of California’s entertainment industry is paramount, but how might existing stay-local incentives and resources available through the Governor’s Office of Business and Economic Development, such as the California Competes initiative, be tuned to include the retention of creative talent and how might it be expanded beyond the entertainment subsector? Could incentives and tax credits be adapted for the creation and essential safety upgrades of artist work/live space? Could a commission on the creative industries be established? What role might the California Arts Council play in this new context?
• Leverage the nascent state-certified cultural district program as a premier model for affordable artist housing preservation and creation. The model could be replicated in locally adopted cultural, creative, arts, and entertainment districts for wider impact. For example, the use of privately formed local business improvement districts to create funding pools dedicated to affordable creative space. Incentivize alternative affordable housing construction models through planning and zoning, building code, and new scoring criteria for competitive housing programs. For example, the tiny-house movement and shipping container construction may offer innovative cost-effective solutions for artist (and other) affordable housing if barriers to funding and approvals were uniformly removed.10
• Form partnerships that can advance affordable artist housing and homeownership funding opportunities. Nationally, state and city cultural facility funds have been used successfully to fully capitalize cultural facilities, but even seed and gap funding

2017 Otis Report on the Creative Economy of California www.otis.edu/otisreport102 CA
for affordable live/work and work/live construction and undercapitalized building upgrades could be the leverage needed to see additional investment. While public funding options are limited, public/private partnerships may be the answer. Large creative industry employers and corporations that relocate to communities with vibrant arts and cultural offerings have the most to gain by safeguarding creative workers. Private foundations that prioritize funding for arts, culture, housing, job creation, and equitable practices would make good financial and strategic partners. Folding in public entities with retuned business development incentives and housing plans that include the creative industries and artists, could form the basis of such a fund. Ancillary to this, funding pools for grants and low-interest loans programs could be developed and directed through a CDFI or state program for first-time artist homebuyers.
• Get ahead of space-loss trends by learning from the experience of other states. Colorado saw a rapid decline in available warehouse space and a steep rise in rental rates that lead to artist displacement from light-industrial work and work/live situations, after marijuana was legalized. Growers with cash in hand moved in and artists moved out. As city ordinances force California growers indoors, the new but growing cannabis industry will further pressurize the real estate market. Is there an opportunity to direct some of the projected revenue to the preservation and creation of affordable artist work/live and live/work space?
• Implement statewide affordable land protections now. Expand the community land trust and land banking model being implemented on behalf of nonprofit arts and cultural organizations in San Francisco and Oakland by the nonprofit Community Arts Stabilization Trust (C.A.S.T).11 How can this model be adapted to bring new opportunities for long-term affordability and financial equity among low- and moderate-income creative workers?
9EngAGE is a Los Angeles-based nonprofit that “transforms affordable senior apartment communities into vibrant centers of learning, wellness and creativity.” The organization and its founder Tim Carpenter have received national attention and the program has been expanding outside of California in recent years.
10Space 4 Art, a San Diego nonprofit has modeled a tiny house, mixed-use, environmentally sustainable, affordable artist housing community through a STEAM program partnership. The innovative group has operated successfully as a rental-based mixed-use artist community in a rapidly gentrifying neighborhood of downtown and is seeking to relocate and establish a permanent home in its piloted housing model.
11C.A.S.T., founded in 2013 through a public/private collaborative effort, is a San Francisco-based nonprofit that purchases and leases space for the exclusive use of nonprofit arts organizations. It seeks to build capacity among organizations to lease and own property, thereby ensuring their long-term stability in a rapidly escalating real estate market. Under the leadership of Moy Eng, the organization has attracted national and international attention for its innovative approach and its facilitation of equitable urban transformation.

2017 Otis Report on the Creative Economy of Californiawww.otis.edu/otisreport 103CA
CONCLUSION
Artists and creatives make up a significant percentage of our workforce and are essential to the creative economy. They impact our communities as educators and cultural practitioners. As artisans and makers, they drive small-town tourism-based economies. They are risk-takers and small business entrepreneurs. Together they keep our economy thriving, our communities authentic, and our brand of innovation, creativity, and equity at the forefront. California communities large and small; urban, suburban, and rural; mountain, desert and coastal have an equal stake in their future.
The greatest challenges facing our artists and creatives are the rising cost of real estate through unfettered and speculative development; the loss of appropriate spaces in which to live and work; the barriers to successful artist housing projects; and the absence of targeted and comprehensive strategies to combat the issues. The solutions are found in adaptations to policies and priorities; realignment of existing tools and resources; and public/private and cross-sector partnerships that are formed with a common goal of positive change and the assurance of successful models of affordable artist housing and workspace opportunities.
If California is to protect and retain this tremendous asset, it must approach the problem like a creative. It must find solutions by innovating from the top down and bottom up. It must reinvent itself in the face of a changing landscape or risk losing its emerging artists and pipeline of creative workers. Technology and industry decentralization trends allow creatives to relocate and thrive in communities nationwide. They follow the opportunities and affordable spaces that offer the greatest freedom and the infrastructure that they need. We need to make it easy for them to remain here, at home, in California.
2017 Otis Report on the Creative Economy of California www.otis.edu/otisreport104 CA
CASE STUDIES
Artist housing comes in all physical and functional forms. Projects may be classified as live/work or work/live. Projects may be housing-only with shared creative spaces or follow a co-housing model. Some artist housing projects in California are well-known and long-standing like the Brewery Artist Lofts or Santa Fe Art Colony, both in downtown Los Angeles. Others are more obscure, naturally occurring affordable spaces hidden within warehouses in industrial zones or adaptively reused buildings in smaller towns across the state. They may be funded with public resources, privately financed, or the product of sweat equity and a do-it-yourself strategy.
Buildings that provide housing and working spaces for artists are diverse because the needs and opportunities vary. The continued natural growth of new, unique, appropriate, and safe spaces should be fostered. One way to do that is to reference successful models that can be replicated and learned from. The following are three distinct examples of successful artist housing projects. The first, located in Pomona, California, is a work/live project on the edge of a light industrial zone. It was created and is operated by the for-profit developer Arteco Partners, who are also credited with the revitalization of downtown Pomona as an arts colony. The second, in Sacramento, California, was catalyzed by the efforts of the Capitol Area Development Authority (CADA) and developed by CFY Development, a local affordable housing developer. It is a mixed-income project involving new construction and historic adaptation. The third, located in Santa Cruz, California, is the product of Artspace, a national nonprofit leader in affordable artist housing. An arts campus, it is 100% affordable to the artists and families who live and work there and the largest of the 46 affordable arts facilities that make up Artspace’s portfolio.

2017 Otis Report on the Creative Economy of Californiawww.otis.edu/otisreport 105CA
CASESTUDY
POMONA PACKING PLANT
Model: work/live, mixed-use, affordable without covenantAddress: 560 East Commercial Street, Pomona, California 91767Developers: Arteco PartnersType of property: Historic warehouse built in 1916Year renovation complete: 2013Cost: (approx.) $1.5 million acquisition; $3.5 million renovation Total sq. ft.: 60,000Stories: 1Number of units: 21 work/live, 1 commercialSize of units: 1,400–7,500 sq. ft.Rent range: $0.47–$0.65 per sq. ft. per month
The Pomona Packing Plant exemplifies how private investment can preserve affordability and ensure working artists remain in arts districts they help popularize.
DESCRIPTION
Arteco Partners is a local development firm that led the revitalization of downtown Pomona, California, through an arts-driven strategy of creating arts-focused studio, live/work, and mixed-use projects. Learning that some artists were not accommodated by the 1200–1500 sq. ft. live/work lofts they designed for artists who work in smaller, more traditional media including desktop multimedia, in their other projects, they conceptualized this commercial project with accessory residential uses to serve those who work in large-scale and industrial media, like metal and wood. The work/live certified spaces include heat, an industrial sink/kitchenette, and a private bathroom with a shower. Artist tenants understand it is a working complex and subject to the noise and activity of a commercial environment.

2017 Otis Report on the Creative Economy of California www.otis.edu/otisreport106 CA
A commitment to affordability is possible due to the relatively low acquisition and renovation costs; the use of the 10% historic tax credit as a source of additional up-front capital; the single-story design; and use of Arteco’s in-house, design, and construction team. At the time of this writing, its relative affordability is evidenced by a new 300-unit Transit Oriented Development project, the Monterey Station Apartments, which advertises open-concept units that rent for as much as $3.00 per sq. ft. – over four times that of the Pomona Packing Plant spaces. Market rate projects can now capture these high rents in part due to the proximity of projects like the Pomona Packing Plant and the area’s desirability as an arts and entertainment destination.
CHALLENGES
Land-use incompatible site. The abandoned warehouse, deemed by the city as unsuitable “for today’s manufacturing needs” was just outside of the downtown-specific plan that allowed live/work and in a light industrial area that did not. The project would have been infeasible if the city of Pomona had not seen the value of the project and collaborated to make the required changes. While that amendment process took a year, rezoning would have triggered the California Environmental Quality Act, increasing the timeline and cost and rendering the project infeasible.
There was no land available for onsite parking. The city assisted by vacating an adjacent dead-end street, now owned by the project and used for parking. The current building’s use, with approximately 50 residents and employees, was presented as less intense than the historic warehouse use, allowing for a flexible interpretation of the parking requirement.

2017 Otis Report on the Creative Economy of Californiawww.otis.edu/otisreport 107CA
FEATURES AND AMENITIES
• 10–30-foot, open-rafter, vaulted ceilings
• Exposed brick walls and concrete floors
• Single-story building – necessary for the industrial work/live function
• Skylights
• Industrial electrical services available (220v)
• Fiber-optic connectivity
• Private parking
• Large entry doors, some units have roll-up exterior-facing doors
UNIQUE ELEMENTS
• Includes an affordable satellite location for the nonprofit Museum of Neon Art (MONA)
• Home to Pomona’s first microbrewery
• Adjacent to the downtown Pomona Arts Colony, Pomona’s arts district, and a participant in the monthly Pomona Arts Colony Association sponsored Art Walk
• Sensitive design that restored and retained historic features of the building
• Diverse tenant base including furniture and fashion designers, filmmakers, and sculpture and ceramic artists
• Interior space design allows for expanding or retracting spaces as tenant needs shift
SOURCES OF FUNDING
• Noncompetitive, 10% Federal Historic Tax Credit
• Private financing
KEY TAKEAWAYS
• The project was made possible by city leaders who found value in and prioritized the project by modifying their land-use documents and flexibly interpreting their parking requirements. Municipalities need to act proactively to pave the way for artist work/live and live/work projects by amending planning and land-use documents in advance of new development or by making work/live allowable by permit. Having a cooperative and flexible approach toward developments that address several community goals is vital. In an escalating real estate market, keeping the entitlement process efficient and costs low for developers is one way of fostering new affordable spaces.
• This same project would not be feasible in Pomona’s current downtown real estate market. The cost of land has increased and with the added expense of seismic retrofitting, the existing affordable rents would not be sufficient to cover the private financing. Land banking for the arts and introducing affordability restrictions are two ways of preserving properties before values rise in existing light industrial and commercial areas around the state.
• Private development can lead revitalization strategies that retain the integrity of historic resources and provide affordable and appropriate space for artists, while creating vibrant mixed-use and commercially successful districts. Supporting private developers who subscribe to the belief that affordable artist spaces are important assets to communities and complementary to commercial development and who are willing to balance profit with community benefit is important.

2017 Otis Report on the Creative Economy of California www.otis.edu/otisreport108 CA
CASESTUDY
WAL (WAREHOUSE ARTIST LOFTS)
Model: live/work, mixed-use, mixed-income (with affordability covenant)Address: 1108 R Street, Sacramento, California 95811Developers: R Street Investors, LP, a partnership of CFY Development and John CiceroneType of property: Historic structure built in 1914, plus new constructionYear Renovation completed: 2014Cost: $41.6 million Residential/Common area sq. ft.: 202,454Commercial sq. ft.: 13,000Stories: 6-story historic, 4-story new constructionTotal live/work units: 116Number of affordable units: 86 (30%, 40%, 50%, and 60% of AMI (Area Median Income))Number of market rate units: 30 Size of market rate units: 550–800 sq. ft. (all are studios)Size of affordable units: 550–1,575 sq. ft. (studio, 1, 2, and 3 bedroom)Rent range: Affordable units are U.S. Department of Housing and Urban Development (HUD) regulated per AMI; market units range from $1,100 to $1,250 per month
WAL is a revitalization catalyst for the Historic R Street District, fulfills multiple community and public agency goals, and is an arts-centric, long-term affordable stronghold for artists and creative workers.
WAL is a revitalization catalyst for the Historic R Street District, fulfills multiple community and public agency goals, and is an arts-centric, long-term affordable stronghold for artists and creative workers.

2017 Otis Report on the Creative Economy of Californiawww.otis.edu/otisreport 109CA
DESCRIPTION
CADA (Capitol Area Development Authority) is a self-supporting public agency charged with building “safe, affordable and environmentally sustainable urban neighborhoods” through redevelopment strategies and public/private partnerships. After 15 years of failed development proposals offered up by private developers for the redevelopment of the CADA-joined historic Lawrence Warehouse and adjacent vacant parcel site, CFY Development created a partnership and the concept of WAL, a mixed-use, mixed-income project for local artists, was realized.
A commitment to affordability is possible through an allocation of 9% Low Income Housing Tax Credits and other affordable housing, redevelopment, and environmental remediation sources; income from commercial tenants; and the inclusion of market rate lofts. There is a 55-year affordability covenant for the 84 subsidized units and an artist preference in place for all units. The live/work spaces are residentially zoned, but designed for artists and their families and shared spaces for “creative collision,” collaboration, and exhibition are integrated into the facility including a dance studio with sprung floors, mirrors, barres, and an 18-foot-high ceiling; a large “Performance Hall”/flexible event space; a large courtyard; and an actively used rooftop. Over 20 locally commissioned art installations and art works are integrated into the design. The funding, functionality, and management practices are modeled in part after the Artspace development model.
The commercial space includes The Public Market and is a natural extension of the artist housing with its unique, local retail and pop-up style restaurants in an airy and vibrant atmosphere. A locally owned barbershop/bar anchors the commercial concept.
CHALLENGES
The building is large, vibrant, and multifunctional; operating costs reflect this. However, operating income is restricted by the low rents. The project would benefit from a more robust budget. A local artist helps by sponsoring arts-based entertainment and fundraising events to feed money back into the project to the benefit of the artist residents.
The project can be very social with many publicly interactive events, which can lead to security issues and concerns.
Financing for this project was not typical and highly complex. The success relied upon a good relationship between the developer and the lending institutions and the tax credit syndicator.

2017 Otis Report on the Creative Economy of California www.otis.edu/otisreport110 CA
FEATURES AND AMENITIES• Performance hall/community room
• Dance studio
• Landscaped courtyard
• Rooftop BBQ and picnic area
• Secure parking garage
• On-Site laundry facilities
• Solar thermal hot water heating
• Large windows
• Up to 18-foot-high ceilings
• Facilities for cleaning/disposing art materials
• Hard surface flooring
• Pet friendly
• Classroom
• Special events and programming
UNIQUE ELEMENTS• Located in the heart of a transit-oriented,
mixed-use neighborhood
• The project participates in the monthly Historic R Street District “First Friday” art walk event
• The development team engaged artists early in the process to inform the project design and ensure an authentic arts community
• Energy efficient project with a Green Point Rating of 126
• Secure bike parking is provided to promote a reduction in carbon footprint
SOURCES OF FUNDING• 9% Low Income Housing Tax Credits (LIHTC)
• CA infill and infrastructure funding program (Prop1C)
• 20% Federal Historic Tax Credits
• Private financing
• CADA residual receipts loan
• U.S. EPA Brownfields Program loan – secured by CADA
KEY TAKEAWAYS
• Public agencies that lead with intention the creation of affordable artist housing projects through public/private partnerships can satisfy multiple public goals, while ensuring long-term appropriate and affordable spaces for local artists and creative workers in revitalizing areas.
• With a four-year, 300-household waitlist at the time of this writing, WAL has tapped into the intense need for affordable artist live/work options in California.
• Innovative projects require strategic partnerships and inclusive practices. WAL is a success story because its team includes public and private leaders and involved artists throughout the process. It also leverages the creative and entrepreneurial talents of its residents and commercial tenants through its collaborative management and business practices in order to foster economic growth.

CASESTUDY
THE TANNERY ARTS CENTER
Model: live/work, mixed-use, 100% affordable (with covenant)Address: 1010–1070 River Street, Santa Cruz, CA 95060Developers: Artspace Projects, Inc. (Housing and Studio), Tannery Arts Center, Inc. (Venue)Type of property: Adaptive reuse of historic tannery buildings built in mid-1800s, plus new construction Year renovation complete: Housing 2009, Studio 2012, Venue 2015Cost: $35.4 million (housing), $7 million (studios)Residential sq. ft.: 180,000Commercial sq. ft.: 23,622Stories: 1-story studios; 3 floors of residential live/workNumber of units: 100 (affordable at 30%, 40%, 50%, or less of AMI)Size of live/work units: 550–1200 sq. ft. (studio, 1, 2, and 3 bedrooms)Rent range: HUD-regulated per AMI Number of studio-only spaces: 28Size of studios: 200–3,200 sq. ft.Theatre seating capacity: 182
DESCRIPTION
The Tannery Arts Center is an 8.3 acre mixed-use campus-style project built in three phases. It includes the Artspace Tannery Lofts, the Digital Media and Creative Arts Center (a.k.a. Working Studios at the Tannery), and the Colligan Theatre. It was created through a joint effort by the former Redevelopment Agency of the city of Santa Cruz, nonprofit developer Artspace Projects, Inc., and the local nonprofit Tannery Arts Center, Inc. (TAC).
Artspace, a national leader in affordable artist housing and facility development is the long-term steward of the 100-unit Tannery Lofts and the Working Studios, the former

2017 Otis Report on the Creative Economy of California www.otis.edu/otisreport112 CA
“The construction of the project has generated hundreds of local jobs and will benefit our community for decades to come. The Tannery Arts Center is the culmination of years of effort by many community stakeholders working together to realize a vision to preserve and support the rich cultural and artistic heritage that makes Santa Cruz unique.” — Bonnie Lipscomb, Economic Development Director, City of Santa Cruz
of which Artspace master leases from the partnership and subleases directly to 28 professional artists to create, display, and sell their work. The live/work spaces have flexible floorplans and durable surfaces to accommodate a variety of residentially compatible art practices, while the Working Studios accommodate commercial and more industrial art forms and support public interaction. There is an artist preference in place for the live/work units and a selection review committee.
TAC, which was formed for this project and is governed by a board of directors representing local business, the public, and the arts, helped guide the direction of the overall project. In addition, it fundraised for and constructed the Colligan Theater.
A commitment to affordability is assured by a long-term affordable land lease; public benefit resources, including private equity generated from a state allocation of 4% Low Income Housing Tax Credits; funding from the 2013 Housing and Economic Recovery Act for the job-growth focused Working Studios; and the guiding mission of Artspace to “create, foster and preserve affordable spaces for artists and arts organizations.”
CHALLENGES
The development site was historically significant, important to the local community, and highly contaminated. A complex project, the Santa Cruz Redevelopment Agency, which was a champion for the project from the start, remediated the site and provided a long-term, affordable lease. The city and its agency’s participation was critical to the project’s success and long-term self-sustainability.
The site is in a 100-year flood plain and the historic buildings were not suitable for housing. New construction with historically sensitive design placed parking at grade with housing and mechanicals located above.
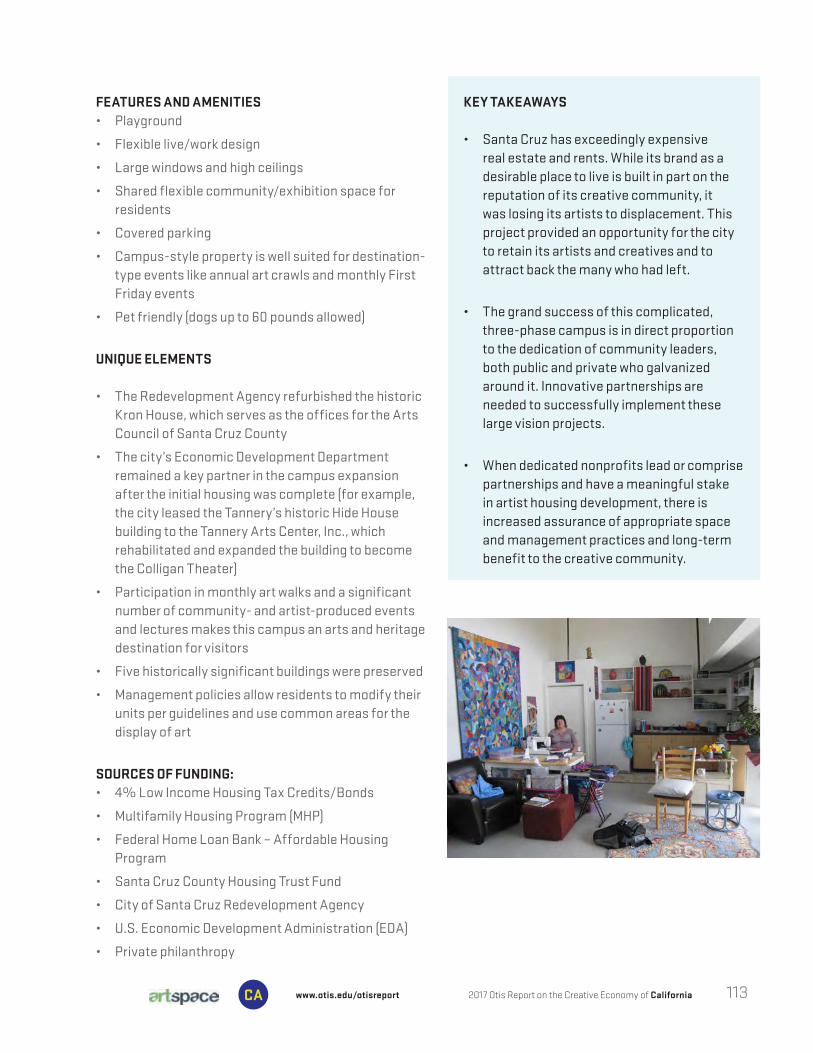
2017 Otis Report on the Creative Economy of Californiawww.otis.edu/otisreport 113CA
FEATURES AND AMENITIES• Playground
• Flexible live/work design
• Large windows and high ceilings
• Shared flexible community/exhibition space for residents
• Covered parking
• Campus-style property is well suited for destination-type events like annual art crawls and monthly First Friday events
• Pet friendly (dogs up to 60 pounds allowed)
UNIQUE ELEMENTS
• The Redevelopment Agency refurbished the historic Kron House, which serves as the offices for the Arts Council of Santa Cruz County
• The city’s Economic Development Department remained a key partner in the campus expansion after the initial housing was complete (for example, the city leased the Tannery’s historic Hide House building to the Tannery Arts Center, Inc., which rehabilitated and expanded the building to become the Colligan Theater)
• Participation in monthly art walks and a significant number of community- and artist-produced events and lectures makes this campus an arts and heritage destination for visitors
• Five historically significant buildings were preserved
• Management policies allow residents to modify their units per guidelines and use common areas for the display of art
SOURCES OF FUNDING:• 4% Low Income Housing Tax Credits/Bonds
• Multifamily Housing Program (MHP)
• Federal Home Loan Bank – Affordable Housing Program
• Santa Cruz County Housing Trust Fund
• City of Santa Cruz Redevelopment Agency
• U.S. Economic Development Administration (EDA)
• Private philanthropy
KEY TAKEAWAYS
• Santa Cruz has exceedingly expensive real estate and rents. While its brand as a desirable place to live is built in part on the reputation of its creative community, it was losing its artists to displacement. This project provided an opportunity for the city to retain its artists and creatives and to attract back the many who had left.
• The grand success of this complicated, three-phase campus is in direct proportion to the dedication of community leaders, both public and private who galvanized around it. Innovative partnerships are needed to successfully implement these large vision projects.
• When dedicated nonprofits lead or comprise partnerships and have a meaningful stake in artist housing development, there is increased assurance of appropriate space and management practices and long-term benefit to the creative community.
Download the full report, view highlights from the creative economy release event, and learn more about other resources at www.otis.edu/otisreport