2014-2015 economic forecast & industry … economist kimberly ritter-martinez economist...
TRANSCRIPT

THE KYSER CENTER FOR ECONOMIC RESEARCH
2014-2015 ECONOMIC FORECAST & INDUSTRY OUTLOOK

ABOUT LOS ANGELES COUNTY:
Los Angeles County is a nation-sized region that spans more than 4,000 square miles, has
10 million residents who speak 140 languages from around the world, and leads the nation as
the #1 Entertainment Capital, the #1 Manufacturing Capital, and #1 International Trade Capital
of America. L.A. County also has the nation’s #1 and #2 ranked seaports, the busiest origin and
destination airport (LAX) and three world-class research institutions plus 118 other colleges and
universities, all of which contribute to the region’s annual economic activity of $570 billion.
By measure of GDP alone, L.A. County would be larger than Sweden, Norway, Poland, Belgium
or Taiwan.
Los Angeles County is governed by five Supervisors, including Supervisor Gloria Molina (District
1), Supervisor Mark Ridley-Thomas (District 2), Supervisor Zev Yaroslavsky (District 3), Supervisor
Don Knabe (District 4), and Supervisor Michael Antonovich (District 5). For more information
about Los Angeles County, visit: http://www.chooselacounty.com.

THE LAEDC THANKS THE FOLLOWING BUSINESS LEADERS FOR THEIR GENEROUS SUPPORT:
For information about LAEDC membership, contact Justin Goodkind (213) 236-4813.For information about LAEDC membership, contact Elsa Flores at (213) 236-4815.
THE LAEDC THANKS THE FOLLOWING BUSINESS LEADERS FOR THEIR GEREROUS SUPPORT:

PRESENTING SPONSOR
EVENT SPONSORS
MEDIA SPONSORS
2014-2015 ECONOMIC FORECAST & INDUSTRY OUTLOOK SPONSORED BY:

2014-2015
ECONOMIC FORECAST
AND
INDUSTRY OUTLOOK
California and Southern California
Including the National and International Setting
February 2014
Los Angeles County Economic Development Corporation The Kyser Center for Economic Research 444 S. Flower St., 37
th Floor, Los Angeles, CA 90071
Tel: 213-622-4300 | 888-4-LAEDC-1 | Fax: 213-622-7100 Web: http://laedc.org | E-mail: [email protected]

©2014 Los Angeles County Economic Development Corporation 444 S. Flower Street, 37
th Floor., Los Angeles 90071
T: (213) 622-4300 | F: (213) 622-7100 | www.laedc.org
The LAEDC, the region's premier business leadership organization, is a private, non-profit 501(c)3
organization established in 1981.
As Southern California’s premier business leadership organization, the mission of the LAEDC is to attract, retain, and grow businesses and jobs for the regions of Los Angeles County.
Since 1996, the LAEDC has helped retain or attract more than 190,000 jobs, providing approximately $12
billion in direct economic impact from salaries and over $850 million in property and sales tax revenues to
the County of Los Angeles.
Regional Leadership
The members of the LAEDC are civic leaders and ranking executives of the region’s leading public and
private organizations. Through financial support and direct participation in the mission, programs, and
public policy initiatives of the LAEDC, the members are committed to playing a decisive role in shaping
the region’s economic future.
Business Services The LAEDC’s Business Development and Assistance Program provides essential services to L.A. County
businesses at no cost, including coordinating site searches, securing incentives and permits, and
identifying traditional and nontraditional financing. The LAEDC also works with workforce training,
transportation, and utility providers.
Economic Information
Through our public information and for-fee research, the LAEDC provides critical economic analysis to
business decision makers, education, media, and government. We publish a wide variety of industry
focused and regional analysis, and our Economic Forecast report, produced by the Kyser Center for
Economic Research, has been ranked #1 by the Wall Street Journal.
Economic and Policy Analysis Group
The LAEDC Economic and Policy Analysis Group offers thoughtful, highly regarded economic and policy
expertise to private- and public-sector clients. The group focuses on economic impact studies, regional
industry analyses and economic issue studies, particularly in water, transportation, infrastructure and
workforce development policy.
Leveraging our Leadership
The LAEDC Center for Economic Development partners with the Southern California Leadership Council
to help enable public sector officials, policy makers, and other civic leaders to address and solve public
policy issues critical to the entire region’s economic vitality and quality of life.
Global Connections
Our World Trade Center Los Angeles-Long Beach works to support the development of international
trade and business opportunities for Southern California companies as the leading international trade
association, trade service organization and trade resource in Los Angeles County. It also promotes the
Los Angeles region as a prime destination for foreign investment. For more information, please visit
www.wtca-lalb.org

Good morning, Ladies and Gentlemen, and welcome to the LAEDC’s 2014-2015 Annual Forecast.
The LAEDC’s Economic Forecast is Southern California’s premier source for in-depth economic
information and analysis on our global, national, state and regional economies. Each forecast release is
accompanied by a public event featuring the insights of influential economists and leaders from the
public, private and education sectors. The forecast report is produced by the LAEDC’s Kyser Center for
Economic Research, led by its Chief Economist, Dr. Robert Kleinhenz.
Dr. Kleinhenz is joined today by a pair of highly respected presenters. Thomas M. Priselac, President
and CEO, Cedars-Sinai Health System Los Angeles, will share his insights into the extraordinary
transformation taking place in our enormously important health care sector due to technological
innovation, public policy, and other market factors. Tad Rivelle, Chief Investment Officer – Fixed
Income, Group Managing Director, Trust Company of the West (TCW), will share his views on the
unintended consequences of Fed policy and give us his perspective on the capital markets .
Repeating his role as Master of Ceremonies, is Frank Mottek who reports on the regional business and
economic news for KNX 1070 NewsRadio where he is host of the KNX Business Hour, the number one
business radio show in Southern California.
This morning’s event has been made possible by a number of generous sponsors, including our
presenting sponsor University of Phoenix, as well as Cedars-Sinai Health System, and Union Bank.
Our media sponsors for this event are KNX 1070 NewsRadio and the Los Angeles Business Journal.
This week the LAEDC is also proud to announce the formation of "inLA," our county-wide initiative to
accelerate the pace of innovation in our region, and its first program, the Blackstone Launchpad, funded
by a multi-million dollar grant from the Blackstone Foundation to encourage entrepreneurship at UCLA,
USC, and UC-Irvine.
Thank you for your continued support of the LAEDC and our mission to attract, retain, and grow
businesses and jobs for the residents of Los Angeles County.
Sincerely,
Bill Allen President and CEO L.A. County Economic Development Corporation

PREPARED AND RESEARCHED BY:
Robert A. Kleinhenz Ph.D Chief Economist
Kimberly Ritter-Martinez Economist
Ferdinando Guerra International Economist
George Entis Research Assistant
Dymphna Menendez Kyser Center Intern
TABLE OF CONTENTS
2014-2015 Forecast at a Glance ..................................................................................... 1
The U.S. Economy .......................................................................................................... 2
Income Growth and Inequality .................................................................................................... 9
The International Economy ........................................................................................... 11
Foreign Exchange Rates ........................................................................................................... 15
The California Economy ................................................................................................ 19
The Future of Water in California .............................................................................................. 23
Gross Product Comparisons ..................................................................................................... 24
Los Angeles County ...................................................................................................... 34
Orange County.............................................................................................................. 40
Riverside and San Bernardino Counties........................................................................ 46
San Diego County ......................................................................................................... 53
Ventura County ............................................................................................................. 59
Major Industries of the Southern California Economy .................................................... 64
Aerospace and Defense ............................................................................................................ 64
Apparel Design and Manufacturing ........................................................................................... 66
Computer and Electronic Product Manufacturing ..................................................................... 67
Professional and Business Services ......................................................................................... 67
Financial Services ..................................................................................................................... 68
Health Care Services/Biomedical.............................................................................................. 69
International Trade/Goods Movement ...................................................................................... 70
Motion Picture/TV Production ................................................................................................... 72
Real Estate and Construction ................................................................................................... 74
Retail Trade ............................................................................................................................... 85
Travel and Tourism ................................................................................................................... 87
Index of Statistical Tables ............................................................................................. 90

2014-2015 Forecast at a Glance
LAEDC Kyser Center for Economic Research 1 Economic Forecast, February 2014
2014-2015 FORECAST AT A GLANCE
The U.S. Economy
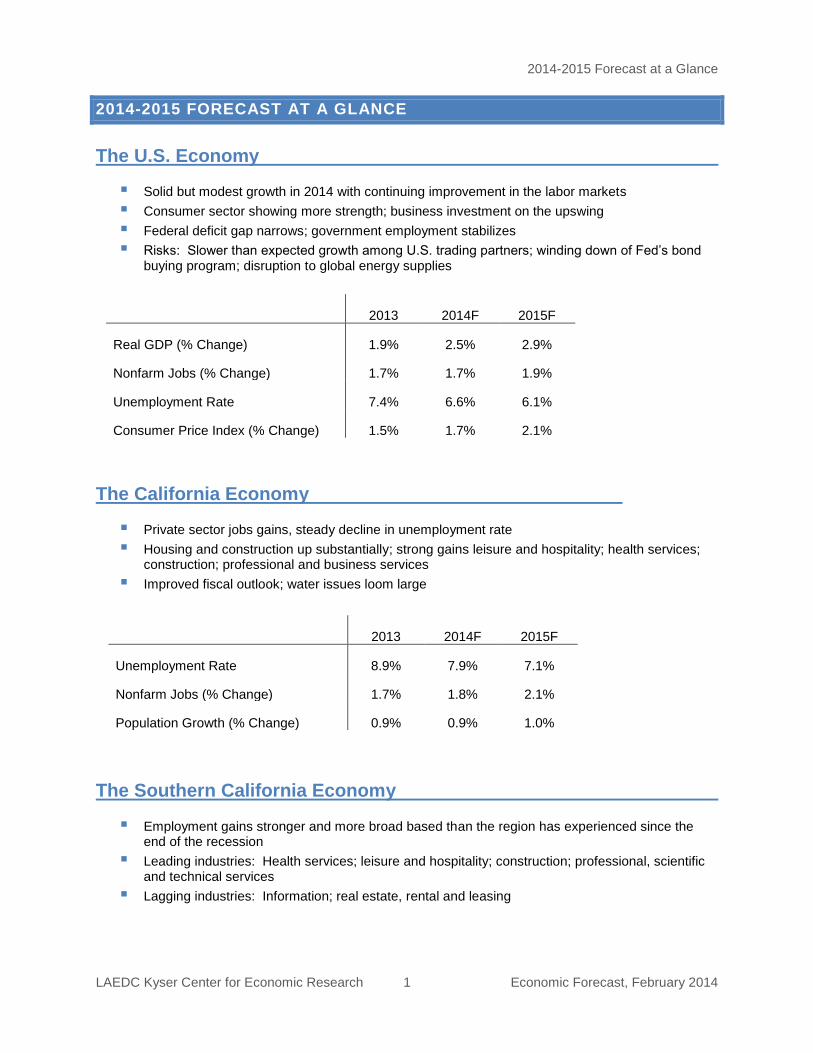
Solid but modest growth in 2014 with continuing improvement in the labor markets
Consumer sector showing more strength; business investment on the upswing
Federal deficit gap narrows; government employment stabilizes
Risks: Slower than expected growth among U.S. trading partners; winding down of Fed’s bond buying program; disruption to global energy supplies
The California Economy
Private sector jobs gains, steady decline in unemployment rate
Housing and construction up substantially; strong gains leisure and hospitality; health services; construction; professional and business services
Improved fiscal outlook; water issues loom large
The Southern California Economy
Employment gains stronger and more broad based than the region has experienced since the end of the recession
Leading industries: Health services; leisure and hospitality; construction; professional, scientific and technical services
Lagging industries: Information; real estate, rental and leasing
2013 2014F 2015F
Real GDP (% Change) 1.9% 2.5% 2.9%
Nonfarm Jobs (% Change) 1.7% 1.7% 1.9%
Unemployment Rate 7.4% 6.6% 6.1%
Consumer Price Index (% Change) 1.5% 1.7% 2.1%
2013 2014F 2015F
Unemployment Rate 8.9% 7.9% 7.1%
Nonfarm Jobs (% Change) 1.7% 1.8% 2.1%
Population Growth (% Change) 0.9% 0.9% 1.0%

The U.S. Economy
LAEDC Kyser Center for Economic Research 2 Economic Forecast, February 2014
THE U.S. ECONOMY
Most indicators suggested that the U.S. economy ended last year with growing
momentum that would presumably carry into 2014. This was good news
considering the challenges the economy faced throughout the year. Sluggish
growth marked the first half of the year, in part because of federal sequestration
budget cuts and other tax and spending policy changes affectionately called the
Fiscal Cliff. Then, in October, the federal government shut down for over two
weeks, causing more disruption to the economy. Still, above trend growth
materialized during the second half of the year, the unemployment rate fell from
7.9% to 6.7% (December to December), inflation remained benign, and the stock
market turned in an outstanding performance.
Surely, a strong finish in 2013 should translate into a strong start to 2014. This
year has other things going for it as well. For example, Congress reached a
bipartisan agreement, passing a budget for the current fiscal year, with tentative
agreement on the budget for the fiscal year ending September 2015. The
unemployment rate continues to edge down while consumer confidence is on the
rise and global economic growth is expected to accelerate this year and next.
Not so fast. Signals are mixed so far this year. The unemployment rate may be
falling but monthly wage and salary job growth has been disappointing over the
last two months, and the stock market indices have slipped below their year-end
highs. Despite concerns over these developments, 2014 should shape up as a
year of solid but modest growth with continued improvement in the labor market,
and with nearly all sectors of the macroeconomy contributing to that growth.
KEY SECTORS
Consumers: Households drew strength from a better labor market picture and
increases in the value of both real and financial assets, but they also dipped into
savings, increased their use of credit, and finally replaced that old car in the
driveway. Consumer spending rose two percent last year, with increased
spending across the board on goods and services. Consumer spending on
durable goods rose by 7.1% last year, with spending on household furnishings
and other durable goods exceeding pre-recession levels for the second year in a
row, and with strong gains in vehicle expenditures that will exceed prerecession
levels this year.
This is a good sign for both households and the broader economy. Consumer
spending accounts for nearly 70% of total spending in the U.S. economy. So
when households feel better about both current and future conditions, consumer
spending increases and drives the entire economy to a higher level of growth. A
higher level of consumer spending is good, but increases in spending on durable
goods are particularly important because they stem from both greater consumer
confidence and the expectation of a better financial picture for households going
forward.
Households have seen gains in the labor market, a lower unemployment rate,
new job creation, and a slight increase in real wages. Household balance sheets
2014 should shape up as
a year of solid but modest
growth with continued
improvement in the labor
market and with nearly all
sectors of the
macroeconomy
contributing to that
growth.

The U.S. Economy
LAEDC Kyser Center for Economic Research 3 Economic Forecast, February 2014
also have improved markedly in recent years. Households initially deleveraged
by paying down existing debt. Once the recovery was underway, non-revolving
debt increased over each of the last four years as they took out more student
loans and financed vehicle purchases with new car loans. But they proceeded
cautiously with revolving credit in the immediate wake of the recession.
Eventually, households moved forward with slight increases in credit card and
other revolving debt in 2011-12 that were followed in 2013 by a very modest
1.9% increase. On the asset side of the balance sheet, stock market gains and
increases in home prices have improved the financial situation of many
households.
The recent performance of the housing market has helped households in many
ways. The U.S. median price of an existing home rose by 11.5% last year. Higher
home prices increased the equity position of homeowners, helping many who
were once underwater. For those who finally had sufficient equity to be able to
refinance at lower mortgage rates, the newly freed up income could be saved or
it could be spent on home improvements and other expenditures. Last year was
also a good year for homebuyers who were able to take advantage of the low
interest rate environment. Existing home sales rose by 9.2% last year and new
home sales rose by 15.7%. Purchases of these homes were partly responsible
for the increase in durable goods purchases mentioned earlier. Buying a home
triggers a positive ripple effect through the economy with purchases of new
appliances, home furnishings, and other items for the home.
Consumer spending should continue to grow over the next two years as
household fundamentals improve. The inflation-adjusted growth rate of
consumer spending is expected to increase more quickly than at any time since
the recession, approaching three percent this year and marginally exceeding
that threshold next year. Spending on consumer durables, nondurables, and
services should all increase this year and next. New vehicle sales will also rise to
levels that are consistent with consumer sector fundamentals but below the pre-
recession peak. Home prices will also increase although supply constraints may
limit sales.
Businesses: Total investment spending accounts for 16% of GDP and rose by
5.5% last year. However, these figures include residential investment, that is,
single- and multi-family construction. Netting out residential investment results in
(nonresidential) business investment spending of just under two trillion dollars
last year, which is 13% of GDP. Business investment spending rose by 5.0% last
year. Within that broad category, spending on structures rose by 3.8%, while
equipment expenditures rose 6.3% and spending on intellectual property rose
4.1%.
Business spending has increased over the past five years, with annual increases
exceeding seven percent in 2010 and 2011 as firms made overdue capital
expenditures and replenished inventories. Temporary tax credits and accelerated
depreciation allowances also contributed to the rebound soon after the recession.
Smaller increases occurred in 2012 and 2013.
The inflation-adjusted growth
rate of consumer spending is
expected to increase more
quickly than at any time since
the recession.

The U.S. Economy
LAEDC Kyser Center for Economic Research 4 Economic Forecast, February 2014
Based on recent results from the Federal Reserve’s Senior Loan Officer Survey,
there has been a modest increase in commercial and investment loans with
banks reporting modest easing of lending standards. These are good signs, as
increased access to borrowed capital should enable firms to grow with expansion
in the general economy. With the Federal Reserve Bank expected to hold short-
term rates steady, but winding down the bond-buying program at the long-term
end, short-term loan rates should be more or less unchanged in 2014 while long-
term rates may rise.
Total investment spending (including residential investment) is expected to
accelerate over the next two years with more than a 9% gain this year and a 7%
increase next year. Business investment spending should increase by nearly 7%
this year, climbing to nearly 8% next year. All major categories of business
investment should trend up over this year and into 2015.
Government: With sequestration budget cuts reducing federal expenditures last
year and improved economic conditions lifting government receipts, the federal
budget made dramatic gains over the last couple of years. Back in 2009, the
budget deficit was 1.4 trillion dollars, equivalent to nearly 10% of GDP. By 2013,
the deficit had fallen to 4.3% of GDP. With the budget for 2013-14 in place and
with tentative agreement on the 2014-15 budget, the deficit is expected to fall to
3.9% of GDP this year, 3.5% in 2015, and to 3.0% by 2016, slightly higher than
the 2.6% average since 1960.
Of the three levels of government, the federal budget is the most visible at the
macroeconomic level, but the federal government has less than 13% of total
government employment. By comparison, state employment accounts for 23% of
all government jobs and local employment makes up 64% of all government jobs.
Federal employment peaked in 2010, but by 2013 had lost 211,000 jobs (-7.1%)
falling to 2.8 million employees. State and local employment both peaked in
2008, but the requirement to balance budgets forced draconian cuts in response
to reduced receipts, leading to large job cuts. From 2008 through last year, state
governments lost 129,000 jobs (a 2.5% cut), finishing at 5.0 million jobs in 2013.
Local government took the biggest hit, losing 521,000 jobs cut (down 3.6%) over
the same period, and finishing with 14.0 million jobs in 2013. State and local
government employment should stabilize or show a slight gain over the next two
years as the economic and fiscal situation recovers.
Looking ahead, federal spending is expected to decrease by 2.0% this year and
will continue to edge down over the next few years. State and local budgets
should stabilize after four successive years of cuts, with a slight 0.5% increase
this year giving way to an increase of approximately one percent in 2015. As the
recession recedes further from view, state and local budgets will continue to
improve.
Trade: Net inflation-adjusted exports improved in 2013 over 2012, as income
gains among US households drove a modest increase in imports; and because
of increased demand for US exports, in part the result of the falling dollar.
Imports grew just 1.4% last year, the fourth increase in as many years, but less
Total investment spending
(including residential
investment) is expected to
accelerate over the next two
years with more than a 9%
gain this year and a 7%
increase next year.

The U.S. Economy
LAEDC Kyser Center for Economic Research 5 Economic Forecast, February 2014
than the 2.2% gain of 2012. As for exports, a moderate 3.5% gain in 2012 gave
way to a more modest 2.8% increase last year.
Exports surpassed the $2 trillion mark for the first time, an important milestone at
a time when the US hopes to improve its balance of trade by growing exports.
For every dollar of exports last year, the U.S. had $1.20 in imports, about the
same as in 2012. This means that the U.S. continues to be a net importer of
goods and services. However, the gap between imports and exports has shrunk
over the years, falling from $786.2 billion in 2006 to $409.1 billion last year.
Over this year and next, more pronounced growth in both imports and exports is
anticipated, driven by faster growth here and abroad. Both imports and exports
will advance to new records levels, with the gap widening slightly over the next
two years.
Labor: The overall or “headline” unemployment rate fell below the seven percent
threshold in the last two months, reaching 6.6% in January 2014. This was the
lowest monthly rate since the fall of 2008, and is a noteworthy improvement
given that the unemployment rate was 7.9% a year earlier. The broader U-6
unemployment rate, which includes discouraged workers, part-time workers who
would like to work full time, and other categories of distressed workers, also fell
from 14.4% in January 2013 to 12.7% this year. However, monthly nonfarm job
growth, which is commonly cited along with the headline unemployment rate,
rose by just over 70,000 jobs in each of the last two months. By comparison, the
average for all of 2013 was 194,000 jobs per month, up 8,000 from 2012 when
the labor market experienced gains averaging 186,000 jobs per month. The
slowdown in job growth is a concern, but it is expected to be temporary and will
give way to more solid job growth later in the year.
Inflation: Inflation has been low in recent years, and is expect to remain low over
the foreseeable future. The labor market has tightened over the past year as the
unemployment rate ratcheted down, but continuing slack in the labor market will
limit wage increases, except for occupations that are in high demand. Similarly,
capacity utilization measures the share of the nation’s industrial production in
use. Recent readings have been under 79%, still below the 83% to 85% range
that corresponds to full utilization of the nation’s productive capacity. Finally,
increases in commodities prices -- determined by global market forces – have
been muted by weak global growth. This could turn around in the next couple of
years as global economic conditions improve. All in all, inflation based on the
Consumer Price Index (CPI) is expected to be 1.7% this year and 2.1% next
year, while other gauges of inflation will be similarly low.
ECONOMIC POLICY
Fiscal Policy: As a rule, fiscal policy ought to help the national economy as it
recovers from a recession, or at least exert a neutral influence. Over the last few
years, however, that objective has collided with efforts to rein in spending and
balance the budget. As a result, fiscal policy has become a drag on the economy
that has worked against gains in the private sector. Growth was hampered earlier
in 2013 by tax increases, including the restoration of the full payroll tax rate.
With economic growth
expected to be closer to
trend over the next two
years, job creation should
accelerate and pull the
unemployment rate down to
its long run average of 6.2%
sometime this year, with the
rate dropping below 6%
next year.

The U.S. Economy
LAEDC Kyser Center for Economic Research 6 Economic Forecast, February 2014
Sequestration cuts became more problematic as the year progressed, and then
the October government shutdown slowed down economic growth in the final
quarter of the year. In all, federal spending cuts reduced GDP by an estimated
0.4% last year.
With the Bipartisan Budget Act of 2013, sequestration cuts were replaced with a
smaller set of discretionary cuts this year and next. Significantly, this agreement
covers both the current 2013-14 and the upcoming 2014-15 fiscal years. Thus,
even though budget cuts will still offset private sector activity this year and next,
they will be smaller than were previously anticipated, and that will be more
predictable, thereby reducing policy uncertainty over the forecast horizon.
Monetary Policy: The Federal Reserve Bank (the Fed) has employed a two-
pronged approach to stimulating the economy since 2009. The first prong was to
reduce the federal funds rate to zero, thereby keeping short-term rates low. The
second prong was a series of bond buying programs known as Quantitative
Easing, through which the Fed has purchased long-term U.S. Treasury bonds
and mortgage backed securities in an effort to keep long rates low. As of this
writing, the Fed has reduced its purchases from $85 billion per month to $65
billion per month. Barring a dramatic and sustained slowdown in the economy,
the Fed (under its new Chair, Janet Yellen) will wind down this program over the
next several months. However, it is likely to adhere to the current short-term rate
policy until sometime next year to ensure that the economy is on a solid footing
as it moves forward.
US FORECAST AND RISKS
Private spending will continue to drive the economy forward as conditions
improve for both businesses and households. Government spending will offset
private sector growth slightly in 2014 and 2015, but will not be as much of a drag
as it was in 2013. The labor market should register gains through this year and
the next as GDP growth approaches three percent, which is roughly the long-
term growth rate of the US economy.
The downside risks to economic growth and a healthier labor market largely
reside elsewhere in the world. Slower than expected growth among U.S. trading
partners could result in a slower growth rate here. In addition, as the Fed winds
down its bond-buying program, interest rates in the U.S. will increase, possibly
triggering an emerging markets currency crisis that can potentially derail growth
in these countries. Finally, despite increases in energy self-sufficiency, a
disruption to global energy supplies, whether due to a natural disaster or a man-
made one, has the potential to increase domestic energy prices, create economic
uncertainty, and limit economic growth over the next two years.

The U.S. Economy
LAEDC Kyser Center for Economic Research 7 Economic Forecast, February 2014
Annual Average, % 2008 2009 2010 2011 2012 2013 2014f 2015f
Fed Funds Rate 1.93 0.16 0.18 0.10 0.14 0.11 0.16 0.35
10-Yr Treasury Note 3.67 3.26 3.21 2.79 1.80 2.35 3.10 3.60
30-Year Fixed Mortgage 6.04 5.04 4.69 4.46 3.66 3.98 4.80 5.20
Sources: Federal Reserve Board; forecasts by LAEDC
Annual % change except where
noted 2008 2009 2010 2011 2012 2013 2014f 2015f
Real GDP -0.3 -2.8 2.5 1.8 2.8 1.9 2.5 2.9
Nonfarm Employment -0.6 -4.4 -0.7 1.2 1.7 1.7 1.7 1.9
Unemployment Rate (%) 5.8 9.3 9.6 8.9 8.1 7.4 6.6 6.1
Consumer Price Index 3.8 -0.4 1.6 3.2 2.1 1.5 1.7 2.1
Federal Budget Balance (FY, $billions) -455 -1416 -1294 -1297 -1089 -680 -$585 -$589
Sources: BEA, BLS and CBO; forecasts by LAEDC
Table 1: U.S. Economic Indicators
Table 2: U.S. Interest Rates

The U.S. Economy
LAEDC Kyser Center for Economic Research 8 Economic Forecast, February 2014
U.S. Economic Growth
3.63.1
2.7
1.9
-0.3
-3.1
2.4
1.82.2
1.92.5
2.9
'04 '05 '06 '07 '08 09 2010 2011 2012 2013 2014f 2015f
Sources: Bureau of Economic Analysis, forecasts by LAEDC
Annual % Change
U.S. Labor Market
0.0%
2.0%
4.0%
6.0%
8.0%
10.0%
12.0%
-5.0
-4.0
-3.0
-2.0
-1.0
0.0
1.0
2.0
3.0
4.0
5.0
'02 '03 '04 '05 '06 '07 '08 '09 '10 '11 '12 '13 '14f '15f
Change in Nonfarm Employment Unemployment Rate
Sources: Bureau of Labor Statistics, forecasts by LAEDC
% Change
Consumer Inflation
-1.0%
-0.5%
0.0%
0.5%
1.0%
1.5%
2.0%
2.5%
3.0%
3.5%
4.0%
4.5%Year-Year % Change in CPI-U
Sources: Bureau of Labor Statistics; forecasts by LAEDC
-3
-2
-1
0
1
2
3
4
5
6
7
U.S. Personal Consumption
Source: Bureau of Economic Analysis
Annual % Change
10
12
14
16
18
20
22
24
26
Receipts Outlays
Federal Budget Receipts &
Outlays as Percentage of GDP
Source: Office of Management & Budget
U.S. Economic Snapshot

The U.S. Economy
LAEDC Kyser Center for Economic Research 9 Economic Forecast, February 2014
U.S. Median Household Income
1967-2012
1967: $42,934
1989: $51,681
1999: $56,080
2012: $51,017
$42,000
$44,000
$46,000
$48,000
$50,000
$52,000
$54,000
$56,000
$58,000
Source: U.S. Census Bureau
In 2012 Dollars
U.S. Mean Household Income
1967-2012
$0
$50,000
$100,000
$150,000
$200,000
$250,000
$300,000
$350,000
$400,000
Top 5%
Fourth Quintile
Highest Quintile
Lowest QuintileSecond QuintileThird Quintile
Source: U.S. Census Bureau
In 2012 Dollars by Percentile
Change in Share of Total Income in U.S.
1967-2012
Lowest Quintile
Second Quintile
Third Quintile
Fourth Quintile
Highest Quintile
Top Five Percent
-25.0%
-15.0%
-5.0%
5.0%
15.0%
25.0%
35.0%Relative to 1967 by Percentile
Source: U.S. Census Bureau
Income Growth and Inequality
Income inequality has increased dramatically in the U.S. over the last three decades. Economic growth has not translated to shared prosperity. In the aftermath of the recession, millions of people remain unemployed or underemployed, greatly exacerbating the problem. Does the growing gap between the wealthy and everyone else deserve our attention? If so, what should we do about it?
Income inequality can be socially destabilizing. It is difficult to preserve a functioning democracy if prosperity is not broadly shared. Income inequality perpetuates societal divides, erodes social mobility, and can lead to intergenerational transfer of poverty. This flies in the face of the American dream that one can advance through hard work and ingenuity. Although there are many reasons for the growing gap in income inequality, this discussion will focus on structural changes that have occurred in the labor market that favor the most highly skilled workers.
The recession may be long over, but the recovery has yet to
reach every corner of the economy. In 2012, the U.S. median
household income (adjusted for inflation) was slightly less than
it was in the late 1980s and 9% below its peak in 1999. The
“good” news is the precipitous decline that began in 2007
(before the recession) appears to be leveling out. Incomes
were basically flat in 2011 and 2012.
Note: This definition of income reflects before tax cash income
and does not account for changing tax burdens and the impact
of income sources that do not take the form of cash (e.g.
employer provided healthcare).
Declines in real income have not affected all Americans
equally. Since 1967, incomes for the lowest quintile have
grown by 19.5% and by 20.3% for the middle quintile.
Meanwhile, incomes for the highest quintile increased by
69.8% and for the top 5% of income earners by 88.2%.
Between 2007 and 2012 (recession and recovery), incomes
declined for almost all households, falling by 10.9% for the
lowest quintile, 7.5% for the middle and by 2.2% for the highest
quintile. Incomes for the top 5% were unchanged.
Another way to look at how well American households are
faring is to examine the distribution of income. This chart
shows the change in the share of income going to each
quintile. Although the bottom quintile saw its share of income
increase during the 1970s, the gains were quickly erased in the
1980s. Since then, only the highest quintile and the top 5%
have seen their share of income increase, while the share of
income going to everyone else has declined.

The U.S. Economy
LAEDC Kyser Center for Economic Research 10 Economic Forecast, February 2014
Change in Gini Index of
Inequality, for the U.S.1967-2012
0.397
0.477
0.35
0.37
0.39
0.41
0.43
0.45
0.47
0.49
Source: U.S. Census Bureau
California Family Income Growth
2007-2010
$0
$50,000
$100,000
$150,000
$200,000
$250,000
$300,000
10th Percentile
25th Percentile
Median 75th Percentile
90th Percentile
95th Percentile
2007 2008 2009 2010
Source: Public Policy Institute of California
The Gini Index is a measure of income inequality. The Gini Index varies between zero and one. A value of one indicates perfect inequality where only one household has any income. A value of zero indicates perfect equality where all households have equal income. Since 1967, the Gini Index for the United States has been rising, meaning the distribution of household income has become more unequal. In 2012, out of 136 countries the United States was the 41
st most unequal, just
ahead of Uruguay but behind the Philippines (The World Factbook, CIA). By state, in 2011, Wyoming had the most equal distribution (.4081) of household income, while New York was most unequal (.5033). Ranking fifth in terms of inequality, California (.4812) was not far behind, and above the national average.
Similar to the rest of the United States, incomes in California declined across the spectrum during the recession and inequality increased. However, compared to the rest of the nation, incomes in California declined even more at the bottom while incomes at the top declined less.
During the recession, the unemployment rate in California spiked at 12.4%, the duration of unemployment rose and many who were working, saw their hours cut or could only find part-time work. Recent research suggests that underemployment as opposed to declining wages was the primary cause for the decline in incomes during and after the recession. Additionally, the slow recovery has limited demand for labor and suppressed wage growth. Thus, policies that promote job creation and especially full-time employment may be a more effective tool for raising incomes than focusing on wage rates.
Over the longer term, the trend of growing inequality is in part the result of structural changes in the labor market that have favored the most highly skilled workers over everyone else. A second, related trend, is the polarization of job opportunities. Job opportunities in high-skill high-wage occupations are expanding at one end, while jobs in low-skill low-wage occupations are expanding at the other end. Opportunities for middle-skill workers have diminished, pushing many former white-collar workers into lower-paying service jobs.
Since the mid-1970s, individuals with the highest levels of education (more than 16 years) have experienced a steady increase in wages. Persons with a bachelor’s degree or some college are also earning more, but nowhere near their counterparts with an advanced degree. On the other hand, individuals with a high school diploma or less suffered a decline in real wages in the 70s and 80s; wages rebounded slightly in the 90s but have been stagnant ever since.
This suggests the most relevant issue for public policy is the growing gap between individuals with high skill levels and the rest of the population. To close that gap we need policies that focus on the disparities across education and skills, and on ways to upgrade the earnings capacity of the majority of Americans.
A particularly alarming symptom of the income gap is the growing fissure in educational achievement as measured by math and reading test scores. While the racial gap has declined, the differences in performance between high and low-income students are widening. Kids at the top have advantages that are simply out of reach for kids at the bottom. Disadvantaged children are reaching college without the skills to persevere and graduate – the result is a growing gap in college completion.
There are a number of policies needed to address these problems. Reforms to the tax code or increases in the minimum wage may be part of the solution, but the nation also needs polices that promote education and skills acquisition across the broadest possible section of the population. This issue goes beyond questions of fairness, right and wrong. The ability of the United States to compete and prosper in a global economy depends on its willingness to make investments that will enable all Americans to have the education and skills necessary to compete in the global labor market.

The International Economy
LAEDC Kyser Center for Economic Research 11 Economic Forecast, February 2014
THE INTERNATIONAL ECONOMY
The Southern California regional economy is linked to the global economy
through international trade, foreign direct investment, tourism, movies, and
education. The region’s goods, services, academic institutions, human capital
and weather are in high demand the world over. This makes it essential to
monitor the developments of both its top trading partners (particularly export
markets) and top sources of FDI. 1
KEY DEVELOPMENTS OF 2013
The key developments of 2013 centered on China, Japan, Europe, and the
emerging economies. First, as was expected, the Chinese economy continued to
slow down in 2013. This had a negative effect on global growth and global trade
flows. But even with the slowdown, China grew in the 7% plus range rather than
the experiencing a hard landing with growth under 5% as some anticipated.
Second, the other key development of 2013 was related to the Japanese
economy. Yes, inflation is back in Japan and “Abenomics” is working. Prime
Minister Shinzo Abe’s government has effectively implemented expansionary
(providing stimulus) fiscal and monetary policies that have provided the desired
outcomes.
Third, the euro zone finally came out of a long and deep recession during the
second half of 2013. This was a major relief for the global economy and it
propelled stronger growth for most economies mentioned in this section as the
euro zone is the largest economy in the world. However, for the year, the euro
zone still contracted by 0.4%.
Finally, the possibility of the Fed tapering its QE3 program sent shock waves
throughout the international economy at the end of May 2013 and in June 2013,
particularly in the emerging markets. The emerging markets that were most
affected were India, Turkey, Indonesia, Brazil and South Africa. These
economies experienced an immediate, significant capital outflow, which resulted
in negative shocks to their currency, stock and bond markets. Unfortunately, and
most recently (end of January and into February) this situation has returned in
2014 and it has once again rattled the global markets/economy. As a result, this
will be the most important issue to focus on in the short term.
China, Europe, Japan along with the U.S. (the four largest economies in the
world) will largely determine the direction of the global economy through the rest
of this year and into 2015. The good news is that the advanced economies
overall will perform more strongly and contribute more to global growth in 2014.
1 Please reference the LAEDC’s series of Growing Together country reports for further
information: http://laedc.org/economic-research-analysis/laedc-reports/

The International Economy
LAEDC Kyser Center for Economic Research 12 Economic Forecast, February 2014
However, the bad news is that most (not all) of the emerging economies are not
performing well and for the first time since the Great Recession they will be
contributing less to global growth.
Outlook for 2014-2015
China, Japan, South Korea and Taiwan are our top four trading partners,
representing more than 75% of total container volume through the ports of Los
Angeles and Long Beach. China actually represents nearly 60% of two-way trade
flows just by itself. Adding in the ASEAN-5 nations, roughly 90% of all trade that
takes place at the San Pedro Bay ports results from China, Japan, South Korea,
Taiwan, Thailand, Vietnam, Indonesia, Malaysia and the Philippines – meaning
Northeast and Southeast Asia. In addition, many of these nations are the Los
Angeles Metro Area’s top export markets and largest sources of FDI into Los
Angeles County. Finally, Canada and Mexico are also closely connected to our
regional economy. This section will provide an outlook for these 11 economies
and pay special attention to the Chinese, Japanese, Korean, Taiwanese,
Canadian and Mexican economies as they will have the greatest impact on our
regional economy.
China: China is the Los Angeles Customs District’s (LACD) #1 trading partner
and the Los Angeles Metropolitan Area’s #3 export market. In addition, China is
one of the largest sources of FDI into Los Angeles County. In fact, Chinese
investment has grown substantially in the past couple of years. The growth
potential for Chinese investment into our region is enormous. China’s continued
economic rise will only benefit Southern California’s goods and services exports
and investment attraction leading to the creation of thousands of jobs and billions
in capital flows.
The Chinese economy continued to slowdown in 2013, particularly over the first
half of 2013. There was a slight improvement over the second half of 2013, which
was encouraging. Growth was strongest in the third quarter of 2013 as it reached
7.8%. However, the Chinese economy has disappointed lately with weaker
economic data over the past couple of months. Naturally, this is a big concern for
the global economy and will ultimately go a long way in determining what actually
happens to global growth in 2014.
The Chinese economy is expected to grow by 7.0% to 7.5% in 2014. As growth
accelerates in Europe and the U.S. in 2014 (which will propel exports), and with
continued infrastructure investment in the inland areas along with economic
reforms, China should avoid growth below 7%. However, as the Chinese
government relies less on growth from fixed investments the economy will
continue to weaken. As a result, the Chinese economy will witness growth in the
7% range in 2015.
Japan: Japan is Los Angeles County’s #1 source of foreign direct investment. In
addition, it is the LACD’s #2 trading partner and the Los Angeles Metropolitan
Area’s #4 export market. The Japanese economy performed relatively well in
2013 as a direct result of expansionary fiscal and monetary policies. The first half
of 2013 witnessed the strongest growth due to the fiscal and monetary policies
The International Economy
LAEDC Kyser Center for Economic Research 13 Economic Forecast, February 2014
put in place at the end of 2012 and the beginning of 2013. Expansionary
monetary policy has led to a substantial drop in the value of the yen, falling by
nearly 30% over the past year vis-à-vis the U.S. Dollar. Of course, this has
translated into a strong resurgence of Japanese exports, including to the U.S.
and the Los Angeles Customs District.
The economic policies of Prime Minister Shinzo Abe (nicknamed “Abenomics”)
are based on three fundamental pillars. These three pillars include government
spending, increasing the money supply and structural reforms. The first two
pillars have been implemented but the third has been postponed until June 2014.
The 10.3 trillion yen fiscal stimulus package along with the bold plan by the Bank
of Japan to double the one percent inflation target to two percent through
accommodative monetary policy and additional asset purchases, has had the
expected positive impact on economic growth. However, this should lead to
growth only in the 1% to 1.5% range in both 2014 and 2015 as consumer
spending will be constrained by an increase in the value-added tax (sales tax)
from 5% to 8% in April.
South Korea: After experiencing the slowest growth rate in three years in 2012,
the Korean economy grew by close to 3% in 2013. Korea’s three main growth
engines (exports, corporate investment, and domestic demand) all recovered in
2013. The strongest economic growth in Korea took place in the third quarter of
2013 as construction and manufacturing led the way. In addition, consumer
spending and exports were relatively healthy. Exports, which represent roughly
50% of Korea’s GDP performed well in 2013, particularly over the first half of last
year. Growth slowed a bit in the second half of 2013 due to a decline in Chinese
demand and the strengthening of the Korean Won vis-à-vis the Japanese Yen.
The South Korean export and economic outlook for 2014 and 2015 will mainly
depend upon the global economic environment, especially developments in
China, Europe, and the U.S., all of which are significant destinations for Korean
exports. The good news is that both Europe and the U.S. will experience more
robust growth in 2014. Moreover, over time, Korea will benefit from free trade
agreements with Europe and the U.S. Since Japan and South Korea export
similar goods to Europe and the U.S., the relative strength of the Korean Won
vis-à-vis the Japanese Yen has weakened export demand in both Europe and
the U.S. as Japanese goods have become relatively cheaper. However, the
benefits of the free trade agreements have negated some of those losses as the
lowering or elimination of tariffs has made Korean goods more affordable for
European and American consumers.
Based on expectations of an improvement in export growth and higher
government spending along with higher corporate investment, the Korean
economy is expected to expand by 3.5% to 4.0% in 2014 and by 4.0% in 2015.
Canada: Canada is the Los Angeles Metropolitan Area’s largest export market
and Los Angeles County’s fifth largest source of foreign direct investment (FDI).
Like the U.S., the Canadian economy witnessed sub-par growth over the past
couple of years, which is not surprising considering the fact that Canada’s
economy depends heavily upon exports, roughly 75% to 80% of which go to the
U.S. In the same vein, acceleration in the U.S. economy should benefit Canada’s
economy in 2014. The Canadian economy has also become more connected to
The International Economy
LAEDC Kyser Center for Economic Research 14 Economic Forecast, February 2014
the Chinese economy mainly due to commodity exports. The fall in commodity
prices (particularly petroleum prices) has negatively impacted the economy over
the past two years.
Canada’s GDP grew by roughly 1.7% in 2013 as weakness in housing and
consumer spending along with tepid export growth prevented any further
expansion. A weaker Canadian Dollar, U.S. GDP growth along the lines of 3%,
and a stronger global economy will bode well for Canada in 2014 and 2015.
Canada will witness an increase in exports in 2014 and most likely a jump in
business investment. These factors along with household consumption will go a
long way in determining whether Canada can get over the hump and begin to
push for growth in the 2.5% range.
The Canadian economy is expected to expand in the range of 2.0% to 2.5% in
2014 and to experience stronger growth of 2.5% or higher in 2015. This all
depends upon what happens in the U.S., commodity prices, domestic
consumption and the household debt situation.
Mexico: Mexico is the Los Angeles Metropolitan Area’s second largest export
market after Canada, and one of Los Angeles County’s largest sources of FDI.
Similar to the Canadian economy, the Mexican economy is heavily dependent
upon U.S. demand as nearly 80% of its manufactured exports (goods) go to the
U.S. As a result, the strength of U.S. economy directly influences Mexico’s
growth potential. However, in recent years, Mexico’s economy has undergone a
transformation, becoming more diversified, while relying less on external demand
and more on domestic demand. This transformation allowed Mexico to grow by
close to 4% going into 2013, but that trend did not continue due to a decline in
construction and a reduction in government spending. A slight slowdown in
exports to the U.S. made the situation even worse.
The big story out of Mexico in 2013 was related to the economic reforms that the
President Nieto-led government has accomplished. Back at the end of 2012, the
new Mexican government embarked on an aggressive reform agenda that
targeted energy, education, fiscal policy and social security. Monumental reforms
were passed that will come into effect in 2014 and 2015, the most significant of
which was to open both the oil and gas industries to foreign investment. If
successful, these reforms can potentially transform the Mexican economy on
many levels, and spur long run growth reaching 6% according to the
Organization of Economic Co-operation and Development.
The Mexican economy should grow by roughly 3.0% in 2014 and by 3.5% in
2015 as exports, government spending, and investment face an improved
environment, and as the U.S. economy strengthens. As mentioned above,
Mexico has substantial long-run potential and will become one of the ten largest
economies in the world by 2030.
Taiwan: Taiwan is the LACD’s fourth largest trading partner and one of Los
Angeles County’s top 10 sources of FDI. Similar to South Korea and Thailand,
Taiwan heavily depends upon external demand, with roughly 70% of Taiwan’s
GDP related to exports, mainly to China. It is more interconnected to the Chinese
economy than any other nation in the world. The slowdown in China, along with
the recession in Europe, weakened the economy over the past couple of years,

The International Economy
LAEDC Kyser Center for Economic Research 15 Economic Forecast, February 2014
prompting the Taiwanese government to intervene by implementing both
expansionary monetary and fiscal policies. The Taiwanese economy expanded
by 2.2% in 2013 as exports decelerated for most of the year. The LAEDC
expects Taiwan to come back strongly over the next couple of years by growing
close to 4% in 2014 and 2015.
ASEAN-5: The Association of Southeast Asian Nations (ASEAN-5) is a group of
five economies that includes Thailand, Vietnam, Indonesia, Malaysia, and the
Philippines. All of these countries fall into the top ten trading partners of the
LACD. Thailand’s (our fifth largest trading partner) economy was the worst
performing of the five economies mainly due to a slowdown in exports and
political protests. Its economy is heavily dependent upon exports (70% to 75% of
GDP), which was a key issue over the past couple of years. However, with faster
growth expected around the globe, this will actually benefit the Thai economy
over the next couple of years as Thailand’s GDP is projected to increase by
roughly 5.0% in 2014 and 2015. All of the ASEAN-5 economies are expected to
experience at least 5% GDP growth in both 2014 and 2015.
KEY RISKS FOR 2014-2015 AND CONCLUSIONS
The key risks for the global economy include China and other emerging markets
and the situation in the Middle East and North Africa. The developing nations of
Asia are expected to experience a higher rate of growth next year, provided
China remains in the 7.0% to 7.5% growth range. Demand from the advanced
economies will also be stronger this year and next, especially in Europe.
According to the latest IMF World Economic Outlook (WEO) update published in
January 2014, the global economy is expected to grow by 3.7% in 2014 and
3.9% in 2015 after experiencing growth of 3.0% in 2013.
FOREIGN EXCHANGE RATES
The biggest currency story in 2013 was related to the Japanese Yen. The current
Japanese government implemented new expansionary economic policies upon
assuming power in late 2012, which, among other things, resulted in yen falling
from 77/dollar in late 2012 to 100/dollar by the end of 2013. This had a
substantial impact on currency markets, international trade, corporate earnings,
and foreign direct investment. Japanese exports greatly benefitted from a weaker
yen. Japanese corporations with operations abroad have also profited from this
development. On the flip side, this does not bode well for Southern California’s
ability to attract foreign direct investment from Japan. However, Japanese
companies are very keen on investing abroad in order to find new markets and
revenues to offset slowing domestic markets as the Japanese population ages. It
remains to be seen how much of an impact this will have on two-way trade flows
between the LACD and Japan in 2014 and in 2015.
In 2013, the U.S. Dollar appreciated vis-à-vis the Japanese Yen, the Canadian
Dollar, and the Brazilian Real. However, the U.S. Dollar depreciated or
weakened vis-à-vis the Chinese Yuan, the euro, the British Pound and the
Korean Won. The U.S. Dollar remained relative stable vis-à-vis the Taiwanese
Dollar. Amongst the Los Angeles Customs District’s top five trading partners and
the Los Angeles Metropolitan Area’s top five export markets, the U.S. Dollar
The Fed’s announcement
in mid-2013 that it would
start tapering at some point
in the future rattled global
financial markets. In fact,
immediately afterwards,
many emerging markets
began to see their
currencies weaken
dramatically.
The International Economy
LAEDC Kyser Center for Economic Research 16 Economic Forecast, February 2014
depreciated slightly vis-à-vis the Chinese Yuan, the Korean Won, the Mexican
Peso and the Thai Baht. The U.S. Dollar weakened versus the euro as the
European debt situation remained stable over the year. The U.S. Dollar would
strengthen if the debt crisis resurfaced and deteriorated or if something were to
trigger an increase in oil prices.
The Fed’s tapering of bond purchases began in late 2013 and should be
completed by the by the fourth quarter of this year. This is the key currency news
story of 2014 as it will put upward pressure on the greenback in the coming
months. Declining commodity prices, mainly due to the slowdown in China and
in other key emerging economies, has put additional upward pressure on the
U.S. dollar (as most key commodities are priced in U.S. Dollars).
The International Economy
LAEDC Kyser Center for Economic Research 17 Economic Forecast, February 2014
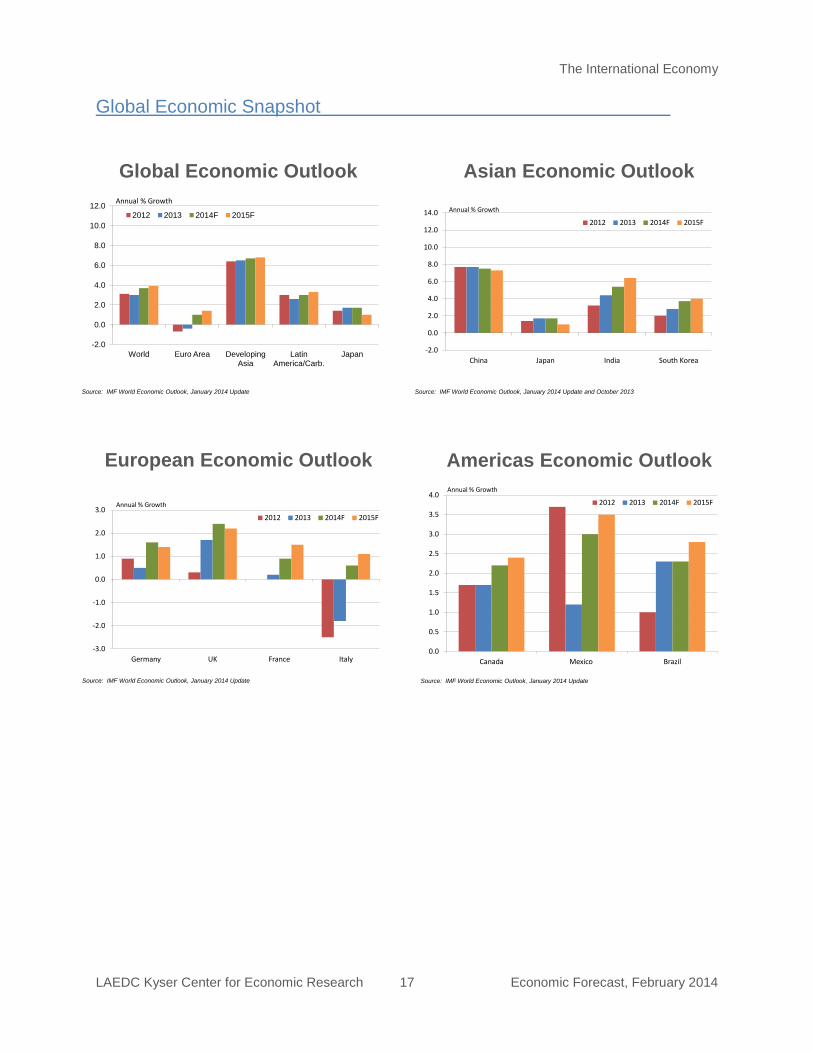
Global Economic Outlook
-2.0
0.0
2.0
4.0
6.0
8.0
10.0
12.0
World Euro Area Developing Asia
Latin America/Carb.
Japan
2012 2013 2014F 2015F
Annual % Growth
Source: IMF World Economic Outlook, January 2014 Update
European Economic Outlook
-3.0
-2.0
-1.0
0.0
1.0
2.0
3.0
Germany UK France Italy
2012 2013 2014F 2015F
Annual % Growth
Source: IMF World Economic Outlook, January 2014 Update
Americas Economic Outlook
0.0
0.5
1.0
1.5
2.0
2.5
3.0
3.5
4.0
Canada Mexico Brazil
2012 2013 2014F 2015F
Annual % Growth
Source: IMF World Economic Outlook, January 2014 Update
Asian Economic Outlook
-2.0
0.0
2.0
4.0
6.0
8.0
10.0
12.0
14.0
China Japan India South Korea
2012 2013 2014F 2015F
Annual % Growth
Source: IMF World Economic Outlook, January 2014 Update and October 2013
Global Economic Snapshot
The International Economy
LAEDC Kyser Center for Economic Research 18 Economic Forecast, February 2014
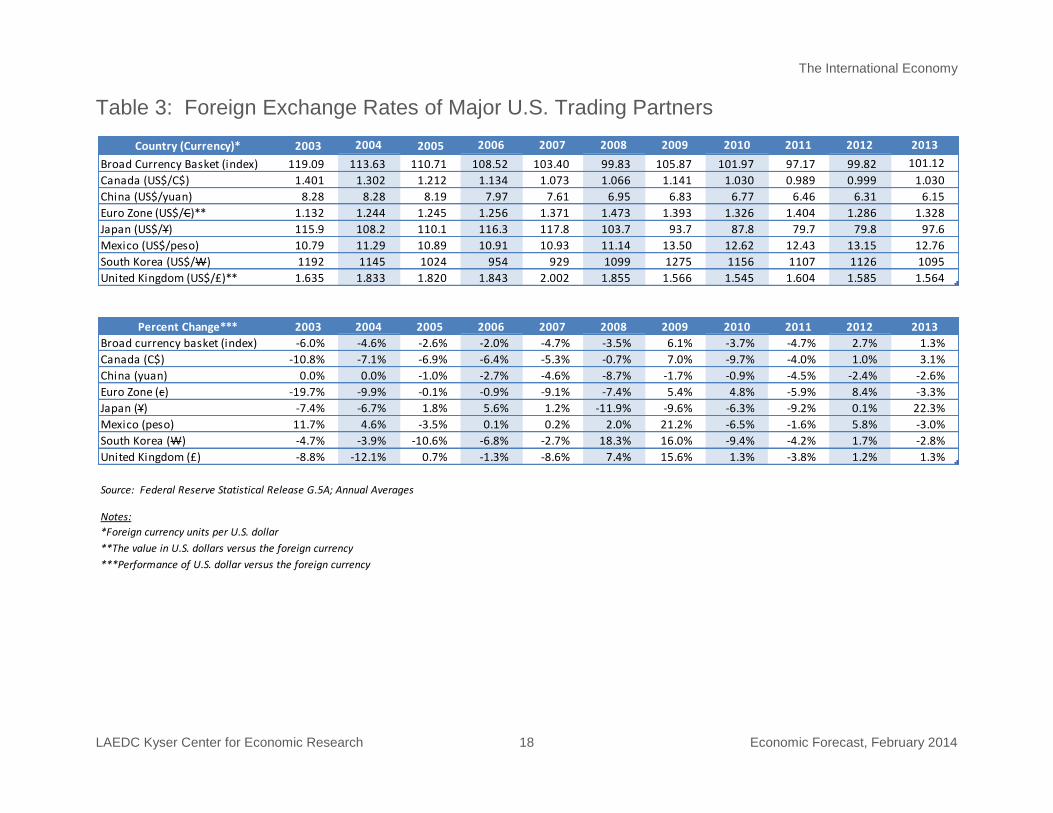
Country (Currency)* 2003 2004 2005 2006 2007 2008 2009 2010 2011 2012 2013
Broad Currency Basket (index) 119.09 113.63 110.71 108.52 103.40 99.83 105.87 101.97 97.17 99.82 101.12
Canada (US$/C$) 1.401 1.302 1.212 1.134 1.073 1.066 1.141 1.030 0.989 0.999 1.030
China (US$/yuan) 8.28 8.28 8.19 7.97 7.61 6.95 6.83 6.77 6.46 6.31 6.15
Euro Zone (US$/C)** 1.132 1.244 1.245 1.256 1.371 1.473 1.393 1.326 1.404 1.286 1.328
Japan (US$/Y) 115.9 108.2 110.1 116.3 117.8 103.7 93.7 87.8 79.7 79.8 97.6
Mexico (US$/peso) 10.79 11.29 10.89 10.91 10.93 11.14 13.50 12.62 12.43 13.15 12.76
South Korea (US$/W) 1192 1145 1024 954 929 1099 1275 1156 1107 1126 1095
United Kingdom (US$/£)** 1.635 1.833 1.820 1.843 2.002 1.855 1.566 1.545 1.604 1.585 1.564
Percent Change*** 2003 2004 2005 2006 2007 2008 2009 2010 2011 2012 2013
Broad currency basket (index) -6.0% -4.6% -2.6% -2.0% -4.7% -3.5% 6.1% -3.7% -4.7% 2.7% 1.3%
Canada (C$) -10.8% -7.1% -6.9% -6.4% -5.3% -0.7% 7.0% -9.7% -4.0% 1.0% 3.1%
China (yuan) 0.0% 0.0% -1.0% -2.7% -4.6% -8.7% -1.7% -0.9% -4.5% -2.4% -2.6%
Euro Zone (c) -19.7% -9.9% -0.1% -0.9% -9.1% -7.4% 5.4% 4.8% -5.9% 8.4% -3.3%
Japan (Y) -7.4% -6.7% 1.8% 5.6% 1.2% -11.9% -9.6% -6.3% -9.2% 0.1% 22.3%
Mexico (peso) 11.7% 4.6% -3.5% 0.1% 0.2% 2.0% 21.2% -6.5% -1.6% 5.8% -3.0%
South Korea (W) -4.7% -3.9% -10.6% -6.8% -2.7% 18.3% 16.0% -9.4% -4.2% 1.7% -2.8%
United Kingdom (£) -8.8% -12.1% 0.7% -1.3% -8.6% 7.4% 15.6% 1.3% -3.8% 1.2% 1.3%
Source: Federal Reserve Statistical Release G.5A; Annual Averages
Notes:
*Foreign currency units per U.S. dollar
**The value in U.S. dollars versus the foreign currency
***Performance of U.S. dollar versus the foreign currency
Table 3: Foreign Exchange Rates of Major U.S. Trading Partners
The California Economy
LAEDC Kyser Center for Economic Research 19 Economic Forecast, February 2014
THE CALIFORNIA ECONOMY
INTRODUCTION
California is back on track to reclaim its status as the Golden State. The steep
decline of the California economy during the recession was exacerbated by
seemingly intractable fiscal challenges that began well before the downturn.
Now, after nearly five years of recovery, California is on a more solid footing.
Although the recovery continues to be very slow, the unemployment rate is
falling, more people are finding jobs, the housing market is improving and for the
first time in years, budget surpluses are in sight.
California lost more than 1.3 million jobs between December 2007 and January
2010. By the close of 2013, California had recovered nearly 70% of the jobs lost
in the state during the recession. Nonfarm payrolls increased in California by
1.7% in 2013, a rate slightly faster than the nation as a whole (1.6%). This pared
the state’s unemployment rate from 10.5% in 2012 to 8.9% in 2013. California
should continue to add jobs at an annual growth rate of 1.8% (261,800 jobs)
through this year, increasing to 2.1% in 2015.
Regionally, the recovery is advancing in nearly every part of the state. From the
earliest stages of the recovery, the Bay Area and the Silicon Valley have led the
state economy with lower unemployment rates and, since 2011, year-over-year
job gains averaging about 3.0%. While the Central and Imperial valleys continue
to lag behind the rest of the state, the counties of Southern California have
experienced moderate job growth with corresponding declines in unemployment
rates.
Orange and San Diego counties were the job growth leaders in Southern
California in 2013, averaging year-over-year nonfarm job gains of 2.1% and 1.8%
respectively. Los Angeles and Ventura counties were not far behind at 1.7%,
while in the Inland Empire nonfarm payrolls increased by 1.2%. Although
unemployment rates have declined throughout Southern California, Orange
County was at the front of the pack in 2013 with an unemployment rate of 6.1%
(the long-run average for Orange County is 4.4%).
TRENDS IN MAJOR INDUSTRIES
Aerospace and Technology
California’s technology sector is diverse and includes manufacturing and service
industries in aerospace, information technology and biomedical technology. This
collection of industries makes up the core of the state’s information, knowledge,
and innovation economy. Aerospace and technology employment is mostly
concentrated in Los Angeles and Orange counties, San Diego County and the
Silicon Valley.
Average monthly employment in California’s technology sector in 2013 was 1.03
million workers, an increase of 23,400 or 2.3% compared with 2012. The biggest
California should continue to
add jobs at an annual growth
rate of 1.8% in 2014,
increasing to 2.1% in 2015.
The California Economy
LAEDC Kyser Center for Economic Research 20 Economic Forecast, February 2014
gains were in management, scientific and technical consulting (16,800 jobs) and
computer systems and design (4,600 jobs), with smaller increases in
pharmaceutical and medicine manufacturing, software publishing, and data
processing. Electronic product manufacturing was flat while aerospace product
and parts manufacturing and scientific R&D services were down marginally. The
aerospace and technology industries are strategically important to California for
the revenue and wealth they create, their high levels of employment and
compensation, and for the exports and tax revenues they generate.
Agriculture
The agriculture industry accounts for about 1.3% of gross state product and
employed 397,100 workers last year, which is equivalent to just over 2.3% of
total civilian employment in the state. Employment rose by 3.1% in 2013
compared with a year earlier. Agricultural and related products are also one of
California’s largest exports to the rest of the world. Cash receipts for all
commodities grew by 3.2% from $43.3 billion in 2011 to a record high of $44.7
billion in 2012. Crop receipts rose by 5.2% to $32.6 billion, while livestock
receipts fell by 1.7% to $12.2 billion. California ranked first among the 50 states
in terms of net farm income at $16.0 billion, based on 2012 data (latest
available).
Health Care
The health care industry in California has been a steady source of employment,
adding jobs even during the recession, with year-over-year gains averaging 2.1%
from 2009 through the first half of 2013. During the second half of 2013,
however, the rate of job growth weakened to 1.7%. Doctors’ offices and
outpatient facilities, which account for about 45% of California health care
employment, experienced the most sizable slow down – from an average of 3.2%
to 1.7%. The pace of hiring at hospitals also slowed, while hiring at nursing
homes and residential care facilities remained constant.
The slowdown in hiring comes as the industry faces significant cost pressures
that have forced health care providers to rein in operating costs. Under the
federal government’s sequestration, nearly all Medicare payments to providers
have been put at risk of a 2% annual cut. The Affordable Care Act also puts new
limits on Medicare reimbursements to providers.
In the long-term, health care employment in California will increase as its
population grows and as the ranks of Baby Boom retirees expand. However, the
industry has some obstacles to overcome that will affect employment – namely
actual and anticipated changes in reimbursements to providers. That said, many
parts of the health care industry will continue to see robust job growth.
Outpatient and home health care employment should see strong gains this year,
partially offsetting weaker hiring at hospitals.
International Trade
International trade is a pillar of the state’s economy. A large share (about 40%)
of the nation’s consumer goods that are produced in Asia transit through
Average monthly employment
in California’s technology
sector in 2013 was 1.03
million workers, an increase of
23,400 or 2.3% compared
with 2012.

The California Economy
LAEDC Kyser Center for Economic Research 21 Economic Forecast, February 2014
California’s ports, while California ranks as the second largest goods exporting
state in the country. California’s largest exports are computer products,
transportation equipment (mainly aerospace-related), machinery, chemicals
(pharmaceuticals), and agriculture. Imports outweigh exports by a two-to-one
margin.
Statewide two-way trade was $596.4 billion last year, a new annual record.
However, growth slowed to a 3.1% gain in 2013 compared with a 3.5% increase
in 2012 and double digit percentage increases in 2010 and 2011 as the economy
dug out of the Great Recession. Below-par two percent GDP growth in the U.S.
constrained imports while economic weakness among U.S. trading partners led
to muted gains in exports. Two-way trade for 2014 is expected to grow by about
4.6%, with a 7.0% increase anticipated for 2015.
Tourism
The tourism and hospitality industry is yet another pillar of California’s economy.
Visitations were up by an estimated 2.4% in 2013 and are expected to increase
by an additional 2.3% in 2014, with leisure travel growing at a faster rate than
business travel. Visitors to California also spent more money last year, pumping
approximately $112.8 billion into the state’s economy. This was up by 5.7%
compared with 2012, and is expected to increase by 5.9% to $119.4 billion in
2014.2 Moreover, overnight travel is growing at a faster pace as the improving
economy encourages longer distance travel and more willingness to spend.
Rising demand for hotel rooms has led to an increase in both occupancy rates
and average daily room rates in all of California’s major metropolitan areas.
Similarly, leisure and hospitality jobs climbed by 4.3% from nearly 1.6 million in
2012 to 1.7 million last year. Rising by 4.5%, payrolls grew the fastest at
restaurants and bars, which make up about 70% of all leisure and hospitality
employment.
Construction
Construction activity and employment both experienced noteworthy gains in 2013
after struggling to find traction for several years. Nonresidential construction
permits are projected to increase by 4.1% this year and by 5.4% next year. New
office construction continues to lag, but industrial construction has made robust
gains, especially in the technology, energy and distribution sectors. New home
permits are likewise expected to show significant gains of 41.4% in 2014 and
35.0% next year, although the year-over comparisons are still coming up from a
very low base.
As for employment, construction was one of the hardest hit sectors during the
recession with the number of jobs falling from a peak of 933,700 in 2006 to a low
2 VisitCalifornia.com; California Travel & Tourism Outlook, 2013 (Tourism Economics)
Visitors to California spent
more money last year (5.7%),
pumping approximately
$112.8 billion into the state’s
economy.
The California Economy
LAEDC Kyser Center for Economic Research 22 Economic Forecast, February 2014
of 559,800 in 2010, a loss of 373,900 jobs or 40% of total construction
employment. Although construction payrolls expanded modestly in 2011 and
2012, expansion gained momentum last year as the housing recovery took off.
Construction jobs increased at a rate of 5.3% compared with 2012, rising to
620,200 jobs. Even so, employment is still nearly 34% below peak levels.
LOOKING AHEAD
California’s recovery is good news for the rest of the country due to the sheer
size of the state’s economy. Looking ahead to the next two years, California’s
economy is projected to grow by 2.8% (versus 2.7 % for the nation) in 2014 and
by 3.5% in 2015. During the second half of the decade, the expansion of
California’s Gross State Product should match or exceed the nation’s growth
rate. Nonfarm employment gains are expected to increase at an annual rate of
about 1.7% throughout the same period. California’s strongest sectors will
continue to be technology, tourism, and exports, but virtually all private sector
industries will add jobs this year and next.
One of the most important elements of California’s recovery is the improving
fiscal outlook. Surpluses are in sight and budgets are being passed on time –
three years in a row for the first time in 30 years. Under current policies, a $5.6
billion surplus is projected by the end of the 2014-2015 fiscal year. Of course,
achieving budget surpluses will depend on continuing economic growth in
California and restrained spending. So far this fiscal year (2013-2014), revenues
are beating expectations. This is primarily due to higher personal income tax
receipts, particularly receipts resulting from capital gains - a very volatile source
of revenues, hence the push by the Governor to start shoring up the state’s rainy
day fund.
In spite of a more positive outlook for California’s economy, a number of risks are
lurking on the not-so-distant horizon. The first of these is the state budget. The
state still needs a more stable source of revenue. Furthermore, projected
surpluses are too small to do much more than chip away at the state’s debt and
little progress has been made in tackling unfunded public pension liabilities.
Higher electricity costs resulting from the state’s mandate to obtain 33% of
electricity from renewable resources by 2020 could put California at a
disadvantage just as other states are benefiting from low natural gas prices.
Rising health care costs, the lack of immigration reform, domestic out-migration
and California’s perennial water problems (see page 23) all represent additional
risks to the state economy. California’s economic vitality stems from many
assets: abundant natural resources, creative people, a strong entrepreneurial
tradition, world-class higher education institutions, leading edge technologies,
and connections to global market. California will continue to build upon this base,
expanding on the gains made in 2013 as the state returns to full economic
health.
California’s economy is
projected to grow by 2.8%
in 2014 and by 3.5% in
2015. The expansion of
California’s Gross State
Product should match or
exceed the nation’s
growth rate into the
second half of the decade.

The California Economy
LAEDC Kyser Center for Economic Research 23 Economic Forecast, February 2014
The Future of Water in California
On January 17, 2014, Governor Brown issued an official drought proclamation for California. Last year was the driest in the state in 199 years of record keeping. Some communities that depend on local surface supplies are already rationing water. The situation is far less dire in Southern California. Water managers in the region say water reserves are sufficient to last through 2014 and possibly into 2015 without rationing. Southern California aggressively embraced water conservation and recycling following the droughts of the 1970s and 1990s. The region has also invested in new reservoirs and ground water banks. Although Southern California’s residents and businesses have drastically reduced per capita water consumption, the region’s growing population means demand for water will continue to increase.
Southern California has two major sources of imported water. One, the Colorado River is in the midst of the longest dry cycle in recorded history. The other source is the network of reservoirs in the northern part of the state, where water levels are well below average and dropping. It is likely Southern California will receive very little water from Northern California this year. More conservation and recycling will help the region keep pace with growth and reduce reliance on imported water, but such measures are only part of the solution.
On January 14, 2014, the California Natural Resource Agency released the Bay Delta Conservation Plan (BDCP). The BDCP is a $25 billion project that calls for the construction of two water diversion tunnels (40 feet in diameter and 35 miles long) that would channel water from the Sacramento River under the delta. The goal of the project is to stabilize water supplies and improve wildlife habitat. The tunnels will cost approximately $15 billion to build and will be funded by water agencies benefiting from the project. Taxpayers will fund the remaining $10 billion for habitat restoration.
There are a number of things the plan does not address and leaves to future political action. For
example, details of how the project will be financed and how much water the tunnels will divert are not stated in the plan. Additionally, communities adjacent to the proposed tunnel route are concerned about the negative impacts on their economies resulting from the decade-long construction process. The DBCP also acknowledges the plan would have permanent effects on scenery and tourism, while habitat restoration will remove an estimated 5,600 acres of farmland from production.
California’s variable climate is punctuated with long droughts and severe floods. The state’s current system of water storage and conveyance facilities is aging, vulnerable to earthquakes and inadequate to face the challenges of climate change. Moreover, conflicts between water for human use and water needed for fish and wildlife are becoming more intense. Whether the BDCP goes ahead or not, California’s water infrastructure urgently needs to be expanded and modernized.
The state’s industrial and agricultural jobs base depends on reliable and affordable water supplies. The quality of life for the state’s residents is also inextricably linked to water. Economic growth and the future prosperity of California depend on investing in secure, reliable and affordable water supplies that also protects fragile ecosystems.
For more information regarding the Delta Bay Conservation Plan, go to the California Natural Resources Agency at www.resources.ca.gov
Water infrastructure is critical to
California’s economy. The state’s industrial
and agricultural jobs base depends on
reliable and affordable water supplies.

The California Economy
LAEDC Kyser Center for Economic Research 24 Economic Forecast, February 2014
GROSS PRODUCT COMPARISONS
The state of California is the most populous in the U.S. and has one of largest
economies in the world. Likewise, Southern California and Los Angeles County
also have two of the largest economies in the world. In fact, Los Angeles County,
which has the largest population and economy of any county in the U.S., would
actually be the 21st largest if it were a country in its own right.
Based on 2013 estimated figures, California just barely surpassed Italy to
become the ninth largest economy in the world. The Los Angeles five-county
region retained its 16th place, ranking behind South Korea and Los Angeles
County remained in 21st place. Los Angeles County is behind Saudi Arabia and
Switzerland, and ahead of Sweden, Norway, Poland, Belgium and Taiwan.
For the second consecutive, year India and Canada swapped rankings as
Canada moved from #11 to #10. Other notable developments include Iran
dropping out of the top 25 rankings in 2013 due to the crippling economic
sanctions and the weakening of its currency. As a result, Sweden, Norway,
Poland and Belgium all moved up one spot. Finally, Taiwan entered into the top
25 rankings.
By and large, emerging and developing economies have been experiencing
larger growth rates than developed economies over the past few years. For
example, China and other emerging markets saw GDP growth in the high single
digits, while the U.S. and the European economies grew by small single digits.
Both California and Los Angeles County grew at rates that were closer to that of
the U.S. rather than that of China or other emerging economies.
As has been the case for the last few years, the weakest performing economies
were in the euro zone. So what should we look for in 2014? California could
surpass Russia to become the eighth largest economy in the world. Mexico
should surpass Spain as the 13th largest economy in the world, while South
Korea will close in on Spain. Also, look for Indonesia to approach the $1 trillion
mark and keep a close eye on Saudi Arabia (which will ultimately depend upon
oil production and prices) as it could surpass the Netherlands.
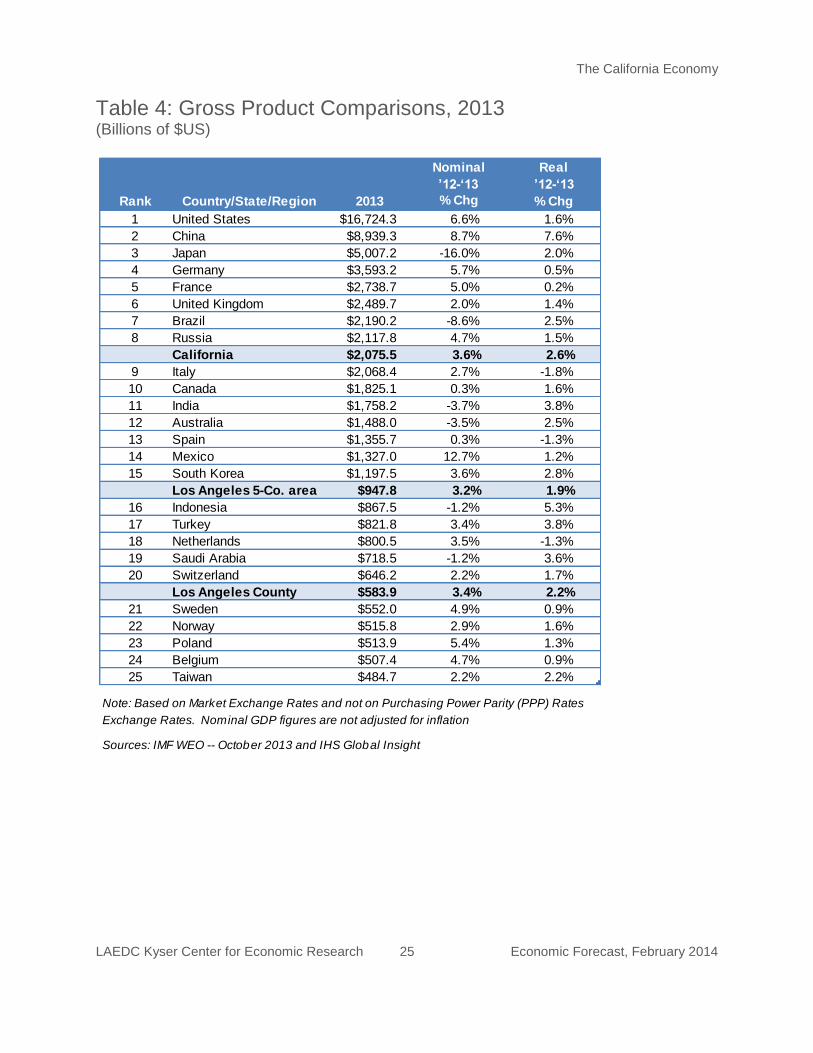
The California Economy
LAEDC Kyser Center for Economic Research 25 Economic Forecast, February 2014
Column1 Column2 Column3 Nominal Real
’12-‘13 ’12-‘13
Rank Country/State/Region 2013 % Chg % Chg
1 United States $16,724.3 6.6% 1.6%
2 China $8,939.3 8.7% 7.6%
3 Japan $5,007.2 -16.0% 2.0%
4 Germany $3,593.2 5.7% 0.5%
5 France $2,738.7 5.0% 0.2%
6 United Kingdom $2,489.7 2.0% 1.4%
7 Brazil $2,190.2 -8.6% 2.5%
8 Russia $2,117.8 4.7% 1.5%
California $2,075.5 3.6% 2.6%
9 Italy $2,068.4 2.7% -1.8%
10 Canada $1,825.1 0.3% 1.6%
11 India $1,758.2 -3.7% 3.8%
12 Australia $1,488.0 -3.5% 2.5%
13 Spain $1,355.7 0.3% -1.3%
14 Mexico $1,327.0 12.7% 1.2%
15 South Korea $1,197.5 3.6% 2.8%
Los Angeles 5-Co. area $947.8 3.2% 1.9%
16 Indonesia $867.5 -1.2% 5.3%
17 Turkey $821.8 3.4% 3.8%
18 Netherlands $800.5 3.5% -1.3%
19 Saudi Arabia $718.5 -1.2% 3.6%
20 Switzerland $646.2 2.2% 1.7%
Los Angeles County $583.9 3.4% 2.2%
21 Sweden $552.0 4.9% 0.9%
22 Norway $515.8 2.9% 1.6%
23 Poland $513.9 5.4% 1.3%
24 Belgium $507.4 4.7% 0.9%
25 Taiwan $484.7 2.2% 2.2%
Note: Based on Market Exchange Rates and not on Purchasing Power Parity (PPP) Rates
Exchange Rates. Nominal GDP figures are not adjusted for inflation
Sources: IMF WEO -- October 2013 and IHS Global Insight
Table 4: Gross Product Comparisons, 2013 (Billions of $US)

The California Economy
LAEDC Kyser Center for Economic Research 26 Economic Forecast, February 2014
California Employment Growth, 2014
-8.0
-1.5
-1.0
1.2
1.8
3.6
8.3
10.2
10.5
11.6
30.0
30.9
36.2
39.1
40.3
52.5
-15.0 -5.0 5.0 15.0 25.0 35.0 45.0 55.0
Government
Education
Finance & Insurance
Real Estate, Rental & Leasing
Management of Enterprises
Information
Other Services
Transportation & Utilities
Admin. & Support
Wholesale Trade
Manufacturing
Prof'l Scientific & Tech.
Retail Trade
Construction
Health Services
Leisure & Hospitality
Source: CA EDD, Labor Market Information Division, forecast by LAEDC
Total nonfarm job growth forecast for 2014 (thousands): +261.8 jobs
California Employment
0.0%
2.0%
4.0%
6.0%
8.0%
10.0%
12.0%
14.0%
13,000
13,500
14,000
14,500
15,000
15,500
'00 '01 '02 '03 '04 '05 '06 '07 '08 '09 '10 '11 '12 '13 '14f '15f
Total Nonfarm Employment Unemployment Rate
Source: EDD Labor Market Information Division; forecast by LAEDC
Annual average in thousands, 2012 benchmark
California Personal Income
& Taxable Sales Growth
-20%
-15%
-10%
-5%
0%
5%
10%
15%
0
500
1,000
1,500
2,000
2,500
'03 '04 '05 '06 '07 08 '09 '10 '11 '12 '13 '14f '15f
Total Personal Income Taxable Sales Growth $Billions
Source: California Board of Equalization, Dept. of Commerce; estimate & forecast by the LAEDC
$0
$100
$200
$300
$400
$500
$600
$700
0
100
200
300
400
500
600
Jan-06 Jan-07 Jan-08 Jan-09 Jan-10 Jan-11 Jan-12 Jan-13
Home Sales
Median Home Price
Home Sales & Median Prices
CaliforniaExisting, single-family homes
(Sales, Thousands, SAAR) (Price, Thousands)
Source: California Association of Realtors
Residential Building Permits
Issued in California
139 151 155
10868
33 25 25 22 26 36 5173
5762 54
56
45
3211 20 25 32
44
62
79
0.0
50.0
100.0
150.0
200.0
250.0
'03 '04 '05 '06 '07 '08 '09 '10 '11 '12 '13 '14f '15f
Multi-Family
Single-Family
Permits issued, thousands
Source: CIRB, California Home Building Foundation, forecast by LAEDC
California Employment Growth, 2014
-0.4%
-0.3%
-0.2%
0.5%
0.8%
0.9%
1.1%
1.6%
1.7%
1.8%
2.1%
2.3%
2.4%
2.6%
2.7%
3.1%
6.3%
-1.5% -0.5% 0.5% 1.5% 2.5% 3.5% 4.5% 5.5% 6.5% 7.5%
Education
Government
Finance & Insurance
Real Estate, Rental & Leasing
Information
Management of Enterprises
Admin. & Support
Other Services
Wholesale Trade
Total Nonfarm Job Growth
Transportation & Utilities
Retail Trade
Manufacturing
Health Services
Prof'l Scientific & Tech.
Leisure & Hospitality
Construction
Source: CA EDD, Labor Market Information Division, forecast by LAEDC
Annual Percent Change
Total nonfarm job growth forecast for 2014, percent change: +1.8%
California Snapshot
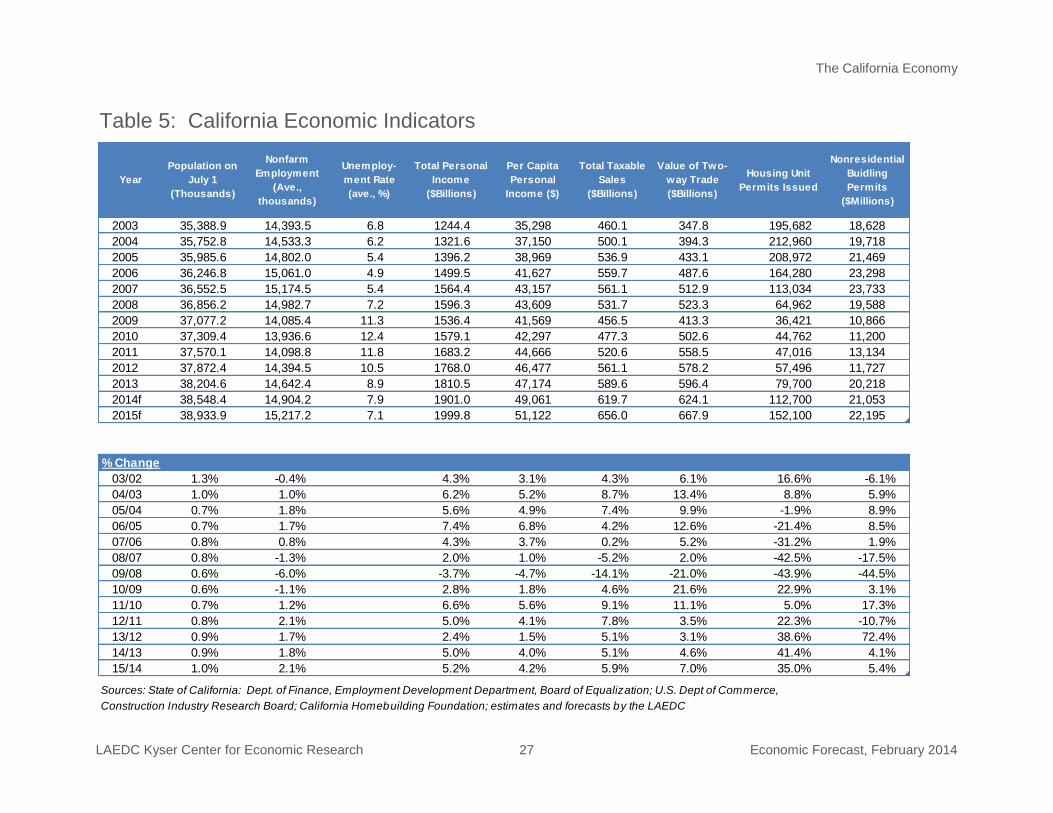
The California Economy
LAEDC Kyser Center for Economic Research 27 Economic Forecast, February 2014
Year
Population on
July 1
(Thousands)
Nonfarm
Employment
(Ave.,
thousands)
Unemploy-
ment Rate
(ave., %)
Total Personal
Income
($Billions)
Per Capita
Personal
Income ($)
Total Taxable
Sales
($Billions)
Value of Two-
way Trade
($Billions)
Housing Unit
Permits Issued
Nonresidential
Buidling
Permits
($Millions)
2003 35,388.9 14,393.5 6.8 1244.4 35,298 460.1 347.8 195,682 18,628
2004 35,752.8 14,533.3 6.2 1321.6 37,150 500.1 394.3 212,960 19,718
2005 35,985.6 14,802.0 5.4 1396.2 38,969 536.9 433.1 208,972 21,469
2006 36,246.8 15,061.0 4.9 1499.5 41,627 559.7 487.6 164,280 23,298
2007 36,552.5 15,174.5 5.4 1564.4 43,157 561.1 512.9 113,034 23,733
2008 36,856.2 14,982.7 7.2 1596.3 43,609 531.7 523.3 64,962 19,588
2009 37,077.2 14,085.4 11.3 1536.4 41,569 456.5 413.3 36,421 10,866
2010 37,309.4 13,936.6 12.4 1579.1 42,297 477.3 502.6 44,762 11,200
2011 37,570.1 14,098.8 11.8 1683.2 44,666 520.6 558.5 47,016 13,134
2012 37,872.4 14,394.5 10.5 1768.0 46,477 561.1 578.2 57,496 11,727
2013 38,204.6 14,642.4 8.9 1810.5 47,174 589.6 596.4 79,700 20,218
2014f 38,548.4 14,904.2 7.9 1901.0 49,061 619.7 624.1 112,700 21,053
2015f 38,933.9 15,217.2 7.1 1999.8 51,122 656.0 667.9 152,100 22,195
% Change Column1 Column2 Column3 Column4 Column5 Column6 Column7 Column8 Column9
03/02 1.3% -0.4% 4.3% 3.1% 4.3% 6.1% 16.6% -6.1%
04/03 1.0% 1.0% 6.2% 5.2% 8.7% 13.4% 8.8% 5.9%
05/04 0.7% 1.8% 5.6% 4.9% 7.4% 9.9% -1.9% 8.9%
06/05 0.7% 1.7% 7.4% 6.8% 4.2% 12.6% -21.4% 8.5%
07/06 0.8% 0.8% 4.3% 3.7% 0.2% 5.2% -31.2% 1.9%
08/07 0.8% -1.3% 2.0% 1.0% -5.2% 2.0% -42.5% -17.5%
09/08 0.6% -6.0% -3.7% -4.7% -14.1% -21.0% -43.9% -44.5%
10/09 0.6% -1.1% 2.8% 1.8% 4.6% 21.6% 22.9% 3.1%
11/10 0.7% 1.2% 6.6% 5.6% 9.1% 11.1% 5.0% 17.3%
12/11 0.8% 2.1% 5.0% 4.1% 7.8% 3.5% 22.3% -10.7%
13/12 0.9% 1.7% 2.4% 1.5% 5.1% 3.1% 38.6% 72.4%
14/13 0.9% 1.8% 5.0% 4.0% 5.1% 4.6% 41.4% 4.1%
15/14 1.0% 2.1% 5.2% 4.2% 5.9% 7.0% 35.0% 5.4%
Sources: State of California: Dept. of Finance, Employment Development Department, Board of Equalization; U.S. Dept of Commerce,
Construction Industry Research Board; California Homebuilding Foundation; estimates and forecasts by the LAEDC
Table 5: California Economic Indicators

The California Economy
LAEDC Kyser Center for Economic Research 28 Economic Forecast, February 2014
YearTotal Nonfarm
Payroll
Natural
ResourcesConstruction Manufacturing
M fg. --
Durable
M fg .--
Nondurable
Wholesale
TradeRetail Trade
Transport. &
UtilitiesInformation
2003 14,393.5 22.2 796.8 1,544.5 978.5 566.0 647.4 1,588.4 480.6 476.1
2004 14,533.3 22.8 850.4 1,523.4 966.0 557.4 653.0 1,617.8 482.8 482.4
2005 14,802.0 23.6 905.3 1,504.7 959.0 545.7 673.6 1,659.3 487.1 473.6
2006 15,061.0 25.1 933.7 1,490.2 947.6 542.6 700.3 1,680.1 496.1 466.0
2007 15,174.5 26.7 892.6 1,464.3 927.9 536.4 715.3 1,689.9 507.7 470.8
2008 14,982.7 28.7 787.7 1,425.4 899.8 525.6 703.5 1,640.9 504.9 475.5
2009 14,085.4 26.1 623.1 1,281.9 798.9 483.0 645.3 1,522.5 474.5 440.4
2010 13,936.6 26.8 559.8 1,241.9 771.1 470.8 644.0 1,513.0 466.3 427.8
2011 14,098.8 29.3 561.2 1,247.8 778.7 469.1 657.9 1,549.2 474.3 428.8
2012 14,394.5 30.1 588.9 1,252.8 782.8 470.0 676.8 1,561.8 486.5 430.4
2013 14,642.4 29.6 620.2 1,248.1 782.3 465.8 698.2 1,568.4 495.8 434.4
2014f 14,904.2 29.6 659.3 1,278.1 812.3 465.8 709.8 1,604.6 506.0 438.0
2015f 15,217.2 30.1 731.9 1,295.9 830.0 465.9 726.8 1,620.0 521.8 440.0
YearFinance &
Insurance
Real Estate,
Rental &
Leasing
Prof, Sci &
Tech Srvs
Mgmt. of
Enterprises
Admin. &
Support Srvs
Educational
Services
Health Care &
Social Asst
Leisure &
HospitalityOther Services Government
2003 606.6 272.2 906.6 247.7 931.0 258.2 1,284.7 1,400.1 504.3 2,426.1
2004 618.8 276.4 918.9 231.3 947.8 262.9 1,303.8 1,439.4 503.9 2,397.7
2005 636.6 283.6 970.2 222.1 968.3 272.2 1,320.9 1,475.2 505.5 2,420.2
2006 639.3 288.5 1,026.5 212.6 1,003.3 277.6 1,343.4 1,519.0 507.1 2,452.3
2007 613.1 283.5 1,060.4 207.2 997.9 289.3 1,388.7 1,560.4 512.2 2,494.6
2008 566.0 275.9 1,079.6 207.2 951.6 300.6 1,432.3 1,572.6 511.3 2,518.9
2009 528.1 254.9 1,014.4 197.3 848.6 304.3 1,455.2 1,503.1 486.1 2,479.6
2010 511.9 248.3 1,016.6 195.4 861.5 309.7 1,478.6 1,501.6 484.9 2,448.4
2011 514.8 247.1 1,050.9 199.3 881.6 325.4 1,509.9 1,535.8 493.7 2,404.9
2012 523.7 250.9 1,104.3 201.7 929.0 336.1 1,543.1 1,599.1 505.7 2,375.1
2013 529.0 257.8 1,136.1 206.9 959.5 347.5 1,571.7 1,668.5 510.0 2,359.0
2014f 528.0 259.0 1,167.0 208.7 970.0 346.0 1,612.0 1,721.0 518.3 2,351.0
2015f 528.0 259.0 1,210.0 208.7 980.1 345.0 1,650.5 1,785.0 519.4 2,365.0
Sources: California Employment Development Department, LMID; estimates and forecasts by LAEDC
Table 6: California Nonfarm Employment Annual averages, Thousands, March 2012 benchmark

The California Economy
LAEDC Kyser Center for Economic Research 29 Economic Forecast, February 2014
\ MSAState of
CaliforniaOakland
San
FranciscoSan Jose Bakersfield Fresno Modesto Sacramento Stockton Los Angeles Orange
Riverside-
San
Bernardino
San Diego Ventura
Year \
1990 12,500.2 879.1 947.4 824.3 170.7 224.4 117.5 618.4 152.7 4,136.7 1,172.7 712.9 966.7 230.2
1991 12,359.3 879.7 939.9 815.5 177.2 227.2 117.8 630.9 155.2 3,984.0 1,144.1 719.1 962.8 230.4
1992 12,154.0 870.2 914.4 801.8 173.3 230.1 120.0 623.2 154.8 3,804.1 1,125.9 729.6 947.5 226.5
1993 12,045.8 873.5 908.1 806.6 169.8 233.5 121.5 625.9 156.2 3,707.3 1,115.4 733.6 946.7 227.0
1994 12,159.8 877.3 903.6 810.2 170.8 237.1 122.2 643.8 157.3 3,702.3 1,126.9 751.0 955.2 233.3
1995 12,422.4 897.4 916.5 842.9 172.8 243.5 124.0 662.8 160.3 3,747.1 1,151.8 779.9 978.6 237.3
1996 12,743.8 916.4 948.5 892.0 174.9 246.8 127.8 681.5 163.4 3,789.2 1,184.7 803.7 1,006.4 237.9
1997 13,130.1 947.9 983.7 939.8 179.3 249.9 131.7 702.2 167.5 3,864.8 1,233.8 841.7 1,054.3 242.7
1998 13,596.7 976.1 1,012.0 969.8 184.3 253.6 137.2 731.4 171.5 3,942.6 1,298.9 882.1 1,105.2 252.3
1999 13,992.3 1,007.9 1,039.5 984.8 188.8 262.1 141.7 770.5 178.7 4,002.2 1,344.8 938.5 1,152.4 263.6
2000 14,488.7 1,044.7 1,081.8 1,044.4 194.2 270.7 144.2 797.2 185.8 4,072.7 1,388.9 988.4 1,193.9 275.0
2001 14,602.5 1,054.7 1,054.3 1,018.1 202.3 275.9 149.7 818.9 191.1 4,074.4 1,413.8 1,029.7 1,218.5 279.9
2002 14,458.4 1,039.8 987.6 917.4 205.1 281.9 150.6 832.2 194.0 4,027.7 1,403.9 1,064.5 1,230.9 281.8
2003 14,393.5 1,025.8 951.1 870.3 207.2 282.8 152.3 846.3 197.3 3,982.7 1,428.9 1,099.2 1,240.2 284.2
2004 14,533.3 1,023.5 939.7 861.8 211.7 286.9 154.6 859.0 200.6 3,995.8 1,456.4 1,160.0 1,259.9 286.2
2005 14,802.0 1,032.0 947.9 869.8 222.0 294.3 159.0 880.9 205.8 4,024.3 1,490.9 1,222.0 1,281.9 291.2
2006 15,061.0 1,045.3 967.5 891.1 233.3 302.6 159.9 899.0 209.0 4,093.1 1,519.0 1,267.7 1,301.6 297.7
2007 15,174.5 1,048.1 988.8 911.0 238.6 306.4 160.2 902.8 211.5 4,122.9 1,515.8 1,271.0 1,308.8 296.7
2008 14,982.7 1,030.8 996.6 915.1 238.3 303.0 156.5 882.1 205.7 4,069.6 1,481.4 1,225.3 1,298.9 290.8
2009 14,085.4 968.7 945.1 856.6 228.2 286.3 146.7 831.4 193.7 3,823.3 1,371.8 1,141.5 1,231.2 274.8
2010 13,936.6 948.6 935.9 855.1 226.5 279.5 146.3 809.9 187.7 3,773.3 1,353.8 1,124.0 1,222.5 272.8
2011 14,098.8 957.4 960.0 876.3 233.3 281.1 146.0 808.7 187.5 3,798.5 1,368.9 1,128.8 1,233.3 274.9
2012 14,394.5 979.6 998.4 905.8 241.4 282.9 148.7 822.7 190.2 3,864.3 1,400.7 1,151.8 1,258.8 278.8
2013 14,642.4 991.9 1,024.9 932.3 245.4 285.9 149.8 831.6 193.8 3,925.9 1,430.1 1,165.9 1,281.9 283.6
2014f 14,904.2 1,008.7 1,046.4 954.7 251.3 291.7 152.7 843.3 198.2 3,987.7 1,460.1 1,191.6 1,306.5 288.7
2015f 15,217.2 1,029.9 1,066.3 976.7 258.1 297.2 155.4 861.8 202.4 4,035.5 1,489.3 1,226.5 1,332.6 294.1
Sources: California EDD, Labor Market Division, Current Employment Series; forecasts by LAEDC
Central California Southern CaliforniaNorthern California
Table 7: California Regional Nonfarm Employment Annual averages for major metropolitan areas, thousands; March 2012 benchmark
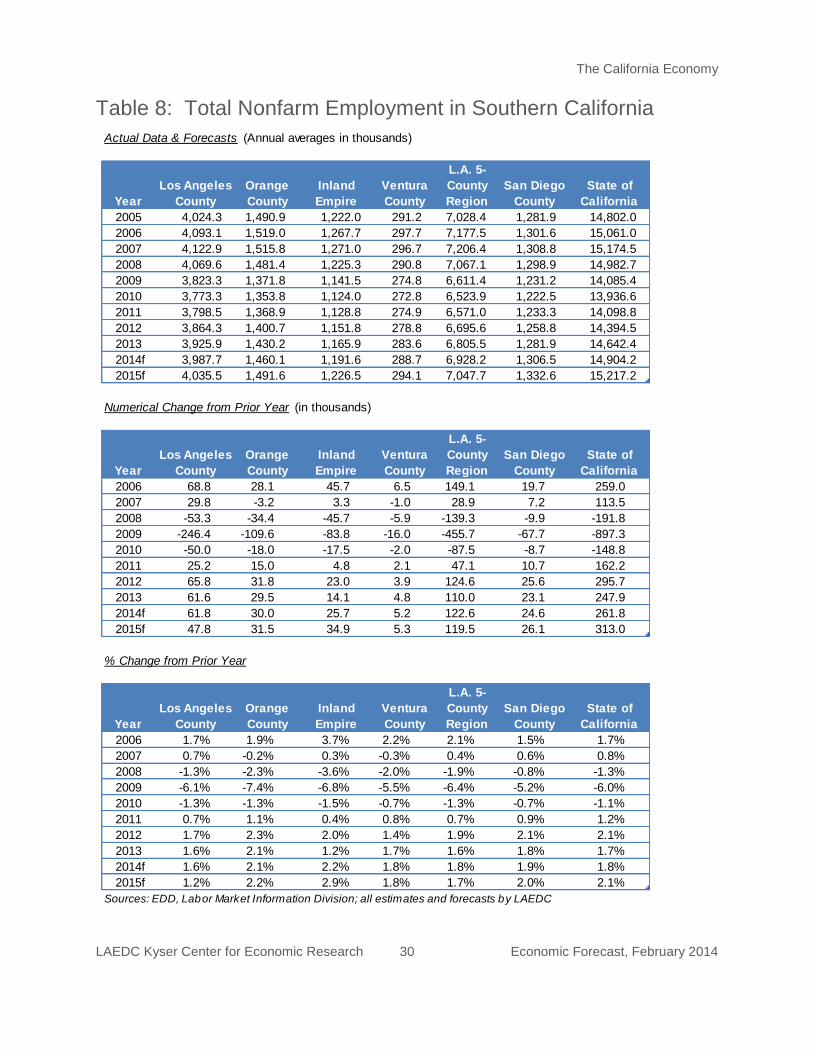
The California Economy
LAEDC Kyser Center for Economic Research 30 Economic Forecast, February 2014
Actual Data & Forecasts (Annual averages in thousands)
Year
Los Angeles
County
Orange
County
Inland
Empire
Ventura
County
L.A. 5-
County
Region
San Diego
County
State of
California
2005 4,024.3 1,490.9 1,222.0 291.2 7,028.4 1,281.9 14,802.0
2006 4,093.1 1,519.0 1,267.7 297.7 7,177.5 1,301.6 15,061.0
2007 4,122.9 1,515.8 1,271.0 296.7 7,206.4 1,308.8 15,174.5
2008 4,069.6 1,481.4 1,225.3 290.8 7,067.1 1,298.9 14,982.7
2009 3,823.3 1,371.8 1,141.5 274.8 6,611.4 1,231.2 14,085.4
2010 3,773.3 1,353.8 1,124.0 272.8 6,523.9 1,222.5 13,936.6
2011 3,798.5 1,368.9 1,128.8 274.9 6,571.0 1,233.3 14,098.8
2012 3,864.3 1,400.7 1,151.8 278.8 6,695.6 1,258.8 14,394.5
2013 3,925.9 1,430.2 1,165.9 283.6 6,805.5 1,281.9 14,642.4
2014f 3,987.7 1,460.1 1,191.6 288.7 6,928.2 1,306.5 14,904.2
2015f 4,035.5 1,491.6 1,226.5 294.1 7,047.7 1,332.6 15,217.2
Numerical Change from Prior Year (in thousands)
Year
Los Angeles
County
Orange
County
Inland
Empire
Ventura
County
L.A. 5-
County
Region
San Diego
County
State of
California
2006 68.8 28.1 45.7 6.5 149.1 19.7 259.0
2007 29.8 -3.2 3.3 -1.0 28.9 7.2 113.5
2008 -53.3 -34.4 -45.7 -5.9 -139.3 -9.9 -191.8
2009 -246.4 -109.6 -83.8 -16.0 -455.7 -67.7 -897.3
2010 -50.0 -18.0 -17.5 -2.0 -87.5 -8.7 -148.8
2011 25.2 15.0 4.8 2.1 47.1 10.7 162.2
2012 65.8 31.8 23.0 3.9 124.6 25.6 295.7
2013 61.6 29.5 14.1 4.8 110.0 23.1 247.9
2014f 61.8 30.0 25.7 5.2 122.6 24.6 261.8
2015f 47.8 31.5 34.9 5.3 119.5 26.1 313.0
% Change from Prior Year
Year
Los Angeles
County
Orange
County
Inland
Empire
Ventura
County
L.A. 5-
County
Region
San Diego
County
State of
California
2006 1.7% 1.9% 3.7% 2.2% 2.1% 1.5% 1.7%
2007 0.7% -0.2% 0.3% -0.3% 0.4% 0.6% 0.8%
2008 -1.3% -2.3% -3.6% -2.0% -1.9% -0.8% -1.3%
2009 -6.1% -7.4% -6.8% -5.5% -6.4% -5.2% -6.0%
2010 -1.3% -1.3% -1.5% -0.7% -1.3% -0.7% -1.1%
2011 0.7% 1.1% 0.4% 0.8% 0.7% 0.9% 1.2%
2012 1.7% 2.3% 2.0% 1.4% 1.9% 2.1% 2.1%
2013 1.6% 2.1% 1.2% 1.7% 1.6% 1.8% 1.7%
2014f 1.6% 2.1% 2.2% 1.8% 1.8% 1.9% 1.8%
2015f 1.2% 2.2% 2.9% 1.8% 1.7% 2.0% 2.1%
Sources: EDD, Labor Market Information Division; all estimates and forecasts by LAEDC
Table 8: Total Nonfarm Employment in Southern California

The California Economy
LAEDC Kyser Center for Economic Research 31 Economic Forecast, February 2014
|------------------ Manufacturing -------------------| Services
Year
Total
Technology
Employment
Electronic
Product
Manufacturing
Aerospace
Product & Parts
Manufacturing
Pharmaceutical
& Medicine
Manufacturing
Software
Publishers
ISPs, Web
Portals, Data
Processing
Computer
Systems
Design & Rel.
Services
Management,
Scientific &
Technical
Consulting
Scientific R&D
Services
2001 1019.2 409.7 86.3 39.2 52.6 28.8 204.4 99.1 99.1
2002 922.0 353.7 79.6 39.5 48.8 20.7 177.1 102.1 100.5
2003 876.7 320.9 73.6 39.1 44.7 18.7 168.8 109.7 101.2
2004 877.1 313.4 73.7 40.6 42.6 18.5 168.5 119.0 100.8
2005 902.6 310.8 73.4 42.0 41.6 19.6 175.6 135.4 104.2
2006 932.2 308.2 73.0 44.0 41.3 20.9 187.3 151.3 106.2
2007 950.6 304.1 72.8 44.2 43.0 20.7 199.2 159.0 107.6
2008 971.3 300.0 73.7 43.6 44.9 20.4 205.8 166.8 116.1
2009 925.3 278.6 72.4 43.5 45.0 19.3 195.5 156.1 114.9
2010 931.7 271.8 73.1 43.4 45.0 18.6 201.0 160.5 118.3
2011 962.0 275.2 71.5 43.3 48.3 18.8 214.5 169.7 120.7
2012 1006.3 271.5 70.5 44.6 51.7 20.5 230.6 191.5 125.4
2013 1029.7 271.6 69.6 45.7 52.8 21.5 235.2 208.3 125.1
Sources: California EDD, LMID
|--------------------------- ----------------------------|
Table 9: California Technology Employment Annual averages, thousands, March 2012 benchmark, based on NAICS

The California Economy
LAEDC Kyser Center for Economic Research 32 Economic Forecast, February 2014
Year
Los
Angeles
County
Column
2
Orange
County
Column
4
Riverside &
San
Bernardino
Colum
n6
Ventura
County
Column
8
Total of
L.A. 5-Co.
Area
Column
10
State of
California
Column
12
Data % ∆ Data % ∆ Data % ∆ Data % ∆ Data % ∆ Data % ∆
1990 8,860 --- 2,412 --- 2,620 --- 669.1 --- 14,562 --- 29,828 ---
1991 8,955 1.1% 2,459 1.9% 2,751 5.0% 676.9 1.2% 14,842 1.9% 30,549 2.4%
1992 9,060 1.2% 2,512 2.2% 2,833 3.0% 686.3 1.4% 15,091 1.7% 30,987 1.4%
1993 9,084 0.3% 2,550 1.5% 2,885 1.8% 693.8 1.1% 15,213 0.8% 31,314 1.1%
1994 9,106 0.3% 2,576 1.0% 2,920 1.2% 700.6 1.0% 15,303 0.6% 31,524 0.7%
1995 9,101 -0.1% 2,605 1.1% 2,960 1.4% 705.1 0.6% 15,370 0.4% 31,712 0.6%
1996 9,108 0.1% 2,646 1.6% 3,007 1.6% 710.5 0.8% 15,471 0.7% 31,963 0.8%
1997 9,186 0.9% 2,700 2.0% 3,063 1.9% 721.7 1.6% 15,669 1.3% 32,453 1.5%
1998 9,266 0.9% 2,750 1.9% 3,117 1.8% 729.1 1.0% 15,862 1.2% 32,863 1.3%
1999 9,394 1.4% 2,803 1.9% 3,198 2.6% 742.8 1.9% 16,138 1.7% 33,419 1.7%
2000 9,544 1.6% 2,854 1.8% 3,276 2.4% 756.9 1.9% 16,431 1.8% 34,001 1.7%
2001 9,636 1.0% 2,890 1.3% 3,386 3.3% 769.0 1.6% 16,681 1.5% 34,513 1.5%
2002 9,722 0.9% 2,914 0.8% 3,489 3.0% 779.9 1.4% 16,906 1.3% 34,938 1.2%
2003 9,791 0.7% 2,940 0.9% 3,623 3.8% 789.4 1.2% 17,143 1.4% 35,389 1.3%
2004 9,823 0.3% 2,956 0.6% 3,757 3.7% 795.0 0.7% 17,331 1.1% 35,753 1.0%
2005 9,810 -0.1% 2,957 0.0% 3,878 3.2% 796.9 0.2% 17,441 0.6% 35,986 0.7%
2006 9,787 -0.2% 2,955 -0.1% 3,994 3.0% 801.2 0.5% 17,538 0.6% 36,247 0.7%
2007 9,774 -0.1% 2,966 0.4% 4,085 2.3% 805.9 0.6% 17,631 0.5% 36,553 0.8%
2008 9,797 0.2% 2,983 0.6% 4,139 1.3% 812.0 0.8% 17,731 0.6% 36,856 0.8%
2009 9,805 0.1% 2,999 0.5% 4,181 1.0% 818.5 0.8% 17,803 0.4% 37,077 0.6%
2010 9,825 0.2% 3,017 0.6% 4,230 1.2% 825.1 0.8% 17,898 0.5% 37,309 0.6%
2011 9,861 0.4% 3,047 1.0% 4,274 1.0% 830.2 0.6% 18,011 0.6% 37,570 0.7%
2012 9,945 0.9% 3,075 0.9% 4,314 0.9% 833.4 0.4% 18,167 0.9% 37,872 0.8%
2013 10,019 0.7% 3,105 1.0% 4,344 0.7% 840.3 0.8% 18,309 0.8% 38,205 0.9%
2014f 10,090 0.7% 3,139 1.1% 4,409 1.5% 847.0 0.8% 18,485 1.0% 38,548 0.9%
2015f 10,160 0.7% 3,173 1.1% 4,493 1.9% 854.7 0.9% 18,681 1.1% 38,934 1.0%
Source: U.S. Census, California Department of Finance, E-2. California County Population Estimates; forcasts by LAEDC
Table 10: Population Trends in California and the Los Angeles 5-County Area Population Estimates as of July 1 each year
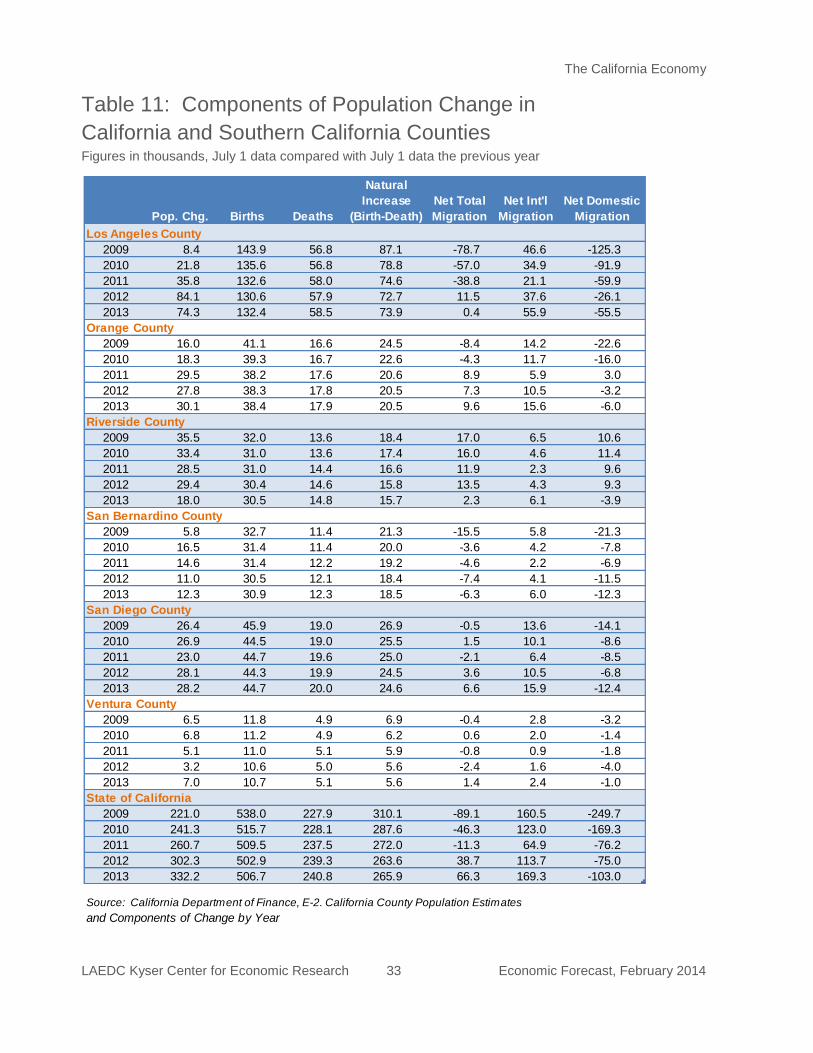
The California Economy
LAEDC Kyser Center for Economic Research 33 Economic Forecast, February 2014
Column1 Pop. Chg. Births Deaths
Natural
Increase
(Birth-Death)
Net Total
Migration
Net Int'l
Migration
Net Domestic
Migration
Los Angeles County
2009 8.4 143.9 56.8 87.1 -78.7 46.6 -125.3
2010 21.8 135.6 56.8 78.8 -57.0 34.9 -91.9
2011 35.8 132.6 58.0 74.6 -38.8 21.1 -59.9
2012 84.1 130.6 57.9 72.7 11.5 37.6 -26.1
2013 74.3 132.4 58.5 73.9 0.4 55.9 -55.5
Orange County
2009 16.0 41.1 16.6 24.5 -8.4 14.2 -22.6
2010 18.3 39.3 16.7 22.6 -4.3 11.7 -16.0
2011 29.5 38.2 17.6 20.6 8.9 5.9 3.0
2012 27.8 38.3 17.8 20.5 7.3 10.5 -3.2
2013 30.1 38.4 17.9 20.5 9.6 15.6 -6.0
Riverside County
2009 35.5 32.0 13.6 18.4 17.0 6.5 10.6
2010 33.4 31.0 13.6 17.4 16.0 4.6 11.4
2011 28.5 31.0 14.4 16.6 11.9 2.3 9.6
2012 29.4 30.4 14.6 15.8 13.5 4.3 9.3
2013 18.0 30.5 14.8 15.7 2.3 6.1 -3.9
San Bernardino County
2009 5.8 32.7 11.4 21.3 -15.5 5.8 -21.3
2010 16.5 31.4 11.4 20.0 -3.6 4.2 -7.8
2011 14.6 31.4 12.2 19.2 -4.6 2.2 -6.9
2012 11.0 30.5 12.1 18.4 -7.4 4.1 -11.5
2013 12.3 30.9 12.3 18.5 -6.3 6.0 -12.3
San Diego County
2009 26.4 45.9 19.0 26.9 -0.5 13.6 -14.1
2010 26.9 44.5 19.0 25.5 1.5 10.1 -8.6
2011 23.0 44.7 19.6 25.0 -2.1 6.4 -8.5
2012 28.1 44.3 19.9 24.5 3.6 10.5 -6.8
2013 28.2 44.7 20.0 24.6 6.6 15.9 -12.4
Ventura County
2009 6.5 11.8 4.9 6.9 -0.4 2.8 -3.2
2010 6.8 11.2 4.9 6.2 0.6 2.0 -1.4
2011 5.1 11.0 5.1 5.9 -0.8 0.9 -1.8
2012 3.2 10.6 5.0 5.6 -2.4 1.6 -4.0
2013 7.0 10.7 5.1 5.6 1.4 2.4 -1.0
State of California
2009 221.0 538.0 227.9 310.1 -89.1 160.5 -249.7
2010 241.3 515.7 228.1 287.6 -46.3 123.0 -169.3
2011 260.7 509.5 237.5 272.0 -11.3 64.9 -76.2
2012 302.3 502.9 239.3 263.6 38.7 113.7 -75.0
2013 332.2 506.7 240.8 265.9 66.3 169.3 -103.0
Source: California Department of Finance, E-2. California County Population Estimates
and Components of Change by Year
Table 11: Components of Population Change in
California and Southern California Counties Figures in thousands, July 1 data compared with July 1 data the previous year

Los Angeles County
LAEDC Kyser Center for Economic Research 34 Economic Forecast, February 2014
LOS ANGELES COUNTY
INTRODUCTION
Los Angeles County has the largest population of any county in the U.S. and it
has a larger population than 43 states. The county has 88 cities, of which the city
of Los Angeles is the largest, followed by Long Beach, Glendale, and Santa
Clarita. In addition, Los Angeles County has the largest county economy in the
nation and would be the 21st largest economy in the world if it were a country.
Los Angeles County is also the top exporter of any county in the U.S. It is one of
the original counties, created when California became a state in 1850.
Los Angeles County entered 2014 with momentum from a county labor market
that slowed during the second half of 2013. The early part of 2013 was a
continuation of 2012, but sluggish conditions nationally contributed to less-than-
satisfactory job growth during the summer and last part of 2013. Still, almost all
of the major private sector industries added jobs in 2013.
In 2013 nonfarm jobs in Los Angeles County grew at a year-over-year rate of
1.6%, matching the growth rate nationally but slightly behind the state’s 1.7%
growth rate. This contributed to a one percent decline in the annual
unemployment rate, which fell from 10.9% in 2012 to 9.8% last year. The
unemployment rate is expected to fall to 8.7% this year and drop to 7.8% in
2015. Total nonfarm employment for the county stood at 3.93 million jobs last
year. The county added over 61,600 nonfarm jobs in 2013, following an increase
of 65,800 in 2012 and 25,200 in 2011. With such improvements, a normal
unemployment rate (7.5%) is still a couple of years away.
Most private industry sectors posted an increase in payroll employment last year.
The largest gains were in leisure and hospitality, professional, scientific and
technical services, healthcare and social assistance, and construction. These
four industries combined contributed more than 73% of the jobs created last
year. Administrative and support services also added 9,500 jobs, but most of that
increase came in the form of temporary workers. Only manufacturing and
transportation, warehousing and utilities lost jobs, down by slightly over 4,200
positions or 1.2% last year and by over 400 jobs or just slightly down by -0.3%
respectively. While the decline in manufacturing continued a long-time trend,
construction witnessed a third consecutive year of gains after three years of
declines in the wake of the Great Recession. Construction added nearly 7,500
jobs last year, equivalent to a nearly 6.8% increase. In the public sector, job
losses continued for yet another year with 6,800 jobs given up in 2013, a 1.2%
decline.
Nonfarm jobs in Los Angeles County are expected to grow by 1.6% this year,
with another 1.2% gain to come in 2015. With these improvements, nonfarm
employment will exceed four million in 2015 for the first time since 2008. The
largest gains for 2014 are expected in healthcare and social assistance (13,800),
leisure and hospitality (8,800 jobs), professional, scientific and technical services
(8,800 jobs), administrative and support services (7,700 jobs), and construction
(5,800 jobs). Manufacturing is expected to experience slight job growth over the
Los Angeles County has
the largest county
economy in the nation and
would be the 21st largest
economy in the world if it
were a country.
Nonfarm jobs in Los
Angeles County are
expected to grow by 1.6%
this year, with another
1.2% gain to come in
2015. With these
improvements, nonfarm
employment will exceed
four million in 2015 for the
first time since 2008.

Los Angeles County
LAEDC Kyser Center for Economic Research 35 Economic Forecast, February 2014
next couple of years for the first time in several years. As for government,
employment will be flat or down slightly in 2014 and in 2015.
TRENDS IN MAJOR INDUSTRIES
Entertainment
The entertainment industry is one of the most visible and important industries in
Los Angeles County. The motion picture and sound recording sector accounts
for most of the county’s entertainment industry employment. Both motion picture
and sound recording jobs and broadcasting jobs registered slight year-over-year
increases in 2013. Average annual employment in motion picture and sound
recording rose to just over 118,000 jobs. Meanwhile, broadcasting almost
reached the 19,860 employment level. The first half of 2013 was stronger than
the second half for both motion picture and sound recording and broadcasting.
Whether more substantial job gains can be achieved in motion picture and sound
recording may depend in part on the success of the California Film Tax Credit
program in the coming years. There has been a steady rise in local production
since the recession. In 2013, on-location feature film production rose by 18.3% to
6,972 days, the fourth consecutive yearly gain. Total production days (includes
film, TV, and commercials) in 2013 increased by 11.7% to 51,670.
International Trade
International trade continues to play an important role in the local economy.
International trade is among the top three largest trade-oriented industry clusters
in Los Angeles County based on 2012 figures (most recent available). Activity
levels depend not only on the health of the national economy but the global
economy as well.
The San Pedro Bay ports of Los Angeles and Long Beach are the two busiest
container ports in the nation. Much of the nation’s imported consumer goods from
Asia and the Pacific Rim enter the United States through the twin ports. The past
year was a strong year for trade flows at the local ports as the number of TEUs
(twenty-foot equivalent units) moving through the ports edged up by 3.4% to 14.6
million containers. The value of two-way trade through the Los Angeles Customs
District, a broader measure of trade volume, rose by 2.7% last year to a record
$414.5 billion. Two-way trade should increase by 4.5% this year, and accelerate
to a 6.9% growth rate in 2015 as prospects improve for the U.S. and its trading
partners. Container activity is projected to grow 4.6% this year in response to
increased imports and exports through the twin ports.
Professional Services and Technology
The professional, scientific, and technical services industry is the fifth largest in
Los Angeles County. Firms in the industry employ a wide array of professionals,
including architects, engineers, and attorneys. It is an important but often
overlooked source of highly compensated jobs in the local economy. Industry
employment stood at 276,800 in 2013, up 3.7% from a year earlier. Growth is
expected to continue in this sector over the next two years, with projected gains
of 8,800 jobs this year and over 9,000 in 2015.
The past year was a
strong year for trade flows
at the local parts as the
number of TEUs moving
through the ports edged
up by 3.4% to 14.6 million
containers. Two-way trade
should increase by 4.5%
this year, and accelerate
to a 6.9% growth rate in
2015 as prospects
improve for the U.S. and
its trading partners.
Los Angeles County
LAEDC Kyser Center for Economic Research 36 Economic Forecast, February 2014
The technology sector, which includes manufacturing and service industries in
aerospace, information technology, electronics, and biomedical technology,
employed 184,000 workers in 2012, and it employed 186,400 people in 2013, up
1.4% from a year earlier. Most of the growth occurred in consulting, which was
offset partially by declines in the manufacturing segments of the technology
sector. Like the professional, scientific, and technical industry, it is a source of
highly compensated jobs in the local economy.
LOOKING AHEAD
The Los Angeles County economy will continue to move forward in 2014 and in
2015, barring any unforeseen shocks to the national economy. Population
eclipsed the 10 million mark in 2013, and will continue on a modest growth
trajectory of just under one percent per year. By 2015, nonfarm employment
should exceed four million, but it may be 2016 or 2017 before nonfarm
employment exceeds the peak of 4.12 million reached in 2007.
With these gains, total personal income will move further away from the
recession-low of just over $390 billion. Personal income increased 1.8% in 2013
to $451.1 billion and is expected to surpass $493 billion by 2015. Total taxable
sales will increase by 5.3% this year and by 6.1% next year, following 5.3%
growth in 2013. Both of these indicators suggest that the local consumer sector is
improving, an all-important fact for retailers and other consumer-serving
businesses.
As for the business sector, 2014 will bring opportunities for emerging as well as
existing industries. Over the short to medium term, expansion will continue in the
major industries. In addition, Silicon Beach will continue to grow as Silicon Valley
companies seek to capitalize on the presence of creative content here in Los
Angeles. Also, venture capital will continue to flow to the area as startups in a
variety of technology industries grow in number. Finally, even as concerns about
funding for government aerospace programs linger, private firms will continue to
pursue commercial space ventures from their operations in Los Angeles County
and elsewhere in Southern California.

Los Angeles County
LAEDC Kyser Center for Economic Research 37 Economic Forecast, February 2014
L.A. County Employment Growth, 2014
-1.4
-1.2
-0.4
-0.3
0.5
0.9
2.7
3.8
4.2
4.4
4.7
5.8
7.7
8.8
8.9
12.8
-3.0 -1.0 1.0 3.0 5.0 7.0 9.0 11.0 13.0 15.0
Real Estate, Rental & Leasing
Information
Government
Other Services
Education
Transportation & Utilities
Finance & Insurance
Management of Enterprises
Retail Trade
Wholesale Trade
Manufacturing
Construction
Admin. & Support
Prof'l Scientific & Tech.
Leisure & Hospitality
Health Services
Source: CA EDD, Labor Market Information Division, forecast by LAEDC
Total nonfarm job growth forecast for 2014 (thousands): +58.9 jobs
Los Angeles County Employment
0.0%
2.0%
4.0%
6.0%
8.0%
10.0%
12.0%
14.0%
3,500
3,600
3,700
3,800
3,900
4,000
4,100
4,200
'03 '04 '05 '06 '07 '08 '09 '10 '11 '12 '13 '14f '15f
Total Nonfarm Employment Unemployment Rate
Source: EDD Labor Market Information Division; forecast by LAEDC
Annual average in thousands, 2012 benchmark
Los Angeles County Personal
Income & Taxable Sales Growth
-20%
-15%
-10%
-5%
0%
5%
10%
0
100
200
300
400
500
600
'03 '04 '05 '06 '07 '08 '09 '10 '11 '12 '13 '14f '15f
Total Personal Income Taxable Sales Growth$Billions
Source: California Board of Equalization, Dept. of Commerce; estimate & forecast by the LAEDC
$0
$100
$200
$300
$400
$500
$600
0
2,000
4,000
6,000
8,000
10,000
12,000
Jan-06 Jan-07 Jan-08 Jan-09 Jan-10 Jan-11 Jan-12 Jan-13
Home Sales
Median Home Price
Home Sales & Median Prices
Los Angeles CountyNew and existing, single-family homes and condos
(Sales) (Price, Thousands)
Source: California Real Estate Research Council; DataQuick
Residential Building Permits
Issued in Los Angeles County
10 12 12 108
3 2 2 2 4 4 5 6
11
15 14 16
13
10
3 58
912
16
21
0.0
5.0
10.0
15.0
20.0
25.0
30.0
'03 '04 '05 '06 '07 '08 '09 '10 '11 '12 '13 '14f '15f
Multi-Family
Single-Family
Permits issued, thousands
Source: CIRB, California Home Building Foundation, forecast by LAEDC
L.A. County Employment Growth, 2014
-1.9%
-0.6%
-0.2%
-0.1%
0.6%
1.0%
1.3%
1.5%
1.9%
2.0%
2.1%
2.9%
3.0%
3.2%
5.0%
-3.0% -1.0% 1.0% 3.0% 5.0%
Real Estate, Rental & Leasing
Information
Other Services
Government
Transportation & Utilities
Retail Trade
Manufacturing
Total Nonfarm Job Growth
Finance & Insurance
Leisure & Hospitality
Wholesale Trade
Health Services
Admin. & Support
Prof'l Scientific & Tech.
Construction
Source: CA EDD, Labor Market Information Division, forecast by LAEDC
Annual Percent Change
Total nonfarm job growth forecast for 2014, percent change: +2.1%
Los Angeles County Snapshot
+
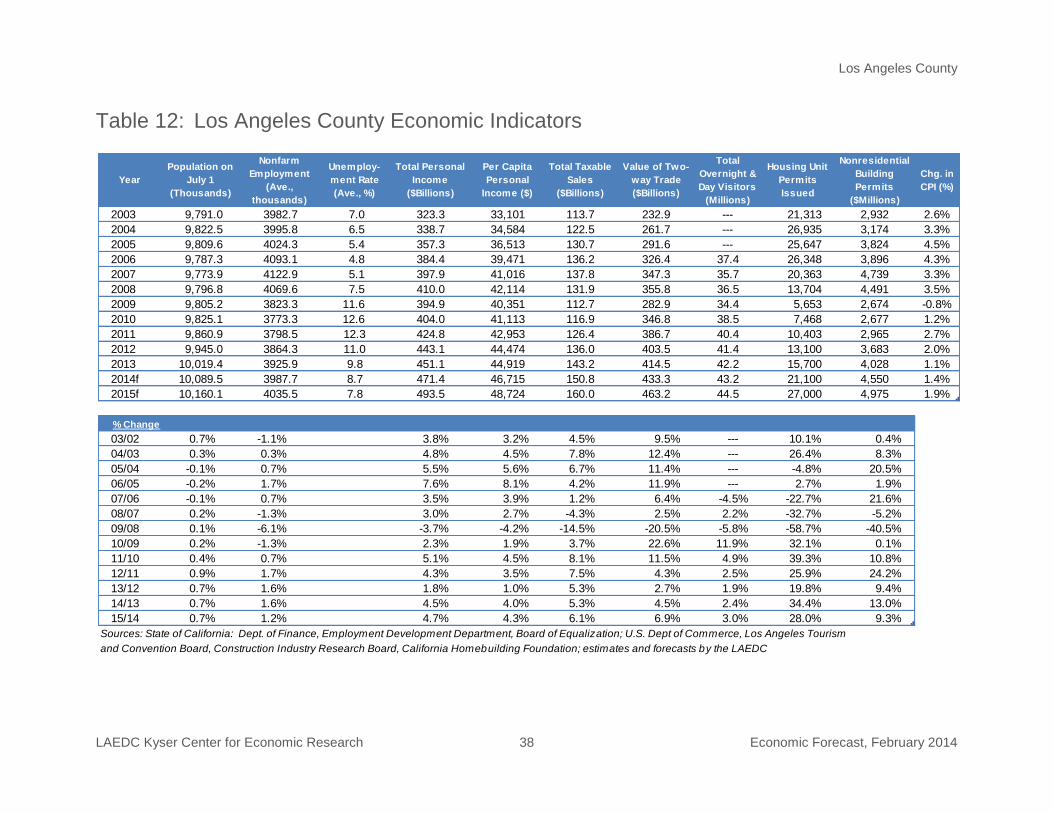
Los Angeles County
LAEDC Kyser Center for Economic Research 38 Economic Forecast, February 2014
Year
Population on
July 1
(Thousands)
Nonfarm
Employment
(Ave.,
thousands)
Unemploy-
ment Rate
(Ave., %)
Total Personal
Income
($Billions)
Per Capita
Personal
Income ($)
Total Taxable
Sales
($Billions)
Value of Two-
way Trade
($Billions)
Total
Overnight &
Day Visitors
(Millions)
Housing Unit
Permits
Issued
Nonresidential
Building
Permits
($Millions)
Chg. in
CPI (%)
2003 9,791.0 3982.7 7.0 323.3 33,101 113.7 232.9 --- 21,313 2,932 2.6%
2004 9,822.5 3995.8 6.5 338.7 34,584 122.5 261.7 --- 26,935 3,174 3.3%
2005 9,809.6 4024.3 5.4 357.3 36,513 130.7 291.6 --- 25,647 3,824 4.5%
2006 9,787.3 4093.1 4.8 384.4 39,471 136.2 326.4 37.4 26,348 3,896 4.3%
2007 9,773.9 4122.9 5.1 397.9 41,016 137.8 347.3 35.7 20,363 4,739 3.3%
2008 9,796.8 4069.6 7.5 410.0 42,114 131.9 355.8 36.5 13,704 4,491 3.5%
2009 9,805.2 3823.3 11.6 394.9 40,351 112.7 282.9 34.4 5,653 2,674 -0.8%
2010 9,825.1 3773.3 12.6 404.0 41,113 116.9 346.8 38.5 7,468 2,677 1.2%
2011 9,860.9 3798.5 12.3 424.8 42,953 126.4 386.7 40.4 10,403 2,965 2.7%
2012 9,945.0 3864.3 11.0 443.1 44,474 136.0 403.5 41.4 13,100 3,683 2.0%
2013 10,019.4 3925.9 9.8 451.1 44,919 143.2 414.5 42.2 15,700 4,028 1.1%
2014f 10,089.5 3987.7 8.7 471.4 46,715 150.8 433.3 43.2 21,100 4,550 1.4%
2015f 10,160.1 4035.5 7.8 493.5 48,724 160.0 463.2 44.5 27,000 4,975 1.9%
% Change Column1 Column2 Column3 Column4 Column5 Column6 Column7 Column8 Column9 Column10
03/02 0.7% -1.1% 3.8% 3.2% 4.5% 9.5% --- 10.1% 0.4%
04/03 0.3% 0.3% 4.8% 4.5% 7.8% 12.4% --- 26.4% 8.3%
05/04 -0.1% 0.7% 5.5% 5.6% 6.7% 11.4% --- -4.8% 20.5%
06/05 -0.2% 1.7% 7.6% 8.1% 4.2% 11.9% --- 2.7% 1.9%
07/06 -0.1% 0.7% 3.5% 3.9% 1.2% 6.4% -4.5% -22.7% 21.6%
08/07 0.2% -1.3% 3.0% 2.7% -4.3% 2.5% 2.2% -32.7% -5.2%
09/08 0.1% -6.1% -3.7% -4.2% -14.5% -20.5% -5.8% -58.7% -40.5%
10/09 0.2% -1.3% 2.3% 1.9% 3.7% 22.6% 11.9% 32.1% 0.1%
11/10 0.4% 0.7% 5.1% 4.5% 8.1% 11.5% 4.9% 39.3% 10.8%
12/11 0.9% 1.7% 4.3% 3.5% 7.5% 4.3% 2.5% 25.9% 24.2%
13/12 0.7% 1.6% 1.8% 1.0% 5.3% 2.7% 1.9% 19.8% 9.4%
14/13 0.7% 1.6% 4.5% 4.0% 5.3% 4.5% 2.4% 34.4% 13.0%
15/14 0.7% 1.2% 4.7% 4.3% 6.1% 6.9% 3.0% 28.0% 9.3%
Sources: State of California: Dept. of Finance, Employment Development Department, Board of Equalization; U.S. Dept of Commerce, Los Angeles Tourism
and Convention Board, Construction Industry Research Board, California Homebuilding Foundation; estimates and forecasts by the LAEDC
Table 12: Los Angeles County Economic Indicators

Los Angeles County
LAEDC Kyser Center for Economic Research 39 Economic Forecast, February 2014
YearTotal Nonfarm
Payroll
Natural
ResourcesConstruction Manufacturing
M fg. --
Durable
M fg .--
Nondurable
Wholesale
TradeRetail Trade
Transport. &
UtilitiesInformation
2003 3,982.7 3.8 134.6 502.1 278.3 223.8 212.0 399.3 161.5 202.3
2004 3,995.8 3.8 140.2 485.8 270.0 215.8 213.0 405.4 161.1 211.9
2005 4,024.3 3.7 148.7 473.9 265.6 208.3 217.1 414.4 161.7 207.6
2006 4,093.1 4.0 157.5 463.9 259.5 204.4 223.5 423.3 165.2 205.6
2007 4,122.9 4.4 157.6 449.2 250.9 198.3 227.0 426.0 165.6 209.8
2008 4,069.6 4.4 145.2 434.4 243.2 191.2 223.7 416.5 163.1 210.3
2009 3,823.3 4.1 117.3 389.2 217.6 171.6 204.5 387.0 151.2 191.2
2010 3,773.3 4.1 104.5 373.2 207.0 166.2 203.0 385.7 150.6 191.5
2011 3,798.5 4.0 105.0 366.8 204.1 162.7 205.2 390.7 151.8 191.9
2012 3,864.3 4.2 108.8 365.7 203.3 162.4 210.9 396.8 154.3 190.3
2013 3,925.9 4.2 116.2 360.8 200.1 160.8 212.2 398.1 153.9 193.9
2014f 3,987.7 4.3 122.0 365.5 201.3 164.7 216.6 402.3 154.8 192.7
2015f 4,035.5 4.3 134.4 367.8 202.3 165.5 218.8 406.4 156.3 192.9
YearFinance &
Insurance
Real Estate,
Rental &
Leasing
Prof, Sci &
Tech Srvs
Mgmt. of
Enterprises
Admin. &
Support Srvs
Educational
Services
Health Care &
Social Asst
Leisure &
Hospitality
Other
ServicesGovernment
2003 163.1 74.8 233.5 77.4 249.1 94.8 367.5 362.6 145.5 599.3
2004 163.0 76.7 237.7 71.2 253.6 95.4 373.5 372.8 144.7 587.1
2005 164.3 77.8 250.9 67.6 257.7 97.4 375.8 377.8 144.3 583.7
2006 166.9 79.8 264.0 63.0 271.9 99.4 381.3 388.6 145.2 589.4
2007 163.6 80.3 273.9 58.8 272.7 102.9 389.8 397.9 147.1 595.7
2008 153.9 79.4 269.6 56.7 256.4 105.1 400.7 401.6 146.1 603.7
2009 142.3 73.8 250.2 54.4 225.3 110.1 404.6 385.6 137.9 595.8
2010 137.8 71.7 245.6 53.2 228.7 111.1 410.9 384.8 136.7 579.6
2011 136.8 71.6 255.3 55.3 232.4 114.2 419.2 394.6 136.9 565.5
2012 138.6 71.7 267.0 56.1 244.1 116.1 428.2 414.1 140.7 556.8
2013 140.2 75.4 276.8 57.0 253.6 122.0 437.4 433.0 141.2 550.0
2014f 142.9 74.0 285.6 60.8 261.3 122.5 450.2 441.8 140.9 549.6
2015f 142.2 73.3 294.7 62.7 269.6 123.0 454.0 446.2 139.5 549.6
Sources: California Employment Development Department, LMID; estimates and forecasts by LAEDC.
Table 13: Los Angeles County Nonfarm Employment Annual averages, Thousands, March 2012 benchmark

Orange County
LAEDC Kyser Center for Economic Research 40 Economic Forecast, February 2014
ORANGE COUNTY
INTRODUCTION
Orange County’s agricultural (mainly orange groves) and oil industries used to
fuel much of the regional economy’s growth. However, beginning in the 1950s,
Orange County started to transform itself into a prosperous hub for the current
day high-tech, aerospace, manufacturing and tourism industries. Facilitating this
transformation was Orange County’s well educated work force. Nearly 90% of
the adult population has a high school diploma and roughly 35% has a bachelor’s
degree or higher. Quality of life is another attribute in which Orange County ranks
high amongst counties in the U.S.
The economy in Orange County has expanded at a faster pace than both the nation and the state over the past few years, a trend that continued in 2013. The unemployment rate in Orange County peaked at 9.5% in 2010, but fell to an average annual rate of 6.0% in 2013. By December 2013, the unemployment rate in Orange County stood at 5.2%, the lowest in Southern California (fourth lowest in the state) and one of the lowest in the nation. The LAEDC forecasts the unemployment rate will average 5.2% in 2014 and 4.6% in 2015.
Orange County total nonfarm employment went from being 8.5% below the peak
reached in 2006 to 6.2% below the peak in 2013, as most private industry
sectors posted an increase in payrolls last year. The largest gains were in
construction, leisure and hospitality, and healthcare and social assistance. Of the
29,800 jobs created in Orange County in 2013, 56% (or 16,800 jobs) were added
in just those three sectors.
In 2014, the LAEDC forecasts Orange County payrolls will increase by roughly
30,000 jobs (2.1%). The largest gains are expected to be in construction (5,400
jobs), professional, scientific and technical services (4,500 jobs), manufacturing
(4,000 jobs), leisure and hospitality (3,200 jobs), and administrative and support
services (2,800 jobs). The county will continue to add jobs in 2015, and will
approach the prerecession peak level of jobs (1.52 million) later in the decade.
Orange County’s manufacturing sector posted relatively strong gains last year,
as employment increased by 2,300 jobs or 1.4%. The rate of economic
expansion was one factor that contributed to the growth. Also, some of Orange
County’s small and midsized manufacturing firms are bringing back previously
outsourced operations as a result of rising shipping and labor costs overseas.
TRENDS IN MAJOR INDUSTRIES
Real Estate and Construction
Orange County’s residential real estate market continued its upward momentum
in 2013 after beginning to rebound in 2012. Sales of existing homes were
relatively strong this past year, but inventories were extremely lean. According to
the California Association of Realtors the median price of an existing single-
The economy in Orange
County has expanded at a
faster pace than both the
nation and the state over
the past few years.
In 2014, the LAEDC
forecasts Orange
County payrolls will
increase by roughly
30,000 jobs (3.1%)

Orange County
LAEDC Kyser Center for Economic Research 41 Economic Forecast, February 2014
family home in Orange County was $542,700 in 2012, which represented an
increase of 5.6% compared with 2011. In 2013, the median price jumped nearly
20% to $660,000. While still high by historical standards, foreclosures have
dropped significantly over the past two years and more quickly than other regions
in Southern California due to the improving economy. New home building gained
significant traction last year with a 63% increase in total housing permits, divided
between 4,000 single family and 4,800 multifamily permits. Stronger economic
growth and demographic pressures will push new home construction higher this
year and into 2015.
Local commercial real estate has also improved. Office and industrial vacancy
rates have inched down and lease rates have stabilized. Non-residential building
permits were up by over 15% in 2013 compared with 2012. Leasing
fundamentals should continue to strengthen this year, paving the way for strong
gains in new non-residential construction in 2014 and 2015.
Leisure and Hospitality
Consumer spending as a result of the tourism industry in Orange County is
another key economic driver for the region. Based on estimates from the Orange
County Visitor and Convention Bureau, over 44 million people visited the County
and spent in excess of $9.5 billion last year, including roughly $7 billion on
lodging, meals and beverages and amusement parks. There were an estimated
3.7 million international visitors in 2013, supporting 156,000 tourism-related jobs
last year.
Manufacturing and Exports
Orange County has a strong manufacturing sector that includes sophisticated
technology companies (especially computer related), aerospace firms and
medical device manufacturers. These sectors rely on a highly skilled workforce,
something Orange County is able to provide in abundance. Of all total nonfarm
employment in Orange County, roughly 11% are engaged in manufacturing. The
other key sectors include leisure and hospitality, health care, administrative and
support services and professional and business services along with retail trade.
Manufacturing in Orange County employs more workers in the durable goods
sector (roughly 73% of the total), producing products like computers, machinery,
and transportation equipment, with smaller but significant numbers in nondurable
goods sectors such as apparel (primarily surf and skating oriented) and food
manufacturing industries.
The county witnessed a 15% decline in manufacturing jobs over the course of the
recession. However, the county has regained 3.5% of those job losses over the
past four years, reaching 160,050 workers in 2013. Last year, durable goods
experienced an increase of over 2,700 jobs, while, non-durable goods saw a loss
of 500 jobs last year. Computer and electronic products continued to be the
largest sub-sector in 2013 with over 34,000 jobs followed by fabricated metal
products (with nearly 23,000 jobs) and transportation equipment (with roughly
14,000 jobs).
In 2013, the median
price of an existing
single-family home
reached $660,000, a
jump of nearly 20% over
the year.
Over 44 million people
visited Orange County in
2013 and spent in
excess of $9.5 billion.

Orange County
LAEDC Kyser Center for Economic Research 42 Economic Forecast, February 2014
It is important to remember that Orange County is also part of the nation’s
strongest export region (includes both goods and services) meaning the Los
Angeles Metropolitan Area (which is comprised of both LA and Orange Counties)
mainly due to its competitive and comparative advantages in manufacturing and
tourism. The Los Angeles Metropolitan Area witnessed roughly $94 billion in
exports in 2012 (most recent data). Of this total, roughly 26% or $25 billion was
related to Orange County exports.
LOOKING AHEAD
Orange County’s economy is expanding and the near-term outlook is growing
even brighter. Initially lagging behind the national recovery, Orange County’s
recovery quickly gathered strength. The region has now seen renewed
development activity – several long delayed construction projects are set to move
forward.
Consumer spending as measured by total taxable sales will post healthy gains
this year and next. Growth in both employment and personal income, along with
improvements in the housing market all point to stronger consumer spending
during the next two years.
Population growth is expected to accelerate in the near-term, providing a boost
for taxable sales in the county (and sales tax revenues to local government). Per
capita income is also expected to increase. The opportunities afforded by Orange
County’s growing high tech sectors, quality of life and congenial climate are
magnets for attracting and retaining a talented and highly skilled workforce,
which in turn, enhances the vitality of the regional economy.

Orange County
LAEDC Kyser Center for Economic Research 43 Economic Forecast, February 2014
Orange County Employment Growth, 2014
0.5%
0.6%
0.6%
1.0%
1.2%
1.3%
1.7%
1.8%
2.0%
2.1%
2.3%
2.5%
2.7%
3.9%
4.5%
7.0%
0.0% 2.0% 4.0% 6.0% 8.0%
Real Estate, Rental & Leasing
Government
Other Services
Information
Finance & Insurance
Health Services
Leisure & Hospitality
Retail Trade
Wholesale Trade
Total Nonfarm Job Growth
Admin. & Support
Manufacturing
Transportation & Utilities
Prof'l Scientific & Tech.
Management of Enterprises
Construction
Source: CA EDD, Labor Market Information Division, forecast by LAEDC
Annual Percent Change
Total nonfarm job growth forecast for 2014, percent change: +2.1%
Orange County Employment Growth, 2014
0.2
0.2
0.3
0.5
0.7
0.9
1.0
1.0
1.6
1.9
2.6
2.8
3.2
4.0
4.5
5.4
0 1 2 3 4 5 6
Information
Real Estate, Rental & Leasing
Other Services
Education
Transportation & Utilities
Government
Management of Enterprises
Finance & Insurance
Wholesale Trade
Health Services
Retail Trade
Admin. & Support
Leisure & Hospitality
Manufacturing
Prof'l Scientific & Tech.
Construction
Source: CA EDD, Labor Market Information Division, forecast by LAEDC
Total nonfarm job growth forecast for 2014 (thousands): +30.0 jobs
Orange County Employment
0.0%
1.0%
2.0%
3.0%
4.0%
5.0%
6.0%
7.0%
8.0%
9.0%
10.0%
1,250
1,300
1,350
1,400
1,450
1,500
1,550
'03 '04 '05 '06 '07 '08 '09 '10 '11 '12 '13 14f 15f
Total Nonfarm Employment Unemployment Rate
Source: EDD Labor Market Information Division; forecast by LAEDC
Annual average in thousands, 2012 benchmark
Orange County Personal
Income & Taxable Sales Growth
-20%
-15%
-10%
-5%
0%
5%
10%
0
20
40
60
80
100
120
140
160
180
200
'03 '04 '05 '06 '07 '08 '09 '10 '11 '12 '13 '14f '15f
Total Personal Income Taxable Sales Growth$Billions
Source: California Board of Equalization, Dept. of Commerce; estimate & forecast by the LAEDC
$0
$100
$200
$300
$400
$500
$600
$700
0
500
1,000
1,500
2,000
2,500
3,000
3,500
4,000
4,500
5,000
Jan-07 Jan-08 Jan-09 Jan-10 Jan-11 Jan-12 Jan-13
Home Sales
Median Home Price
Home Sales & Median Prices
Orange CountyNew and existing, single-family homes and condos
(Sales) (Price, Thousands)
Source: California Real Estate Research Council; DataQuick
Orange County Snapshot
Residential Building Permits
Issued in Orange County
64 4 4
21 1 1 2 2
45
6
45
3 5
5
21
23 3
5
6
7
0.0
2.0
4.0
6.0
8.0
10.0
12.0
14.0
'03 '04 '05 '06 '07 '08 '09 '10 '11 '12 '13 '14f '15f
Multi-Family
Single-Family
Permits issued, thousands
Source: CIRB, California Home Building Foundation, forecast by LAEDC

Orange County
LAEDC Kyser Center for Economic Research 44 Economic Forecast, February 2014
Year
Population on
July 1
(Thousands)
Nonfarm
Employment
(Ave., Thousands)
Unemploy-
ment Rate
(Ave., %)
Total
Personal
Income
($Billions)
Per Capita
Personal
Income ($)
Total Taxable
Sales
($Billions)
Total Overnight
& Day Visitors
(Millions)
Housing Unit
Permits
Issued
Nonresidential
Building
Permits
($Millions)
2003 2,939.7 1,428.9 4.8 122.5 41,805 47.5 42.7 9,311 1,006
2004 2,956.5 1,456.4 4.3 129.9 44,169 51.7 43.5 9,322 1,133
2005 2,957.2 1,490.9 3.8 138.7 47,172 55.1 44.7 7,206 1,495
2006 2,955.4 1,519.0 3.4 148.9 50,775 57.2 44.9 8,371 2,401
2007 2,965.8 1,515.8 3.9 151.0 51,492 57.3 44.3 7,072 2,005
2008 2,982.8 1,481.4 5.3 152.9 51,688 53.6 43.1 3,159 1,439
2009 2,998.8 1,371.8 8.9 145.9 48,841 45.7 42.7 2,200 952
2010 3,017.3 1,353.8 9.5 147.2 48,769 47.7 42.7 3,091 1,152
2011 3,046.8 1,368.9 8.8 154.8 50,642 51.7 42.9 4,807 1,291
2012 3,074.5 1,400.7 7.6 161.7 52,342 55.2 43.8 5,400 1,263
2013 3,104.7 1,430.1 6.1 165.1 52,865 58.0 44.3 8,800 1,454
2014f 3,138.8 1,460.1 5.2 173.9 55,033 61.3 45.2 11,100 1,725
2015f 3,173.4 1,489.3 4.6 183.6 57,454 64.9 46.6 13,200 1,875
% Change Column1 Column2 Column3 Column4 Column5 Column6 Column7 Column8 Column9
03/02 0.9% 1.8% 5.1% 4.5% 5.9% 2.4% -22.5% -16.8%
04/03 0.6% 1.9% 6.1% 5.7% 8.8% 1.7% 0.1% 12.6%
05/04 0.0% 2.4% 6.7% 6.8% 6.5% 2.8% -22.7% 32.0%
06/05 -0.1% 1.9% 7.4% 7.6% 3.9% 0.4% 16.2% 60.6%
07/06 0.4% -0.2% 1.4% 1.4% 0.2% -1.3% -15.5% -16.5%
08/07 0.6% -2.3% 1.3% 0.4% -6.4% -2.7% -55.3% -28.2%
09/08 0.5% -7.4% -4.6% -5.5% -14.7% -1.0% -30.4% -33.8%
10/09 0.6% -1.3% 0.9% -0.1% 4.3% 0.1% 40.5% 21.0%
11/10 1.0% 1.1% 5.1% 3.8% 8.5% 0.5% 55.5% 12.1%
12/11 0.9% 2.3% 4.5% 3.4% 6.7% 2.1% 12.3% -2.2%
13/12 1.0% 2.1% 2.1% 1.0% 5.2% 1.1% 63.0% 15.1%
14/13 1.1% 2.1% 5.3% 4.1% 5.7% 2.0% 26.1% 18.6%
15/14 1.1% 2.0% 5.6% 4.4% 5.9% 3.1% 18.9% 8.7%
Sources: State of California: Dept. of Finance, Employment Development Department, Board of Equalization; U.S. Dept of Commerce,
CIC Research, Inc., Construction Industry Research Board; California Homebuilding Foundation; estimates and forecasts by the LAEDC
Table 14: Orange County Economic Indicators

Orange County
LAEDC Kyser Center for Economic Research 45 Economic Forecast, February 2014
YearTotal Nonfarm
Payroll
Natural
ResourcesConstruction Manufacturing Mfg. -- Durable
Mfg .--
Nondurable
Wholesale
TradeRetail Trade
Transport. &
UtilitiesInformation
2003 1,428.9 0.5 83.7 183.9 127.2 56.7 83.2 152.8 29.0 35.2
2004 1,456.4 0.6 92.2 183.5 127.1 56.4 82.4 153.2 29.2 33.8
2005 1,490.9 0.7 99.9 182.9 128.3 54.6 83.0 158.1 28.7 32.8
2006 1,519.0 0.6 106.6 182.7 128.0 54.7 83.7 160.8 28.2 31.9
2007 1,515.8 0.6 103.1 180.4 126.2 54.2 86.9 161.2 28.9 31.2
2008 1,481.4 0.6 91.2 174.0 122.5 51.5 86.7 155.6 29.3 30.1
2009 1,371.8 0.5 74.2 154.8 109.1 45.7 79.4 142.3 27.8 27.3
2010 1,353.8 0.5 68.0 150.4 106.5 43.9 77.6 140.1 26.7 24.8
2011 1,368.9 0.5 70.8 156.3 112.8 43.5 77.0 141.3 27.4 24.0
2012 1,400.7 0.5 71.8 157.8 114.0 43.8 76.7 142.2 27.7 24.2
2013 1,430.2 0.4 77.5 160.1 115.2 44.8 78.9 141.5 27.5 24.4
2014f 1,460.1 0.5 82.9 164.1 118.1 45.9 80.5 144.1 28.2 24.6
2015f 1,491.6 0.5 92.0 165.7 119.3 46.4 82.1 146.0 28.3 24.8
YearFinance &
Insurance
Real Estate, Rental
& Leasing
Prof, Sci &
Tech Srvs
Mgmt. of
Enterprises
Admin. &
Support Srvs
Educational
Services
Health Care &
Social Asst
Leisure &
HospitalityOther Services Government
2003 88.0 34.2 96.4 32.9 119.3 18.9 107.5 158.6 46.7 154.2
2004 96.0 36.3 97.6 30.6 122.6 19.2 111.8 162.9 47.4 153.4
2005 100.9 37.5 103.2 30.0 126.9 19.8 113.7 165.0 48.4 155.3
2006 99.0 39.1 109.3 28.9 132.2 20.8 117.0 169.6 47.7 156.7
2007 89.1 38.6 113.5 27.9 127.7 21.6 121.1 172.9 47.4 159.4
2008 76.1 37.0 116.1 26.1 120.2 23.6 127.1 176.4 46.5 160.8
2009 70.6 34.5 107.3 24.3 104.8 23.4 128.8 169.1 42.6 156.6
2010 69.4 34.1 106.1 22.8 110.8 23.6 131.9 168.6 42.2 152.3
2011 73.3 34.1 109.9 23.1 113.1 24.6 137.7 177.9 43.7 148.3
2012 73.6 34.4 112.7 23.2 120.0 24.7 138.7 180.5 44.3 147.8
2013 78.1 35.4 113.7 23.1 123.4 25.2 143.3 186.6 44.8 146.3
2014f 79.1 35.5 118.1 24.2 126.2 25.6 145.2 189.8 45.1 147.2
2015f 79.3 35.6 122.9 25.1 131.3 25.9 146.9 192.0 44.9 148.2
Sources: California Employment Development Department, LMID; estimates and forecasts by LAEDC
Table 15: Orange County Nonfarm Employment Annual averages, Thousands, March 2012 benchmark
Riverside and San Bernardino Counties
LAEDC Kyser Center for Economic Research 46 Economic Forecast, February 2014
RIVERSIDE AND SAN BERNARDINO COUNTIES: THE INLAND EMPIRE
INTRODUCTION
The Inland Empire, consisting of Riverside County and San Bernardino County,
has struggled in recent years to shake off the effects of the Great Recession and
the housing crisis. The region added population throughout the recession, but at
growth rates well below those of the pre-recession years. The unemployment
rate declined by nearly two percentage points last year to an annual rate of
10.2% and the region added jobs, but the performance of the region’s major
industries was mixed. Meanwhile, housing indicators gained ground, notably new
home construction permits and home prices.
Wage and salary (nonfarm) employment in the region rose by 1.2% last year to
1.17 million jobs. The Inland Empire has regained over 40,000 of the 147,000
jobs lost during the recession, adding more than 14,000 jobs in 2013 alone.
Leisure and hospitality contributed more than half of the job gains last year with
7,500 jobs added, followed by a 2,600 increase in wholesale trade. Retail, health
care, and transportation, warehousing and utilities all added two thousand jobs or
more over the past year, while professional scientific and technical services
added 1,900 jobs. These gains were offset by a loss of 2,700 jobs in the
government sector, and declines in administrative and support services (-2,200
jobs), manufacturing (-1,500 jobs) and construction (-1,200 jobs). Real estate
rental and leasing employment, and information sector employment experienced
smaller decreases, while the remaining industries were generally flat.
Within leisure and hospitality, most of the increase was attributed to eating and
drinking establishments where nearly 6,000 jobs were added. Despite the decline
in manufacturing employment overall, the food processing industry posted a
2.1% gain over the prior year, rising to just over 10,000 workers. The decline in
administrative and support services was mainly due to cuts in temporary
employment.
The decline in construction jobs appeared to be at odds with increases in
housing permits and nonresidential construction over the past year. It should be
noted that the job counts refer to wage and salary workers employed by firms in
the Inland Empire. To the extent that construction activity is conducted by firms
headquartered outside the region, and to the extent that these firms are using
non-wage and salary workers (that is, independent contractors), the job counts
for the region are not indicative of construction activity occurring on the ground
throughout the region.
TRENDS IN MAJOR INDUSTRIES
Transportation, Logistics, and Distribution
Collectively the transportation, warehousing, and wholesale industries accounted
for nearly 121,000 wage and salary workers in 2013, or just over 10% of all
nonfarm employment in the region. About 45,000 workers were in transportation,
Employment in the Inland
Empire rose by 1.2% last
year and the unemployment
rate declined by nearly two
percentage points to an
annual rate 10.2%.

Riverside and San Bernardino Counties
LAEDC Kyser Center for Economic Research 47 Economic Forecast, February 2014
22,000 were in warehousing and storage, and nearly 54,000 were employed in
wholesale activities. The sector added over 4,500 jobs last year with wholesaling
contributing more than 2,500 jobs, warehousing 1,100, and the balance from
transportation.
The region places high hopes on its current and future role as the transportation
and distribution center to Southern California and the nation. The region’s
industrial vacancy rate continues to decline even as new industrial space has
been added in recent years. As both the U.S. and its major trading partners
experience stronger economic growth, increased levels of trade through the San
Pedro Bay ports is expected drive gains in the Inland Empire’s transportation,
logistics and distribution industries.
Real Estate
Aside from industrial property, nonresidential real estate in the Inland Empire has
a long road to recovery. On the residential side, however, the region has made
real gains in terms of home prices and construction activity. The median price of
an existing home in the Inland Empire rose above the $200,000 threshold for the
first time in five years, hitting $241,620 in 2013. The 27.6% annual increase for
the Inland Empire was the largest in the five-county area, and was due mainly to
strong demand constrained by a lean supply of homes for sale (under four
months at year end).
New home construction responded to tight market conditions and higher home
prices last year with a 46% increase in housing permits. Of the 8,829 permits in
2013, seven out of ten were single-family homes. Even so, the permit count for
last year was a fraction of the permit levels that prevailed before the recession.
The Inland Empire housing market will continue to register gains in 2014 and
2015. The supply of homes for sale should increase over the next two years, but
will fall short of long run levels. This will contribute to large price increases this
year and next. In reaction to higher prices, permit levels are expected to rise to
nearly 14,000 this year and nearly 20,000 next year. While higher permit levels
are indicative of a regional housing market that is recovering, the projected levels
for this year and next will be well below pre-recession peak levels.
LOOKING AHEAD
The Inland Empire’s unemployment rate has come down more quickly than in
other parts of Southern California, but other indicators suggest that the region is
lagging its neighbors in recovery. Momentum in the Inland Empire economy
should pick up this year and next, with job gains exceeding two percent per year
in 2014 and 2015. Nearly all private sector industries will add jobs, and even
government employment should turn the corner in 2014 with slight gains this year
and next.
The household sector of the Inland Empire will continue to heal over the next two
years. Personal income is expected to increase by 5% to 6% this year and next,
driving modest increases in total taxable sales. Per capita income will increase
The 27.6% annual increase
in the median home price in
the Inland Empire was the
largest in the Los Angeles
five-county area.

Riverside and San Bernardino Counties
LAEDC Kyser Center for Economic Research 48 Economic Forecast, February 2014
by 3.5% to 4% this year and next, as well. These developments are driving job
gains in leisure and hospitality as well as retail activity, and will contribute to full
recovery across the region in the years to come.
Looking toward the second half of the decade, the Inland Empire’s population
growth rate should accelerate as it once again becomes the destination in
Southern California to relieve pent-up demand for affordable housing and
lifestyles. The region will also recover from recession-induced job losses, finally
seeing wage and salary jobs surpass the 2007 peak of 1.27 million sometime in
late 2016 or early 2017. With its ongoing investment in transportation and
warehousing infrastructure, the region will be well-positioned to benefit from the
anticipated long-term growth trend in Pacific Rim trade. Meanwhile, industries
that serve the local population will see gains as the overall economy moves
forward.

Riverside and San Bernardino Counties
LAEDC Kyser Center for Economic Research 49 Economic Forecast, February 2014
Inland Empire Employment Growth, 2014
0.0
0.1
0.2
0.4
0.8
0.8
1.0
1.2
1.5
1.7
2.3
2.5
2.8
3.2
3.2
0 0 0 0 0 0 0 0
Management of Enterprises
Real Estate, Rental & Leasing
Information
Finance & Insurance
Other Services
Admin. & Support
Education
Manufacturing
Transportation & Utilities
Wholesale Trade
Prof'l Scientific & Tech.
Government
Health Services
Leisure & Hospitality
Retail Trade
Source: CA EDD, Labor Market Information Division, forecast by LAEDC
Total nonfarm job growth forecast for 2014 (thousands): 25.7 jobs
Inland Empire Employment Growth, 2014
0.7%
1.0%
1.1%
1.4%
1.5%
1.8%
1.9%
1.9%
2.1%
2.1%
2.2%
2.3%
3.2%
5.6%
5.9%
6.7%
0.0% 2.0% 4.0% 6.0% 8.0%
Real Estate, Rental & …
Admin. & Support
Government
Manufacturing
Finance & Insurance
Information
Other Services
Retail Trade
Transportation & Utilities
Health Services
Total Nonfarm Job Growth
Leisure & Hospitality
Wholesale Trade
Educational Services
Prof'l Scientific & Tech.
Construction
Source: CA EDD, Labor Market Information Division, forecast by LAEDC
Annual Percent Change
Total nonfarm job growth forecast for 2014, percent change: +2.2%
Inland Empire Employment
0.0%
2.0%
4.0%
6.0%
8.0%
10.0%
12.0%
14.0%
16.0%
1,000
1,050
1,100
1,150
1,200
1,250
1,300
'03 '04 '05 '06 '07 '08 '09 '10 '11 '12 '13 '14f '15f
Total Nonfarm Employment Unemployment Rate
Source: EDD Labor Market Information Division; forecast by LAEDC
Annual average in thousands, 2012 benchmark
Inland Empire Personal Income
& Taxable Sales Growth
-20%
-15%
-10%
-5%
0%
5%
10%
15%
20%
0
20
40
60
80
100
120
140
160
180
'03 '04 '05 '06 '07 08 '09 '10 '11 '12 '13 '14f '15f
Total Personal Income Taxable Sales Growth$Billions
Source: California Board of Equalization, Dept. of Commerce; estimate & forecast by the LAEDC
$0
$50
$100
$150
$200
$250
$300
$350
$400
$450
0
1,000
2,000
3,000
4,000
5,000
6,000
7,000
Jan-06 Jan-07 Jan-08 Jan-09 Jan-10 Jan-11 Jan-12 Jan-13
Home Sales
Median Home Price
Home Sales & Median Prices
Riverside CountyNew and existing, single-family homes and condos
(Sales) (Price, Thousands)
Source: California Real Estate Research Council; DataQuick
$0
$50
$100
$150
$200
$250
$300
$350
$400
0
500
1,000
1,500
2,000
2,500
3,000
3,500
4,000
4,500
5,000
Jan-06 Jan-07 Jan-08 Jan-09 Jan-10 Jan-11 Jan-12 Jan-13
Home Sales
Median Home Price
Home Sales & Median Prices
San Bernardino CountyNew and existing, single-family homes and condos
(Sales) (Price, Thousands)
Source: California Real Estate Research Council; DataQuick
Inland Empire Snapshot
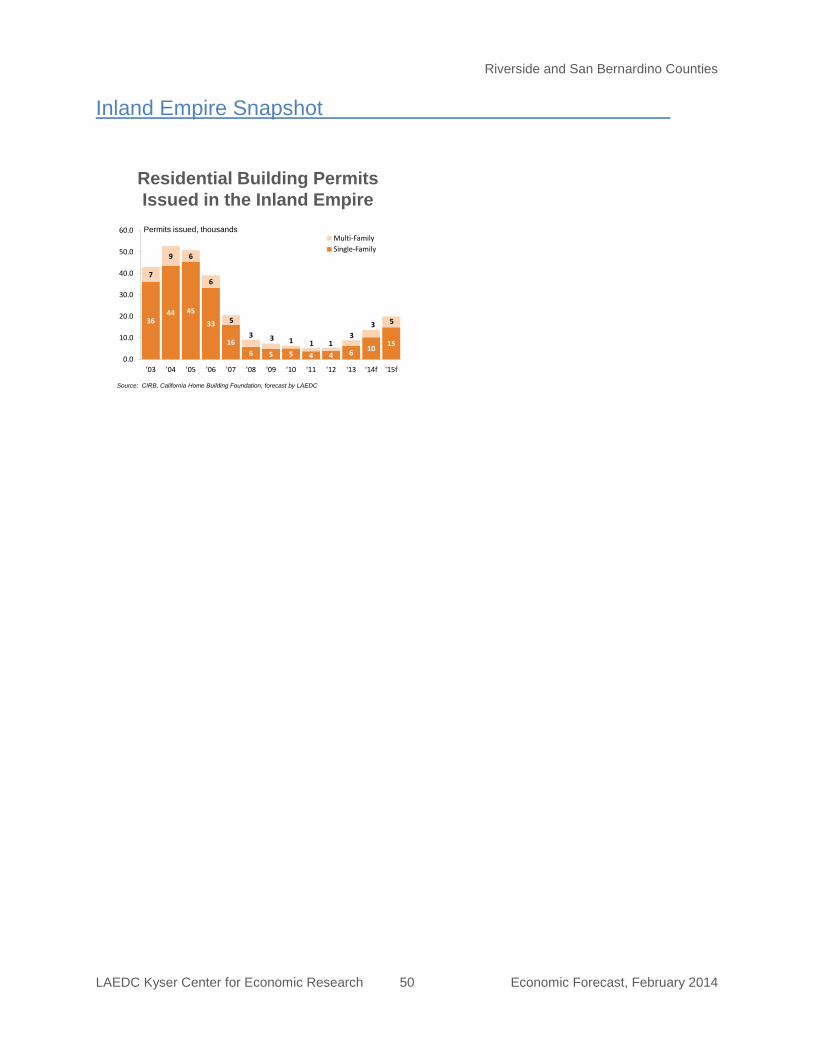
Riverside and San Bernardino Counties
LAEDC Kyser Center for Economic Research 50 Economic Forecast, February 2014
Residential Building Permits
Issued in the Inland Empire
3644 45
33
16
6 5 5 4 4 610
15
7
9 6
6
5
3 3 1 1 13
3 5
0.0
10.0
20.0
30.0
40.0
50.0
60.0
'03 '04 '05 '06 '07 '08 '09 '10 '11 '12 '13 '14f '15f
Multi-Family
Single-Family
Permits issued, thousands
Source: CIRB, California Home Building Foundation, forecast by LAEDC
Inland Empire Snapshot
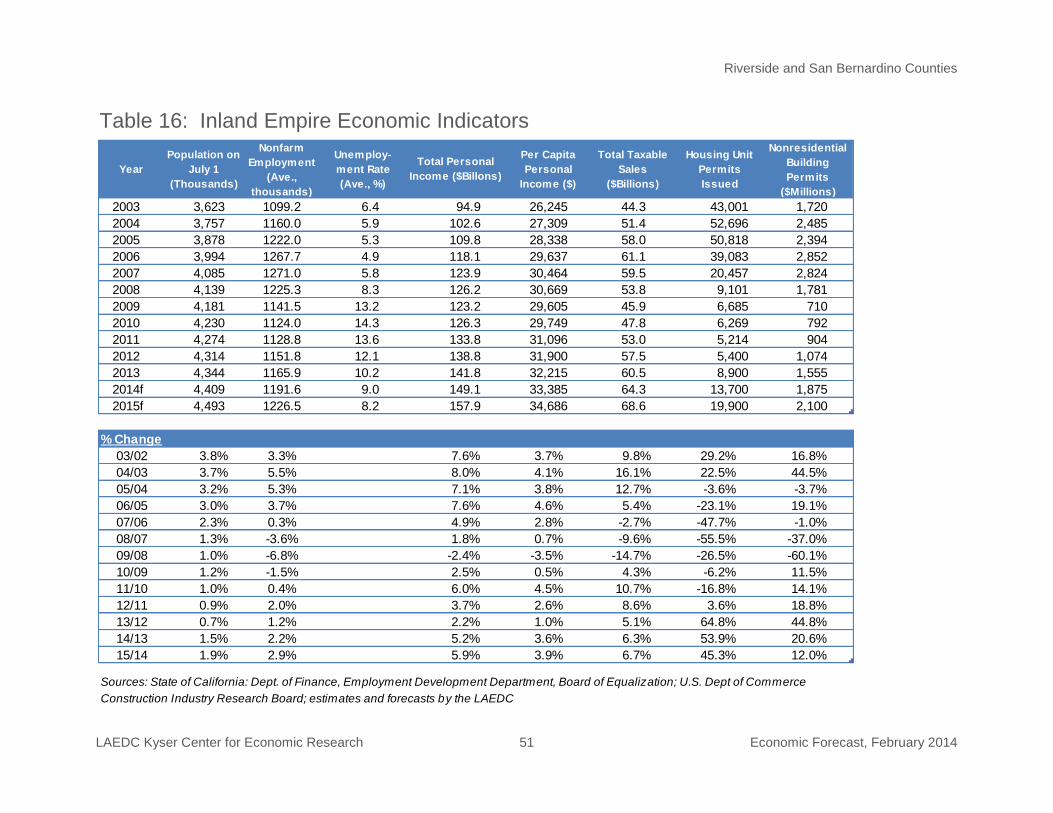
Riverside and San Bernardino Counties
LAEDC Kyser Center for Economic Research 51 Economic Forecast, February 2014
Year
Population on
July 1
(Thousands)
Nonfarm
Employment
(Ave.,
thousands)
Unemploy-
ment Rate
(Ave., %)
Total Personal
Income ($Billons)
Per Capita
Personal
Income ($)
Total Taxable
Sales
($Billions)
Housing Unit
Permits
Issued
Nonresidential
Building
Permits
($Millions)
2003 3,623 1099.2 6.4 94.9 26,245 44.3 43,001 1,720
2004 3,757 1160.0 5.9 102.6 27,309 51.4 52,696 2,485
2005 3,878 1222.0 5.3 109.8 28,338 58.0 50,818 2,394
2006 3,994 1267.7 4.9 118.1 29,637 61.1 39,083 2,852
2007 4,085 1271.0 5.8 123.9 30,464 59.5 20,457 2,824
2008 4,139 1225.3 8.3 126.2 30,669 53.8 9,101 1,781
2009 4,181 1141.5 13.2 123.2 29,605 45.9 6,685 710
2010 4,230 1124.0 14.3 126.3 29,749 47.8 6,269 792
2011 4,274 1128.8 13.6 133.8 31,096 53.0 5,214 904
2012 4,314 1151.8 12.1 138.8 31,900 57.5 5,400 1,074
2013 4,344 1165.9 10.2 141.8 32,215 60.5 8,900 1,555
2014f 4,409 1191.6 9.0 149.1 33,385 64.3 13,700 1,875
2015f 4,493 1226.5 8.2 157.9 34,686 68.6 19,900 2,100
% Change Column1 Column2 Column3 Column4 Column5 Column6 Column7 Column8
03/02 3.8% 3.3% 7.6% 3.7% 9.8% 29.2% 16.8%
04/03 3.7% 5.5% 8.0% 4.1% 16.1% 22.5% 44.5%
05/04 3.2% 5.3% 7.1% 3.8% 12.7% -3.6% -3.7%
06/05 3.0% 3.7% 7.6% 4.6% 5.4% -23.1% 19.1%
07/06 2.3% 0.3% 4.9% 2.8% -2.7% -47.7% -1.0%
08/07 1.3% -3.6% 1.8% 0.7% -9.6% -55.5% -37.0%
09/08 1.0% -6.8% -2.4% -3.5% -14.7% -26.5% -60.1%
10/09 1.2% -1.5% 2.5% 0.5% 4.3% -6.2% 11.5%
11/10 1.0% 0.4% 6.0% 4.5% 10.7% -16.8% 14.1%
12/11 0.9% 2.0% 3.7% 2.6% 8.6% 3.6% 18.8%
13/12 0.7% 1.2% 2.2% 1.0% 5.1% 64.8% 44.8%
14/13 1.5% 2.2% 5.2% 3.6% 6.3% 53.9% 20.6%
15/14 1.9% 2.9% 5.9% 3.9% 6.7% 45.3% 12.0%
Sources: State of California: Dept. of Finance, Employment Development Department, Board of Equalization; U.S. Dept of Commerce
Construction Industry Research Board; estimates and forecasts by the LAEDC
Table 16: Inland Empire Economic Indicators
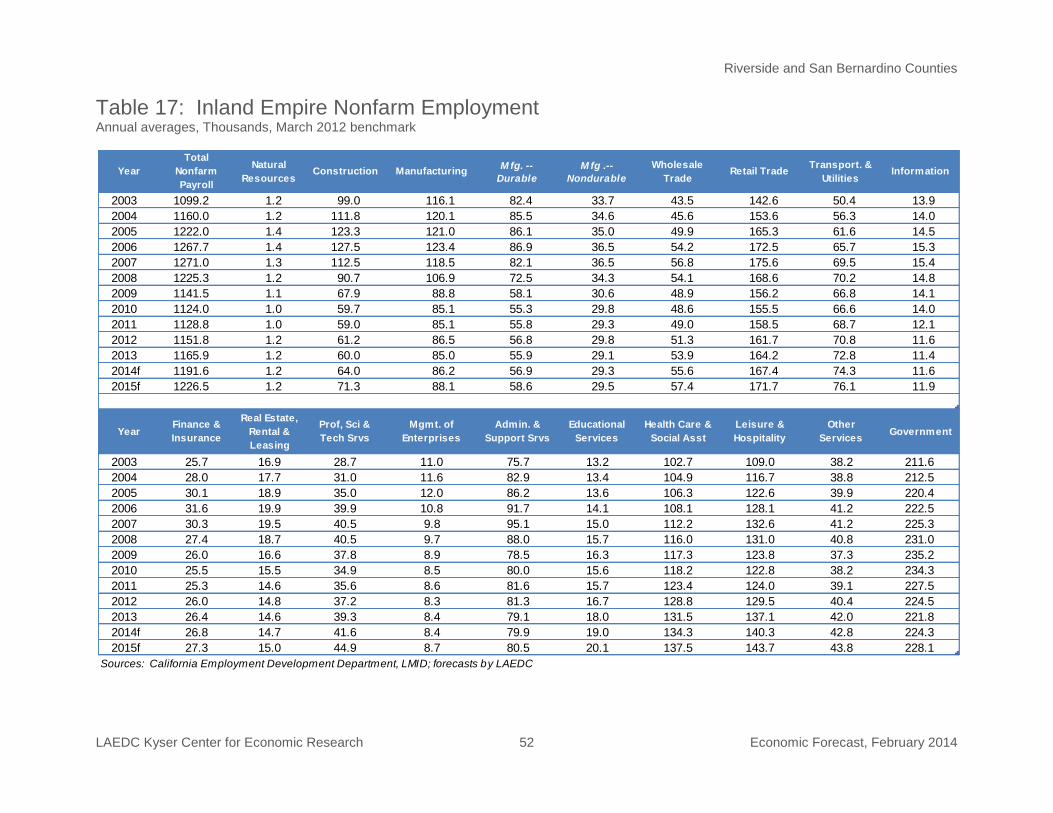
Riverside and San Bernardino Counties
LAEDC Kyser Center for Economic Research 52 Economic Forecast, February 2014
Table 17: Inland Empire Nonfarm Employment Annual averages, Thousands, March 2012 benchmark
Year
Total
Nonfarm
Payroll
Natural
ResourcesConstruction Manufacturing
M fg. --
Durable
M fg .--
Nondurable
Wholesale
TradeRetail Trade
Transport. &
Utilities Information
2003 1099.2 1.2 99.0 116.1 82.4 33.7 43.5 142.6 50.4 13.9
2004 1160.0 1.2 111.8 120.1 85.5 34.6 45.6 153.6 56.3 14.0
2005 1222.0 1.4 123.3 121.0 86.1 35.0 49.9 165.3 61.6 14.5
2006 1267.7 1.4 127.5 123.4 86.9 36.5 54.2 172.5 65.7 15.3
2007 1271.0 1.3 112.5 118.5 82.1 36.5 56.8 175.6 69.5 15.4
2008 1225.3 1.2 90.7 106.9 72.5 34.3 54.1 168.6 70.2 14.8
2009 1141.5 1.1 67.9 88.8 58.1 30.6 48.9 156.2 66.8 14.1
2010 1124.0 1.0 59.7 85.1 55.3 29.8 48.6 155.5 66.6 14.0
2011 1128.8 1.0 59.0 85.1 55.8 29.3 49.0 158.5 68.7 12.1
2012 1151.8 1.2 61.2 86.5 56.8 29.8 51.3 161.7 70.8 11.6
2013 1165.9 1.2 60.0 85.0 55.9 29.1 53.9 164.2 72.8 11.4
2014f 1191.6 1.2 64.0 86.2 56.9 29.3 55.6 167.4 74.3 11.6
2015f 1226.5 1.2 71.3 88.1 58.6 29.5 57.4 171.7 76.1 11.9
YearFinance &
Insurance
Real Estate,
Rental &
Leasing
Prof, Sci &
Tech Srvs
Mgmt. of
Enterprises
Admin. &
Support Srvs
Educational
Services
Health Care &
Social Asst
Leisure &
Hospitality
Other
Services Government
2003 25.7 16.9 28.7 11.0 75.7 13.2 102.7 109.0 38.2 211.6
2004 28.0 17.7 31.0 11.6 82.9 13.4 104.9 116.7 38.8 212.5
2005 30.1 18.9 35.0 12.0 86.2 13.6 106.3 122.6 39.9 220.4
2006 31.6 19.9 39.9 10.8 91.7 14.1 108.1 128.1 41.2 222.5
2007 30.3 19.5 40.5 9.8 95.1 15.0 112.2 132.6 41.2 225.3
2008 27.4 18.7 40.5 9.7 88.0 15.7 116.0 131.0 40.8 231.0
2009 26.0 16.6 37.8 8.9 78.5 16.3 117.3 123.8 37.3 235.2
2010 25.5 15.5 34.9 8.5 80.0 15.6 118.2 122.8 38.2 234.3
2011 25.3 14.6 35.6 8.6 81.6 15.7 123.4 124.0 39.1 227.5
2012 26.0 14.8 37.2 8.3 81.3 16.7 128.8 129.5 40.4 224.5
2013 26.4 14.6 39.3 8.4 79.1 18.0 131.5 137.1 42.0 221.8
2014f 26.8 14.7 41.6 8.4 79.9 19.0 134.3 140.3 42.8 224.3
2015f 27.3 15.0 44.9 8.7 80.5 20.1 137.5 143.7 43.8 228.1
Sources: California Employment Development Department, LMID; forecasts by LAEDC

San Diego County
LAEDC Kyser Center for Economic Research 53 Economic Forecast, February 2014
SAN DIEGO COUNTY
INTRODUCTION
San Diego County is a thriving innovation hub for the telecommunications,
medical device, and biotechnology industries. San Diego County’s life sciences
sector ranks second in the nation just behind Boston-Cambridge in terms of
employment, establishments, and venture capital.3 San Diego County also has a
significant high-tech manufacturing sector and is a popular travel destination.
The unemployment rate in San Diego County peaked in 2010 at 10.5%, but by
2013 had fallen to an average annual rate of 7.4%. The LAEDC forecasts the
unemployment rate will decline to 6.4% in 2014 and to 5.6% in 2015.
Last year, the number of nonfarm jobs in San Diego County was just 2.0% below
the peak level reached in 2007, and by 2015 the LAEDC forecasts job growth will
finally push employment above pre-downturn levels. Growth has been broad-
based with every private sector except manufacturing adding jobs in 2013. By
the end of 2014, the LAEDC forecasts county payrolls will increase by 24,400
jobs (1.9%).
Consumer spending as measured by total taxable sales is also on the upswing.
Although the unemployment rate is still elevated (the 10-year average prior to
2008 was 4.3%), job and income growth, along with the housing market
recovery, are providing consumers with the means to increase spending. High
educational attainment, which generally results in better-paying jobs, and growth
in high-tech industries will provide a boost to the region’s per capita income as
well.
There is also a rising trend in population growth, most of which has come from
natural population growth (i.e. births outnumbering deaths as opposed to
immigration). Population growth will accelerate in the near term due to
improvements in the housing market, the region’s booming tech sector, and the
high quality of life to be found in San Diego. As the population of San Diego
County grows, total taxable sales will also increase, boosting business activity,
job creation and local government revenues.
TRENDS IN MAJOR INDUSTRIES
Aerospace and Defense
The aerospace and defense sector in San Diego County is an integral part of the
region’s economy. Military spending will be flat or down slightly this year, but the
industry is bracing for uncertain and possibly severe cuts to the Pentagon’s
budget in the years ahead. Although defense-related firms are rightly concerned
3 Jones Lang LaSalle, Life Sciences Cluster Report, Global 2012
Last year, the number of
nonfarm jobs was just 2.0%
below the peak level
reached in 2007 and by
2015, the LAEDC forecasts
job growth will finally push
employment in San Diego
County above pre-downturn
levels.

San Diego County
LAEDC Kyser Center for Economic Research 54 Economic Forecast, February 2014
about Pentagon budget cuts, a significant amount of the work being done by
local contractors is related to the development of systems that are likely to
continue growing even as defense budgets are cut: unmanned aerial vehicles,
cyber security, intelligence surveillance, and defense-related electronics and
software.
Agriculture
While smaller than it once was, San Diego’s agricultural industry is still significant
(ranking 19th largest in the U.S.) and has a higher dollar-value per acre
($479,000) than any other county in California. In 2013, farm employment was
down by 0.9% to 9,700 workers compared with the prior year. The largest
commercial crops were nursery plants and avocados. In spite of having what the
National Weather Service describes as the most nearly perfect climate in the
country, San Diego growers do face some considerable challenges – land costs
are high and water supply is an ongoing concern, specifically the increasing cost
of water. Questions regarding water supply in the long-term loom large as well.
Biotechnology and Health Care
San Diego’s biotechnology and health care sectors added jobs and services to
the region. In 2013, the San Diego region ranked ninth in the nation (the
“Midwest” was eighth) in the amount of venture capital invested – much of it
going to the biotechnology sector. Of the 50 life sciences companies across the
country that went public last year, seven were located in San Diego.4
Health care services continue to expand. Several new hospital facilities opened
in 2013 and more are on the way. These include the newly completed $456
million naval hospital at Camp Pendleton and the Scripps Proton Therapy
Center, which is expected to attract patients from around the world. Considering
the advanced state of the region’s health care industry, San Diego has the
potential to become a hub for medical tourism. The region is also home to a large
number of retirees who typically require more health care services.
Tourism and Hospitality
San Diego’s travel and tourism industry is growing. With demand for hotel rooms
outpacing new supply, fundamentals in the lodging sector should continue to
improve. Occupancy rates hit 80.4% in the third quarter of 2013 compared with
79.4% during the same period in 2012. Average daily room rates have also
accelerated, rising to $150.89 and surpassing the previous peak set in 2008.
New hotel construction is still at very low levels, but financing for hospitality
projects is finally beginning to thaw. In the meantime, hotels are undergoing
extensive renovations, including the three largest by room count, clustered
around the convention center.
4 San Diego Business Journal, V34 n. 49; December 9-15, 2013
In 2013, the San Diego
region ranked 9th in the
nation in the amount of
venture capital invested
– much of it going to the
biotechnology sector.
San Diego County
LAEDC Kyser Center for Economic Research 55 Economic Forecast, February 2014
The number of San Diego visitors (day and overnight) rose by 2.2% in 2013 to 33
million. Visitor expenditures exceeded $8.3 billion last year. Visitor counts are
expected to increase by 1.6% to 33.5 million in 2014 and total expenditures by
5.4% to $8.8 billion. Longer term, visitor growth is forecast to rise above two
percent in 2015 before setting down to an average growth rate of 1.8%.
Spending growth will slow after 2014, but remain stable through 2016.5
LOOKING AHEAD
San Diego’s economy is moving in the right direction; the pace of growth since
the recovery can only be described as moderate, but momentum is building. The
region is investing in infrastructure that will improve long-term growth prospects,
including upgrades to Lindberg Field and a project to expand the border crossing
at San Ysidro.
The quality of life is among the best in the nation and the region’s population has
higher levels of educational attainment relative to the state overall. About 85% of
the adult population has a high school diploma or more, while 34% has a
bachelor’s degree or higher.
San Diego has the benefit of a near perfect climate, a key attribute that attracts a
well-educated and talented workforce and a steady influx of well-off retirees. San
Diego has become one of the nation’s leading innovation hubs. The presence of
the U.S Navy and Marine Corps also makes a significant contribution to the
region’s economy.
5 Tourism Economics, San Diego County Travel Forecast, December 2013

San Diego County
LAEDC Kyser Center for Economic Research 56 Economic Forecast, February 2014
Residential Building Permits
Issued in San Diego County
10 108
5 4 2 2 2 2 2 24
6
9 8
7
6
4
31 1
3 46
7
9
0.0
2.0
4.0
6.0
8.0
10.0
12.0
14.0
16.0
18.0
20.0
'03 '04 '05 '06 '07 '08 '09 '10 '11 '12 '13 '14f '15f
Multi-Family
Single-Family
Permits issued, thousands
Source: CIRB, California Home Building Foundation, forecast by LAEDC
San Diego County Personal
Income & Taxable Sales Growth
-15%
-10%
-5%
0%
5%
10%
0
20
40
60
80
100
120
140
160
180
200
'03 '04 '05 '06 '07 '08 '09 '10 '11 '12 '13 14f 15f
Total Personal Income Taxable Sales Growth$Billions
Source: California Board of Equalization, Dept. of Commerce; estimate & forecast by the LAEDC
San Diego County Employment Growth, 2014
-0.2
0.0
0.0
0.1
0.2
0.6
0.8
1.5
1.6
1.8
2.0
2.2
3.1
3.3
3.5
3.8
-0.5 0 0.5 1 1.5 2 2.5 3 3.5 4 4.5
Other Services
Real Estate, Rental & Leasing
Finance & Insurance
Information
Mgmt. of Enterprises
Wholesale Trade
Transportation & Utilities
Government
Manufacturing
Education
Health Services
Retail Trade
Prof'l Scientific & Tech.
Leisure & Hospitality
Admin. & Support
Construction
Source: CA EDD, Labor Market Information Division; forecast by LAEDC
Total nonfarm job growth forecast for 2014 (thousands): +24.6 jobs
San Diego County Employment Growth, 2014
-0.3%
0.0%
0.0%
0.3%
0.7%
1.1%
1.3%
1.5%
1.6%
1.7%
1.9%
2.0%
2.5%
2.9%
4.3%
6.6%
-1.0% 0.0% 1.0% 2.0% 3.0% 4.0% 5.0% 6.0% 7.0% 8.0%
Other Services
Real Estate, Rental & Leasing
Finance & Insurance
Information
Government
Management of Enterprises
Wholesale Trade
Health Services
Retail Trade
Manufacturing
Total Nonfarm Employment
Leisure & Hospitality
Prof'l Scientific & Tech.
Transportation & Utilities
Admin. & Support
Construction
Source: CA EDD, Labor Market Information Division, forecast by LAEDC
Total nonfarm job growth forecast for 2014, percent change: +1.9%
Annual Percent Change
$0
$100
$200
$300
$400
$500
$600
0
500
1,000
1,500
2,000
2,500
3,000
3,500
4,000
4,500
5,000
Jan-06 Jan-07 Jan-08 Jan-09 Jan-10 Jan-11 Jan-12 Jan-13
Home Sales
Median Home Price
(Sales) (Price, Thousands)
Source: California Real Estate Research Council; DataQuick
Home Sales & Median Prices
San Diego CountyNew and existing, single-family homes and condos
San Diego County Employment
0.0%
2.0%
4.0%
6.0%
8.0%
10.0%
12.0%
1,160
1,180
1,200
1,220
1,240
1,260
1,280
1,300
1,320
1,340
1,360
'03 '04 '05 '06 '07 '08 '09 '10 '11 '12 '13 '14f '15f
Total Nonfarm Employment Unemployment Rate
Source: EDD Labor Market Information Division; forecast by LAEDC
Annual average in thousands, 2012 benchmark
San Diego County Snapshot

San Diego County
LAEDC Kyser Center for Economic Research 57 Economic Forecast, February 2014
Year
Population on
July 1
(Thousands)
Nonfarm
Employment (Ave.,
Thousands)
Unemploy-
ment Rate
(Ave., %)
Total
Personal
Income
($Billions)
Per Capita
Personal
Income ($)
Total Taxable
Sales ($Billions)
Value of Two-
way Trade
($Billions)
Total
Overnight &
Day Visitors
(Millions)
Housing Unit
Permits
Issued
Nonresidential
Building
Permits
($Millions)
Chg. In CPI
(%)
2003 2,944.0 1,240.2 5.2 110.2 37,796 40.9 35.6 32.1 18,314 1,169 3.7%
2004 2,963.4 1,259.9 4.7 118.2 40,345 44.5 39.4 31.8 17,306 1,288 3.7%
2005 2,970.1 1,281.9 4.3 123.4 42,012 46.7 43.2 31.8 15,258 1,382 3.7%
2006 2,982.8 1,301.6 4.0 130.5 44,266 47.8 50.5 32.2 10,777 1,622 3.4%
2007 3,014.2 1,308.8 4.6 136.1 45,742 47.5 53.9 31.6 7,445 1,417 2.3%
2008 3,051.3 1,298.9 6.0 141.6 46,851 45.3 53.4 31.1 5,154 1,062 3.9%
2009 3,077.6 1,231.2 9.6 137.0 44,767 39.7 43.9 29.6 2,990 584 0.0%
2010 3,104.6 1,222.5 10.5 141.0 45,431 41.6 48.4 29.9 3,346 659 1.3%
2011 3,125.8 1,233.3 10.0 150.8 48,066 45.1 52.6 31.1 5,223 1,006 3.0%
2012 3,153.9 1,258.8 8.9 158.0 49,719 48.0 56.4 32.3 6,193 1,089 1.6%
2013 3,182.1 1,281.9 7.4 161.6 50,216 50.4 59.0 33.0 8,100 1,379 1.2%
2014f 3,220.3 1,306.5 6.4 170.3 52,275 53.2 61.5 33.5 11,200 1,450 1.4%
2015f 3,258.9 1,332.6 5.6 179.5 54,471 56.4 65.9 34.2 14,900 1,550 1.8%
% Change Column1 Column2 Column3 Column4 Column5 Column6 Column7 Column8 Column9 Column10
03/02 1.2% 0.8% 4.9% 4.4% 5.9% -0.5% -0.3% 16.4% 0.0%
04/03 0.7% 1.6% 7.3% 6.7% 8.8% 10.7% -0.8% -5.5% 10.2%
05/04 0.2% 1.7% 4.4% 4.1% 5.0% 9.6% -0.2% -11.8% 7.3%
06/05 0.4% 1.5% 5.7% 5.4% 2.5% 17.0% 1.3% -29.4% 17.4%
07/06 1.1% 0.6% 4.3% 3.3% -0.7% 6.6% -2.0% -30.9% -12.6%
08/07 1.2% -0.8% 4.0% 2.4% -4.5% -0.8% -1.5% -30.8% -25.1%
09/08 0.9% -5.2% -3.2% -4.4% -12.4% -17.8% -4.8% -42.0% -45.0%
10/09 0.9% -0.7% 2.9% 1.5% 4.8% 10.2% 0.9% 11.9% 12.8%
11/10 0.7% 0.9% 7.0% 5.8% 8.3% 8.6% 4.3% 56.1% 52.6%
12/11 0.9% 2.1% 4.7% 3.4% 6.4% 7.3% 3.6% 18.6% 8.3%
13/12 0.9% 1.8% 2.3% 1.0% 5.2% 4.6% 2.3% 30.8% 26.6%
14/13 1.2% 1.9% 5.4% 4.1% 5.5% 4.2% 1.5% 38.3% 5.1%
15/14 1.2% 2.0% 5.4% 4.2% 6.0% 7.2% 2.1% 33.0% 6.9%
Sources: State of California: Dept. of Finance, Employment Development Department, Board of Equalization; U.S. Dept of Commerce,
CIC Research, Inc., Construction Industry Research Board; California Homebuilding Foundation; estimates and forecasts by the LAEDC
Table 18: San Diego County Economic Indicators

San Diego County
LAEDC Kyser Center for Economic Research 58 Economic Forecast, February 2014
YearTotal Nonfarm
PayrollNatural Resources Construction Manufacturing M fg. -- Durable
M fg .--
Nondurable
Wholesale
TradeRetail Trade
Transport. &
UtilitiesInformation
2003 1,240.2 0.3 80.2 105.3 78.8 26.5 41.6 140.8 27.3 33.4
2004 1,259.9 0.4 87.7 104.3 78.1 26.2 41.9 144.9 28.4 32.5
2005 1,281.9 0.4 90.8 104.5 79.1 25.4 43.6 147.4 28.4 32.6
2006 1,301.6 0.5 92.7 103.9 78.4 25.5 45.1 148.3 28.7 31.7
2007 1,308.8 0.4 87.0 102.5 77.3 25.2 45.5 148.1 28.8 31.3
2008 1,298.9 0.4 76.1 102.8 78.1 24.7 44.9 142.0 29.0 31.4
2009 1,231.2 0.4 61.1 95.3 73.1 22.2 40.6 131.6 27.3 28.2
2010 1,222.5 0.4 55.4 92.9 71.0 21.9 40.1 130.7 26.5 25.1
2011 1,233.3 0.4 55.2 93.1 70.9 22.2 41.3 133.4 26.1 24.2
2012 1,258.8 0.4 56.3 93.5 70.7 22.8 43.5 135.6 27.6 24.6
2013 1,281.9 0.4 58.4 92.6 69.9 22.7 43.8 137.0 28.8 24.7
2014f 1,306.5 0.4 62.3 94.2 71.2 23.0 44.4 139.2 29.6 24.8
2015f 1,332.6 0.4 69.3 95.2 72.0 23.2 44.8 140.7 30.0 25.0
YearFinance &
Insurance
Real Estate, Rental
& Leasing
Prof, Sci &
Tech Srvs
Mgmt. of
Enterprises
Admin. &
Support Srvs
Educational
Services
Health Care &
Social Asst
Leisure &
Hospitality
Other
ServicesGovernment
2003 51.2 28.8 105.1 19.1 80.5 18.8 103.0 140.7 46.8 217.3
2004 52.8 29.1 103.9 18.2 86.6 20.1 101.6 145.7 47.9 214.3
2005 53.5 29.7 110.8 17.4 87.2 21.1 101.4 149.6 48.8 215.1
2006 53.2 30.5 115.3 16.9 87.1 21.3 103.8 156.5 48.4 217.9
2007 50.2 30.1 118.6 16.1 88.4 22.0 107.6 161.8 48.3 222.4
2008 46.1 29.2 120.4 15.9 85.9 24.4 112.9 164.0 48.4 225.1
2009 43.3 26.5 116.7 16.0 74.1 26.7 117.5 154.8 46.8 224.5
2010 41.3 25.9 117.5 17.1 73.2 25.4 120.2 154.5 46.1 230.4
2011 42.7 25.6 118.6 17.5 73.7 27.1 125.4 155.6 47.6 228.3
2012 43.6 25.9 120.9 18.0 76.6 28.4 126.1 161.0 49.3 227.6
2013 44.0 25.9 122.8 18.3 80.4 30.2 129.9 166.1 50.3 228.5
2014f 44.1 26.0 125.9 18.5 83.9 32.0 131.8 169.4 50.1 230.0
2015f 44.1 26.0 131.9 18.8 87.5 33.4 133.1 172.1 50.0 230.8
Sources: California Employment Development Department, LMID; estimates and forecasts by LAEDC
Table 19: San Diego County Nonfarm Employment Annual averages in thousands, March 2012 Benchmark
Ventura County
LAEDC Kyser Center for Economic Research 59 Economic Forecast, February 2014
VENTURA COUNTY
INTRODUCTION
Ventura County is the smallest of the counties in the Los Angeles five-county
region based on population, but it is home to a broad array of industries that
include agriculture, professional business services, technology, and tourism. Fine
dining, wine tasting, a myriad of outdoor activities and 43 miles of coastline
attract visitors seeking to get away for the weekend or needing a stopover point
between Los Angeles and San Francisco. This has certainly helped Ventura
County’s leisure and hospitality sector this past year.
Ventura County is not only a port of call for travelers but is also a shipping hub for
automobiles and agricultural goods. Port Hueneme serves as a distribution point
for automobile manufacturers and is a collection point for many agricultural
goods that are shipped throughout the nation. In 2013, the port handled 4.9
million tons of cargo with total two-way trade valued at $8.3 billion.
On an annual basis, Ventura County’s unemployment rate dropped from 9.0% in
2012 to 7.6% in 2013. However, among the Tri-Counties area, Ventura lags
behind San Luis Obispo County (with an unemployment rate of 6.4%) and Santa
Barbara County (6.6%). Although 7.6% represents a significant improvement, the
unemployment rate remains elevated compared with prerecession averages. The
LAEDC expects the unemployment rate will drop half a percentage point in 2014
to 6.8% and by another half of a percentage point in 2015 to 6.3%.
Nonfarm employment grew by 1.7% last year, averaging 283,600 nonfarm jobs
during 2013. Despite adding jobs over the past three years, Ventura County
nonfarm employment in 2013 was 14,200 jobs below the peak level reached in
2006, corresponding more closely to levels last seen in the early part of the
2000s. The LAEDC forecasts nonfarm employment to grow at a modest pace of
1.8% for both 2014 and 2015.
Ventura had some clear winners in 2013. Among the best performing sectors
were leisure and hospitality (accounting for nearly two-thirds of the total nonfarm
job gains in the county), construction, health care, wholesale trade, and
professional scientific and technical services. Administrative and support services
also improved through the year, largely because of increases in temporary
employment.
TRENDS IN MAJOR INDUSTRIES
Tourism
Ventura boasts a strong market for tourists looking for an alternative to the higher
priced Santa Barbara area. Benefits include the short distance from Los Angeles
County and more affordable lodging. Gains are expected for 2014. The number
of occupied rooms is expected to increase by 1.3% with hotel occupancy rates

Ventura County
LAEDC Kyser Center for Economic Research 60 Economic Forecast, February 2014
reaching 69.2%, and average daily room rates rising by 3.0%. The revenue per
available room should increase by 4.4% to $73.56.
Housing and Consumer Spending
The Ventura County housing market saw positive developments in both home
prices and sales volumes in 2013. The median price for an existing single-family
home rose to $428,100, an increase of 20.2% compared with 2012. Similar to
other regions in Southern California, increased demand for housing is
constrained by tight lending standards and limited supplies of homes for sale.
The LAEDC expects Ventura County’s population to increase at a moderate pace
for the next two years, growing to 854,700 individuals by 2015. Total personal
income should increase by 4.7% this year and by 5.0% the following year. As
long as job growth continues to accelerate at its current pace, per capita income
will rise by 3.8% this year and by 4.1% in 2015. For 2014, consumer spending is
also expected to see strong growth.
LOOKING AHEAD
The Ventura County economy will advance broadly over the next two years. The
LAEDC forecasts expansion in all private industry sectors in 2014 with similar
gains in 2015. Leisure and hospitality, health care, and retail trade will lead the
way. The construction sector will also post notable gains as new home building,
and to a lesser extent, nonresidential development, will recover The fastest
growing occupations will be network systems and data communications analysts,
home health aides, pharmacy technicians, physical therapists, and fitness
trainers. The next three to five years should see continued growth across the
county’s major industries.

Ventura County
LAEDC Kyser Center for Economic Research 61 Economic Forecast, February 2014
Ventura County Employment Growth, 2014
Source: CA EDD, Labor Market Information Division, forecast by LAEDC
Total nonfarm job growth forecast for 2014 (thousands): +5.2 jobs
0.0
0.0
0.0
0.0
0.1
0.1
0.1
0.2
0.2
0.3
0.3
0.4
0.6
0.7
0.7
1.2
0 0.2 0.4 0.6 0.8 1 1.2 1.4
Mgmt. of Enterprises
Information
Other Services
Real Estate, Rental & Leasing
Transportation & Utilities
Education
Finance & Insurance
Admin. & Support
Prof'l Scientific & Tech.
Government
Wholesale Trade
Manufacturing
Construction
Health Services
Retail Trade
Leisure & Hospitality
Ventura County Employment Growth, 2014
0.0%
0.4%
0.4%
0.6%
0.8%
1.4%
1.4%
1.4%
1.5%
1.8%
2.0%
2.0%
2.0%
2.4%
2.4%
3.2%
0.0% 0.5% 1.0% 1.5% 2.0% 2.5% 3.0% 3.5%
Other Services
Finance & Insurance
Real Estate, Rental & Leasing
Government
Information
Admin. & Support
Management of Enterprises
Prof'l Scientific & Tech.
Manufacturing
Total Nonfarm Job Growth
Transportation & Utilities
Wholesale Trade
Retail Trade
Health Services
Education
Leisure & Hospitality
Source: CA EDD, Labor Market Information Division, forecast by LAEDC
Annual Percent Change
Total nonfarm job growth forecast for 2014, percent change: +1.8%
$0
$100
$200
$300
$400
$500
$600
$700
0
200
400
600
800
1,000
1,200
1,400
Jan-06 Jan-07 Jan-08 Jan-09 Jan-10 Jan-11 Jan-12 Jan-13
Home Sales
Median Home Price
Home Sales & Median Prices
Ventura CountyNew and existing, single-family homes and condos
(Sales) (Price, Thousands)
Source: California Real Estate Research Council; DataQuick
Ventura County Employment
0.0%
2.0%
4.0%
6.0%
8.0%
10.0%
12.0%
260
265
270
275
280
285
290
295
300
'03 '04 '05 '06 '07 '08 '09 '10 '11 '12 '13 14f 15f
Total Nonfarm Employment Unemployment Rate
Source: EDD Labor Market Information Division; forecast by LAEDC
Annual average in thousands, 2012 benchmark
Ventura County Personal
Income & Taxable Sales Growth
-15%
-10%
-5%
0%
5%
10%
0
5
10
15
20
25
30
35
40
45
50
'03 '04 '05 '06 '07 '08 '09 '10 '11 '12 '13 '14f '15f
Total Personal Income Taxable Sales Growth$Billions
Source: California Board of Equalization, Dept. of Commerce; estimate & forecast by the LAEDC
Residential Building Permits
Issued in Ventura County
2.31.7
2.6
1.6
0.70.3
0.20.2 0.1
0.4
0.3
0.5 0.8
1.3
0.9
1.9
0.9
1.1
0.50.2
0.4 0.5
0.5
0.3
0.4
0.6
0.0
0.5
1.0
1.5
2.0
2.5
3.0
3.5
4.0
4.5
5.0
'03 '04 '05 '06 '07 '08 '09 '10 '11 '12 '13 '14f '15f
Multi-Family
Single-Family
Permits issued, thousands
Source: Construction Industry Research Board, forecast by LAEDC
Ventura County Snapshot

Ventura County
LAEDC Kyser Center for Economic Research 62 Economic Forecast, February 2014
Year
Population on
July 1
(Thousands)
Nonfarm
Employment (Ave.,
Thousands)
Unemploy-
ment Rate
(Ave., %)
Total Personal
Income
($Billions)
Per Capita
Personal
Income ($)
Total Taxable
Sales
($Billions)
Housing Unit
Permits
Issued
Nonresidential
Building Permits
($Millions)
2003 789.4 284.2 5.8 29.3 37.2 10.4 3,635 379
2004 795.0 286.2 5.4 31.6 39.7 11.2 2,603 353
2005 796.9 291.2 4.8 33.4 42.1 11.9 4,516 372
2006 801.2 297.7 4.3 35.9 45.0 12.3 2,461 326
2007 805.9 296.7 4.9 37.5 46.8 12.2 1,847 346
2008 812.0 290.8 6.3 37.4 46.3 11.3 842 345
2009 818.5 274.8 9.9 36.0 44.2 9.9 404 153
2010 825.1 272.8 10.8 37.0 44.8 10.2 590 160
2011 830.2 274.9 10.1 39.3 47.3 11.0 640 141
2012 833.4 278.8 9.0 40.8 48.8 11.9 870 127
2013 840.3 283.6 7.6 42.4 49.8 12.4 600 124
2014f 847.0 288.7 6.8 44.4 52.1 13.1 900 135
2015f 854.7 294.1 6.3 46.6 54.7 13.8 1,400 145
% Change Column1 Column2 Column3 Column4 Column5 Column6 Column7 Column8
03/02 1.2% 0.8% 6.6% 5.4% 5.9% 45.0% 31.1%
04/03 0.7% 0.7% 7.8% 7.0% 7.7% -28.4% -6.9%
05/04 0.2% 1.7% 5.9% 5.9% 6.6% 73.5% 5.4%
06/05 0.5% 2.2% 7.5% 7.0% 3.4% -45.5% -12.4%
07/06 0.6% -0.3% 4.2% 4.0% -0.7% -24.9% 6.1%
08/07 0.8% -2.0% -0.2% -1.0% -7.4% -54.4% -0.3%
09/08 0.8% -5.5% -3.6% -4.6% -12.7% -52.0% -55.7%
10/09 0.8% -0.7% 2.7% 1.4% 3.5% 46.0% 4.6%
11/10 0.6% 0.8% 6.2% 5.4% 7.8% 8.5% -12.1%
12/11 0.4% 1.4% 3.9% 3.3% 7.7% 35.9% -9.7%
13/12 0.8% 1.7% 3.9% 1.9% 4.8% -31.0% -2.4%
14/13 0.8% 1.8% 4.7% 4.7% 5.1% 50.0% 8.9%
15/14 0.9% 1.8% 5.0% 5.0% 5.6% 55.6% 7.4%
Sources: State of California: Dept. of Finance, Employment Development Department, Board of Equalization; U.S. Dept of Commerce
Construction Industry Research Board; estimates and forecasts by the LAEDC
Table 20: Ventura County Economic Indicators

Ventura County
LAEDC Kyser Center for Economic Research 63 Economic Forecast, February 2014
YearTotal Nonfarm
EmploymentNatural Resources Construction Manufacturing Mfg. -- Durable
Mfg. --
Nondurable
Wholesale
TradeRetail Trade
Transport. &
UtilitiesInformation
2003 284.2 0.6 16.6 37.1 24.0 13.0 11.8 34.5 5.6 7.2
2004 286.2 0.7 16.9 38.3 24.2 14.1 12.2 35.3 5.7 6.8
2005 291.2 0.8 18.8 37.7 23.9 13.9 12.5 36.5 5.8 6.2
2006 297.7 1.1 20.5 38.4 24.1 14.3 12.6 37.6 6.1 6.0
2007 296.7 1.1 18.8 38.0 23.9 14.1 13.0 37.6 6.1 5.8
2008 290.8 1.2 16.7 35.9 23.2 12.7 12.8 37.3 6.0 5.6
2009 274.8 1.2 13.2 32.6 20.4 12.2 12.0 35.1 5.4 5.3
2010 272.8 1.2 11.3 31.5 19.5 12.0 12.3 35.5 5.3 5.1
2011 274.9 1.3 11.3 30.6 18.8 11.8 12.4 36.3 5.5 4.9
2012 278.8 1.3 11.7 29.8 18.1 11.6 12.5 37.1 5.7 4.9
2013 283.6 1.2 12.4 29.2 17.7 11.5 12.9 37.4 5.8 4.9
2014f 288.7 1.3 13.1 29.6 18.0 11.7 13.1 38.2 5.9 4.9
2015f 294.1 1.4 14.6 30.0 18.2 11.8 13.3 38.6 6.0 5.0
YearFinance &
Insurance
Real Estate, Rental
& Leasing
Prof, Sci &
Tech Srvs
Mgmt. of
Enterprises
Admin. &
Support Srvs
Educational
Services
Health Care &
Social Asst
Leisure &
HospitalityOther Services Government
2003 19.2 4.3 13.6 3.9 19.4 3.3 24.3 27.6 10.4 44.8
2004 19.8 4.4 14.2 3.6 19.5 3.5 24.0 28.5 10.3 42.5
2005 20.0 4.4 15.1 3.5 19.8 3.5 24.8 29.2 10.4 42.2
2006 19.6 4.5 16.0 3.3 20.1 3.5 25.4 30.5 10.2 42.5
2007 17.9 4.8 16.2 3.2 18.8 4.0 26.5 32.0 9.9 43.0
2008 16.4 4.7 16.7 3.1 18.0 4.4 27.4 31.5 10.0 43.1
2009 16.1 4.4 16.2 2.9 16.1 4.4 27.9 29.8 9.3 42.9
2010 16.0 4.3 15.3 2.7 15.8 4.4 28.4 30.3 9.2 44.2
2011 16.2 4.2 15.0 2.4 16.0 4.4 29.4 31.4 9.2 44.4
2012 15.3 4.1 15.4 2.3 17.0 5.0 30.3 33.0 9.5 43.9
2013 14.4 4.1 15.8 2.3 17.8 5.1 30.8 36.1 9.5 43.8
2014f 14.4 4.2 16.0 2.4 18.0 5.2 31.5 37.3 9.4 44.1
2015f 14.5 4.2 16.6 2.5 18.7 5.3 32.0 37.9 9.4 44.3
Sources: California Employment Development Department, LMID; estimates and forecasts by LAEDC
Table 21: Ventura County Nonfarm Employment Annual averages in thousands, March 2012 Benchmark
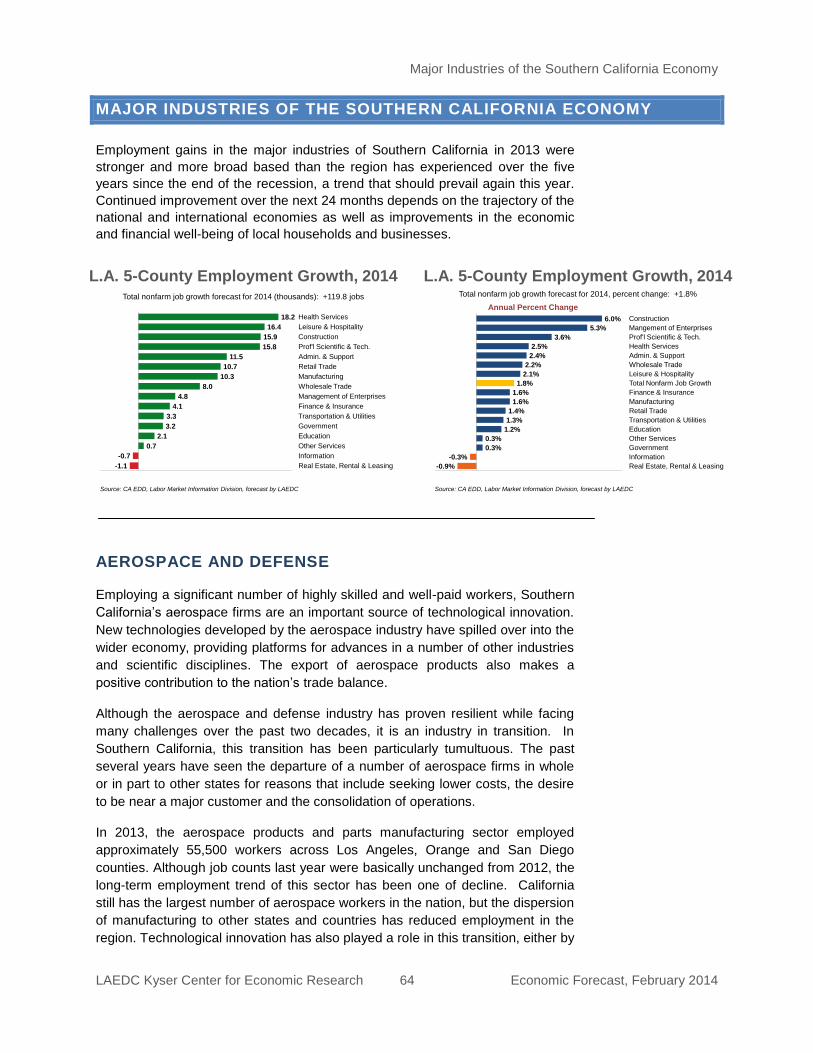
Major Industries of the Southern California Economy
LAEDC Kyser Center for Economic Research 64 Economic Forecast, February 2014
L.A. 5-County Employment Growth, 2014
-1.1
-0.7
0.7
2.1
3.2
3.3
4.1
4.8
8.0
10.3
10.7
11.5
15.8
15.9
16.4
18.2
-5.0 0.0 5.0 10.0 15.0 20.0
Real Estate, Rental & Leasing
Information
Other Services
Education
Government
Transportation & Utilities
Finance & Insurance
Management of Enterprises
Wholesale Trade
Manufacturing
Retail Trade
Admin. & Support
Prof'l Scientific & Tech.
Construction
Leisure & Hospitality
Health Services
Source: CA EDD, Labor Market Information Division, forecast by LAEDC
Total nonfarm job growth forecast for 2014 (thousands): +119.8 jobs
L.A. 5-County Employment Growth, 2014
-0.9%
-0.3%
0.3%
0.3%
1.2%
1.3%
1.4%
1.6%
1.6%
1.8%
2.1%
2.2%
2.4%
2.5%
3.6%
5.3%
6.0%
-2.0% -1.0% 0.0% 1.0% 2.0% 3.0% 4.0% 5.0% 6.0% 7.0%
Real Estate, Rental & Leasing
Information
Government
Other Services
Education
Transportation & Utilities
Retail Trade
Manufacturing
Finance & Insurance
Total Nonfarm Job Growth
Leisure & Hospitality
Wholesale Trade
Admin. & Support
Health Services
Prof'l Scientific & Tech.
Mangement of Enterprises
Construction
Source: CA EDD, Labor Market Information Division, forecast by LAEDC
Annual Percent Change
Total nonfarm job growth forecast for 2014, percent change: +1.8%
MAJOR INDUSTRIES OF THE SOUTHERN CALIFORNIA ECONOMY
Employment gains in the major industries of Southern California in 2013 were
stronger and more broad based than the region has experienced over the five
years since the end of the recession, a trend that should prevail again this year.
Continued improvement over the next 24 months depends on the trajectory of the
national and international economies as well as improvements in the economic
and financial well-being of local households and businesses.
AEROSPACE AND DEFENSE
Employing a significant number of highly skilled and well-paid workers, Southern
California’s aerospace firms are an important source of technological innovation.
New technologies developed by the aerospace industry have spilled over into the
wider economy, providing platforms for advances in a number of other industries
and scientific disciplines. The export of aerospace products also makes a
positive contribution to the nation’s trade balance.
Although the aerospace and defense industry has proven resilient while facing
many challenges over the past two decades, it is an industry in transition. In
Southern California, this transition has been particularly tumultuous. The past
several years have seen the departure of a number of aerospace firms in whole
or in part to other states for reasons that include seeking lower costs, the desire
to be near a major customer and the consolidation of operations.
In 2013, the aerospace products and parts manufacturing sector employed
approximately 55,500 workers across Los Angeles, Orange and San Diego
counties. Although job counts last year were basically unchanged from 2012, the
long-term employment trend of this sector has been one of decline. California
still has the largest number of aerospace workers in the nation, but the dispersion
of manufacturing to other states and countries has reduced employment in the
region. Technological innovation has also played a role in this transition, either by
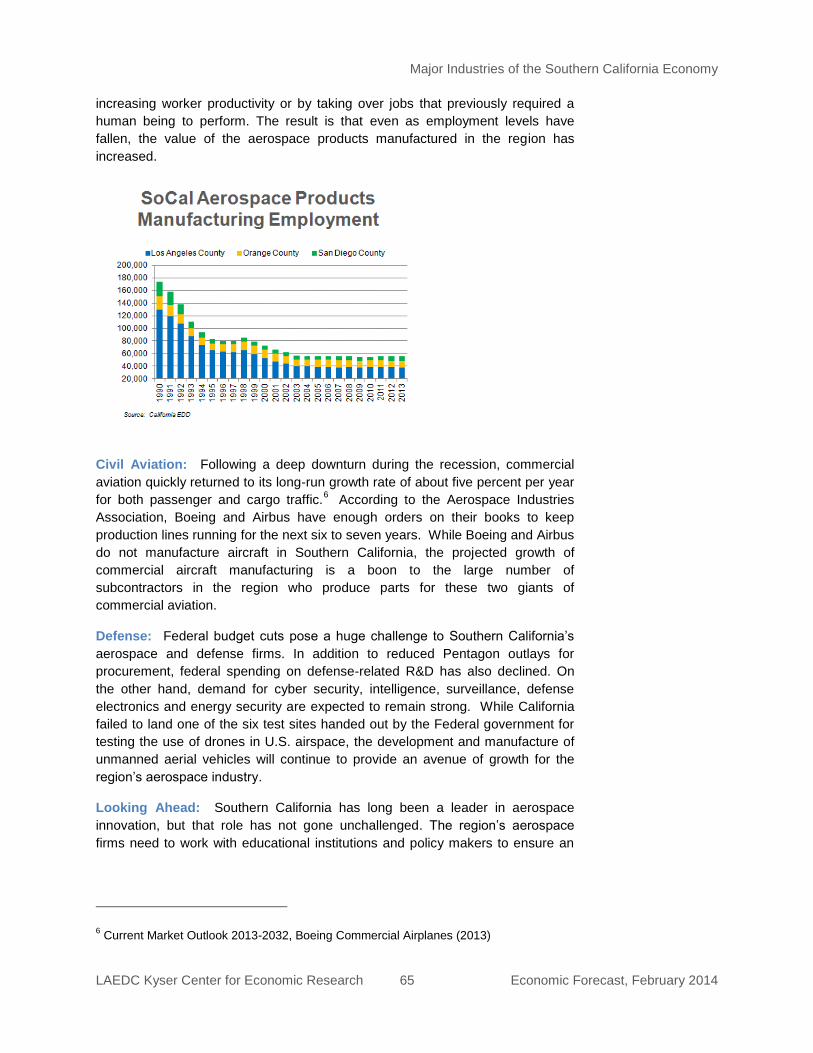
Major Industries of the Southern California Economy
LAEDC Kyser Center for Economic Research 65 Economic Forecast, February 2014
increasing worker productivity or by taking over jobs that previously required a
human being to perform. The result is that even as employment levels have
fallen, the value of the aerospace products manufactured in the region has
increased.
Civil Aviation: Following a deep downturn during the recession, commercial
aviation quickly returned to its long-run growth rate of about five percent per year
for both passenger and cargo traffic.6 According to the Aerospace Industries
Association, Boeing and Airbus have enough orders on their books to keep
production lines running for the next six to seven years. While Boeing and Airbus
do not manufacture aircraft in Southern California, the projected growth of
commercial aircraft manufacturing is a boon to the large number of
subcontractors in the region who produce parts for these two giants of
commercial aviation.
Defense: Federal budget cuts pose a huge challenge to Southern California’s
aerospace and defense firms. In addition to reduced Pentagon outlays for
procurement, federal spending on defense-related R&D has also declined. On
the other hand, demand for cyber security, intelligence, surveillance, defense
electronics and energy security are expected to remain strong. While California
failed to land one of the six test sites handed out by the Federal government for
testing the use of drones in U.S. airspace, the development and manufacture of
unmanned aerial vehicles will continue to provide an avenue of growth for the
region’s aerospace industry.
Looking Ahead: Southern California has long been a leader in aerospace
innovation, but that role has not gone unchallenged. The region’s aerospace
firms need to work with educational institutions and policy makers to ensure an
6 Current Market Outlook 2013-2032, Boeing Commercial Airplanes (2013)

Major Industries of the Southern California Economy
LAEDC Kyser Center for Economic Research 66 Economic Forecast, February 2014
adequate supply of skilled workers. It is also imperative that the flow of federal
research and development dollars continues.
Southern California has several advantages as an aerospace center, including a
deep well of skilled labor, an extensive infrastructure of test fields, universities
and other educational and research centers, and the existence of a strong
electronics industry. Aerospace may be an industry in transition, but new market
opportunities are enhancing the region’s ability to compete in the commercial
space sector, civil aviation, and commercial applications of defense technologies.
APPAREL DESIGN AND MANUFACTURING
Apparel design, manufacturing, and wholesaling make a significant contribution
to the Southern California economy, particularly in Los Angeles County. The
fashion industry in Orange County is smaller, but is still quite diverse. Los
Angeles is the global capital for premium denim and casual cool, while Orange
County is best known for women’s sportswear and fashions inspired by the surf
and skate culture of the region. In addition to apparel, the region’s fashion
industry also includes textiles and jewelry manufacturing as well as footwear,
handbag and cosmetics production, and wholesaling activities.
Southern California employs the largest number of apparel workers in the United
States and is one of the few places in the U.S. where apparel continues to be
manufactured. Although production of most apparel items has largely shifted to
lower wage countries in Latin America and Asia, high-end apparel that requires
strict quality control and specialized skills or processing tends to be
manufactured locally.
Design-related activity also contributes to maintaining the apparel industry’s
presence in Southern California. The “Made in L.A.” label has strong appeal
around the world. Fashion goes hand-in-hand with the entertainment industry
and the region’s energetic art scene. Designers are attracted to the creative
freedom that abounds in Los Angeles. The proximity of designers to local
manufacturers enables them to check up on product and personally
communicate with production managers.
The local industry is also a leader in “fast-fashion” apparel production – a term
used to describe the production of clothing that reflects current fashion trends
that go from the runway to store shelves in as little as four weeks.
Much of the apparel manufacturing and wholesaling workforce in Southern
California is located in Los Angeles County, although a smaller but significant
number of workers may be found in Orange County. Apparel manufacturing
employed 43,000 wage and salary workers in Los Angeles County in 2013, while
apparel wholesaling employed 22,700 workers, for total industry employment of
65,700 workers. Employment in 2013 fell by 2.6% from a year earlier due to the
loss of 2,500 manufacturing jobs. In contrast, apparel wholesaling added 742
jobs for a 3.4% increase.

Major Industries of the Southern California Economy
LAEDC Kyser Center for Economic Research 67 Economic Forecast, February 2014
The apparel industry also employs a large number of independent contractors,
significantly boosting total employment numbers. In 2011 (latest data available),
there were nearly 7,900 independent contractors working in Los Angeles and
Orange counties manufacturing and wholesaling textiles, apparel, footwear,
leather goods and jewelry.
Thanks to the many apparel design and merchandising schools located in the
region, the design sector is thriving. These schools attract students from all over
the world. Big name local brands employ numerous design-related workers, but
the majority of local designers work independently.
Apparel manufacturing remains one of the most labor-intensive industries in the
world, which gives countries with lower wages and low cost of living a
competitive edge. Technological innovations, an apparel specific outward-
oriented trade policy, or a dramatic change in the relative costs of manufacturing
clothing abroad could slow or even arrest this decline. However, over the near-
term, local apparel manufacturing employment will continue the downward trend
that began in the late 1990s, but creative design work will flourish.
COMPUTER AND ELECTRONIC PRODUCT MANUFACTURING
The computer and electronic product manufacturing industry employed 40,300
workers in Los Angeles County last year with another 34,300 in Orange County
and 24,600 in San Diego County. Ventura County employment in the industry
was much smaller at 5,300 workers. For the region as whole, there were
104,500 persons employed in this industry last year.
Like many other manufacturing industries, computer and electronic product
manufacturing has experienced a trend decline in employment dating back to the
late 1990s when there were nearly 172,000 workers in the industry. In 2013, the
industry experienced a 1.4% decline in jobs across the region, with the largest
loss occurring in Los Angeles County (1,300 jobs). In spite of the falling job
counts, this continues to be an important industry for the region because it
employs a large number of skilled workers in both professional and production
occupations that generally earn higher than average wages.
PROFESSIONAL AND BUSINESS SERVICES
The professional and business services industry includes a diverse set of
industry sectors including professional, scientific and technical services;
management of companies and enterprises (i.e. corporate headquarters); and
administrative, support and waste services.
There were just over one million workers in the Los Angeles five-county region
last year, up 2.6% from 2012. In Los Angeles County alone, this industry
employed 587,400 workers last year, with Orange County exceeding 260,000
and nearly 127,000 in the Inland Empire. In Los Angeles County, about 20,200
jobs were added in 2013, an increase of 3.6%. Orange County saw an increase
of 1.7% last year, while professional and business services jobs in the Inland
Empire edged down by 0.1%.

Major Industries of the Southern California Economy
LAEDC Kyser Center for Economic Research 68 Economic Forecast, February 2014
Breaking down the numbers by sector demonstrates a great deal of variation in
job growth within the professional and business services industry. Across the
Los Angeles five-county region, professional, scientific and technical services
expanded payrolls by 3.0% in 2013, while management of companies and
enterprises added jobs at a rate of 1.0%. Administrative, support and waste
services saw job growth of 2.5%. Employment services, which includes
temporary employment agencies, was the fastest growing subsector within this
group with job growth of 6.3% (in Los Angeles County, employment services jobs
expanded at a rate of 11.3%). Since the end of the recession, temporary
employment services has been among the fastest growing sectors, which is
typical following a recession. The fact that employers are still using a large
number of temporary workers may be indicative of firms’ continuing uncertainty
regarding demand for their services.
Illustrating the wide diversity of this industry, below are additional job counts by
subsector for Los Angeles County in 2013:
Accounting, tax preparation and bookkeeping added 4,970 jobs (11.3%)
Consulting services added 3,450 jobs (7.4%)
Investigation and security gained 725 jobs (1.6%)
Computer systems design was flat over the year
Legal services and advertising lost a combined total of 158 jobs (-0.2%)
With a mix of occupations that include a wide range of skill and income levels,
this diverse sector will continue to be one of the largest and fastest growing in the
region over this year and next.
FINANCIAL SERVICES
The financial activities industry has now experienced two consecutive years of
growth after suffering deep cuts during the Great Recession and accompanying
financial crisis. From the peak in 2006 through 2010 the industry lost over
103,000 jobs throughout Southern California, mostly in the finance and insurance
sub-sector.
However, financial activities employment growth has resurfaced throughout
Southern California with the exception of Ventura County over the past three
years. Both Orange and Los Angeles counties have seen the most significant
growth on a percentage basis. Los Angeles County added the largest number of
jobs in 2013, with over 5,400 jobs mainly in real estate and rental leasing.
Orange County was a close second with nearly 5,400 jobs added in 2013, mainly
stemming instead from finance and insurance. The rest of Southern California
witnessed slight increases with the exception of Ventura County which lost a total
of 900 jobs in 2013.
With respect to the main sub-sectors which include finance and insurance and
real estate and rental leasing the story was slightly different. Both the Inland
Empire and San Diego actually experienced jobs losses in the real estate and
rental leasing sub-sector, while Ventura County saw job gains in this area.

Major Industries of the Southern California Economy
LAEDC Kyser Center for Economic Research 69 Economic Forecast, February 2014
Overall, the Southern California area added over 17,000 jobs over the last two
years. Although the total number of jobs is still nowhere near the 2006 peak total
of 544,000, the job market has improved and is trending in the right direction as
the financial and housing situations have substantially improved over the past
three years.
The number of foreclosures and short sales in the residential market is
significantly lower and will influence the market to a lesser degree this year and
next. Meanwhile, loans made since the recession and financial crisis have met
much stiffer credit standards and should pose few problems going forward. Also,
the Dodd-Frank regulation continues to change the way the financial industry
serves businesses and households.
With each year that passes, the financial crisis of the last decade moves further
in the background and the financial system continues to heal. This will be
reflected in Southern California in the form of small single-digit employment gains
both in financial services and in real estate jobs both this year and in 2015.
HEALTH CARE SERVICES AND BIOMEDICAL
The Los Angeles-five county region has a population of 18.3 million people, 10
million of whom live in Los Angeles County. Nearly half of the people in the
nation’s most populated state reside in the Southern California region. With such
a large population in a relatively small geographic area, Southern California is
able to support a number of important and influential medical centers, and a
thriving life sciences industry. Educational institutions within the UC and CSU
systems, along with several private universities provide training for medical
professionals and engage in cutting edge research.
In 2013, the health care industry employed nearly 743,000 people in the Los
Angeles five-county region, with another 129,900 in San Diego County. Los
Angeles County was home to 438,400 jobs of those jobs, accounting for almost
59% of total industry employment in the five-county area. Over the past several
years, health care employment has grown consistently, expanding by 2.4% in
2013. Orange County has been one of the faster growing areas and is capturing
an increasing share (19.3% in 2013) of Southern California’s health care
employment.
The largest segment of healthcare employment in the five-county region is
ambulatory health care services, accounting for 43.6% of healthcare jobs,
followed by hospitals, with a 23.2% share of employment. Nursing and residential
care facilities experienced the fastest industry growth in the region, increasing by
3.3% over the year in 2013.
Health care is a large industry in the U.S. In 2012, health care spending reached
$2.8 trillion ($8,915 per person), up from $2.7 trillion ($8,680 per person) in 2011.
For the nation, health care spending accounted for 17.2% of gross domestic
product. The industry will have to adapt as the nation’s population ages, new
medical technologies emerge, and as the federal Affordable Care Act continues
to roll out. Efforts to contain costs will collide with increased demand for health

Major Industries of the Southern California Economy
LAEDC Kyser Center for Economic Research 70 Economic Forecast, February 2014
care services that will accompany both the graying of the boomer population and
expanded health care coverage.
In addition to providing health care services, biomedical research is a thriving
high-tech industry in Southern California. Within Los Angeles County, the
healthcare companies who engage in research and development of medical
devices and pharmaceuticals employed 22,469 workers in 2012. Both medical
research and the manufacturing of medical instruments and pharmaceuticals are
an important source of jobs and economic growth in Southern California.
The Southern California health services industry will continue to add jobs over
the next two years. Employment in Los Angeles County is expected to grow by
3.2% in 2014 and by 1.0% in 2015. Orange County should see health care
payrolls expand by 1.3% and 1.2% over the next two year; employment in San
Diego will increase by 1.5% and 1.0%; and in the Inland Empire by 2.1% and
2.4%.
INTERNATIONAL TRADE/GOODS MOVEMENT
International trade is a critical component of the Los Angeles County economy
and a key driver of goods movement in Southern California. Based on recently
completed research, the LAEDC estimates that there were 158,542 trade related
jobs in 2011 in Los Angeles County (most recent data available). This cluster
combines transportation, logistics, and distribution services to form the largest
traded industry cluster in Los Angeles County.
Within the industry cluster, the largest concentration of jobs falls in transportation
and warehousing. For the region as a whole, Southern California transportation
and warehousing jobs grew by nearly 1,900 jobs in 2013 after gaining 2,600 jobs
in 2012. Looking at individual counties, Los Angeles County experienced a slight
decline in jobs in 2013, although air and truck transportation did witness small
gains. In the Inland Empire (a warehousing and distribution center) nearly 2,000
jobs were added (up by 3%), while San Diego added nearly 1,000 jobs.
The combined San Pedro Bay ports witnessed a strong year in 2013. The
combined total loaded cargo for both ports was up by roughly 3%. This was
mainly attributed to a stronger than expected peak season and to a much
stronger than expected November and December. Total loaded cargo volume at
the Port of Los Angeles was down again in 2013 by roughly 4%, while total
loaded volume at the Port of Long Beach was up by over 12%. A new trend has
emerged in the industry over the past two years whereby shippers form alliances
to allow cargo volumes to move more fluidly between the Ports of Los Angeles
and Long Beach.
The Ports of Los Angeles and Long Beach maintained their top two rankings in
the U.S. during 2013, handling a total of 14.6 million containers, up by 3.4%. In
addition, the Los Angeles Customs District (LACD) maintained its number one
position in the U.S. in 2013 with a two-way trade value of $414.5 billion (ahead of
New York). In 2013, the value of total two-way trade at the LACD increased by
2.7% on a year-over-year basis.

Major Industries of the Southern California Economy
LAEDC Kyser Center for Economic Research 71 Economic Forecast, February 2014
0
2
4
6
8
10
12
14
16
18
2003 2004 2005 2006 2007 2008 2009 2010 2011 2012 2013 2014f
14.0 14.1 14.615.3
Millions of TEUs
14.3
11.8
13.114.2
15.8 15.7
11.8
14.1
TEU Throughput
San Pedro Bay Ports
Sources: Ports of Los Angeles and Long Beach; forecast by LAEDC
International airport cargo, which generally consists of small, lightweight, high-
value products that require quick delivery, passes through both LAX and Ontario
International Airport. Freight tonnage passing through LAX just slightly dropped
by -0.98% in 2013 on an annual basis, while at Ontario, freight tonnage
increased by 1.4% in 2013.
Over 40% of the nation’s imported containers come through the ports of Los
Angeles and Long Beach. The outlook for 2014 and into 2015 is bright as the
U.S. economy could reach a three percent GDP growth rate and most of our top
trading partners should experience strong growth. Total container traffic at the
Port of Los Angeles and the Port of Long Beach is projected to expand in 2014 to
15.3 million TEUs, a rise of 4.6%, and then continuing to increase in 2015. Both
imports and exports should improve this year with imports outperforming exports.
The expected improvement in trade will positively impact both ports as well as all
the other goods movement industry players, from the longshoremen’s union to
the independent truck drivers and the railroads.
Alameda Corridor: The 20-mile rail cargo line that connects both ports to the
main railroad yards near downtown Los Angeles continues to be an instrumental
part of the entire goods movement process. The number of trains running on the
Alameda Corridor has seen consistent growth since 2010. In 2013, the number of
trains rose by 8.2% on a year-to-date basis through November. The average
number of trains per day rose from 42 in 2012 to 45 in 2013. The real positive
news was that the 2013 peak season train levels were similar to the 2007 figures.
Both the number of trains and the number of containers should increase this year
as both imports and exports witness robust growth due to the improvement in the
U.S. and international economies.

Major Industries of the Southern California Economy
LAEDC Kyser Center for Economic Research 72 Economic Forecast, February 2014
Motion Picture & Sound Recording
Employment in Los Angeles County
Sources: CA EDD. LMID
0
20
40
60
80
100
120
140
160
2000 2001 2002 2003 2004 2005 2006 2007 2008 2009 2010 2011 2012 2013
Thousands
MOTION PICTURE/TV PRODUCTION
The entertainment industry is a cornerstone of the Los Angeles County economy
both in its own right and as a tourist attraction. Activity directly related to the
motion picture and sound-recording industry generates huge economic benefits
for the region both directly and indirectly. Stroll past an on-location film shoot in
downtown Los Angeles and in addition to actors, camera operators and directors,
one will see workers employed to drive equipment trucks and provide security;
caterers may be on site to feed crews. Behind the scenes, the industry employs
accountants, lawyers and insurance firms. Film studios and related activities are
users of large amounts of office and industrial real estate. The entertainment
industry is also a major source of export revenues for the region because of the
royalties earned overseas by locally produced films and TV shows.
In 2013, there were 118,100 wage and salary jobs in the motion picture and
sound recording industry in Los Angeles County, a slight increase of 0.7% or 780
jobs compared with 2012. This sector is still struggling to return to prerecession
employment levels and remains well below the 2004 peak of 132,200 jobs.
Within motion picture and sound recording, motion picture and video production
is the largest part of the industry by far with the greatest concentration of wage
and salary jobs in the entertainment industry. Other important subsectors include
motion picture distribution, post production services, and sound recording.
The entertainment industry also employs a large number of independent
contractors. Independent contractors approached 82,400 prior to the recession
(2008), but fell in number to just over 81,000 in 2009. By 2011 (latest data
available), that figure increased to nearly 89,200, significantly adding to the
overall job count in the industry.

Major Industries of the Southern California Economy
LAEDC Kyser Center for Economic Research 73 Economic Forecast, February 2013
On-Location Film Production
Days by Type
Source: Film LA
0
10
20
30
40
50
60
2001 2002 2003 2004 2005 2006 2007 2008 2009 2010 2011 2012 2013
Feature Films Television Commercials Other
Production Days, 1000s
Another indicator of industry activity is the number of permitted on-location film
days. On-location film activity increased by 11.7% in 2013 to 51,670 production
days. While on-location activity in 2013 fell short of prerecession peak levels of
roughly 55,000 days that prevailed from 2005 through 2007, it was the fourth
consecutive annual increase since bottoming out in 2009. By category, feature
films rose by 18.7%, television increased by 11.5%, commercials rose by 5.4%
and “other” (student and industrial films; music videos, etc.) was up by 12.6%.7
The National Association of Theatre Owners estimates the number of tickets sold
in 2013 was about even with 2012 (1.36 billion), but below the record level of
1.57 billion set in 2002. Total box office receipts increased by 6.4% in 2012 to
$34.7 billion (latest data available). International box office receipts, which
comprise 69% of the total, were up by 6.7%, while domestic receipts rose by
5.9%.8 Meanwhile, ticket price inflation is helping to push revenues for theater
operators to an all time high in spite of the decline in movie theater attendance.
In 2013, total at-home entertainment spending was essentially flat at $18.2
billion. Revenue growth occurred in electronic sell-through (consumers pay a
one-time fee to download a media file), video on demand and subscription
streaming, while rentals (excluding video on demand) declined.9
Clearly, the way in which the public consumes entertainment content is still
evolving. Fewer people are attending traditional movie theaters, opting instead
to watch movies and TV shows on whatever screen is at hand – maybe a tablet
computer at home or on a smart phone while waiting to catch a flight. Increasing
numbers of people are abandoning cable TV plans in favor of subscription
services like Netflix or Hulu. With the proliferation of personal electronic devices
7 Film L.A. Inc., L.A. Area On-Location Production 2012-2013
8 Motion Picture Association of America, Theatrical Market Statistics, 2012
9 The Digital Entertainment Group, 2013 Annual Home Entertainment Report

Major Industries of the Southern California Economy
LAEDC Kyser Center for Economic Research 74 Economic Forecast, February 2014
and content providers, people now expect entertainment to be at their fingertips
anytime, anywhere.
Recognizing the importance of the film industry to the region, in 2009 California
enacted a program that allocates $100 million annually to film and TV
productions in the form of a tax credit for qualified production expenses. While
the provision of California’s film tax credit has slowed runaway production and
boosted local activity, programs in New York ($430 million in 2012) and
Louisiana ($229 million), eclipsed the $100 million annually offered by California.
In total, 39 states handed out $1.5 billion in film tax credits in 2012.10
In spite of
the cost advantages offered by competing states, Los Angeles County has
remained an attractive location for movie and TV production because of the deep
labor pool and extensive film infrastructure. However, other states have been
investing heavily in production facilities and workforce development.
REAL ESTATE AND CONSTRUCTION
Residential Real Estate
The housing market recovery in Southern California gained momentum in 2013.
By the close of the year, median home prices in the region had risen on a year-
over-year basis for 21 consecutive months11
while foreclosures and short sales
fell to the lowest level since before the recession.
Price increases over the past year were driven in part by investors scooping up
blocks of single-family homes in foreclosure – creating a new asset class in the
process: single-family real estate investment trusts. However, the tendency of
investors to pay cash has shut many traditional buyers, especially first-timers, out
of the lower end of the market. Meanwhile, as prices continued to rise, more
mid- to high-end homes were listed for sale, pushing prices up across the board.
Although the region’s housing market is in a much stronger position than it was a
year ago, a number of impediments stand in the way of faster recovery. The
fundamentals that drive demand for housing are not improving quickly enough to
keep pace with the run-up in prices: job growth, income growth and household
formation. On the supply side, the inventory of homes for sale is responding
slowly to price appreciation. Furthermore, as the economy improves interest
rates will rise and hinder affordability.
A sustained housing market recovery requires rising rates of household formation
and homeownership. Although household formation has been lagging, it is
improving. The average number of new U.S. household formations fell to a
recent low of 357,000 in 2010. By 2011, as labor market conditions improved,
household formation rebounded to 1.1 million. The long run average since 1948
is 1.2 million new households per year.
10 Los Angeles Times, Making Film Deals with Tax Credits (12/26/13) 11 Note: New and resale single-family homes and condominiums

Major Industries of the Southern California Economy
LAEDC Kyser Center for Economic Research 75 Economic Forecast, February 2014
U.S. Household Formation and
Home Ownership
61%
62%
63%
64%
65%
66%
67%
68%
69%
70%
0
500
1,000
1,500
2,000
2,500
3,000
3,500
4,000
Household Formation, thousands Rate of Homeownership
Source: US Census Bureau
The rate of homeownership in the United States has been in decline since
peaking in 2004 at 69.0%. The rate for 2013 was 65.2%. One factor contributing
to the decline since 2007 was the foreclosure crisis, which reduced the number
of potential buyers. Tighter credit standards have also prevented many would-be
buyers from entering the market. Additionally, many young people are entering
the workforce with high levels of student debt and are more likely to rent or
remain living in their parents’ homes. This also leads to delays in starting
families and forming new households.
Looking ahead to 2014 and 2015, stronger economic growth should pull
traditional buyers back to Southern California’s housing markets. The number of
homes sold in the $300,000 to $799,000 price range (a range that includes trade-
up buyers) has been rising, with sales of homes priced above $800,000 growing
at an even faster rate. In contrast, sales of homes priced below $300,000 have
dropped off sharply.12
Transactions in this more affordable segment of the market
are declining because of a lack of homes for sale and because many
homeowners in this market still owe more than their homes are worth.
The combination of higher home prices and rising mortgage interest rates mean
housing affordability has taken a hit. While still good by Southern California
standards, the recent decline in affordability coupled with the slow increase in
supply have the potential to scare away buyers and slow the pace of the
recovery. Tighter mortgage underwriting standards will continue to be a hurdle as
well.13
The upside of this equation is rising prices should encourage more people
12 DQNews.com: December Homes Sales at Six-Year Low; Median Price Jumps (1/14/14)
13 Note: Tighter mortgage underwriting standards became official with the Qualified
Mortgage Rule that went into effect January 10. For a detailed explanation see the
Consumer Financial Protection Bureau: http://www.consumerfinance.gov/regulatory-
implementation/
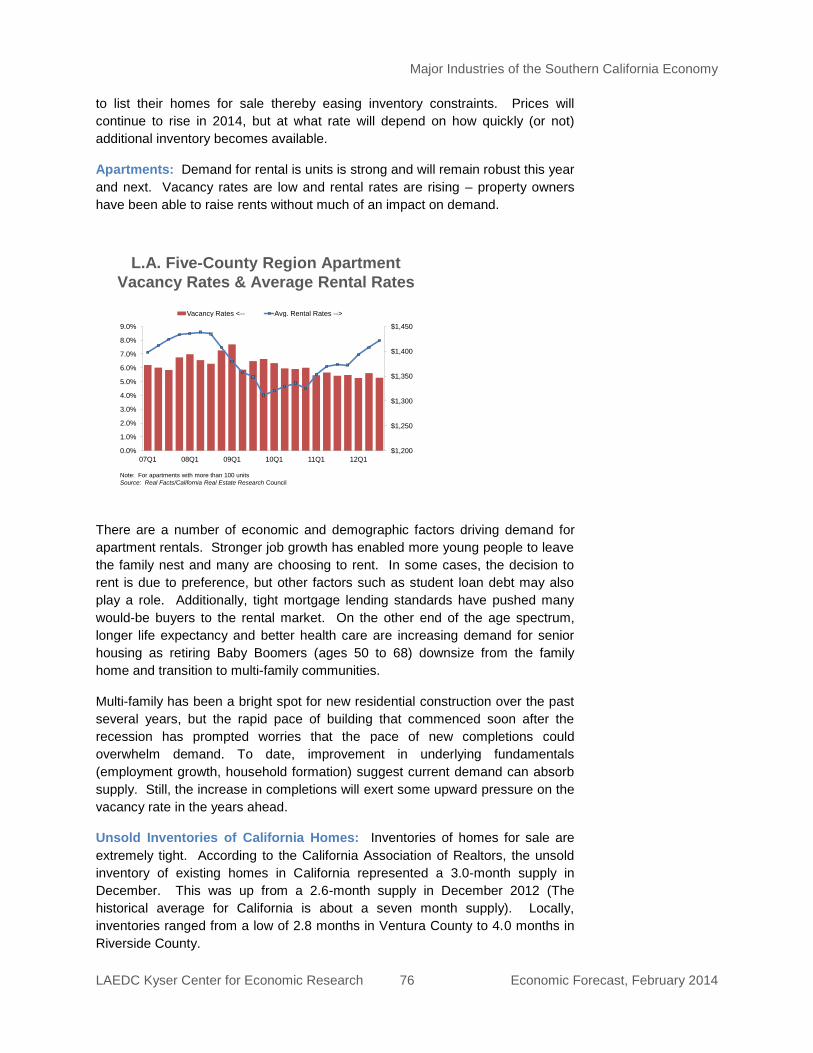
Major Industries of the Southern California Economy
LAEDC Kyser Center for Economic Research 76 Economic Forecast, February 2014
L.A. Five-County Region Apartment
Vacancy Rates & Average Rental Rates
$1,200
$1,250
$1,300
$1,350
$1,400
$1,450
0.0%
1.0%
2.0%
3.0%
4.0%
5.0%
6.0%
7.0%
8.0%
9.0%
07Q1 08Q1 09Q1 10Q1 11Q1 12Q1
Vacancy Rates <-- Avg. Rental Rates -->
Note: For apartments with more than 100 units
Source: Real Facts/California Real Estate Research Council
to list their homes for sale thereby easing inventory constraints. Prices will
continue to rise in 2014, but at what rate will depend on how quickly (or not)
additional inventory becomes available.
Apartments: Demand for rental is units is strong and will remain robust this year
and next. Vacancy rates are low and rental rates are rising – property owners
have been able to raise rents without much of an impact on demand.
There are a number of economic and demographic factors driving demand for
apartment rentals. Stronger job growth has enabled more young people to leave
the family nest and many are choosing to rent. In some cases, the decision to
rent is due to preference, but other factors such as student loan debt may also
play a role. Additionally, tight mortgage lending standards have pushed many
would-be buyers to the rental market. On the other end of the age spectrum,
longer life expectancy and better health care are increasing demand for senior
housing as retiring Baby Boomers (ages 50 to 68) downsize from the family
home and transition to multi-family communities.
Multi-family has been a bright spot for new residential construction over the past
several years, but the rapid pace of building that commenced soon after the
recession has prompted worries that the pace of new completions could
overwhelm demand. To date, improvement in underlying fundamentals
(employment growth, household formation) suggest current demand can absorb
supply. Still, the increase in completions will exert some upward pressure on the
vacancy rate in the years ahead.
Unsold Inventories of California Homes: Inventories of homes for sale are
extremely tight. According to the California Association of Realtors, the unsold
inventory of existing homes in California represented a 3.0-month supply in
December. This was up from a 2.6-month supply in December 2012 (The
historical average for California is about a seven month supply). Locally,
inventories ranged from a low of 2.8 months in Ventura County to 4.0 months in
Riverside County.

Major Industries of the Southern California Economy
LAEDC Kyser Center for Economic Research 77 Economic Forecast, February 2014
Southern California Unsold
New Housing
Source: California Real Estate Research Council
0
2,000
4,000
6,000
8,000
10,000
12,000
14,000
16,000Total Units
Ventura
San Bernardino
Riverside
Orange
Inventories of unsold new homes are also very lean. Together with stronger
demand and rising prices, conditions are rapidly improving for homebuilders. In
Los Angeles County, the inventory of new unsold homes fell by 30.0% during the
third quarter of 2013 compared with the same period in 2012. In Orange County,
inventories declined by 15.2%. In the Inland Empire, unsold inventories in
Riverside County were down by 2.8% during the third quarter, while in San
Bernardino County, inventories declined by 15.2%. In Ventura County, the
unsold new home inventory dropped by 29.8% during the third quarter of 2013.
New Home Construction: Builders are generally more optimistic about 2014.
Inventories of new homes are extremely low and existing home prices are on the
rise, a situation that is driving recent gains in new home building.
Permits for new home construction in Southern California picked up speed last
year, rising by 37.4% to an estimated 34,000 units. Since bottoming out in 2009
at 14,942 total units permitted, housing permits have rebounded by 128%. Even
so, permit levels remain a fraction of the peak of 91,556 units reached in 2004.
The LAEDC forecasts that homebuilders will pull permits for 46,800 new units in
the Los Angeles five-county region this year, an increase of 37.6% compared
with 2013. New home construction will gather speed in 2015, jumping to 61,500
new units permitted. In addition to rising home prices, employment will be a key
driver of new home construction, leading builders to look for available land near
markets where employment is likely to exhibit strong growth over the coming
years.
Conclusion: The housing market in Southern California is undeniably in better
shape than it was a year ago. Sales activity has increased across a broad range
of home prices – an indication the market has moved back to a more balanced
position. Support for existing home sales and new home construction is shifting
away from investor purchases and back to traditional buyers. Credit conditions

Major Industries of the Southern California Economy
LAEDC Kyser Center for Economic Research 78 Economic Forecast, February 2014
will remain restrictive and mortgage interest rates are on the rise,14
but gains in
median prices will continue through 2014 albeit at a more moderate pace as
supply constraints ease.
Further improvement this year and next will depend in large part on progress in
the rest of the economy. Strong job and income growth has historically led to
new household formation, spurring new home construction. After previous
recessions, residential investment typically contributed one to two percent to
annual economic growth. During the first two years of the current recovery,
residential investment made no contribution to GDP growth, but as of 2011 the
housing sector finally began to provide a small lift to the economy.
14 Note: Rates on a 30-year fixed mortgage are expected to increase this year from 3.98%
in 2013 to 4.80% as the Fed eases back on its program of MBS purchases.

Major Industries of the Southern California Economy
LAEDC Kyser Center for Economic Research 79 Economic Forecast, February 2014
Annual % Change
Year
L.A.
County
Orange
County
Inland
Empire
Ventura
County Year
L.A.
County
Orange
County
Inland
Empire
Ventura
County
2003 348,409 488,439 217,953 462,521 2003 21.3% 19.5% 29.9% 24.2%
2004 435,954 642,577 295,173 599,282 2004 25.1% 31.6% 35.4% 29.6%
2005 517,853 706,555 364,407 668,138 2005 18.8% 10.0% 23.5% 11.5%
2006 577,147 732,517 383,580 685,957 2006 11.4% 3.7% 5.3% 2.7%
2007 589,166 727,570 367,248 673,940 2007 2.1% -0.7% -4.3% -1.8%
2008 382,714 540,650 230,710 463,560 2008 -35.0% -25.7% -37.2% -31.2%
2009 299,268 505,589 161,114 416,770 2009 -21.8% -6.5% -30.2% -10.1%
2010 323,290 546,385 179,268 442,820 2010 8.0% 8.1% 11.3% 6.3%
2011 307,660 512,500 172,280 418,270 2011 -4.8% -6.2% -3.9% -5.5%
2012 327,470 542,700 189,300 427,000 2012 6.4% 5.9% 9.9% 2.1%
2013 405,580 651,650 241,620 516,470 2013 23.9% 20.1% 27.6% 21.0%
Source: California Association of Realtors
Annual % Change
Year
L.A.
County
Orange
County
Inland
Empire
Ventura
County LA-5 Year
L.A.
County
Orange
County
Inland
Empire
Ventura
County LA-5
2003 21,313 9,311 43,001 3,635 77,260 2003 10.1% -22.5% 29.2% 45.0% 15.0%
2004 26,935 9,322 52,696 2,603 91,556 2004 26.4% 0.1% 22.5% -28.4% 18.5%
2005 25,647 7,206 50,818 4,516 88,187 2005 -4.8% -22.7% -3.6% 73.5% -3.7%
2006 26,348 8,371 39,083 2,461 76,263 2006 2.7% 16.2% -23.1% -45.5% -13.5%
2007 20,363 7,072 20,457 1,847 49,739 2007 -22.7% -15.5% -47.7% -24.9% -34.8%
2008 13,704 3,159 9,101 842 26,806 2008 -32.7% -55.3% -55.5% -54.4% -46.1%
2009 5,653 2,200 6,685 404 14,942 2009 -58.7% -30.4% -26.5% -52.0% -44.3%
2010 7,468 3,091 6,269 590 17,418 2010 32.1% 40.5% -6.2% 46.0% 16.6%
2011 10,403 4,807 5,214 640 21,064 2011 39.3% 55.5% -16.8% 8.5% 20.9%
2012 13,100 5,400 5,400 840 24,740 2012 25.9% 12.3% 3.6% 31.3% 17.5%
2013 15,700 8,800 8,900 600 34,000 2013 19.8% 63.0% 64.8% -28.6% 37.4%
2014f 21,100 11,100 13,700 900 46,800 2014f 34.4% 26.1% 53.9% 50.0% 37.6%
2015f 27,000 13,200 19,900 1,400 61,500 2015f 28.0% 18.9% 45.3% 55.6% 31.4%
Sources: Construction Industry Research Board, California Homebuilding Foundation; forecasts by LAEDC
Table 22: Median Existing Single-Family Home Prices
Table 23: Total Housing Permits

Major Industries of the Southern California Economy
LAEDC Kyser Center for Economic Research 80 Economic Forecast, February 2014
Office Vacancy Rates in
Southern California
Source: Cushman and Wakefield
2.0
6.0
10.0
14.0
18.0
22.0
26.0
30.0
Los Angeles Orange Inland Empire Ventura
Percent vacant, quarterly averages
Nonresidential Real Estate
Commercial real estate has experienced a much slower turnaround in
fundamentals in the aftermath of the great recession compared with previous
recovery periods. However, emerging trends indicate commercial real estate will
gain momentum in 2014.
Office Space
The modest pace of economic growth over the past five years has led to painfully
slow improvements in both operating fundamentals and new construction for the
region’s commercial real estate sector, especially office properties. Employment
growth in industries that utilize office space is approaching prerecession levels
but changes in technology and workplace organization have reduced the amount
of office space utilized per worker. Firms have realized dramatic cost savings by
reducing their real estate footprint – real estate is usually the second highest
corporate cost after employment. Much stronger employment growth is needed
to offset these trends.
Southern California’s office market appears to be stabilizing but there is a great
deal of variation by county and submarket. The sectors that are driving demand
for office space include energy, technology, health care, biomedical research,
and to a lesser extent education and financial services. Leasing activity is
generally on the rise, but the impact on rental rates has been minimal. It will take
several more quarters of improvement before the region’s office market recovery
becomes firmly entrenched
Los Angeles County: Although performance was uneven in 2013, Los Angeles
County’s office market closed the year on a more positive note than anticipated.
Vacancy rates edged down, occupancy increased and there was even a small
bump in rental rates.

Major Industries of the Southern California Economy
LAEDC Kyser Center for Economic Research 81 Economic Forecast, February 2014
During the fourth quarter of 2013, the overall office vacancy rate in Los Angeles
County was 18.2%, down marginally from 18.4% during the same period in 2012.
Net absorption in 2013 was positive 295,483 square feet (compared with 1.0
million square feet in 2012) with the Westside and L.A. North responsible for
most of the gain. No new construction was completed during 2013, but there
was 790,748 square feet of new construction working through the pipeline. The
average asking rent for Class A space was $2.83 per square foot during the
fourth quarter of 2013. This represents an increase in rents of 0.7% compared
with the fourth quarter of 2012.
The central business district submarket had the highest vacancy rate in Los
Angeles County (20.6%). There were significant occupancy losses last year as
several firms downsized – a trend that is expected to slow in 2014. The Westside
posted the lowest overall vacancy rate (15.4%) where demand is strong for both
traditional and creative space. In Santa Monica, creative user demand dropped
the vacancy rate to 8.5%, while in the South Bay, El Segundo is home to one of
the fastest growing office markets in Los Angeles County and is emerging as a
creative tenant favorite. Demand from advertising firms for space in Playa Vista’s
“agency row” was also strong last year.
Orange County: Orange County closed 2013 with three consecutive years of
substantial net absorption. Demand from health care and technology companies
drove much of the improvement in Orange County’s office market, while by
geography, demand was strongest in the greater airport area.
In Orange County, the average office vacancy rate declined in the fourth quarter
of 2013 to 14.9% from 16.0% a year ago. Net absorption in 2013 was positive
1.1 million square feet compared with 1.4 million square feet in 2012. No new
office space was delivered, but there is nearly 790,000 square feet of new
construction underway. The average Class A asking rent in Orange County
increased by 3.9% over the year to $2.14 per square foot during the fourth
quarter.
Inland Empire: The Inland Empire office market should continue to stabilize
over the rest of 2014, but true recovery is still somewhere down the road.
Employment growth in the industries that use office space is slowly improving,
but nowhere near fast enough to fill available vacant space.
In the Inland Empire, the office vacancy rate was 19.3% during the fourth quarter
of 2013, down from 21.4% during the same period in 2012. Rental rates edged
down to $1.97 per square foot from $2.06. Total net absorption in 2013 was
446,000 square feet compared with 586,000 square feet in 2012.
Industrial Space
Southern California is a major center for manufacturing, international trade and
logistics, and entertainment, all of which are users of industrial space. Los
Angeles County is the nation’s largest manufacturing center and is home to its
biggest port complex. An adequate supply of industrial land with ready access to

Major Industries of the Southern California Economy
LAEDC Kyser Center for Economic Research 82 Economic Forecast, February 2014
Industrial Vacancy Rates in
Southern California
Source: Cushman and Wakefield
0.0
2.0
4.0
6.0
8.0
10.0
12.0
14.0
16.0
Los Angeles Orange Inland Empire Ventura
Percent vacant, quarterly averages
the region’s transportation infrastructure facilitates trade and enhances the
competiveness of the region. Moreover, industrial real estate is job-producing
land, offering employment opportunities for all skill and education levels; it
supports jobs in other business sectors and generates taxes that sustain and
improve the quality of life elsewhere within the greater Los Angeles region.
Los Angeles County: The Los Angeles industrial real estate market continues
to improve. Vacancy rates are trending down and rental rates are slowly edging
up. New construction activity was also strong in 2013.
At the close of 2013, the overall industrial vacancy rate in Los Angeles County
was 4.4%, down from 4.6% in during the same period last year. Over the year,
the average asking rent for industrial space jumped from $0.49 per square foot to
$0.58 per square foot. Overall absorption for 2013 was just over one million
square feet.
In 2013, nearly 2.5 million square feet of new industrial construction was
completed with another 2.6 million square feet in the pipeline at the end of the
year. This was the largest amount of space under construction at year-end since
2008. The South Bay and Central Los Angeles submarkets are leading the way,
with 1.1 and 1.6 million square feet of new product added last year.
Orange County: Like Los Angeles County, Orange County has one of tightest
industrial real estate markets in the country. Net absorption during 2013 was
nearly 1.8 million square feet. New industrial construction totaled 308,080
square feet last year with another 209,715 square feet currently underway.
The average direct vacancy rate in the fourth quarter of 2013 was 4.0%, which
was down from 5.2% during the same time a year ago. During the fourth quarter,
the average asking rents increased to $0.72 per square foot from $0.68 per
square foot during the comparable period last year.
Major Industries of the Southern California Economy
LAEDC Kyser Center for Economic Research 83 Economic Forecast, February 2014
Orange County’s industrial real estate market is on track for recovery although
the pace is slower than anyone would like. Higher land costs make the area less
attractive to users of large warehouses, but with low interest rates and low sales
prices, investor activity should post significant gains in 2014.
Inland Empire: Strong demand for large-scale distribution space in the Inland
Empire decreased the overall vacancy rate to 5.9% in the fourth quarter of 2013
from 7.1% during the fourth quarter of 2012. This was the lowest vacancy rate
since the first quarter of 2008. Asking rents edged up, rising from $0.38 per
square foot in the last quarter of 2012 to $0.40 per square foot during the final
quarter of 2013. Net absorption for the year was just under 12.6 million square
feet.
New construction in 2013 added 9.5 million square feet of new industrial product
to the Inland Empire with an additional 17.5 million square feet still under
construction. The Inland Empire leads the nation in industrial construction and
demand for large-scale distribution facilities should easily absorb new
construction in 2014. As vacancies decline, and if demand stays on course,
rents will rise but are expected to remain below prerecession levels for the near
future.
Forecast for Private Nonresidential Construction
For the most part, new office space development will proceed at a cautious rate
in all five counties of the Southern California region. Office vacancy rates will be
stable or decline through 2014, but how fast will depend on improvement in the
labor markets. Average rents may continue to be soft in some areas, but for the
most part, appear to be stabilizing or even increasing in some of the more
desirable submarkets. Although changes in workforce organization will present a
challenge going forward, the lack of new construction and stronger employment
growth this year will help drive the region’s office market recovery.
The outlook for industrial space development is somewhat more positive,
especially for warehouse and distribution, data centers and to a lesser extent,
manufacturing and R&D centers. However, improvements in vacancy rates and
rents will depend largely on trade and manufacturing activity. Another factor is
the rate at which speculative developments come online – too much supply
added too fast could push vacancy rates higher.
The value of total nonresidential construction in the five-county region rose to an
estimated $7.2 billion in 2013, up by 16.5% compared with 2012. In 2014, as
general economic and labor markets conditions improve, the LAEDC forecasts
nonresidential construction in the region will increase to $8.3 billion (15.8%).
While this increase appears large in percentage terms, the market is coming off a
very low base. The road to recovery is still unfolding and will be a long one.
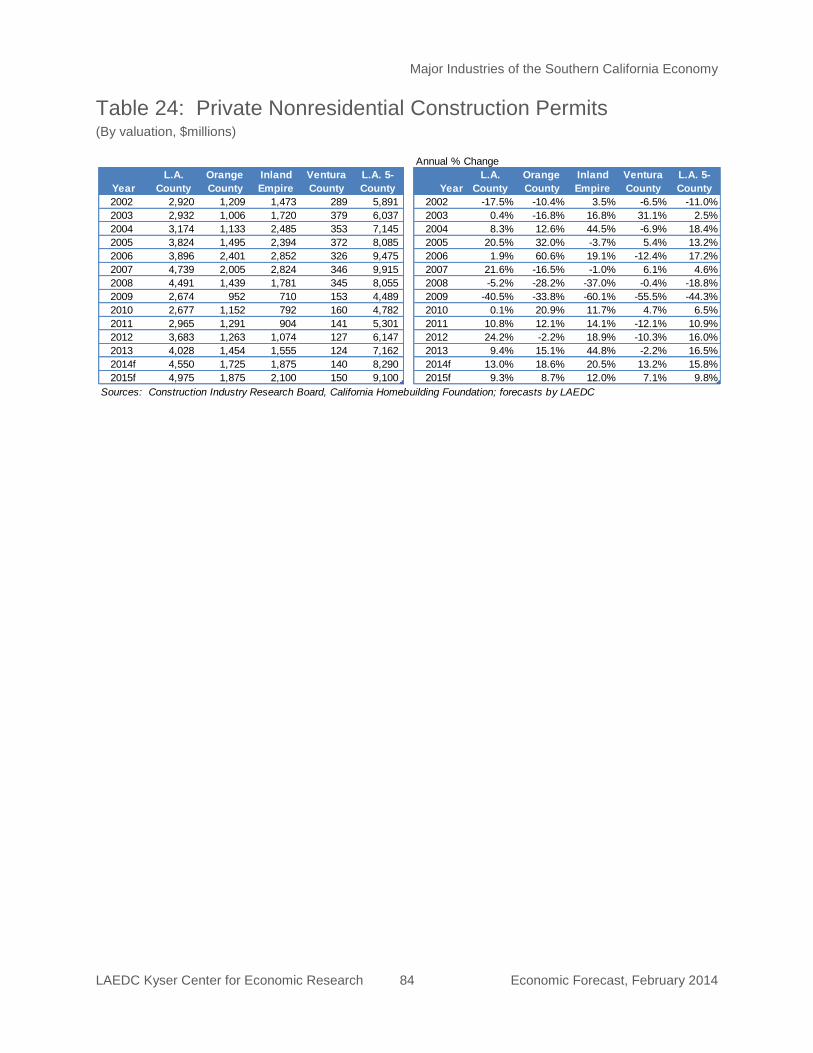
Major Industries of the Southern California Economy
LAEDC Kyser Center for Economic Research 84 Economic Forecast, February 2014
Annual % Change
Year
L.A.
County
Orange
County
Inland
Empire
Ventura
County
L.A. 5-
County Year
L.A.
County
Orange
County
Inland
Empire
Ventura
County
L.A. 5-
County
2002 2,920 1,209 1,473 289 5,891 2002 -17.5% -10.4% 3.5% -6.5% -11.0%
2003 2,932 1,006 1,720 379 6,037 2003 0.4% -16.8% 16.8% 31.1% 2.5%
2004 3,174 1,133 2,485 353 7,145 2004 8.3% 12.6% 44.5% -6.9% 18.4%
2005 3,824 1,495 2,394 372 8,085 2005 20.5% 32.0% -3.7% 5.4% 13.2%
2006 3,896 2,401 2,852 326 9,475 2006 1.9% 60.6% 19.1% -12.4% 17.2%
2007 4,739 2,005 2,824 346 9,915 2007 21.6% -16.5% -1.0% 6.1% 4.6%
2008 4,491 1,439 1,781 345 8,055 2008 -5.2% -28.2% -37.0% -0.4% -18.8%
2009 2,674 952 710 153 4,489 2009 -40.5% -33.8% -60.1% -55.5% -44.3%
2010 2,677 1,152 792 160 4,782 2010 0.1% 20.9% 11.7% 4.7% 6.5%
2011 2,965 1,291 904 141 5,301 2011 10.8% 12.1% 14.1% -12.1% 10.9%
2012 3,683 1,263 1,074 127 6,147 2012 24.2% -2.2% 18.9% -10.3% 16.0%
2013 4,028 1,454 1,555 124 7,162 2013 9.4% 15.1% 44.8% -2.2% 16.5%
2014f 4,550 1,725 1,875 140 8,290 2014f 13.0% 18.6% 20.5% 13.2% 15.8%
2015f 4,975 1,875 2,100 150 9,100 2015f 9.3% 8.7% 12.0% 7.1% 9.8%
Sources: Construction Industry Research Board, California Homebuilding Foundation; forecasts by LAEDC
Table 24: Private Nonresidential Construction Permits (By valuation, $millions)

Major Industries of the Southern California Economy
LAEDC Kyser Center for Economic Research 85 Economic Forecast, February 2014
U.S. Retail Sales
Source: U.S. Census Bureau
-15.0%
-10.0%
-5.0%
0.0%
5.0%
10.0%
15.0%
20.0%
25.0%
Total Retail Sales Core Retail Sales Non Store Retail Sales
Dec. 2013
Core 4.4% y/y
Total 4.1% y/y
Nonstore 9.9% y/y
Y/Y % Change
RETAIL TRADE
The retail sector is a key component of the economy at both the national and
local levels. Because such a large portion of U.S. economic activity depends on
consumer spending, purchases of retail goods and services is an important
economic indicator. Retailers also provide an enormous number of jobs that
encompass a wide range of skill and income levels. In 2013, nearly 11% of the
work force in the Los Angeles five-county region was employed in the retail
sector. That amounted to 741,300 jobs, an increase of 1.3% compared with
2012.
The U.S. retail sector continued to improve in 2013, but has not yet achieved full
recovery. Consumers remain cautious and are careful about what they buy,
especially low and middle-income consumers. Still, retail sales were up by a solid
4.2% compared with 2012 while core retail sales15
increased by 3.8%. The best
performing retail sectors were auto sales (up 8.7%) and non-store retailers i.e.
on-line and catalogs (up 10.1%).
Retailers have cause to be more optimistic about 2014 and 2015. Consumer
confidence surged in December of last year after falling during the previous three
months. It appears the government shutdown during the fall of 2013 had little
lasting effect on consumer spending and consumers are now feeling more
positive about their current circumstances and the outlook. The labor markets
have been showing steady improvement and the unemployment rate reached a
five-year low by the close of 2013. On the other hand, while personal income16
15 Note: Core retail sales strip out automobiles, gasoline, and building material and garden
supply stores, and are used to estimate consumer spending.
16 Note: In addition to wages and salaries, personal income includes rental income,
interest, dividends, employer contributions to retirement funds, government social
insurance, and government transfers.

Major Industries of the Southern California Economy
LAEDC Kyser Center for Economic Research 86 Economic Forecast, February 2014
is rising, growth rates have been weak at best and the gains unevenly distributed
among the broader population. Adjusted for inflation, the median weekly wage
for American workers in 2013 (first three quarters) was the same as 2007.17
A healthier housing market will also help fuel increases in retail spending over
the next two years. Rising home prices tend to make people feel wealthier and
encourage them to spend more. Household net worth has already surpassed
prerecession levels, rising to $77.3 trillion in the third quarter of last year, 17%
higher than it was in 2007 before the Great Recession and the financial crisis.
Household nonmortgage debt also reached that milestone and stands at 15%
over its prerecession peak. Although growth in credit card debt has been
restrained, low interest rates have made it more affordable for consumers to
finance the purchase of automobiles and household appliances.
Cautious consumers mean most retailers have to work harder for every sale
(luxury retailers are doing somewhat better). Retailers also have had to adjust to
rapidly evolving changes in consumer buying habits. People are spending more
on services like travel, movie downloads, concerts and sporting events, and less
on goods like clothing. Consumers have also become better informed, more
discerning and more interactive. Retailers are collecting and using large
amounts of data in order to provide a more personal shopping experience for
their customers. The use of tablets and smart phones to enhance and expand
the shopping experience has become standard for comparing prices, finding
coupons and making purchases.
Up and coming technologies include computer-simulated 3-D environments
viewed through a computer screen or wireless glasses. A number of big-name
retailers are already experimenting with applications of this technology to
improve store layouts and in-store navigation for shoppers. In the near-future, a
consumer will be able to walk into a grocery store and know instantly what
gluten-free products are available by way of an app on her smart phone. Virtual
dressing rooms are also being tested – imagine “trying on” and accessorizing an
outfit that appears and changes as the shopper views herself on a large screen.
Looking ahead, consumer spending is expected to post gains that are more
robust this year with even stronger growth over the course of 2015. Total U.S.
personal consumption expenditures, a large part of which are retail sales, are
expected to increase in 2014 by 2.8% compared with 2.0% in 2013, and rise to
3.1% in 2015. Southern California retail sales closely track national economic
trends. The LAEDC is forecasting moderate increases in total taxable sales, of
which retail sales make up about two-thirds, for 2013 that will range from 6.3% in
the Inland Empire to 5.1% in Ventura County. Orange, San Diego, and Los
Angeles counties should see increases in taxable sales of 5.7%, 5.5% and 5.3%
respectively.
17 Bureau of Labor Statistics, Current Population Survey: http://www.bls.gov/cps/#data

Major Industries of the Southern California Economy
LAEDC Kyser Center for Economic Research 87 Economic Forecast, February 2014
TRAVEL AND TOURISM
Hospitality and tourism is one of Southern California’s largest and most visible
industry sectors, employing hundreds of thousands of people and generating
billions of dollars in economic activity. In 2013, Los Angeles County hosted a
record 42.2 million visitors (day and overnight), a 2.0% increase over the
previous year. This was the third straight year that Los Angeles County achieved
record breaking visitor counts. Tourists and business travelers spent a chart
topping $16.5 billion in 2012 (latest data available), which was an increase of
6.9% over 2011. The numbers for 2013 are expected to be even better. The total
economic contribution of the hospitality and tourism sector to the Los Angeles
region was over $30 billion in 2012.18
Over six million additional international travelers arrived in Los Angeles in 2013
compared with 2012, an increase of 2.6%. International travelers accounted for
14.6% of the total number of visitors (day and overnight) who arrived in Los
Angeles in 2013, compared with 14.5% in 2012. Slightly stronger global
economic growth in 2013 may explain in part why international growth (2.6%)
outpaced domestic visitor growth (1.9%).
While Mexico and Canada sent the largest number of international visitors to Los
Angeles County, China remained in the top spot as Los Angeles County’s
number one overseas market. China sent 570,000 visitors to Los Angeles
County in 2013, a jump of over 21% compared with the previous year. In fact, the
Los Angeles Tourism and Convention Board opened up a second office in China
last year to promote travel to Los Angeles. A recent analysis by CLSA Asia-
Pacific Markets predicts that the number of Chinese visitors to the U.S. will triple
from 1.5 million in 2012 to 5.7 million by 2020. This is excellent news for the
hospitality and tourism industry in California and Los Angeles County. Nearly half
of all Chinese traveling to the U.S. visit California and over 72% (based on 2013
figures) of those visiting California come to Los Angeles County. As a result, Los
18 The Los Angeles Tourism and Convention Board
L.A. County Overnight Visitor
Counts and Spending
$0
$2
$4
$6
$8
$10
$12
$14
$16
$18
0.0
5.0
10.0
15.0
20.0
25.0
30.0
2001 2002 2003 2004 2005 2006 2007 2008 2009 2010 2011 2012
Domistic Visitors International Visitors Visitor Spending ($bns)
Source: L.A. Tourism and Convention Board

Major Industries of the Southern California Economy
LAEDC Kyser Center for Economic Research 88 Economic Forecast, February 2014
Angeles County could see anywhere from one and a half to two million Chinese
visitors by 2020, a development that would benefit hotels, restaurants, cultural
venues, tourist attractions and luxury brand retailers.
Demand for the region’s hotel rooms was very strong in 2013, with record high
levels in both occupancy rates and total rooms sold. The average occupancy rate
in Los Angeles County was estimated to have reached 76.8% in 2013, up from
75.4% in 2012. Total rooms nights sold reached 27.2 million last year, an
expansion of 2.1% from 2012. Average daily room rates (ADR) improved as well,
regaining the ground lost during the downturn. Last year, ADR in Los Angeles
County was estimated to be $136.52, an increase of 4.9% compared with 2012.
The story is much the same throughout Southern California although there is
considerable variation by county and submarket. In 2014 and into 2015, the
lodging sector will benefit from stronger corporate spending, personal income
growth and international visitation. Transient-occupancy taxes, a significant
revenue source for local governments, should also register increases. 19
Leisure and hospitality employment is on the rise as well. In 2013, the leisure
and hospitality sector20
added 37,293 jobs, representing a 4.1% year-over gain in
employment. Over half of the gain was concentrated in Los Angeles County
(18,817 jobs), but job counts were up across the region with significant gains in
the Inland Empire and San Diego County. Restaurants and bars, which employ
about 70% of all workers in the leisure and hospitality sector, also expanded
payrolls in 2013. The outlook for the region’s signature leisure and hospitality
industry is even brighter in 2014 and 2015. Stronger economic growth both at
home and abroad will provide a nice uptick in activity. Additionally, after several
years of almost no new hotel construction, there are multiple hotel projects under
construction in Southern California with more projects planned for the next two
19 Note: This section was largely based on figures from the Los Angeles Tourism and
Convention Board as well as PKF Consulting.
20
Note: This sector (NAICS 72) includes lodging, food services, the performing arts, museums, amusement parks and gambling establishments, all of which cater to residents as well as tourists so employment figures are not entirely attributable to tourist-related activities.
Hotel Occupancy Rates
40.0
50.0
60.0
70.0
80.0
90.0
100.0
Ja
n-0
7
Ju
l-0
7
Ja
n-0
8
Ju
l-0
8
Ja
n-0
9
Ju
l-0
9
Jan
-10
Ju
l-1
0
Ja
n-1
1
Ju
l-11
Jan
-12
Ju
l-1
2
Ja
n-1
3
Ju
l-1
3
Los Angeles Co. Orange Co. San Diego Co.
Source: PKF Consulting
Occupancy Rates (%)

Major Industries of the Southern California Economy
LAEDC Kyser Center for Economic Research 89 Economic Forecast, February 2014
SoCal Leisure & Hospitality Employment
Source: California EDD
0
200
400
600
800
1,000
1,200
Los Angeles County Orange County Inland Empire
San Diego County Ventura County
Thousands
years. A number of prominent hotel properties have also undergone extensive
remodels in an effort to keep guests coming back and to attract new customers.
Efforts to maintain Southern California’s position as a premier travel destination
are ongoing. LAX has acted on a multi-billion dollar investment program to
upgrade facilities. The centerpiece of this effort was the modernization of the
Tom Bradley International Terminal, which opened in September 2013. San
Diego International and Orange County’s John Wayne Airport have also recently
undergone major upgrades.

Index of Statistical Tables
LAEDC Kyser Center for Economic Research 90 Economic Forecast, February 2014
INDEX OF STATISTICAL TABLES
Table 1: U.S. Economic Indicators .................................................................................................. 7
Table 2: U.S. Interest Rates ............................................................................................................ 7
Table 3: Foreign Exchange Rates of Major U.S. Trading Partners…………………… ............. …18
Table 4: Gross Product Comparisons, 2013 ................................................................................. 25
Table 5: California Economic Indicators ....................................................................................... 27
Table 6: California Nonfarm Employment ..................................................................................... 28
Table 7: California Regional Nonfarm Employment ...................................................................... 29
Table 8: Total Nonfarm Employment in Southern California ........................................................ 30
Table 9: California Technology Employment ................................................................................ 31
Table 10: Population Trends in California and the Los Angeles Five-County Area....................... 32
Table 11: Components of Population Change in California and SoCal Counties.......................... 33
Table 12: Los Angeles County Economic Indicators ..................................................................... 38
Table 13: Los Angeles County Nonfarm Employment ................................................................... 39
Table 14: Orange County Economic Indicators ............................................................................. 44
Table 15: Orange County Nonfarm Employment ........................................................................... 45
Table 16: Inland Empire Economic Indicators ............................................................................... 51
Table 17: Inland Empire Nonfarm Employment ............................................................................. 52
Table 18: San Diego County Economic Indicators ........................................................................ 57
Table 19: San Diego County Nonfarm Employment ...................................................................... 58
Table 20: Ventura County Economic Indicators............................................................................. 62
Table 21: Ventura County Nonfarm Employment .......................................................................... 63
Table 22: Median Existing Single-Family Home Prices ................................................................. 79
Table 23: Total Housing Permits .................................................................................................... 79
Table 24: Private Nonresidential Construction Permits ................................................................. 84