california is a small, open economy, with no monetary...
TRANSCRIPT

Green Regulations in California and Sweden
Peter Berck and Runar Brännlund
Abstract
California and Sweden are both leaders in green regulations and actions. In both
there is a substantial political base for environmental regulation, yet the path to regulation
in these two political entities is quite different. California emphasizes command and
control regulations while Sweden makes heavy use of taxes. We show that both
underlying economic factors and the constraints of the larger systems in which these
economies are embedded contribute to their choice of control methods.
Introduction
Both Sweden and California are “green” states where the control of pollution is
taken beyond what is required by outside forces, such as the United States and the
European Union (EU). In this chapter we examine how forces, such as the rules of the EU
and the commerce clause of the U.S. Constitution, or the economic strengths of these two
economies lead to their specific forms of regulation. Though the two economies choose
very different ways to regulate, they are alike in their willingness to impose burdens on
consumers. To begin with, we describe some of the important features of these
two economies. Then, we describe the Swedish and California greenhouse gas (GHG)
regimes. The last section is a conclusion.
Economic Background
California is a medium-sized, open economy with no monetary policy and a near-
balanced budget. At $1.7 trillion of gross state product, California would rank as the
world’s eighth largest economy in 2006. It is not known for heavy manufacturing and no
longer has significant steel mills or car plants. It has fading oil reserves but a significant
refinery capacity. Although it is among the largest agricultural states by value, it is not a
major producer of grain.
California is the longtime home of the environmental movement and currently has
a very green, Republican governor and a strongly democratic and green legislature. It is
among the states that have decided to set GHG reduction goals independent of
U.S. policy.
Sweden, in contrast, is a small, open economy that has preserved its monetary
autonomy (as opposed to joining the euro) and runs a balanced budget by choice. The
gross domestic product of Sweden in 2006 was $385 billion, much smaller than
California, though nearly the same on a per-capita basis. Sweden has considerable heavy
industry, including a large mining sector, a steel industry, truck and automobile
manufacture, and a large paper and forestry industry. Furthermore, Sweden has no fossil
fuel. The Swedish parliamentary system consists mainly of two “blocks,” a left wing
block, including the Green Party, and a center right-wing block that is currently in power.
Attention to climate-change action has been unabated in the current center-right coalition.
Statsminister Fredrik Reinfeldt has even been pictured with Governor Arnold
Schwarzenegger.
2
Both Sweden and California have a long record of environmental action unforced
by external factors. Sweden was green long before Brussels required it, and California
was green before there was a U.S. Environmental Protection Agency (EPA). While these
countries have green policies in common, they differ considerably in the legal regime
surrounding the environment and the tools that are used to induce compliance.
Sweden’s Environmental-regulation Regime
From 1999, Sweden had a new and comprehensive Environmental Code
(Miljöbalk, 1998, p. 808). The Code provides a framework for the environment that is at
once very familiar to a U.S. environmental practitioner yet also startlingly different. To
begin with, the Code applies in all media, unlike the U.S. and California model of
separate laws for water, endangered species, air, pesticides, procedure, and so on. As a
single code of seven parts, 33 chapters, and 450 articles, it proceeds from principles to
procedure and then to penalties.
The heart of the Code is (1) the precautionary approach, (2) the requirement that
measures must be taken to avert damage to human health or the environment, and (3) the
polluter pays principle (Ministry of the Environment, 2004). These are general rules and
apply to all activities both private and public.
The polluter pays principle opens the possibility of money damages for almost
any activity that adversely affects the environment. In this sense it looks like the
Comprehensive Environmental Response, Compensation, and Liability Act (CERCLA),
which provides for natural resource damages in a more limited setting. The litigation
generated by CERCLA, like the case for damages from the Exxon Valdez spill, has not
been viewed by all as a positive development in environmental policy.
3

Like the Clean Water Act and the Clean Air Act (CAA), the Environmental Code
requires “best available technology” to avoid damage. And, again, like its U.S. cousin, it
allows a phase-in period for existing sources to comply.
Again, like the California Environmental Quality Act and the National
Environmental Policy Act, the Code requires that large projects prepare “impact
statements” and, in the case of the United States, through a collection of interacting laws,
and, in Sweden’s case, through the Code, obtain environmental permits. In the
United States, the environmental laws require public entities, broadly construed to
produce environmental-impact reports (California) or statements (United States) for
major actions (including issuing permits to private entities) with an effect on the
environment. The Code extends this equally to private and public entities. The major
difference in the Code and U.S. law is the approval process for actions with
environmental consequences.
Under the Code, the moving entity submits its plan to a county agency if the
project is small or to the Environmental Court (approximately, a Federal District Court) if
the project is large. The ruling of the court may be appealed to an appellate
environmental court and, ultimately, to the High Court. The legal action is designed to go
to the ultimate question of whether the plan is consonant with the Code. In contrast, much
of the legal action in the United States is about whether the environmental-impact
statement is procedurally correct. In Sweden, the government can intervene in this
process and make a political decision to allow a project that would otherwise be denied.
In the United States, such intervention is exceedingly difficult.
In the above respects, there is correspondence in the ways that environmental law
is carried out in these two entities. The most radical difference between California and 4

Sweden is the Swedes’ use of environmental taxes and charges. Taxes are a direct result
of the polluter pays principle since they literally make the polluter pay for all of their
pollution.
Sweden’s performance in GHG reduction is remarkable. Between 1991 and 2001,
there is a 5 percent reduction in emissions and, since the mid-1970s, the reduction has
been 40 percent. The majority of this reduction was attributable to the buildup of the
nuclear-power industry. But biofuels, especially used in the heating sector, have also
contributed significantly. Climate policy, per se, dates only from the late 1980s. Table 1
gives a short history.
Table 1. Climate Policy Decisions in Sweden
1988 The first explicit climate target in Sweden. The target included CO2 only and implied a stabilization of emissions at the “current level.”
1991 An amendment to the 1988 target. All GHGs are now included.
1993 A national climate strategy in line with the targets in the United Nations (UN) Climate Convention was decided. The new target was a stabilization of CO2 emissions originating from fossil fuels to the 1990 level before year 2000 and a reduction thereafter.
1997 A decision of new guidelines for energy policy with a specific climate strategy for the energy sector.
1998 A parliamentary decision on transport policy implying a stabilization by 2010 of CO2
emissions from transports to the level of 1990.
1999 A decision to introduce a system with 15 environmental quality targets, including “limited climate impact.”
2002 A new proposition on the “Swedish climate strategy,” in which the prevailing objectives were stated.
2002 A further refinement of the system with environmental quality targets, including sector responsibility to achieve the targets.
2002 An energy policy decision, including decisions concerning further international efforts in the climate area.
2006 A decision implying that the intermediate targets, 2008–2012, should still be kept but that the emissions by 2020 should be 25 percent lower than 1990.
Source: Energimyndigheten (2007).
5

The current commitment is much more stringent than what is required by the EU.
The climate target decided upon was a long-run objective that the concentration of GHGs
should not exceed 550 parts per million of CO2 equivalents and that the per-capita
emissions should not exceed 4.5 per ton by the year 2050. The ambient objective, of
course, requires international cooperation for its fulfillment. In addition to the long-run
objective, Sweden adopted short-run targets, implying that the average emissions of
GHGs during the period 2008–2012 should be 4 percent lower than the 1990 level. This
target is to be achieved without the use of “flexible instruments” and/or carbon sinks
(flexible instruments are being reconsidered).1 At the same time, Sweden was committed
to a binding commitment through the Kyoto protocol and the EU agreement of burden
sharing within the EU. According to that commitment, Sweden is obliged to limit its
emissions to no more than +4 percent, as an average, 2008–2012, compared with the
1990 level. In other words, the Swedish parliament decided on national goals that were
significantly stricter than the obligations that resulted from the negotiations within the
EU.
The current collection of instruments that are being used to reduce
GHG emissions are shown in Table 2.
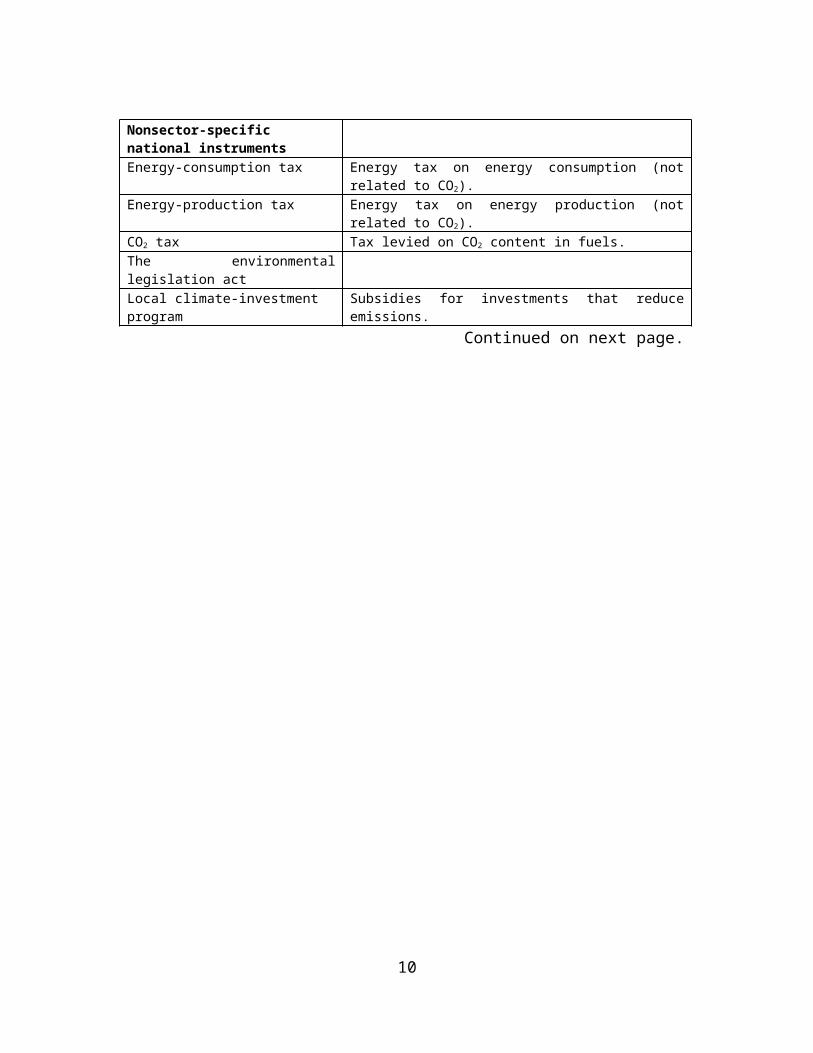
Table 2. Climate Policy Instruments in Sweden
Nonsector-specific national instrumentsEnergy-consumption tax Energy tax on energy consumption (not related to CO2).Energy-production tax Energy tax on energy production (not related to CO2).CO2 tax Tax levied on CO2 content in fuels.The environmental legislation actLocal climate-investment program Subsidies for investments that reduce emissions.
Continued on next page.
1Flexible instruments is a term taken from the Kyoto protocol and includes measures, such as the clean-development mechanisms, permit trading, and joint implementation.
6

Table 2—continued.
Information Information campaigns about the climate problem jointly done by the Energy Agency, Consumer Agency, and the Swedish Environmental Protection Agency.
Sector-specific instrumentsEnergy and housing sectorGreen certificates Consumers of electricity obliged to buy a specific
amount of certificates (proportional to electricity consumption) that ensure production of electricity from renewable sources.
Subsidy to windpower Investment subsidy and a variable “green bonus.”Promotion program for improving energy efficiency
Companies that engage get a tax relief from the EU minimum energy tax.
Energy declaration of buildings From 2007, it is mandatory to have an energy declaration for buildings.
Building norms Specific norms for energy efficiency in buildings and regulations for loss of heat.
Transport sectorFuel taxesTax exemption on biofuelYearly vehicle tax Differentiated with respect to CO2 emissions.Biofuel car subsidy SEK (Swedish krona) 10 000 (€ 1 200) subsidy when
purchasing a biofuel car.EU specific instrumentsEU Emissions Trading System Emission Trading System for CO2, launched in 2005.
Covers a subset of the EU CO2 emissions.
Source: Own construction from various sources. See Swedish Energy Agency (2008) for a detailed description of the policy instruments in use in Sweden.
Except for the tax instruments, nearly the same measures are either in effect or
proposed for California. California subsidizes solar cells (an analog of the climate-
investment program), has a renewable-portfolio requirement for electric generators
(analog of green certificates), has strict energy codes for buildings, and is working on a
trading scheme to cover at least the electric sector.
Sweden is unusual in the sense that they have some taxes that are explicitly levied
on emissions, e.g., the CO2 tax and the sulfur tax, which are explicit taxes on the CO2
content and sulfur content in fuels. However, in the universe of the Organization for
Economic Cooperation and Development (OECD) countries, Sweden is not remarkable
for its magnitudes of environmental tax revenues, which are about 3 percent of the Gross
7

National Product (GNP). It is the United States, where taxes are about 1 percent of GNP,
that is very different from the OECD mean of 2.5 percent. One reason for the lower
revenues in Sweden, in spite of its relative high rates, is that the use of fossil fuels is
relatively low.
Table 3 shows the environmental taxes and their yields by year. The revenues
from the CO2 tax are those that are increasing fastest over time (together with the vehicle
tax). The revenue increase was due to an increased tax rate against a stable tax base.2
Table 3. Tax Receipts From Environmental Taxes
1993 1995 1997 1999 2001 2003Environmental Taxes
CO2 tax 12046 12481 13484 13658 17725 23814Sulfur tax 210 171 155 129 87 122Pesticide/herbicide tax 15 35 56 43 61 67Fertilizer tax 211 326 401 368 384 340Refuse tax 936 906Mining tax 141 151 128 193
Sum (A) 12 482 13 014 14 237 14 348 19 322 25 442Environment Related Taxes
Fuel tax 23431 25649 28260 28686 24930 20831Electric energy tax 6519 6727 9495 11515 13080 15651Waterpower tax 1175 1018Nuclear tax 114 145 1587 1662 1939 1829Ultimate waste disposal tax 1272 1495 867 1017 760 459
Sum (B) 32 510 35 034 40 208 42 879 40 709 38 770Weakly Related Environmental Taxes
Vehicle tax 4675 4418 6728 6881 7303 7687Sales tax on vehicles 1469 1908 225 281 –23Mileage tax 3125
Continued on next page.
2A more in-depth analysis of the Swedish environmental tax system is given in Brännlund (2006). 8

Table 3—continued.
Sum (C) 9 269 6 326 6 954 7 162 7 280 7 687
Environmental Tax (%)* 23 24 23 22 29 35
A + B + C 54 261 54 373 61 399 64 389 67 311 71 899Percent of Total Tax 6,1 6,1 5,5 5,5 5,5Percent of GNP 3,1 2,8 3,0 2,9 2,9 2,9
Note: In millions of 2003 SEK. *(A)/(A + B + C).Source: Assembled from various publications from “Skatteverket” (the Swedish tax authority).
The Swedish energy and CO2 taxes are not applied uniformly. There is one set of rates for
nonmanufacturing and another for manufacturing. The basic argument behind the
differentiation is that the manufacturing sector is subject to international competition. The
next two figures show the tax rates for oil, electricity, gasoline, and diesel.
Figure 1. Specific Tax (CO2 + Energy Tax) For Fuel and Electricity (Excluding Sulfur), 1974–2005*
0
0.1
0.2
0.3
0.4
0.5
0.6
SEK/Kwh
Heating fuel
Diesel
Gasoline
Electricity
*SEK per kilowatt-hour (kWh), fixed prices (2004), nonmanufacturing sectors.Source: Assembled from various publications from “Skatteverket” (the Swedish tax authority).
9
We see that there is a steady positive trend over the whole period. The sharp increase in
the early 1990s corresponds to a policy decision to tax carbon dioxide and otherwise shift
taxation toward the environment and away from labor.
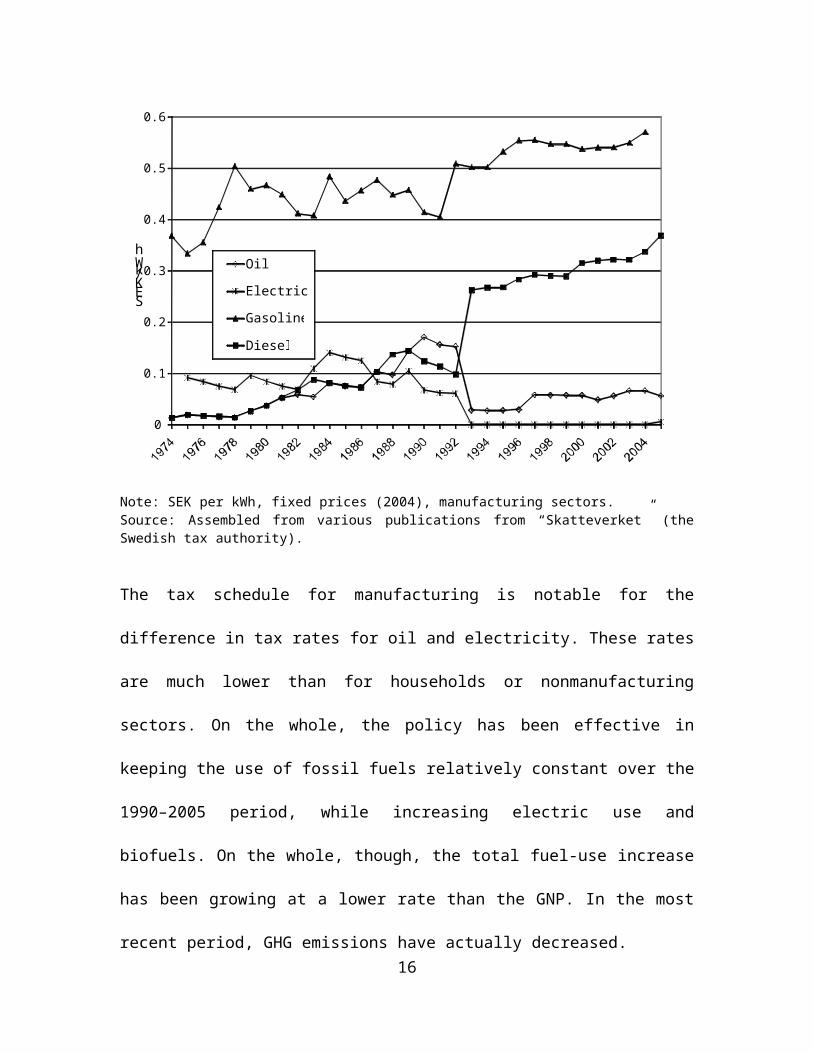
Figure 2. Specific Tax (CO2 + Energy Tax) for Fuel and Electricity (Excluding Sulfur), 1974–2005*
0
0.1
0.2
0.3
0.4
0.5
0.6
SEK/kWh
Oil
Electricity
Gasoline
Diesel
Note: SEK per kWh, fixed prices (2004), manufacturing sectors.Source: Assembled from various publications from “Skatteverket” (the Swedish tax authority).
The tax schedule for manufacturing is notable for the difference in tax rates for oil and
electricity. These rates are much lower than for households or nonmanufacturing sectors.
On the whole, the policy has been effective in keeping the use of fossil fuels relatively
constant over the 1990–2005 period, while increasing electric use and biofuels. On the
whole, though, the total fuel-use increase has been growing at a lower rate than the GNP.
In the most recent period, GHG emissions have actually decreased.
10

While the performance of energy taxes has been quite good for the economy as a
whole, the transport sector has not shared in the decrease in GHG emissions. Although
the taxes have had a negative effect on transport fuel demand, increased income has
outweighed this effect to a large extent. From 1990 to 2005, CO2 emissions from the
transport sector increased by 10 percent (Energimyndigheten, 2007). The tax increase on
gasoline and diesel since 1990 has, according to some estimates, reduced emissions by
approximately 1.5–3.2 metric tons per year, which corresponds to a 10 percent to
20 percent reduction in the transport sector (Statens Institut för
Kommunikationsforskning, 2005).3
The overall picture for GHG emissions for Sweden is quite positive, with large
decreases in emissions at the same time that national income has been increasing. An
important challenge in meeting Sweden’s long-term GHG goals is the transport sector. In
California, on the other hand, regulation of GHG emissions in the transport sector has
taken high priority.
California’s Special Place in U.S. Environmental Regulation
Many of California’s environmental laws predate similar laws of the
United States. California was the first state to regulate automobile exhaust. Since its
regulations predated the CAA and since the Los Angeles basin traps exhaust to a greater
degree than is common in the rest of the United States, the CAA allowed California to
keep its strict regulations and provided a special mechanism for California to make air
3An analysis of changes in the Swedish CO2 tax is presented in Brännlund and Nordström (2004) and Brännlund, Ghalwash, and Nordström (2007). It is shown that an increase in the CO 2 tax has a negative effect on fuel demand. An analysis of changes in the Swedish CO2 tax is presented in Brännlund and Nordström (2004) and Brännlund, Ghalwash, and Nordström (2007). It is shown that an increase in the CO2
tax has a negative effect on fuel demand, but the effect, to some extent, depends on how the tax revenues are recycled.
11

regulations more stringent than the United States as a whole. Once California makes such
regulations, other states are free to adopt the California regulation rather than the
regulations made by the U.S. EPA.
The CAA, itself, is very broadly drawn and mentions climate change as well as
human health. California is trying to use the authority granted by the CAA to originate
climate legislation that can be copied by other states.
California has decided to join Kyoto or even do Kyoto one better. By executive
order, Governor Schwarzenegger has decreed that California’s GHG goal is to reduce its
emissions to 80 percent of its 1990 levels by 2050.
California has already taken the first steps to reduce its auto emissions. California
Assembly Bill No. 1493 (AB 1493), which was introduced by Assemblymember
Fran Pavley, mandates the reduction of GHG from automobiles. The California Air
Resources Board (CAL ARB), acting in accordance with AB 1493, promulgated an
effluent standard for CO2 emissions for automobile exhaust. For vehicles less than
3,751 lbs., the requirements for 2009 are an average of 323 gallons per mile and, for
2016, they are 205 gallons per mile. For heavier vehicles (up to 8,500 lbs.), they start at
439 gallons per mile and are reduced to 332 gallons per mile. There were two bars to the
enforcement of the California regulations. One was that the regulations required the
assent of the U.S. EPA, and the second were lawsuits against the regulations by the
Alliance of Automobile Manufacturers (among others).4
The California requirements will not have the force of law until the U.S. EPA
grants California a waiver from federal preemption—the technical term for allowing
4Green Mountain Chrysler vs. Crombie, U.S. District Court for the District of Vermont, Case No. 2:05-cv-302. Trial was in 2007 and finished after the judgment in Massachusetts vs. the U.S. EPA.
12

California to have its own automobile standards—and, therein, hangs a long legal tail.
The U.S. EPA has been reluctant to exercise authority to regulate GHGs. The State of
Massachusetts, among others, sued the U.S. EPA to force GHG rulemaking.5 After
protracted litigation, the U.S. Supreme Court found that automobiles contribute to global
warming, that incremental regulation that does not solve the whole global-warming
problem is admissible, and that EPA has the authority to regulate. The Court also found
that EPA could not ignore its responsibility to regulate. 6
While the litigation was in process, the U.S. Congress passed, and the President
signed, the Energy Independence and Security Act (EISA) of 2007. The Act required
average fuel economy of 35 miles per gallon (mpg) by 2050. The increases in fuel
economy must start by 2011. This law requires a slower pace of a fuel-economy increase
than the state legislation, and California chose to maintain its request for a waiver.
Partially because the U.S. action covers the same ground and in much the same way as
the California action, the U.S. EPA administrator felt that the EPA had some grounds to
deny the California request for a waiver. The U.S. EPA administrator has denied the
California request, and California is challenging the denial in court.
At the same time, the Automobile Industry sued California and other states that
copied the California regulations to prevent the regulations from coming into force. That
trial is over, and California won in all respects. In addition to trying the issues of whether
GHGs do cause global-climate change, the issues involved in that case also turn on the
reasonableness of the regulations in several dimensions.
5Massachusetts vs. the U.S. EPA (p. 1457) contains findings that automobiles contribute to GHGs and that incremental regulation is acceptable.6Id. At 1462.
13

The most pertinent of these dimensions are the costs and efficacy of the measurers
that could be used to reduce GHGs. The key finding for regulatory purposes is that
“There is a near-term, or off-the-shelf, technology package in each of the vehicle classes
evaluated (small and large car, minivan, and small and large truck) that resulted in a
reduction of CO2 emissions of at least 15 percent to 20 percent from baseline 2009
values” (CAL ARB, 2004). For instance, CAL ARB found that six-speed automated
manual transmissions would save about 8 percent of GHG emissions. The CAL ARB
created packages of techniques that would reduce emissions at least cost. For the 2015
time period, the costs were about $1,000 per car for a 26 percent reduction in GHG
output. The industry alleges that these techniques will save less fuel and cost three times
as much. The weighing of the costs and benefits is required by California legislation and,
indirectly, by the CAA. The California law requires maximum feasible technology and
cost effectiveness. While a strict cost-benefit evaluation is not germane to regulation
under the CAA, there is a back door to limiting costs. The cost of technologies in the
CAA is described, for example, as the “best available technology.” This seems to mean
something that exists and can be used at a “reasonable” cost. Technologies that do not
exist or have exorbitant cost do not fit this rubric and cannot be used as a basis for
regulation. Once the regulator has chosen a set of technologies that is efficacious and
implementable, the regulator sets an effluent standard (so many grams of CO2 equivalent
per mile). The firms are free to meet that standard by using the technology suggested or
in any other way that they wish. In this case the manufacturers could meet the
requirement by selling a different mix of cars in California than in the rest of the
United States. Domestic manufacturers could leave out their larger and more profitable
14

models. This is what they claim they will do, but it is not profit maximizing for them to
do so.
Once GHGs are found to be pollutants, there are two subsections of the CAA that
pertain to regulating stationary sources. One section requires the U.S. EPA to set a
National Ambient Air Quality Standard (NAAQS). States are then obligated to regulate
stationary sources in such a way as to meet that standard. While this makes good sense
for nitrogen oxide and sulfur oxide, it is much more difficult with a long-lived pollutant,
such as GHG. With nitrogen oxide, if one stops emitting very soon, the ambient standard
is met. With GHG, if one trims the whole world’s output of GHG, then, in 50 or
100 years, the standard may be met. Fortunately, for those states that wish to cut their
emissions, the CAA also allows them to directly regulate stationary sources even without
there being a NAAQS.
Perhaps one more word about the legal issues is in order for an EU audience.
There is an inherent conflict between the limited power of the United States (which, in
this case, is to regulate interstate commerce) and the States with the power to protect
public health. Congress’s power under the commerce clause usually wins out. In the
CAA, Congress was explicit in granting all states the same rights that they had prior to
the CAA to regulate stationary sources and to grant California the same rights that it had
prior to the CAA to regulate mobile sources.
The legal analysis is complicated. First, there is the issue of whether a waiver
based upon the CAA has the same force as a law of the United States. The Vermont court
found that it did. Second, there is the issue of whether the CAA or the Energy Policy
Conservation Act of 1975 had precedence in the establishment of standards. The Energy
Conservation Act is the framework for setting mileage standards—the Corporate Average 15
Fuel Economy (CAFE) standards—for the purpose of saving energy. The Vermont court
found that the CAA takes precedence. The argument was that, since the CAA required
the U.S. EPA to consider everything that the Department of Transportation (DOT) needs
to consider in setting the CAFE standards and, in addition, to consider public health, the
CAA imposed duties on EPA that went beyond those imposed on DOT. The Vermont
court position has long-lasting consequences because it assures that, as climate change
becomes better understood, the CAA obligation to prevent it will lead to yet stricter
automotive standards.
The fundamental economic and political interests in this struggle are plain
enough. California has no automobile industry and has already tightly regulated
stationary sources to limit conventional pollutants. For instance, California has almost no
coal-fired boilers and makes all of its electricity out of renewables, nuclear, or natural
gas. Therefore, California has little at risk from regulating automobiles and conventional
mobile sources. The U.S. Automobile Industry, on the other hand, pleads that most of its
earnings come from less fuel-efficient cars and trucks. So a fuel-efficiency regulation
would favor the Japanese (which are Southern United States) manufacturers (who make
small cars and fuel-efficient hybrids) over the American (really, Detroit and Northern
United States) manufacturers, hence, the spirited opposition of the manufacturers to
increased standards.
The California initiative is proceeding on three other fronts. California is
considering a low-carbon fuel standard for cars, California is actively working to assure
that its imported electricity is low-carbon electricity, and California is considering an
overall carbon cap enforced by a cap and trade system.
16
All of these decisions are much more difficult than the decision to require more
expensive automobiles, both as a technical matter and as a political matter.
Automobiles
Let us review what is known about GHG automobile regulation. The
GHG emissions are vehicle miles traveled (vmt) times gallons per mile times carbon per
gallon. Thus, there are three choices to be made: how far, how efficient, and how carbon
intensive. Government can and does target all three decisions.
Absent regulation, automobile companies will build and consumers will buy cars
with poor fuel efficiency. In 2004, Sweden’s car fleet averaged 314 gallons per mile of
carbon dioxide. That is close to the 2009 standard for California and also close to the
emissions intensity of the current California small- and large-car fleets.
The composition of the Swedish car fleet shows that it is difficult to cause fuel
efficiency in automobiles by means of taxes to the degree planned for in the California
regulations. On February 13, 2008, the lowest price for gas in Umeå, Sweden, was $6.47
per gallon while the lowest Bay area price was $2.92. Given the Swedish tax on gasoline
and on carbon dioxide, the magnitude of this difference in price is easily explained.
According to a new study by Dargay (2008), energy taxes (including a CO2 tax) have
contributed to an energy saving of approximately 10 percent. That is, without these taxes,
energy consumption by cars would have been 10 percent higher. According to Dargay,
this efficiency improvement, to a large extent, is due to lower fuel consumption per
kilometer.
Automobile companies say that their customers are not very concerned with
mileage. In the hearings for the GHG auto-efficiency standards, the automobile company
17

representative went as far as to say that his customers care more about cup holders. The
work of Berry, Levinsohn, and Pakes (1995) finds that only at the lower end of the price
range is mpg much of a determinant of choice of car. No estimate that we know of
predicts a strong response of vehicle choice to gasoline price.
The second place to look for GHG savings is in vmt. Again, the empirical
evidence is that higher gasoline prices do not have a great effect on miles traveled.
Estimating the demand for vmt is a difficult activity. The demand estimates are
said to be short run if they account for fleet make up and long run if they do not.
Gasoline-demand studies surveyed by Espey (1996) give a long-run price demand
elasticity of –.7 and a short-run elasticity of about –.2. There is a huge dispersion in
estimates. The cost of vmt is not treated uniformly in these studies. Let us start with a
short-run perspective. Here, the choice is how much to drive, given that the car is already
purchased. The costs to consider are the cost of time, the cost of gas (the item of interest),
the cost of parking, the marginal cost of mileage on the car, and the marginal cost of
insurance. To get an order-of-magnitude idea of these costs, the Internal Revenue Service
allows approximately 50 cents per mile as the cost of a car. The fleet average miles per
hour is about 20 mpg. Therefore, at $2 per gallon, gas is 10 cents of this. The 2006
median weekly earnings divided by 40 is $17 per hour. At 40 miles per hour, the cost of
time is about 42 cents per mile. So the price of a marginal vmt is at least 52 cents and, at
most, 92 cents, exclusive of parking. (In a big city, the parking for a trip to the center can
double the cost of the trip and, hence, the vmt). The role of mpg and dollars per gallon
are reciprocal in this exercise, so they should have the same effect with opposite signs in
the demand for gas. Now, gas is one-fifth to one-tenth of the cost of vmt so, by the usual
18

derived demand arguments, even if demand for vmt were elastic, demand for gas would
be very inelastic.
The long-run situation, and, by extension, the influence on gasoline price on the
choice of motor car, has an additional complication. The choice of car should be
influenced by the present value of the expected stream of gasoline expenditures. The real
price of this stream has not changed nearly as much as the short-run price of gas. The
current run-up in gas prices is perhaps the first increase that is expected to remain
permanent. So the historical data simply do not include much variance in present-value
gas prices.
Going back now to getting the carbon out of transportation, particularly, cars, the
evidence on the demand for autos leads to the conclusion that a very large tax would be
necessary to reduce vmt and induce the purchase of more efficient cars. Indeed, the
Swedish experience bears out that the current and high gasoline taxes are not sufficient
to achieve increases in kilometers per mile on the order of 30 percent.
It is much less clear, however, that the Swedish situation in respect to vmt is at all
similar to the situation in California. Here, the tendency of the Swedish population to live
in areas thoroughly served by mass transit, itself a government policy, may well dominate
the equation for how many miles to travel. Perhaps the “less than one beer” permissible
blood alcohol level also reduces trips. In 1997, Swedish vmt was 3,989 miles per capita
while it was 5,701 miles per capita for the United States (U.S. DOT, 2003).
Let us return to the choice of cars. We have argued that, even doubling fuel
prices, will not drive fuel efficiency down to the desired target levels in California or in
Sweden. While, in Sweden, the shift of the tax burden from labor to environment was
possible, the same exercise seems beyond political reach in the California. In addition to 19

missing the advantages of a parliamentary system (the government, by definition, has the
votes to carry through policy), California government has further impediments to tax
shifting. The bill that set the California efficiency standards in motion (AB 1493) also
prohibited the use of increased taxes as an instrument. General taxes require a two-thirds
vote of the legislature, very unlikely in the antitax climate of California.
In the EU, there is discussion of a fuel-efficiency standard similar to the
California standard. However, it has not been promulgated as was expected on
January 23 and the reports in the press blame opposition from Germany, which is a maker
of larger cars (BusinessWeek, 2008). In this sense the EU mirrors the United States:
Areas making large cars oppose efficiency standards and have enough power to delay
them for some time. In the United States, it appears that it was the threat of California
and allied states setting nonnational and very strict standards that allowed Congress to
act, and the President to sign, somewhat more relaxed standards.
Should the California waiver of preemption ultimately prevail, it will create a
market for more efficient cars. Vermont, New York, Massachusetts, Rhode Island, and
Canada as well as other jurisdictions have already indicated that they will impose similar
or identical requirements. With a supply of such cars secured and a demonstration that
economic life will not end with more efficient automobiles, there will be increased
pressure on the EU to come along. So, although California may not lead by much in this
particular case, its leadership may well tip the balance in the EU as it seems to have done
in the rest of the United States.
Therefore, there is a very mixed bag here. The tax measures relied upon in
Sweden and impossible in California are a small hope for reducing vmt. The grams per
20

mile measures relied upon in California and, so far, impossible in the EU and Sweden, do
solve the problem of the carbon intensity of miles.
Auto Fuel
Both GHG intensity and fuel-source availability have led California to consider
policies to make motor fuel less petroleum based. The AB 1007 required such a study of
the California Energy Commission (CEC), which is currently incomplete. The results, in
a nutshell, are that, absent a breakthrough in cellulosic fuels (either ethanol or a liquid ),
the use of lower carbon fuels will be expensive.
For the CEC, three scenarios were evaluated. These are examples in the report of
the CEC (2007, p. 42 et seq.). The first is the ethanol and hydrogen fuel-cell vehicle
example. The second is the advanced biofuels and partial-hybrid electric vehicle
example. The third is the biofuels and hydrogen fuel-cell vehicle example. They differ in
the availability of advanced biofuels and the reliance on partial-hybrid electric or fuel-cell
vehicles. The aggressive scenarios, in terms of how much carbon was displaced, had
public-sector spending at $8 billion. At these projected costs, it is unclear if any such
policy will actually be adopted by California.
Ethanol (or biodiesel) is already required by the U.S. Energy Policy Act of 2005
and, more so, by EISA of 2007. These Acts provide an assurance of demand in addition
to the preexisting 50 cents per gallon blenders’ credit. Together, they have driven the
remarkable growth of ethanol in the United States. Of course, high prices or, more
exactly, margins between the corn price and the gasoline price also drive this process.
Within California, the use of ethanol depends upon the economics, including the
economics of the tradable obligations to use ethanol under the U.S. program, and upon
21
the requirements for use in low-pollution gasoline. The U.S. program requires 7.5 billion
gallons of renewables in 2012 (the California share would be about 750 million gallons).
Ethanol in the Untied States is produced from corn—a minor crop in California.
Using ethanol would require either devoting land now used for other crops, usually of
high value, to a feedstock crop or importing the ethanol. A cursory examination of
California agriculture would suggest that major amounts of ethanol will not be produced
in California, at least as long as consumers are willing to buy lettuce, grapes, avocados,
almonds, and so on at, or above, the current prices. Land values in California are more
than double those in the corn belt in 2006, lending credence to the proposition that,
economically, little corn-based ethanol will be produced from corn grown in California.
Thus, California ethanol is most likely to be imported. Without either a California
renewable-portfolio standard for car fuel or an air-pollution-based requirement for
ethanol in gas, the least-cost solution to the use of fuel will likely keep most ethanol in
the Midwest, especially if the requirement to make ethanol cars continues.
The EU and Sweden have an ambivalent relation to the current biofuels regime.
The Swedes make ample use of their forest biomass for heat but not as a motor fuel. This
opportunity is also possible and is being pursued on a smaller scale in rural California.
Sweden is not any better suited to corn or sugarcane than California, so native production
is unlikely. The distances between ethanol production and the location of consumption
would militate, in Sweden, as in California, against any great consumption. Finally, there
is no farm lobby that will be benefited by such a requirement in either place.
While the EU has set a biofuels transport target for each country, there is a
significant backlash. For instance, on January 21, 2008, the United Kingdom House of
Commons Environmental Audit Committee stated its opposition to the further use of 22

biofuels and drew responses from the EU energy and agriculture commissioners
(EurActiv, 2008). The January 23, 2008, draft of the EU directive on environment calls
for 10 percent of transport fuels to be biofuels. This is about the maximum level of
ethanol that can be burned without modification to the car fleet. The directive also
requires a 35 percent GHG savings and no use of wetlands, old forests, etc., to produce
the fuels. It is an open question as to whether this directive is possible.
With the biofuels initiative, California and the EU are in the same position in one
way and not another. The current GHG gain of biofuels is contested in both places. The
potential costs will loom large in the California debate but seem less important in the EU.
As the debate continues, particularly if the green position becomes strongly anti current
biofuels, we would expect Sweden and California to come out on the same side, the green
side, while the EU as a whole and the United States would come out on the farm-lobby
side.
Conclusion
Both Sweden and California are driven by internal green politics and enmeshed in
federal systems that have strong countervailing tendencies. The interaction of the car,
agriculture, and energy lobbies with states’ rights produce some very different results.
The EU does not restrict how green Sweden can be. Thus, they can adopt high energy
taxes, sulfur taxes, and so on and drive imported coal and oil largely out of their
production system. Although Sweden has to commit to the rules agreed upon within the
EU, Sweden has actually chosen to commit more than the EU obligations. According to
the burden sharing within the EU, stating a +4 percent target for Sweden, Sweden has
unilaterally decided on a –4 percent target. The means applied to achieve this target are
23

mainly increases in the CO2 tax, coupled with some subsidies toward renewable energy
sources, such as subsidies to wind power and “eco cars” (mainly, ethanol cars).
Considering the objective, the policy has been successful in the sense that fossil fuels
have been, for the most part, driven out of the system, transports excluded. The transport
sector is the only sector where CO2 emissions have not been reduced drastically during
the last 30 years; on the contrary, we can see an increase. To some extent, Sweden may
be more conflicted on cars, considering that they make two brands of large cars (Saab and
Volvo), both largely for export. California produces neither cars nor grain and is free to
pursue its green tendencies in both regimes. It is, however, not free to set standards as it
pleases within the Untied States and so must compromise with the countervailing lobbies
for energy and agriculture.
24

References
Berry, S.; Levinsohn, J.; and Pakes, A. “Automobile Prices in Market Equilibrium,”
Econometrica, 63 (4), July, 1995, pp. 841–890.
Brännlund, R. Skatteväxling, framgångsväg eller återvändsgränd. SNS förlag, Stockholm
(in Swedish), 2006.
Brännlund, R.; Ghalwash, T.; and Nordström, J. “Increased Energy Efficiency and the
Rebound Effect: Effects on Consumption and Emissions,” Energy Economics, 29,
2007, pp. 1–17.
Brännlund, R., and Nordström, J. “Carbon Tax Simulations Using a Household Demand
Model.” European Economic Review, 48, 2004, pp. 211–233.
BusinessWeek. “Bavaria Battles EU Auto Emissions Plan,” January 14,
2008
(http://www.businessweek.com/globalbiz/content/jan2008/gb200
80114_492087.htm?
chan=globalbiz_europe+index+page_autos).
CAL ARB. Staff Proposal On: The Maximum Feasible and Cost-effective Reduction of
Greenhouse Gas Emissions From Motor Vehicles, Sacramento, CA, June, 2004.
CEC. FINAL Adopted State Alternative Fuels Plan. Final Commission Report,
Publication No. CEC-600-2007-011-CMF. Posted December 24, 2007. Adopted
at Energy Commission Business Meeting, December 5, 2007, 88 p.
Dargay, J. Effects of Taxation on Energy Efficiency. Report to
Energieffektiviseringsutredningen, Bilaga 5, SOU 2008:28, 2008.
Energimyndigheten. Rapport ET2007:29, 2007.
25

Espey, M. “Explaining the Variation in Elasticity Estimates of Gasoline Demand in the
United States: A Meta-Analysis,” The Energy Journal, 17 (3), 1996, pp. 49–60.
EurActiv. “Commission Defends Biofuels in Face of Mounting Criticism,” January 21,
2008 (http://www.euractiv.com/en/energy/commission-defends-biofuels-face-
mounting-criticism/article-169728).
Miljöbalk, 1998, p. 808.
Ministry of the Environment. “Sweden’s Environmental Policy: A Brief Overview,”
Document No. M 2004.03, Stockholm, 2004 (http://www.sweden.gov.se/
environment).
Statens Institut för Kommunikationsforskning. Effekter av prisförändringar på drivmedel
1990–2005 samt skattade effekter 2010–2020. SIKA PM 2005:NC4, 2005.
Swedish Energy Agency. “Styrmedel I klimatpolitiken. Delrapport 2 I
Energimyndighetens och Naturvårdsverkets underlag till Kontrollstation 08,”
2008.
U.S. DOT. “Annual Automobile Vehicle Miles of Travel (VMT) Per Capita and Number
of Automobiles Per Capita 1997,” Table, Office of Highway Police Information,
February, 2003 (http://www.fhwa.dot.gov/ohim/onh00/bar4.htm).
26