california institute of technology nasa osma sas 2001advanced risk reduction tool - m.s. feather1...
TRANSCRIPT

NASA OSMA SAS 2001 Advanced Risk Reduction Tool - M.S. Feather 1
California Institute of Technology
ARRT Advanced Risk Reduction
ToolPresentation to the 1st Annual NASA
Office of Safety and Mission Assurance (OSMA)Software Assurance Symposium (SAS)
Dr. Martin S. FeatherARRT Center Initiative Lead*
Jet Propulsion LaboratoryCalifornia Institute of Technology
[email protected]://eis.jpl.nasa.gov/~mfeather
*Initiative began in 1999 with Dr. John Kelly as Lead

NASA OSMA SAS 2001 Advanced Risk Reduction Tool - M.S. Feather 2
California Institute of Technology
ARRT Heritage & Contributors
ARRT is inspired by, and based onJPLer Steve Cornford’s Defect Detection and Prevention (DDP)
and JPLer Tim Larson’s Risk Balancing Profiles (RBP).
John KellyBurt SigalJames EddingfieldSteve CornfordPhil DaggettJulia DunphyRoger Klemm
Jim Kiper (U. Miami, Ohio)William Evanco (Drexel)Steve Fickas (U. Oregon)Martha Wetherholt (NASA Glenn)Richard Hutchinson (Wofford, SC)
primary collaboratorsTim Menzies (U. British Columbia)Tim Kurtz (NASA Glenn)Hoh In (Texas A&M)
con
trib
uto
rs (
JPL)
con
trib
uto
rs
funding, management& guidanceNASA Code Q, NASA Goddard IV&V FacilitySiamak Yassini, Ken McGill, Marcus Fisher

NASA OSMA SAS 2001 Advanced Risk Reduction Tool - M.S. Feather 3
California Institute of Technology
The Universe of ARRT Customers
optimists
pragmatists
pessimists
“Hello, I’m from Software Quality
Assurance / IV&Vand I’m here to
help you”
“Got Risk?”
“Too much…”“Too little…”“Don’t know…”
“Plan the best useof Software Quality Assurance / IV&V”
“How?”
NASA OSMA SAS 2001 Advanced Risk Reduction Tool - M.S. Feather 4
California Institute of Technology
TheOptimists
“Hello, I’m from Software Quality Assurance / IV&V and I’m here to help you”
Many attendees of this symposium are likely to already believe in the net value of assurance
activities, but optimism alone is not sufficiently contagious!
What is needed is the means to quantitatively assess the cost/benefit of assurance activities applied to specific projects. This will:
• be more convincing
• determine best use of limited resources
• identify alternatives (e.g., requirements to discard)

NASA OSMA SAS 2001 Advanced Risk Reduction Tool - M.S. Feather 5
California Institute of Technology
The Optimists
ARRT performs quantitative cost/benefit calculation for suite of assurance activities applied to a specific project
Cost/benefit data & reasoning has been applied to:
Individual activities, e.g., Regression testing [Graves et al, 1998].
Pairwise comparisons, e.g., “Peer reviews are more effective than function testing for faults of omission and incorrect specification” [Basili & Boehm, 2000].
Lifecycle process improvement, e.g., Quality, productivity and estimation gains from CMM-like process improvement [McGarry et al, 1998].
Gap!

NASA OSMA SAS 2001 Advanced Risk Reduction Tool - M.S. Feather 6
California Institute of Technology
ARRT’s Quantitative Cost/Benefit Model
Risk mitigations subdivided into
Preventions – prevent problems from appearing in the first placee.g., training programmers fewer coding errorscost = performing preventionbenefit = reduction of risk likelihood
Detections – detect problems so that they can be correctede.g., unit testing detects internal coding errorscost = performing detection +
performing the repair (cost depends on when!)benefit = reduction of risk likelihood
Alleviations – applied to decrease the severity of problemse.g., robust coding tolerant of out-of-bound input valuescost = performing alleviationbenefit = reduction of risk severity

NASA OSMA SAS 2001 Advanced Risk Reduction Tool - M.S. Feather 7
California Institute of Technology
Cost/Benefit – Simple Scenario
System tests, observed by spacecraft engineers($$)
Mission loss due to misinterpretation of requirements
Reimplement misinterpreted requirements ($$$)
Misinterpret ambiguous requirements
Poorly written requirements
Programming errors
Correct programming errors ($$)
Mission loss due to programming errors
Imp
lem
enta
tio
nphase assurance
choices
mistakeshappen
Use ARM to do Requirements Analysis ($)Correct ambiguous requirements ($)
Test
phase
Opera
tions
phase
Requir
em
en
tsphase Low costs to
analyze with ARM & correct
flaws now
RIS
KS
High cost to reimplement requirements this late in
development
NASA OSMA SAS 2001 Advanced Risk Reduction Tool - M.S. Feather 8
California Institute of Technology
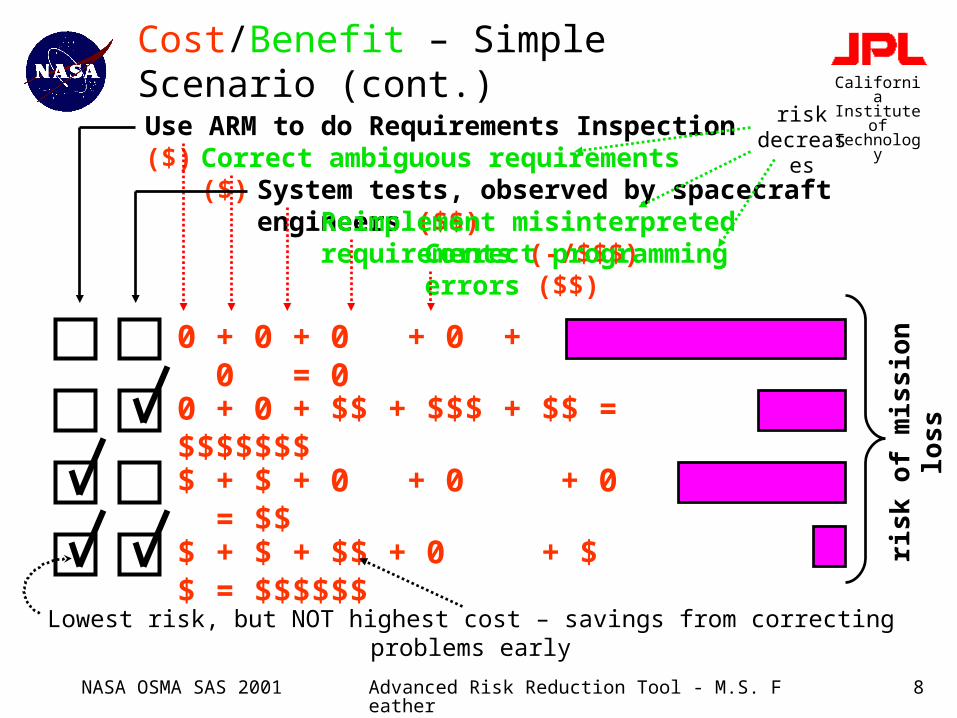
Cost/Benefit – Simple Scenario (cont.)Use ARM to do Requirements Inspection ($)
System tests, observed by spacecraft engineers ($$)
0 + 0 + $$ + $$$ + $$ = $$$$$$$
Correct ambiguous requirements ($)
Reimplement misinterpreted requirements (-/$$$)Correct programming errors ($$)
$ + $ + 0 + 0 + 0 = $$
$ + $ + $$ + 0 + $$ = $$$$$$
0 + 0 + 0 + 0 + 0 = 0
risk o
f m
issio
n loss
Lowest risk, but NOT highest cost – savings from correcting problems early
risk decrease
s
NASA OSMA SAS 2001 Advanced Risk Reduction Tool - M.S. Feather 9
California Institute of Technology
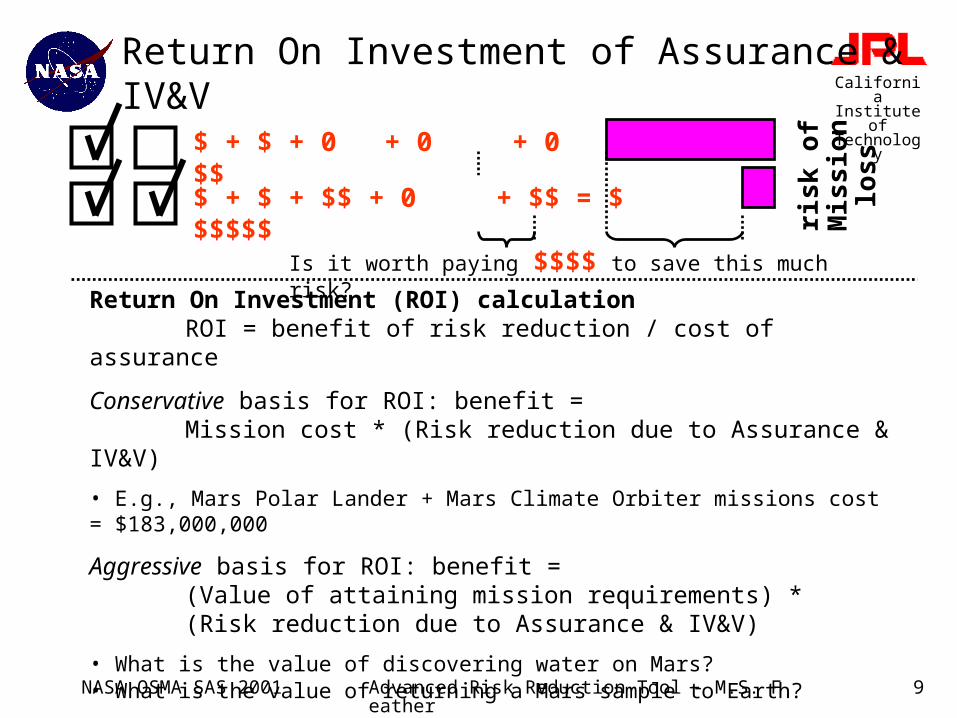
Return On Investment of Assurance & IV&V
Return On Investment (ROI) calculationROI = benefit of risk reduction / cost of assurance
Conservative basis for ROI: benefit = Mission cost * (Risk reduction due to Assurance & IV&V)
• E.g., Mars Polar Lander + Mars Climate Orbiter missions cost = $183,000,000
Aggressive basis for ROI: benefit = (Value of attaining mission requirements) *(Risk reduction due to Assurance & IV&V)
• What is the value of discovering water on Mars? • What is the value of returning a Mars sample to Earth?
$ + $ + $$ + 0 + $$ = $$$$$$
risk o
f M
issio
nlo
ss$ + $ + 0 + 0 + 0 = $$
Is it worth paying $$$$ to save this much risk?
NASA OSMA SAS 2001 Advanced Risk Reduction Tool - M.S. Feather 10
California Institute of Technology
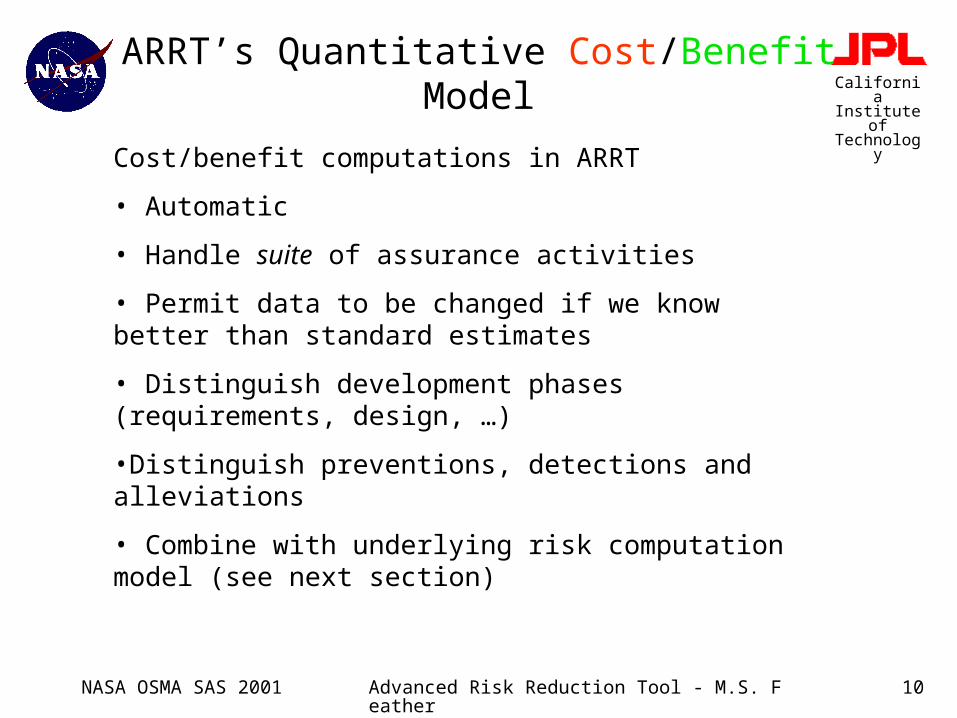
ARRT’s Quantitative Cost/Benefit Model
Cost/benefit computations in ARRT
• Automatic
• Handle suite of assurance activities
• Permit data to be changed if we know better than standard estimates
• Distinguish development phases (requirements, design, …)
•Distinguish preventions, detections and alleviations
• Combine with underlying risk computation model (see next section)
NASA OSMA SAS 2001 Advanced Risk Reduction Tool - M.S. Feather 11
California Institute of Technology
The Pessimists
GOTRISK?TOO MUCH – use ARRT to plan
how to reduce risk in a cost-effective manner.
TOO LITTLE – use ARRT to plan how to accept more risk in exchange for reduced cost and schedule, more functionality, etc.
JUST RIGHT – use ARRT to maintain a desired risk profile through the lifetime of the project.
DON’T KNOW – use ARRT to assess risk status.
“Risk as a Resource” – Dr. Michael Greenfield
[Greenfield, 1998]
NASA OSMA SAS 2001 Advanced Risk Reduction Tool - M.S. Feather 12
California Institute of Technology
ARRT’s treatment of Risk– DDP & RBP concepts, specifically populated with software data
DDP is a process [Cornford et al, 2001]supported by a custom tool [Feather et al, 2000a] for quantitative risk management.
RBP is a qualitative risk management tool populated with risk and risk mitigation data.
DDP & RBP merged [Feather et al, 2000b] into DDP
ARRT uses this merged combination of DDP & RBP
ARRT is inspired by, and based onJPLer Steve Cornford’s Defect Detection and Prevention (DDP)
and JPLer Tim Larson’s Risk Balancing Profiles (RBP).In particular, ARRT inherits DDP’s Risk Model.
NASA OSMA SAS 2001 Advanced Risk Reduction Tool - M.S. Feather 13
California Institute of Technology
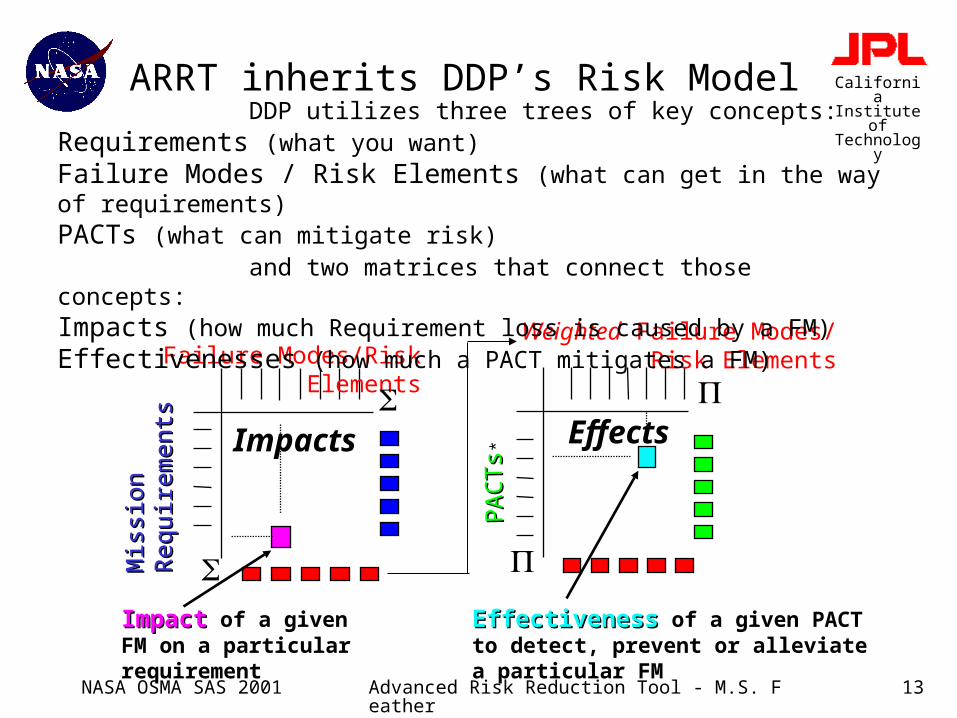
ARRT inherits DDP’s Risk Model
ImpactImpact of a given FM on a particular requirement
Impacts
Failure Modes/Risk Elements
Mis
sion
Mis
sion
Requir
em
en
tsR
equir
em
en
ts
EffectivenessEffectiveness of a given PACT to detect, prevent or alleviate a particular FM
Effects
Weighted Failure Modes/Risk Elements
PA
CTs
PA
CTs*
DDP utilizes three trees of key concepts:Requirements (what you want)Failure Modes / Risk Elements (what can get in the way of requirements)PACTs (what can mitigate risk)
and two matrices that connect those concepts:Impacts (how much Requirement loss is caused by a FM)Effectivenesses (how much a PACT mitigates a FM)
NASA OSMA SAS 2001 Advanced Risk Reduction Tool - M.S. Feather 14
California Institute of Technology
ARRT/DDP Computations & Visualizations
Information is derived from user-provided data via built-in computations, e.g.,
• FM’s cumulative impact = FM.Likelihood * ( (R Requirements) R.Weight * Impact(R, FM))
Information presented via cogent visualizations• Bar charts• Risk Region chart• Stem-and-leaf plots• Detailed view of properties of individual
element

NASA OSMA SAS 2001 Advanced Risk Reduction Tool - M.S. Feather 15
California Institute of Technology
ARRT/DDP Trees
Taxonomies of Software Requirements / Risks / Risk Mitigations
ContractedExpanded
SelectedDeselected
Number:Title
Autonumbering: linear 1,2,… or tree 1, 1.1, 1.2, 1.2.1, …
NASA OSMA SAS 2001 Advanced Risk Reduction Tool - M.S. Feather 16
California Institute of Technology
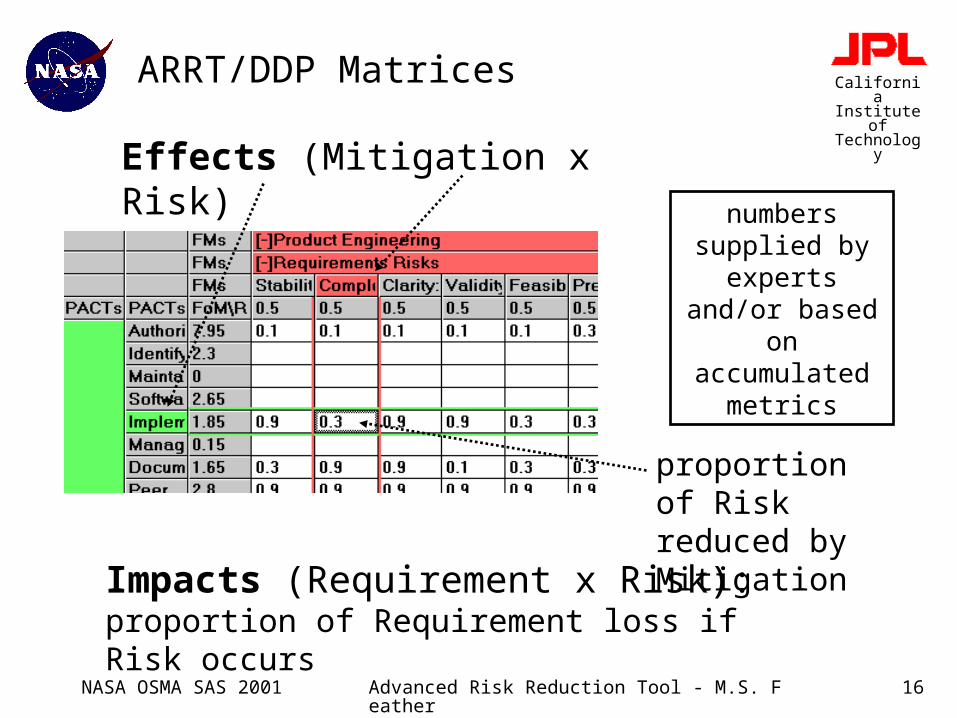
Effects (Mitigation x Risk)
ARRT/DDP Matrices
Impacts (Requirement x Risk):proportion of Requirement loss if Risk occurs
proportion of Risk reduced by Mitigation
numbers supplied by
experts and/or based on
accumulated metrics

NASA OSMA SAS 2001 Advanced Risk Reduction Tool - M.S. Feather 17
California Institute of Technology
ARRT/DDP Visualizations - Bar Charts
Unsorted – order matches leaf elements in Risk tree
Sorted – in decreasing order of remaining riskRequirements bar chart – how much each is impacted
Mitigations bar chart – how much impact each is saving
Green: of this Risk’s total Impact on Requirements, that saved by Mitigations
Red: of this Risks’s total Impact on Requirements, that remaining despite Mitigations
Risks bar chart
Item number in tree
NASA OSMA SAS 2001 Advanced Risk Reduction Tool - M.S. Feather 18
California Institute of Technology
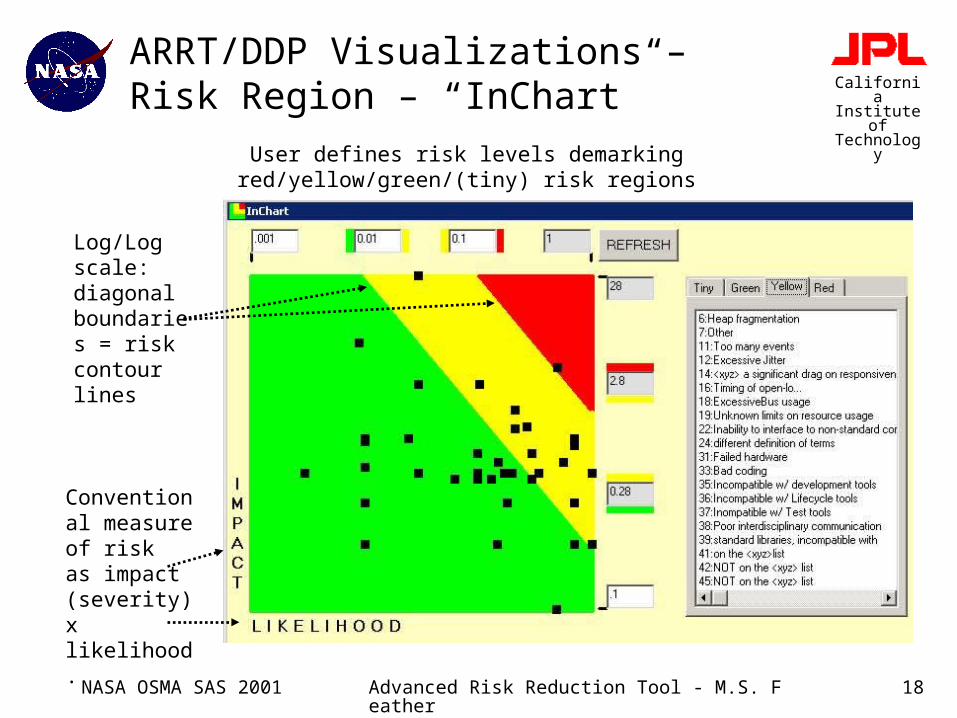
ARRT/DDP Visualizations – Risk Region – “InChart”User defines risk levels demarking red/yellow/green/(tiny) risk
regions
Log/Log scale: diagonal boundaries = risk contour lines
Conventional measure of riskas impact (severity) x likelihood.
NASA OSMA SAS 2001 Advanced Risk Reduction Tool - M.S. Feather 19
California Institute of Technology
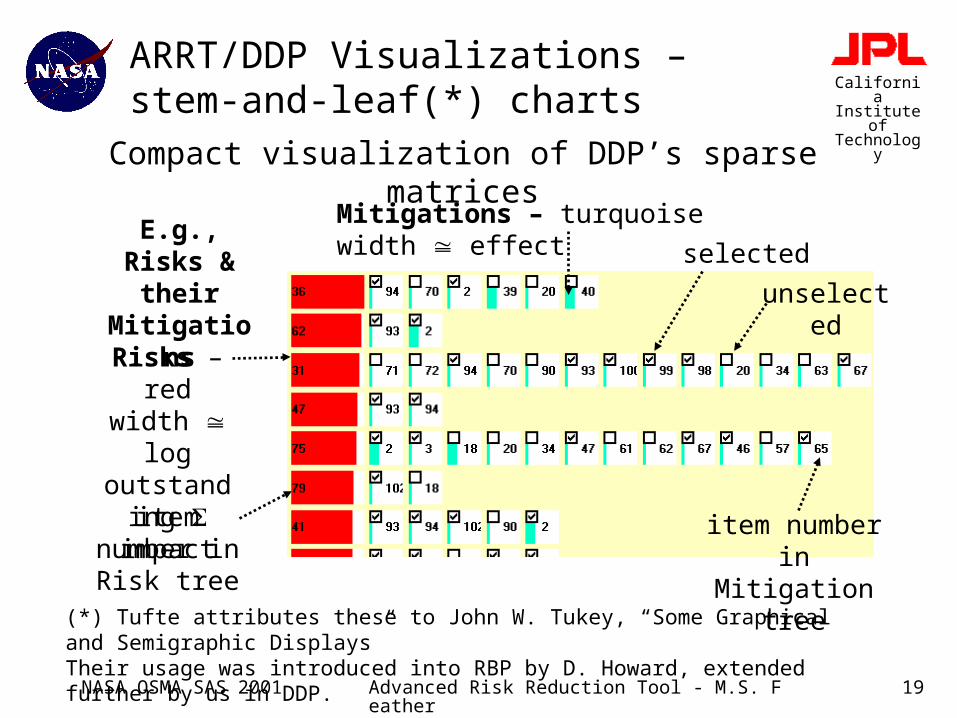
ARRT/DDP Visualizations – stem-and-leaf(*) charts
(*) Tufte attributes these to John W. Tukey, “Some Graphical and Semigraphic Displays”Their usage was introduced into RBP by D. Howard, extended further by us in DDP.
Compact visualization of DDP’s sparse matrices
Risks – red width log outstanding impact
E.g., Risks &
their Mitigatio
ns
Mitigations – turquoise width effect selected
unselected
item number in Risk tree
item number in Mitigation tree
NASA OSMA SAS 2001 Advanced Risk Reduction Tool - M.S. Feather 20
California Institute of Technology
The Pragmatists
Objective: Plan the best use ofSoftware Quality Assurance & IV&V
“Has it been used?”
“Where does the data come from?”
“How does it combine with software estimation & planning?”
“What about…?”
NASA OSMA SAS 2001 Advanced Risk Reduction Tool - M.S. Feather 21
California Institute of Technology
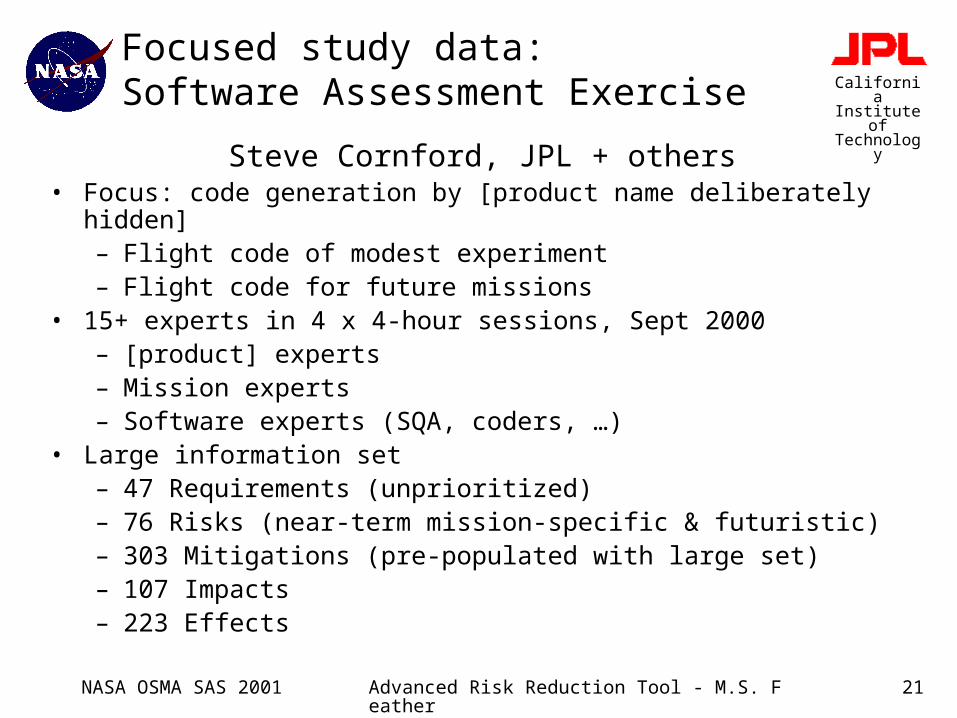
Focused study data: Software Assessment Exercise
Steve Cornford, JPL + others• Focus: code generation by [product name deliberately hidden]
– Flight code of modest experiment– Flight code for future missions
• 15+ experts in 4 x 4-hour sessions, Sept 2000– [product] experts– Mission experts– Software experts (SQA, coders, …)
• Large information set– 47 Requirements (unprioritized)– 76 Risks (near-term mission-specific & futuristic)– 303 Mitigations (pre-populated with large set)– 107 Impacts– 223 Effects
NASA OSMA SAS 2001 Advanced Risk Reduction Tool - M.S. Feather 22
California Institute of Technology
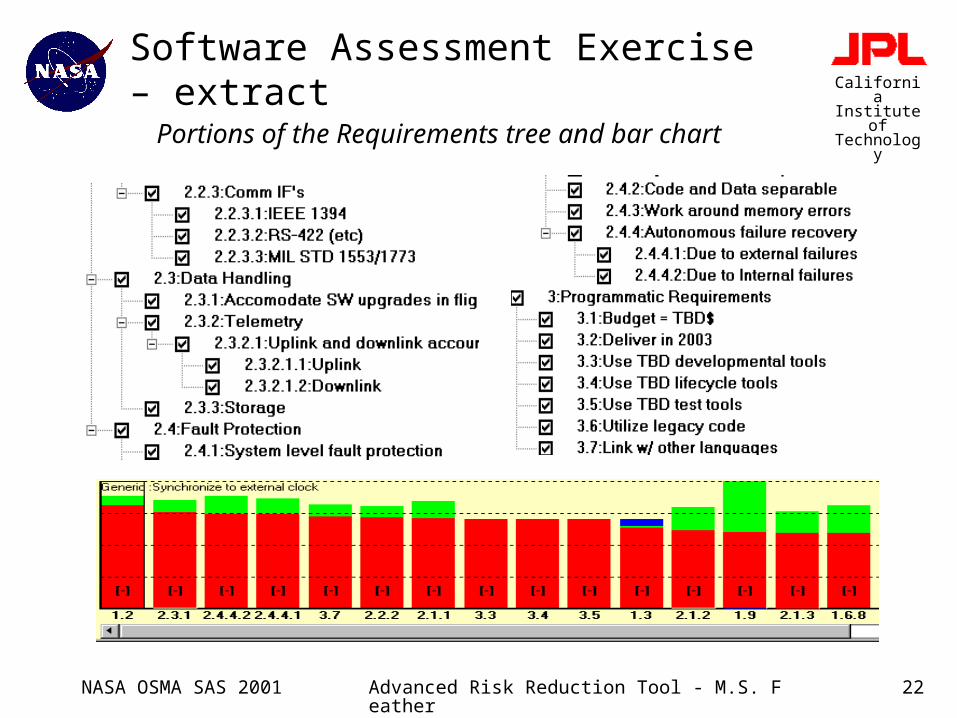
Software Assessment Exercise – extract
Portions of the Requirements tree and bar chart
NASA OSMA SAS 2001 Advanced Risk Reduction Tool - M.S. Feather 23
California Institute of Technology
Software Engineering Community Data
• Risks: Software Risk Taxonomy (SEI)• Mitigations: two datasets:
1. JPL’s Risk Balance Profile of SQA actions2. Assurance activities from Ask Pete (NASA Glenn
tool)
• Effects: cross-linkings of the above (Jim Kiper)1. Expert’s best estimates of yes/no (Prof. J. Kiper)2. Experts’ 1000+ best estimates of quantified
effectiveness (Prof. J. Kiper & J. Eddingfield)
Note: Requirements are PROJECT SPECIFIC

NASA OSMA SAS 2001 Advanced Risk Reduction Tool - M.S. Feather 24
California Institute of Technology
Software Estimation & Planning data: ARRT – Ask Pete collaboration
Tim Kurtz, [email protected]
SAIC/NASA Glenn Research Center http://tkurtz.grc.nasa.gov/petePrincipal Investigator Martha Wetherholt
see companion presentation in this symposium
Ask Pete runs to gather project characteristics, make first cut at suggested selection of risk mitigations.Mitigation selection passed to ARRT
ARRT runs to allow user to assess risk, provide costs, customize to project (add/remove risks, refine effect values, etc.), tune selection accordingly.Revised mitigation selection returned to Ask Pete
Ask Pete runs to generate final reports
NASA OSMA SAS 2001 Advanced Risk Reduction Tool - M.S. Feather 25
California Institute of Technology
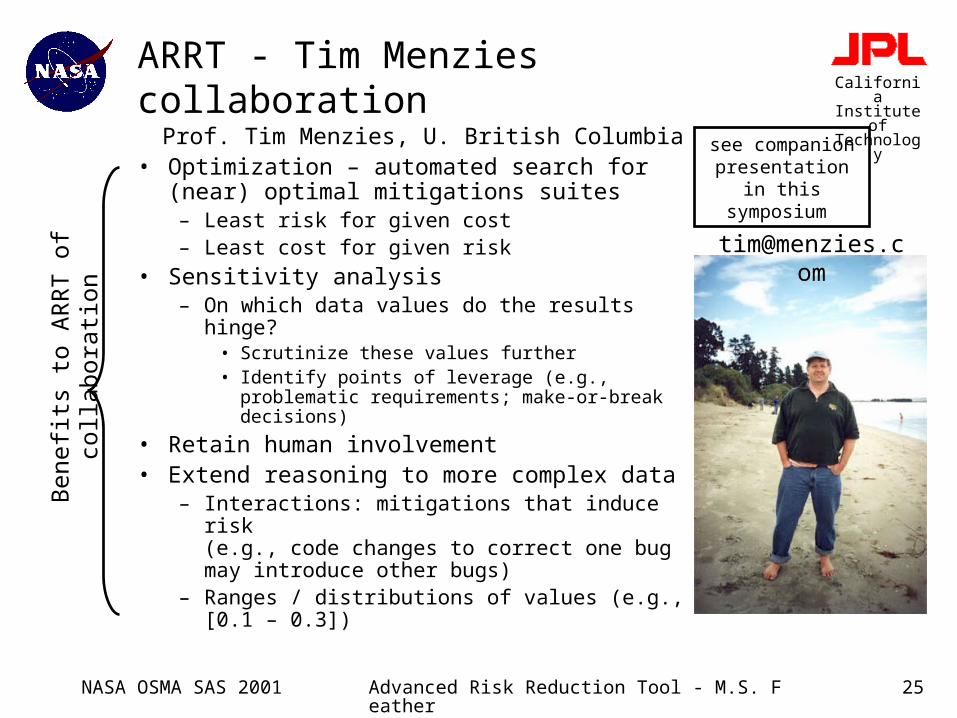
ARRT - Tim Menzies collaboration
Prof. Tim Menzies, U. British Columbia• Optimization – automated search for (near)
optimal mitigations suites – Least risk for given cost– Least cost for given risk
• Sensitivity analysis– On which data values do the results hinge?
• Scrutinize these values further• Identify points of leverage (e.g., problematic
requirements; make-or-break decisions)
• Retain human involvement• Extend reasoning to more complex
data– Interactions: mitigations that induce risk
(e.g., code changes to correct one bug may introduce other bugs)
– Ranges / distributions of values (e.g., [0.1 – 0.3])
Benefits
to A
RR
T o
f co
llabora
tion
see companion presentation in this symposium

NASA OSMA SAS 2001 Advanced Risk Reduction Tool - M.S. Feather 26
California Institute of Technology
ARRT – Hoh In et al collaboration: IEESIM
Integrated views (data schema) from local tool views
Exchangeable format based on XML
Extendable interfaces for additional tools
Shared Information Mediator
INTERMEDIARYIEESIM
DDP
Other Tools (e.g., VCR)
Shared Database
IEESIM Server
IEESIM Client
IEESIM Client
Web Browser
IEESIM Client
ASK PETE
http://www.cs.tamu.edu/faculty/hohin/
Repository ofproject data
Insert & classify,Search,Retrieve,Delete
Accessibility via the web
Prof. Hoh In, Texas A&M University
NASA OSMA SAS 2001 Advanced Risk Reduction Tool - M.S. Feather 27
California Institute of Technology
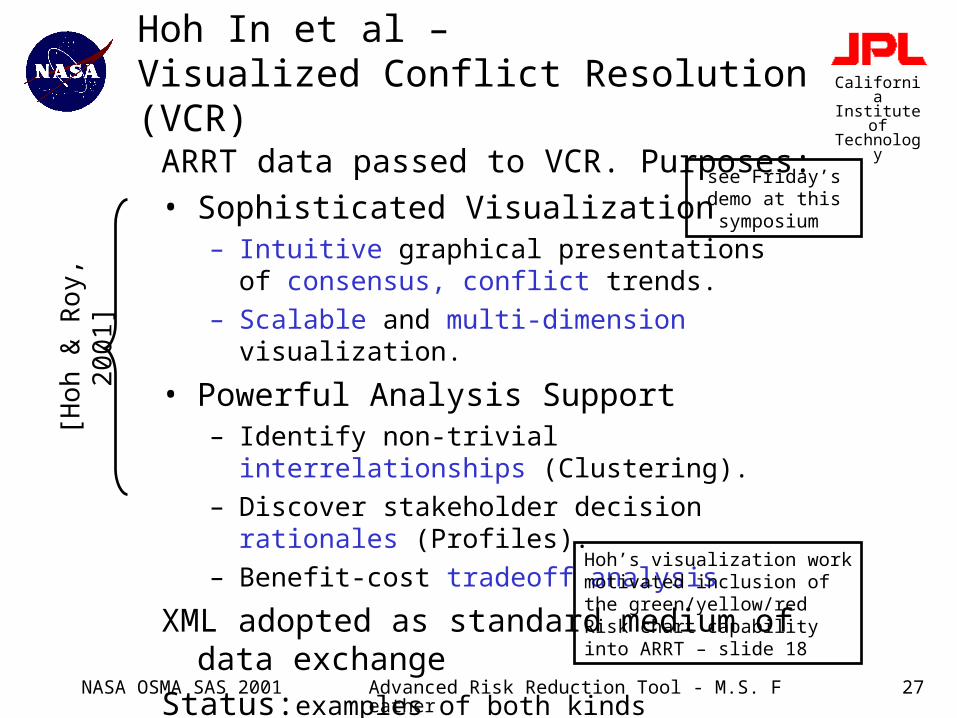
ARRT data passed to VCR. Purposes:
• Sophisticated Visualization– Intuitive graphical presentations
of consensus, conflict trends.
– Scalable and multi-dimension visualization.
• Powerful Analysis Support– Identify non-trivial interrelationships (Clustering).
– Discover stakeholder decision rationales (Profiles).
– Benefit-cost tradeoff analysis
XML adopted as standard medium of data exchange
Status:examples of both kindsof data transferred & visualized
Hoh In et al –Visualized Conflict Resolution (VCR)
see Friday’s demo at this symposium
Hoh’s visualization work motivated inclusion of the green/yellow/red Risk chart capability into ARRT – slide 18
[Hoh
& R
oy,
20
01
]
NASA OSMA SAS 2001 Advanced Risk Reduction Tool - M.S. Feather 28
California Institute of Technology
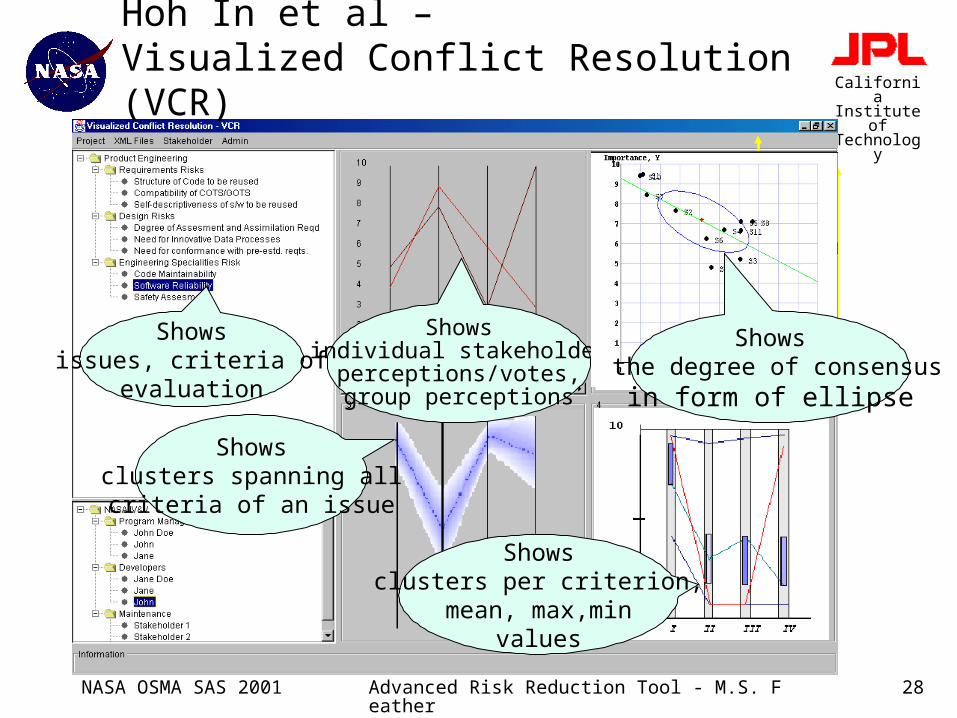
Showsclusters per criterion,
mean, max,minvalues
Shows issues, criteria of
evaluation
Showsclusters spanning allcriteria of an issue
Showsindividual stakeholder
perceptions/votes,group perceptions
Shows the degree of consensus
in form of ellipse
Hoh In et al – Visualized Conflict Resolution (VCR)
NASA OSMA SAS 2001 Advanced Risk Reduction Tool - M.S. Feather 29
California Institute of Technology
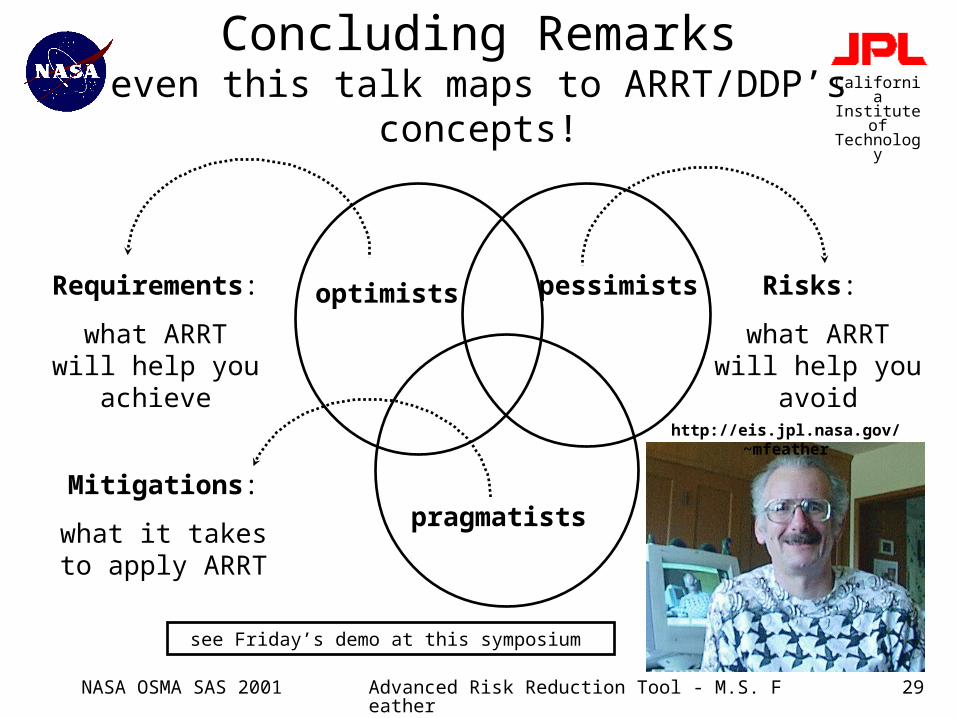
Concluding Remarkseven this talk maps to ARRT/DDP’s
concepts!
optimists
pragmatists
pessimistsRequirements:
what ARRT will help you achieve
Mitigations:
what it takes to apply ARRT
Risks:
what ARRT will help you avoid
see Friday’s demo at this symposium
http://eis.jpl.nasa.gov/~mfeather

NASA OSMA SAS 2001 Advanced Risk Reduction Tool - M.S. Feather 30
California Institute of Technology
References [Basili & Boehm, 2000] V. Basili & B.Boehm "CeBaSE: The
Center for Empirically based Software Engineering" NASA Goddard 25th Annual Software Engineering Workshop, 2000.
[Cornford et al, 2001] S.L. Cornford, M.S. Feather & K.A. Hicks. “DDP – A tool for life-cycle risk management”, IEEE Aerospace Conference, Big Sky, Montana, Mar 2001, pp. 441-451.
[Feather et al, 2000a] M.S. Feather, S.L. Cornford & M. Gibbel. “Scalable Mechanisms for Requirements Interaction Management”, 4th IEEE International Conference on Requirements Engineering, Schaumburg, Illinois: 119-129, June 2000.
[Feather et al, 2000b] M.S. Feather, S.L. Cornford & T.W. Larson. “Combining the Best Attributes of Qualitative and Quantitative Risk Management Tool Support”, 15th IEEE International Conference on Automated Software Engineering, Grenoble, France: 309-312, September 2000.
NASA OSMA SAS 2001 Advanced Risk Reduction Tool - M.S. Feather 31
California Institute of Technology
References[Graves et al, 1998] T. Graves, M. Harrold, J. Kim, A. Porter and
G. Rothermel. “An Empirical Study of Regression Test Selection Techniques”. 20th Int. Conference on Software Engineering, 1998, pp. 267-273.
[Greenfield, 1998] M.A. Greenfield “Risk Management ‘Risk As A Resource’ ” http://www.hq.nasa.gov/office/codeq/risk/
[Hoh & Roy, 2001] H. In & S. Roy “Visualization Issues for Software Requirements Negotiation” 25th Annual International Computer Software and Applications Conference, Chicago, IL, Oct. 2001.
[McGarry et al, 1998] F. McGarry, S. Burke & B. Decker. Measuring the impacts individual process maturity attributes have on software products., 5th International Software Metrics Symposium, 1998, pp. 52-60