california drought update - mike anderson, california state climatologist, california department of...
TRANSCRIPT
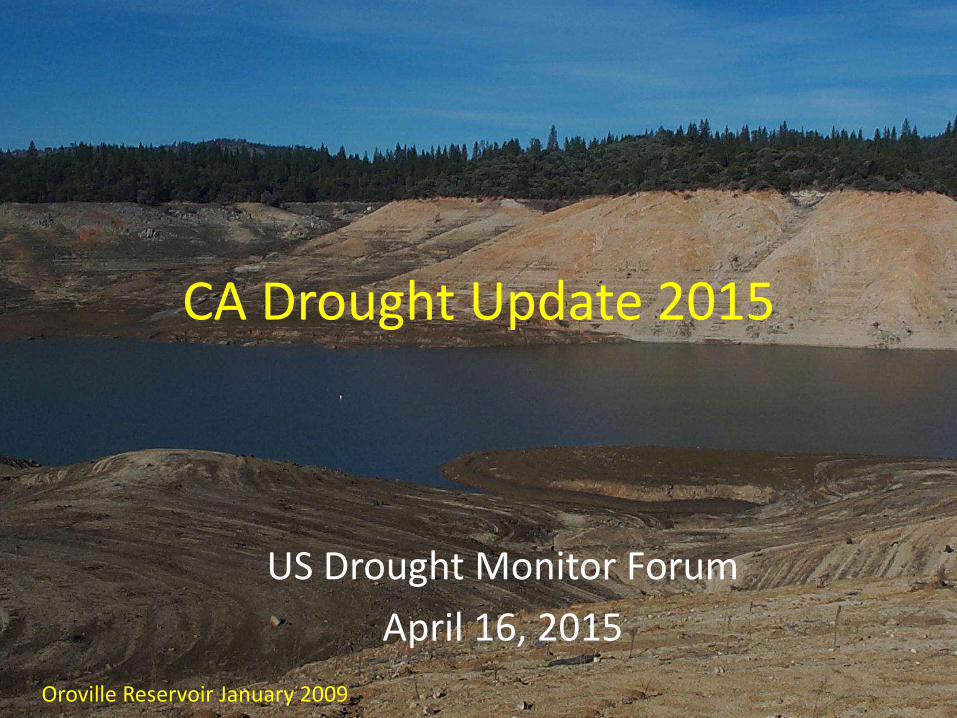
CA Drought Update 2015
US Drought Monitor Forum
April 16, 2015
Oroville Reservoir January 2009
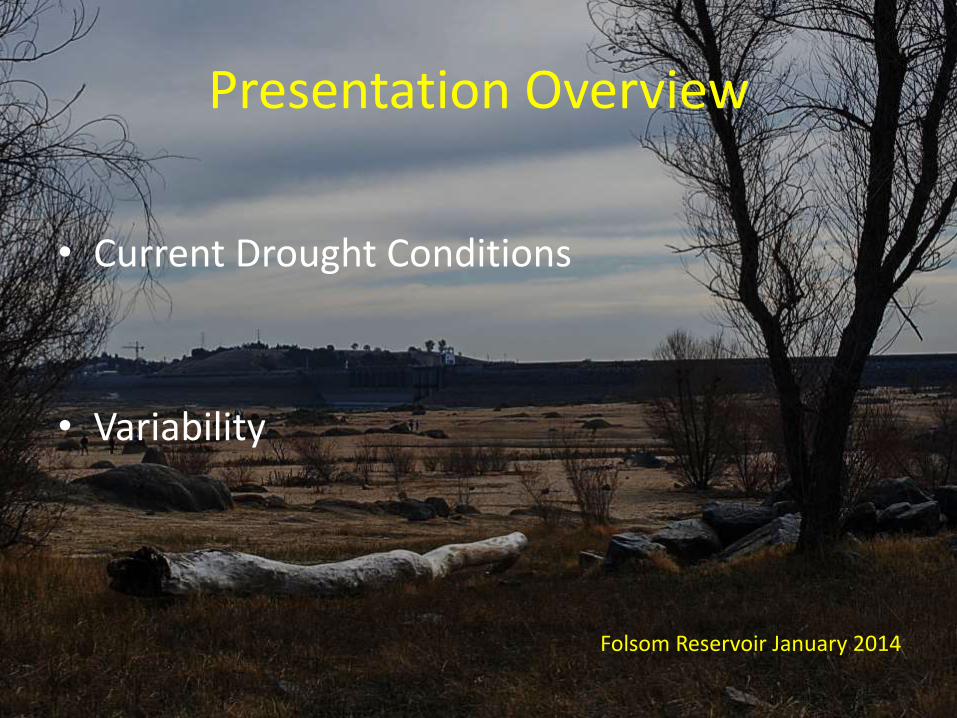
Presentation Overview
• Current Drought Conditions
• Variability
Folsom Reservoir January 2014
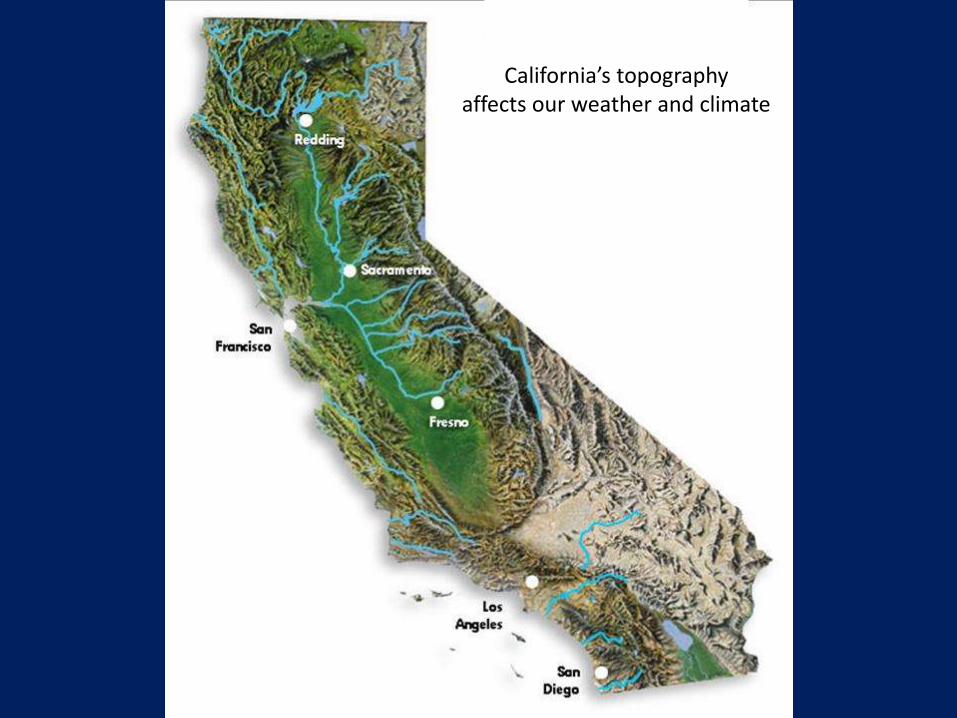
California’s topographyaffects our weather and climate
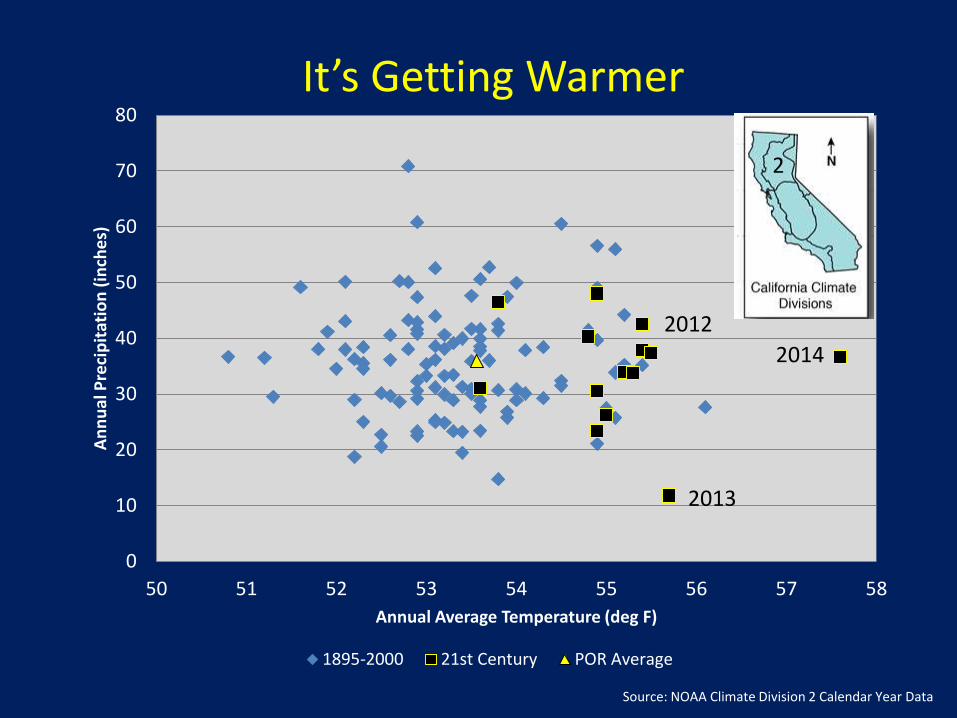
0
10
20
30
40
50
60
70
80
50 51 52 53 54 55 56 57 58
An
nu
al P
reci
pit
atio
n (
inch
es)
Annual Average Temperature (deg F)
1895-2000 21st Century POR Average
2
Source: NOAA Climate Division 2 Calendar Year Data
2014
It’s Getting Warmer
2013
2012
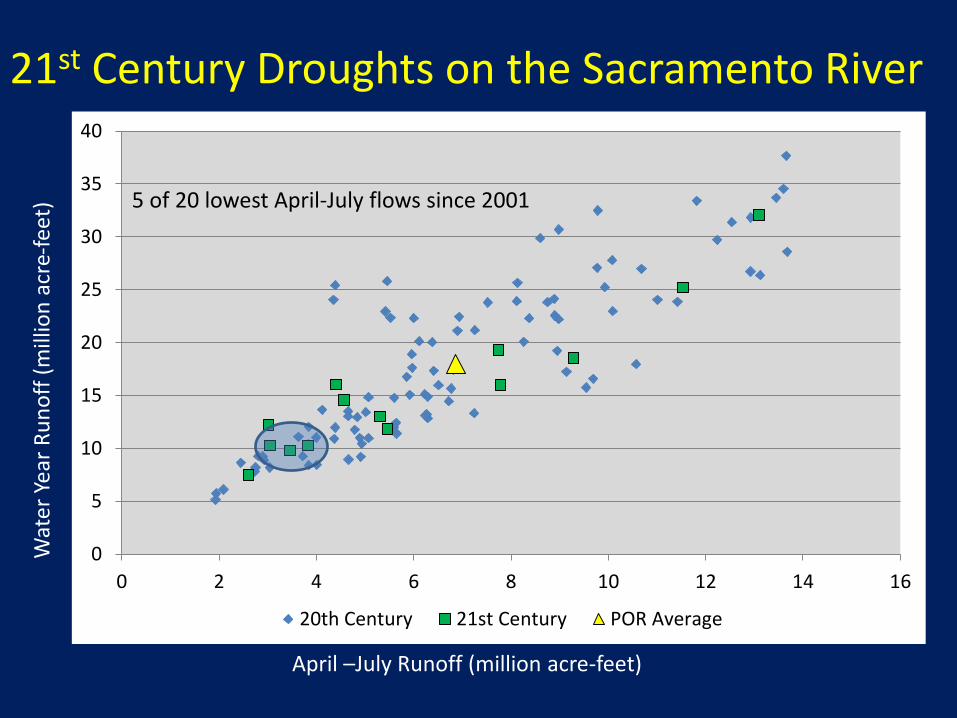
April –July Runoff (million acre-feet)
Wat
er Y
ear
Ru
no
ff (
mill
ion
acr
e-fe
et)
21st Century Droughts on the Sacramento River
1976
2
0
5
10
15
20
25
30
35
40
0 2 4 6 8 10 12 14 16
20th Century 21st Century POR Average
5 of 20 lowest April-July flows since 2001
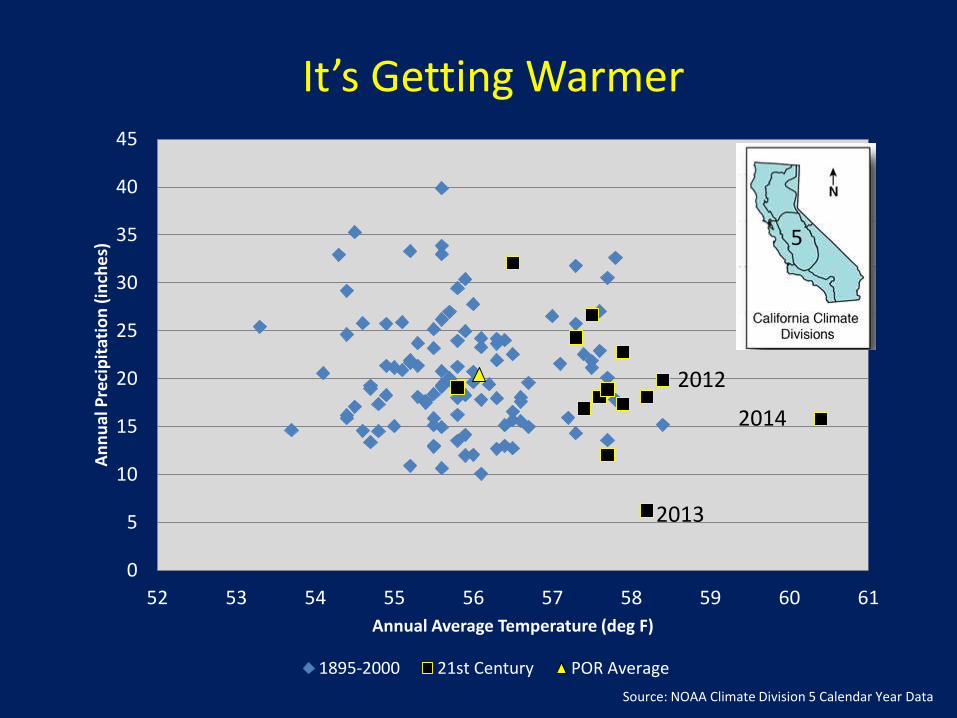
0
5
10
15
20
25
30
35
40
45
52 53 54 55 56 57 58 59 60 61
An
nu
al P
reci
pit
atio
n (
inch
es)
Annual Average Temperature (deg F)
1895-2000 21st Century POR Average
2
Source: NOAA Climate Division 5 Calendar Year Data
2014
2013
5
It’s Getting Warmer
2012
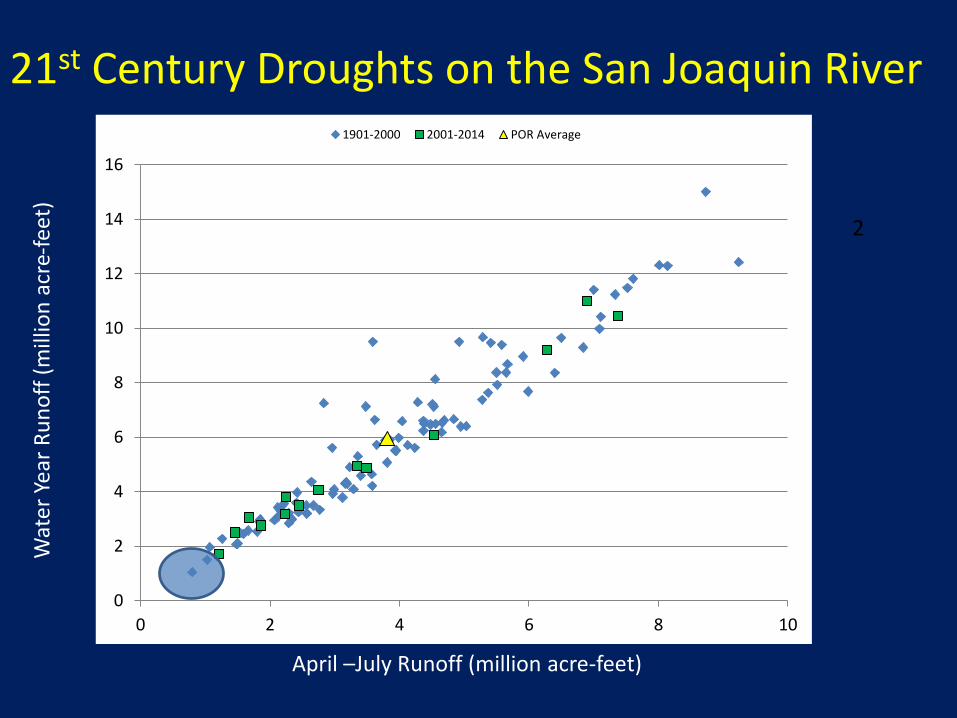
April –July Runoff (million acre-feet)
Wat
er Y
ear
Ru
no
ff (
mill
ion
acr
e-fe
et)
21st Century Droughts on the San Joaquin River
1976
25 of 20 lowest April-July flows since 2001
0
2
4
6
8
10
12
14
16
0 2 4 6 8 10
1901-2000 2001-2014 POR Average

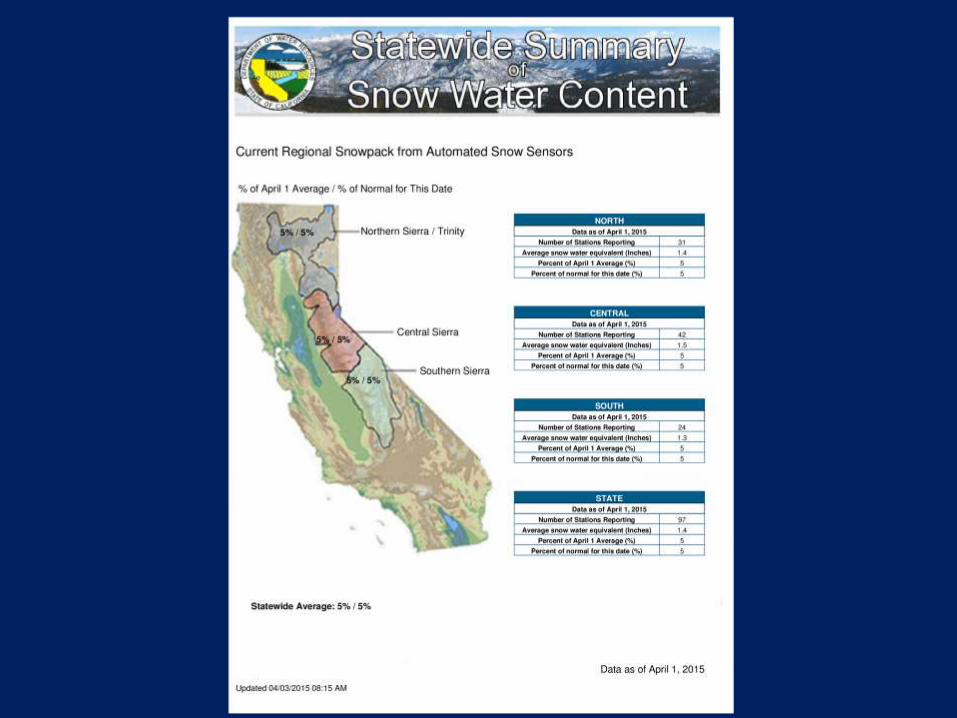
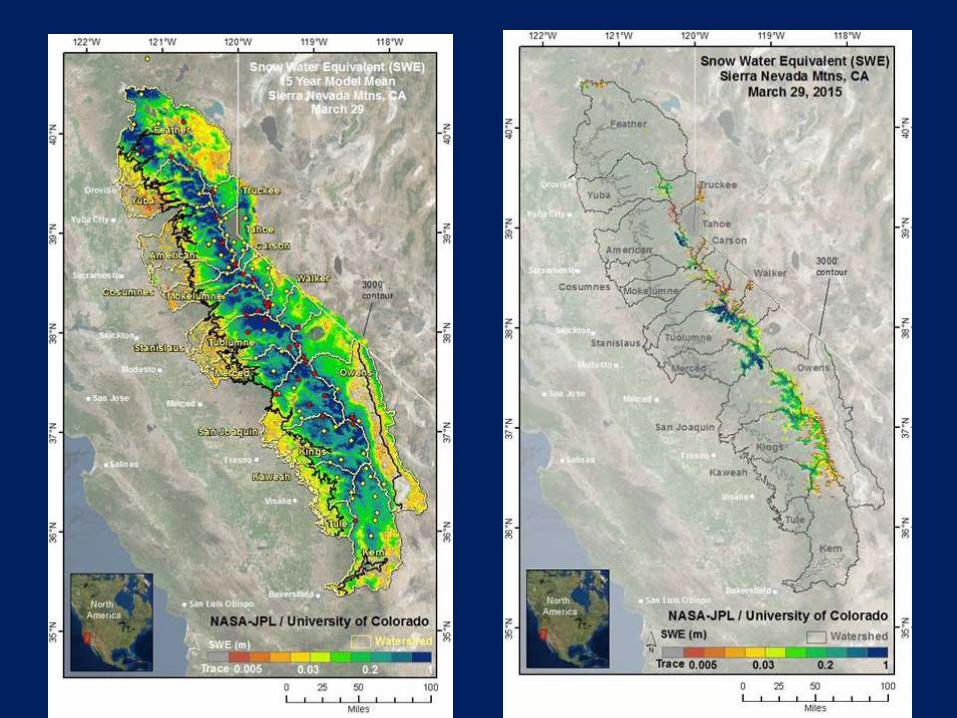
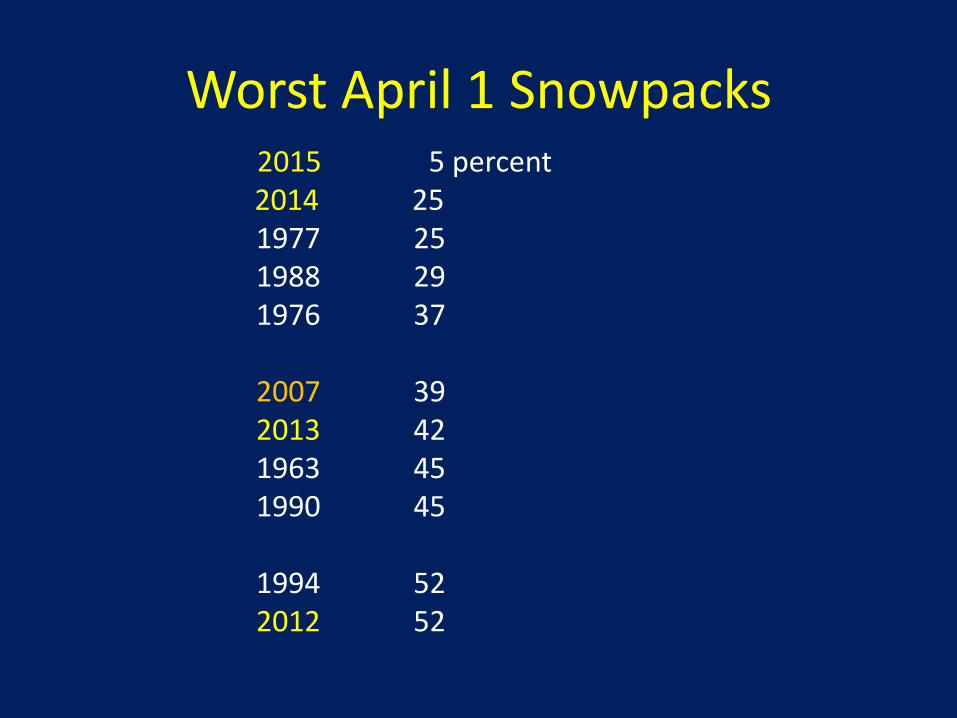
Worst April 1 Snowpacks2015 5 percent2014 25 1977 251988 291976 37
2007 392013 421963 451990 45
1994 522012 52
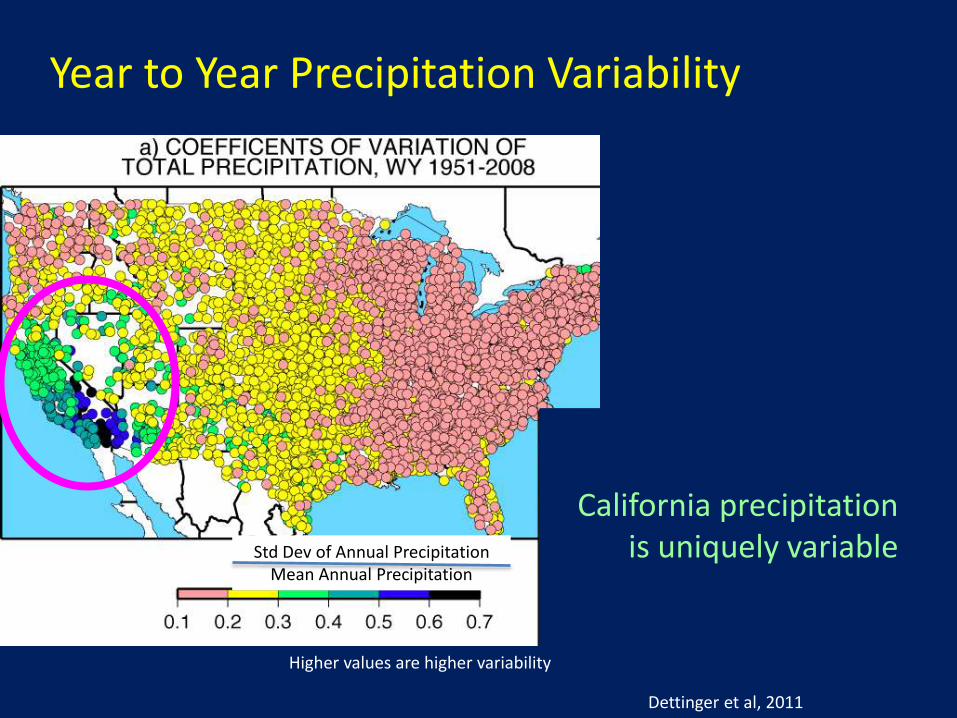
Year to Year Precipitation Variability
Dettinger et al, 2011
Std Dev of Annual PrecipitationMean Annual Precipitation
California precipitation is uniquely variable
Higher values are higher variability
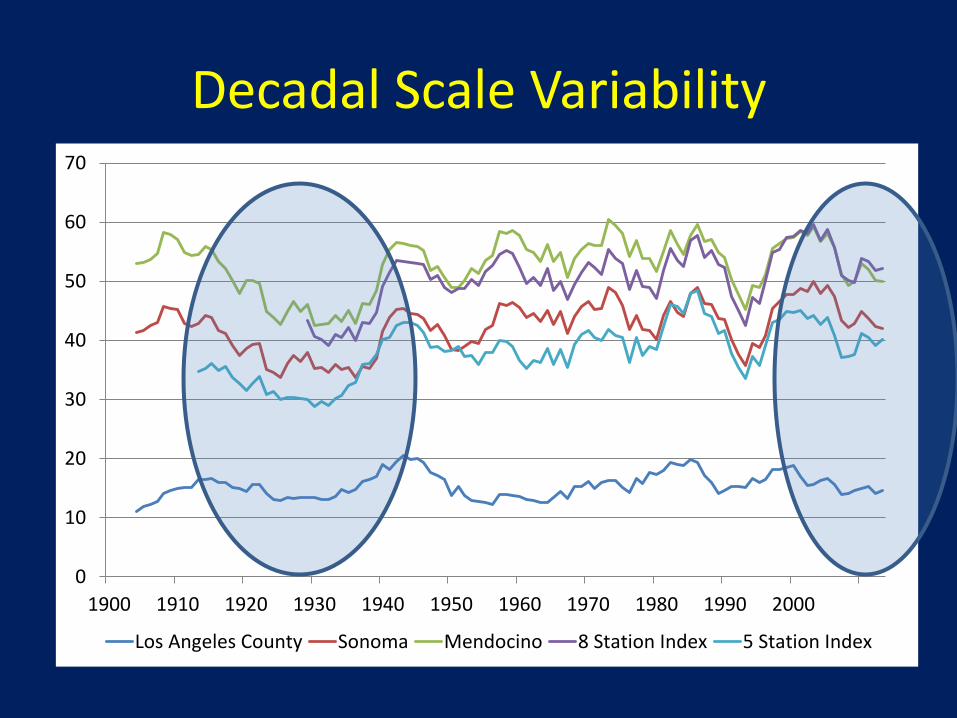
0
10
20
30
40
50
60
70
1900 1910 1920 1930 1940 1950 1960 1970 1980 1990 2000
Los Angeles County Sonoma Mendocino 8 Station Index 5 Station Index
Decadal Scale Variability
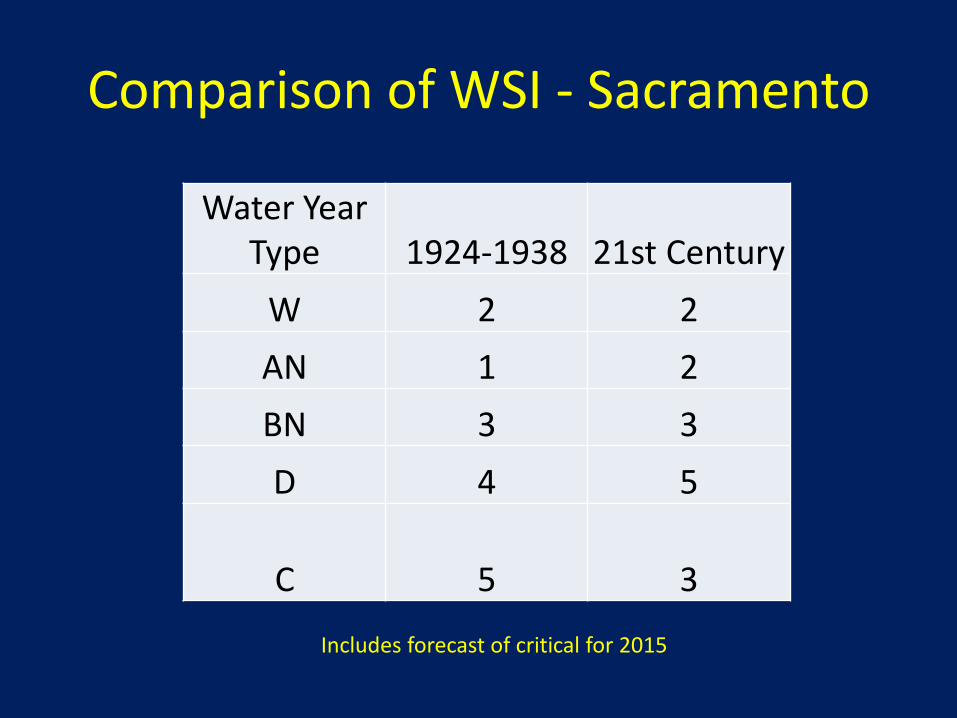
Comparison of WSI - Sacramento
Water Year Type 1924-1938 21st Century
W 2 2
AN 1 2
BN 3 3
D 4 5
C 5 3
Includes forecast of critical for 2015

Comparison of Runoff – Sacramento
21st Century Oct-Mar Apr-Jul WY
Max 18.06 13.09 32.09
Average 8.66 6.08 15.48
Min 4.29 2.6 7.47
1923-1940 Oct-Mar Apr-Jul WY
Max 17.96 12.93 31.83
Average 7.63 5.87 14.13
Min 3.27 1.94 5.74
Units are Million Acre-Feet

* From tree rings
18.6
8.7*
12.011.2
9.8
13.112.4
6.7
10.011.2
10.4
0
5
10
15
20
WYAverage
1578-1580 1918-1920 1924-1926 1929-1934 1947-1950 1959-1961 1976-1977 1987-1992 2007-2009 2012-2014
SACRAMENTO FOUR RIVER RUNOFF
COMPARISON WITH PREVIOUS DROUGHTS
Average Annual Drought Period Runoff in Million Acre-Feet
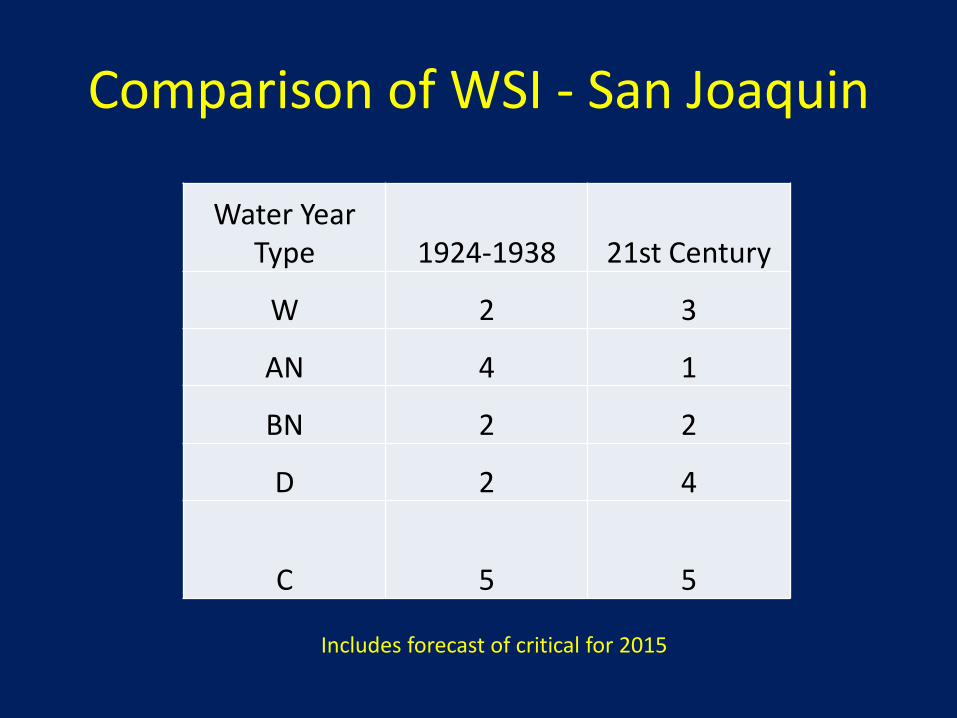
Comparison of WSI - San Joaquin
Water Year Type 1924-1938 21st Century
W 2 3
AN 4 1
BN 2 2
D 2 4
C 5 5
Includes forecast of critical for 2015
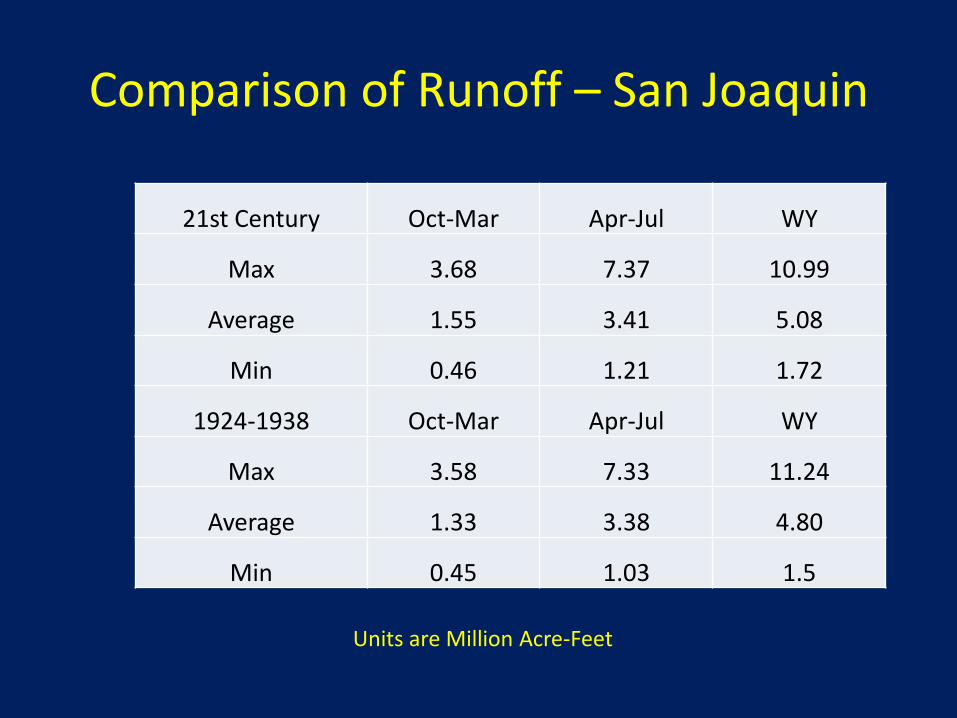
Comparison of Runoff – San Joaquin
21st Century Oct-Mar Apr-Jul WY
Max 3.68 7.37 10.99
Average 1.55 3.41 5.08
Min 0.46 1.21 1.72
1924-1938 Oct-Mar Apr-Jul WY
Max 3.58 7.33 11.24
Average 1.33 3.38 4.80
Min 0.45 1.03 1.5
Units are Million Acre-Feet
* From tree rings
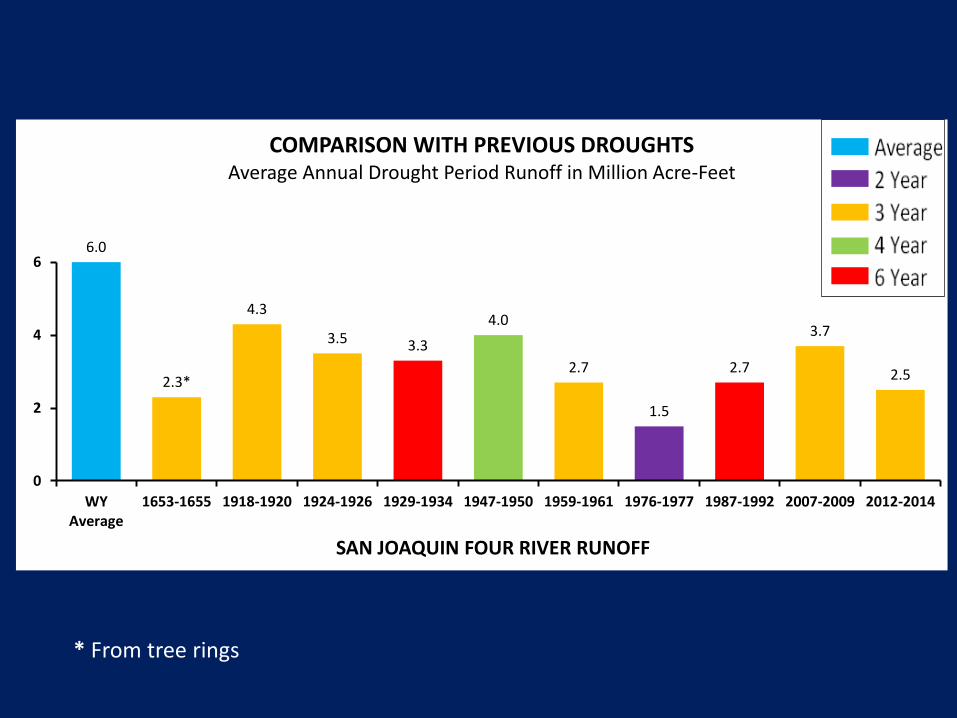
6.0
2.3*
4.3
3.5 3.3
4.0
2.7
1.5
2.7
3.7
2.5
0
2
4
6
WYAverage
1653-1655 1918-1920 1924-1926 1929-1934 1947-1950 1959-1961 1976-1977 1987-1992 2007-2009 2012-2014
SAN JOAQUIN FOUR RIVER RUNOFF
COMPARISON WITH PREVIOUS DROUGHTSAverage Annual Drought Period Runoff in Million Acre-Feet
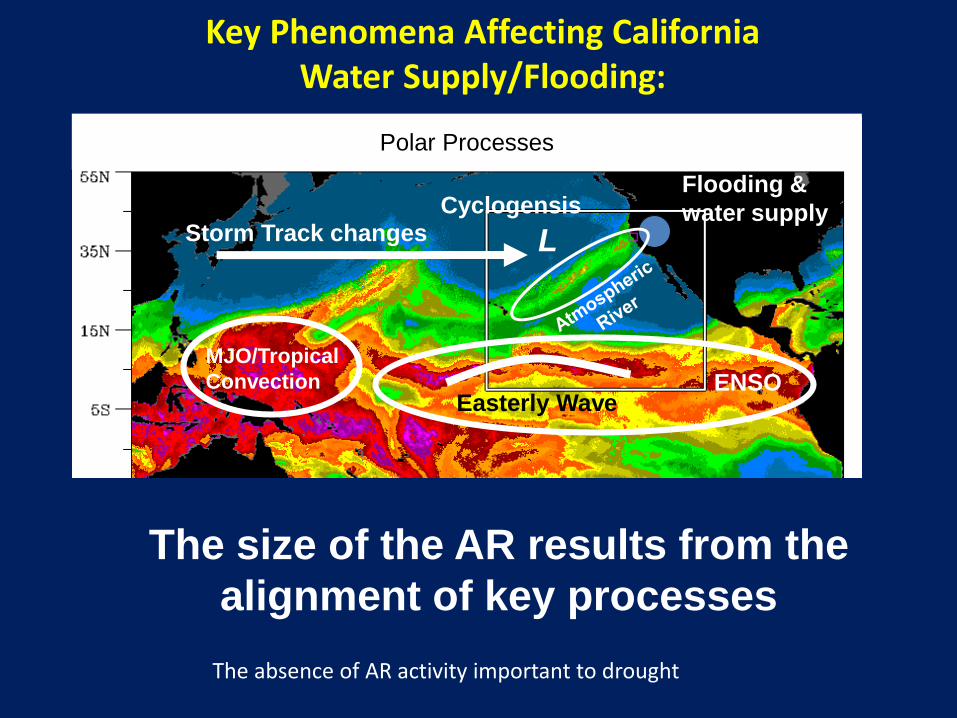
Storm Track changes
Flooding &
water supply
MJO/Tropical
Convection ENSO
Polar Processes
Key Phenomena Affecting California Water Supply/Flooding:
Easterly Wave
Cyclogensis
L
The size of the AR results from the
alignment of key processes
The absence of AR activity important to drought

Summarizing Thoughts
• 21st century droughts have shown record setting characteristics and are warmer than 20th century counterparts
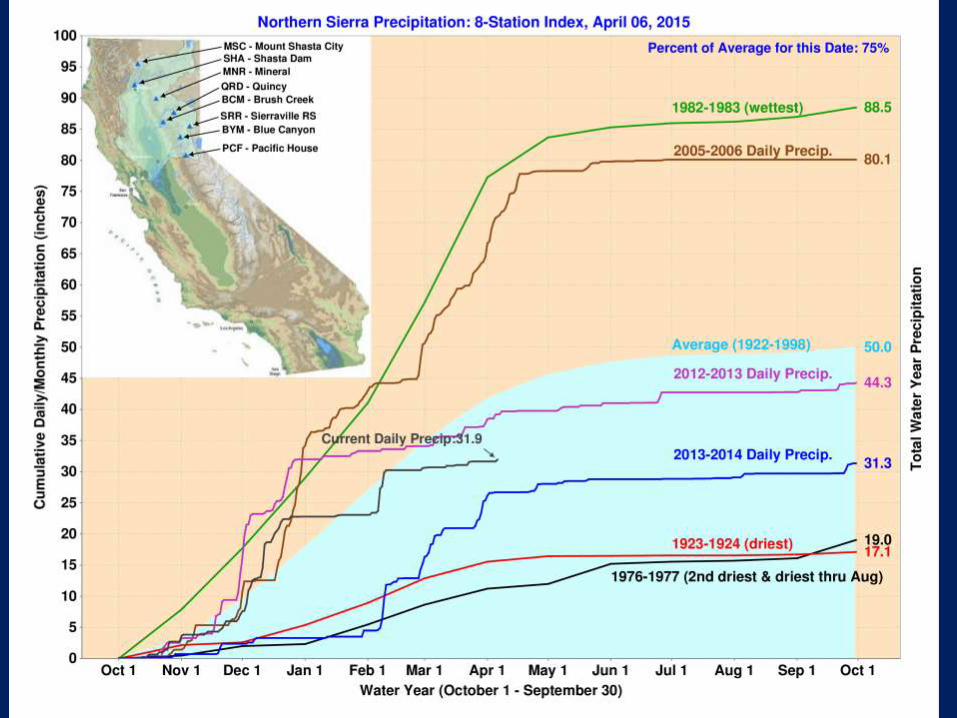
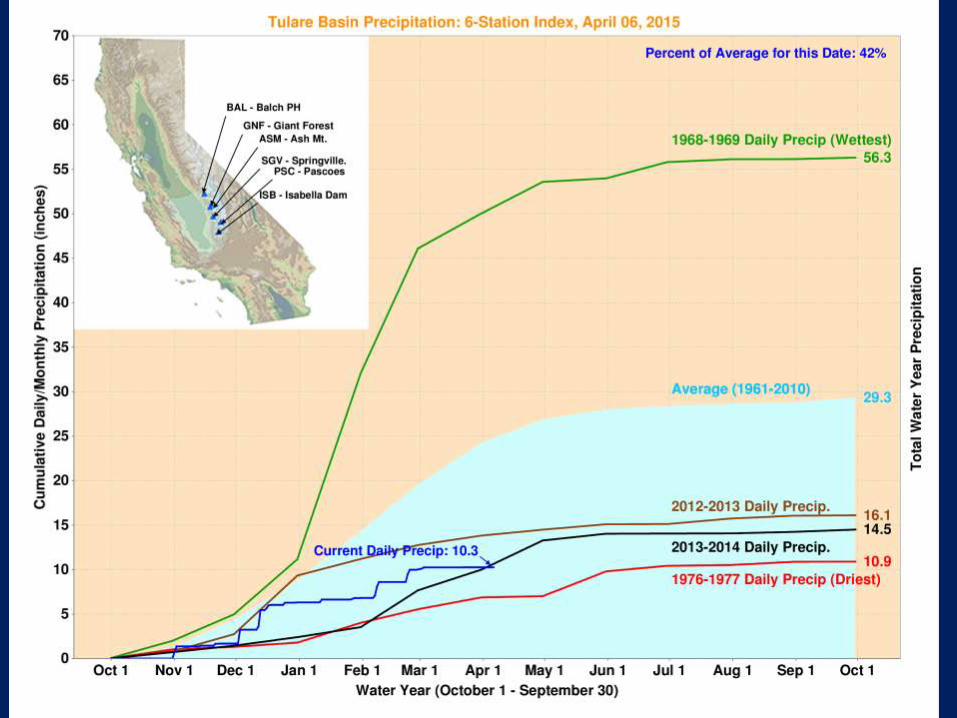
• Atmospheric river events provide significant inputs into annual precipitation totals – fewer such events in drought years
Conclusions
• The expectation of increased variability means new extremes and extreme transitions with past few years serving as an example.
• Planning for future droughts can take advantage of information in the historical record including paleo reconstructions. The trick will be to increase our understanding of causal mechanisms and watershed condition/response.