calculating and reporting of ct values for ground water ... · 7 eliminating the source of the e...
TRANSCRIPT
Calculating and Reporting of
CT Values
for
Ground Water Treatment Systems Not Under the Direct Influence of Surface Water

2
________________________________________________________________________ TABLE OF CONTENTS AND ILLUSTRATIONS ___________________________________________________________________
3
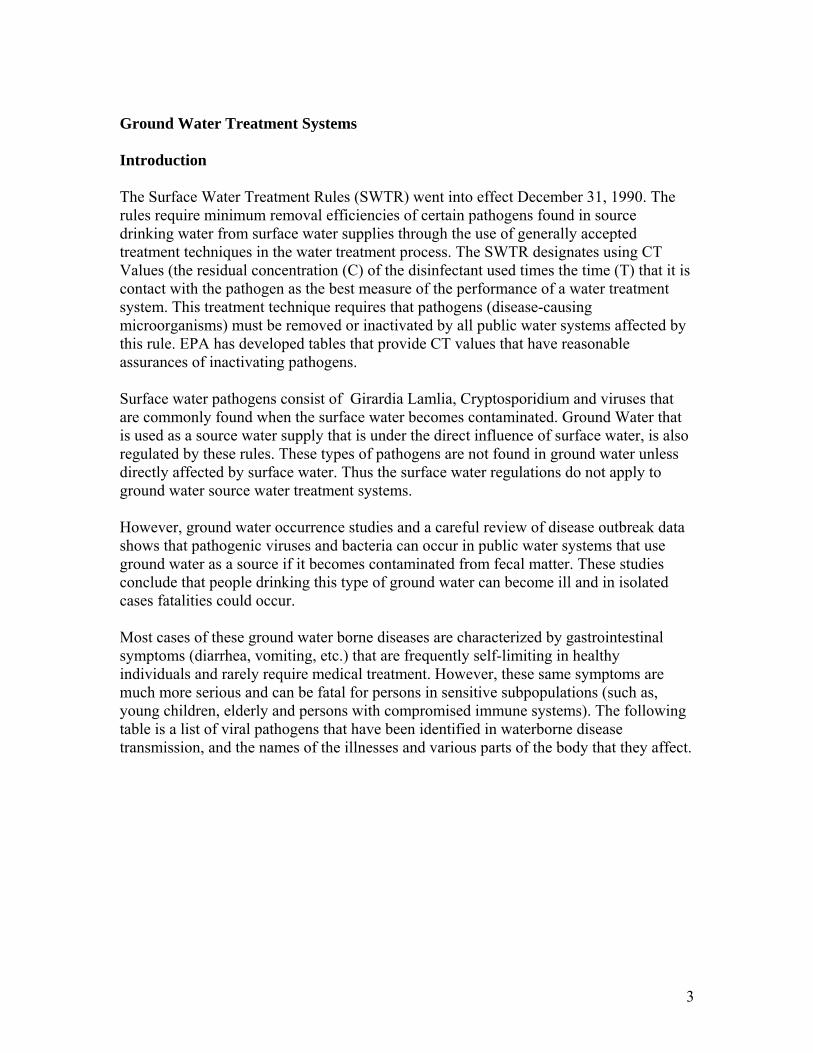
Ground Water Treatment Systems Introduction The Surface Water Treatment Rules (SWTR) went into effect December 31, 1990. The rules require minimum removal efficiencies of certain pathogens found in source drinking water from surface water supplies through the use of generally accepted treatment techniques in the water treatment process. The SWTR designates using CT Values (the residual concentration (C) of the disinfectant used times the time (T) that it is contact with the pathogen as the best measure of the performance of a water treatment system. This treatment technique requires that pathogens (disease-causing microorganisms) must be removed or inactivated by all public water systems affected by this rule. EPA has developed tables that provide CT values that have reasonable assurances of inactivating pathogens. Surface water pathogens consist of Girardia Lamlia, Cryptosporidium and viruses that are commonly found when the surface water becomes contaminated. Ground Water that is used as a source water supply that is under the direct influence of surface water, is also regulated by these rules. These types of pathogens are not found in ground water unless directly affected by surface water. Thus the surface water regulations do not apply to ground water source water treatment systems. However, ground water occurrence studies and a careful review of disease outbreak data shows that pathogenic viruses and bacteria can occur in public water systems that use ground water as a source if it becomes contaminated from fecal matter. These studies conclude that people drinking this type of ground water can become ill and in isolated cases fatalities could occur. Most cases of these ground water borne diseases are characterized by gastrointestinal symptoms (diarrhea, vomiting, etc.) that are frequently self-limiting in healthy individuals and rarely require medical treatment. However, these same symptoms are much more serious and can be fatal for persons in sensitive subpopulations (such as, young children, elderly and persons with compromised immune systems). The following table is a list of viral pathogens that have been identified in waterborne disease transmission, and the names of the illnesses and various parts of the body that they affect.
4
Group Subgroup No. of
(Sub)Types Associated Disease Organs Where Virus Multiplies
Enterovirus Poliovirus 3 Muscular paralysis Aseptic meningitis Febrile episode
Intestinal mucosa, spinal cord, brain stem Meninges Intestinal mucosa and lymph
Echovirus 34 Aseptic meningitis Muscular paralysis Guillain-Barre’s Syndrome1 Exanthem Respiratory diseases Diarrhea Epidemic myalgia Pericarditis and myocarditis Hepatitis
Stem Intestinal mucosa, spinal cord, brain Spinal cord Skin Respiratory tracts and lungs Gastrointestinal tract Respiratory tract and gastrointestinal tract Pericardial and myocardial tissue Liver
Coxsackie >24 Herpangina2 Mouth
A Acute lymphatic pharyngitis Aseptic meningitis Muscular paralysis Hand-foot-mouth disease3 Respiratory disease Infantile diarrhea Hepatitis Pericarditis and myocarditis
Lymph nodes and pharynx Meninges Intestinal mucosa, spinal cord, brain stem Skin of hands-feet, and much of mouth Respiratory tracts and lungs Intestinal mucosa Liver Pericardial and myocardial tissue
Enterovirus (continued)
B 6 Pleurodynia4 Aseptic meningitis Muscular paralysis Meningoencephalitis Pericarditis, endocarditis, myocarditis Respiratory disease Hepatitis or Rash Spontaneous abortion Insulin-dependent diabetes Congenital heart anomalies
Intercostal muscles Meninges Intestinal mucosa, spinal cord, brain stem Meninges and brains Pericardial and myocardial tissue Respiratory tracts and lungs Liver Placenta Langerhan’s cells of pancreases Developing heart
Reovirus 6 Not well known
Adenovirus 31 Respiratory diseases Acute conjunctivitis Acute appendicitis Intussusception Subacute thyroiditis Sarcoma in hamsters
Respiratory tracts and lungs Conjunctival cells and blood vessels Appendia and lymph nodes Intestinal lymph nodes Thyroid Muscle cells
Hepatitis >2 Infectious hepatitis Serum hepatitis Down’s Syndrome
Liver Liver Frontal lobe of brain, muscle, bones

5
Pathways into ground water systems can come from two areas, either the source water can become microbially contaminated from surface runoff or the treatment system can be breached from physical sources such as birds, insects or wind bone atmospheric microbial contamination that can gain access treatment systems through tanks that are open to the atmosphere. Ground Water Virus Inactivation Requirements The requirements for ground water source protection are found in FAC 62-555.315(6)(b) and (f). These requirements cover the start up of a well that has been out of operation for more than 6 months and the sampling requirements that must be performed before start-up approval. The regulation states that, “if any sample shows the presence of E.coli The well shall be considered microbially contaminated unless the Department invalidates the sample or the supplier of water determines and eliminates the source of the E. coli.” Subsection (f) has similar requirements. This section requires water suppliers to periodically sample raw ground water for microbiological contamination and “if any sample is positive for E.coli, the relevant well(s) shall be considered microbially contaminated unless the Department invalidates the sample or the supplier of water determines and eliminates the source of the E. coli …” Treatment protection requirements are found in FAC 62-555.320(12)(b). The regulation states, that “ … suppliers of water using ground water that is not under the direct influence of surface water but that is exposed during treatment to open atmosphere and possible microbial contamination shall provide treatment that reliably achieves at least four log inactivation or removal of viruses before or at the first customer at all flow rates. This section also requires those systems meeting the definitions in subsections (b) and (f) to also meet the four log inactivation or removal of viruses. The requirements for community water systems are summarized in the following table. Community water systems will have to perform daily CT calculations unless the E coli samples are invalidated or the problem is corrected. Community Water System are required to achieve at least 4-log inactivation or removal of viruses before or at the first customer at all flow rates. Table Requirements for Community Water Systems For Providing CT Calculations

6
Provisions for Invalidating a Ground Water Sample It is extremely important that plant personnel be trained in proper sampling and analysis techniques to avoid laboratory error. Coliforms, including fecal coliforms are ubiquitous and it is important that samples be collected from protected locations, that clean and proper containers are used for collection, that the sample is properly preserved and that chain of custody procedures be followed. However, with the best of training sampling and analysis errors do sometimes occur, but are relatively rare. DEP has a procedure that allows for invalidation of improper samples and it is included in the following table. However, samples are considered valid unless one of the following conditions are met: Table DEP Procedures for Invalidation of a Water Sample
1. The initial sample is determined by DEP to include obvious sampling error(s) 2. The laboratory that performed the analysis admits to analysis error(s) as
determined by DEP. 3. The sample is non-representative as determined by DEP, resulting from a
written justification from the water system that the sample does not reflect water quality.
4. A confluent growth of TNTC in the lab analysis results in an undetermined result..
If DEP approves the invalidation of a sample, a replacement sample is required for the invalidated sample.
No. Covered Ground Water System and DEP Regulation
1. Wells Microbially Contaminated / Susceptible per 62-555.315(6)(b) or (f)
2. Ground Water Systems (GWS) That Must Treat for Virus Inactivation 62-555.350(5)
3. GWS Considered Contaminated / Susceptible Microbially 62-555.320(12)
4. GWS with Units Exposed to Open Atmosphere During Treatment 62-555.315(6)(b) or (f)
7
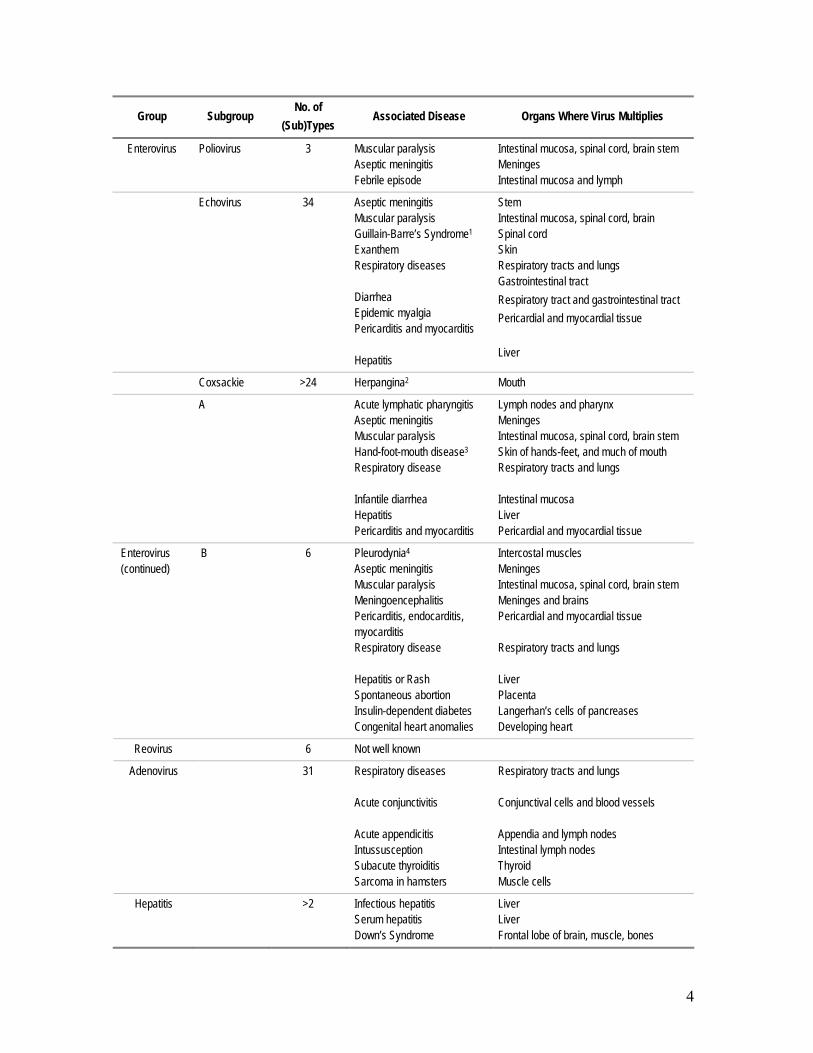
Eliminating the Source of the E coli in Ground Water Ground water that is microbially contaminated or has a direct threat of contamination with known sources of E coli presents a threat to public health. E coli is an indicator of direct fecal contamination and the cause of the contamination or the elimination of the threat should always take precedence over chemical disinfection as the best alternative for providing protection to the drinking water. Tanks open to the atmosphere are relatively easy to and inexpensive to cover when compared to the costs of other constructed water treatment facilities. The tops of basins should always be covered with a solid material to prevent contamination by bird droppings, insects and wind blown debris. Screens around the side of a basin are acceptable. Basin protection made of aluminum structural channels and roofing with screened in sides are commercially available. For well contamination there are standard checks that should be made to identify the source of the contamination. Identifying and correcting a well contamination problem is far easier than to deal with the intermittent type of contamination that generate additional time, expense, paperwork and regulatory sampling and reporting that will occur over time if left uncorrected. Suggestions for correcting contamination in well systems are found in the troubleshooting guide provided below: Table Well Contamination Troubleshooting Guide
# Well Contamination Problem Likely Source of Problem & Remedy
1. Are there any septic tanks, broken storm or sanitary sewers, or contaminated pond water in close proximity to the well?
Water from contaminated sources close to a well can work its way through the surface strata eventually reaching the well. Well Setback Requirements are found in 62.532.400, Table 1, for various types of facilities. Eliminate possible sources of fecal contamination.
2. Are there drainage ditches uphill from the well site?
Contaminated water can collect in areas in close proximity and enter the well. Regrade away from site
3. Is the well subject to flooding? Surface water will transport contaminants to the well and make its way into the borehole through unconsolidated soil. Provide fill and redirect water away from the well head.
4. Does the casing terminate at least 12” above the 100 yr. flood level?
Surface water under hydraulic pressure can reach the well and contaminate it. Raise casing to proper elevation.

8
5. Is the area around the well unusually wet?
Possible corroded casing pipe caused by corrosive water. This condition will allow water to backflow into the well from the surface. Examine and repair well casing.
6. Is there the possibility of abandoned wells in the area?
This condition can result in intrusion from a contaminated source to reach the well. Properly abandon well using regulations found in 62.532.440.
7. Is the well located inside a pump house and what is the sanitary condition?
Unsanitary conditions in a pump house can result in contamination of a groundwater sample. Also the floor of a pump house needs to slope away from the well and be above the 100 yr. flood elevation. Clean and Disinfect the area.
8. Is there any evidence of cracking in the well slab?
A cracked well slab can allow contaminated water to enter a well. It can be the result of settlement and the condition should be corrected.
9. Is there evidence of algae on the well pad, casing or foundation?
Growing algae on a well pad indicates a moist condition that will attract birds, insects and animals that can lead to well contamination.
10.
Does water drain away from the well site?
Surface water will transport contaminants to the well and make its way into the borehole through unconsolidated soil. Provide fill and redirect water away from the well head.
11.
Is the sanitary well seal intact? A damaged well seal is indicative of lack of proper well venting. This condition will suck contaminants into the well under vacuum conditions.
12.
Is the seal water system draining away from the well head.
Poorly maintained packing glands will result in large flows of water into areas that can enter the borehole. Correct this condition.
13.
Are all fittings that provide access to the well protected and pointing downward?
Fittings such as spigots can provide a source of contamination. They should not have threads and point down. Correct this condition.
14.
Is the well vent intact, pointed downward and 12” above the 100 yr. flood elevation.
The well vent is necessary to provide pressure and vacuum relief to the well. If absent a condition exists that can damage well seals and become a source of contamination. Correct these conditions.

9
15.
Is there a check valve installed on the discharge side of the pump and is it working?
These condition can allow contaminated water to backflush into the well. Repair.
16.
Is there cavitation or water hammer occurring when the well is running or shut down.
These conditions can damage check valves and allow contaminated water to backflush into the well. Repair.
17.
Is the well site protected from access by fence and gate?
Allowing access to a well will encourage vandalism and other undesirable activities near the well head possibly leading to contamination. Secure site.
18.
Are there livestock or evidence of wild animals roaming or roosting in close proximity to the well ?
Animals provide a source of fecal contamination and should be kept away from the well head to avoid possible contamination.
19.
Has the well been evaluated for surface water influence?
Surface water can easily transport contaminants into the well. Standard checks for indicator organisms, temperature, color and TOC can be used to identify this potential.
20.
Are there other ground water wells and are they microbially affected?
If the contamination can be isolated to one well the problem can be more easily identified. If multiple wells are affected the problem is more widespread and indicative of a larger surface water intrusion type problem.
21.
How often does the well operate? An intermittent well operation can be an isolated problem at the site that can be identified and corrected.
22.
When did the contamination occur and did it follow any unusual weather event?
Linking a well problem to a weather event can be helpful in determining if the well is under surface water influence.
CT as Representative of Water Treatment Effectiveness The CT value or the contact time, is a measure of the pathogen inactivation potential of a treatment system. CT is used to determine the compliance with DEP drinking water regulations for viral inactivation. CT simply stands for concentration (C) and contact time (T). CT is the result of multiplying the disinfectant residual concentration by the contact time. CT is a measure

10
of disinfection effectiveness for the time that the water and disinfectant are in contact. “C” is the disinfectant residual concentration measured in mg/L at peak hourly flow and “T” is the time that the disinfectant is in contact with the water at peak hourly flow. The contact time (T) is measured from the point of disinfectant injection to a point where the residual is measured before the first customer (or the next disinfection application point) and is measured in minutes. The CT Equation is shown below and will be calculated for each treatment system and compared against a required CT value to determine compliance.
CT Equation: CTcalc (minutes-mg/L) = C x T C = Residual disinfectant concentration measured during peak hourly flow in mg/L. T = Time, measured in minutes, that the water is in contact with the disinfectant.
Determining CT99.99 or 4-Log Removal for Viruses All groundwater water treatment systems that have tested positive for E coli or use basins in the treatment process that are open to the atmosphere, that fall under the provisions of FAC 62-555(6)(b) and (f) or FAC 62-555 (12)(b) must achieve 4-log (99.99%) reduction of viruses through removal (filtration) and/or inactivation (disinfection.) DEP may grant log removal credits for filtration which typically vary depending on the treatment process (such as conventional, direct, or alternative filtration) if such filtration systems are operated according to defined treatment parameters. Log removal credits are discussed in another section of this manual. For unfiltered systems, all four logs must be achieved through disinfection. One method used to calculate log inactivation uses the CT99.99 value for viruses. Virus inactivation must be determined if chloramines, chlorine dioxide, or ozone are used for primary disinfection. The actual log inactivation for viruses can be calculated by the following formula: Log Inactivation for Virus Equation
Actual Log Inactivation of Viruses = 4 x (CTcalc / CT99.99) Variables in the Viral Deactivation Process There are four variables that influence the effectiveness of the disinfection or viral deactivation process. These are: disinfectant type, temperature, pH and residual disinfectant concentration. Using this operational information, a CT value corresponding
11
to the inactivation of 4-log inactivation of viruses can be read from CT tables developed by EPA. After a system has identified the disinfection segment(s), the system must collect the four variables for each disinfection segment, on the same day each week, during peak hourly flow, to determine log inactivation for the treatment plant. These are described as follows :
• The residual disinfectant concentration (“C,” in mg/L); • Contact time “T” in minutes (the time the water is in contact with the
disinfectant); • At each residual disinfectant concentration sampling point:
- Water temperature (in degrees Celsius) and - PH (only for systems using chlorine)
The time that the disinfectant is in contact with the pathogens (viruses) must be determined daily to complete the CT calculation. This contact time, measured as T10, is determined based on the peak hourly flow rate occurring during the 24 hour period and a detention time that is equaled or exceeded by 90 percent of the water passing through the basin. The disinfectant residual concentration is defined as the concentration of disinfectant usedto protect the distribution system from recontamination. This residual is measured, at a location referred to as the “residual sampling point.” For systems with one disinfection point, the CT value will be the time the that the disinfectant is in contact with the pathogens to the first customer on the system. If more than one disinfection point is used, then the CT will be the sum of the CT values calculated for the “segments.” Treatment Segments Generally, water treatment process will include more than one disinfection point. Estimated viral log inactivations are calculated for each disinfection segment of the treatment train. Once the log inactivations for each segment are calculated, they are summed to yield the total plant log inactivations. The following steps show the process for determining CT values when multiple disinfection points are used. Considerations for the Calculation of CT Values To calculate CT values it is necessary to provide a schematic of the plant process configuration and sizes to determine the contact time. A typical schematic of a water plant process showing four treatment process segments is shown below:

12
Note that for each process segment, chlorine residual, temperature and pH has been determined at Peak Hourly Flow. These values are used in conjunction with the basin physical characteristics to determine the actual time the disinfectant is in contact with any potential pathogens or viruses. Disinfectant Selection Considerations
The most important use of disinfectants in water treatment is to prevent water borne disease. The term Disinfection is defined by the U.S. EPA as a specific standard for drinking water. It is a higher standard than Sterilization, which does not necessarily guarantee removal of Giardia cysts, enteric viruses & other pathogens. The difference is in the pathogens killed and the kill ratio. Sterilization eliminates the easy to kill bacteria to a 3 log or 99.9% level. Disinefection eliminates all known pathogens to a 4 log or 99.99% level.
Inactivation is the process is a measure of the effectiveness of the disinfection process. In water treatment, disinfection is one of the primary means to inactivate pathogens. There are three primary mechanisms responsible for pathogen inactivation by disinfection. These mechanism are shown in the following table.
Table Mechanisms of Pathogen Inactivation
Inactivation Mechanism
Description
Cellular Organization Destroys or impairs cellular
structural organization
13
Metabolism Interferes with energy-yielding metabolism
Growth Interferes with biosynthesis and growth
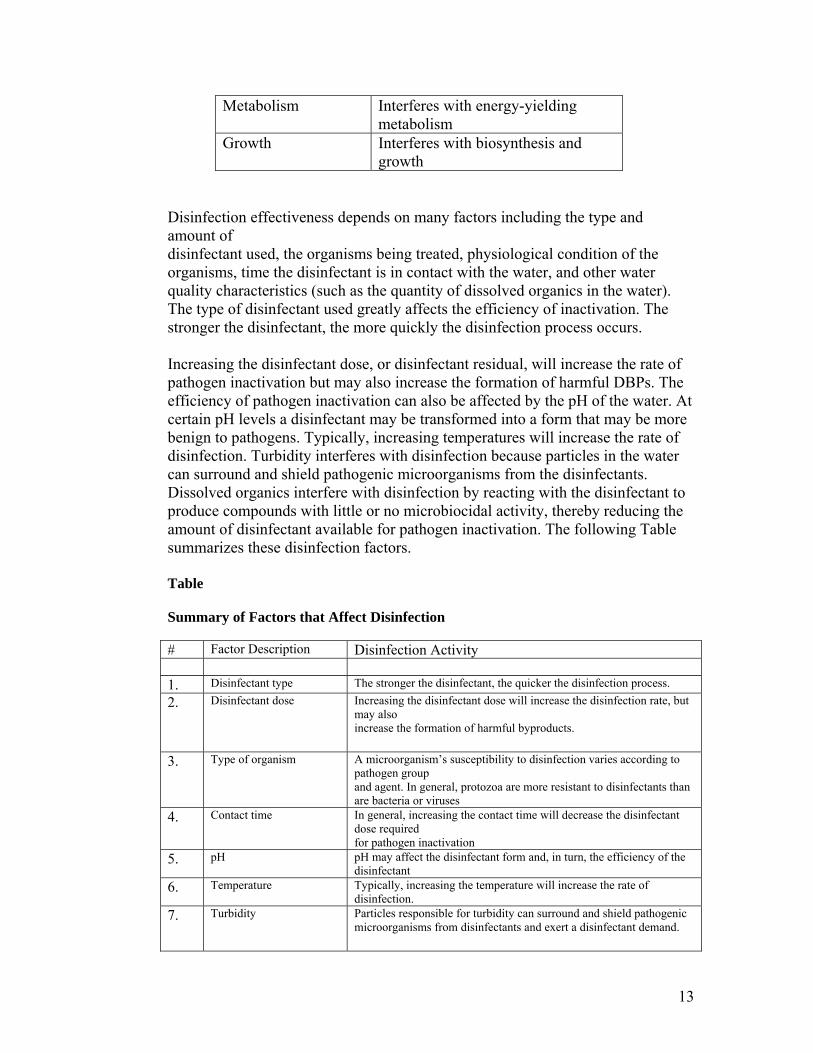
Disinfection effectiveness depends on many factors including the type and amount of disinfectant used, the organisms being treated, physiological condition of the organisms, time the disinfectant is in contact with the water, and other water quality characteristics (such as the quantity of dissolved organics in the water). The type of disinfectant used greatly affects the efficiency of inactivation. The stronger the disinfectant, the more quickly the disinfection process occurs. Increasing the disinfectant dose, or disinfectant residual, will increase the rate of pathogen inactivation but may also increase the formation of harmful DBPs. The efficiency of pathogen inactivation can also be affected by the pH of the water. At certain pH levels a disinfectant may be transformed into a form that may be more benign to pathogens. Typically, increasing temperatures will increase the rate of disinfection. Turbidity interferes with disinfection because particles in the water can surround and shield pathogenic microorganisms from the disinfectants. Dissolved organics interfere with disinfection by reacting with the disinfectant to produce compounds with little or no microbiocidal activity, thereby reducing the amount of disinfectant available for pathogen inactivation. The following Table summarizes these disinfection factors. Table Summary of Factors that Affect Disinfection
# Factor Description Disinfection Activity 1. Disinfectant type The stronger the disinfectant, the quicker the disinfection process. 2. Disinfectant dose Increasing the disinfectant dose will increase the disinfection rate, but
may also increase the formation of harmful byproducts.
3. Type of organism A microorganism’s susceptibility to disinfection varies according to pathogen group and agent. In general, protozoa are more resistant to disinfectants than are bacteria or viruses
4. Contact time In general, increasing the contact time will decrease the disinfectant dose required for pathogen inactivation
5. pH pH may affect the disinfectant form and, in turn, the efficiency of the disinfectant
6. Temperature Typically, increasing the temperature will increase the rate of disinfection.
7. Turbidity Particles responsible for turbidity can surround and shield pathogenic microorganisms from disinfectants and exert a disinfectant demand.

14
8. Dissolved organic and inorganic Compounds
Dissolved organics can interfere with disinfection by consuming the disinfectants to produce compounds with little or no microbiocidal activity, thereby reducing the amount of disinfectant available for pathogen inactivation.
Some systems employ different disinfectants to meet their system's demands. These disinfectants are used for primary and/or secondary disinfection depending on the utility’s need and the specific disinfectant. Primary disinfection provides the appropriate CT to inactivate microbial pathogens. Disinfectants proven effective for this purpose include free chlorine, chlorine dioxide, and ozone. Secondary disinfection ensures residual protection to control microorganism regrowth or recontamination during water storage and distribution. Either free chlorine, or chlorine plus the addition of ammonia to form chloramine, accomplishes this task
One of the most useful ways of characterizing the pathogen inactivation efficiency of any disinfectant is the CT factor. CT is defined as the product of the residual disinfectant, C, in milligrams per liter (mg/L), and the contact time, T, in minutes. The CT factor implies that an equivalent level of disinfection can be achieved by different combinations of disinfectant concentrations and contact times. CT factors are typically determined for different levels of pathogen inactivation. Inactivation is usually measured in log base 10, while CT values are usually measured in mg-min/L. The level of inactivation, is expressed as “log removal” or “log inactivation.” For example, a 2-log inactivation is equivalent to a 99 percent pathogen inactivation. Each unit increase in the log removal of pathogens will result in a ten-fold decrease in the fraction of viable pathogens. For example, a 3-log inactivation is equivalent to a 99.9 percent inactivation When discussing filtration and disinfection, removal levels from filtration can be combined with disinfection inactivation levels to create an overall removal/inactivation level. EPA has identified CT values for the inactivation of Giardia cysts and viruses for various disinfectants using various disinfectants at a water temperature of 10ºC and a pH range of 6.0 to 9.0. For ground water treatment systems that are required to perform log removal calculations, the CT values for a 4-log removal of viruses must be used. Some systems employ different disinfectants to meet their system's demands. These disinfectants are used for primary and/or secondary disinfection depending on the utility’s need and the specific disinfectant. Primary disinfection provides the appropriate CT to inactivate microbial pathogens. Disinfectants proven effective for this purpose include free chlorine, chlorine dioxide, and ozone. Secondary disinfection ensures residual protection to control microorganism regrowth or recontamination during water storage and distribution. Either free

15
chlorine, or chlorine plus the addition of ammonia to form chloramine, accomplishes this task. Free chlorine will be the disinfectant of choice by most water systems. However, those systems that experience the production of disinfection by-products that approach or exceed regulatory limits may switch or combine their primary disinfectant with a different secondary disinfectant. Because of cost concerns and ease of production, typically, the choice of the secondary disinfectant will be combined chlorine or chloramines, made by adding ammonia. Chloramines significantly limit the production of disinfection by-products and can help a system meet disinfection by-product regulations. Chloramines is a far weaker disinfectant than other alternatives such as chlorine, chlorine dioxide, or ozone. Chloraimine is particularly weak in inactivating some viruses. Its performance is influenced by water temperature and pH outside of the normal operating range of 6-9. Chloramines are between 50 and 100 times less effective at viral inactivation than free chlorine. These significant differences in inactivation ability is illustrated in the following table. Using chloramines for primary disinfection to achieve inactivation of viruses can be problematic and is not recommended. Typically what a utility will do is use free chlorine in the treatment process for viral inactivation and use chlorimine in the distribution system to maintain the required 0.6 combined chlorine residual. Another issue with the use of chloramines in water treatment is the application point of the ammonia. If a water system uses chloramines it is not always appropriate to assume that 99.99 percent or greater inactivation of viruses is achieved by using EPA tables. Some data indicates that certain rotavirus are less sensitive to inactivation by preformed chloramines. Thus it is necessary to consider how the chloramines was produced in the water treatment plant to properly apply the chlorimine tables. If chlorine is applied prior to the ammonia, the short term presence of free chlorine would be expected to provide at least 99.99 percent inactivation of rotavirus prior to the addition of ammonia and subsequent formation of chloramines. To use the tables it is necessary for the treatment plant to add the chlorine prior to the addition of ammonia. If ammonia is added first, the CT values for achieving 99.99 percent inactivation of viruses can not be used. If a water treatment plant adds ammonia prior to or in combination with chlorine, it must demonstrate through an “on-site challenge study”, that the system’s log-deactivation levels meet or exceed the 4-log requirements. Guidance for conducting such studies is found in USEPA’s, Guidance Manual for Compliance with Filtration and Disinfection Requirements.
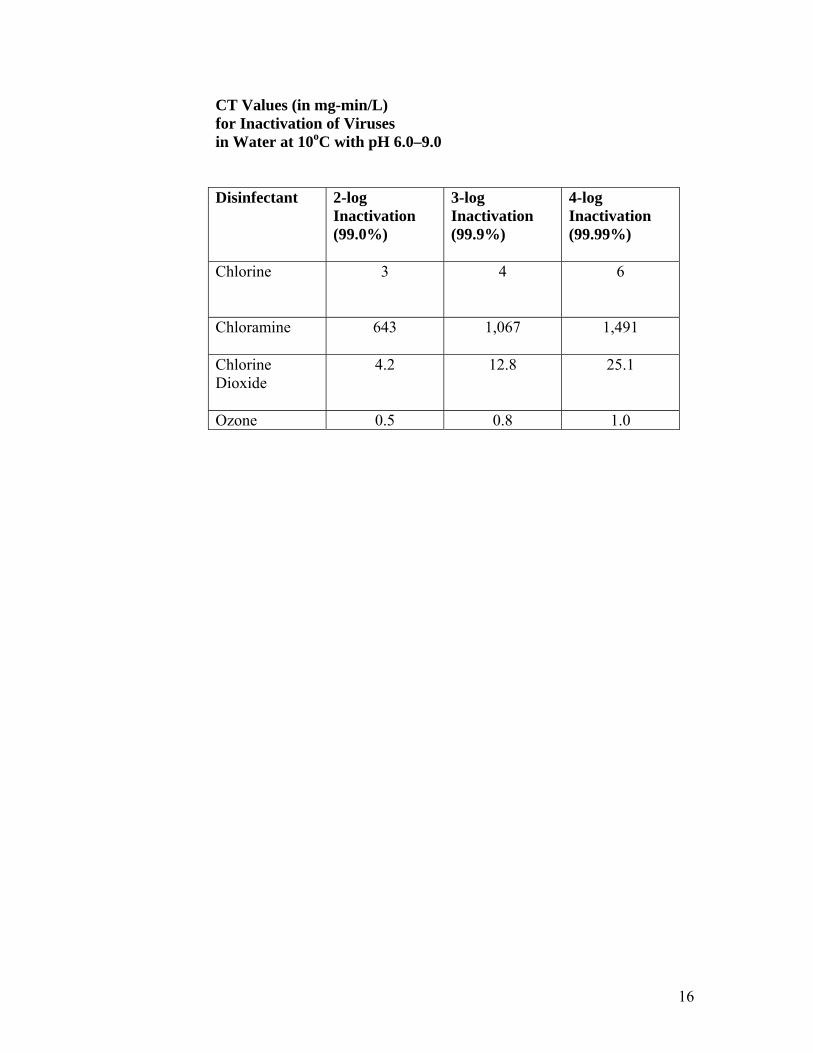
Table 2-3.
16
CT Values (in mg-min/L) for Inactivation of Viruses in Water at 10oC with pH 6.0–9.0 Disinfectant
2-log Inactivation (99.0%)
3-log Inactivation (99.9%)
4-log Inactivation (99.99%)
Chlorine
3 4 6
Chloramine
643 1,067 1,491
Chlorine Dioxide
4.2 12.8 25.1
Ozone 0.5 0.8 1.0

17
Basin Configurations and Considerations in Determining Contact Time (T10)
Determining Contact Time, (T10) for Each Segment For the purpose of determining compliance with the disinfection requirements, the contact time for plant segments, including pipes, basins and storage reservoirs used in the treatment process is the detention time in which 90 percent of the water passing through the unit is retained within the basin, (i.e., T10). The contact time or detention time, T10, is the value estimated using the theoretical detention time (TDT) derated by a factor that approximates the actual flow conditions through the plant segment. Unfortunately, actual contact time is generally not the same as a calculated theoretical detention time (TDT) because of many factors that cause the water to travel faster in some areas of a tank. In all tanks some “dead spots” will develop and these areas do not contribute to the actual contact time. This condition known as short circuiting and can be minimized by the installation of baffles in a tank to direct flow in such a manner to prevent the dead spots from developing. Tank baffling provides for more actual use of the tank for volume for disinfectant contact. Under field conditions, only flow in pipes will achieve a condition where 100% of the vessel is utilized. Thus for pipes the theoretical detention time is equivalent to the actual contact time. Since tanks rarely will achieve a 100% total useable volume condition, baffling factors have been developed that describe various tank shapes and baffling conditions and provide a reasonable estimate of the percentage of the actual tank volume that is providing actual contact time between the disinfectant and any potential pathogens. These baffling factors are then applied against the calculated theoretical detention times and are used to de-rate detention times to approximate the actual contact time in a basin. “Baffling Factors” can be estimated by comparing the actual plant basin characteristics to standards for basins with similar characteristics. From these the actual contact time can be estimated. As previously discussed, the water treatment train must be divided into several disinfection segments. These correspond to the number of disinfectant application points. The disinfection segments may include several unit processes of the treatment train. The total T10 for the disinfection segment is the sum of each T10
for each unit process within the segment. T10 can also be calculated for the whole plant or an entire segment instead of for individual segments, as long as there are no additional points of disinfectant addition. The segment T10 is multiplied by the disinfectant residual at the end of the segment to yield the segment CTactual. There are two methods to determine the contact time for a treatment process. The

18
first method calculates contact time by utilizing the hydraulic characteristics of the treatment basin and baffling factors. These baffling factors are shown in Appendix. The second method involves conducting a tracer study for each disinfection segment. Baffling factors are used to determine T10 from theoretical detention times in systems when it is impractical to conduct tracer studies. Baffling conditions include, very poor, poor, average, superior, or perfect conditions. A conservative approach to calculating the contact time with baffling factors is to select the lowest baffling condition that is applicable. If it is not clear whether the baffling condition for a basin is average or superior, then lower value should always be selected for the T10 calculations. Use of Tracer Studies for Determining Contact Time For some plants where de-rating of the calculated detention time results in a condition where the needed contact time to achieve viral inactivation can not be met a treatment systems may elect to conduct a tracer study. Tracer studies are more accurate than the use of baffling factors as they provide a real measure of the contact time by measuring the time it takes for the tracer to flow through each segment in the treatment train. Tracer studies provide a better understanding of how well the disinfectant is mixing with the water for the hydraulic conditions of a specific water treatment plant. The disadvantage of the tracer study is that they are labor intensive and costly to conduct. The baffling factor method is typically a more desirable alternative for determining the contact time. It is less labor intensive, inexpensive, and easy to perform. The disadvantage, however, is that the baffling factors may not accurately represent the actual contact time of the system. Determining Contact Time (T10) Using a Tracer Study A tracer study uses a chemical tracer to determine the detention time of water flowing through a unit process, segment, or system. Typical chemical tracers include chloride ions, fluoride ions, and a fluorescent dye Rhodamine WT. The selected tracer chemical should be readily available, easily monitored, and acceptable for use in potable water supplies. The tracer selected must detectable during treatment and not be consumed or removed by the water treatment process. Both Fluoride and Chloride ions meet this criteria and have been used effectively in tracer studies. Fluoride ions can generally be used in lower concentrations than chloride because they are typically present in lower concentrations in the source water. Rhodamine is another tracer that has found wide use for tracer studies. However it is a fluorescent tracer that must be used following certain guidelines.

19
Selection of a the particular chemical tracer may depend on the unit processes and the salt concentrations present in the water. Specific instructions on chemical tracers and under what conditions are they most effective are found in many water treatment references and will not be covered here. Tracer studies are generally performed when the more conservative baffling factors do not accurately describe the actual contact time in a water treatment plant and compliance with deactivation requirements are significantly affected. If a water treatment systems elects to conduct a tracer study, the study must be conducted in consultation with DEP and using the acceptable Agency guidelines in order for the value of T10 that is determined to be acceptable to the Agency. Requirements for Conducting a Tracer Study The test procedure for determining the contact time with a tracer study includes the following considerations:
• The system determines the flow rate or rates to be used in the study. • The system selects the tracer chemical and determines the raw water background concentration of the tracer chemical. The background level is needed to both determine the quantity of chemical to feed and to evaluate the data properly. • The system determines the tracer addition locations, plans the sample collection logistics and frequency, and determines the appropriate tracer dosage. Sampling frequencies depend on the size of the basin. the larger the basin the easier it is to obtain an adequate profile with less frequent sampling is needed. Small basins need more frequent sampling. However, to obtain an adequate profile, large systems may be more difficult to handle than small basins because sampling events are longer in duration thus presenting logistical problems in staffing for sample collection and sample analysis. • The system conducts the tracer test using either the step-dose or slugdose methods. • The system compiles and analyzes the data. • The system calculates T10.
The guidelines found in the table below, include minimum acceptable requirements and the water provider is directed to consult with DEP to identify additional requirements that may be necessary for conducting a tracer study.
Table Guidelines for Conducting a Tracer Study 1. Application Points for
Tracer Addition The tracer chemical should be added at the same points in the treatment train as

20
the disinfectant to be used in the CT calculations, since it will be used to determine T10 for the disinfection segments.
2. Acceptable Methods a.) Step Dose In the step-dose method, the tracer
chemical is injected at a constant dosage and the endpoint concentration is monitored. To determine a 90 percent recovery for the tracer, endpoint sampling should continue until the tracer concentration reaches a steady-state level.
b.) Slug Dose With the slug-dose method, a large dose of tracer chemical is instantaneously injected. An effective way to achieve instantaneous addition is to use a gravity-fed tube to release the single dose. The tracer concentration is monitored at the endpoint, until the entire dose has passed through the system. A mass balance is required to determine whether the entire tracer dose was recovered. Additional mathematical manipulation is required to determine T10 from the concentration versus time profile.
Considerations for Determining Contact Time for Unit Process The unit processes that comprise each disinfection segment may typically include sedimentation, filtration, and pipeline flow. If there are other processes, these need to be included also. Each of these processes have special hydraulic characteristics affecting the contact time. In totally submerged pipelines, the contact time can be assumed equivalent to the theoretical detention time and is calculated by dividing the internal volume of the pipeline by the peak hourly flow rate through the pipeline. Pipeline flow is assumed to be plug flow because there are no dead zones or unutilized volume in the pipe. Therefore, each unit of water is assumed to spend the same time in the pipeline, referred to as the TDT.

21
For treatment processes with other shapes (e.g., a rectangular sedimentation basin) the time spent by the water in the reactor may vary over a range. For example, some water may move faster by short-circuiting while other water may spend more time in the reactor trapped in “dead zones” resulting in little flow. Factors that impact contact time include the following:
1. flow rate, 2. water level in the unit, 3. shape of the unit, 4. inlet/outlet locations, 5. baffle types and locations, 6. whether the unit is filling or emptying, 7. sludge depth, 8. seasonal variations, and 9. thermal stratification.
The volume of each basin, pipe, or unit process is used to calculate T10. Since many treatment basins will have fluctuating levels water levels that affect volume, the most conservative value at the peak hourly flow should be chosen to determine the useable contact volume. Where information is not available for the peak hourly condition than the minimum volume that can occur in the treatment unit or the lowest volume realized for the day should be used. It is incumbent upon the operator who performs the contact time calculation to identify and include an accurate representation when determining basin volumes. The table below provides some suggestions.
22
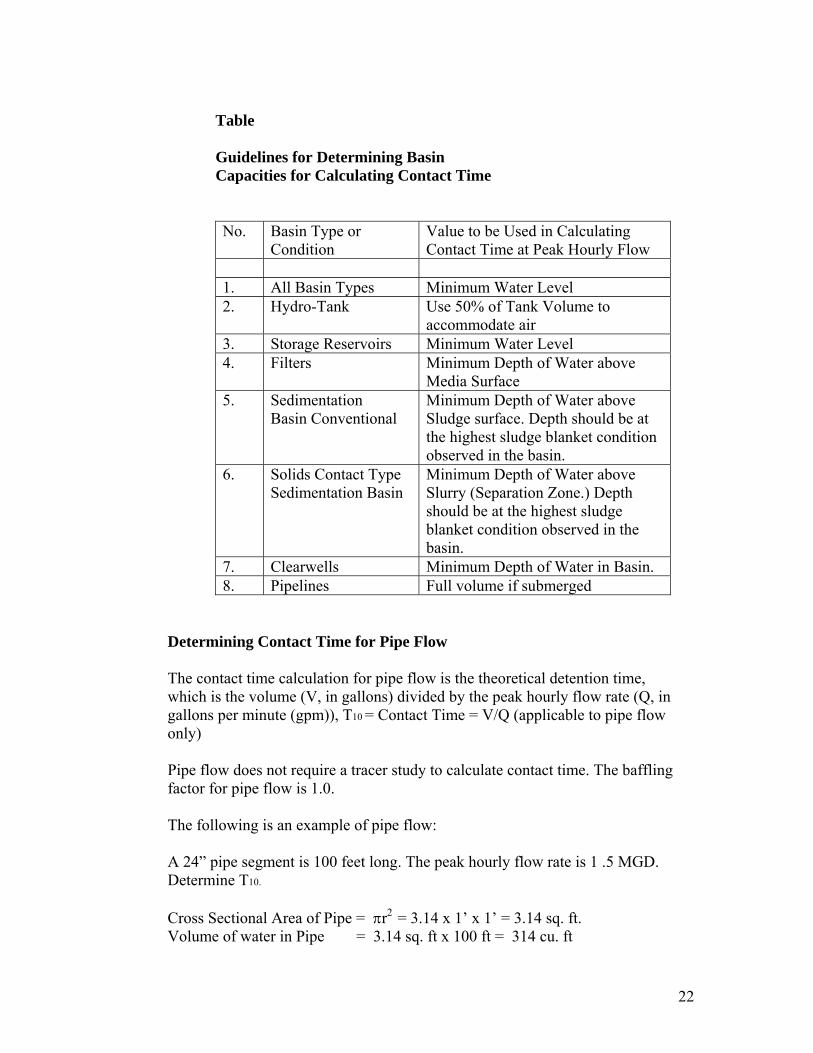
Table Guidelines for Determining Basin Capacities for Calculating Contact Time
No. Basin Type or Condition
Value to be Used in Calculating Contact Time at Peak Hourly Flow
1. All Basin Types Minimum Water Level 2. Hydro-Tank Use 50% of Tank Volume to
accommodate air 3. Storage Reservoirs Minimum Water Level 4. Filters Minimum Depth of Water above
Media Surface 5. Sedimentation
Basin Conventional Minimum Depth of Water above Sludge surface. Depth should be at the highest sludge blanket condition observed in the basin.
6. Solids Contact Type Sedimentation Basin
Minimum Depth of Water above Slurry (Separation Zone.) Depth should be at the highest sludge blanket condition observed in the basin.
7. Clearwells Minimum Depth of Water in Basin. 8. Pipelines Full volume if submerged
Determining Contact Time for Pipe Flow The contact time calculation for pipe flow is the theoretical detention time, which is the volume (V, in gallons) divided by the peak hourly flow rate (Q, in gallons per minute (gpm)), T10 = Contact Time = V/Q (applicable to pipe flow only) Pipe flow does not require a tracer study to calculate contact time. The baffling factor for pipe flow is 1.0. The following is an example of pipe flow: A 24” pipe segment is 100 feet long. The peak hourly flow rate is 1 .5 MGD. Determine T10.
Cross Sectional Area of Pipe = πr2 = 3.14 x 1’ x 1’ = 3.14 sq. ft. Volume of water in Pipe = 3.14 sq. ft x 100 ft = 314 cu. ft

23
= 314 cu. ft x 7.48 gallons/ cu. ft = 2349 gallons Convert MGD to GPM = 1.5 MGD x 694 GPM/MGD = 1041 GPM T10 = V/Q = 2349 gallons / 1041 GPM = 2.3 minutes T10 = 2.3 minutes Determining Contact Time in Mixing Basins and Storage Reservoirs In mixing basins and storage reservoirs, the theoretical detention time generally does not represent the actual disinfectant contact time. Thus, determining contact time is more complicated with basins.The time used to compute CTactual in treatment basins depends on the reservoir shape, inlets, outlets, and baffling. Most clearwells and some other treatment basins were not designed to provide optimal hydraulic characteristics for contact with a disinfectant. For the purpose of determining compliance with the disinfection requirements, the contact time of mixing basins and storage reservoirs used in calculating CTactual should be the detention time in which 90 percent of the water passing through the unit is retained within the basin, (i.e., T10). Information provided by tracer studies is used for estimating the detention time T10 for the purpose of calculating CTactual. If tracer studies are not practical, the TDT and baffling factor approach can be used. A plant with multiple treatment trains and different operating characteristics should have the critical train identified. Determining Contact Time Using Baffling Factors for Basin Conditions The TDT is computed by dividing the volume of a unit process by the peak hourly flow rate (TDT=V/Q). Baffling factors (T10/T) selected for a specific unit process are multiplied by the theoretical detention time that derate the calculated detention value to yield an estimate of the contact time or T10, in the basin. T10 = Contact Time = V/Q * T10/T Table Baffling Classifications and Factors Baffling Condition T10/T or Baffling Factor Baffling Description Unbaffled (mixed flow) 0.1 None, agitated basin, very low
length to width ratio, high inlet and outlet flow velocities
Poor 0.3 Single or multiple unbaffled inlets and outlets, no intrabasin baffles
Average 0.5 Baffled inlet or outlet with some intra-basin baffles
Superior 0.7 Perforated inlet baffle, serpentine or perforated intrabasin

24
baffles, outlet weir or perforated launders
Perfect (plug flow) 1.0 Very high length to width ratio (pipeline flow), perforated inlet, outlet, and intra-basin baffles
The following is an example calculating TDT for a Basin: A basin has a Volume of 500,000 gallons of water at peak conditions with a Peak Hourly Flow Rate of 10,000 GPM. The Contact Basin is unbaffled. TDT = V/Q = 500,000 gallons/10,000 GPM = 50 minutes However, because the contact basin is unbaffled, the T10/T is 0.1 and the resulting actual contact time used for determining log inactivation must be derated. T10 (contact time) = 50 minutes * 0.1 = 5 minutes By improving contact conditions through inlet and outlet and some intra-basin perforated baffles, the T10/T may be improved to 0.7 and, therefore, the new contact time would be calculated as follows: T10 (contact time) = 50 minutes * 0.7 = 35 minutes.
25
Steps in Determining the Water Treatment Plant CT CT values can be calculated using the following steps:
1. Measure the following operational data each day at each disinfectant residual sampling point(s):
a. Disinfectant residual concentration (C, in mg/L) b. Water temperature (°C) c. Water pH (for systems using chlorine).
2. Determine the peak hourly flow rate for each day from flow monitoring records..
3. Calculate the contact time (T10) for each disinfection segment
a. Define the number of segments b. Determine the Method of Selecting T10 (from Chart or Dye Study)
4. Calculate CTactual for each disinfection segment under actual operating
conditions (i.e., C x T10)
5. Determine the CT required for 4-log Virus inactivation (CT4-log, virus) from the CT Tables. These required CT values are dependent on the disinfectant type, residual concentration, temperature, and pH.
6. Calculate the estimated log inactivation for viruses for each disinfection segment using segment log inactivation of viruses = 4.0 * CTactual / CT4-log, viruses.
7. Add the segment log inactivations to determine the plant log inactivations due to chemical disinfection. Plant log inactivation of viruses = ∑ (segment log inactivation of viruses)
Each of the steps are discussed below. Determining Residual Disinfectant Concentration (Step 1)
The residual disinfectant concentration is monitored for each disinfection segment during peak hourly flow and is measured in milligrams per liter (mg/L). At least one monitoring point must be associated with each disinfectant injection point. However, systems may choose to sample for residual disinfectant concentration at more than one location for each unique injection point. The residual disinfectant concentration must be measured using methods listed in Standard Methods for the Examination of Water and Wastewater, 18th (1992), 19th (1995), or 20th
(1998) editions. For those systems using ozone, Method 4500-03 B, contained in

26
Standard Methods for the Examination of Water and Wastewater, 18th (1992) or 19th (1995) editions must be used. Residual disinfectant concentrations for free chlorine and combined chlorine may be measured using DPD colorimetric test kits.
Determining Temperature The temperature is measured at each monitoring point and at the same time as the residual disinfectant concentration (during peak hourly flow). The temperature should be measured in degrees Celsius (Co) because the CT Tables are based on temperature as measured in Co . Temperature is important since the effectiveness of all disinfectants is temperature sensitive. Temperature must be measured using Method 2550 in Standard Methods for the Examination of Water and Wastewater, 18th (1992), 19th (1995), or 20th (1998) editions. Determining pH If a system uses chlorine as a disinfectant, pH must be monitored because chlorine is pH-sensitive and is more effective at lower pH values. The pH is sampled at each sampling point and at the same time as the residual disinfectant concentration (during peak hourly flow). The CT tables in for chlorine are based on pH. Systems must measure pH using EPA Method 150.1 or 150.2, ASTM method D1293-95, or Method 4500-H+ in Standard Methods for the Examination of Water and Wastewater, 18th (1992), 19th (1995), or 20th (1998) editions.
Determining Peak Hourly Flow The amount of time the water is in contact with the disinfectant is a function of flow rate. When the flow rate increases, the time the water spends in the plant decreases. Using the peak hourly flow rate for analysis provides a conservative value for contact time and represents the worst case scenerio where pathogens might pass through the disinfection process unaffected. Some systems may be able to use a single peak hourly flow across the plant. In some systems, the peak hourly flow may vary across the plant. If the system has multiple disinfection segments and flow does vary across the plant, the disinfection segments may have different peak hourly flows. Each system will determine its peak hourly flow rate differently. Some possible ways to determine the flow rate include:
1. Flow meter records; 2. Design flow rate; 3. Maximum loading rates to treatment process units; 4. Raw water pump records; or, 5. Historical maximum flow rate.

27
When determining peak hourly flow, systems may want to take into consideration the location of their disinfection segment. For example, a system with a single disinfection segment with disinfection prior to the clearwell may consider using clearwell pumping rates versus raw water pump records to determine the peak hourly flow rate. When compiling data for the peak hourly flow rates, systems will monitor for residual disinfectant concentration, pH (if chlorine is used), and temperature. Systems with supervisory control and data acquisition (SCADA) systems will be able to review records, identify the peak hourly flow, and then obtain the residual disinfectant concentration, temperature, and pH (if chlorine is used) that were recorded during peak hourly flow. Those systems without SCADA will need to coordinate with DEP to develop a procedure that allows the system to most accurately identify peak hourly flow to allow for proper data collection. If records are not available the plant must record hourly values for a full 24 hour period to choose the proper time period The recommended method for determining peak hourly flow when flow data is unavailable is:
1. Determine when peak hourly flow occurred the day before data must be collected. Collect the residual disinfectant concentration, temperature, and pH (if chlorine is used) on the required day at the time peak hourly flow occurred on the previous day. 2. Proceed to collect residual disinfectant concentration, temperature, and pH (if chlorine is used as a disinfectant) at three different times (such as before, during, and after) near the time peak hourly flow occurred on the previous day. Then, based on pump records or other information, determine when peak hourly flow actually occurred and use the data that were collected nearest to the time of peak hourly flow.
Log Reduction Credits
Log reduction credits are allowed for ground water systems that use filters in the treatment process. The credits are described in 62-555.320(12)(b) and are shown in the following table. Filtration Type Viral Log
Removal Credit
Viral Log Reduction that must be achieved by Disinfection
Direct Filtration 1 3 Diatomaceous Earth 1 3 Conventional 2 2 Slow Sand 2 2

28
In order to receive a filtration credit the water treatment system must achieve:
1. combined filtered water turbidities is less than 0.3 NTU in at least 95% of the measurements taken each month and
2. no the combined filter never exceeds 1 NTU in the month 3. Combined filter turbidity must be measured every 4 hours.
For those water systems that wish to receive log reduction credits, they must obtain approval from DEP in writing. What You will need to do to Report CT Values to DEP There are basically two steps in setting up your water Treatment Plant’s CT reporting procedures. Step One: You must first prepare a flow schematic of your facility. The schematic shall begin at the raw water source and end with the first customer. The information for the diagram shall include the following:
1. Type of units, 2. Number of each treatment processing units, 3. Dimensions of each unit, 4. Total capacity of treatment process units, 5. Disinfection application points, 6. Disinfection residual points, 7. Any flow splits, 8. Any sludge depth, 9. Tank Water Levels Under Peak Hourly Flow Conditions 10. Description of flow pattern for each unit, 11. Your best estimate for the baffling factor, 12. Your best estimate for the Log-removal credit, 13. The person’s name who prepared the diagram, 14. The telephone number at which the preparer can be contacted, and 15. Any other comments or necessary information.
Step 2:
1. Your diagram will be kept at your facility and sent to your District DEP office for evaluation. It will also be kept at your facility for review by DEP at the time of your Sanitary Survey. 2. Your Schematic baffling factors will be reviewed and adjusted if needed.

29
3. Your filtration process will be assigned a Log removal credit if one is appropriate. 4. You will receive a copy of the any revisions to your system schematic 5. You will be required to complete daily DEP form 62-555-900(3), Monthly Operating Report (MOR) and it shall be submitted monthly.
If your system changes for any reason, then you need to revise your system schematic and resubmit it to your District Office. The following are some examples of where you will need to submit a revised schematic:
1. A treatment unit is taken out of service. 2. A treatment unit is added to the process. 3. Baffling of units is added or redesigned. 4. The point of injecting disinfectant is changed. 5. The point of a disinfectant residual is changed.

30
Example CT Calculations

31
Example 1 – Use of Free Chlorine Well Considered Microbially Contaminated / Susceptible
Step 1 - Prepare Schematic
•• Well Pump = 75 gpmWell Pump = 75 gpm•• Hydropneumatic Tank = 1,000 galHydropneumatic Tank = 1,000 gal•• Cl2 Residual = 1.2 mg/LCl2 Residual = 1.2 mg/L•• Water = 21Water = 21ooC, 7.8 pHC, 7.8 pH
WellWellCl2Cl2 HydroHydro TankTank
66--inchinch66--inin
First First CostumerCostumer
500500--ftft2020--ftft
Pipe Volume per footPipe Volume per foot
23.5 gal23.5 gal242416.3 gal16.3 gal2020
10.44 gal10.44 gal16165.88 gal5.88 gal12122.61 gal2.61 gal881.47 gal1.47 gal660.65 gal0.65 gal440.37 gal0.37 gal330.16 gal0.16 gal22
Volume per foot Volume per foot (gallons)(gallons)
Pipe Pipe Dia Dia (inches)(inches)

32
Step 2 - Compute CT for Pipe Segment
•• Pipe CT =Pipe CT = ConcConc x Tx TCC x BF x BF •• Well Pump = 75 gpm (Peak Flow)Well Pump = 75 gpm (Peak Flow)•• 66--inch Pipe = 1.47 gal/footinch Pipe = 1.47 gal/foot•• BF for pipe = 1 (MOR Table 1, page 6)BF for pipe = 1 (MOR Table 1, page 6)•• TTCC = Pipe Length x Pipe = Pipe Length x Pipe VolVol x Peak Flow x Peak Flow •• TTCC = 520= 520--ft x 1.47 gal/ft / 75 gpm = 10.2 minft x 1.47 gal/ft / 75 gpm = 10.2 min•• TTCC x BF = 10.2 min x 1 = 10.2 min x BF = 10.2 min x 1 = 10.2 min
Step 3 - Calculate CT for Hydro-Tank Segment
•• Tank CT =Tank CT = ConcConc x Tx TCC x BF x BF •• Well Pump = 75 gpm (Peak Flow)Well Pump = 75 gpm (Peak Flow)•• 1,000 gal Hydro1,000 gal Hydro--Tank @ 500 gal Useable*Tank @ 500 gal Useable*•• BF for Tank = 0.3 (MOR Table 1, page 6)BF for Tank = 0.3 (MOR Table 1, page 6)•• TTCC = Tank Volume x Peak Flow = Tank Volume x Peak Flow •• TTCC = 1,000 gal / 75 gpm = 13.3 min= 1,000 gal / 75 gpm = 13.3 min•• TTCC x BF = 13.3 min x 0.3 x 50% = 2 minx BF = 13.3 min x 0.3 x 50% = 2 min
**DerateDerate Volume by 50%, See Table XXXVolume by 50%, See Table XXX
33
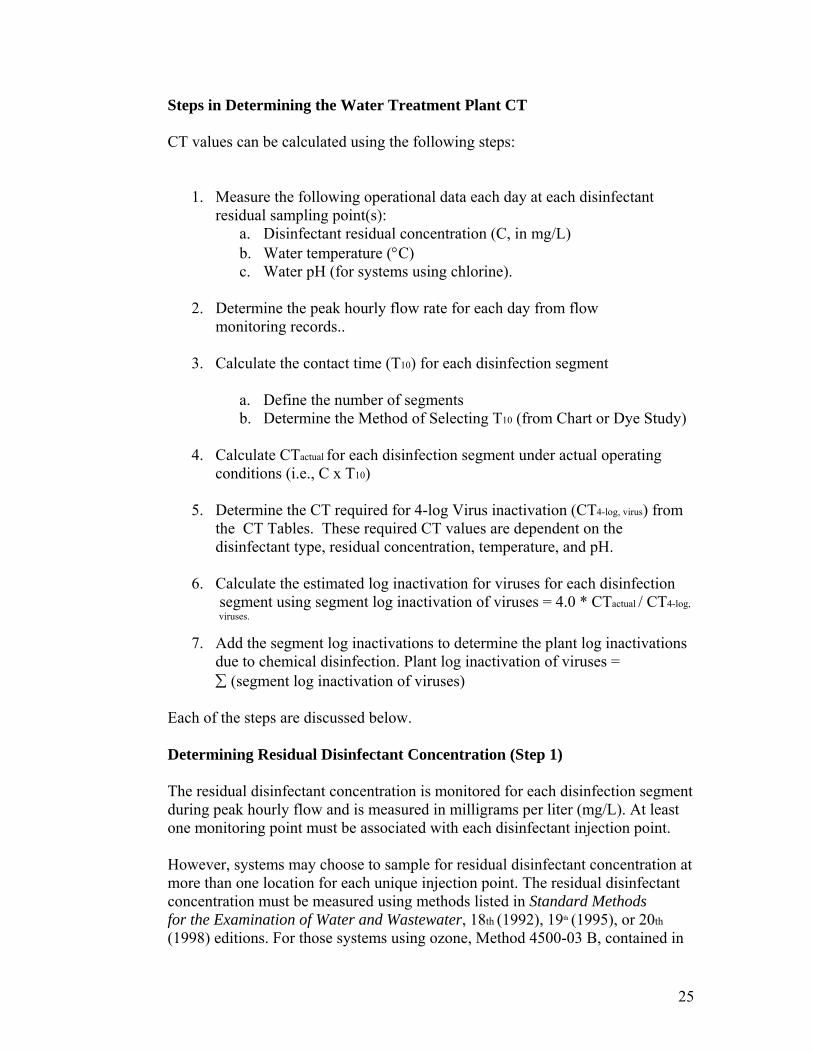
Step 4 Calculate CT Combined Segments
– Tank (TC x BF x 50%) = 2 min – Pipe (TC x BF) = 10.2 min – Total (TC x BF) = 12.2 min– Lowest CT Provided Before or at 1st Customer
During Peak Hourly Flow, mg-min/L– CT = Conc x (TC x BF) – CT = 1.2 mg/L x 12.2 min– CT = 14.6 mg-min /L
Step 5 – Compare to DEP CT requirements– Minimum CT Required, mg-min/L– Water = 21oC, 7.8 pH– MOR Table 2, page 6– CT Values for Inactivation of Viruses by Free Chlorine,
pH 6-9 (mg-min/L)
2.82.81.81.8
1.01.0
2121ooCC
2.62.61.61.6
1.01.0
2222ooCC
2.42.43.03.04.44.46.06.0441.41.42.02.03.03.04.04.033
1.01.01.01.02.02.03.03.022
2323ooCC2020ooCC1515ooCC1010ooCCInactivation Inactivation (Log)(Log)
• Minimum CT Required = 2.8 mg-min/L
The Log Removal is 14.6 = 5.2 > 1; Disinfection more than adequate!
2.8
34
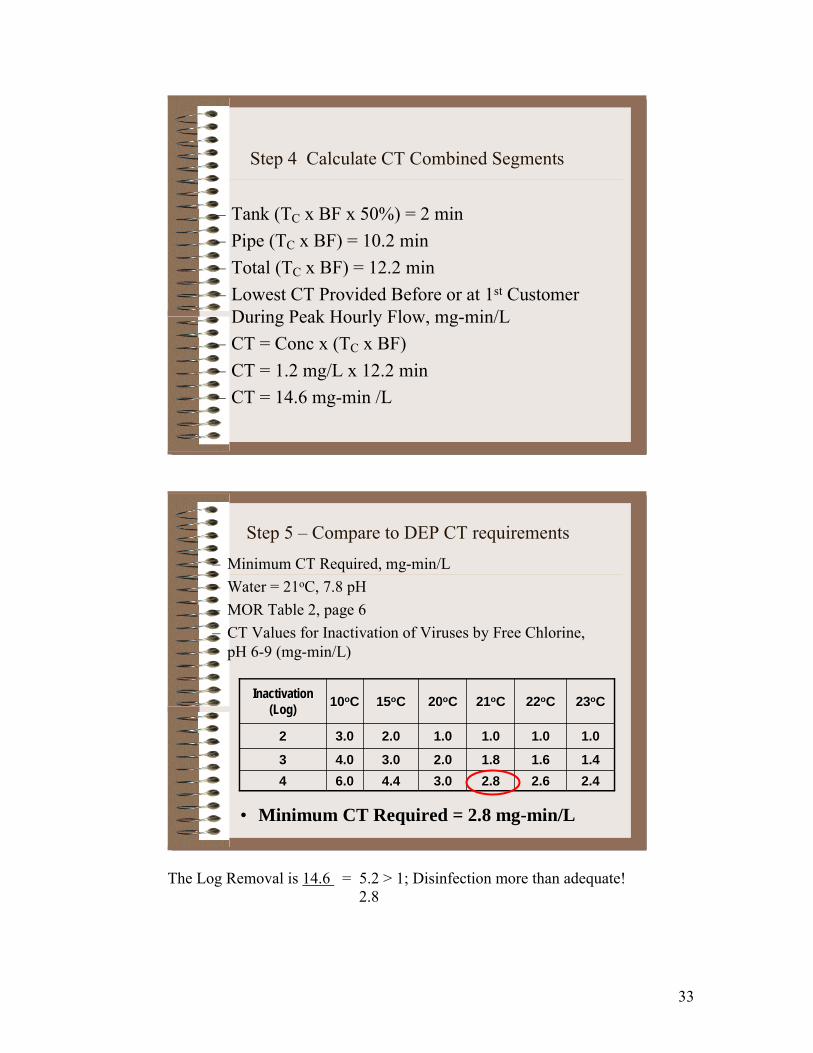
Example 2 – Same System Plant Switches to Chloramine
Example 2 – ChloraminesWell Considered Microbially Contaminated / Susceptible
7477.82014.612.21.2108,000
6967.82114.612.21.2108,000
Minimum CT
Required, mg-min/L
pH pf Water, if Applica
ble
Temp. of
Water, oC
Lowest CT Provided
Before or at 1st Customer During Peak Flow, mg-
min/L
Disinfectant Contact Time
(T) at C Measurement During Peak
Flow, minutes
Lowest Residual
Disinfectant Concentration (C) Before or
at 1st
Customer During Peak Flow, mg/L
Peak Flow, gpd
NO GOOD!NO GOOD!
Example 2 – The Use of Chloramine as a Primary Disinfectant The above example clearly indicates the problem with attempting to use chloramine as a primary disinfectant. In most all cases, it will be necessary to use free chlorine as the primary disinfectant in order to meet CT requirements.
35
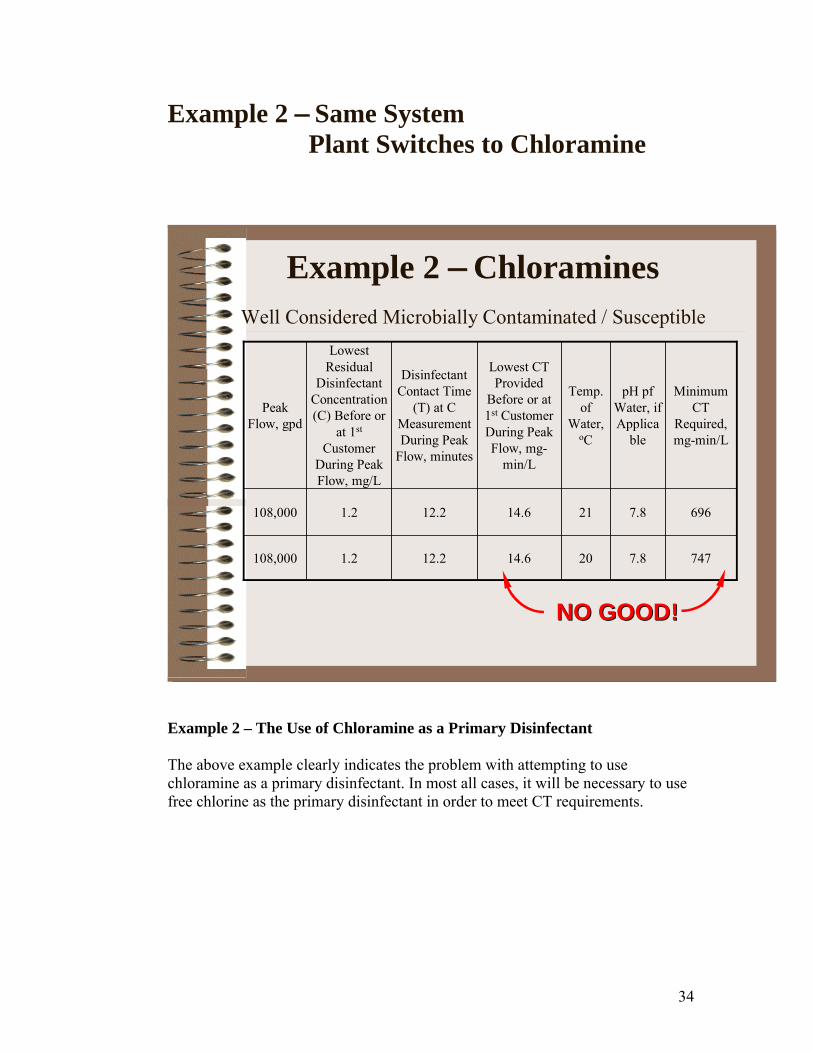
Example 3 Example 3 Basin Exposed to Open Atmosphere During Treatment
• Peak Flow Hourly Flow (Largest HSP) = 200 gpm• 2 ea.- Clarifiers = 10,000 gal; 3 Filters @ 5,000 ea.;
Storage Tank = 100,000 gal• Cl2 Residual = 0.8 mg/L• Water = 21oC, 7.8 pH• Note: Because WTP uses Filter include “Removal Credit”
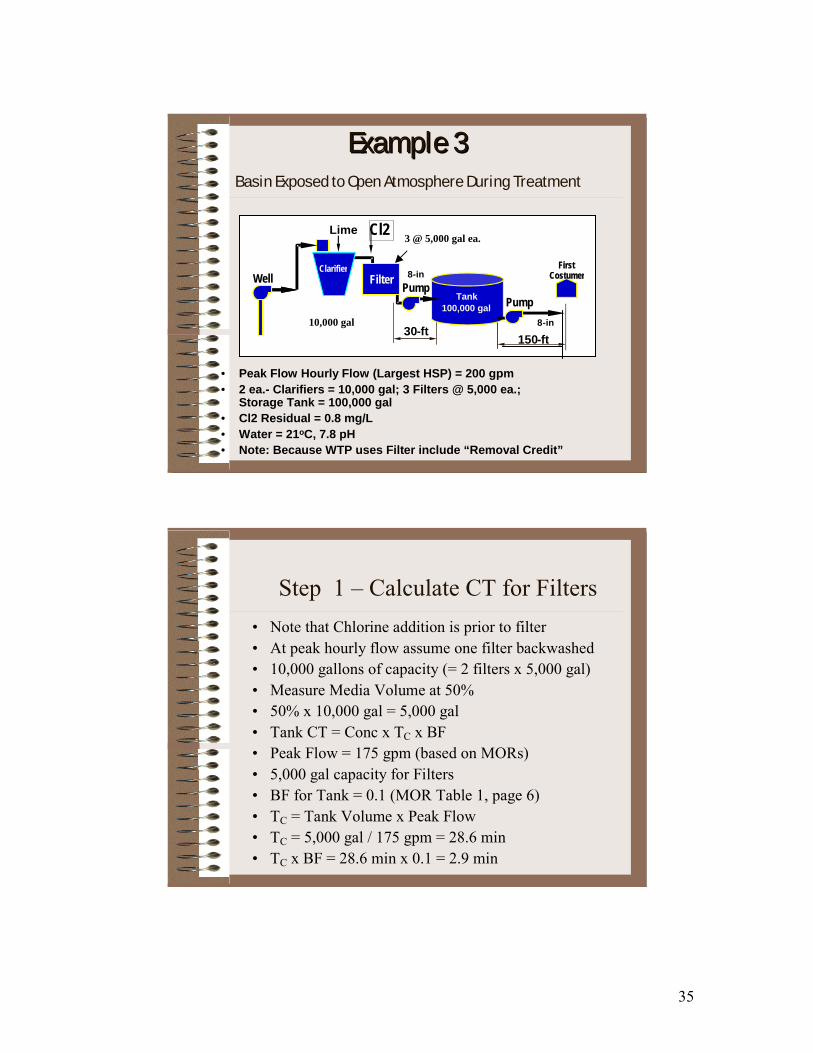
Step 1 – Calculate CT for Filters• Note that Chlorine addition is prior to filter• At peak hourly flow assume one filter backwashed• 10,000 gallons of capacity (= 2 filters x 5,000 gal)• Measure Media Volume at 50%• 50% x 10,000 gal = 5,000 gal • Tank CT = Conc x TC x BF • Peak Flow = 175 gpm (based on MORs)• 5,000 gal capacity for Filters• BF for Tank = 0.1 (MOR Table 1, page 6)• TC = Tank Volume x Peak Flow • TC = 5,000 gal / 175 gpm = 28.6 min• TC x BF = 28.6 min x 0.1 = 2.9 min
Well Well
Cl2
88--inin
88--ininFirst First
Costumer Costumer First First Costumer Costumer
150150--ftft3030--ftft
Lime
Tank100,000 gal
FilterClarifier
PumpPumpPumpPump
10,000 gal
3 @ 5,000 gal ea.
36
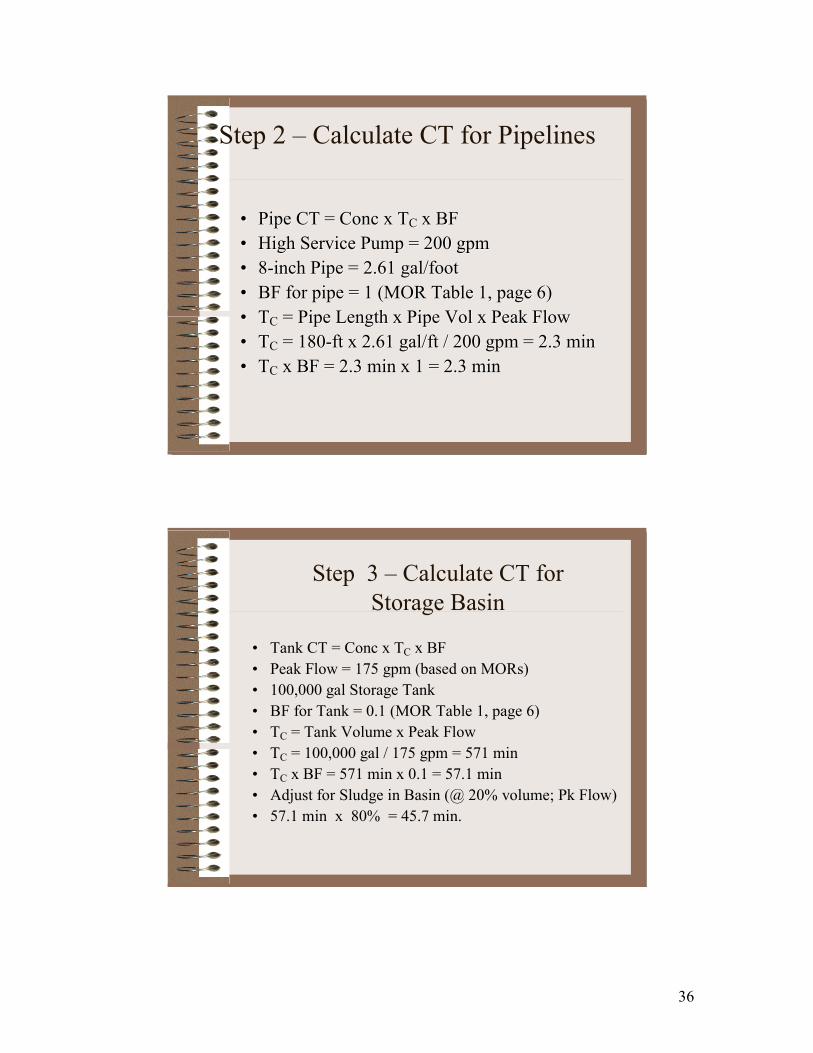
Step 2 – Calculate CT for Pipelines
•• Pipe CT =Pipe CT = ConcConc x Tx TCC x BF x BF •• High Service Pump = 200 gpmHigh Service Pump = 200 gpm•• 88--inch Pipe = 2.61 gal/footinch Pipe = 2.61 gal/foot•• BF for pipe = 1 (MOR Table 1, page 6)BF for pipe = 1 (MOR Table 1, page 6)•• TTCC = Pipe Length x Pipe = Pipe Length x Pipe VolVol x Peak Flow x Peak Flow •• TTCC = 180= 180--ft x 2.61 gal/ft / 200 gpm = 2.3 minft x 2.61 gal/ft / 200 gpm = 2.3 min•• TTCC x BF = 2.3 min x 1 =x BF = 2.3 min x 1 = 2.3 min 2.3 min
Step 3 – Calculate CT for Storage Basin
• Tank CT = Conc x TC x BF • Peak Flow = 175 gpm (based on MORs)• 100,000 gal Storage Tank• BF for Tank = 0.1 (MOR Table 1, page 6)• TC = Tank Volume x Peak Flow • TC = 100,000 gal / 175 gpm = 571 min• TC x BF = 571 min x 0.1 = 57.1 min• Adjust for Sludge in Basin (@ 20% volume; Pk Flow)• 57.1 min x 80% = 45.7 min.

37
Step 5 Compute Combined CT
– Filter TC x BF = 2.9 min– Tank TC x BF = 57.1 min – Pipe TC x BF = 2.3 min – Total TC x BF = 62.3 min– Lowest CT Provided Before or at 1st Customer During Peak
Flow, mg-min/L– CT = Conc x TC x BF– CT = 0.8 mg/L x 62.3 min– CT = 49.8 mg-min /L
Step 6 Step 6 –– Apply CT Apply CT Filter CreditFilter Credit
2-Log2-Log4-LogViruses1-Log2-Log3-LogGiardia Cysts
InactivationNeeded
RemovalCredit
SWTR Reqm’t
Pathogen
• If Your Systems Use Filtration Treatment, then a “Removal Credit” May be Applied
• Turbidity Settled Water Must be Less than 2 NTU Prior to Filtration
• Turbidity of Combined Filter Effluent Must be < 0.3 NTU in 95% Monthly Samples & Combined Plant < 1 NTU unit Measured Every 15 Minutes

38
Step 7 – Determine Log InactivationRequirements for 2 Log Reduction
– Minimum CT Required, mg-min/L– Water = 21oC, 7.8 pH– MOR Table 2, page 6– CT Values for Inactivation of Viruses by Free Chlorine, pH 6-
9 (mg-min/L)
2.81.8
1.0
21oC
2.61.6
1.0
22oC
2.43.04.46.041.42.03.04.03
1.01.02.03.02
23oC20oC15oC10oCInactivation (Log)
•Minimum CT Required = 1.0 mg-min/L
Example 3 Example 3 Exposed to Open Atmosphere During TreatmentExposed to Open Atmosphere During Treatment
1.01.07.87.8202047.547.559.459.40.80.8252,000252,000
1.01.07.87.8212147.547.559.459.40.80.8252,000252,000
Minimum CT Minimum CT Required, Required, mgmg--min/Lmin/L
pH pf pH pf Water, if Water, if ApplicablApplicabl
e e
Temp. Temp. of of
Water, Water, ooCC
Lowest CT Lowest CT Provided Provided
Before or at 1Before or at 1stst
Customer Customer During Peak During Peak
Flow, mgFlow, mg--min/Lmin/L
Disinfectant Disinfectant Contact Time Contact Time
(T) at C (T) at C Measurement Measurement During Peak During Peak
Flow, minutesFlow, minutes
Lowest Lowest Residual Residual
Disinfectant Disinfectant Concentration Concentration (C) Before or at (C) Before or at
11stst Customer Customer During Peak During Peak Flow, mg/LFlow, mg/L
Peak Flow, Peak Flow, gpdgpd
OKAY!OKAY!

39

40
Example 4Inactivation for Multiple Disinfection
Application Points & Multiple Disinfectants
Baffling Factor for Tanks: bf = 0.1; pipes = 1Flow through pipe and tanks measured with meterAll Pipe is 8” in diameter, Sections shown are pipeline lengths
WellWellCl2Cl2
First First CustomerCustomer
Sec 3 Sec 3 --10561056--ftft
Tank100,000 gal
PumpPump
Tank100,000 gal
Cl2Cl2 NH2ClNH2Cl
Sec 2 Sec 2 --26402640--ftftSec 1 Sec 1 -- 15841584--ftft
Peak Hourly Flow = 1.5 MGD
Step 1 – Assemble Known Data
Description Section 1 Section 2 Section 3Description Section 1 Section 2 Section 3
Length of PipeLength of Pipe 1,584 2,640 1,0561,584 2,640 1,056
Flow (MGD) Flow (MGD) PipePipe 1.51.5 2.02.0 2.02.0Tank Tank 2.0 2.02.0 2.0
Disinfectant Residuals (pH = 8.0; T = 20Disinfectant Residuals (pH = 8.0; T = 20o C)Cl2Cl2 0.1 0.1 0.2 0.2 NH2Cl NH2Cl 0.9 0.9

41
Step 2 – Calculate CT for Pipelines
Pipe CT = Conc x TC x BF 8-inch Pipe = 2.61 gal/foot• BF for pipe = 1 (MOR Table 1, page 6)• TC = Pipe Length x Pipe Vol x Peak hrly Flow
• TC1 = 1584-ft x 2.61 gal/ft / 1041 gpm = 4.0 min• TC2 = 2640-ft x 2.61 gal/ft / 1388 gpm = 5.0 min• TC2 = 1056-ft x 2.61 gal/ft / 1388 gpm = 2.0 min
Step 4 Step 4 –– Calculate CT for BasinsCalculate CT for Basins
–– Tank CT =Tank CT = ConcConc x Tx TCC x BF x BF –– 100,000 gal Storage Tank100,000 gal Storage Tank–– BF for Tank = 0.1 (MOR Table 1, page 6)BF for Tank = 0.1 (MOR Table 1, page 6)–– TTCC = (Tank Volume / Peak Flow) x BF= (Tank Volume / Peak Flow) x BF
•• TTC1C1 == 100,000 gal / 1,388 100,000 gal / 1,388 gpm gpm x 0.1 = 7.2 minx 0.1 = 7.2 min•• TTC2C2 == 100,000 gal / 1,388 100,000 gal / 1,388 gpm gpm x 0.1 = 7.2 minx 0.1 = 7.2 min

42

43
c. Chlorine dioxide - less stable than chlorine or chloramine, therefore, may not be able to maintain disinfectant residual required throughout the distribution system. If your system meets the inactivation log for Giardia cysts, then the system will not automatically meet the SWTR for viruses. This fact is demonstrated in Table 6. In this example you need to use the CT Value required for viruses instead of the CT Value required for Giardia because that number is higher. If the plant is considered “properly” operated, then you calculate the required CT Value for Giardia cysts because all those numbers are higher. TABLE 6. Example of a plant using chlorine dioxide as a disinfectant. Also assume pH is 8 and water temperature is 5° C or 41° F. PATHOGENS REQUIRED INACTIVATION CT REQUIRED Giardia cysts 3-Log 26 Viruses 4-Log 33.4 d. Ozone - extremely reactive and dissipates quickly after application. If your system meets the inactivation _____________________________________________________________________________________________ F.1.- 7 CT Values - Calculating and Reporting Kentucky Department for Environmental Protection log for Giardia cysts, then the system will not automatically meet the SWTR for viruses. This fact is demonstrated in Table 7. As a result you use the higher CT Value required after comparing the CT Value required for Giardia cysts to the CT Value required for viruses. TABLE 7. Example of a “properly” operated plant using ozone as a disinfectant. Also assume pH is 8 and water temperature is less than 10° C (50° F). PATHOGENS REQUIRED INACTIVATION CT REQUIRED Giardia cysts 1-Log 0.48
44
Viruses 2-Log 0.5 e. Ultraviolet light (UV) - not considered effective for inactivating Giardia cysts. f. Combination of disinfectants - for example, a system may chlorinate at the intake and feed ammonia later to form chloramines. 2. Water temperature Higher CT Values are required in cold water to get the same level of Log-reduction as in warmer temperatures. As you can see in Figure 2, the warmer the temperature the lower the CT requirement. 3. pH Figure 2 demonstrates that chlorinated water at a higher pH requires a higher required CT Value. For other disinfectants, pH is not a factor except for outside the normal operating range of 6-9 when chloramines are utilized. _____________________________________________________________________________________________ F.1.- 8 CT Values - Calculating and Reporting CT (mg/l-min)
pH TEMPERATURE (Centigrade) FIGURE 2. Required 1-LOG CT Values at Chlorine Residual = 1.0 mg/l _____________________________________________________________________________________________ F.1.- 9 CT Values - Calculating and Reporting Kentucky Department for Environmental Protection HOW DO YOU CALCULATE CT VALUES? First, you must know the following: 1. Peak flow rate (gallons per minute or gpm) - If your raw water flow rate is different from the finished water flow rate, you must use the different rate where appropriate. Another option is to use the higher value to simulate your worst condition possible. 2. Water temperature (Centigrade or Celsius) - If your temperature is measured in degrees (° F) Fahrenheit, then use the conversion equation: Centigrade = (°F - 32) / 1.8 3. pH 4. Disinfectant residual (milligrams per liter or mg/L) 5. Capacity of all detention facilities (gallons or gal) - You are allowed to include all storage tanks and piping up to the first customer, but after the first injection point of the disinfectant. HELPFUL HINTS

45
The following helpful hints located in this section are intended to provide you with some guidance in the CT Value process. They are designed for the goal of protecting the public as much as possible. Before actually trying to tackle the CT calculations, you should draw a schematic or flow chart of your system. Next label the known parameters such as pipe diameters and the dimensions of sedimentation basins. Label your disinfection injection points as well as disinfection residual sampling points. Use your schematic to make a daily worksheet for your calculations. You should use the low level for your clearwell volume for the worst case of the day. You should also note the sludge depth in any unit, such as sedimentation basin, and subtract that volume from the total volume calculated. Another hint is to study the units or components separately. Your calculated CT Values may be higher in this case. This fact means that your system may meet the SWTR compliance requirements easier. Always calculate for the conservative side because if you can prove your system meets the SWTR under the worst conditions, then it should meet the rule at all other times during that individual day. For example, you take a chlorine residual reading and it is somewhere between 0.6 mg/L and 0.8 mg/L. When you look up the required CT Value from the table in Appendix A, you should look up the CT Value required for 0.8 mg/L because that required value is higher than the CT Value required for the 0.6 mg/L. For your calculated CT Value you should use the lesser chlorine residual to be on the conservative side. Suppose your system uses chlorine as a disinfectant. You take the water temperature and conclude that it is 8° C. This temperature puts you between the 5° C and the 10° C chart in Appendix A. To be on the conservative side, you should always use the higher required CT Value. In the case of temperature, the higher CT Value occurs at lower temperatures as is shown in Figure 2. Therefore, use the chart for 5° C. Again suppose your system uses chlorine as a disinfectant. You measured the pH and determine that it is about 6.7. In the case of pH, the higher the pH the higher the CT Value required. This situation is displayed in figure 2 as well. Therefore, in this case, you should us the CT chart in Appendix A that is closest to 6.7 but not lower than 6.7. If you wanted to be exact in your calculations for the three previous examples, you may use a method called linear interpolation.

46
_____________________________________________________________________________________________ F.1.- 10 CT Values - Calculating and Reporting Kentucky Department for Environmental Protection CT VALUE PROCEDURAL STEPS 1. Draw schematic. 2. Label schematic with known and unknowns. 3. Determine the CT Value required for you system. a. SWTR goals are shown in Table 2. b. Determine the plant’s Log-removal credit (“properly” operated?) c. Subtract the Log-removal credit from the SWTR goal. This number is the Log-inactivation goal that must be met by your system. 4. Calculate the capacities of all the detention facilities. 5. Determine the baffling factor (BF) of each unit using Table 3. 6. Examine each unit or component. a. Calculate detention time (DT). b. Calculate the CT Value. c. Look up the required CT Value. d. Calculate the individual CT Value ratios. This number is determined by dividing the calculated CT Value by the required CT Value. 7. Total the CT Value ratios. 8. Compare the total CT Value ratio to the Log-inactivation goal (the number found in step 3). a. If the Log-inactivation goal is higher, your system does not meet the SWTR requirements. b. If the CT Value ratio is higher, your system does meet the SWTR requirements. c. If the CT Value ratio is equal to the CT Value required, then your system is meeting the SWTR requirements BUT just barely. You are leaving no room for error. _____________________________________________________________________________________________ F.1.- 11 CT Values - Calculating and Reporting Kentucky Department for Environmental Protection EXAMPLE PROBLEM GIVEN INFORMATION Your water source is 1 mile from the water treatment plant. Gaseous chlorine is injected at the intake. The raw water flow rate is 695 gpm. The pH is measured at 8. The water temperature is 0.5° C or 32.9° F. Your water

47
treatment plant uses complete treatment and is classified as “properly” operated. The chlorine residual is measured after the filter at 0.6 mg/L. Gaseous chlorine is injected again after the filter. The chlorine residual is measured again after the clearwell and is found to be 0.8 mg/L. The finished water flow rate is 670 gpm. _____________________________________________________________________________________________ F.1.- 12 CT Values - Calculating and Reporting Kentucky Department for Environmental Protection SYSTEM DIAGRAM Lake Blue Chlorine injection point Pump capacity = 695 gpm 8” Transmission main = 1 mile Rapid Mix Flocculators: Poor Baffling Capacity = 20,900 gal Sedimentation Basins (Clarifiers): Average Baffling Capacity = 166,700 gal Chlorine injection point Filters Chlorine residual = 0.6 mg/l Clearwell: Unbaffled Total Capacity = 150,000 gal Normal low level 1/3 full Chlorine residual = 0.8 mg/l Pump capacity = 670 gpm First Customer _____________________________________________________________________________________________ F.1.- 13 CT Values - Calculating and Reporting Kentucky Department for Environmental Protection CT VALUE PROCEDURAL STEPS 1. Draw schematic (see Figure 3). 2. Label schematic with known and unknowns (see Figure 3). 3. Determine the CT Value required for your system. a. SWTR goals, as shown Table 2. b. Determine the plant’s Log-removal credit (“properly” operated?) c. Subtract the Log-removal credit from the SWTR goal. This number is the Loginactivation goal that must be met by your system as shown below. PATHOGEN / SWTR GOALS - REMOVAL CREDIT = INACTIVATION

48
Giardia cysts / 3-Log - 2-Log = 1-Log 4. Calculate the capacities of all the detention facilities. NOTE: Remember, you can only calculate the capacities of all detention facilities after the initial disinfection injection point and only up to the first customer. a. Transmission main: V = ¶ x r2 x L where: V is the water volume (cu ft) ¶ is the constant (3.142) r is the radius (ft) L is the length (ft) Pipe radius: pipe diameter / 2 = 8 in/2 - 4 in Convert to feet: 4 in x 1 ft/12 in = = 0.333 ft Length of pipe: 1 mile = 5,280 ft Calculate volume: V = 3.142 x (0.333 ft) 2 x 5,280 ft V = 1,843 cu ft Convert to gallons: 1 cu ft = 7.48 gal V = 1,843 cu ft x 7.48 gal V = 13,786 gal b. Flash mix: For this example the volume for this unit is not calculated because by Kentucky’s design criteria the time through this unit cannot exceed one (1) minute. This time is not a factor in most cases. c. Flocculator: Given as 20,900 gal d. Clarifier: Given as 1566,700 gal e. Filter: For this example the volume in the filter is not calculated because the time through this unit usually does not contribute much in the _____________________________________________________________________________________________ F.1.- 14 CT Values - Calculating and Reporting Kentucky Department for Environmental Protection calculated total CT Value. If you wish to utilize this unit in your calculations, filters are considered to generally have superior baffling conditions. The theoretical value for filters can be obtained by subtracting the volume of the filter media, gravel, and underdrains from the unit’s total volume. Next divide the volume by the flow rate, and use the superior factor of 0.7. You should also measure your disinfectant residual after the unit. f. Clearwell: Give as 150,000 gal total but the low level is only 1/3 of the clearwell capacity. The usable capacity is 50,000 gal. 5. Determine the baffling factor (BF) for each unit using Table 3.
49
Reference diagrams are located in Appendix B. For this example, the values for the detention facilities as determined in step 4 are compiled in Table 8. Table 8. Detention Facilities UNIT CAPACITY (gal) BAFFLING FACTOR (BF) 1. Transmission Main 13.786 1.0 2. flocculator 20,900 0.3 3. Clarifier 166,700 0.5 4. Clearwell 50,000 0.1 6. Examine each unit or component. a. Calculate detention time (DT). Detention time is calculated by taking the capacity of the unit (gal) and dividing it by the flow rate (gpm). 1. Transmission main: DT = 13,786 gal / 695 gpm DT = 19.836 min 2. Flocculator: DT = 20,900 gal / 695 gpm DT 30.072 min 3. Clarifier: DT = 166,700 gal / 695 gpm DT = 239.856 min 4. Clearwell: DT = 50,000 gal / 670 gpm DT = 74.627 min b. Calculate the CT Value (CT). The calculated CT Value is obtained by multiplying the concentration of disinfectant (mg/L) by the detention time (min) by the baffling factor. _____________________________________________________________________________________________ F.1.- 15 CT Values - Calculating and Reporting Kentucky Department for Environmental Protection 1. Transmission main: CT = 0.6 mg/L x 19.836 min x 1.0 CT = 11.902 mg/L-min 2. Flocculator: CT = 0.6 mg/L x 30.072 min x 0.3 CT = 5.413 mg/L-min 3. Clarifier: CT = 0.6 mg/L x 239.856 min x 0.5 CT = 71.957 mg/L-min 4. Clearwell: CT = 0.8 mg/L x 74.627 min x 0.1 CT = 5.970 mg/L-min c. Look up the required CT Value from Appendix A. Instructions are provided in Appendix A. 1. Transmission main: req. CT = 95 mg/L-min 2. Flocculator: req. CT = 95 mg/L-min 3. Clarifier: req. CT = 95 mg/L-min 4. Clearwell: req. CT = 98 mg/L-min d. Calculate the individual CT Value ratios. This number is determined by dividing the calculated CT Value by the required CT Value. 1. Transmission main:

50
ratio = 11.902 mg/L-min / 95 mg/L-min ratio = 0.125 2. Flocculator: ratio = 5.413 mg/L-min / 95 mg/L-min ratio = 0.057 3. Clarifier: ratio = 71.957 mg/L-min / 95 mg/L-min ratio = 0.757 4. Clearwell: ratio = 5.970 mg/L-min / 98 mg/L-min ratio = 0.061 7. Total the CT Value ratios. 1. Transmission main: 0.125 2. Flocculator: 0.057 3. Clarifier: 0.757 4. Clearwell: 0.061 Total: 1.000 8. Compare the total CT Value ratio to the Log-inactivation goal (the number found in step 3). STEP 3 required 1-log inactivation. a. If the Log-inactivation goal is higher, your system _____________________________________________________________________________________________ F.1.- 16 CT Values - Calculating and Reporting Kentucky Department for Environmental Protection does not meet the SWTR requirements. b. If the CT Value ratio is higher, your system does meet the SWTR requirements. c. If the CT Value ratio is equal to the Log-inactivation required, then your system is meeting the SWTR requirements BUT just barely. CONCLUSION FOR THIS EXAMPLE Since the plant was classified as “properly” operated on this particular day, it was given a 2-Log removal credit. From the CT calculations for the 1-Log inactivation the plant barely meets the SWTR requirements for this particular day, BUT the treatment techniques utilized by this system leave no room for error. For example, suppose some of the plant’s equipment were out of order. The plant could not then be considered “properly” operated. Thereby, the Log-inactivation required would have been greater. Assuming that all other conditions remained the same, this plant would not have been in compliance with the SWTR because the CT Value ratio would have been less than the Log-inactivation required.

51
For another scenario, assume the plant is “properly” operated. The finished water main from the filter to the clearwell has been tapped to provide potable water to the water treatment plant itself. The first customer now becomes the water treatment plant. In calculating the CT Values for this situation you cannot include any portion of the clearwell capacity or any other unit that is after the plant tap for your Log-inactivation. Therefore, your total CT ratio for your plant is as follows: 1. Transmission main: 0.125 2. Flocculator: 0.057 3. Clarifier: 0.757 4. Clearwell: 0.000 Total: 0.939 This total indicated that you system did not meet the SWTR requirements on this day. OTHER EXAMPLES Lets look at another example. You use chlorine as a disinfectant and your plant has complete treatment and is “properly” operated. The pH is 8.0 and the temperature is 0.5° C (32.9° F). You have completed your CT Value calculations and your comparison. You have determined that your system is not meeting the SWTR requirements. As a result, you decide to increase your chlorine concentration through your system. Figure 4 demonstrates as you increase the amount of chlorine through your system, that it does not effectively help you to meet the SWTR requirements. This fact is because as you increase the chlorine residual, the required CT Value also increases. In order for you to effectively meet the SWTR requirements you could consider adding or changing the baffling through the unit. As Figure 4 also shows, the calculated CT Values for the clearwell example approach the overall required CT Value as you change the baffling factor not the chlorine concentration. __________________________________________________________________________ HOW TO USE THE CT VALUE REQUIRED TABLES CHLORINE AS THE DISINFECTANT 1. You only need to look up Tables A-1 through A-6 (for Giardia cysts) in the Appendix. 2. Look up the Table for your water temperature. Be sure that you pay close attention to the position of the decimal point. It is easy to look up 0.5° C rather than 5.0° C. 3. On that Table locate the chart for the pH in question. 4. Go down the left column until you locate the correct chlorine concentration.

52
5. Next look across that row from left to right until you are in the column with the correct Log-reduction. 6. The number located there is your CT Value required. Record it. CHLORAMINE AS THE DISINFECTANT 1. For Giardia cysts, look up Table A-12 in this Appendix. 2. Look down the first column and find the correct temperature. 3. Next look across that row from left to right until you are in the column with the correct Log-reduction. 4. The number located there is your CT Value required for Giardia. Record it. 5. For viruses, look up Table A-13 in the Appendix. 6. Look down the first column and find the correct temperature. 7. Next look across that row from left to right until you are in the column with the correct Log-reduction. 8. The number located there is your CT Value required for viruses. Record it. 9. Compare the number recorded in step 4 to the number recorded in step 8. Use the higher number as your CT Value required. CHLORINE DIOXIDE AS THE DISINFECTANT 1. For Giardia cysts, look up Table A-8 in this Appendix. 2. Look down the first column and find the correct temperature. 3. Next look across that row from left to right until you are in the column with ________________________________________________________________________________________________ F.1.-22 C T Values - Calculating and Reporting Kentucky Department for Environmental Protection the correct Log-reduction. 4. The number located there is your CT Value required for Giardia. Record it. 5. For viruses, look up Table A-9 in this Appendix. 6. Look down the first column and find the correct temperature. 7. Next look across that row from left to right until you are in the column with the correct Log-reduction. 8. The number located there is your CT Value required for viruses. Record it. 9. Compare the number recorded in step 4 to the number recorded in step 8. Use the higher number as your CT Value required. OZONE AS THE DISINFECTANT 1. Look up Table A-10 in this Appendix. 2. Look down the first column and find the correct temperature. 3. Next look across that row from left to right until you are in the column with the correct Log-reduction. 4. The number located there is your CT Value required for Giardia. Record it. 5. For viruses, look up Table A-11 in this Appendix. 6. Look down the first column and find the correct temperature.

53
7. Next look across that row from left to right until you are in the column with the correct Log-reduction. 8. The number located there is your CT Value required for viruses. Record it. 9. Compare the number recorded in step 4 to the number recorded in step 8. Use the higher number as your CT Value required.
54
Appendix A - Glossary of Terms Used in Document abandoned well. A well the use of which has been permanently discontinued or which is in such a state of disrepair that it cannot be used for its intended purpose or for observation purposes. annulus or annular space.Any artificially created void existing between a well casing or liner pipe and a bore hole wall or between two casings or between tubing and casing or liner pipe. aquifer. A geologic formation, group of formations, or part of a formation capable of yielding a significant amount of ground water to wells, springs or surface water. baffle. A flat board or plate, deflector, guide or similar device constructed or placed in flowing water or slurry systems to cause more uniform flow velocities, to absorb energy, and to divert, guide, or agitate liquids (water, chemical solutions, slurry). baffling factor (BF). The ratio of the actual contact time to the theoretical detention time (TDT.) bentonite. A pumpable grouting material used for plugging or sealing water wells, consisting of a high solid sodium montmorillonite. The grout shall yield solids ranging from 20 to 30 percent, with a minimum density equal to or greater than 9.4 pounds per gallon, and a permeability of approximately 1x10⁻⁷ centimeters per second or less, or shall be dry non-treated, high swelling sodium montmorillonite. High swelling is defined as having a minimum swell index of 18 cubic centimeters as determined by ASTM standard D-5890-95. clarifier. A large circular or rectangular tank or basin in which water is held for a period of time, during which the heavier suspended solids settle to the bottom by gravity. Clarifiers are also called settling basins and sedimentation basins. For CT calculations the detention area must be reduced by the amount of solids stored in the basin. clearwell. A reservoir for the storage of filtered water with sufficient capacity to prevent the need to vary the filtration rate in response to short-term changes in customer demand. Also used to provide chlorine contact time for disinfection. For CT calculations, the water volume under peak hourly flow conditions must be used to determine the actual contact time in the basin. coagulant. A chemical added to water that has suspended and colloidal solids to destabilize particles and adhere to one another allowing subsequent floc formation and removal by sedimentation, filtration, or both. coagulation. A process using coagulant chemicals and mixing by which colloidal and suspended materials are destabilized and agglomerated into flocs. community water system (CWS). A public water system which serves at least 15 service connections used by year-round residents or regularly serves at least 25 year-round residents. conventional filtration treatment. A series of processes including coagulation, flocculation, sedimentation, and filtration resulting in substantial particulate removal. Cryptosporidium. A disease-causing protozoan widely found in surface water sources. Cryptosporidium is spread by the fecal-oral route as a dormant oocyst from human and animal feces. In its dormant stage, Cryptosporidium is housed in a very small, hard-shelled oocyst form that is resistant to chlorine and chloramine disinfectants. When water containing these oocysts is ingested, the protozoan may cause a severe gastrointestinal

55
disease called cryptosporidiosis. CT or CTcalc. The product of “residual disinfectant concentration” (C) in mg/l determined before or at the first customer, and the corresponding “disinfectant contact time” (T) in minutes, i.e., “C” x “T”. If a public water system applies disinfectants at more than one point prior to the first customer, it must determine the CT of each disinfectant sequence before or at the first customer to determine the total percent inactivation or “total inactivation ratio”. In determining the total inactivation ratio, the public water system must determine the residual disinfectant concentration of each disinfection sequence and corresponding contact time before any subsequent disinfection application point(s). “CT99.99” is the CT value required for 99.99 percent (4-log) inactivation of viruses. CTcalc/CT99..99 is the inactivation ratio. The sum of the inactivation ratios, or total inactivation ratio shown as Σ [(CTcalc) / (CT99.9.9)] is calculated by adding together the inactivation ratio for each disinfection sequence or segment. A total inactivation ratio equal to or greater than 1.0 is assumed to provide a 4-log inactivation of viruses for designated ground water systems that fail E coli requirements or have treatment units or tanks open to the atmosphere. detention time. The average length of time a drop of water or a suspended particle remains in a tank or chamber. Mathematically, it may be determined by dividing the volume of water in the tank by the flow rate through the tank. direct filtration. A a series of processes including coagulation and filtration, but excluding sedimentation, and resulting in substantial particulate removal. disinfectant. Any oxidant, including but not limited to chlorine, chlorine dioxide, chloramines, and ozone added to water in any part of the treatment or distribution process, that is intended to kill or inactivate pathogenic microorganisms including viruses. disinfectant contact time. The time in minutes that it takes for water to move from the point of disinfectant application or the previous point of disinfectant residual measurement to a point before or at the point where residual disinfectant concentration (“C”) is measured. Where only one “C” is measured, “T” is the time in minutes that it takes for water to move from the point of disinfectant application to a point before or at where residual disinfectant concentration (“C”) is measured. Where more than one “C” is measured, “T” is (a) for the first measurement of “C”, the time in minutes that it takes for water to move from the first or only point of disinfectant application to a point before or at the point where the first “C” is measured and (b) for subsequent measurements of “C”, the time in minutes that it takes for water to move from the previous “C” measurement point to the “C” measurement point for which the particular “T” is being calculated. Disinfectant contact time in pipelines must be calculated based on “plug flow” by dividing the internal volume of the pipe by the maximum hourly flow rate through that pipe. Disinfectant contact time within mixing basins and storage reservoirs must be determined by tracer studies or an equivalent demonstration. disinfection. A process which inactivates pathogenic organisms including viruses in water by chemical oxidants or equivalent agents. disinfection byproduct precursors. Substances that can be converted into disinfection

56
byproducts during disinfection by the reaction of chlorine with organic material. Typically, most of these precursors are constituents of natural organic matter (NOM). In addition, the bromide ion (Br-) is a precursor material. disinfection byproducts (DBPs). Inorganic and organic compounds formed by the reaction of the disinfectant, natural organic matter, and the bromide ion during water disinfection processes. Regulated DBPs include trihalomethanes, haloacetic acids, bromate, and chlorite. disinfection segment. A section of the water treatment system beginning at one disinfectant injection or monitoring point and ending at the next disinfectant injection or monitoring point. effluent. Water or some other liquid that is raw, partially or completely treated that is flowing from a reservoir, basin, treatment process or treatment plant. enhanced coagulation. As defined in 40 CFR 141.2, the addition of sufficient coagulant for improved removal of disinfection byproduct precursors by conventional filtration treatment. enhanced softening. As defined in 40 CFR 141.2, the improved removal of disinfection byproduct precursors by precipitative softening. filtration. A process for removing particulate matter from water by passage through porous media. The process may consist of sedimentation, absorption, staining and adsorption. finished water. Water that has passed through a water treatment plant such that all the treatment processes are completed or “finished” and ready to be delivered to consumers. Also called product water. flocculation. A process to enhance agglomeration or collection of smaller floc particles into larger, more easily settleable particles through gentle stirring by hydraulic or mechanical means. Giardia lamblia. Flagellated protozoan found in contaminated surface water, which are shed during its cyst-stage with the feces of man and animals. When water containing these cysts is ingested, the protozoan causes a severe gastrointestinal disease called giardiasis. ground water under the direct influence of surface water (GWUDI). As defined in 40 CFR 141.2, any water beneath the surface of the ground with significant occurrence of insects or other macroorganisms, algae, or large-diameter pathogens such as Giardia lamblia or Cryptosporidium, or significant and relatively rapid shifts in water characteristics such as turbidity, temperature, conductivity, or pH which closely correlate to climatological or surface water conditions. Direct influence must be determined for individual sources in accordance with criteria established by the DEP. haloacetic acids five (HAA5). The sum of the concentrations in milligrams per liter of the haloacetic acid compounds (monochloroacetic acid, dichloroacetic acid, trichloroacetic acid, monobromoacetic acid, and dibromoacetic acid), rounded to two significant figures after addition. influent water. Raw water plus recycle streams. interpolation. A technique used to determine values that fall between the marked intervals on a scale.

57
liner. A metallic or nonmetallic pipe which is installed either within the outer casing to improve, repair, or protect the outer casing or below the outer casing to seal off caving material which may be encountered in the open hole of the well. log inactivation. The percentage of microorganisms inactivated through disinfection by a given process. log reduction. The percentage of microorganisms reduced through log removal added to the log inactivation. One log reduction means that 90% of the microorganisms are removed or inactivated. Two log corresponds to 99%, three log is 99.9% and four log corresponds to 99.99%. log removal. The percentage of microorganisms physically removed by a given process. maximum contaminant level (MCL). As defined in 40 CFR 141.2, the maximum permissible level of a contaminant in water which is delivered to any user of a public water system. membrane filtration. A filtration process (e.g., reverse osmosis, nanofiltration, ultrafiltration, and microfiltration) using tubular or spiral-wound elements that exhibits the ability to mechanically separate water from other ions and solids by creating a pressure differential and flow across a membrane. micrograms per liter (⎧g/L). One microgram of a substance dissolved in each liter of water. This unit is equal to parts per billion (ppb) since one liter of water is equal in weight to one billion micrograms. micron. A unit of length equal to one micrometer (⎧m). One millionth of a meter or one thousandth of a millimeter. One micron equals 0.00004 of an inch. milligrams per liter (mg/L). A measure of concentration of a dissolved substance. A concentration of one mg/L means that one milligram of a substance is dissolved in each liter of water. For practical purposes, this unit is equal to parts per million (ppm) since one liter of water is equal in weight to one million milligrams. Thus a liter of water containing 10 milligrams of calcium has 10 parts of calcium per one million parts of water, or 10 parts per million (10 ppm). neat cement grout. A mixture consisting of water and Portland cement (American Concrete Institute Type I or American Concrete Institute Type III), or other approved types of cement and acceptable amounts of those additives approved for use in cement grouts by the permitting authority. Nominal. Those standard sizes of pipe from one-eighth inch to 12 inches, specified on the inside diameter, which may be less than or greater than the number indicated. When referred to the grouting annulus, nominal means either the available void thickness between telescoped casing varying less than 0.20 inches below standard where one inch of grout is required and 0.35 inches below standard where two inches of grout is required, or the average available void thickness between the borehole and outside wall of the casing. non-community water system (NCWS). As defined in 40 CFR 141.2, a public water system that is not a community water system. A non-community water system is either a “transient non-community water system (TWS)” or a non-transient non-community water system (NTNCWS).” non-transient non-community water system (NTNCWS). As defined in 40 CFR 141.2, a public water system that is not a community water system and that regularly serves at least 25 of the same persons over six months per year.
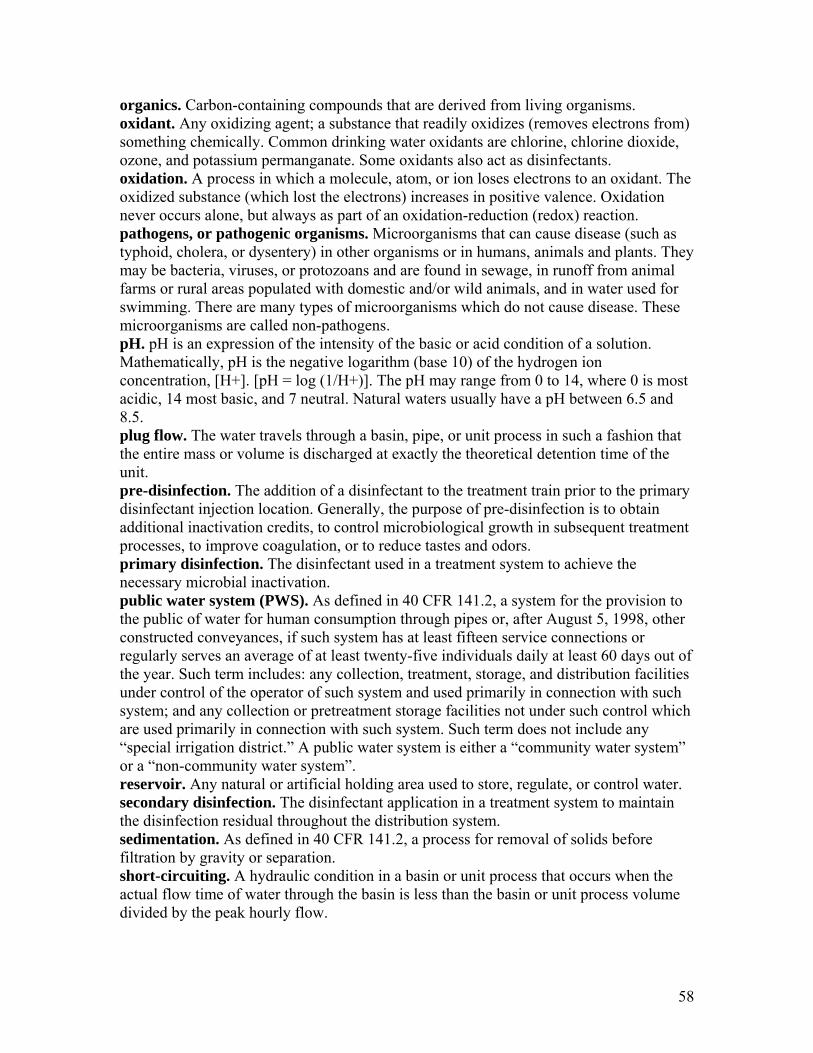
58
organics. Carbon-containing compounds that are derived from living organisms. oxidant. Any oxidizing agent; a substance that readily oxidizes (removes electrons from) something chemically. Common drinking water oxidants are chlorine, chlorine dioxide, ozone, and potassium permanganate. Some oxidants also act as disinfectants. oxidation. A process in which a molecule, atom, or ion loses electrons to an oxidant. The oxidized substance (which lost the electrons) increases in positive valence. Oxidation never occurs alone, but always as part of an oxidation-reduction (redox) reaction. pathogens, or pathogenic organisms. Microorganisms that can cause disease (such as typhoid, cholera, or dysentery) in other organisms or in humans, animals and plants. They may be bacteria, viruses, or protozoans and are found in sewage, in runoff from animal farms or rural areas populated with domestic and/or wild animals, and in water used for swimming. There are many types of microorganisms which do not cause disease. These microorganisms are called non-pathogens. pH. pH is an expression of the intensity of the basic or acid condition of a solution. Mathematically, pH is the negative logarithm (base 10) of the hydrogen ion concentration, [H+]. [pH = log (1/H+)]. The pH may range from 0 to 14, where 0 is most acidic, 14 most basic, and 7 neutral. Natural waters usually have a pH between 6.5 and 8.5. plug flow. The water travels through a basin, pipe, or unit process in such a fashion that the entire mass or volume is discharged at exactly the theoretical detention time of the unit. pre-disinfection. The addition of a disinfectant to the treatment train prior to the primary disinfectant injection location. Generally, the purpose of pre-disinfection is to obtain additional inactivation credits, to control microbiological growth in subsequent treatment processes, to improve coagulation, or to reduce tastes and odors. primary disinfection. The disinfectant used in a treatment system to achieve the necessary microbial inactivation. public water system (PWS). As defined in 40 CFR 141.2, a system for the provision to the public of water for human consumption through pipes or, after August 5, 1998, other constructed conveyances, if such system has at least fifteen service connections or regularly serves an average of at least twenty-five individuals daily at least 60 days out of the year. Such term includes: any collection, treatment, storage, and distribution facilities under control of the operator of such system and used primarily in connection with such system; and any collection or pretreatment storage facilities not under such control which are used primarily in connection with such system. Such term does not include any “special irrigation district.” A public water system is either a “community water system” or a “non-community water system”. reservoir. Any natural or artificial holding area used to store, regulate, or control water. secondary disinfection. The disinfectant application in a treatment system to maintain the disinfection residual throughout the distribution system. sedimentation. As defined in 40 CFR 141.2, a process for removal of solids before filtration by gravity or separation. short-circuiting. A hydraulic condition in a basin or unit process that occurs when the actual flow time of water through the basin is less than the basin or unit process volume divided by the peak hourly flow.

59
surface water. As defined in 40 CFR 141.2, all water which is open to the atmosphere and subject to surface runoff. total organic carbon (TOC). As defined in 40 CFR 141.2, total organic carbon in mg/L measured using heat, oxygen, ultraviolet irradiation, chemical oxidants, or combinations of these oxidants that convert organic carbon to carbon dioxide, rounded to two significant figures. total trihalomethanes (TTHM). As defined in 40 CFR 141.2, the sum of the concentration in milligrams per liter of the trihalomethane compounds (trichloromethane [chloroform], dibromochloromethane, bromodichloromethane and tribromomethane [bromoform]), rounded to two significant figures. trihalomethane (THM). As defined in 40 CFR 141.2, one of the family of organic compounds, named as derivatives of methane, wherein three of the four hydrogen atoms in methane are each substituted by a halogen atom in the molecular structure. tracer. A foreign substance mixed with or attached to a given substance for subsequent determination of the location or distribution of the foreign substance. tracer study. A study using a substance that can readily be identified in water (such as a dye) to determine the distribution and rate of flow in a basin, pipe, ground water, or stream channel. transient non-community water system. As defined in 40 CFR 141.2, means a noncommunity water system that does not regularly serve at least 25 of the same persons over six months per year. virus. A virus of fecal origin which is infectious to humans by waterborne transmission. water supply system. The collection, treatment, storage, and distribution of potable water from source to consumer. (20) “Repair” means any action which involves the physical alteration or replacement of any part of a well, but does not include the alteration or replacement of any portion of a well which is above ground surface. (21) “Telescoping Casing” means an interior casing extending below and sealed within an exterior casing. (22) “Water Well” or “Well” means any excavation that is drilled, cored, bored, washed, driven, dug, jetted, or otherwise constructed when the intended use of such excavation is for the location, acquisition, development, or artificial recharge of ground water, but such term does not include any well for the purpose of obtaining or prospecting for oil, natural gas, minerals, or products of mining or quarrying; for inserting media to dispose of oil brines or to repressure oil-bearing or natural gas-bearing formation; for storing petroleum, natural gas, or other products; or for temporary dewatering of subsurface formations for mining, quarrying, or construction purposes. (23) “Water Well Contractor” means an individual who is responsible for the construction, repair, or abandonment of a water well and who is licensed under Chapter 62-531, F.A.C., to engage in the business of construction, repair, or abandonment of wells.

60
(24) “Well Seal” means an approved arrangement or device to prevent contaminants from entering the well at the upper terminal. Specific Authority 373.309 FS. Law Implemented 373.303,

61
Appendix B - DEP Groundwater Forms Used in Providing CT Calculations

62


65

66

67

APPENDIX G EXAMPLES OF POOR, AVERAGE, AND SUPERIOR BAFFLING CONDITIONS IN BASINS.

69

70
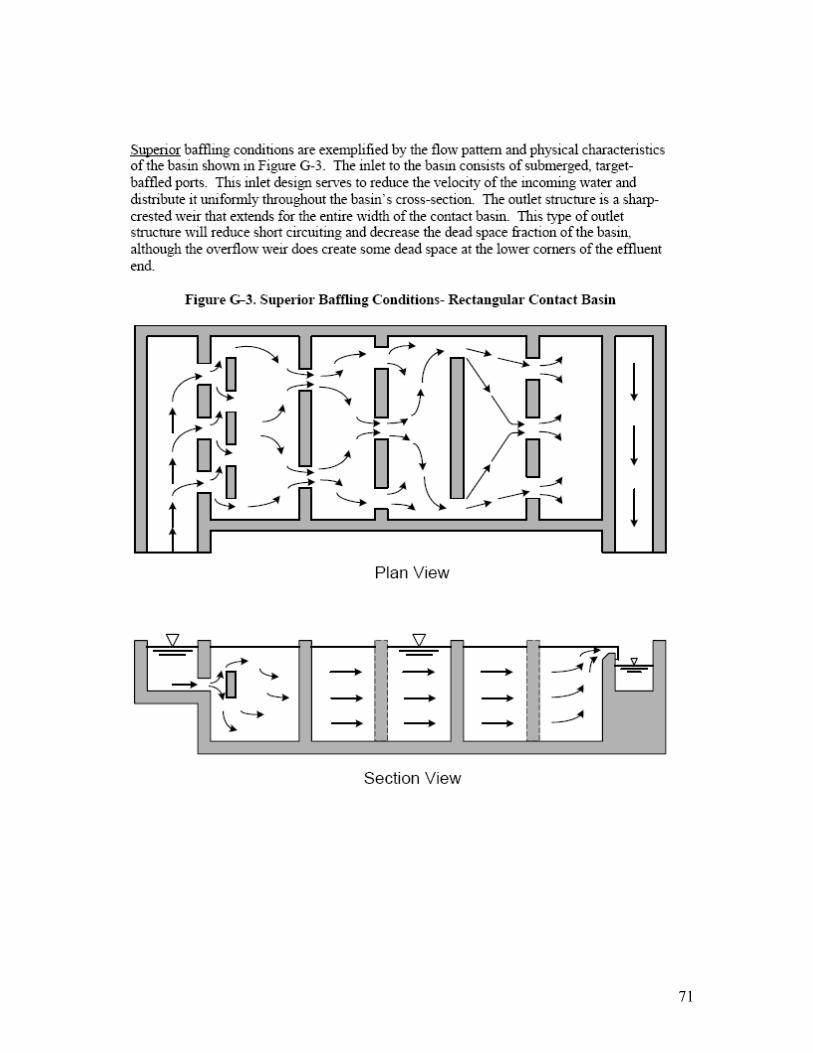
71

72
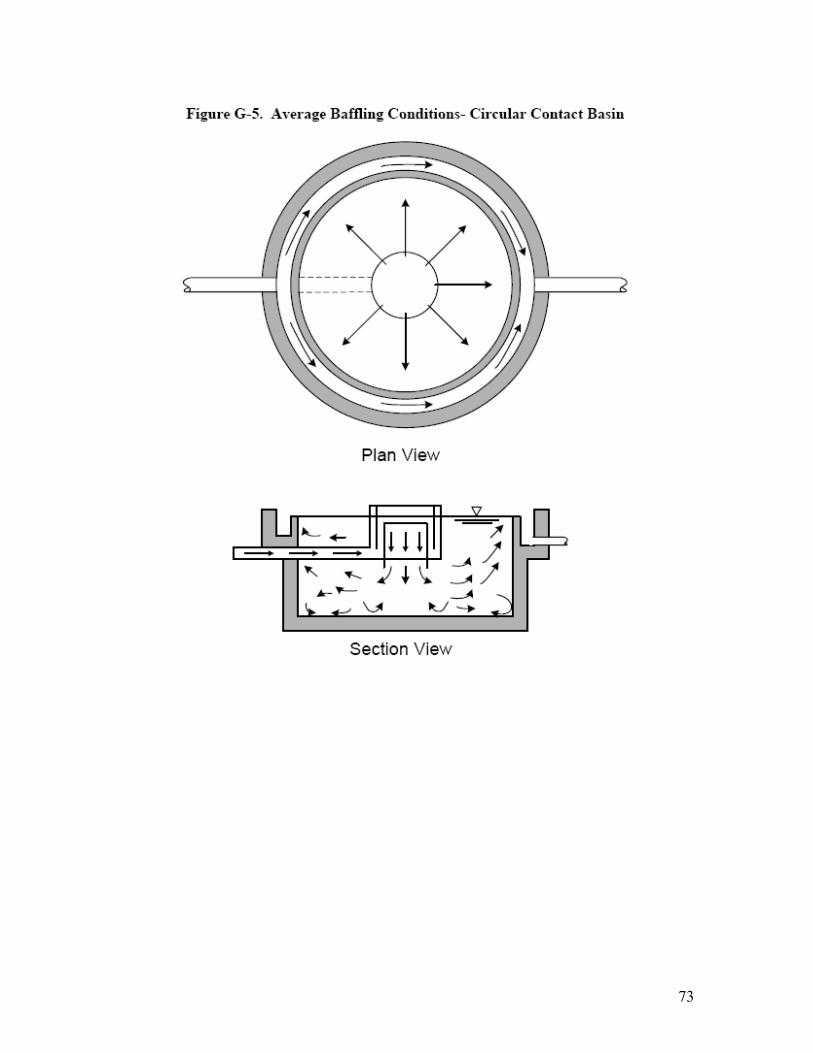
73
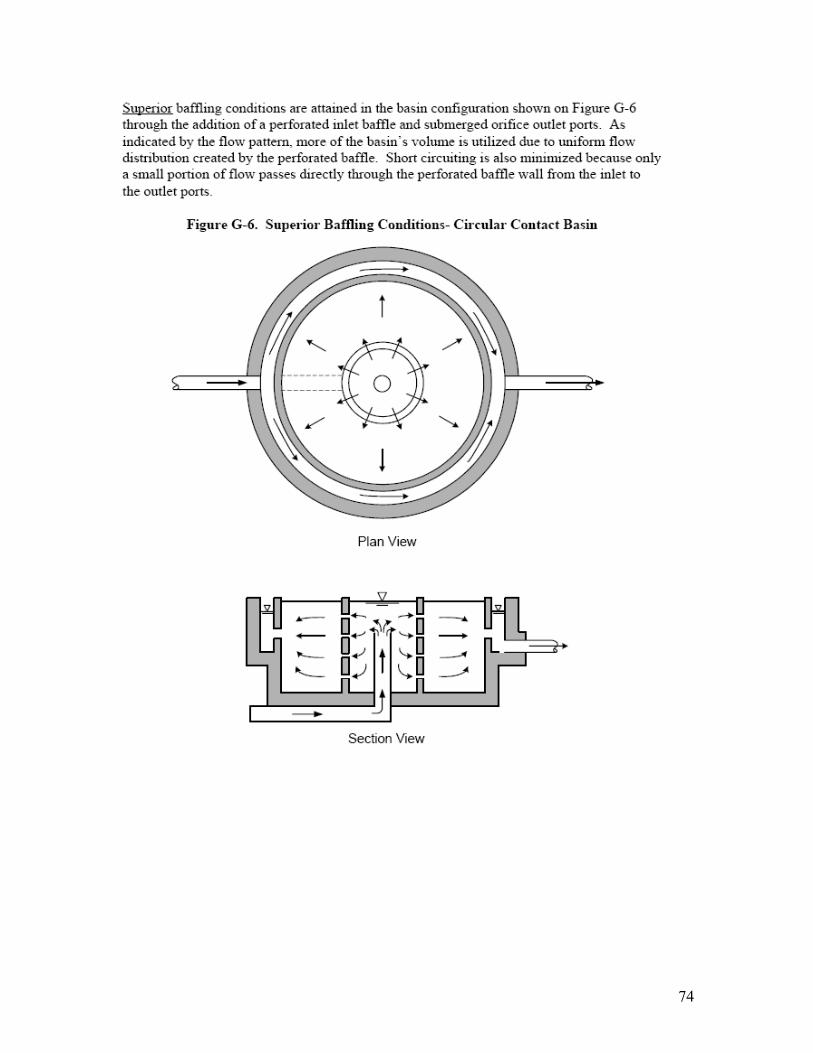
74