calcitonin has a vasopressin-like effect on aquaporin-2 trafficking
TRANSCRIPT

Calcitonin Has a Vasopressin-like Effect on Aquaporin-2Trafficking and Urinary Concentration
Richard Bouley, Hua A.J. Lu, Paula Nunes, Nicolas Da Silva, Margaret McLaughlin,Ying Chen, and Dennis Brown
Massachusetts General Hospital Center for Systems Biology, Program in Membrane Biology and NephrologyDivision, Massachusetts General Hospital and Harvard Medical School, Boston, Massachusetts
ABSTRACTThe most common cause of hereditary nephrogenic diabetes insipidus is a nonfunctional vasopressin (VP)receptor type 2 (V2R). Calcitonin, another ligand of G-protein–coupled receptors, has a VP-like effect onelectrolytes and water reabsorption, suggesting that it may affect AQP2 trafficking. Here, calcitoninincreased intracellular cAMP and stimulated the membrane accumulation of AQP2 in LLC-PK1 cells.Pharmacologic inhibition of protein kinase A (PKA) and deficiency of a critical PKA phosphorylation siteon AQP2 both prevented calcitonin-induced membrane accumulation of AQP2. Fluorescence assaysshowed that calcitonin led to a 70% increase in exocytosis and a 20% decrease in endocytosis of AQP2.Immunostaining of rat kidney slices demonstrated that calcitonin induced a significant redistribution ofAQP2 to the apical membrane of principal cells in cortical collecting ducts and connecting segments butnot in the inner stripe or inner medulla. Calcitonin-treated VP-deficient Brattleboro rats had a reducedurine flow and two-fold higher urine osmolality during the first 12 hours of treatment compared withcontrol groups. Although this VP-like effect of calcitonin diminished over the following 72 hours, thetachyphylaxis was reversible. Taken together, these data show that calcitonin induces cAMP-dependentAQP2 trafficking in cortical collecting and connecting tubules in parallel with an increase in urineconcentration. This suggests that calcitonin has a potential therapeutic use in nephrogenic diabetesinsipidus.
J Am Soc Nephrol 22: 59–72, 2011. doi: 10.1681/ASN.2009121267
Hereditary nephrogenic diabetes insipidus ismost often associated with expression of a non-functional vasopressin receptor type 2 (V2R)mutant (X-linked nephrogenic diabetes insipidus[NDI]).1–3 The V2R signaling pathway that regu-lates aquaporin 2 (AQP2) trafficking has been ex-tensively studied.2,4 –10 When vasopressin (VP)binds V2R, adenylyl cyclase is activated, intracellu-lar cAMP is increased, and protein kinase A (PKA)is stimulated. AQP2 is phosphorylated at serine 256(S256), which is critical for AQP2 accumulation atthe plasma membrane and an increase in collectingduct water permeability.11,12 Although other strate-gies to bypass the defective V2R signaling pathwayin X-linked NDI have been proposed,13 includingthe use of cGMP selective phosphodiesterase inhib-itors such as sildenafil,14,15 the need for more effec-
tive treatment remains. Earlier work by De Rouffig-nac et al.16,17 proposed an antidiuretic effect ofcalcitonin (CT), and Carney and Thompson18 alsosuggested a possible role for CT in water reabsorp-tion. These observations suggest that CT might af-fect water reabsorption via regulation of AQP2 traf-
Received December 17, 2009. Accepted August 22, 2010.
Published online ahead of print. Publication date available atwww.jasn.org.
Correspondence: Dr. Richard Bouley, Massachusetts GeneralHospital, Center for Systems Biology, Program in MembraneBiology and Division of Nephrology, Simches Research Center,Room 8202, 185 Cambridge Street, Boston, MA 02114. Phone:617-726-1375; Fax: 617-643-3182; E-mail: [email protected]
Copyright © 2011 by the American Society of Nephrology
BASIC RESEARCH www.jasn.org
J Am Soc Nephrol 22: 59–72, 2011 ISSN : 1046-6673/2201-59 59

ficking subsequent to an increase in cAMP levels in target cells.CT is primarily secreted by thyroid parafollicular cells,19,20
although its precursor form has been detected in liver, kidney,and neutrophils.21,22 CT also has hypocalcemic and hypophos-phatemic effects.23–26 CT binds two G-protein– coupled recep-tors in humans: CT receptor types 1 (CT(A)) and 2 (CT(B)).27–29
CT(A) and CT(B) are both associated with the heterotrimericG-protein Gs and increase intracellular cAMP, but CT(B) canalso affect phosphoinositide-specific phospholipase C.30
Although CT affects several organs, its principal target is thekidney where it is largely degraded.31–36 The distribution ofCT-binding sites is slightly different among rat, mouse, rabbit,primate, and human.37,38 CT stimulates adenylyl cyclase activ-ity in human thick ascending limb and in cortical and medul-lary collecting ducts.39 In rat, CT-binding sites were detected inthe cortical collecting duct and distal convoluted tubule (pos-sibly including the connecting segment) and in thick ascendinglimbs.38,40 – 42 Quantitative reverse transcription (RT)-PCR de-tected CT(A) but not CT(B) mRNA in rat kidney,43 supportingprevious work showing that rat kidney has only a single class ofCT-binding sites.42 The location of both CT and VP receptorsin some of the same tubule segments is consistent with theobservation that CT has a VP-like effect on these segments.16,17
De Rouffignac et al.16,17 suggested that CT plays a role in thecorticomedullary gradient formation by modifying electrolytetransport in the thick ascending limb. Acute treatment with CTconfirmed a VP-like effect on electrolytes and suggested aneffect on water reabsorption in collecting ducts.18
Here, we investigated the effect of CT on AQP2 traffickingin vitro, in situ, and in vivo using LLC-PK1 kidney epithelialcells, kidney slices in vitro, and CT-infused VP-deficientBrattleboro rats. CT induced an increase of intracellular cAMPin AQP2-expressing LLC-PK1 cells that express endogenousCT receptor,29,44,45 resulting in AQP2 membrane accumula-tion. Immunocytochemistry on Brattleboro rat kidneysshowed a CT-induced increase of AQP2 membrane accumu-lation in cells from connecting segments and cortical collectingducts, in parallel with a significant but transient reduction inurine volume and an increase in urine osmolality.
RESULTS
PKA-dependent AQP2 Membrane Accumulation inResponse to CT in LLC-PK1 CellsIn the absence of ligand, green fluorescence protein (GFP)-tagged V2R (V2R-GFP) is expressed principally at the plasmamembrane (Figure 1A), whereas c-myc-tagged AQP2 is in cy-toplasmic vesicles (Figure 1B). In the presence of VP (10 nM,10 minutes), V2R-GFP showed moderate internalization (Fig-ure 1C), whereas AQP2 accumulated at the plasma membrane(Figure 1D). CT (100 nM, 10 minutes) had a similar effect onAQP2 membrane accumulation (Figure 1F) without affectingV2R-GFP localization (Figure 1E). The CT effect was abolishedby H89 (30 �M), a PKA inhibitor (Figure 1H), suggesting a
Figure 1. CT stimulates AQP2 accumulation in the plasma membraneof kidney epithelial cells without affecting V2R-GFP distribution. Confo-cal immunofluorescence microscopy shows V2R-GFP and AQP2 inLLC-VA cells before and after treatment with VP and CT with or withoutthe PKA inhibitor H89. (A and B) In nonstimulated cells, V2R-GFP (green)is concentrated in the plasma membrane (A), whereas AQP2 (red)remains in cytoplasmic vesicles localized mainly around the nucleus (B).(C through F) In contrast, AQP2 shows plasma membrane localization(arrows) after incubation for 10 minutes with 10 nM VP (D) or 100 nM CT(F). V2R-GFP was partially internalized into cytoplasmic vesicles at thisearly time point after VP treatment (C), but its distribution was notchanged by CT treatment (E). (G and H) The presence of H89 did noteffect V2R distribution (G), but the effect of CT on the distribution ofAQP2 was completely abolished in the presence of this inhibitor (H).These images are representative of three independent experiments.The bar indicates 10 �m.
BASIC RESEARCH www.jasn.org
60 Journal of the American Society of Nephrology J Am Soc Nephrol 22: 59–72, 2011

role for PKA in the AQP2 response to CT. To determinewhether AQP2 phosphorylation at S256 was necessary, LLC-PK1 cells expressing either wild type or AQP2 (S256A), a phos-phorylation-deficient mutant, were incubated with CT (Figure 2).WhereasCT(100nM,10minutes) inducescell surfaceaccumulationof wild type AQP2 (Figure 2, A and B), it had no effect on the AQP2(S256A) mutant (Figure 2, C and D). This suggests that S256 phos-phorylation of AQP2 is essential for the CT effect. Furthermore, CTincreased intracellular cAMP levels dose-dependently in LLC-VAcells (Figure 3). The effect of CT (1 �M) is almost (approximately80%) as great as 1 �M VP in LLC-VA cells. CT also increased cAMPin untransfected LLC-PK1 and in LLC-W2 cells that are transfectedwith AQP2 alone (data not shown).
Effect of CT on Exocytosis and Endocytosis in LLC-PK1CellsTo address the mechanism of AQP2 cell surface accumulationin response to CT, exocytosis and endocytosis were analyzed inLLC-PK1 cells using a fluorescence-based soluble yellow fluo-rescent protein (ssYFP) secretion assay and a Texas Red-dext-ran internalization assay as described previously (Figure 4).46
Endocytosis was moderately but significantly inhibited in bothcell linesbyCT(Figure4A).CTalsosignificantly increasedexocytosisin both LLC-AQP2-ssYFP and LLC-ssYFP cells (Figure 4B), indicat-ing that CT stimulates exocytosis in renal epithelial cells, even if theydo not express AQP2.
CT Effect on AQP2 Membrane Accumulation inPrincipal CellsElectron microscopy was used to study AQP2 accumulation in theapical plasma membrane of cortical principal cells (Figure 5). Weobserved a striking increase of gold-labeled apical AQP2 intubules from CT-treated Brattleboro rats (Figure 5B) com-pared with controls (Figure 5A). Quantification is shown inFigure 5C. Apical AQP2 accumulation was 4.3 times higher inCT-treated animals. The technique used here detects only api-cal plasma membrane AQP2 and not intracellular AQP2.
CT Induces AQP2 Trafficking in SituAQP2 trafficking was also followed by immunofluorescence inrat kidney slices incubated in the presence or absence of CT(100 nM) for 1 hour in vitro (Figure 6, A through D). CT
significantly increased AQP2 at the apicalplasma membrane of cortical collectingducts (Figure 6, A and B), but more prom-inent apical accumulation was seen in con-necting segments (Figure 6, A and B, in-sets), identified by calbindin doublestaining (not shown). In the outer (notshown) and the inner medulla, however,AQP2 was localized throughout the cyto-plasm in the presence or absence of CT(Figure 6, C and D). Quantification of theseeffects is shown in Figure 6E. Some differ-ences in the intensity of the AQP2 responsewere noted between cells and the kidney insitu, possibly related to different CT affini-ties among species or the availability/effi-ciency of the machinery for CT signaling.Nevertheless, these results support our cellculture observations that CT inducesAQP2 trafficking, but this effect is re-stricted mainly to cortical tubules in situ.
Immunostaining showed that CT re-ceptor is expressed in both the corticalconnecting segment and collecting duct(Figure 7, A and C). It is located at boththe apical and lateral membranes of con-necting segments, identified by calbindinstaining (Figure 7A, arrows), whereas it isfound mainly at the lateral membrane ofcortical collecting ducts, identified byAQP2 staining (Figure 7C). Both stainingpatterns were abolished in the presenceof the immunizing peptide (Figure 7, Band D).
Figure 2. Wild-type AQP2, but not S256A mutant AQP2, accumulates at theplasma membrane in the presence of CT. Indirect immunofluorescence microscopyof AQP2 staining in LLC-AQP2 wild type and S256A mutant expressing cellsincubated in the presence or absence of CT. The AQP2 (S256A) mutant is locatedon intracellular vesicles similar to wild type AQP2 in basal conditions (A and C,respectively). After CT treatment (100 nM, 10 minutes) AQP2 wild type accumulatesat the plasma membrane (B), whereas localization of the AQP2 (S256A) mutant isunchanged (D). These images are representative of three independent experi-ments. The bar indicates 10 �m.
BASIC RESEARCHwww.jasn.org
J Am Soc Nephrol 22: 59–72, 2011 Calcitonin Stimulates Urine Concentration 61
CT Has an Antidiuretic Effect in VivoOsmotic pumps containing CT or vehicle were implantedinto Brattleboro rats, which have no endogenous VP anddisplay polydipsia and polyuria. All of the animals were ini-
tially drinking an average of approximately 237 ml of wa-ter/d and excreting most as hypoosmotic urine (approxi-mately 197 ml/d, approximately 134 mOsm/kg). During thefirst 12 hours of exposure, urine volume from CT-treatedrats was three times lower and twice as concentrated as thatfrom saline-treated rats (Figure 8). After 24 hours, thesedifferences were less than after 12 hours. After 48 hours, adifference of 40% in urine volume was found, whereas urineosmolality remained low (approximately 126 mOsm/kg).The effect of CT was lost after 72 hours of continuous infu-sion (Figure 8, A and B). Consistent with reduced urineoutput, CT-treated rats drank 116 � 41 ml of water com-pared with 290 � 36 ml in the control group during the first24 hours. This effect disappeared after the third day of treat-ment (302 � 20 versus 277 � 54 ml). After pump removaland 10 days of rest, the rats were again infused with CTusing a new minipump. After 4 hours, CT-treated rats uri-nated less, and the urine was more concentrated than in thecontrol group (Figure 8, E and F). Serum osmolality wassimilar in both groups (299 � 3 mOsmol/kg), and blood profileanalysis (Table 1) showed no difference in sodium, potassium,chloride, calcium, glucose, or creatinine. CT did not affectplasma oxytocin levels after 4 hours (13.2 � 0.6 versus 14.0 �1.9 ng/ml) or 24 hours of infusion (16.5 � 2.9 versus 19.9 � 5.1ng/ml). These values are similar to those (4.3 to 18.8 pg/ml)reported by Edwards et al.47
Kidneys from both groups of retreated animals were har-vested after 4 hours and immunostained for AQP2 (Figure 9).As observed in kidney slices, AQP2 accumulated at the apicalpole of cortical principal cells of CT infused rats, in contrast tothe more diffuse distribution in controls (Figure 9, A and B).Apical redistribution of AQP2 (Figure 9, A and B, insets) wasalso prominent in cortical connecting segments, identified bycalbindin staining (not shown). CT had no detectable effect onAQP2 distribution in the outer (not shown) or inner medulla(Figures 9D and 6D). Quantification of the CT effect is shownin Figure 9E.
To study the effect of food intake and CT on water reab-sorption, we performed a second experiment where food (and,therefore, solute) intake was controlled. Both groups were de-prived of food for 4 hours, and then food was monitored untilthe end of the experiment. After 4 hours, urine volume was notsignificantly different between the treated and nontreatedgroups, but the urine of CT-treated rats was significantly moreconcentrated (204 � 49 mOsM/Kg) than the urine of un-treated rats (124 � 27 mOsm/kg). A significant difference inurine volume became more apparent with time. After 12hours, the treated rat urine volume was �30% lower than un-treated groups, although their food consumption was not sig-nificantly different. After 24 hours, CT-treated rats produced39% less urine (128 � 20 versus 208 � 10 ml, n � 3, P � 0.05),and it was more hypertonic (172 � 21 versus 132 � 14 mOsM/Kg, n � 3, P � 0.05), whereas their food consumption was lessthan the controls at this later time point (19 � 2 versus 11 � 1 g,n � 3, P � 0.05).
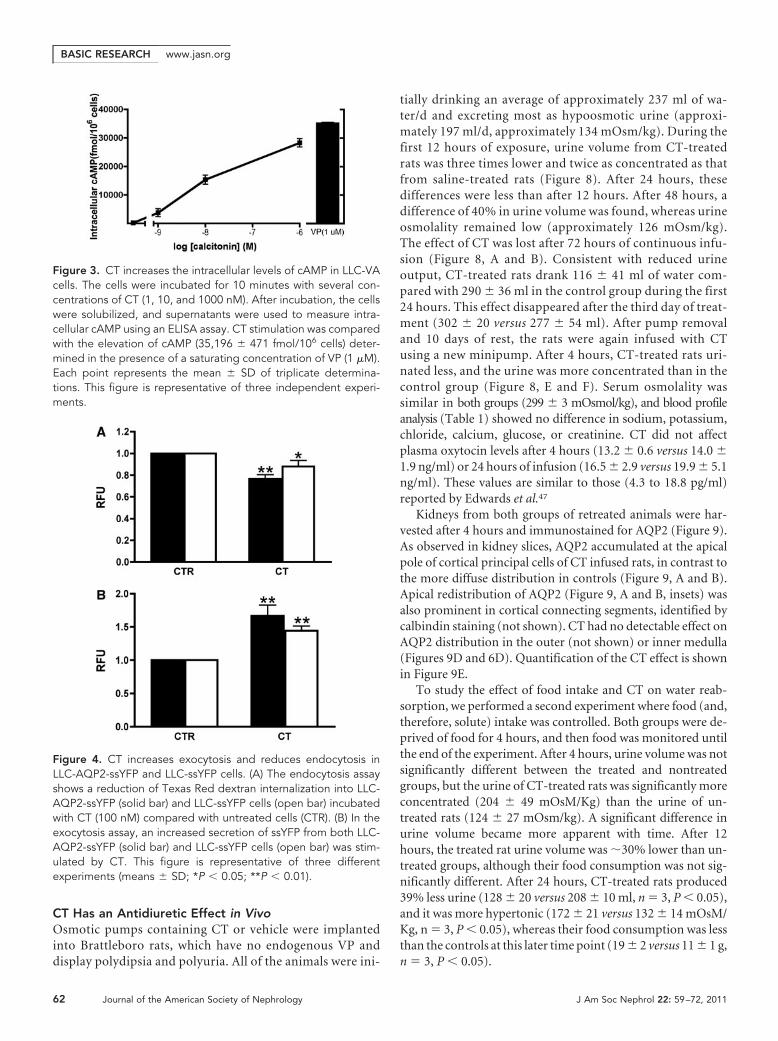
Figure 3. CT increases the intracellular levels of cAMP in LLC-VAcells. The cells were incubated for 10 minutes with several con-centrations of CT (1, 10, and 1000 nM). After incubation, the cellswere solubilized, and supernatants were used to measure intra-cellular cAMP using an ELISA assay. CT stimulation was comparedwith the elevation of cAMP (35,196 � 471 fmol/106 cells) deter-mined in the presence of a saturating concentration of VP (1 �M).Each point represents the mean � SD of triplicate determina-tions. This figure is representative of three independent experi-ments.
Figure 4. CT increases exocytosis and reduces endocytosis inLLC-AQP2-ssYFP and LLC-ssYFP cells. (A) The endocytosis assayshows a reduction of Texas Red dextran internalization into LLC-AQP2-ssYFP (solid bar) and LLC-ssYFP cells (open bar) incubatedwith CT (100 nM) compared with untreated cells (CTR). (B) In theexocytosis assay, an increased secretion of ssYFP from both LLC-AQP2-ssYFP (solid bar) and LLC-ssYFP cells (open bar) was stim-ulated by CT. This figure is representative of three differentexperiments (means � SD; *P � 0.05; **P � 0.01).
BASIC RESEARCH www.jasn.org
62 Journal of the American Society of Nephrology J Am Soc Nephrol 22: 59–72, 2011

CT Effect on AQP2 ExpressionThe amount of AQP2 protein was not significantly changedafter a 24-hour infusion of CT, as detected by Western blotanalysis (Figure 10, A and B). Furthermore, levels of AQP2 andCT receptor mRNA were not affected by CT treatment (Figure10C).
DISCUSSION
Earlier work from the group of De Rouffignac16 showed thatCT has a VP-like antidiuretic activity in hormone-depletedBrattleboro rats, but evidence of an effect on principal cells waslacking, and determining the effects of CT on AQP2 traffickingwas not possible. Our data confirm that CT-treated Brattle-boro rats show a significant increase in urine osmolality andshow that CT stimulates an increase in cell surface accumula-tion of AQP2 in vitro, in situ, and in vivo. The increase inplasma membrane AQP2 after CT stimulation, in parallel withdecreased urine output and increased urine osmolality, sup-ports the idea that CT plays a direct role in the urinary concen-trating mechanism at the level of the collecting duct (and con-necting segment), in addition to its effect on NaCl transport inthe thick ascending limb that could affect the medullary con-centration gradient.16 Brattleboro rats treated with CT drankless water than controls, as expected when urinary output isreduced. Previous studies showed that a reduction of urinaryoutput is also correlated with reduced water intake in VP-
treated Brattleboro rats.48,49 Furthermore, although acutetreatment of Brattleboro rats with physiologic doses of VP hadno reported effect on GFR,50,51 direct measurements of GFRwere not performed in these studies, and a contribution of achange in GFR to the observed effect of CT cannot be ruled out.
The signaling pathway by which CT increases AQP2 mem-brane accumulation seems similar to the cAMP-dependentmechanism of VP action. CT binding to its receptor triggers anincrease in cAMP that activates PKA and leads to AQP2 phos-phorylation at S256, which is required for AQP2 membraneaccumulation.11,12 The absence of any effect of CT on traffick-ing of an AQP2(S256A) mutant in LLC-PK1 cells confirms thatphosphorylation of S256 is essential for AQP2 membrane ac-cumulation in response to CT as well as VP.11,12 At present, theeffect of CT on phosphorylation of other target residues in theAQP2 protein52,53 is not known. The mechanism regulatingAQP2 trafficking upon CT and VP binding to their respectivereceptors seems similar; CT signals mainly via cAMP in thenephron,40,42 whereas VP affects both intracellular cAMP andcalcium levels, and increased intracellular calcium has beenimplicated in the response to VP54 including AQP2 traffick-ing.55 However, CT might effect intracellular calcium levels incortical collecting duct cells as a result of cAMP elevation,56 butthis effect was believed to occur in intercalated cells.57 Furthercomparative studies may reveal a role of calcium in fine-tuningthe cAMP signaling pathway in renal epithelial cells.
Functional differences that distinguish CT and VP actionare, however, suggested by these and prior studies on their
Figure 5. Immunogold electron microscopyshows apical plasma membrane insertion ofAQP2 induced by CT in vivo. AQP2 was localizedby pre-embedding labeling of thick, nonperme-abilized vibratome sections kidney cortical tissuewith an antibody against an external epitope ofAQP2. Only plasma membrane AQP2 is de-tected using this procedure. CT treatment (B)showed a significant amount of AQP2 plasmamembrane associated with the apical membraneand microvilli, whereas AQP2 in the apical plasmamembrane was much less abundant in corticalkidney sections of the untreated rats (A). Theseresults support the epifluorescence microscopydata shown in Figures 6 and 9. The number ofgold particles labeling AQP2 is expressed permicrometer of apical membrane length (C).Images of two to three tubules from eachtissue were analyzed with ImageJ software(National Institutes of Health). The density ofAQP2 at the apical plasma membrane (openbar) was compared with the density of AQP2in the apical membranes of untreated rats(solid bar) (means � SEM; n � 3; *P � 0.05).The position of the cell junction between aprincipal cell (B) and an AQP2-negative in-tercalated cell (A) is indicated with an arrowin each figure. The bar indicates 0.5 �m.
BASIC RESEARCHwww.jasn.org
J Am Soc Nephrol 22: 59–72, 2011 Calcitonin Stimulates Urine Concentration 63

relative effects on exo- and endocytosis in LLC-PK1 cells. CTstimulated exocytosis of ssYFP both in native LLC-PK1 cellsand LLC-PK1 cells that expressed AQP2. In contrast, VP in-creases exocytosis only in LLC-PK1 cells that express AQP2.46
Furthermore, CT had a small but significant inhibitory effecton endocytosis in both cell types whether or not they expressAQP2. These data suggest that CT may have a general effect onexo- and endocytosis, whereas the effect of VP is more specif-ically related to the presence of AQP2 in transporting vesi-cles.46 Finally, because CT acts via cAMP, its effect could in-volve both short term trafficking as well as long termstimulation of AQP2 transcription via activation of a cAMP-response element in the 5�-flanking region of the AQP2gene.58 – 60 However, in these studies, no significant alterationin levels of either AQP2 protein or mRNA were detectable afterCT treatment for 24 hours, at least at the level of detectionafforded by our techniques. Interestingly, another G-protein–coupled receptor ligand, glucagon, also has antidiuretic effects,although its effect on AQP2 trafficking in vivo remains to bedetermined.41,61
As expected from the distribution of CT receptors along theurinary tubule,37,40 the effect of CT on AQP2 membrane accu-mulation was region-dependent. The effect was greater in theconnecting segment and cortical collecting duct, where CT re-
ceptors are most abundant, than in the medullary collectingduct. Because considerable water reabsorption occurs in thecortex, preventing excessive fluid delivery to the medulla, in-creasing water permeability of only cortical tubule segmentswould have a significant (but only partial) antidiuretic effect.Our in vivo data show that this is the case. A combination ofagents that stimulate AQP2 apical accumulation in both corti-cal and medullary collecting ducts will be required to elicit amore substantial antidiuretic response in the absence of defec-tive V2R signaling.
Salmon CT has been examined as a potential therapeuticagent for metabolic bone diseases with minimal side ef-fects.62 A high concentration of CT affected calcium andmagnesium excretion and even had a diuretic effect.18,63,64
However, the concentration of CT used in our study wasequivalent to the plasma concentration of endogenous thy-rocalcitonin that does not cause phosphaturia and natriure-sis.16,18 At this lower concentration, we show that AQP2membrane accumulation in the kidney is stimulated, indi-cating that CT affects principal cells and not only interca-lated cells, as suggested earlier.57 Although we attribute re-duced drinking in CT-treated rats to changes in waterbalance caused by decreased urinary output, a partial directeffect of CT on the drinking response cannot be completely
Figure 6. Indirect immunofluorescence images of kid-ney tissue slices showing AQP2 in principal cells ofcortical or inner medullary collecting ducts. One ratkidney was cut into thin slices and incubated in vitrowith buffer (A and C) or with CT (B and D) for 1 hourbefore fixation by immersion, sectioning, and immuno-staining to detect AQP2. Under control conditions,AQP2 was mainly localized throughout the cytoplasmand showed little apical membrane staining in collect-ing ducts from the cortex (A) and inner medulla (C), aswell as in cortical connecting segments (inset). In thepresence of CT, AQP2 staining of the apical membraneregion was increased in principal cells of the corticalcollecting duct (B) and in connecting segments (inset),but AQP2 remained localized in the cytoplasm in theinner medulla (D). Quantification of the effect of CT onAQP2 in principal cells (E) showed that CT induced asignificant apical redistribution that was most apparentin the connecting segment but also was significant inthe cortical collecting duct. No effect on AQP2 distri-bution was detectable in the inner medulla. The im-ages are representative of three independent experi-ments. The quantification shows the means of morethan 100 cells taken from the three different experi-ments (means � SEM; n � 3; *P � 0.05). The barindicates 10 �m.
BASIC RESEARCH www.jasn.org
64 Journal of the American Society of Nephrology J Am Soc Nephrol 22: 59–72, 2011

ruled out. Salmon CT, an amylin agonist, reduces mainlyprandial drinking, whereas it does not affect the drinking-inducing response to angiotensin II.65,66 Salmon CT maydirectly stimulate neurons in the subfornical organ in rat,and it has a dipsogenic effect in starved pygmy goats.65,67 Itis also possible that reduction of water intake may partici-pate in increasing urine concentration via the release of oxy-tocin either indirectly or by direct activation of CT familyreceptors in the brain.68 –70 Indeed, intracerebroventricularinjection of oxytocin inhibits water intake.71,72 It has alsobeen shown previously that oxytocin-induced AQP2/waterchannel mobilization occurs, in parallel with an oxytocin-induced antidiuresis in Brattleboro rats.73–75 However, wewere unable to detect any significant change in plasma oxy-tocin levels in CT-treated rats. Likewise, GFR is slightly butnot significantly increased by acute CT treatment of “hor-mone-deprived” Brattleboro rats,16 suggesting that changesin GFR are not responsible for the CT effect on urine con-centration. In our study, GFR was not directly measured,but serum creatinine was not significantly different betweencontrol and CT-treated rats.
The antidiuretic effect of CT persisted for over 24 hoursbut diminished thereafter. This tachyphylaxis may be due toreceptor downregulation or tolerance. After removal of theminipump, re-exposure of the same animals to CT onceagain induced an antidiuretic response. Such downregula-tion might be diminished by fine-tuning the dose of CT or
by giving periodic treatments (e.g. once per 24 hours) ratherthan a continuous infusion of CT. In summary, we haveshown that CT modulates AQP2 trafficking in a mannersimilar to VP and that its infusion results in a significantincrease of urine osmolality and a significant reduction inurine output in Brattleboro rats. Additional studies will berequired to determine whether CT might also be beneficialto patients suffering from X-linked NDI.
CONCISE METHODS
Experimental Animals and Statistical AnalysesAnimal experiments were approved by the Institutional Committee
on Research Animal Care, in accordance with the National Institutes
of Health Guide for the Care and Use of Laboratory Animals. Adult
male Brattleboro rats (Harlan, Indianapolis, IN), a model of central
diabetes insipidus, were used for the in situ and in vivo portions of this
study (see below) and were supplied by the National Rat Resource
Research Center (Madison, WI). All of the results were statistically
analyzed using the t test. The differences were considered significant
at P values less than 0.05.
Cell CultureUnless otherwise stated, all of the chemicals were purchased from
Sigma (St. Louis, MO), and all of the cell culture reagents were
purchased from Invitrogen (Carlsbad, CA). LLC-PK1a cells stably
Figure 7. Indirect immunofluorescence im-ages of kidney showing CT receptor in corti-cal collecting ducts and connecting segments.One rat kidney was fixed by immersion, sec-tioned and immunostained to detect the CTreceptor as well as AQP2 and calbindin. The CTreceptor is located in the apical membrane incortical tubules (A) that costain for calbindin(A, inset, green), a marker of cortical connectingsegments. Apical staining is completely abol-ished in the presence of directed antibody pep-tide (B) in calbindin-positive tubules (B, inset).Mainly basolateral CT receptor staining was ob-served in cortical collecting ducts (C). Both theCT receptor (red) and AQP2 (green) colocalizedin the same cells (C, inset). This CT receptorstaining was abolished in the presence of pep-tide inhibitor (D, inset), although some spots ofnonspecific fluorescence remain scatteredthroughout the section. The images are repre-sentative of three independent experiments.
BASIC RESEARCHwww.jasn.org
J Am Soc Nephrol 22: 59–72, 2011 Calcitonin Stimulates Urine Concentration 65

expressing both GFP-tagged V2R and c-myc-tagged AQP2 (re-
ferred to here as LLC-VA cells, to indicate V2R-GFP and AQP2
expression) were cultured in DMEM, 10% FBS, and neomycin (1
mg/ml) as described previously.15,76 LLC-PK1 cells stably express-
ing wild type c-myc-tagged aquaporin-2 (LLC-W2 cells) and
serine 256 mutant to alanine (LLC-AQP2 (S256A)) were grown as
described previously.14
cAMP AssaysMeasurements of intracellular cAMP levels in the constant presence
of 3-isobutyl-1-methyl-xanthine (1 mM), a phosphodiesterase inhib-
itor (Amersham Biosciences Corp., Piscataway, NJ), were performed
using Biotrak kit as described previously.14,77,78 Intracellular cAMP
accumulation was evaluated in LLC-VA cells after incubation in the
presence of 1 �M VP or CT for 10 minutes at 37°C. All of the cAMP
assays were performed in triplicate.
Fluorescence Exocytosis and Endocytosis AssaysThe fluorescence exocytosis assay was performed as described previ-
ously46 using either LLC-PK1 cells expressing AQP2 and a soluble
yellow fluorescence protein (LLC-AQP2-ssYFP) or with LLC-PK1
cells expressing ssYFP only (LLC-ssYFP cells). Briefly, the cells were
grown to confluence on 24-well cell culture plates. The cells were
washed twice and incubated for 1 hour in 250 �l of Hanks’ balanced
salt solution, 20 mM HEPES, and 2 g/L glucose (HBSS). The cells were
then incubated in 250 �l of control HBSS or in HBSS containing CT
(10 �M) for 30 minutes at 37°C. At the end of the incubation, 150 �l
of medium was transferred from each well to a black half-area 96-well
plate (Corning, Corning, NY). The ssYFP fluorescence in each well
was read immediately after collection using a multimode plate reader
(model DTX880; Beckman-Coulter, Fullerton, CA). The values rep-
resent at least three independent experiments, measured in triplicate.
Background fluorescence values were obtained from empty wells, and
fluorescence values are reported as a ratio of each background- and
zero-subtracted value to the corresponding LLC-AQP2-ssYFP and
LLC-ssYFP cell 30-minute control value.
The endocytosis assay was also performed on LLC-AQP2-ssYFP
and LLC-ssYFP cells. The cells were grown to confluence on 96-well
cell culture plates. The cells were rinsed once and incubated for 1 hour
in HBSS and then for 30 minutes in 0.5 mg/ml of dialyzed Texas Red
dextran (10,000 kD) diluted in HBSS in the presence or absence of CT
(10 �M). After incubation, the cells were washed twice in PBS and
then lysed in 50 �l of lysis buffer (20 mM Tris/HCl, pH 7.4, 5 mM
EDTA, 5 mM EGTA, 30 mM NaF, 30 mM Na4P2PO7, 2 mM Na3VO4,
1% Triton X-100, 0.1% SDS. Fluorescence released into the medium
was read at 590 nm/650 nm using a multimode plate reader (model
DTX880; Beckman-Coulter, Fullerton, CA). The values represent at
least three independent experiments, measured in triplicate. The
background fluorescence values were obtained from empty wells, and
fluorescence values are reported as a ratio of each background- and
Figure 8. Urine volume decreases and urine osmolarity increasesin CT-treated rats. Metabolic cage analysis of the volume andurine osmolality from Brattleboro rats infused with CT or saline.Brattleboro rats were implanted with osmotic minipumps thatdeliver saline or CT (2 mU/min/100 g rat) for 7 days. Urine osmo-lality and volume were not modified in animals treated with saline(f) (A and B, respectively). In contrast, the urine osmolality wassignificantly increased and its volume was reduced during the first24 hours in CT-perfused animals (Œ) (A and B, respectively).Osmolality of the urine from both groups was analyzed after 4, 11,22, and 24 hours (C). The osmolality of urine from CT-treated rats(Œ) increased rapidly and then declined over time, whereas theosmolality of saline-treated animals was low and stable (f). Inparallel, the urine volume of saline-treated groups (f) was greaterthan animals treated with CT (Œ) (D). After removing the pumpsfor 10 days, the same rats were once again challenged with CT,and their urine osmolality and volume were analyzed (E and F,respectively). A 4-hour urine collection was performed before andafter reperfusion of animals with saline (solid bar) or CT (openbar), and the rats were then perfusion-fixed for analysis of AQP2distribution in their kidneys (see Figure 9). Those results representthe average values obtained from three different animals(means � SD; *P � 0.05). The bar indicates 10 �m.
Table 1. Plasma solute and electrolyte profile ofcalcitonin-treated and control Brattleboro rats
Control Rat(n � 3)
CT-treated Rat(n � 3)
Sodium (mmol/L) 150.0 � 3.6 148.3 � 0.6Potassium (mmol/L) 4.2 � 0.4 3.9 � 0.5Chloride (mmol/L) 109.0 � 3.0 108.0 � 2.0Calcium (mmol/L) 1.11 � 0.32 1.21 � 0.33Glucose (mg/dl) 208.3 � 18.3 225.6 � 12.6Bun (mg/dl) 16.0 � 4.0 7.7 � 0.6Creatine (mg/dl) 0.3 � 0.1 0.4 � 0.0
BASIC RESEARCH www.jasn.org
66 Journal of the American Society of Nephrology J Am Soc Nephrol 22: 59–72, 2011

zero-subtracted value to the corresponding LLC-AQP2-ssYFP and
LLC-ssYFP cells 30-minute control values.
Immunocytochemistry of Cell CulturesLLC-VA, LLC-AQP2 or LLC-AQP2 (S256A) cells were plated on 12 �
12-mm glass coverslips (Fisher Scientific, Pittsburgh, PA). The cells
were incubated at 37°C in DMEM with or without VP (10 nM) or CT
(100 nM). The effect of CT on AQP2 trafficking was also examined in
the presence of N-(2[[3-(4-bromophenyl)-2-propenyl]-amino]-
ethyl)-5-isoquinolinesulfonamide (H89) (30 �M), a PKA inhibitor.
After incubation, the cells were rinsed with cold PBS and fixed in PBS
containing 4% paraformaldehyde (Electron Microscopy Sciences,
Hatfield, PA) and 5% sucrose for 20 minutes at room temperature.
After fixation, LLC-AQP2, LLC-AQP2 (S256A), and LLC-VA cells
were stained with nondiluted ascites fluid containing a monoclonal
anti-c-myc antibody (A9E10) as described previously.14,79 The c-myc
antibody was detected using donkey anti-mouse IgG conjugated to
indocarbocyanine (CY3) at a final concentration of 1.8 �g/ml (Jack-
son ImmunoResearch, West Grove, PA) for 1 hour. The coverslips
were washed in PBS and mounted in Vectashield (Vector Labs, Bur-
lingame, CA). Immunofluorescence in LLC-VA cells was examined
using a Zeiss 63 � 1.4NA Plan Apo objective mounted on a Bio-Rad
Radiance 2000 confocal microscope (Carl Zeiss MicroImaging Inc.,
Thornwood, NY), whereas fluorescence of LLC-AQP2 and LLC-
AQP2 (S256A) was examined using a Nikon Eclipse E800 epifluores-
cence microscope equipped with a 60 � 1.4NA Plan Apo objective
and a Hamamatsu Orca CCD Camera (MVI, Avon, MA).
In Situ Kidney Tissue Slices: Preparation andTreatmentThe effect of CT on AQP2 trafficking was studied in thin slices of
kidney in vitro, which were prepared as described previously.14,77
Briefly, adult male homozygous Brattleboro rats (350 g) were anes-
thetized using sodium pentobarbital (65 mg/kg body wt intraperito-
neally). The blood was washed out from the kidneys by intraventric-
ular perfusion using HBSS, pH 7.4, at 37°C equilibrated with 5% CO2,
95% O2. The thin transversally sliced kidneys (approximately 0.5
mm) were cut using a Stadie-Riggs slicer (Thomas Scientific, Swedes-
boro, NJ). All of the slices were incubated at 37°C for 15 minutes in
equilibrated HBSS only. After equilibration, the slices were distrib-
uted into new vials containing either HBSS or CT (100 nM). After 60
minutes, all of the slices were fixed by immersion in paraformalde-
Figure 9. Indirect immunofluorescence of sec-tions from rat kidney showing AQP2 in principalcells of cortical and inner medullary collectingducts with and without CT treatment in vivo.After implantation of minipumps containing ei-ther saline or CT for 4 hours, the animals wereanesthetized, and the kidneys were fixed byperfusion, followed by sectioning and immuno-staining to detect AQP2. (A through C) Undercontrol conditions, AQP2 is localized towardthe apical pole of collecting ducts from thecortex (A) and inner medulla (C), as well as thecortical connecting segment (A, inset), but inthe presence of CT, AQP2 is more sharply con-centrated at the apical pole of principal cellsfrom the cortical collecting duct (B) and in cellsof the connecting segment (B, inset), reflectinga reduction in cytoplasmic vesicle staining andan increase in apical membrane staining (seealso Figure 6). (D) CT had no effect in the innermedulla, where AQP2 remained localizedthroughout the cytoplasm. (E) Quantification ofthe effect of CT on AQP2 redistribution in prin-cipal cells showed a significant increase in api-cal staining in both cortical collecting ductsand, to an even greater extent, connecting seg-ments. No effect was detected in the innermedulla. The images are representative ofthree independent incubations, and quan-tification shows the mean of more then 100cells taken from the three different experi-ments (means � SEM; *P � 0.05). The barindicates 10 �m.
BASIC RESEARCHwww.jasn.org
J Am Soc Nephrol 22: 59–72, 2011 Calcitonin Stimulates Urine Concentration 67

hyde-lysine-periodate (PLP) fixative at 4°C overnight. The slices were
then rinsed several times in 10 mM sodium phosphate buffer contain-
ing 0.9% NaCl, pH 7.4, and stored in the same buffer plus 0.02%
NaN3 at 4°C before use for immunostaining and quantification as
described below.
In Vivo CT Treatment of Rats and Perfusion FixationBefore experiments, all adult Brattleboro rats (weighting approxi-
mately 350 g) were installed in individual metabolic cages for 24
hours. Urine volume and osmolality were analyzed using a vapor
pressure osmometer (Vapro 5520; Wescor Inc., Logan, UT). The rats
were divided into two groups of three animals. After anesthesia with
isofluorane (Hospira Inc., Lake Forest, IL), Alzet osmotic pumps
(Durect Corp., Cupertino, CA) filled with saline solution were im-
planted into the first group, whereas the second group received
pumps loaded with salmon CT that released 2 mU (312 pg)/min/100
g body weight. The rats were placed back into metabolic cages. Urine
was collected at 4, 11, 22, and 24 hours, and after the first day, 24-hour
urine samples were collected over the next 6 days. Throughout the
study the individual animals were handled for approximately 5 min-
utes every day. The rats were kept under normal conditions of light
cycling (12 hours of dark/12 hours of light). The animals were allowed
to rest in their previous cage for 10 days and then were placed for 24
hours into metabolic cages before the implantation of a second mini
pump. The rats were then put back into metabolic cages, where the
effects of CT on both urine volume and osmolality were followed for
4 hours. The rats were anesthetized with isofluorane at the end of the
experiment. Blood samples were collected by cardiac puncture. All of
the animals were perfused with PBS for 1 minutes followed by PLP
perfusion fixation for 5 minutes. After perfusion, the kidneys were cut
into 5-mm slices, immersed overnight in PLP solution, and stored in
PBS containing 0.02% NaN3 at 4°C before use for immunostaining
and quantification as described below. Serum and urine and profiles
were analyzed at the Massachusetts General Hospital Clinical Pathol-
ogy Laboratory facility. Oxytocin plasma concentration was deter-
mined by enzyme immunoassay following manufacturer’s protocol
(Phoenix Pharmaceuticals, Inc., Burlingame, CA).
This study was performed with food ad libitum. However, we also
carried out a second experiment with regulated food intake. After 24
hours in metabolic cages, the rats were anesthetized. One kidney was
harvested for RT-PCR and Western blot analysis. Then the animals
were perfused as described above.
Immunocytochemistry of Kidney TissuesBefore immunofluorescence staining and quantification, kidney sam-
ples were first cryoprotected in PBS containing 30% sucrose for 2
hours. The slices were mounted on a cutting block covered with OCT
compound 4583 (Tissue-Tek; Miles Inc., Elkhart, IN). Four-�m sec-
tions were cut from the frozen tissue using a Leica cryostat (Leica,
Deerfield, IL). The sections were attached to Superfrost-plus glass
slides (Fisher Scientific) for immunofluorescence staining of AQP2 or
colocalization of CT receptor with either calbindin or AQP2. First, to
quantify the effect of CT on AQP2 trafficking, the kidney sections
were rehydrated in PBS for 20 minutes and then incubated in PBS
containing 1% bovine serum albumin for 15 minutes to block non-
Figure 10. CT has no effect on either the level of AQP2 protein ormRNA expression in kidney cortex. The effect of CT on AQP2 expres-sion in the kidney cortex was investigated at the protein (A and B) andgene level (C) using Western blot and real-time PCR techniques. Cortexof the untreated and treated rats (24 hours CT) were homogenized andseparated by SDS-PAGE. Each lane represents a single animal. Westernblot analysis (A) was performed on three different control tissues (lanes1 to 3) and CT-treated rat kidneys (lanes 4 to 6). AQP2 was detected byWestern blot using an anti-AQP2 antibody directed against the secondextracellular region of AQP2. Densitometric analysis of Western blot (B)of immunodetected AQP2 (28 kD) and the glycosylated band around40 kD was performed. The band intensities were normalized by loadingcontrols. The average intensity of three untreated rats (solid bar) was NScompared with the average band intensity of CT-treated rats (open bar).The data are the means � SD (n � 3). Real-time PCR (C) showed that CTdid not affect AQP2 or CT receptor mRNA. Real-time PCR analysisshowed no effect on the level of AQP2 and CT receptor mRNA in ratstreated for 24 hours with calcitonin (open bar) compared with the levelsof AQP2 mRNA in untreated rats (solid bar). The data are the means �SD (n � 3).
BASIC RESEARCH www.jasn.org
68 Journal of the American Society of Nephrology J Am Soc Nephrol 22: 59–72, 2011

specific staining. The sections were incubated with a previously char-
acterized antiserum raised against the second extracellular loop of
AQP280 (diluted 1:100 in PBS) for 1 hour at room temperature, fol-
lowed by a 15-minute wash in high-salt PBS (containing 2.7% NaCl)
to reduce background staining and two 5-minute washes in PBS. The
sections were then incubated with donkey anti-rabbit IgG conjugated
to fluorescein (FITC) at a final concentration of 11 �g/ml (Jackson
ImmunoResearch) for 1 hour at room temperature and then washed
as for the primary antibody. Kidney tissues were then incubated with
ascites fluid (diluted 1:600 in PBS) containing mouse monoclonal
anti-calbindin antibodies (Sigma). The sections were washed and in-
cubated with 1.5 �g/ml of donkey anti-mouse IgG conjugated to CY3
(Jackson ImmunoResearch) and then mounted in Vectashield (Vec-
tor Labs) diluted 2:1 in 0.1 M Tris-HCl, pH 8.0. Mounted slides were
examined using a Nikon Eclipse E800 epifluorescence microscope
equipped with a 40 � 1.0NA Plan Apo objective, and the images were
captured digitally using a Hamamatsu Orca CCD camera and IPLab
Spectrum software (Scanalytic, Vienna, VA).
To confirm the site of action of CT, we performed an immuno-
staining essay to observe colocalization of the CT receptor with either
calbindin, a marker of the cortical connecting segment or AQP2, a
marker of collecting duct principal cells. After rehydration, the tissue
sections were incubated for 10 minutes at 90°C in EDTA buffer pH 9.0
(Thermo Fisher Scientific, Waltham, MA). One hour after the heat-
induced antigen retrieval treatment, the tissue sections were incu-
bated with PBS containing 1% donkey serum for 15 minutes to block
nonspecific staining. The sections were incubated with antibodies
against the second extracellular loop of AQP2 or the mouse monoclo-
nal anti-calbindin antibody as described above. The sections were
then incubated for 1 hour with either donkey anti-rabbit IgG or anti-
mouse IgG conjugated to fluorescein (FITC) (11 �g/ml) (Jackson
ImmunoResearch). The sections were washed and then incubated for
12 hours at 4°C with goat anti-CT receptor (2 �g/ml; Santa Cruz
Biotechnology, Santa Cruz, CA) in the presence or the absence of
immunizing peptide peptide as a control (20 �g/ml). After incuba-
tion, the sections were washed and incubated with 1.5 �g/ml of don-
key anti-goat IgG conjugated to CY3 and then mounted in Vectash-
ield (Vector Labs) diluted 2:1 in 0.1 M Tris-HCl, pH 8.0. The
mounted slides were examined using a confocal microscope.
Apical AQP2 Fluorescence QuantificationTo quantify the fluorescence of AQP2 labeling at the apical mem-
brane, the images from sections incubated with antibodies at the same
time were collected using the same exposure time, which was set so
that the brightest images were not saturated. After collection, the im-
ages were analyzed with IPLab Spectrum software. All of the cells used
for quantification had a complete spherical nucleus, and apical and
basolateral membranes were clearly delimited. The apical area occu-
pied by AQP2-associated fluorescence in the principal cells was mea-
sured in a defined region of interest. The apical AQP2-associated flu-
orescence pixels were taken into account if they had an intensity that
was twice the background value. Background intensity levels were
defined as twice the mean pixel intensity of the nucleus. The total area
of the highlighted pixels at the apical pole of the cells was quantified
from at least 20 cells. As we have previously described,77 a reduction in
total area occupied by AQP2 fluorescence reflects a concentration of
the AQP2 protein in the apical pole and apical membrane of the cell
caused, in this case, by the action of CT. Between 30 and 60 measure-
ments were taken for each sample, and the samples were taken from at
least three different controls and experimental sets of tissue. The re-
sults are expressed as the means � SEM of the pixel area occupied by
the fluorescence signal. Statistical analyses were performed using the t
test. The differences were considered significant at P values less than
0.05.
Immunogold Labeling of AQP2 at the PlasmaMembrane: Effect of CTFifty-�m vibratome sections of PLP perfused kidneys were cut and
hydrated 5 for minutes in PBS and then incubated 5 minutes in PBS
containing 1% SDS. The sections were washed four times in PBS and
then blocked for 30 minutes in PBS, 1% BSA. The sections were incu-
bated for 12 hours at 4°C with the AQP2 extracellular domain anti-
body followed by three washes in PBS and then incubated 12 hours at
4°C with goat-anti-rabbit antibody conjugated to 15-nm gold parti-
cles (Ted Pella, Redding, CA; 1.4 �g/ml). After incubation, the sec-
tions were washed three times with PBS, rinsed twice with 0.1 M
cacodylate buffer, and then fixed in 1% glutaraldehyde diluted in 0.1
M cacodylate buffer. The sections were postfixed in 1% osmium tet-
roxide (Electron Microscopy Sciences, Fort Washington, PA) in 0.1 M
cacodylate buffer, dehydrated in a series of ascending graded alcohols,
pre-embedded in alcohol:Epon (1:1) for 12 hours to 100% EPON
(Ted Pella), then flat-embedded in 100% EPON on slides and cover-
slips coated with liquid release agent, and polymerized for 12 hours at
60°C.
The cortical regions of the flat-embedded sections were cut out
and re-embedded in Epon in flat molds again for 12 hours at 60°C.
Ninety-nm sections were cut on a Reichert (Depew, NY) ultramic-
rotome and collected on Formvar-coated grids. The cells were stained
with 2% uranyl acetate, rinsed in distilled water, and further con-
trasted with lead citrate for 5 minutes. The samples were examined
and photographed at 80 kv with a JEOL (Tokyo, Japan) 1011 electron
microscope equipped with an AMT (Danvers, MA) digital camera.
Image analysis was performed as described previously81 with ImageJ
software (National Institutes of Health, Bethesda, MD).
Electrophoresis and Western Blot AnalysisThe effect of 24 hours of CT perfusion on AQP2 expression in the rat
kidney cortex was studied by Western blot analysis. The kidneys of
anesthetized Brattleboro rats with subcutaneous pumps containing
buffer or CT for 24 hours were harvested, and the cortex was separated
for analysis. Protein electrophoresis and Western blotting was per-
formed as described previously.77 In brief, approximately 20 mg of
cortical proteins were solubilized in radioimmune precipitation assay
buffer (Boston Bioproducts, Boston, MA), 4 mM EDTA, and protease
inhibitor (Roche Diagnostics), and the lysates were separated on 4 to
12% Bis-Tris-PAGE gel (Invitrogen) and then transferred onto poly-
vinylidene difluoride membranes (Bio-Rad, Hercules, CA). The pres-
ence of AQP2 was detected using a polyclonal rabbit anti-AQP2 anti-
body (1:500) and revealed using an Amdex goat anti-rabbit IgG-
horseradish peroxidase (1:100,000 dilution; Amersham, Little
BASIC RESEARCHwww.jasn.org
J Am Soc Nephrol 22: 59–72, 2011 Calcitonin Stimulates Urine Concentration 69

Chalfont, United Kingdom). The proteins were visualized using a
Western Lightning chemiluminescence reagent plus system
(PerkinElmer Life Sciences, Boston, MA). For reblotting, acid-
stripped membranes were incubated with a mouse anti-pan-actin an-
tibody (0.2 �g/ml; Chemicon International, Temecula, CA) and used
as loading control. All of the Kodak BioMax XAR films (Fisher Scien-
tific) were scanned, and the band intensities were quantified using
IPLab software (BD Biosciences, San Jose, CA).
Total RNA Extraction and Quantitative RT-PCRThe extraction and quantitative RT-PCR was performed as described
previously.82In brief, the tissues were homogenized in Ambion TRI
reagent, and RNA was isolated following the RiboPure kit protocol
(Applied Biosystems, Foster City, CA). Genomic DNA contamination
was eliminated using the Ambion DNA-free kit. DNA-free total RNA
samples were aliquoted and stored at �80°C. The samples were re-
verse-transcribed for 1 hour at 42°C in a final volume of 50 �l with 1�
buffer II, 5 mM MgCl2, 1.0 mM each dNTP, 1 unit/�l RNase inhibi-
tor, 2.5 �M random hexamers, and 2.5 units/�l murine leukemia
virus reverse transcriptase (all RT reagents were from Applied Biosys-
tems). Reverse transcription products were used as templates for
quantitative PCR. The sequences of PCR primer sets (synthesized
by Invitrogen) are as follows: RC1AR-F1 (GTGGCCCTTG-
GATACTGAGA) and RC1AR-R1 (TTGTACCAGAGCTGCCT-
GAA) for the CT receptor; RAQP2-TMF1 (CCCTCTCCATTG-
GTTTCTCTGT) and RAQP2-TMR1 (GGCTGGATTCATGG-
AGCAA) for aquaporin 2; and RGAPDH-TMF1 (AGAGA-
GAGGCCCTCAGTTGCT) and RGAPDH-TMR1 (TGGAATTGT-
GAGGGAGATGCT) for glyceraldehyde-3-phosphate dehydroge-
nase. Quantitative PCR analysis was performed with a 7300 Real-
Time PCR System (Applied Biosystems). Each reaction was
performed in triplicate by using the iTaq SYBR Green Supermix
with ROX reagent (Bio-Rad). A dissociation curve was generated
after each SYBR Green PCR run to confirm the specificity of the
amplification, and relative quantification was performed using the
“��Ct” method.
ACKNOWLEDGMENTS
This work was supported by National Institutes of Health grant
PO1DK38452 (DB). R. Bouley received an investigator award from
the National Kidney Foundation. P. Nunes was supported by a Doc-
toral Level Postgraduate Scholarship from the Natural Sciences and
Engineering Research Council of Canada, and H. A. J. Lu was sup-
ported by NIDDK, National Institutes of Health Grant K08 DK-
075940-01. The Microscopy Core facility of the Massachusetts Gen-
eral Hospital Program in Membrane Biology receives additional
support from the Boston Area Diabetes and Endocrinology Research
Center (grant DK57521) and the Center for the Study of Inflamma-
tory Bowel Disease (grant DK43341). This work had been partially
presented at the American Society of Nephrology meeting 2009.
DISCLOSURESNone.
REFERENCES
1. Bichet DG, Razi M, Arthus MF, Lonergan M, Tittley P, Smiley RK, RockG, Hirsch DJ: Epinephrine and dDAVP administration in patients withcongenital nephrogenic diabetes insipidus: Evidence for a pre-cyclicAMP V2 receptor defective mechanism. Kidney Int 36: 859–866, 1989
2. Canfield MC, Tamarappoo BK, Moses AM, Verkman AS, Holtzman EJ:Identification and characterization of aquaporin-2 water channel mu-tations causing nephrogenic diabetes insipidus with partial vasopres-sin response. Hum Mol Genet 6: 1865–1871, 1997
3. Vargas-Poussou R, Forestier L, Dautzenberg MD, Niaudet P, DechauxM, Antignac C: Mutations in the vasopressin V2 receptor and aqua-porin-2 genes in 12 families with congenital nephrogenic diabetesinsipidus. J Am Soc Nephrol 8: 1855–1862, 1997
4. Brown D: The ins and outs of aquaporin-2 trafficking. Am J PhysiolRenal Physiol 284: F893–F901, 2003
5. Deen PM, Verdijk MA, Knoers NV, Wieringa B, Monnens LA, van OsCH, van Oost BA: Requirement of human renal water channel aqua-porin-2 for vasopressin-dependent concentration of urine. Science264: 92–95, 1994
6. Deen PM, Brown D: Trafficking of native and mutant mammalian MIPproteins. In: Aquaporins: Current Topics in Membranes, edited byHohmann S, NSAAP, New York, Academic Press, 2001, pp 235–276
7. Nedvetsky PI, Tamma G, Beulshausen S, Valenti G, Rosenthal W,Klussmann E: Regulation of aquaporin-2 trafficking. Handb Exp Phar-macol 133–157, 2009
8. Nielsen S, Frokiaer J, Marples D, Kwon TH, Agre P, Knepper MA:Aquaporins in the kidney: From molecules to medicine. Physiol Rev82: 205–244, 2002
9. Procino G, Mastrofrancesco L, Mira A, Tamma G, Carmosino M, EmmaF, Svelto M, Valenti G: Aquaporin 2 and apical calcium-sensing recep-tor: New players in polyuric disorders associated with hypercalciuria.Semin Nephrol 28: 297–305, 2008
10. Sasaki S, Kuwahara M, Yamashita Y, Marumo F: Structure and functionof AQP2. Nephrol Dial Transplant 15[Suppl 6[: 21–22, 2000
11. Fushimi K, Sasaki S, Marumo F: Phosphorylation of serine 256 isrequired for cAMP-dependent regulatory exocytosis of the aqua-porin-2 water channel. J Biol Chem 272: 14800–14804, 1997
12. Katsura T, Gustafson CE, Ausiello DA, Brown D: Protein kinase Aphosphorylation is involved in regulated exocytosis of aquaporin-2 intransfected LLC-PK1 cells. Am J Physiol 272: F817–F822, 1997
13. Bouley R, Hasler U, Lu HA, Nunes P, Brown D: Bypassing vasopressinreceptor signaling pathways in nephrogenic diabetes insipidus. SeminNephrol 28: 266–278, 2008
14. Bouley R, Breton S, Sun T, McLaughlin M, Nsumu NN, Lin HY, AusielloDA, Brown D: Nitric oxide and atrial natriuretic factor stimulate cGMP-dependent membrane insertion of aquaporin 2 in renal epithelial cells.J Clin Invest 106: 1115–1126, 2000
15. Bouley R, Lin HY, Raychowdhury MK, Marshansky V, Brown D, AusielloDA: Downregulation of the vasopressin type 2 receptor after vaso-pressin-induced internalization: Involvement of a lysosomal degrada-tion pathway. Am J Physiol Cell Physiol 288: C1390–C401, 2005
16. de Rouffignac C, Elalouf JM: Effects of calcitonin on the renal concen-trating mechanism. Am J Physiol 245: F506–F511, 1983
17. de Rouffignac C, Imbert-Teboul M: Effects of antidiuretic hormone onrenal reabsorption of electrolytes. Adv Nephrol Necker Hosp 13:297–317, 1984
18. Carney S, Thompson L: Acute effect of calcitonin on rat renal electro-lyte transport. Am J Physiol 240: F12–F16, 1981
19. Copp DH, Cheney B: Calcitonin: A hormone from the parathyroidwhich lowers the calcium-level of the blood. Nature 193: 381–382,1962
20. Hirsch PF, Gauthier GF, Munson PL: Thyroid Hypocalcemic Principleand Recurrent Laryngeal Nerve Injury as Factors Affecting the Re-sponse to Parathyroidectomy in Rats. Endocrinology 73: 244–252,1963
BASIC RESEARCH www.jasn.org
70 Journal of the American Society of Nephrology J Am Soc Nephrol 22: 59–72, 2011

21. Koszegi T: Immunoluminometric detection of human procalcitonin.J Biochem Biophys Methods 53: 157–164, 2002
22. Morgenthaler NG, Struck J, Chancerelle Y, Weglohner W, Agay D,Bohuon C, Suarez-Domenech V, Bergmann A, Muller B: Production ofprocalcitonin (PCT) in non-thyroidal tissue after LPS injection. HormMetab Res 35: 290–295, 2003
23. Evanson JM, Garner A, Holmes AM, Lumb GA, Stanbury SW: Interre-lations between thyrocalcitonin and parathyroid hormone in rats. ClinSci 32: 271–278, 1967
24. Gudmundsson TV, MacIntyre I, Soliman HA: The isolation of thyrocal-citonin and a study of its effects in the rat. Proc R Soc Lond B Biol Sci164: 460–477, 1966
25. Morii H, DeLuca HF: Relationship between vitamin D deficiency, thy-rocalcitonin, and parathyroid hormone. Am J Physiol 213: 358–362,1967
26. Munson PL, Hirsch PF: Thyrocalcitonin: newly recognized thyroid hor-mone concerned with metabolism of bone. Clin Orthop Relat Res 49:209–232, 1966
27. Gorn AH, Lin HY, Yamin M, Auron PE, Flannery MR, Tapp DR, ManningCA, Lodish HF, Krane SM, Goldring SR: Cloning, characterization, andexpression of a human calcitonin receptor from an ovarian carcinomacell line. J Clin Invest 90: 1726–1735, 1992
28. Kuestner RE, Elrod RD, Grant FJ, Hagen FS, Kuijper JL, Matthewes SL,O’Hara PJ, Sheppard PO, Stroop SD, Thompson DL, Whitmore TE,Findlay DM, Houssami S, Sexton PM, Moore EE: Cloning and charac-terization of an abundant subtype of the human calcitonin receptor.Mol Pharmacol 46: 246–255, 1994
29. Lin HY, Harris TL, Flannery MS, Aruffo A, Kaji EH, Gorn A, Kola-kowski LF Jr, Lodish HF, Goldring SR: Expression cloning of anadenylate cyclase-coupled calcitonin receptor. Science 254: 1022–1024, 1991
30. Nussenzveig DR, Thaw CN, Gershengorn MC: Inhibition of inositolphosphate second messenger formation by intracellular loop oneof a human calcitonin receptor: Expression and mutational analysisof synthetic receptor genes. J Biol Chem 269: 28123–28129, 1994
31. Blower PJ, Puncher MR, Kettle AG, George S, Dorsch S, Leak A,Naylor LH, O’Doherty MJ: Iodine-123 salmon calcitonin, an imag-ing agent for calcitonin receptors: synthesis, biodistribution, me-tabolism and dosimetry in humans. Eur J Nucl Med 25: 101–108,1998
32. de Luise M, Martin TJ, Greenberg PB, Michelangeli V: Metabolism ofporcine, human and salmon calcitonin in the rat. J Endocrinol 53:475–482, 1972
33. Marx SJ, Woodward C, Aurbach GD, Glossmann H, Keutmann HT:Renal receptors for calcitonin. Binding and degradation of hormone.J Biol Chem 248: 4797–4802, 1973
34. Newsome FE, O’Dor RK, Parkes CO, Copp DH: A study of the stabilityof calcitonin biological activity. Endocrinology 92: 1102–1106, 1973
35. Scarpace PJ, Neuman WF, Raisz LG: Metabolism of radioiodinatedsalmon calcitonin in rats. Endocrinology 100: 1260–1267, 1977
36. Scarpace PJ, Parthemore JG, Deftos LJ: The distribution of biologi-cally active and inactive radioiodinated human calcitonin in the rat.Endocrinology 103: 128–132, 1978
37. Chai SY, Christopoulos G, Cooper ME, Sexton PM: Characterization ofbinding sites for amylin, calcitonin, and CGRP in primate kidney. Am JPhysiol 274: F51–F62, 1998
38. Morel F: Sites of hormone action in the mammalian nephron. Am JPhysiol 240: F159–F164, 1981
39. Chabardes D, Gagnan-Brunette M, Imbert-Teboul M, Gontcharevs-kaia O, Montegut M, Clique A, Morel F: Adenylate cyclase respon-siveness to hormones in various portions of the human nephron. J ClinInvest 65: 439–448, 1980
40. Chabardes D, Imbert-Teboul M, Montegut M, Clique A, Morel F:Distribution of calcitonin-sensitive adenylate cyclase activity along therabbit kidney tubule. Proc Natl Acad Sci U S A 73: 3608–3612, 1976
41. Morel F, Chabardes D, Imbert-Teboul M, Le Bouffant F, Hus-
Citharel A, Montegut M: Multiple hormonal control of adenylatecyclase in distal segments of the rat kidney. Kidney Int Suppl 11:S55–S62,1982
42. Sexton PM, Adam WR, Moseley JM, Martin TJ, Mendelsohn FA:Localization and characterization of renal calcitonin receptors by invitro autoradiography. Kidney Int 32: 862–868, 1987
43. Firsov D, Bellanger AC, Marsy S, Elalouf JM: Quantitative RT-PCRanalysis of calcitonin receptor mRNAs in the rat nephron. Am J Physiol269: F702–F709, 1995
44. Dayer JM, Vassalli JD, Bobbitt JL, Hull RN, Reich E, Krane SM: Calci-tonin stimulates plasminogen activator in porcine renal tubular cells:LLC-PK1. J Cell Biol 91: 195–200, 1981
45. Jans DA, Resink TJ, Wilson LE, Reich E, Hemmings BA: Isolation of amutant LLC-PK1 cell line defective in hormonal responsiveness: Apleiotropic lesion in receptor function. Eur J Biochem 160: 407–412,1986
46. Nunes P, Hasler U, McKee M, Lu HA, Bouley R, Brown D: A fluorim-etry-based ssYFP secretion assay to monitor vasopressin-induced exo-cytosis in LLC-PK1 cells expressing aquaporin-2. Am J Physiol CellPhysiol 295: C1476–C1487, 2008
47. Edwards BR, LaRochelle FT Jr, Gellai M: Concentration of urine bydehydrated Brattleboro homozygotes: Is there a role for oxytocin?Ann N Y Acad Sci 394: 497–502, 1982
48. Laycock JF, Lee J, Lewis AF: The effect of chlorpropamide on water balancein pitressin-treated Brattleboro rats. Br J Pharmacol 52: 253–263, 1974
49. Valtin H, Schroeder HA: Familial Hypothalamic Diabetes Insipidus inRats (Brattleboro Strain). Am J Physiol 206: 425–430, 1964
50. Forsling ML, Judah JM, Windle RJ: The effect of vasopressin andoxytocin on glomerular filtration rate in the conscious rat: contributionto the natriuretic response. J Endocrinol 141: 59–67, 1994
51. Gellai M, Silverstein JH, Hwang JC, LaRochelle FT Jr, Valtin H: Influ-ence of vasopressin on renal hemodynamics in conscious Brattlebororats. Am J Physiol 246: F819–F827, 1984
52. Brown D, Hasler U, Nunes P, Bouley R, Lu HA: Phosphorylation eventsand the modulation of aquaporin 2 cell surface expression. Curr OpinNephrol Hypertens 17: 491–498, 2008
53. Moeller HB, MacAulay N, Knepper MA, Fenton RA: Role of multiplephosphorylation sites in the COOH-terminal tail of aquaporin-2 forwater transport: Evidence against channel gating. Am J Physiol RenalPhysiol 296: F649–F657, 2009
54. Nickols HH, Shah VN, Chazin WJ, Limbird LE: Calmodulin interactswith the V2 vasopressin receptor: Elimination of binding to the Cterminus also eliminates arginine vasopressin-stimulated elevation ofintracellular calcium. J Biol Chem 279: 46969–46980, 2004
55. Chou CL, Yip KP, Michea L, Kador K, Ferraris JD, Wade JB, KnepperMA: Regulation of aquaporin-2 trafficking by vasopressin in the renalcollecting duct: Roles of ryanodine-sensitive Ca2 stores and calmod-ulin. J Biol Chem 275: 36839–36846, 2000
56. Siga E, Champigneulle A, Imbert-Teboul M: cAMP-dependent effectsof vasopressin and calcitonin on cytosolic calcium in rat CCD. Am JPhysiol 267: F354–F365, 1994
57. Siga E, Mandon B, Roinel N, de Rouffignac C: Effects of calcitonin onfunction of intercalated cells of rat cortical collecting duct. Am JPhysiol 264: F221–F227, 1993
58. Hozawa S, Holtzman EJ, Ausiello DA: cAMP motifs regulating transcription inthe aquaporin 2 gene. Am J Physiol 270: C1695–C702, 1996
59. Matsumura Y, Uchida S, Rai T, Sasaki S, Marumo F: Transcriptionalregulation of aquaporin-2 water channel gene by cAMP. J Am SocNephrol 8: 861–867, 1997
60. Yasui M, Zelenin SM, Celsi G, Aperia A: Adenylate cyclase-coupledvasopressin receptor activates AQP2 promoter via a dual effect onCRE and AP1 elements. Am J Physiol 272: F443–F450, 1997
61. Yano Y, Cesar KR, Araujo M, Rodrigues AC Jr, Andrade LC, Magaldi AJ:Aquaporin 2 expression increased by glucagon in normal rat inner medullarycollecting ducts. Am J Physiol Renal Physiol 296: F54–F59, 2009
BASIC RESEARCHwww.jasn.org
J Am Soc Nephrol 22: 59–72, 2011 Calcitonin Stimulates Urine Concentration 71

62. Chesnut CH, 3rd, Azria M, Silverman S, Engelhardt M, Olson M,Mindeholm L: Salmon calcitonin: A review of current and future ther-apeutic indications. Osteoporos Int 19: 479–491, 2008
63. Keeler R, Walker V, Copp DH: Natriuretic and diuretic effects ofsalmon calcitonin in rats. Can J Physiol Pharmacol 48: 838–841, 1970
64. Twery MJ, Obie JF, Cooper CW: Ability of calcitonins to alter food andwater consumption in the rat. Peptides 3: 749–755, 1982
65. Del Prete E, Schade B, Riediger T, Lutz TA, Scharrer E: Effects ofamylin and salmon calcitonin on feeding and drinking behavior inpygmy goats. Physiol Behav 75: 593–599, 2002
66. Plata-Salaman CR, Oomura Y: Calcitonin effect on the dipsogenicresponse to intra-cerebroventricular administration of angiotensin II.Physiol Behav 40: 515–521, 1987
67. Riediger T, Schmid HA, Young AA, Simon E: Pharmacological charac-terisation of amylin-related peptides activating subfornical organ neu-rones. Brain Res 837: 161–168, 1999
68. Otsubo H, Hyodo S, Hashimoto H, Kawasaki M, Suzuki H, Saito T,Ohbuchi T, Yokoyama T, Fujihara H, Matsumoto T, Takei Y, Ueta Y:Centrally administered adrenomedullin 5 activates oxytocin-secretingneurons in the hypothalamus and elevates plasma oxytocin level inrats. J Endocrinol 202: 237–247, 2009
69. Serino R, Ueta Y, Hara Y, Nomura M, Yamamoto Y, Shibuya I, HattoriY, Kitamura K, Kangawa K, Russell JA, Yamashita H: Centrally admin-istered adrenomedullin increases plasma oxytocin level with inductionof c-fos messenger ribonucleic acid in the paraventricular and su-praoptic nuclei of the rat. Endocrinology 140: 2334–2342, 1999
70. Ueta Y, Serino R, Shibuya I, Kitamura K, Kangawa K, Russell JA,Yamashita H: A physiological role for adrenomedullin in rats: A potenthypotensive peptide in the hypothalamo-neurohypophysial system.Exp Physiol 85: 163S–169S, 2000
71. Arletti R, Benelli A, Bertolini A: Oxytocin inhibits food and fluid intakein rats. Physiol Behav 48: 825–830, 1990
72. Fitts DA, Thornton SN, Ruhf AA, Zierath DK, Johnson AK, ThunhorstRL: Effects of central oxytocin receptor blockade on water and salineintake, mean arterial pressure, and c-Fos expression in rats. Am JPhysiol Regul Integr Comp Physiol 285: R1331–R1339, 2003
73. Edwards BR, LaRochelle, FT Jr: Antidiuretic effect of endogenous
oxytocin in dehydrated Brattleboro homozygous rats. Am J Physiol247: F453–F465, 1984
74. Lencer WI, Brown D, Ausiello DA, Verkman AS: Endocytosis of waterchannels in rat kidney: Cell specificity and correlation with in vivoantidiuresis. Am J Physiol 259: C920–C932, 1990
75. Li C, Wang W, Summer SN, Westfall TD, Brooks DP, Falk S, SchrierRW: Molecular mechanisms of antidiuretic effect of oxytocin. J Am SocNephrol 19: 225–232, 2008
76. Bouley R, Hawthorn G, Russo LM, Lin HY, Ausiello DA, Brown D:Aquaporin 2 (AQP2) and vasopressin type 2 receptor (V2R) endocy-tosis in kidney epithelial cells: AQP2 is located in “endocytosis-resis-tant” membrane domains after vasopressin treatment. Biol Cell 98:215–232, 2006
77. Bouley R, Pastor-Soler N, Cohen O, McLaughlin M, Breton S, BrownD: Stimulation of AQP2 membrane insertion in renal epithelial cellsin vitro and in vivo by the cGMP phosphodiesterase inhibitor sil-denafil citrate (Viagra). Am J Physiol Renal Physiol 288: F1103–F1112, 2005
78. Bouley R, Sun, T-X, Chenard M, McLaughlin M, McKee M, Lin HY,Brown D, Ausiello DA: Functional role of the NPxxY motif in internal-ization of the type 2 vasopressin receptor in LLC-PK1 cells. Am JPhysiol Cell Physiol 285: C750–C762, 2003
79. Evan GI, Lewis GK, Ramsay G, Bishop JM: Isolation of monoclonalantibodies specific for human c-myc proto-oncogene product. MolCell Biol 5: 3610–3616, 1985
80. Gustafson CE, Levine S, Katsura T, McLaughlin M, Aleixo MD, Tama-rappoo BK, Verkman AS, Brown D: Vasopressin regulated trafficking ofa green fluorescent protein-aquaporin 2 chimera in LLC-PK1 cells.Histochem Cell Biol 110: 377–386, 1998
81. Paunescu TG, Ljubojevic M, Russo LM, Winter C, McLaughlin MM,Wagner CA, Breton S, Brown D: cAMP stimulates apical V-ATPaseaccumulation, microvillar elongation, and proton extrusion in kidneycollecting duct A-intercalated cells. Am J Physiol Renal Physiol 298:F643–F654, 2010
82. Da Silva N, Silberstein C, Beaulieu V, Pietrement C, Van Hoek AN,Brown D, Breton S: Postnatal expression of aquaporins in epithelialcells of the rat epididymis. Biol Reprod 74: 427– 438, 2006
BASIC RESEARCH www.jasn.org
72 Journal of the American Society of Nephrology J Am Soc Nephrol 22: 59–72, 2011