cagny english light3 - files.shareholder.comfiles.shareholder.com/.../cagny5.pdf · during this...
TRANSCRIPT

1
February 16, 2010

2
Safe harbor statement
During this presentation management may discuss certain forward‐
looking statements concerning FEMSA’s future performance that should
be considered as good faith estimates made by the Company. These
forward‐looking statements reflect management expectations and are
based upon currently available data. Actual results are subject to future
events and uncertainties, which could materially impact FEMSA’s actual
performance.

3
Agenda
FEMSA
OXXO
Coca‐Cola FEMSA
Questions & Answers

4
Delivering consistent double‐digit growth
EBIT(US$ million)
Total Revenue (US$ million)
CAGR 99‐09: 14%
CAGR 04‐09: 12%
CAGR 99‐09: 12%
CAGR 04‐09: 10%
4,075
8,424
14,598
1999 2004 2009
Note: 2009 figures in nominal Mexican pesos converted to US dollars using average exchange rate of the year, prior figures in constant pesos as of year end and converted to US dollars using the period‐end exchange rate.
952
1,810
2,748
1999 2004 2009
638
1,232
2,001

5
FEMSA 2009 snapshot
Despite facing mid‐single‐digit GDP contraction in its markets, FEMSA delivers double‐digit Revenues and EBIT growth
Strong pricing and operating expense containment offset raw material and FX pressures, resulting in 9.3% EBIT growth
Double‐digit EBIT growth supported by operations in Latincentro and Mercosur, and stable growth in Mexico
Stellar results delivering approximately 45% EBIT growth and 180 basis‐point margin expansion
FEMSA (Millions of Pesos as reported)
EBIT+19.1%
Revenues+17.3%
EBITDA+17.1%
168,022197,033
29,011
22,68427,012
4,328
31,68237,090
5,408
2008 2009
2008 2009
2008 2009

6
4,754
14,842
1999 Feb-10
Source: Bloomberg.
Creating economic value during the last decade
FEMSA Market Cap Evolution (US$ million)
• Consistently strengthening our
competitive position
• Ability to operate in a rapidly changing
economic environment
• Strong brand portfolio and exceptional
operational capabilities
CAGR 99 ‐ Feb’10: 12%
7
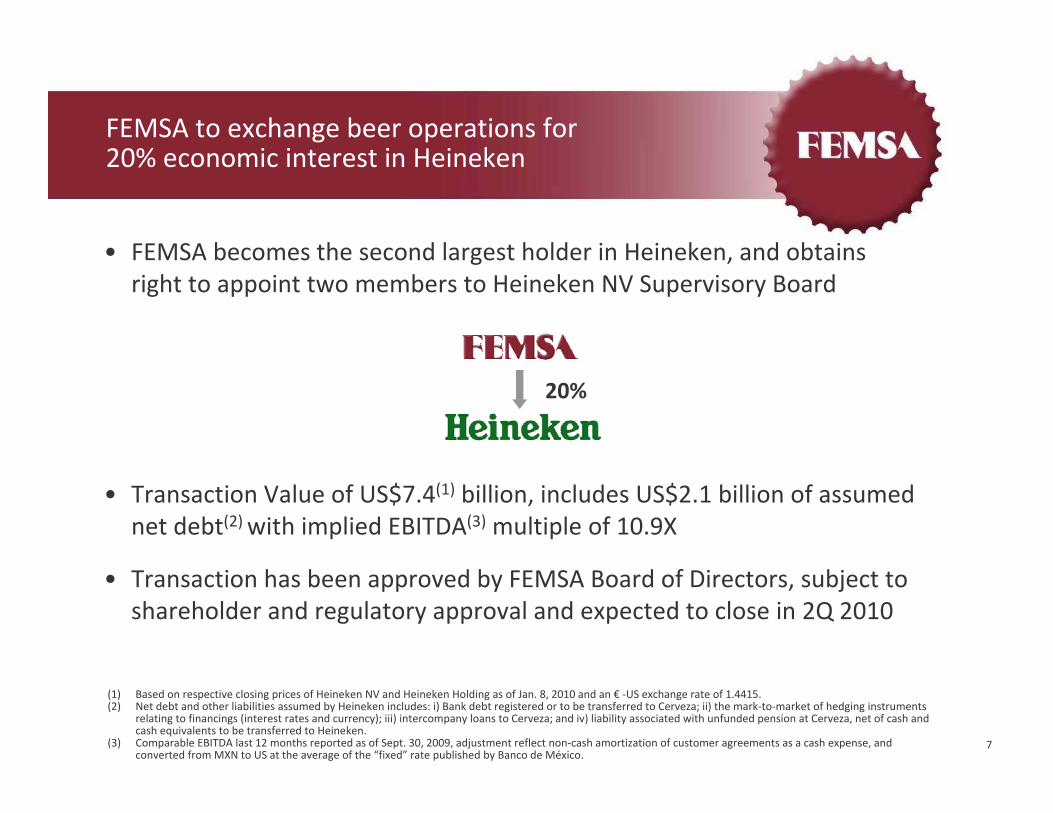
• FEMSA becomes the second largest holder in Heineken, and obtainsright to appoint two members to Heineken NV Supervisory Board
• Transaction Value of US$7.4(1) billion, includes US$2.1 billion of assumed net debt(2) with implied EBITDA(3) multiple of 10.9X
• Transaction has been approved by FEMSA Board of Directors, subject to shareholder and regulatory approval and expected to close in 2Q 2010
FEMSA to exchange beer operations for20% economic interest in Heineken
(1) Based on respective closing prices of Heineken NV and Heineken Holding as of Jan. 8, 2010 and an € ‐US exchange rate of 1.4415.(2) Net debt and other liabilities assumed by Heineken includes: i) Bank debt registered or to be transferred to Cerveza; ii) the mark‐to‐market of hedging instruments
relating to financings (interest rates and currency); iii) intercompany loans to Cerveza; and iv) liability associated with unfunded pension at Cerveza, net of cash and cash equivalents to be transferred to Heineken.
(3) Comparable EBITDA last 12 months reported as of Sept. 30, 2009, adjustment reflect non‐cash amortization of customer agreements as a cash expense, and converted from MXN to US at the average of the “fixed” rate published by Banco de México.
20%

8
Transaction rationale
• Ongoing reconfiguration of the global brewing industry and the resulting need to increase scale and geographic reach to compete effectively, FEMSA has transformed its beer operations in a 20% economic stake in Heineken
• Heineken presented us with the most compelling opportunity
• Heineken has the global footprint, scale, brand building and innovation capabilities, as well as the only truly global beer brand to compete and win on a global scale
• FEMSA’s potential for long‐term value creation is enhanced by this investment and we expect to contribute significantly to Heineken’s success globally and particularly in Mexico

9
FEMSA going forward
53.7% 100% 20%
Largest Coke bottler in Latin America, second largest in the world
Market leader and fastest growing retail
chain in Mexico
The world’s most international brewer
• Combined strength of balanced positions in three leading iconic branded companies should provide significant opportunities for further growth and generate compelling investment returns
• FEMSA has achieved considerable financial and strategic flexibility as a result of this transaction
• Transaction enables FEMSA to focus and concentrate efforts on Coca‐Cola FEMSA and OXXO, continue developing operational excellence, maintain dominant market positions and tap potential growth through acquisition opportunities
• Benefit from participation in Heineken’s future value creation
10
FEMSA
OXXO
Coca‐Cola FEMSA
Questions & Answers
Agenda

11
Accelerated profitable growth
EBIT(US$ million)
Revenue (US$ million)
CAGR 99‐09: 21% CAGR 99‐09: 30%
CAGR 04‐09: 14% CAGR 04‐09: 32%
Note: 2009 figures in nominal Mexican pesos converted to US dollars using average exchange rate of the year, prior figures in constant pesos as of year end and converted to US dollars using the period‐end exchange rate.
14
62
276
1999 2004 2009
330
82
24421
1,477
4,232
1999 2004 2009
3,967
2,048
590
+ 420 pb
4.1%
8.3%

12
OXXO going forward
• Maintain focus on OXXO’s extraordinary growth potential across Mexico and other suitable markets
• Be the most successful convenience store operator
• Continue driving agenda to define the convenience category in the region through the evolution of our value proposition

13
The largest company‐operated store chain in the Americas
Company Operated
Franchise/Licensee
7,9207,334
5,904
4,686 4,6394,144 3,984
2,783
1,898 1,776
Note: 7 Eleven includes US, Canada and Mexico Operations, Alimentation Couche‐Tard includes Canada Operations.Source: CSNews "Top 100 US Convenience Store Companies, 2009."
14
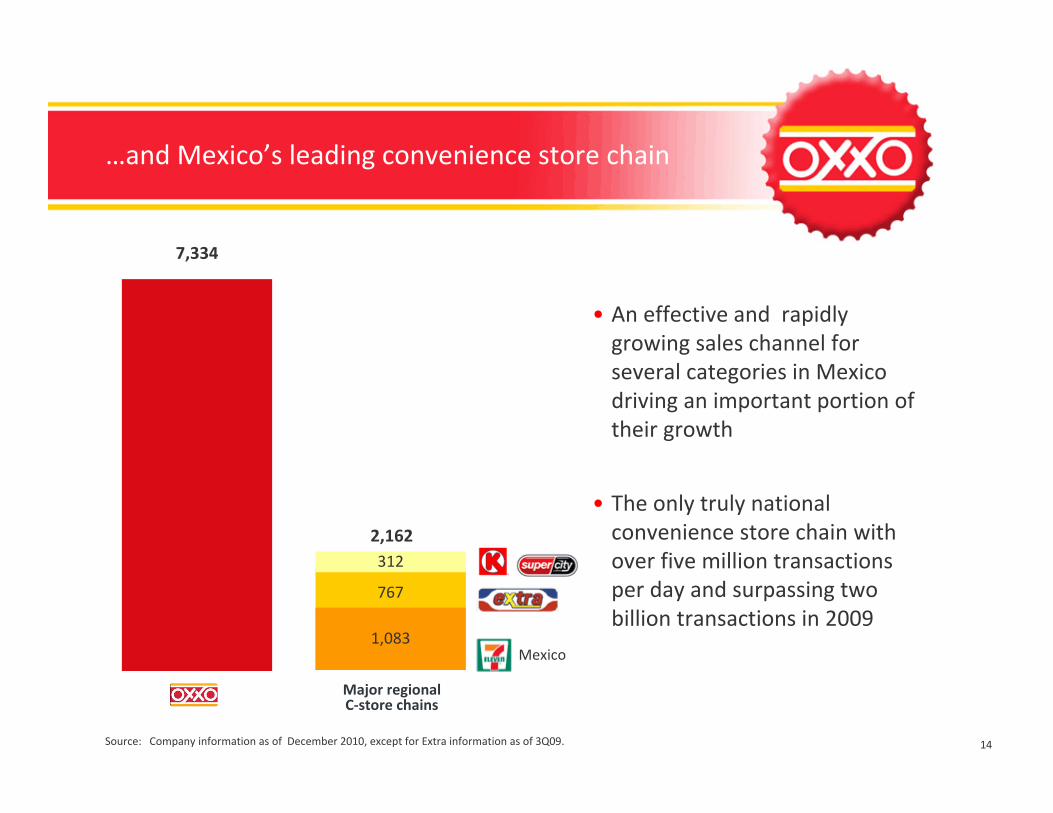
…and Mexico’s leading convenience store chain
Source: Company information as of December 2010, except for Extra information as of 3Q09.
Major regionalC‐store chains
767
1,083
312
2,162
7,334
• An effective and rapidly growing sales channel for several categories in Mexico driving an important portion of their growth
• The only truly national convenience store chain with over five million transactions per day and surpassing two billion transactions in 2009
Mexico
15
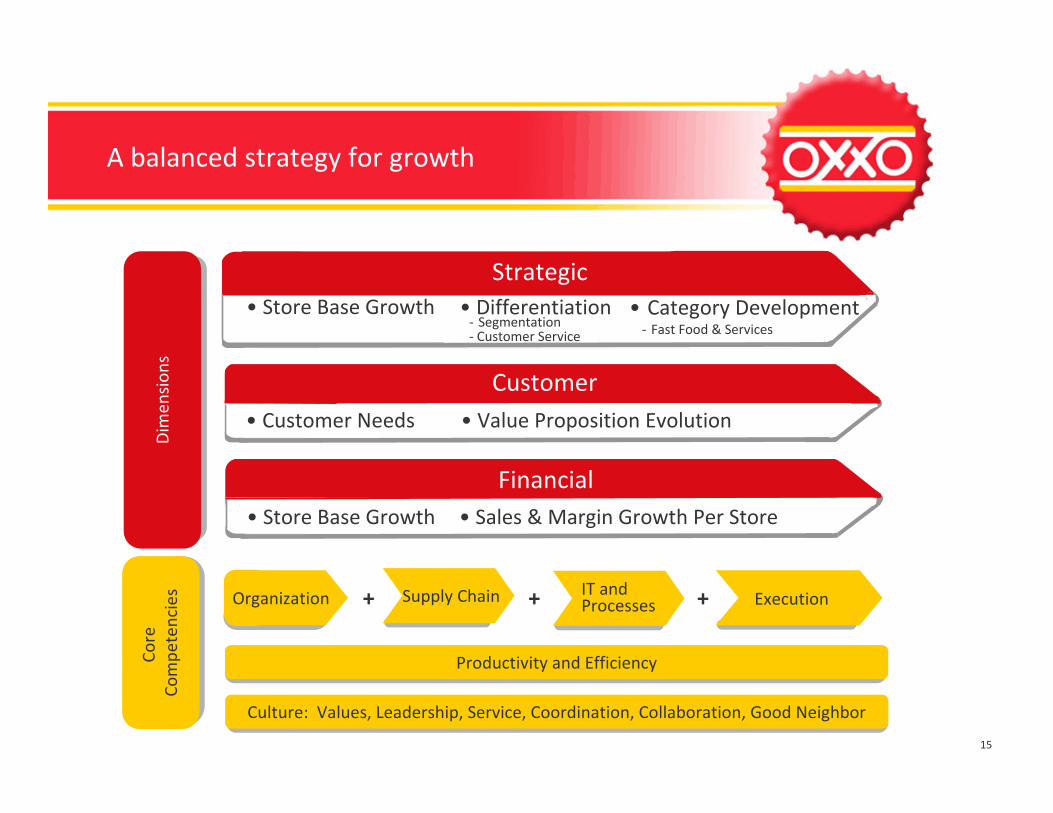
A balanced strategy for growth
Execution
Dim
ension
sCo
re
Compe
tencies ++Organization IT and
ProcessesSupply Chain
Productivity and Efficiency
Culture: Values, Leadership, Service, Coordination, Collaboration, Good Neighbor
+
Strategic
‐ Customer Service‐ Segmentation
• Store Base Growth • Differentiation‐ Fast Food & Services
• Category Development
• Value Proposition Evolution• Customer Needs
Customer
Financial• Store Base Growth • Sales & Margin Growth Per Store
16
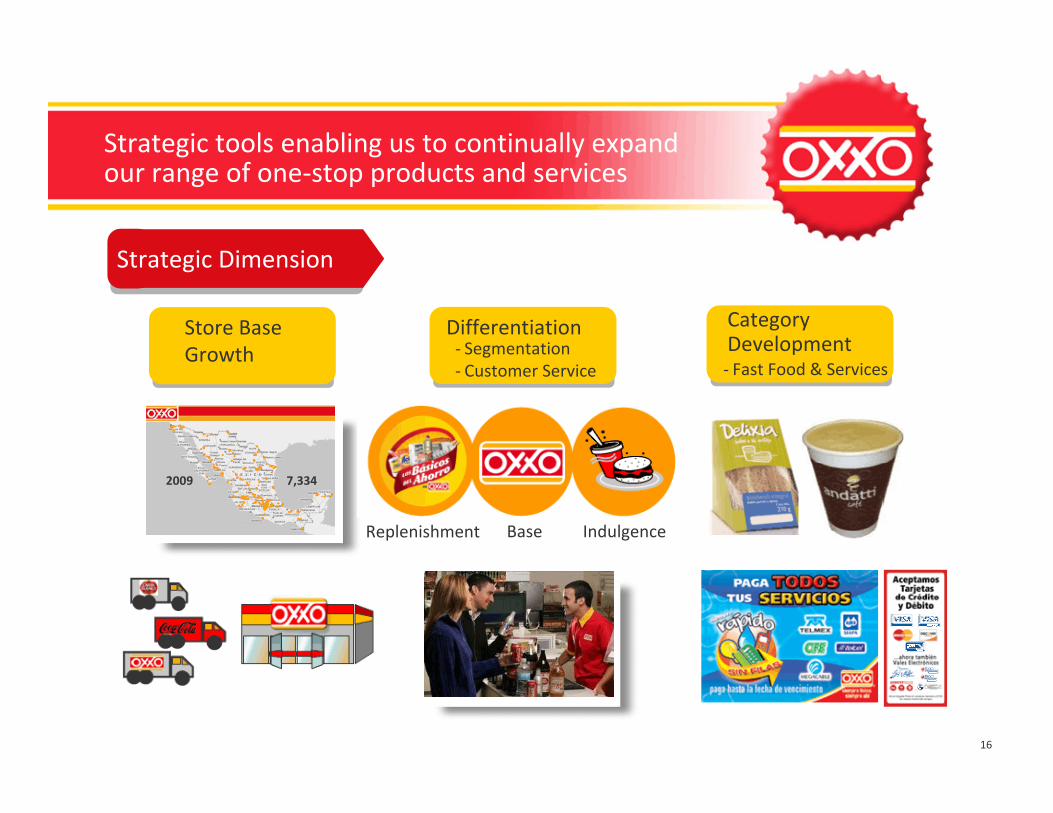
Strategic tools enabling us to continually expand our range of one‐stop products and services
Strategic Dimension
‐ Segmentation‐ Customer Service
Differentiation
‐ Fast Food & Services
Category Development
Store Base Growth
IndulgenceBaseReplenishment
2009 7,334

17
Developing our value proposition to satisfy our customer needs
+ Differentiation
Value Proposition Satisfying Customer Needs
CravingTime
Optimization HungerThirst
Daily GatheringReplenishment
&
Customer Dimension
Nearby
Practical
Reliable
Empathic
Innovative
Attractive
18
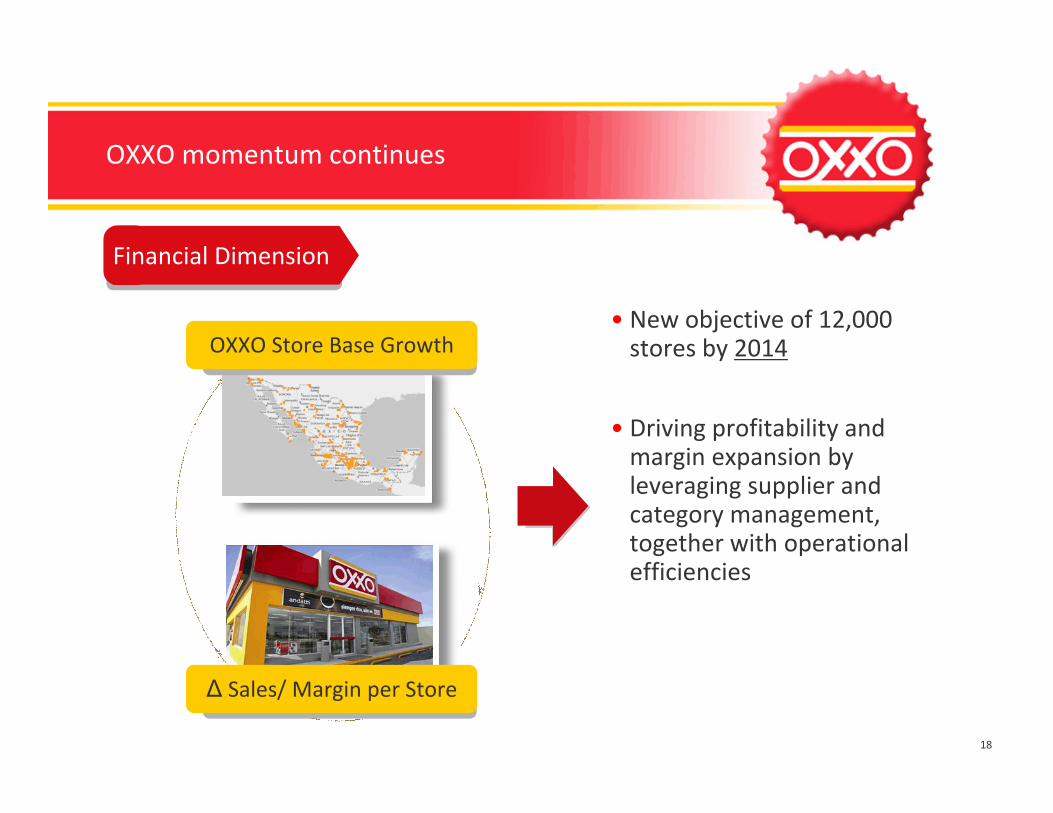
OXXO momentum continues
• New objective of 12,000 stores by 2014
• Driving profitability and margin expansion by leveraging supplier and category management, together with operational efficiencies
Financial Dimension
OXXO Store Base Growth
Δ Sales/ Margin per Store
19
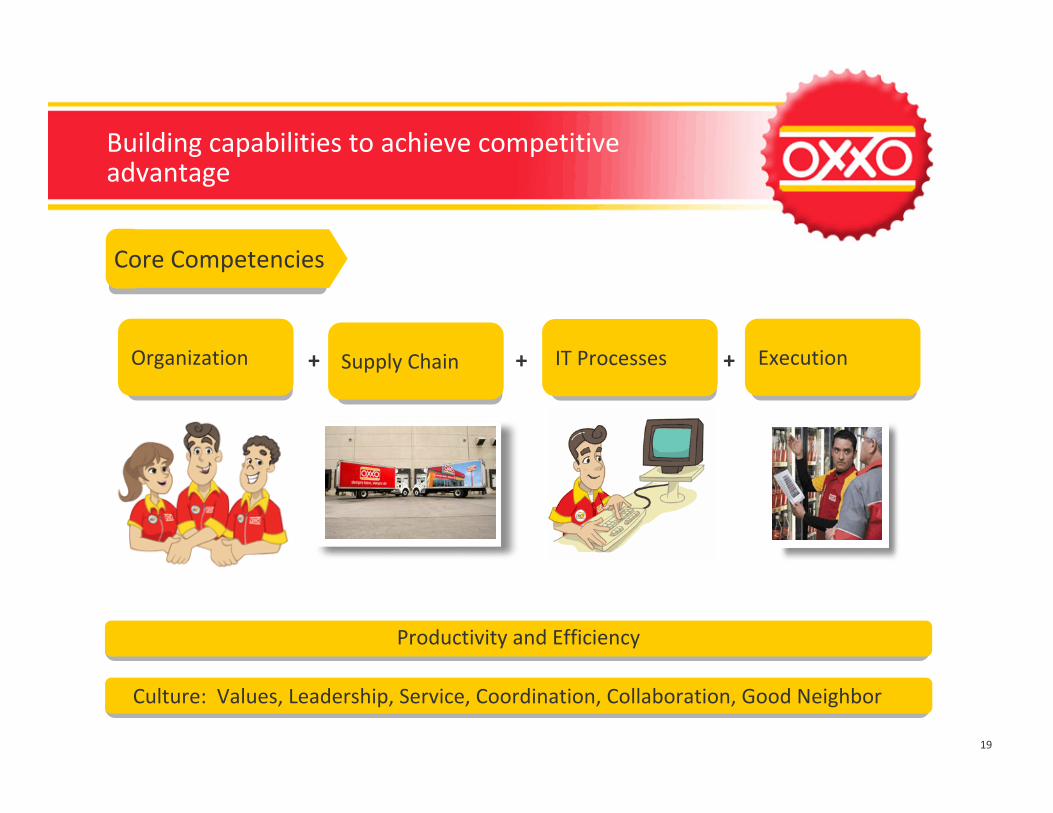
Building capabilities to achieve competitive advantage
Core Competencies
Productivity and Efficiency
Culture: Values, Leadership, Service, Coordination, Collaboration, Good Neighbor
+++ IT ProcessesSupply Chain ExecutionOrganization

20
FEMSA
OXXO
Coca‐Cola FEMSA
Questions & Answers
Agenda
21
Growing through Execution

22
Our history denotes our strong focus on growth through execution
23
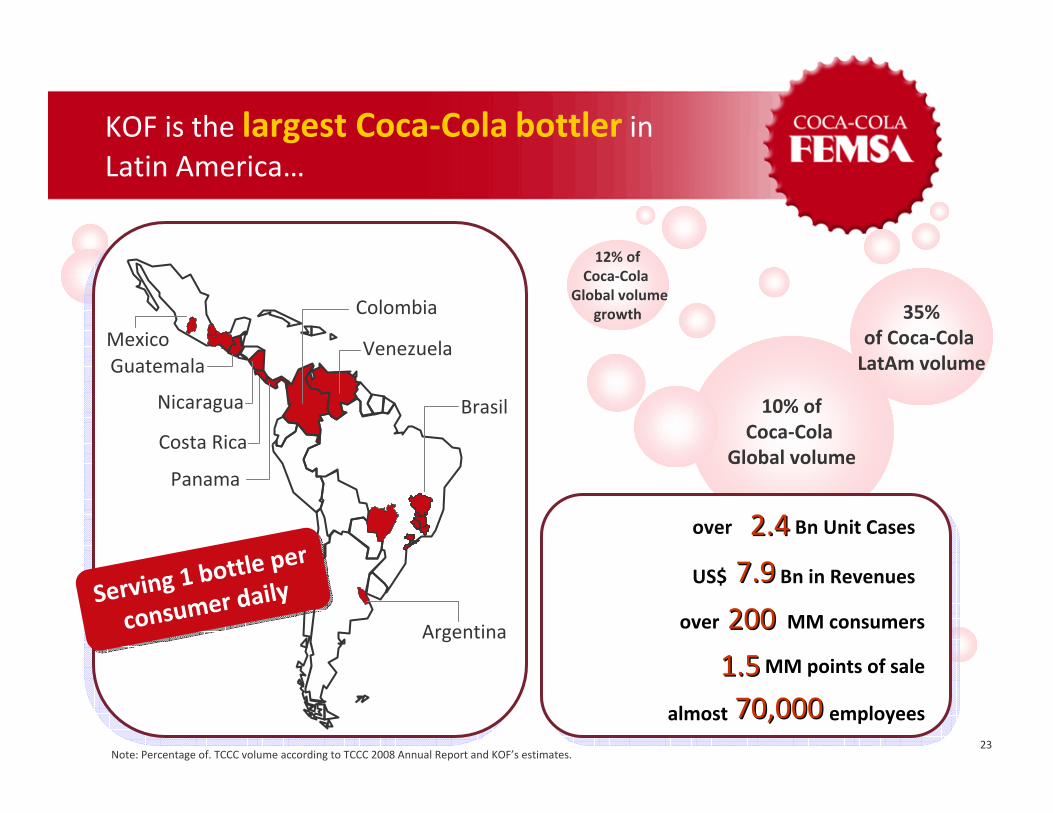
10% ofCoca‐Cola
Global volume
35%of Coca‐Cola LatAm volume
12% ofCoca‐Cola
Global volumegrowth
2.42.4over Bn Unit Cases
US$ Bn in Revenues7.97.9
over MM consumers200200MM points of sale1.51.5
almost employees70,00070,000
MexicoGuatemala
Colombia
Venezuela
BrasilNicaragua
Costa Rica
Panama
Argentina
KOF is the largest Coca‐Cola bottler in Latin America…
Note: Percentage of. TCCC volume according to TCCC 2008 Annual Report and KOF’s estimates.
Serving 1 bottle
per
consumer dailyServing
1 bottle per
consumer daily

24
EBITDA(US$ Bn)
Revenues (US$ Bn)
CAGR 99‐09: 18%
CAGR 03‐09: 17%
CAGR 99‐09: 18%
CAGR 03‐09: 14%
7.9
3.1
1.5
1999 2003 2009
0.3
0.7
1.5
1999 2003 2009
Note: Figures in Nominal Mexican Pesos converted to US Dollars using EOP exchange rate of each year.
Growth 08‐09KOF EBITDA + 15%
KOF Territories GDP ‐ 4%
Growth 08‐09KOF EBITDA + 15%
KOF Territories GDP ‐ 4%
… with a solid growth track record

25
Ever‐changing consumer trends requiring
constant innovation and adaptation
Multi‐category and segmentation driving
complexity(e.g. more SKUs,
new capabilities and service models)
Category convergence, Industry consolidationand tougher competitive
environment
Modern trade development &
emerging channels pressuring our
traditional service model
Requires a more comprehensive approach to
constantly improve
execution
Requires a more comprehensive approach to
constantly improve
execution
As we continue growing, we face more complex challenges…
26
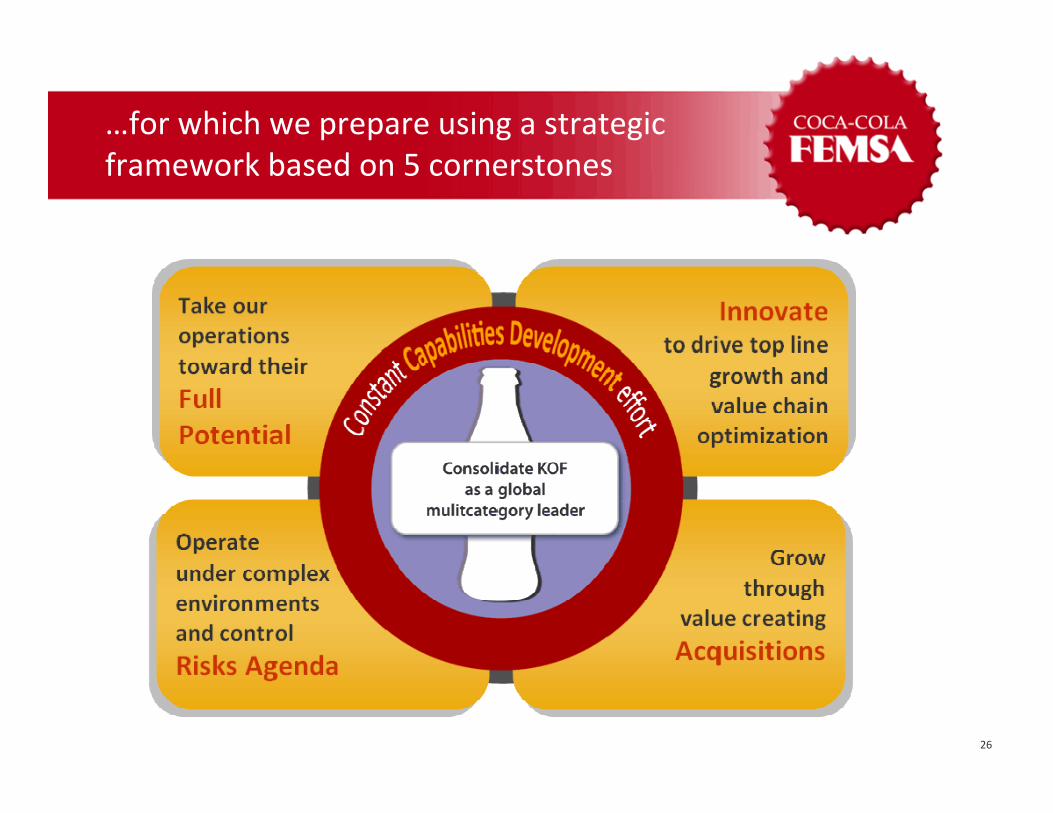
…for which we prepare using a strategic framework based on 5 cornerstones

27
Assets per UC(1)(US$/UC)
Productivity opportunities:Productivity opportunities:
• Distribution network restructuring ‐ Brazil
• Asset reconfiguration –Colombia
• Reconfiguration of plants and DCs –Mexico
•… and we keep on looking for more
Source: KOF Strategic Planning. Figures in Nominal Mexican pesos converted to US Dollars using EOP exchange rate.(1) Property, Plant and Equipment Net (2) Considers all CAPEX, including CAPEX to replace depreciated assets.
1.0
1.6
2009
2004
Capex per Incremental Volume(US$/UC) (1)
2.3
5.6
‐39% ‐60%
Aiming at our full potential, we strongly focus on leveraging existing asset utilization…
Manufacturing Productivity(MM UC / Plant)
78
35
Distribution Productivity(MM UC / DC)
7
12
52 30 244 208
+124% +66%
Plants DCs

28
•Lightest Coca‐Cola Contour
•Short Cap in Mexico 100% (currently rollout in rest of operations)
• 15% recycled content in our packages and doubling it
•Savings:– 35,000 tons of PET / year
– US$ 40 MM / year
•New packages: Re‐sealable can, wrap‐around labeling, etc.
… and continuously invest and innovate in our value chain to maximize productivity
PackagingPackaging Processes and TechnologyProcesses and Technology
• 2009 capacity increase of ~325 MM UC
• Improved water & energy usage ~ US$ 2 MM savings in 2009
• Currently evaluating investments in:
– Warehouse automation (laser guided vehicles, automated picking, warehousing silos)
– Toluca first 1 Lt / 1 Lt of water usage facility
– Heavy manual labor elimination

29
KOF Sparkling, Water and Emerging Categories Volume: 2004 ‐ 2009
(Bn Unit Cases)
Sparkling
Water
Still
2009
2.4
2006
2.0
2004
1.8
StillBeverages
StillBeverages
SparklingSparkling
Opportunity SizeUS$ 4.2 Bn
CAGR(04 –09)
40%
5%
7%
Source: Nielsen, and KOF Strategic Planning Estimates.
Our multi‐category focus has allowed us to grow consistently, yet opportunities remain
… plus US$ 4 to 5 Bn in new categories
WaterWater
OpportunityUS$ 2.0 Bn
Opportunity US$ 1.5 Bn
30
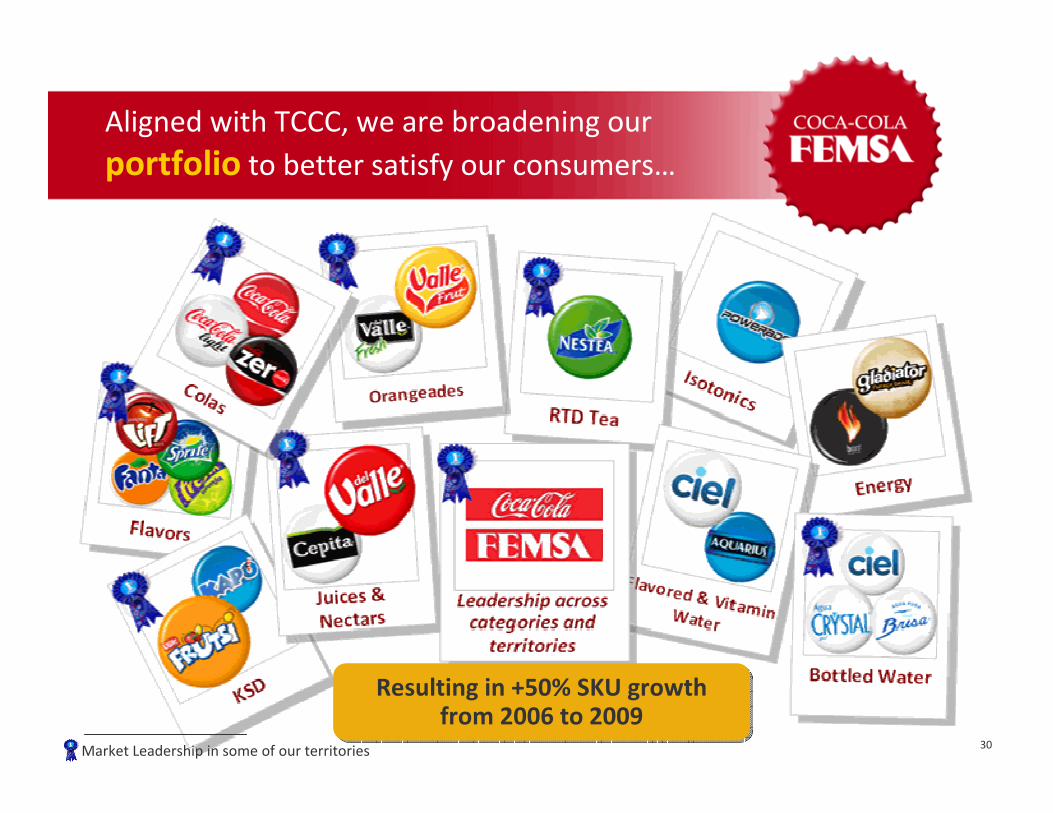
Aligned with TCCC, we are broadening our portfolio to better satisfy our consumers…
Resulting in +50% SKU growth from 2006 to 2009
Resulting in +50% SKU growth from 2006 to 2009
Market Leadership in some of our territories

31
World–Class Capabilities
Productive Supply Chain
Superior Customer Management & Execution
Winning Brands Portfolio
Traditional Customized Emerging
• A perfectly aligned systemallows us to fully exploit market opportunities
• Excelling at execution requires:
− a total company strategy involving all functions
− investing in capabilities along the value chain
− developing transfer mechanisms across operations / channels
− integrating and automating all systems
… and excelling at execution, aligning our value chain to deliver to each customer accordingly

32Customers
BronzeBronze
Value Based Customer Segmentation
Maximize Top Line Growth
Improve Efficiency
SilverSilver
GoldGold
Effective & efficient sales and delivery model to provide defined value
proposition
ServiceModelServiceModel
Right offer to each retailer to implement
desired picture of success
Customer Value
Proposition
Customer Value
Proposition
Perfect multicategoryshopper experience in every point of sale
Picture of Success
Picture of Success
Objective
Custo‐mized
Custo‐mized
Emerg‐ing
Emerg‐ing
Improve Service / Efficiency
We have transformed our commercial model to focus on our customers’ value
Core Commercial Processes

33
51
25
125
40
2007 2009Innovation / Execution
Organic Growth
Del Valle Acquisition
KOF Still Beverage Volume: 2007 ‐ 2009(MM UC)
2% of portfolio
5% of portfolio
60%
Categ
ory CA
GR
= 77%
of KOF’s 2007‐09 incremental
volume
Transformed a US$ 300MM
into a US$ 600MM business
in two years
Transformed a US$ 300MM
into a US$ 600MM business
in two years
For example, Valle Frut success shows how value creating acquisitions levered with innovation & execution deliver growth

34
Our innovation pipeline focuses on products that can transform the category with relevant top line results
Our innovation pipeline focuses on products that can transform the category with relevant top line results
• New business models: Joint ventures with KO
– 50/50 profit split
• Leverage innovation: Jugos del Valle expansion…
– … from 2 to 6 countries
– … from 60 to 260 SKU’s
• Use of new technologies
– …from Tetra Pak to PET
• Joint effort: KO – KOF Innovation Stewardship
– Launch of high quality low juice content product
• Important effort developing / transferring execution capabilitiesacross organization
Getting to Jugos del Valle, implied rethinking our business model & speeding up our go‐to‐market

35
0
500
1,000
1,500
2,000
2,500
2003 2004 2005 2006 2007 2008 2009
KOF not only executed operationally, but delivered positive financial results
KOF EBITDA and Debt: 2003‐2009(US$ MM)
Multicategory LeadershipMulticategory Leadership
Volume outside Mexico
49%
Focus
Net Debt
EBITDA
12%
Panamco IntegrationPanamco Integration
JDValleAcquisition
PanamcoAcquisition
RemilAcquisition
Debt red
uction as
promisedDeb
t reductio
n as
promised
ADLAAcquisition
BrisaAcquisition

36
We aim to maintain our profitable growth track in the following years
•A multi‐category company with…– Efficient asset utilization & state‐of‐the‐art systems
– Value creation acquisitions levered by compelling innovation
– Evolving commercial model & capability transfer mechanisms
– Flexible & experienced talent pool
– Strong financials
We are ready to continue growing through execution…
KOF Market Cap: 1994 ‐ Feb 2010 (US$ Bn)
1.5
3.24.4
12.1
1994 1999 2004 2009

37
FEMSA
OXXO
Coca‐Cola FEMSA
Questions & Answers
Agenda

38
FEMSA: Committed to further strengthening our soft drinks and retail businesses based on our proven track record to create shareholder value
• Sustained growth and leadership through further consolidation of the regional Coca‐Cola system and increased development of the NAB segment
• Accelerated growth of store base in Mexico and beyond, while focusing on improving the value proposition to drive same‐store sales and expand margins
• Participation in growth of the leading premium brand‐driven global brewer, with a balanced reach across developed and emerging markets

39
EBITDA reconciliation by division
In US$ million
Consolidated FEMSAIncome from OperationsDepreciationAmortizationEBITDA
FEMSA CervezaIncome from OperationsDepreciationAmortizationEBITDA
Coca‐Cola FEMSAIncome from OperationsDepreciationAmortizationEBITDA
FEMSA ComercioIncome from OperationsDepreciationAmortizationEBITDA
1999 2000 2001 2002 2003 2004 2005 2006
638 737 896 910 1,078 1,232 1,467 1,610178 201 212 194 232 298 338 375137 179 192 198 232 280 314 346952 1,117 1,300 1,303 1,542 1,810 2,119 2,332
277 297 344 340 319 425 504 54881 90 102 107 104 132 139 15372 108 121 134 151 182 202 219430 494 567 581 574 739 844 920
217 302 415 426 597 690 817 87660 73 71 50 86 111 123 13954 59 53 44 59 97 115 117331 434 539 519 742 898 1,055 1,131
24 29 31 47 62 82 118 1495 7 8 9 12 19 30 384 6 9 9 12 21 26 3433 42 48 64 85 122 175 221
2007
1,793399355
2,547
495148221864
1,049151123
1,322
2125039
301
2008
2,036446362
2,844
484154228866
1,22922780
1,536
2766042378
Note: 2009 and 2008 figures in nominal Mexican pesos converted to US dollars using average exchange rate of the year, prior figures in constant pesos as of year end and converted to US dollars using the period‐end exchange rate.
Fx Rate (Pesos per US$) 11.1410.9210.8010.6311.1511.2410.439.169.629.48
2009
2,0014153322,748
437140201778
1,17320882
1,463
3306138429
13.50