c tutorial for rhapsody - nus computing - homeabhik/cs4271/module2011/lab1/tutorial... · rhapsody...
TRANSCRIPT


Rhapsody®
C Tutorial
Before using the information in this manual, be sure to read the “Notices” section of the Help or the PDF available from Help > List of Books.
This edition applies to Telelogic Rhapsody 7.4 and to all subsequent releases and modifications until otherwise indicated in new editions.
© Copyright IBM Corporation 1997, 2008.
US Government Users Restricted Rights—Use, duplication or disclosure restricted by GSA ADP Schedule Contract with IBM Corp.
ii
Contents
Getting Started . . . . . . . . . . . . . . . . . . . . . . . . . . . . . . . . . . . . . . . . . . . . . . . . . . . . 1Rhapsody in C Tutorial Overview . . . . . . . . . . . . . . . . . . . . . . . . . . . . . . . . . . . . . . . . . . . . . . . . . . . 1
C Tutorial Objectives. . . . . . . . . . . . . . . . . . . . . . . . . . . . . . . . . . . . . . . . . . . . . . . . . . . . . . . . . . . . . . 1
Documentation Conventions . . . . . . . . . . . . . . . . . . . . . . . . . . . . . . . . . . . . . . . . . . . . . . . . . . . . . . . 2
About the Rhapsody Product. . . . . . . . . . . . . . . . . . . . . . . . . . . . . . . . . . . . . . . . . . . . . . . . . . . . . . . 2UML Diagrams . . . . . . . . . . . . . . . . . . . . . . . . . . . . . . . . . . . . . . . . . . . . . . . . . . . . . . . . . . . . . . . . . 3Diagrams in the FunctionalC Profile. . . . . . . . . . . . . . . . . . . . . . . . . . . . . . . . . . . . . . . . . . . . . . . . . 4Starting the Rhapsody Product . . . . . . . . . . . . . . . . . . . . . . . . . . . . . . . . . . . . . . . . . . . . . . . . . . . . 5Closing the Rhapsody Product. . . . . . . . . . . . . . . . . . . . . . . . . . . . . . . . . . . . . . . . . . . . . . . . . . . . . 5
Setting Up for the C Tutorial. . . . . . . . . . . . . . . . . . . . . . . . . . . . . . . . . . . . . . . . . . . . . . . . . . . . . . . . 6Creating the Stopwatch Project . . . . . . . . . . . . . . . . . . . . . . . . . . . . . . . . . . . . . . . . . . . . . . . . . . . . 6Creating a Project. . . . . . . . . . . . . . . . . . . . . . . . . . . . . . . . . . . . . . . . . . . . . . . . . . . . . . . . . . . . . . . 6
Managing Projects. . . . . . . . . . . . . . . . . . . . . . . . . . . . . . . . . . . . . . . . . . . . . . . . . . . . . . . . . . . . . . . . 9Saving a Project . . . . . . . . . . . . . . . . . . . . . . . . . . . . . . . . . . . . . . . . . . . . . . . . . . . . . . . . . . . . . . . . 9Opening a Project. . . . . . . . . . . . . . . . . . . . . . . . . . . . . . . . . . . . . . . . . . . . . . . . . . . . . . . . . . . . . . 11Saving Packages Separately . . . . . . . . . . . . . . . . . . . . . . . . . . . . . . . . . . . . . . . . . . . . . . . . . . . . . 12Creating Backups . . . . . . . . . . . . . . . . . . . . . . . . . . . . . . . . . . . . . . . . . . . . . . . . . . . . . . . . . . . . . . 14
Naming Conventions and Guidelines . . . . . . . . . . . . . . . . . . . . . . . . . . . . . . . . . . . . . . . . . . . . . . . 16Standard Prefixes. . . . . . . . . . . . . . . . . . . . . . . . . . . . . . . . . . . . . . . . . . . . . . . . . . . . . . . . . . . . . . 16Guidelines for Naming Model Elements . . . . . . . . . . . . . . . . . . . . . . . . . . . . . . . . . . . . . . . . . . . . . 16
Rhapsody User Interface . . . . . . . . . . . . . . . . . . . . . . . . . . . . . . . . . . . . . . . . . . . . . . . . . . . . . . . . . 17Toolbars . . . . . . . . . . . . . . . . . . . . . . . . . . . . . . . . . . . . . . . . . . . . . . . . . . . . . . . . . . . . . . . . . . . . . 18Browser . . . . . . . . . . . . . . . . . . . . . . . . . . . . . . . . . . . . . . . . . . . . . . . . . . . . . . . . . . . . . . . . . . . . . 19Drawing Toolbars . . . . . . . . . . . . . . . . . . . . . . . . . . . . . . . . . . . . . . . . . . . . . . . . . . . . . . . . . . . . . . 21Drawing Area . . . . . . . . . . . . . . . . . . . . . . . . . . . . . . . . . . . . . . . . . . . . . . . . . . . . . . . . . . . . . . . . . 21Output Window. . . . . . . . . . . . . . . . . . . . . . . . . . . . . . . . . . . . . . . . . . . . . . . . . . . . . . . . . . . . . . . . 21Features Dialog Box. . . . . . . . . . . . . . . . . . . . . . . . . . . . . . . . . . . . . . . . . . . . . . . . . . . . . . . . . . . . 22
Summary . . . . . . . . . . . . . . . . . . . . . . . . . . . . . . . . . . . . . . . . . . . . . . . . . . . . . . . . . . . . . . . . . . . . . . 26
Lesson 1: Creating File Diagrams . . . . . . . . . . . . . . . . . . . . . . . . . . . . . . . . . . . . 27
Rhapsody iii
Table of Contents
Goals for this Lesson . . . . . . . . . . . . . . . . . . . . . . . . . . . . . . . . . . . . . . . . . . . . . . . . . . . . . . . . . . . . 27
Exercise 1: Creating the File Diagram . . . . . . . . . . . . . . . . . . . . . . . . . . . . . . . . . . . . . . . . . . . . . . . 28Task 1a: Creating the File Diagram . . . . . . . . . . . . . . . . . . . . . . . . . . . . . . . . . . . . . . . . . . . . . . . . 29Task 1b: Drawing Files. . . . . . . . . . . . . . . . . . . . . . . . . . . . . . . . . . . . . . . . . . . . . . . . . . . . . . . . . . 31Task 1c: Adding Functions for Timer . . . . . . . . . . . . . . . . . . . . . . . . . . . . . . . . . . . . . . . . . . . . . . . 33Task 1d: Adding Variables for Timer . . . . . . . . . . . . . . . . . . . . . . . . . . . . . . . . . . . . . . . . . . . . . . . 34Task 1e: Adding a Dependency . . . . . . . . . . . . . . . . . . . . . . . . . . . . . . . . . . . . . . . . . . . . . . . . . . . 35Task 1f: Adding a Function and Arguments for Display . . . . . . . . . . . . . . . . . . . . . . . . . . . . . . . . . 37Task 1g: Adding an Include File for Display . . . . . . . . . . . . . . . . . . . . . . . . . . . . . . . . . . . . . . . . . . 41Task 1h: Adding a Diagram Title . . . . . . . . . . . . . . . . . . . . . . . . . . . . . . . . . . . . . . . . . . . . . . . . . . 42
Summary . . . . . . . . . . . . . . . . . . . . . . . . . . . . . . . . . . . . . . . . . . . . . . . . . . . . . . . . . . . . . . . . . . . . . . 42
Lesson 2: Creating Flow Charts . . . . . . . . . . . . . . . . . . . . . . . . . . . . . . . . . . . . . 43Goals for this Lesson . . . . . . . . . . . . . . . . . . . . . . . . . . . . . . . . . . . . . . . . . . . . . . . . . . . . . . . . . . . . 43
Exercise 1: Creating a Flow Chart for the Tick Function. . . . . . . . . . . . . . . . . . . . . . . . . . . . . . . . 44Task 1a: Creating the Flow Chart. . . . . . . . . . . . . . . . . . . . . . . . . . . . . . . . . . . . . . . . . . . . . . . . . . 45Task 1b: Drawing Action Elements . . . . . . . . . . . . . . . . . . . . . . . . . . . . . . . . . . . . . . . . . . . . . . . . 46Task 1c: Drawing a Default Flow . . . . . . . . . . . . . . . . . . . . . . . . . . . . . . . . . . . . . . . . . . . . . . . . . . 47Task 1d: Drawing a Termination State . . . . . . . . . . . . . . . . . . . . . . . . . . . . . . . . . . . . . . . . . . . . . . 47Task 1e: Drawing Condition Connector . . . . . . . . . . . . . . . . . . . . . . . . . . . . . . . . . . . . . . . . . . . . . 48Task 1f: Drawing Activity Flows . . . . . . . . . . . . . . . . . . . . . . . . . . . . . . . . . . . . . . . . . . . . . . . . . . . 49Task 1g: Adding a Diagram Title . . . . . . . . . . . . . . . . . . . . . . . . . . . . . . . . . . . . . . . . . . . . . . . . . . 50
Summary . . . . . . . . . . . . . . . . . . . . . . . . . . . . . . . . . . . . . . . . . . . . . . . . . . . . . . . . . . . . . . . . . . . . . . 51
Lesson 3: Creating Statecharts . . . . . . . . . . . . . . . . . . . . . . . . . . . . . . . . . . . . . . 53Goals for this Lesson . . . . . . . . . . . . . . . . . . . . . . . . . . . . . . . . . . . . . . . . . . . . . . . . . . . . . . . . . . . . 53
Exercise 1: Creating a Statechart for the Timer . . . . . . . . . . . . . . . . . . . . . . . . . . . . . . . . . . . . . . . 54Task 1a: Creating the Statechart . . . . . . . . . . . . . . . . . . . . . . . . . . . . . . . . . . . . . . . . . . . . . . . . . . 55Task 1b: Adding Transitions Between States. . . . . . . . . . . . . . . . . . . . . . . . . . . . . . . . . . . . . . . . . 57Task 1c: Using the Rhapsody Timer . . . . . . . . . . . . . . . . . . . . . . . . . . . . . . . . . . . . . . . . . . . . . . . 59
Exercise 2: Animating a Statechart . . . . . . . . . . . . . . . . . . . . . . . . . . . . . . . . . . . . . . . . . . . . . . . . . 62Task 2a: Defining a Test Component and Configuration . . . . . . . . . . . . . . . . . . . . . . . . . . . . . . . . 63Task 2b: Creating a Debug Configuration . . . . . . . . . . . . . . . . . . . . . . . . . . . . . . . . . . . . . . . . . . . 65Task 2c: Starting Animation . . . . . . . . . . . . . . . . . . . . . . . . . . . . . . . . . . . . . . . . . . . . . . . . . . . . . . 67Task 2d: Creating the Timer Instance . . . . . . . . . . . . . . . . . . . . . . . . . . . . . . . . . . . . . . . . . . . . . . 69Task 2e: Generating Events to Run the Animation . . . . . . . . . . . . . . . . . . . . . . . . . . . . . . . . . . . . 73Task 2f: Quitting Animation . . . . . . . . . . . . . . . . . . . . . . . . . . . . . . . . . . . . . . . . . . . . . . . . . . . . . . 78
Summary . . . . . . . . . . . . . . . . . . . . . . . . . . . . . . . . . . . . . . . . . . . . . . . . . . . . . . . . . . . . . . . . . . . . . . 78
iv C Tutorial
Table of Contents
Lesson 4: Creating Message Diagrams . . . . . . . . . . . . . . . . . . . . . . . . . . . . . . . 79Goals for this Lesson . . . . . . . . . . . . . . . . . . . . . . . . . . . . . . . . . . . . . . . . . . . . . . . . . . . . . . . . . . . . 79
Exercise 1: Creating a Message Diagram . . . . . . . . . . . . . . . . . . . . . . . . . . . . . . . . . . . . . . . . . . . . 80Task 1a: Creating a Message Diagram . . . . . . . . . . . . . . . . . . . . . . . . . . . . . . . . . . . . . . . . . . . . . 81Task 1b: Adding Instances to the Message Diagram. . . . . . . . . . . . . . . . . . . . . . . . . . . . . . . . . . . 83Task 1c: Drawing Messages to Define the Stopwatch Communication . . . . . . . . . . . . . . . . . . . . . 84Task 1d: Adding a Diagram Title . . . . . . . . . . . . . . . . . . . . . . . . . . . . . . . . . . . . . . . . . . . . . . . . . . 86
Summary . . . . . . . . . . . . . . . . . . . . . . . . . . . . . . . . . . . . . . . . . . . . . . . . . . . . . . . . . . . . . . . . . . . . . . 86
Lesson 5: Generating Code and More . . . . . . . . . . . . . . . . . . . . . . . . . . . . . . . . 87Goals for this Lesson . . . . . . . . . . . . . . . . . . . . . . . . . . . . . . . . . . . . . . . . . . . . . . . . . . . . . . . . . . . . 87
Exercise 1: Managing Multiple Configurations. . . . . . . . . . . . . . . . . . . . . . . . . . . . . . . . . . . . . . . . 88
Exercise 2: Generating Code . . . . . . . . . . . . . . . . . . . . . . . . . . . . . . . . . . . . . . . . . . . . . . . . . . . . . . 89
Exercise 3: Viewing and Editing the Generated Code . . . . . . . . . . . . . . . . . . . . . . . . . . . . . . . . . . 89Task 3a: Viewing the Generated Code . . . . . . . . . . . . . . . . . . . . . . . . . . . . . . . . . . . . . . . . . . . . . 90Task 3b: Adding Line Numbers . . . . . . . . . . . . . . . . . . . . . . . . . . . . . . . . . . . . . . . . . . . . . . . . . . . 92Task 3c: Using the Browser to Locate Code . . . . . . . . . . . . . . . . . . . . . . . . . . . . . . . . . . . . . . . . . 93Task 3d: Adding Code for the timerReset Function . . . . . . . . . . . . . . . . . . . . . . . . . . . . . . . . . . . . 94Task 3e: Roundtripping . . . . . . . . . . . . . . . . . . . . . . . . . . . . . . . . . . . . . . . . . . . . . . . . . . . . . . . . . 95
Summary . . . . . . . . . . . . . . . . . . . . . . . . . . . . . . . . . . . . . . . . . . . . . . . . . . . . . . . . . . . . . . . . . . . . . . 96
Lesson 6: Animating and Comparing Message Diagrams . . . . . . . . . . . . . . . . 97Goals for this Lesson . . . . . . . . . . . . . . . . . . . . . . . . . . . . . . . . . . . . . . . . . . . . . . . . . . . . . . . . . . . . 97
Exercise 1: Animating Message Diagrams . . . . . . . . . . . . . . . . . . . . . . . . . . . . . . . . . . . . . . . . . . . 98Task 1a: Running the Executable . . . . . . . . . . . . . . . . . . . . . . . . . . . . . . . . . . . . . . . . . . . . . . . . . 98Task 1b: Generating an Event . . . . . . . . . . . . . . . . . . . . . . . . . . . . . . . . . . . . . . . . . . . . . . . . . . . 100Task 1c: Pausing Animation. . . . . . . . . . . . . . . . . . . . . . . . . . . . . . . . . . . . . . . . . . . . . . . . . . . . . 102Task 1d: Stopping Animation . . . . . . . . . . . . . . . . . . . . . . . . . . . . . . . . . . . . . . . . . . . . . . . . . . . . 102Task 1e: Saving the Animated Diagram. . . . . . . . . . . . . . . . . . . . . . . . . . . . . . . . . . . . . . . . . . . . 103Task 1f: Comparing the Message Diagrams . . . . . . . . . . . . . . . . . . . . . . . . . . . . . . . . . . . . . . . . 104Task 1g: Examining the Comparison Results . . . . . . . . . . . . . . . . . . . . . . . . . . . . . . . . . . . . . . . 106
Summary . . . . . . . . . . . . . . . . . . . . . . . . . . . . . . . . . . . . . . . . . . . . . . . . . . . . . . . . . . . . . . . . . . . . . 106
Index . . . . . . . . . . . . . . . . . . . . . . . . . . . . . . . . . . . . . . . . . . . . . . . . . . . . . . . . . . . 107
Rhapsody v

Table of Contents
vi C Tutorial

Getting Started
Welcome to the C tutorial for Telelogic Rhapsody®!
Rhapsody is the Model-Driven Development environment of choice for systems engineers and software developers of either embedded or real-time systems.
Rhapsody in C generates full production C code for a variety of target platforms based on UML 2.0 behavioral and structural diagrams. The Rhapsody product also provides for the reverse engineering of C code for reuse of your intellectual property within a Model-Driven environment.
NoteBefore you can work through any of the lessons in this tutorial, you must create the Stopwatch project, which is detailed in Setting Up for the C Tutorial. After which, you should work through the tutorial in the order of the lessons.
Rhapsody in C Tutorial OverviewThis tutorial teaches you the basics of using Rhapsody in C by building a stopwatch model. It provides step-by-step instructions on using the main features of the Rhapsody product to analyze, design, and build a model of a stopwatch using a file-based modeling approach.
C Tutorial ObjectivesWhen you have completed this tutorial, you will have performed the following standard tasks:
Created a Rhapsody project Create a file diagram Create a flow chart Create a statechart Create a message diagram Generated, viewed, located, and edited code Animated the model, including compared message diagrams
Rhapsody 1
Getting Started
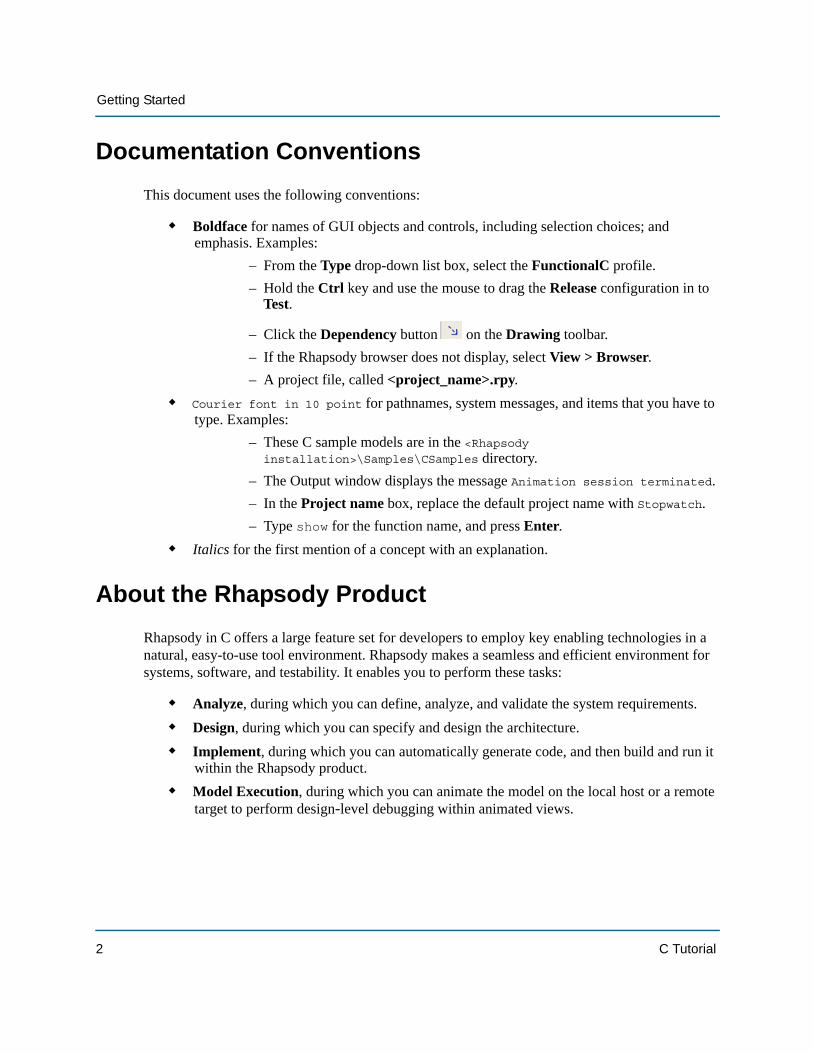
Documentation ConventionsThis document uses the following conventions:
Boldface for names of GUI objects and controls, including selection choices; and emphasis. Examples:
– From the Type drop-down list box, select the FunctionalC profile.– Hold the Ctrl key and use the mouse to drag the Release configuration in to
Test.
– Click the Dependency button on the Drawing toolbar.– If the Rhapsody browser does not display, select View > Browser.– A project file, called <project_name>.rpy.
Courier font in 10 point for pathnames, system messages, and items that you have to type. Examples:
– These C sample models are in the <Rhapsody installation>\Samples\CSamples directory.
– The Output window displays the message Animation session terminated.– In the Project name box, replace the default project name with Stopwatch.– Type show for the function name, and press Enter.
Italics for the first mention of a concept with an explanation.
About the Rhapsody ProductRhapsody in C offers a large feature set for developers to employ key enabling technologies in a natural, easy-to-use tool environment. Rhapsody makes a seamless and efficient environment for systems, software, and testability. It enables you to perform these tasks:
Analyze, during which you can define, analyze, and validate the system requirements. Design, during which you can specify and design the architecture. Implement, during which you can automatically generate code, and then build and run it
within the Rhapsody product. Model Execution, during which you can animate the model on the local host or a remote
target to perform design-level debugging within animated views.
2 C Tutorial
About the Rhapsody Product
UML Diagrams
The following are the UML diagrams in the Rhapsody product:
Use Case Diagrams show the main functions of the system (use cases) and the entities (actors) outside the system.
Structure Diagrams show the system structure and identify the organizational pieces of the system.
Object Model Diagrams show the structure of the system in terms of classes, objects, files, and the relationships between these structural elements.
Sequence Diagrams show sequences of steps and messages passed between structural elements when executing a particular instance of a use case.
Activity Diagrams specify a flow for classifiers (classes, files, blocks, actors, use cases), objects, and operation/function.
Statecharts show the behavior of a particular classifier (class, file, actor, use case) or object over its entire life cycle.
Collaboration Diagrams provide the same information as sequence diagrams, emphasizing structure rather than time.
Component Diagrams describe the organization of the software units and the dependencies among units.
Deployment Diagrams show the nodes in the final system architecture and the connections between them.
In addition, Flow Charts are available in the Rhapsody product. You can use a flow chart to describe a function or class operation and for code generation.
Rhapsody 3
Getting Started
Diagrams in the FunctionalC Profile
The FunctionalC profile tailors Rhapsody in C for the C coder, allowing the user to functionally model an application using familiar constructs such as files, functions, call graphs, and flow charts. A Rhapsody profile “hosts” domain-specific tags and stereotypes.
The FunctionalC profile tailors the diagram view for the C developer by providing the following diagrams:
Build Diagrams to show how the software is to be built. Call Graph Diagrams to show the relationship of function calls as well as the
relationship of data. File Diagrams to show how files interact with one another (typically how the #include
structure is created). Flow Charts to show a function or class operation and for code generation. Message Diagrams to show how the files functionality may interact through messaging
(synchronous function calls or asynchronous communication).In addition, you can also create activity diagrams, statecharts, and use case diagrams (as described in UML Diagrams) when you use the FunctionalC profile.
Note that not all diagrams are used in this tutorial. For more information about the diagram types, refer to the Rhapsody User Guide.
4 C Tutorial
About the Rhapsody Product
Starting the Rhapsody Product
Windows
To start the Rhapsody product in Windows: Select Start > All Programs > Telelogic > Telelogic Rhapsody version number > Rhapsody Development Edition > Rhapsody in C.
Linux
To start the Rhapsody product in Linux, follow these steps:
1. From the Terminal, browse to the Rhapsody home directory.
2. Execute the RhapsodyInC script. For example: [RhapsodyUser@MyHostMachine]# cd /home/Rhapsody [RhapsodyUser@MyHostMachine Rhapsody]# ./RhapsodyInC In this example, “RhapsodyUser” is the username, “MyHostMachine” is the host machine and “/home/Rhapsody” is the installation directory.
Closing the Rhapsody Product
To exit the Rhapsody product, follow these steps:
1. Save your work.
2. Choose File > Exit or click the Close button .
Rhapsody 5
Getting Started
Setting Up for the C TutorialYou must create and set up the Stopwatch project before you can work through this tutorial.
NoteThis tutorial assumes that you have installed the compiler necessary to generate code.
Creating the Stopwatch Project
This section describes how to:
Create a project Save a project Open the Stopwatch project
Creating a Project
A Rhapsody project includes the UML diagrams, packages, and code generation configurations that define the model and the code generated from it. When you create a new project, Rhapsody creates a directory containing the project files in the specified location. The name you choose for your new project is used to name project files and directories, and it appears at the top level of the project hierarchy in the Rhapsody browser. Rhapsody provides several default elements in the new project, including a default package, component, and configuration.
To create a new project, follow these steps:
1. Start the Rhapsody product if it is not already running. See Starting the Rhapsody Product, if necessary.
2. Click the New button on the main toolbar or select File > New to open the New Project dialog box.
3. In the Project name box, replace the default project name (Project) with Stopwatch.
4. In the In folder box, enter a new directory name or browse to find an existing directory.
Note: To avoid potentially long pathnames, do not create the project on the desktop.
6 C Tutorial

Setting Up for the C Tutorial
5. From the Type drop-down list box, select the FunctionalC profile. The FunctionalC profile tailors Rhapsody in C for the C coder, allowing the user to functionally model an application using familiar constructs such as files, functions, call graphs, and flow charts.
Note: For a description of the available project profile types that you can select from the Type drop-down list, refer to the Rhapsody User Guide. (Do a search of the user guide PDF file for “specialized profile.”)
Your dialog box should resemble the following figure.
Rhapsody 7
Getting Started
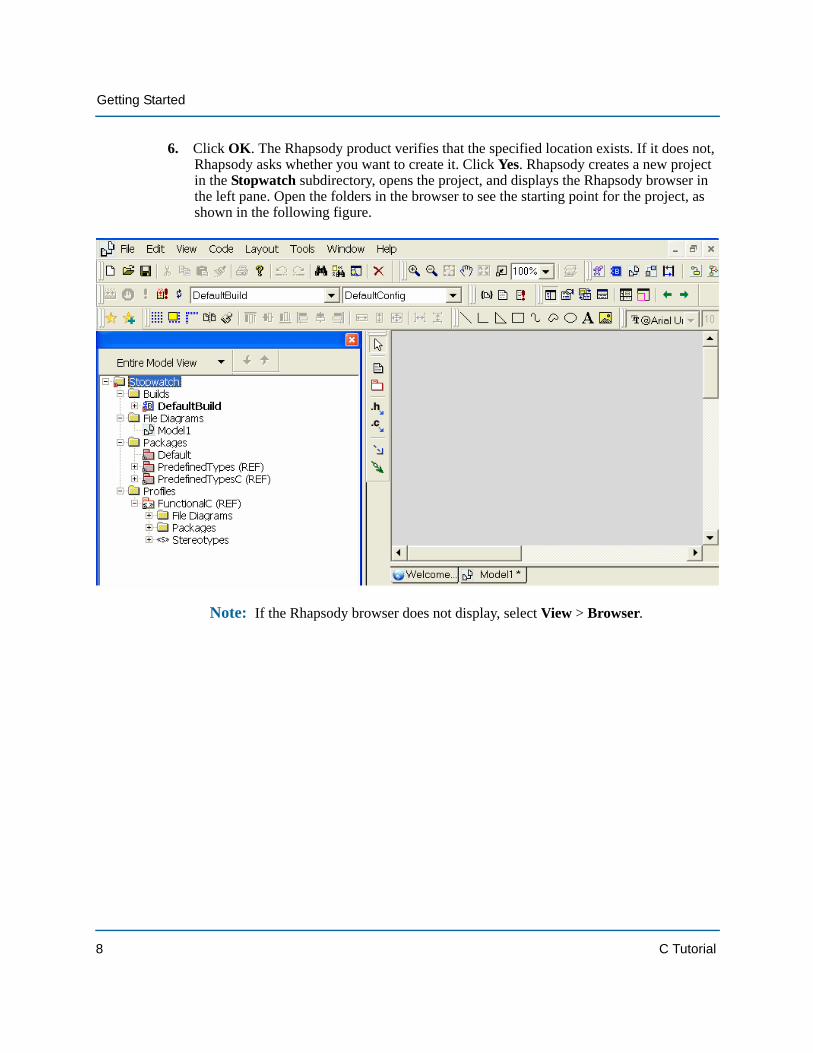
6. Click OK. The Rhapsody product verifies that the specified location exists. If it does not, Rhapsody asks whether you want to create it. Click Yes. Rhapsody creates a new project in the Stopwatch subdirectory, opens the project, and displays the Rhapsody browser in the left pane. Open the folders in the browser to see the starting point for the project, as shown in the following figure.
Note: If the Rhapsody browser does not display, select View > Browser.
8 C Tutorial
Managing Projects
Managing ProjectsThis section provides you with more information about the Rhapsody product. It covers how to save and open a project, how to save packages separately (to help you with configuration management and improve project organization), and how to create automatic backups. In addition, it talks about naming conventions and provides you with details about the Rhapsody user interface.
Saving a Project
Use the Save command to save the project in its current location. The Save command saves only the modified units, reducing the time required to save large projects. In Rhapsody, a unit is any element of a project that is saved in a separate file. You can partition your model into units down to the class/file level. Creating units simplifies collaboration in team environments.
To save the project to a new location, use the Save As command.
The Rhapsody product performs an autosave every ten minutes to back up changes made between saves. Modified units are saved in the autosave folder, along with any units that have a time stamp older than the project file.
You may want to save your project more frequently. To save the project in the current location, use one of the following methods:
Click the Save button on the main toolbar, or Select File > Save.
NoteYou can set a property to create backups of your model every time you save your project. This gives you the opportunity to revert to a previously saved version if you encounter a problem. By default, Rhapsody does not create backups. For more information about creating backups, see Creating Backups. You can also refer to the Rhapsody User Guide.
Rhapsody 9
Getting Started
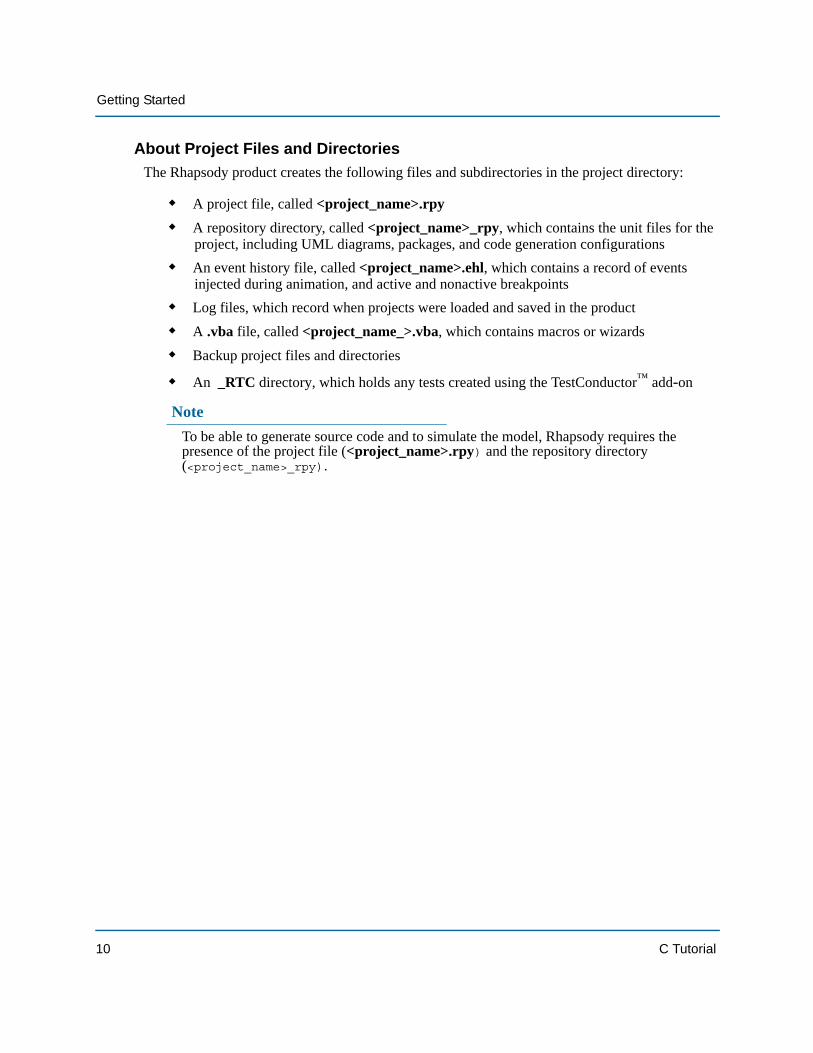
About Project Files and DirectoriesThe Rhapsody product creates the following files and subdirectories in the project directory:
A project file, called <project_name>.rpy A repository directory, called <project_name>_rpy, which contains the unit files for the
project, including UML diagrams, packages, and code generation configurations An event history file, called <project_name>.ehl, which contains a record of events
injected during animation, and active and nonactive breakpoints Log files, which record when projects were loaded and saved in the product A .vba file, called <project_name_>.vba, which contains macros or wizards Backup project files and directories
An _RTC directory, which holds any tests created using the TestConductor™ add-on
NoteTo be able to generate source code and to simulate the model, Rhapsody requires the presence of the project file (<project_name>.rpy) and the repository directory (<project_name>_rpy).
10 C Tutorial
Managing Projects
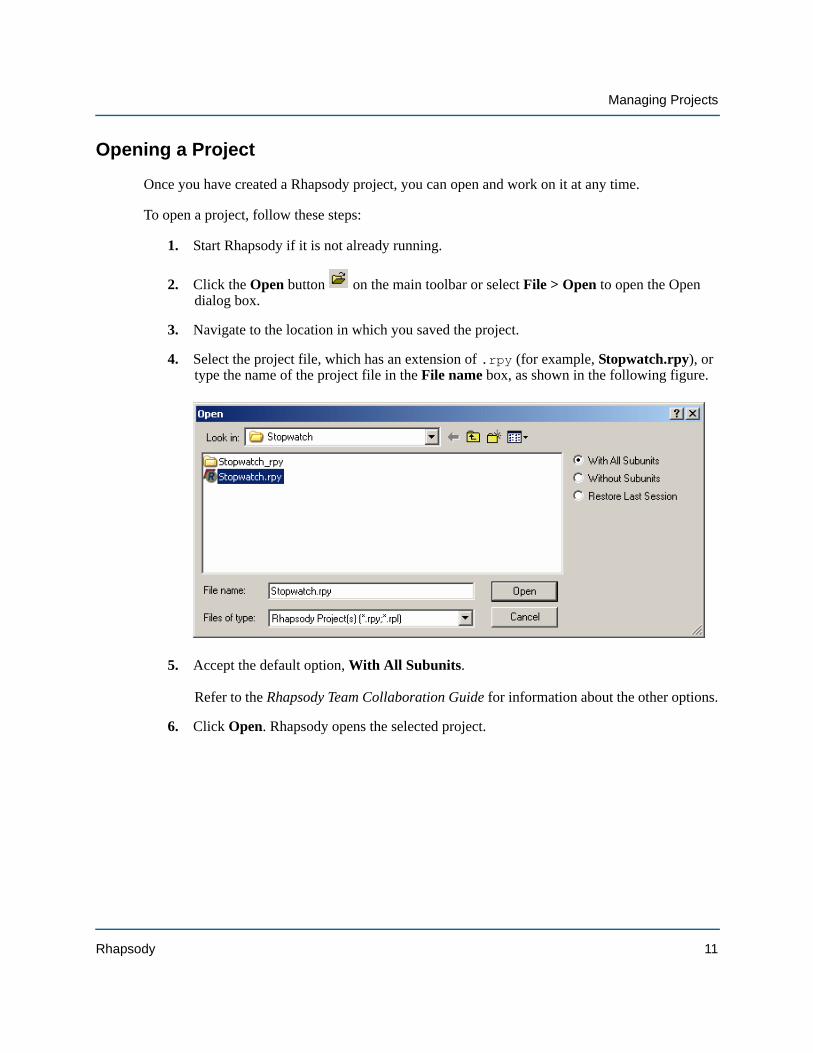
Opening a Project
Once you have created a Rhapsody project, you can open and work on it at any time.
To open a project, follow these steps:
1. Start Rhapsody if it is not already running.
2. Click the Open button on the main toolbar or select File > Open to open the Open dialog box.
3. Navigate to the location in which you saved the project.
4. Select the project file, which has an extension of .rpy (for example, Stopwatch.rpy), or type the name of the project file in the File name box, as shown in the following figure.
5. Accept the default option, With All Subunits. Refer to the Rhapsody Team Collaboration Guide for information about the other options.
6. Click Open. Rhapsody opens the selected project.
Rhapsody 11
Getting Started
Saving Packages Separately
To assist with configuration management and improve project organization, you may want to store packages in separate subdirectories within a parent folder. Rhapsody has two directory schemes: flat and hierarchical.
In flat mode, all package files are stored in the project directory, regardless of their location in the project hierarchy.
In hierarchical mode, a package is stored in a subdirectory one level below its parent. It is possible to have a hybrid project, where some packages are stored in flat mode, and others are organized in a hierarchy of folders.
To change the directory scheme so new packages are stored in separate directories by default, follow these steps:
1. Right-click the project name in the Rhapsody browser (for example, Stopwatch) and select Features to open the Features dialog box.
2. On the Properties tab, click the drop-down arrow and select All. (The label appears as View All after you make the selection.)
Note: The Properties tab lists the properties associated with an element. The Properties tab of the Features dialog box includes a Help pane below the list of properties. This pane displays help text for the selected property. Help is displayed for each of the levels: subject, metaclass, property (for example, General, Model, DefaultDirectoryScheme). For an example of this pane, see the figure shown in step 4.
3. Expand the General subject and then expand the Model metaclass.
Note: Rhapsody descriptions use a notation method with double colons to identify the location of a specific property, for example, General::Model::DefaultDirectoryScheme.
12 C Tutorial
Managing Projects
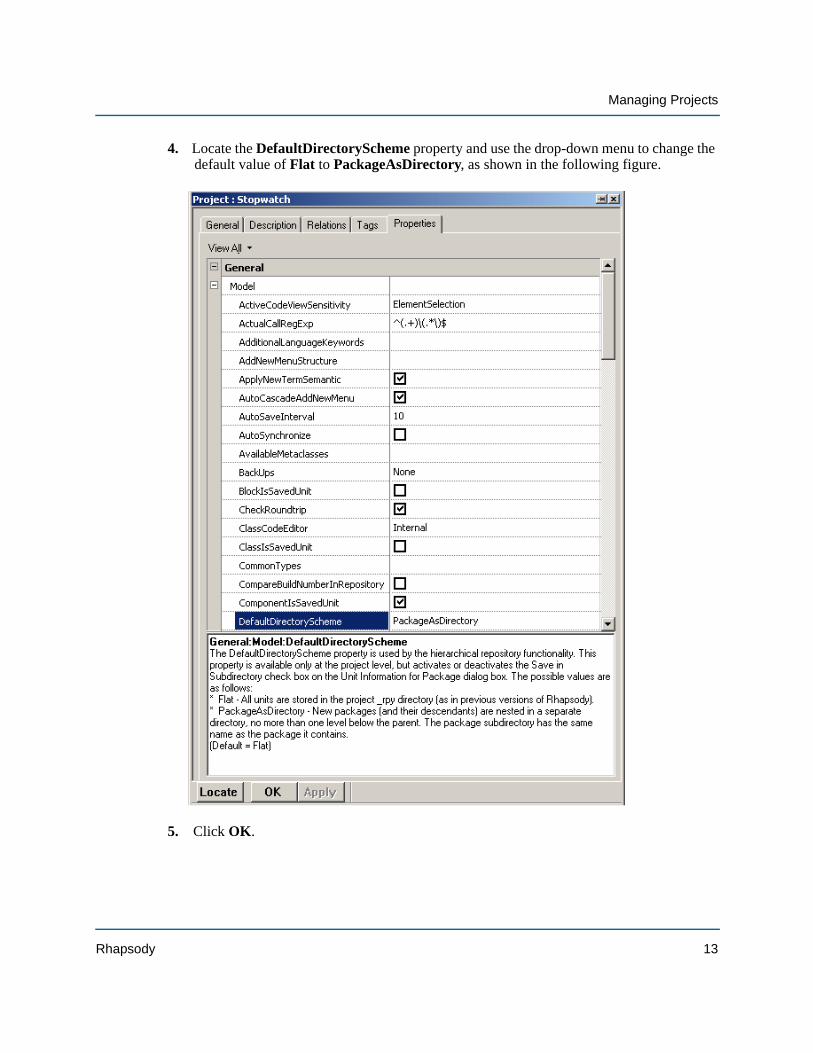
4. Locate the DefaultDirectoryScheme property and use the drop-down menu to change the default value of Flat to PackageAsDirectory, as shown in the following figure.
5. Click OK.
Rhapsody 13
Getting Started
Creating Backups
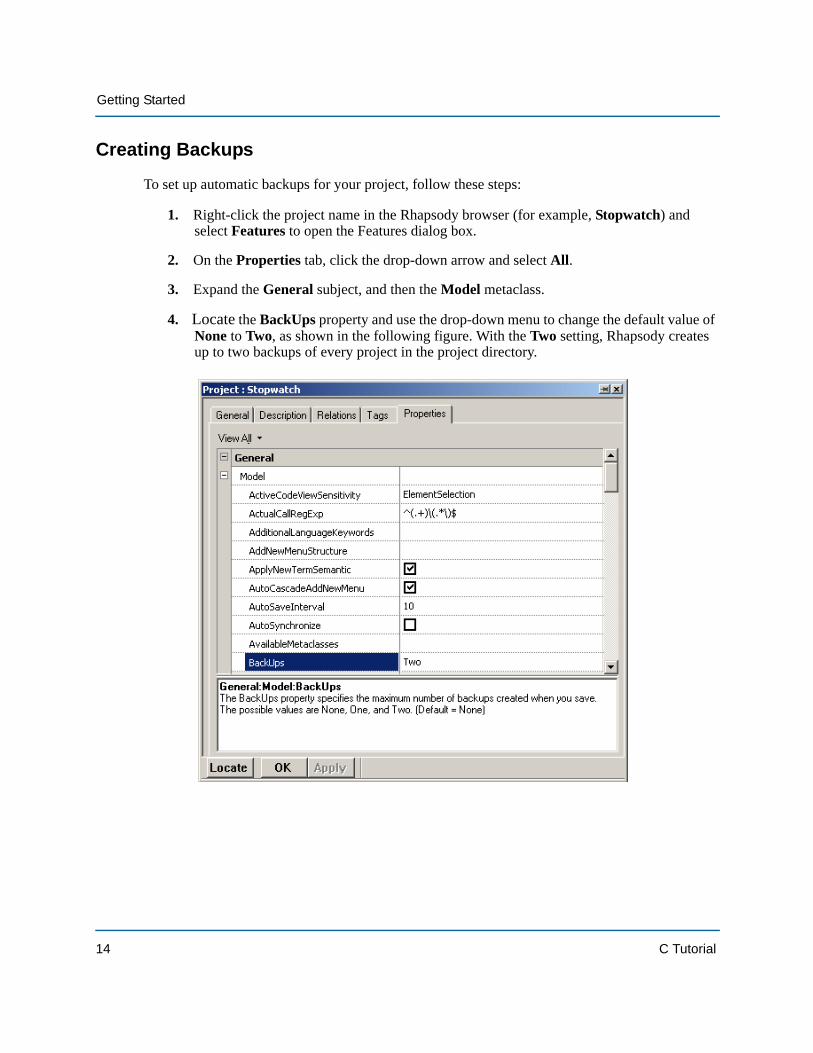
To set up automatic backups for your project, follow these steps:
1. Right-click the project name in the Rhapsody browser (for example, Stopwatch) and select Features to open the Features dialog box.
2. On the Properties tab, click the drop-down arrow and select All.
3. Expand the General subject, and then the Model metaclass.
4. Locate the BackUps property and use the drop-down menu to change the default value of None to Two, as shown in the following figure. With the Two setting, Rhapsody creates up to two backups of every project in the project directory.
14 C Tutorial
Managing Projects
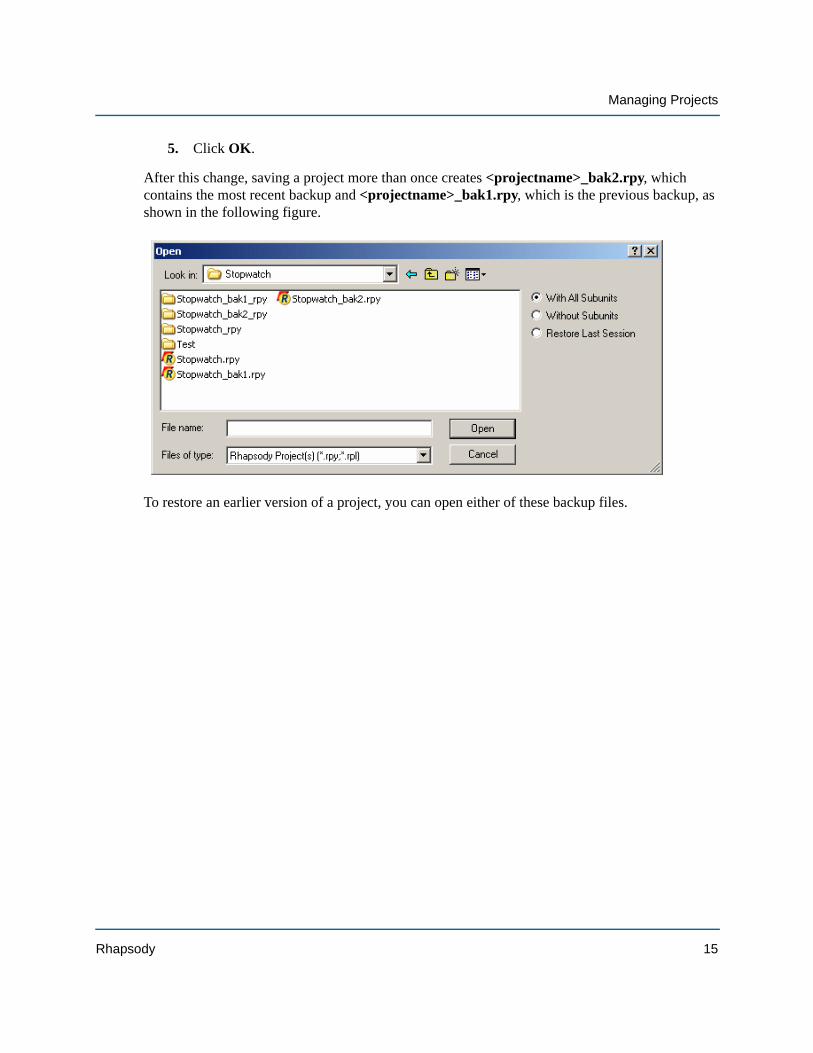
5. Click OK.
After this change, saving a project more than once creates <projectname>_bak2.rpy, which contains the most recent backup and <projectname>_bak1.rpy, which is the previous backup, as shown in the following figure.
To restore an earlier version of a project, you can open either of these backup files.
Rhapsody 15
Getting Started
Naming Conventions and GuidelinesTo assist all members of your team in understanding the purpose of individual items in the model, it is a good idea to define naming conventions. These conventions help team members to read the diagram quickly and remember the model element names easily.
NoteRemember that the names used in the Rhapsody models are going to be automatically written into the generated code. Therefore, the names should be simple and clearly label all of the elements.
Standard Prefixes
Lower and upper case prefixes are useful for model elements. The following is a list of common prefixes with examples of each:
Event names = “ev” (evStart) Trigger operations = “op” (opPress) Condition operations = “is” (isPressed) Interface classes = “I” (IHardware)
Guidelines for Naming Model Elements
The names of the model elements should follow these guidelines:
Class names begin with an upper case letter, such as “System.” Operations and attributes begin with lower case letters, such as “restartSystem.” Upper case letters separate concatenated words, such as “checkStatus.” The same name should not be used for different elements in the model because it will
cause code generation problems. For example, no two elements, such as a class, an interface, and a package, should not have exactly the same name.
16 C Tutorial
Rhapsody User Interface
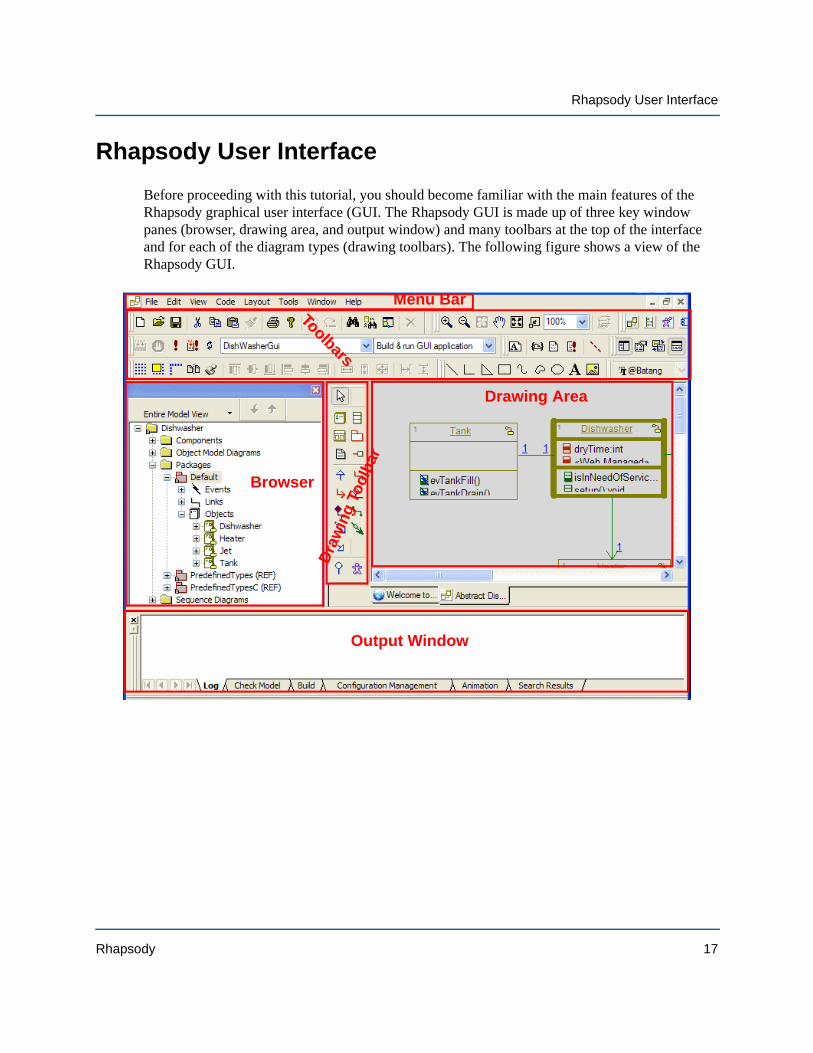
Rhapsody User InterfaceBefore proceeding with this tutorial, you should become familiar with the main features of the Rhapsody graphical user interface (GUI. The Rhapsody GUI is made up of three key window panes (browser, drawing area, and output window) and many toolbars at the top of the interface and for each of the diagram types (drawing toolbars). The following figure shows a view of the Rhapsody GUI.
Browser
Output Window
Drawing Area
Menu BarToolbars
Draw
ing
Tool
bar
Rhapsody 17
Getting Started
Toolbars
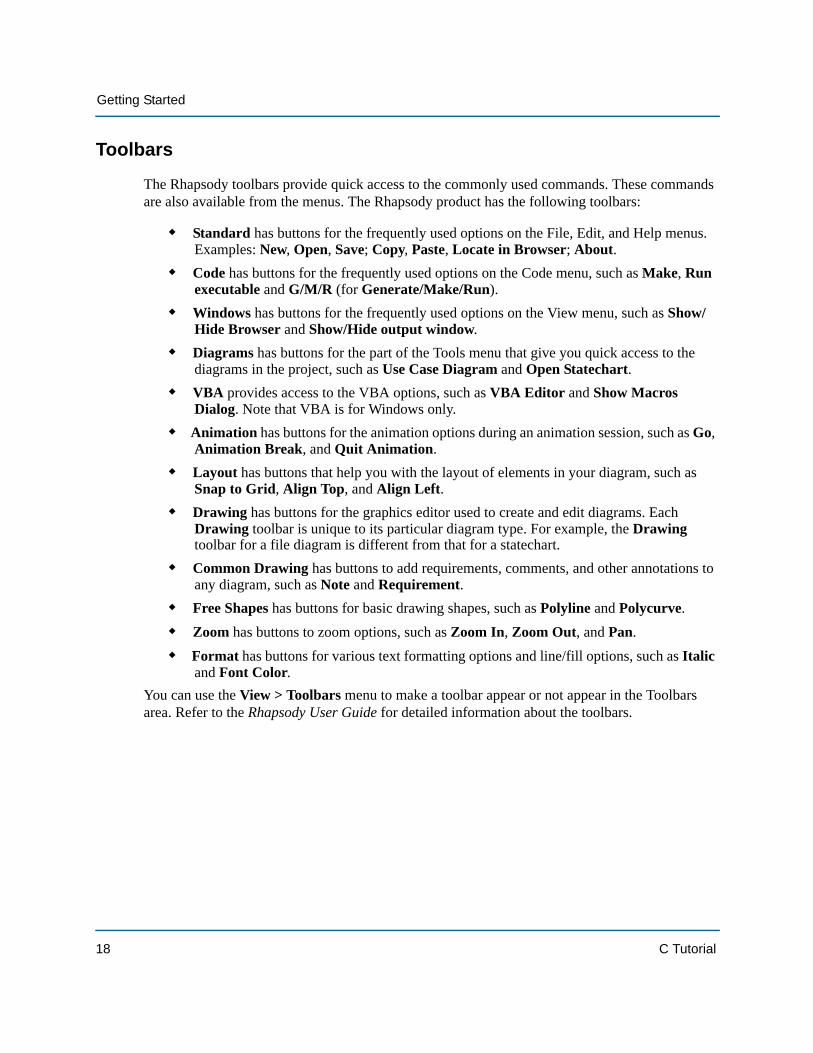
The Rhapsody toolbars provide quick access to the commonly used commands. These commands are also available from the menus. The Rhapsody product has the following toolbars:
Standard has buttons for the frequently used options on the File, Edit, and Help menus. Examples: New, Open, Save; Copy, Paste, Locate in Browser; About.
Code has buttons for the frequently used options on the Code menu, such as Make, Run executable and G/M/R (for Generate/Make/Run).
Windows has buttons for the frequently used options on the View menu, such as Show/Hide Browser and Show/Hide output window.
Diagrams has buttons for the part of the Tools menu that give you quick access to the diagrams in the project, such as Use Case Diagram and Open Statechart.
VBA provides access to the VBA options, such as VBA Editor and Show Macros Dialog. Note that VBA is for Windows only.
Animation has buttons for the animation options during an animation session, such as Go, Animation Break, and Quit Animation.
Layout has buttons that help you with the layout of elements in your diagram, such as Snap to Grid, Align Top, and Align Left.
Drawing has buttons for the graphics editor used to create and edit diagrams. Each Drawing toolbar is unique to its particular diagram type. For example, the Drawing toolbar for a file diagram is different from that for a statechart.
Common Drawing has buttons to add requirements, comments, and other annotations to any diagram, such as Note and Requirement.
Free Shapes has buttons for basic drawing shapes, such as Polyline and Polycurve. Zoom has buttons to zoom options, such as Zoom In, Zoom Out, and Pan. Format has buttons for various text formatting options and line/fill options, such as Italic
and Font Color.You can use the View > Toolbars menu to make a toolbar appear or not appear in the Toolbars area. Refer to the Rhapsody User Guide for detailed information about the toolbars.
18 C Tutorial
Rhapsody User Interface
Browser
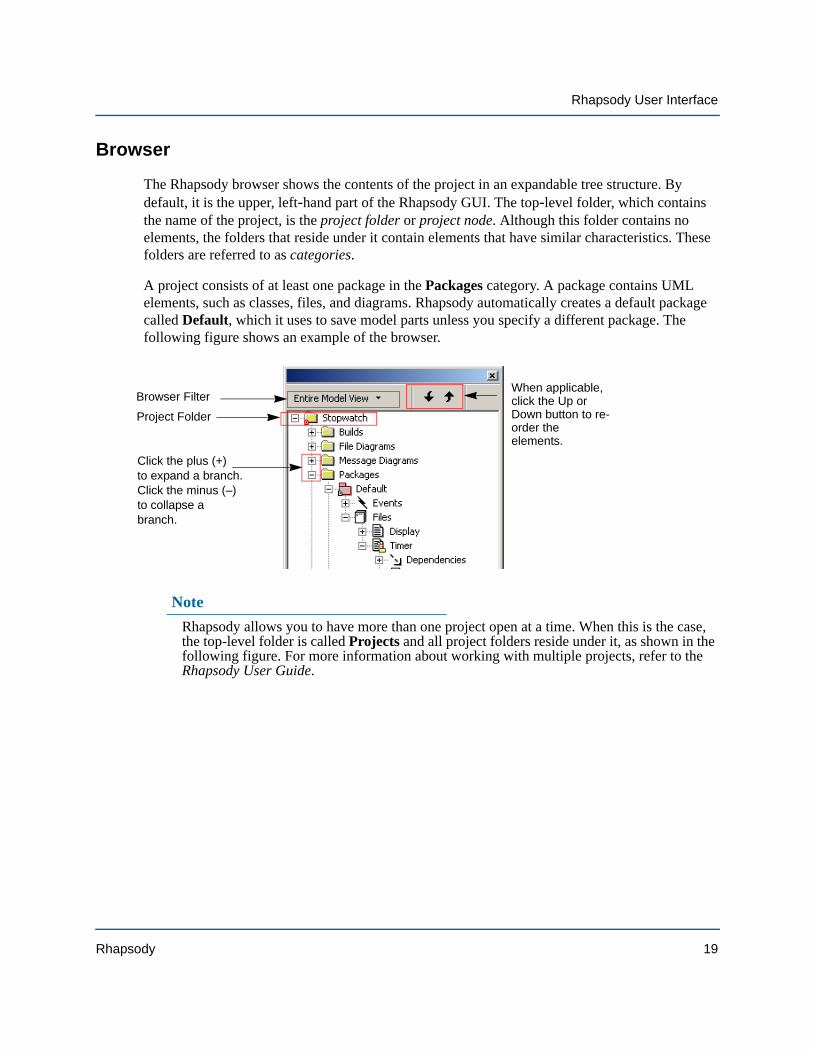
The Rhapsody browser shows the contents of the project in an expandable tree structure. By default, it is the upper, left-hand part of the Rhapsody GUI. The top-level folder, which contains the name of the project, is the project folder or project node. Although this folder contains no elements, the folders that reside under it contain elements that have similar characteristics. These folders are referred to as categories.
A project consists of at least one package in the Packages category. A package contains UML elements, such as classes, files, and diagrams. Rhapsody automatically creates a default package called Default, which it uses to save model parts unless you specify a different package. The following figure shows an example of the browser.
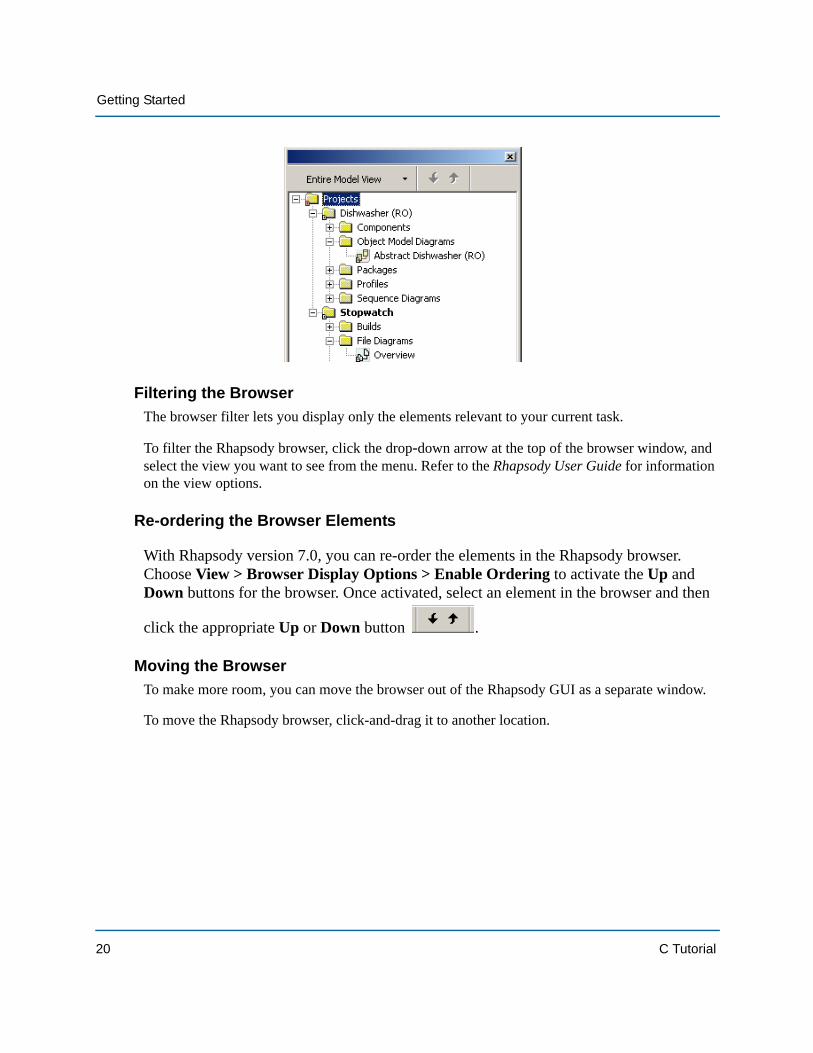
NoteRhapsody allows you to have more than one project open at a time. When this is the case, the top-level folder is called Projects and all project folders reside under it, as shown in the following figure. For more information about working with multiple projects, refer to the Rhapsody User Guide.
Click the plus (+) to expand a branch.Click the minus (–) to collapse a branch.
Project Folder
Browser FilterWhen applicable, click the Up or Down button to re-order the elements.
Rhapsody 19
Getting Started
Filtering the BrowserThe browser filter lets you display only the elements relevant to your current task.
To filter the Rhapsody browser, click the drop-down arrow at the top of the browser window, and select the view you want to see from the menu. Refer to the Rhapsody User Guide for information on the view options.
Re-ordering the Browser Elements
With Rhapsody version 7.0, you can re-order the elements in the Rhapsody browser. Choose View > Browser Display Options > Enable Ordering to activate the Up and Down buttons for the browser. Once activated, select an element in the browser and then
click the appropriate Up or Down button .
Moving the BrowserTo make more room, you can move the browser out of the Rhapsody GUI as a separate window.
To move the Rhapsody browser, click-and-drag it to another location.
20 C Tutorial
Rhapsody User Interface
Drawing Toolbars
The Rhapsody product displays a separate Drawing toolbar for each UML diagram type. By default, it places the Drawing toolbar to the left of the diagram.
To move the toolbar, click and drag it to another location. To make the Drawing toolbar appear or not appear, choose View > Toolbars > Drawing.
Drawing Area
The drawing area displays the graphic editors and code editors, and it is the region for drawing diagrams. By default, it is the upper, right-hand section of the Rhapsody GUI. Rhapsody displays each diagram with a tab that includes the name of the diagram and an icon that denotes the diagram type. When you make changes to a diagram, Rhapsody displays an asterisk next to the diagram name on the tab and after the name of the diagram in the title bar to indicate that you must save your changes.
Output Window
The Output window displays Rhapsody messages. By default, it is the lower section of the Rhapsody GUI. It includes tabs that display the following types of messages:
Log Check Model Build Configuration Management Animation Search Results
Typically, the Output window appears when you generate code and run animation. If the Output window does not appear, choose View > Output Window.
Rhapsody 21
Getting Started
Features Dialog Box
The Features dialog box lets you view and edit the features of an element in the Rhapsody product.
To open the Features dialog box, do one of the following in the Rhapsody browser or a diagram:
Double-click an element (for example, mins [a variable]), or Right-click an element (for example, Execution [a diagram]) and then select Features, or Select an element and press Alt + Enter, or Select an element and select View > Features
You can resize the Features dialog box and hide the tabs on this dialog box if you want. For more information about using the Features dialog box, refer to the Rhapsody User Guide.
NoteOnce you open the Features dialog box, you can leave it open and select other elements to view their features. You must save your model to save all the changes you may have made.
22 C Tutorial
Rhapsody User Interface
Tabs for the Features Dialog BoxThe Features dialog box has different tabs at the top of the dialog box and different boxes on the tabs depending on the element type.
The following tabs are ones used most often in this tutorial. For more information about these tabs, as well as the other tabs that you may see in a Features dialog box, refer to the Rhapsody User Guide.
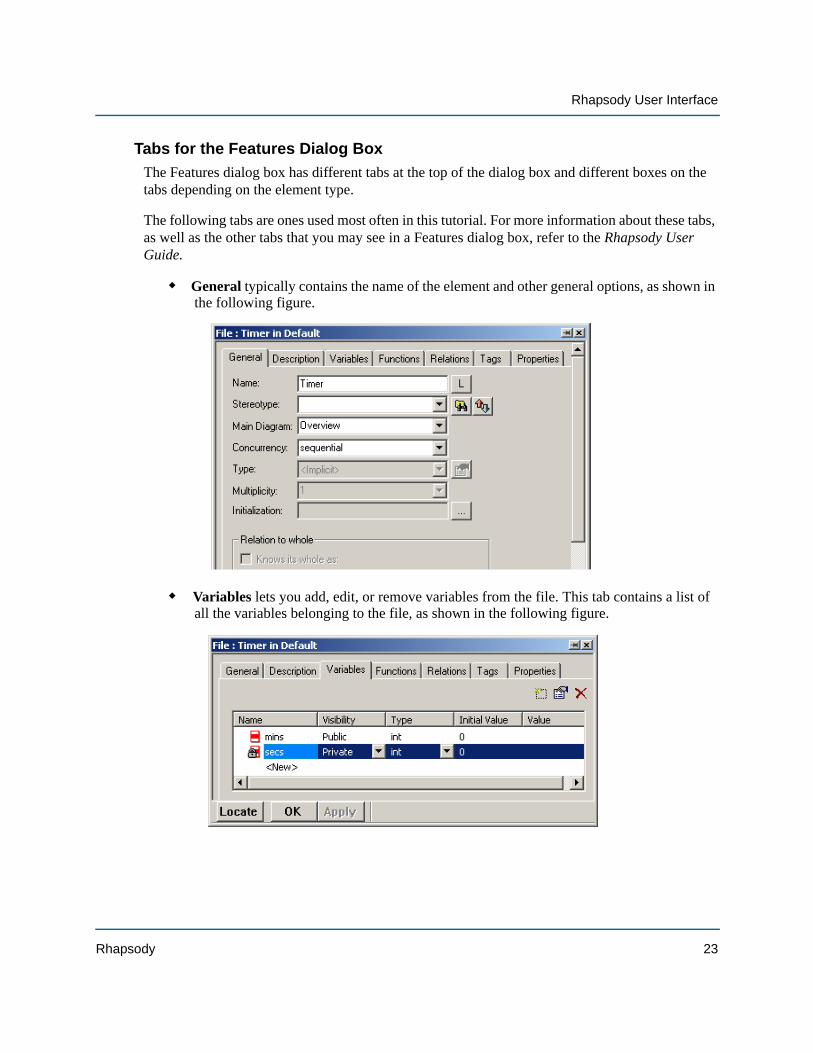
General typically contains the name of the element and other general options, as shown in the following figure.
Variables lets you add, edit, or remove variables from the file. This tab contains a list of all the variables belonging to the file, as shown in the following figure.
Rhapsody 23
Getting Started
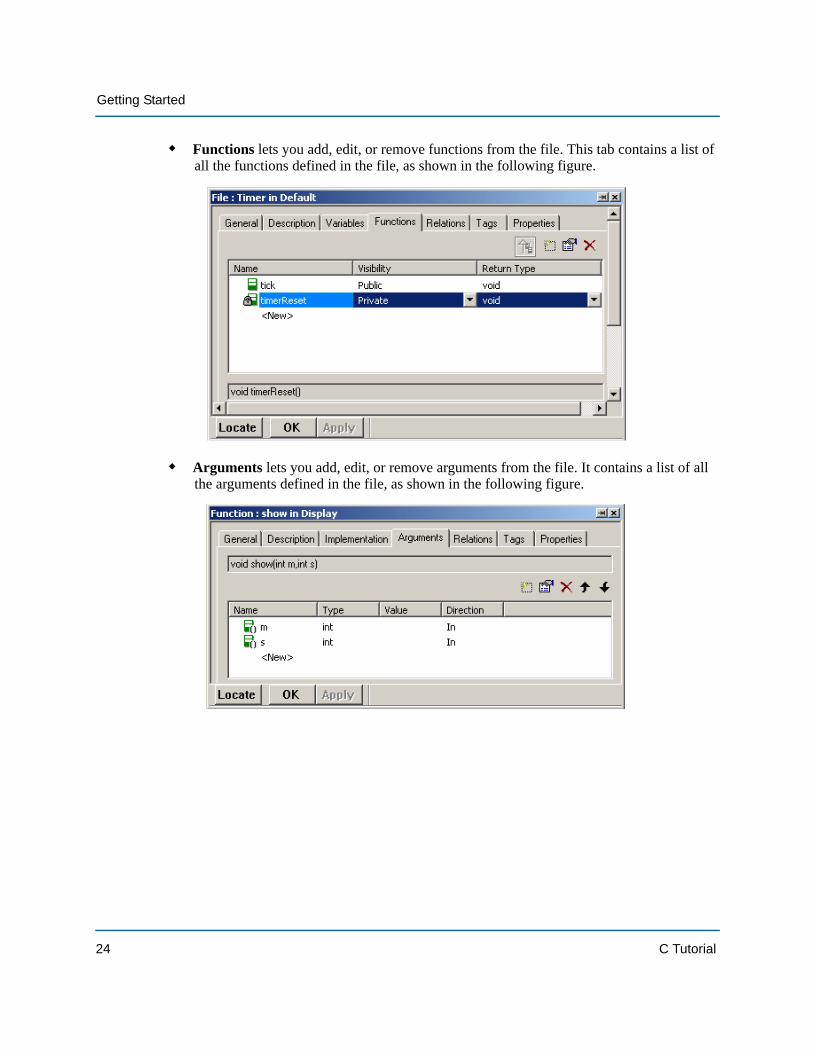
Functions lets you add, edit, or remove functions from the file. This tab contains a list of all the functions defined in the file, as shown in the following figure.
Arguments lets you add, edit, or remove arguments from the file. It contains a list of all the arguments defined in the file, as shown in the following figure.
24 C Tutorial
Rhapsody User Interface
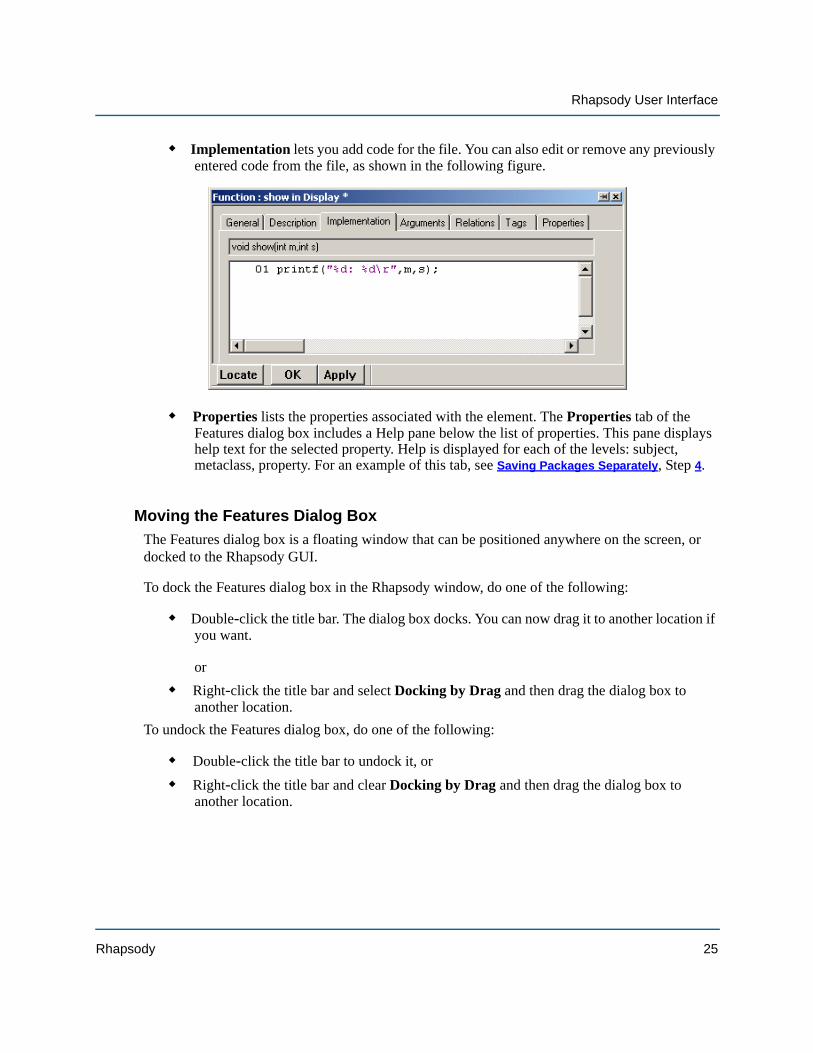
Implementation lets you add code for the file. You can also edit or remove any previously entered code from the file, as shown in the following figure.
Properties lists the properties associated with the element. The Properties tab of the Features dialog box includes a Help pane below the list of properties. This pane displays help text for the selected property. Help is displayed for each of the levels: subject, metaclass, property. For an example of this tab, see Saving Packages Separately, Step 4.
Moving the Features Dialog BoxThe Features dialog box is a floating window that can be positioned anywhere on the screen, or docked to the Rhapsody GUI.
To dock the Features dialog box in the Rhapsody window, do one of the following:
Double-click the title bar. The dialog box docks. You can now drag it to another location if you want. or
Right-click the title bar and select Docking by Drag and then drag the dialog box to another location.
To undock the Features dialog box, do one of the following:
Double-click the title bar to undock it, or Right-click the title bar and clear Docking by Drag and then drag the dialog box to
another location.
Rhapsody 25
Getting Started
SummaryIn this section, you became familiar with the Rhapsody product and its features. You learned how to do the following:
Start and close the Rhapsody product Set up for the tutorial by creating the Stopwatch project Learned about the Rhapsody GUI
You are now ready to proceed to the next sections, where you are going to create a file diagram.
Note that for ease of presentation, this guide organizes the sections by diagram type and general workflow. However, when modeling systems, diagrams are often created in parallel or may require elements in one diagram to be planned or designed before another diagram can be finalized. For example, you might identify the communication scenarios using sequence diagrams before defining the flows, flow items, and port contracts in the structure diagrams. In addition, you might perform black-box analysis using activity diagrams, sequence diagrams, and statecharts; and white-box analysis using sequence diagrams before decomposing the system’s functions into subsystem components.
When you do black-box analysis, such as when you do a black-box sequence diagram, you are showing the sequence of messages between external actors and the system as a whole. When you do white-box analysis, such as when you do a white-box sequence diagram, you are showing messages to and from the internal individual parts.
26 C Tutorial
Lesson 1: Creating File Diagrams
File diagrams show how files interact with one another. Typically, file diagrams show how the #include structure is created. File diagrams provide a graphical representation of the system structure. The Rhapsody code generator directly translates the elements and relationships modeled in file diagrams into C source code.
NoteBefore you can work through any of the lessons in this tutorial, you must create the Stopwatch project, which is detailed in Setting Up for the C Tutorial. In addition, you should work through the tutorial in the order of the lessons.
Goals for this LessonIn this lesson, you create a file diagram called Overview.You learn about the following elements for a file diagram:
Files Functions Variables Dependencies Arguments
Rhapsody 27
Lesson 1: Creating File Diagrams
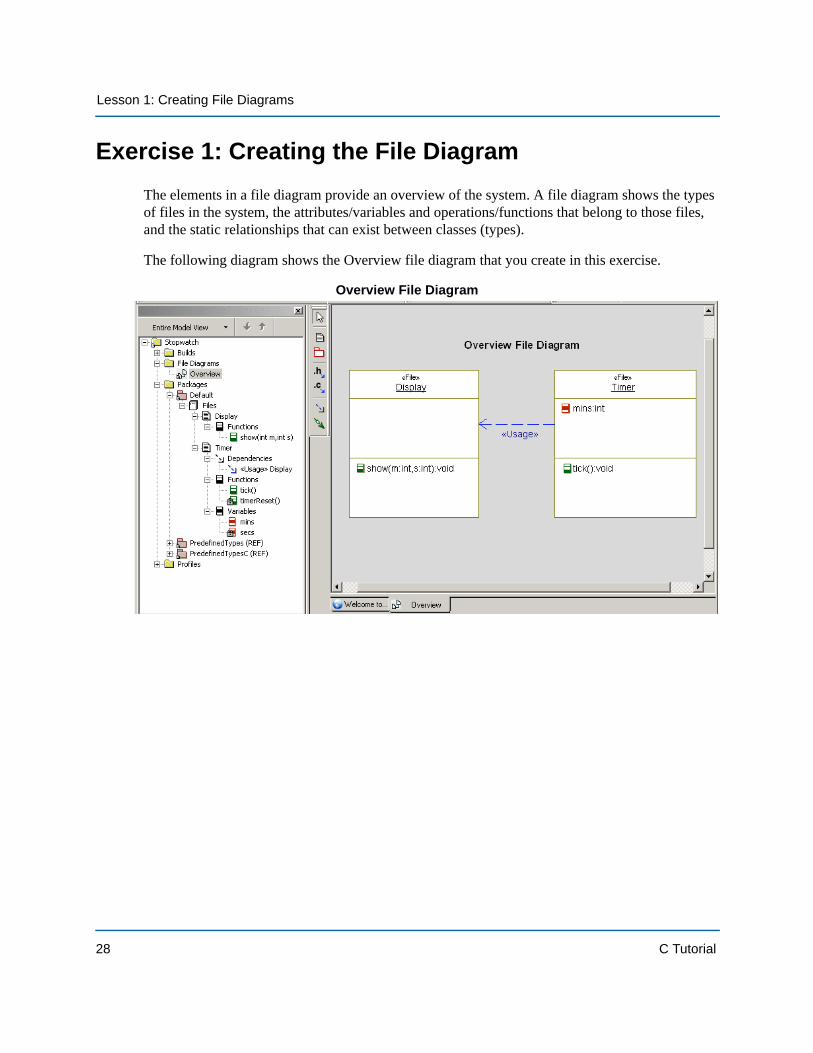
Exercise 1: Creating the File DiagramThe elements in a file diagram provide an overview of the system. A file diagram shows the types of files in the system, the attributes/variables and operations/functions that belong to those files, and the static relationships that can exist between classes (types).
The following diagram shows the Overview file diagram that you create in this exercise.
Overview File Diagram
28 C Tutorial
Exercise 1: Creating the File Diagram
Task 1a: Creating the File Diagram
You draw a file diagram using the following general steps:
1. Draw files
2. Add functions, variables, and dependencies
3. Add implementation code
The following tasks describe each of these steps in detail.
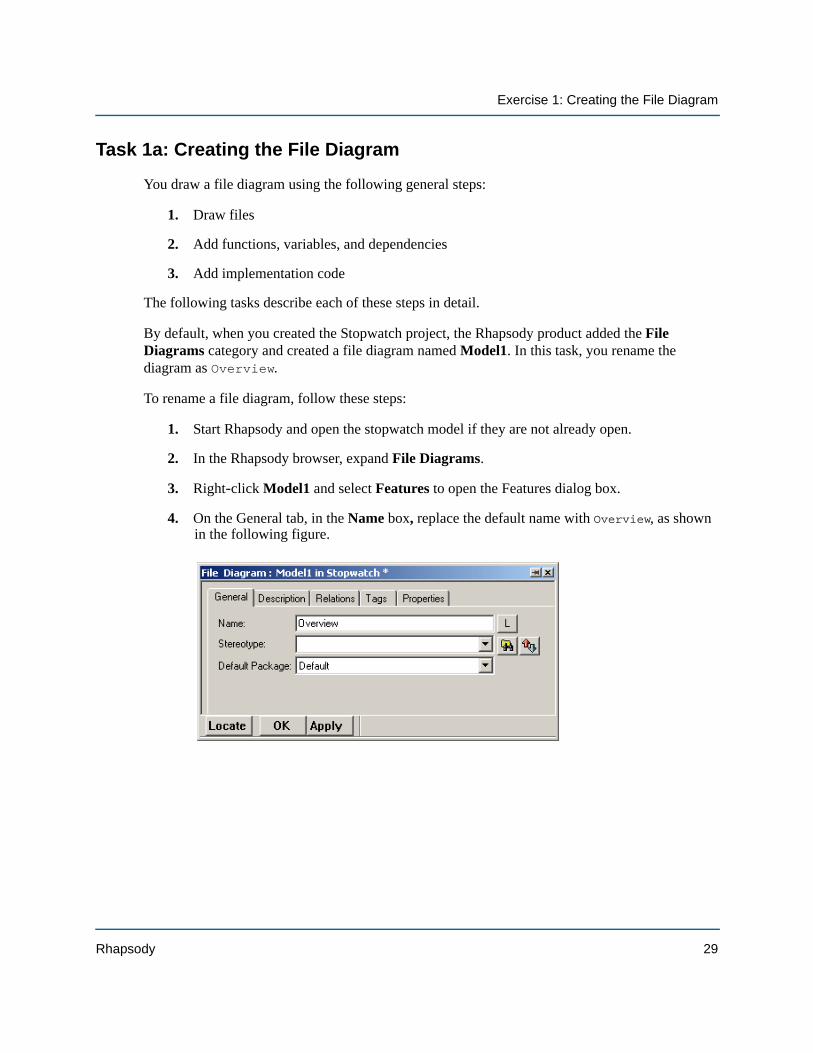
By default, when you created the Stopwatch project, the Rhapsody product added the File Diagrams category and created a file diagram named Model1. In this task, you rename the diagram as Overview.
To rename a file diagram, follow these steps:
1. Start Rhapsody and open the stopwatch model if they are not already open.
2. In the Rhapsody browser, expand File Diagrams.
3. Right-click Model1 and select Features to open the Features dialog box.
4. On the General tab, in the Name box, replace the default name with Overview, as shown in the following figure.
Rhapsody 29
Lesson 1: Creating File Diagrams
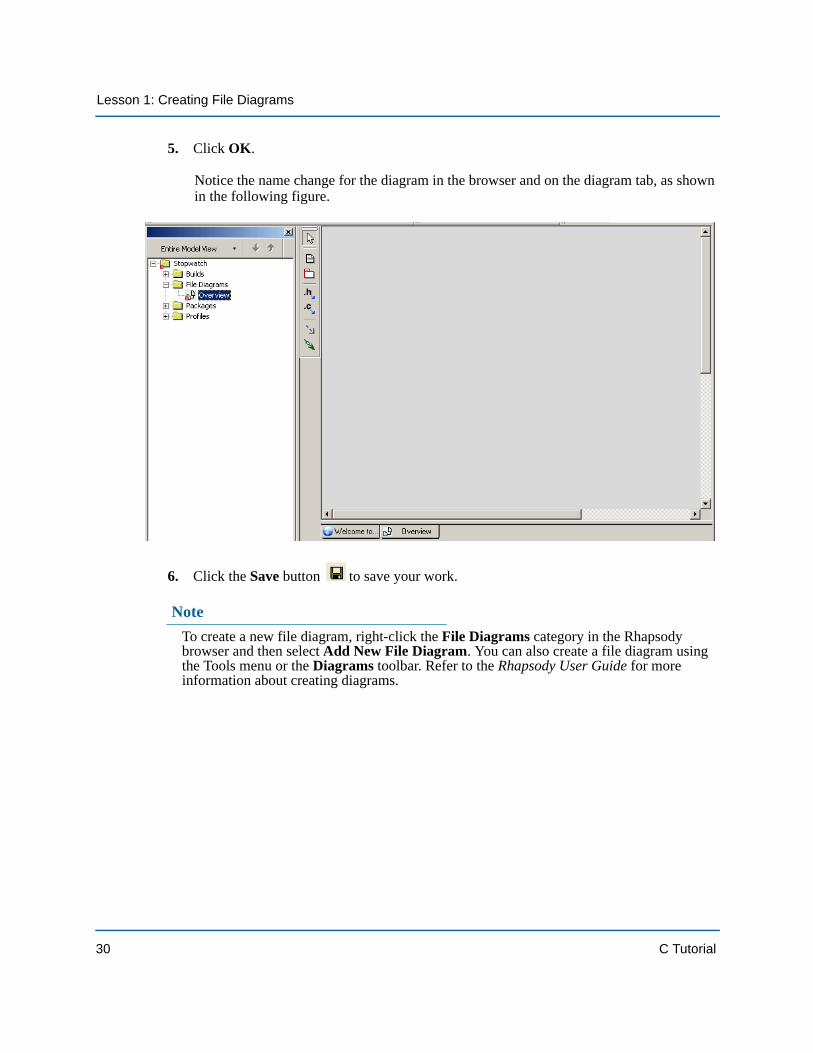
5. Click OK. Notice the name change for the diagram in the browser and on the diagram tab, as shown in the following figure.
6. Click the Save button to save your work.
NoteTo create a new file diagram, right-click the File Diagrams category in the Rhapsody browser and then select Add New File Diagram. You can also create a file diagram using the Tools menu or the Diagrams toolbar. Refer to the Rhapsody User Guide for more information about creating diagrams.
30 C Tutorial
Exercise 1: Creating the File Diagram
Task 1b: Drawing Files
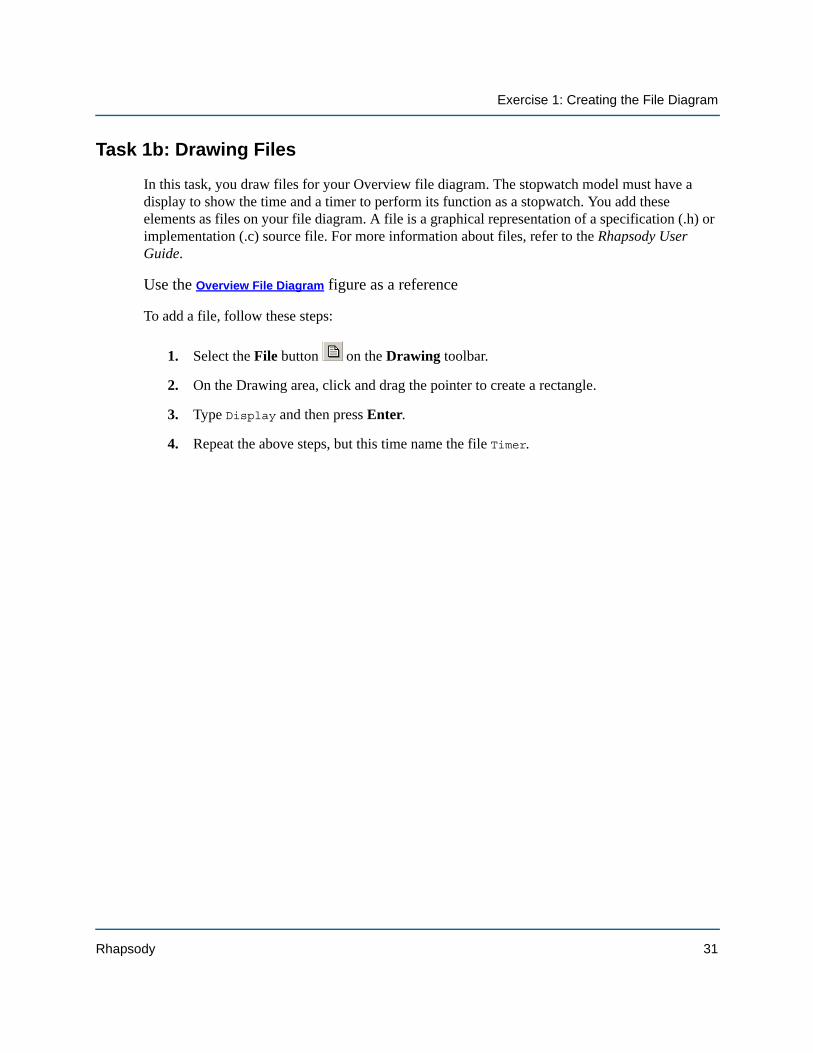
In this task, you draw files for your Overview file diagram. The stopwatch model must have a display to show the time and a timer to perform its function as a stopwatch. You add these elements as files on your file diagram. A file is a graphical representation of a specification (.h) or implementation (.c) source file. For more information about files, refer to the Rhapsody User Guide.
Use the Overview File Diagram figure as a reference
To add a file, follow these steps:
1. Select the File button on the Drawing toolbar.
2. On the Drawing area, click and drag the pointer to create a rectangle.
3. Type Display and then press Enter.
4. Repeat the above steps, but this time name the file Timer.
Rhapsody 31
Lesson 1: Creating File Diagrams
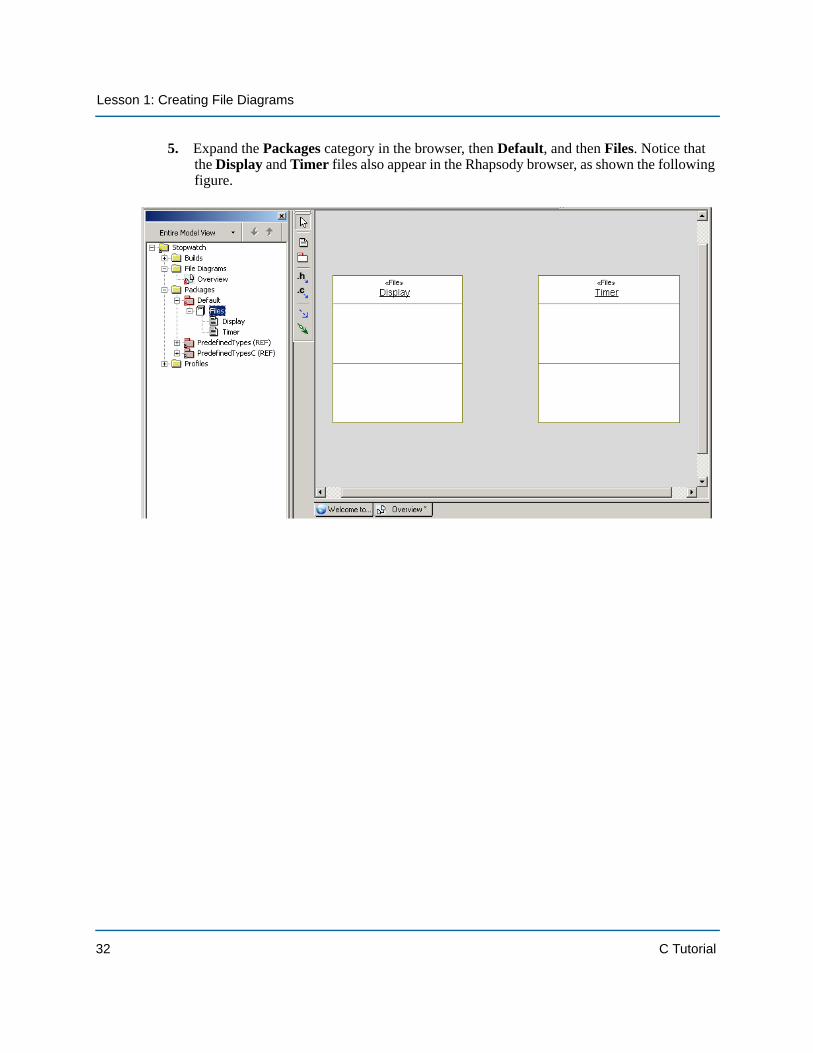
5. Expand the Packages category in the browser, then Default, and then Files. Notice that the Display and Timer files also appear in the Rhapsody browser, as shown the following figure.
32 C Tutorial
Exercise 1: Creating the File Diagram
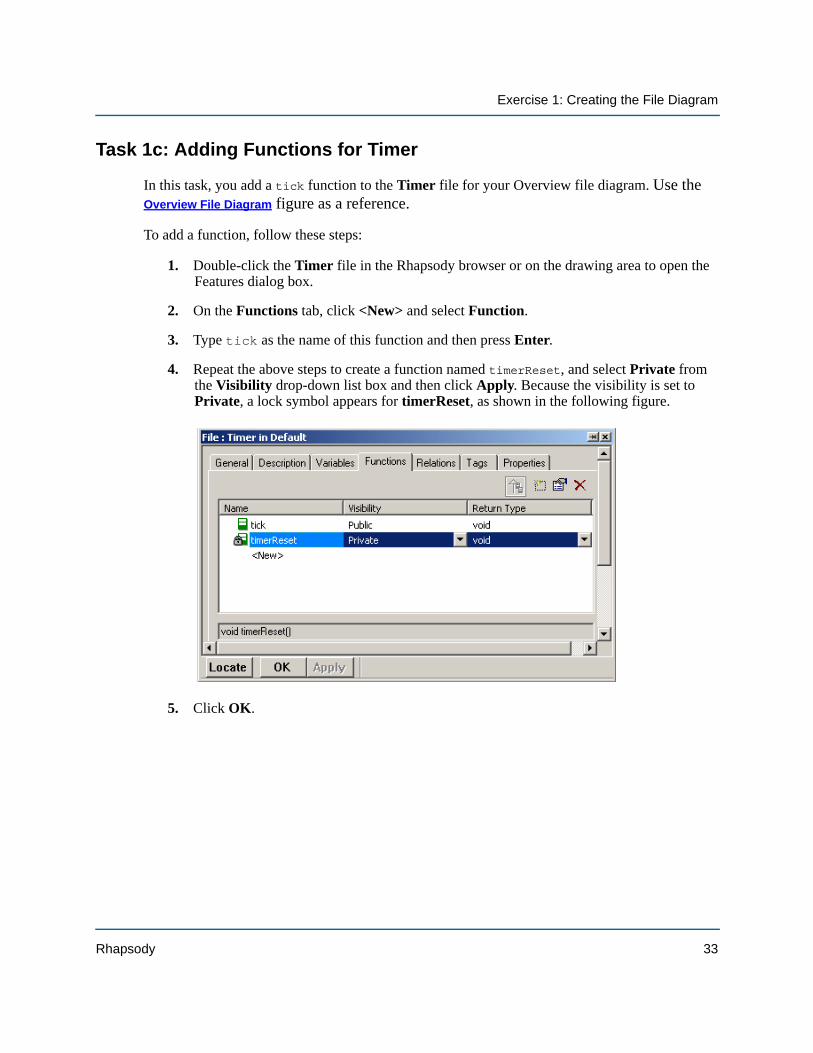
Task 1c: Adding Functions for Timer
In this task, you add a tick function to the Timer file for your Overview file diagram. Use the Overview File Diagram figure as a reference.
To add a function, follow these steps:
1. Double-click the Timer file in the Rhapsody browser or on the drawing area to open the Features dialog box.
2. On the Functions tab, click <New> and select Function.
3. Type tick as the name of this function and then press Enter.
4. Repeat the above steps to create a function named timerReset, and select Private from the Visibility drop-down list box and then click Apply. Because the visibility is set to Private, a lock symbol appears for timerReset, as shown in the following figure.
5. Click OK.
Rhapsody 33
Lesson 1: Creating File Diagrams
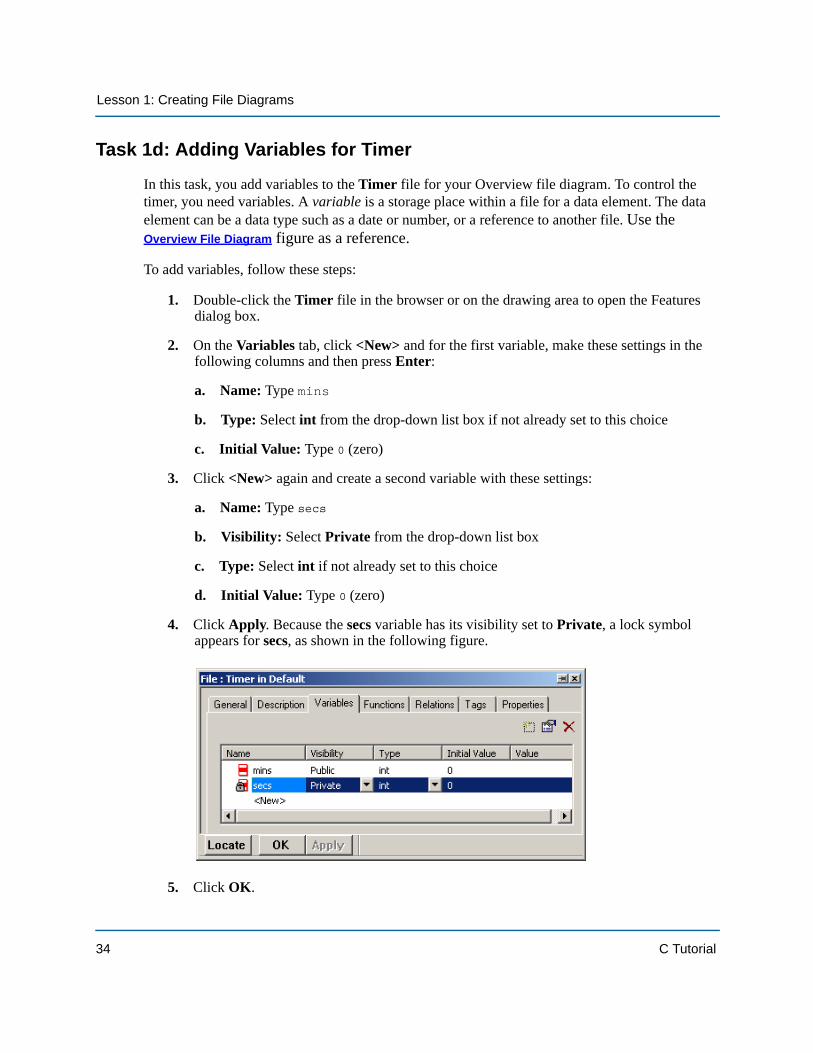
Task 1d: Adding Variables for Timer
In this task, you add variables to the Timer file for your Overview file diagram. To control the timer, you need variables. A variable is a storage place within a file for a data element. The data element can be a data type such as a date or number, or a reference to another file. Use the Overview File Diagram figure as a reference.
To add variables, follow these steps:
1. Double-click the Timer file in the browser or on the drawing area to open the Features dialog box.
2. On the Variables tab, click <New> and for the first variable, make these settings in the following columns and then press Enter:
a. Name: Type mins
b. Type: Select int from the drop-down list box if not already set to this choice
c. Initial Value: Type 0 (zero)
3. Click <New> again and create a second variable with these settings:
a. Name: Type secs
b. Visibility: Select Private from the drop-down list box
c. Type: Select int if not already set to this choice
d. Initial Value: Type 0 (zero)
4. Click Apply. Because the secs variable has its visibility set to Private, a lock symbol appears for secs, as shown in the following figure.
5. Click OK.
34 C Tutorial
Exercise 1: Creating the File Diagram
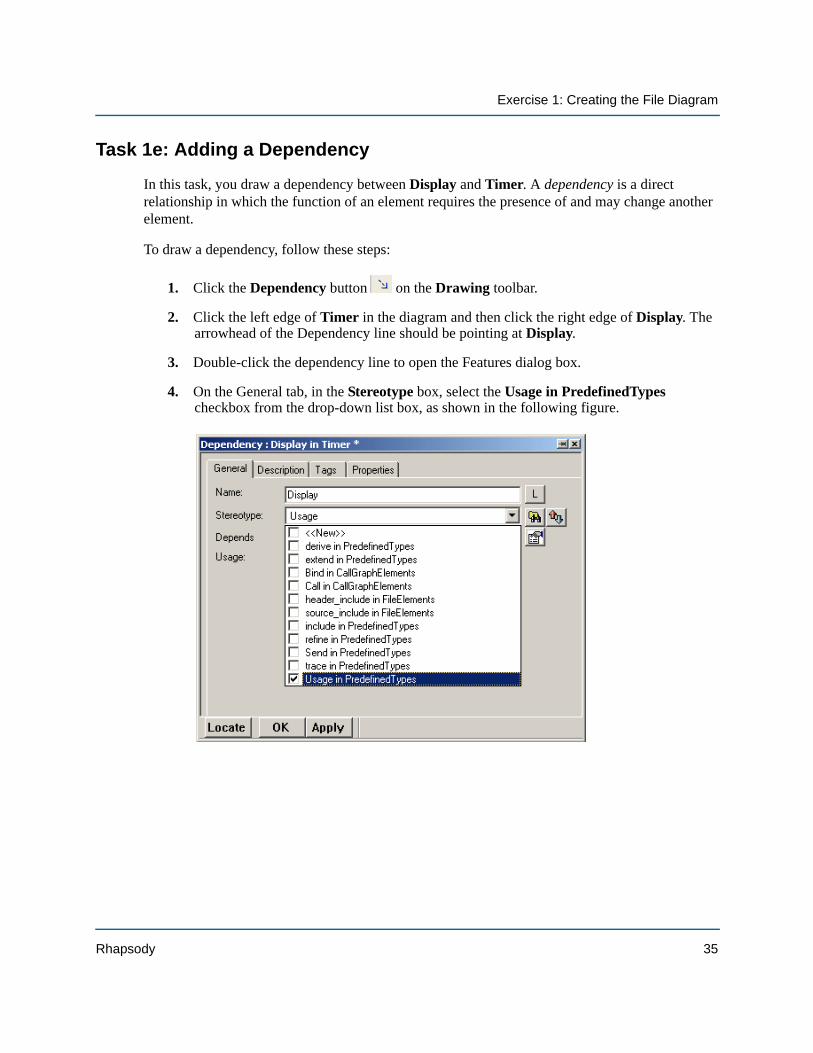
Task 1e: Adding a Dependency
In this task, you draw a dependency between Display and Timer. A dependency is a direct relationship in which the function of an element requires the presence of and may change another element.
To draw a dependency, follow these steps:
1. Click the Dependency button on the Drawing toolbar.
2. Click the left edge of Timer in the diagram and then click the right edge of Display. The arrowhead of the Dependency line should be pointing at Display.
3. Double-click the dependency line to open the Features dialog box.
4. On the General tab, in the Stereotype box, select the Usage in PredefinedTypes checkbox from the drop-down list box, as shown in the following figure.
Rhapsody 35
Lesson 1: Creating File Diagrams
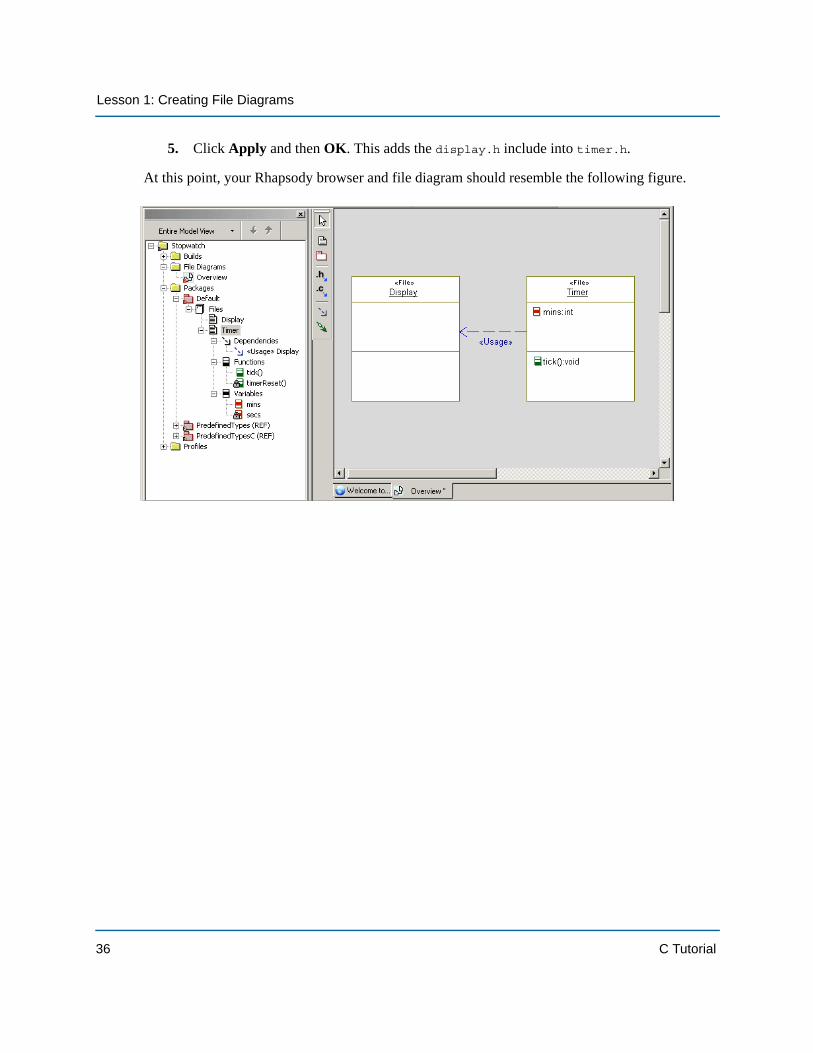
5. Click Apply and then OK. This adds the display.h include into timer.h.
At this point, your Rhapsody browser and file diagram should resemble the following figure.
36 C Tutorial
Exercise 1: Creating the File Diagram
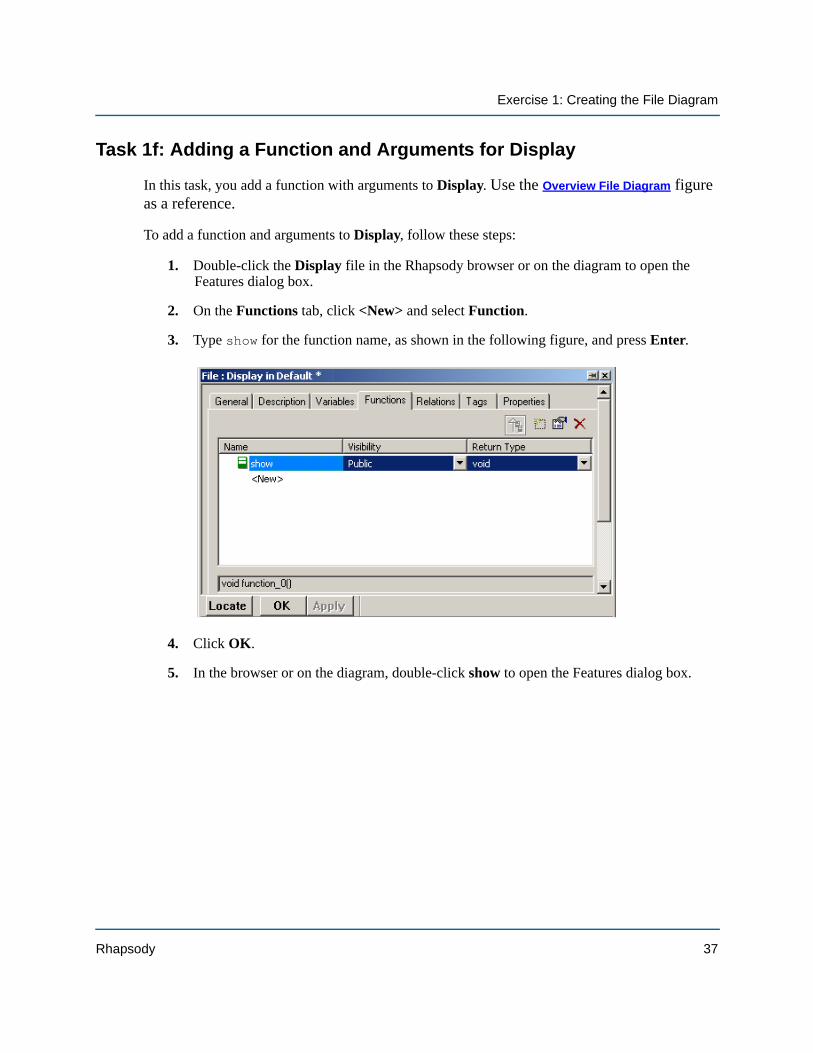
Task 1f: Adding a Function and Arguments for Display
In this task, you add a function with arguments to Display. Use the Overview File Diagram figure as a reference.
To add a function and arguments to Display, follow these steps:
1. Double-click the Display file in the Rhapsody browser or on the diagram to open the Features dialog box.
2. On the Functions tab, click <New> and select Function.
3. Type show for the function name, as shown in the following figure, and press Enter.
4. Click OK.
5. In the browser or on the diagram, double-click show to open the Features dialog box.
Rhapsody 37
Lesson 1: Creating File Diagrams
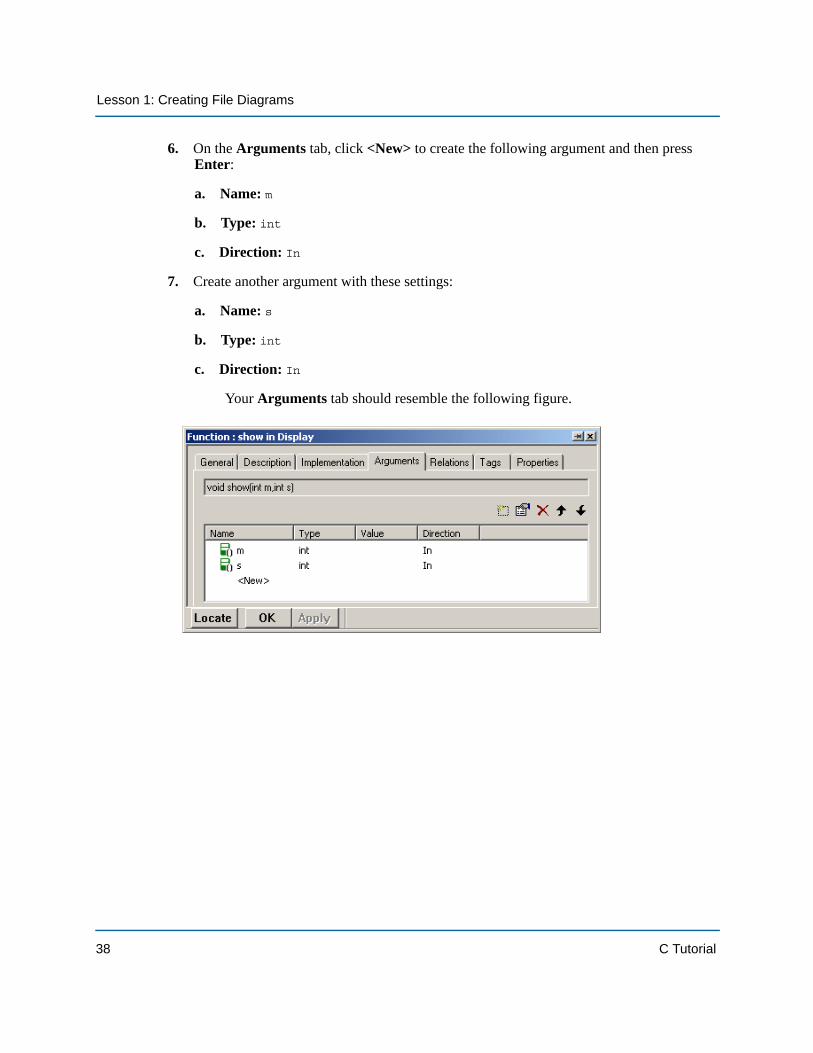
6. On the Arguments tab, click <New> to create the following argument and then press Enter:
a. Name: m
b. Type: int
c. Direction: In
7. Create another argument with these settings:
a. Name: s
b. Type: int
c. Direction: In
Your Arguments tab should resemble the following figure.
38 C Tutorial
Exercise 1: Creating the File Diagram
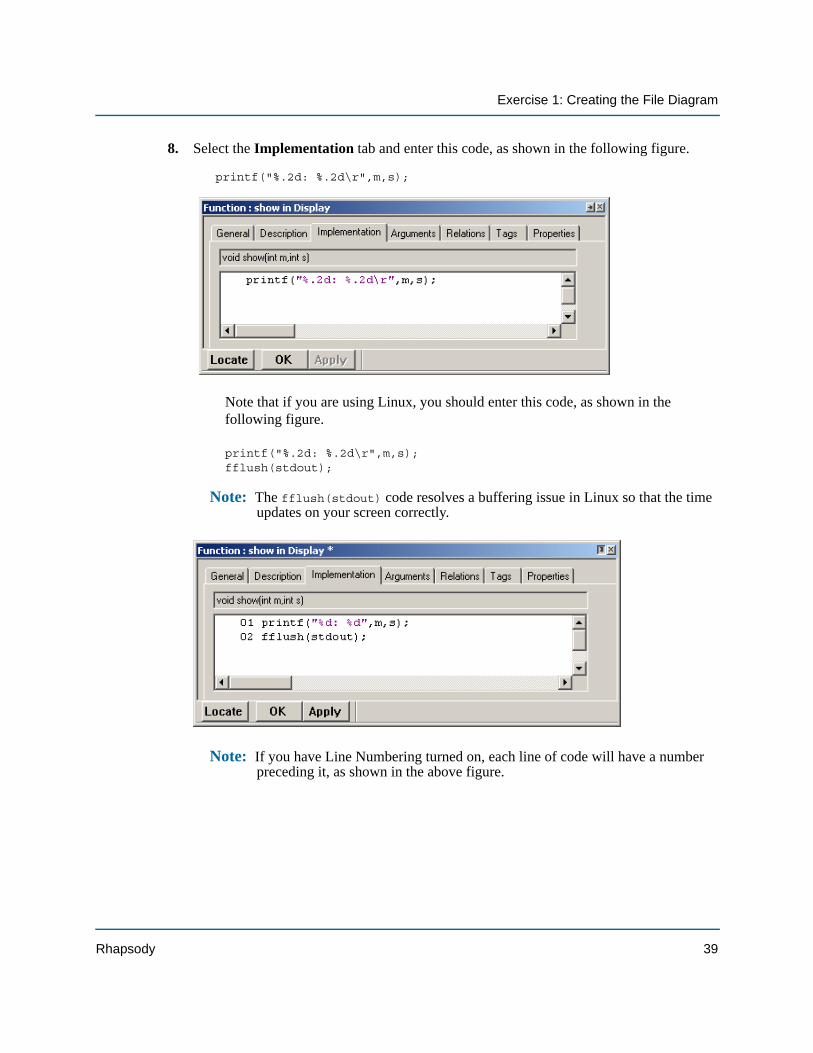
8. Select the Implementation tab and enter this code, as shown in the following figure.
printf("%.2d: %.2d\r",m,s);
Note that if you are using Linux, you should enter this code, as shown in the following figure. printf("%.2d: %.2d\r",m,s); fflush(stdout);
Note: The fflush(stdout) code resolves a buffering issue in Linux so that the time updates on your screen correctly.
Note: If you have Line Numbering turned on, each line of code will have a number preceding it, as shown in the above figure.
Rhapsody 39
Lesson 1: Creating File Diagrams
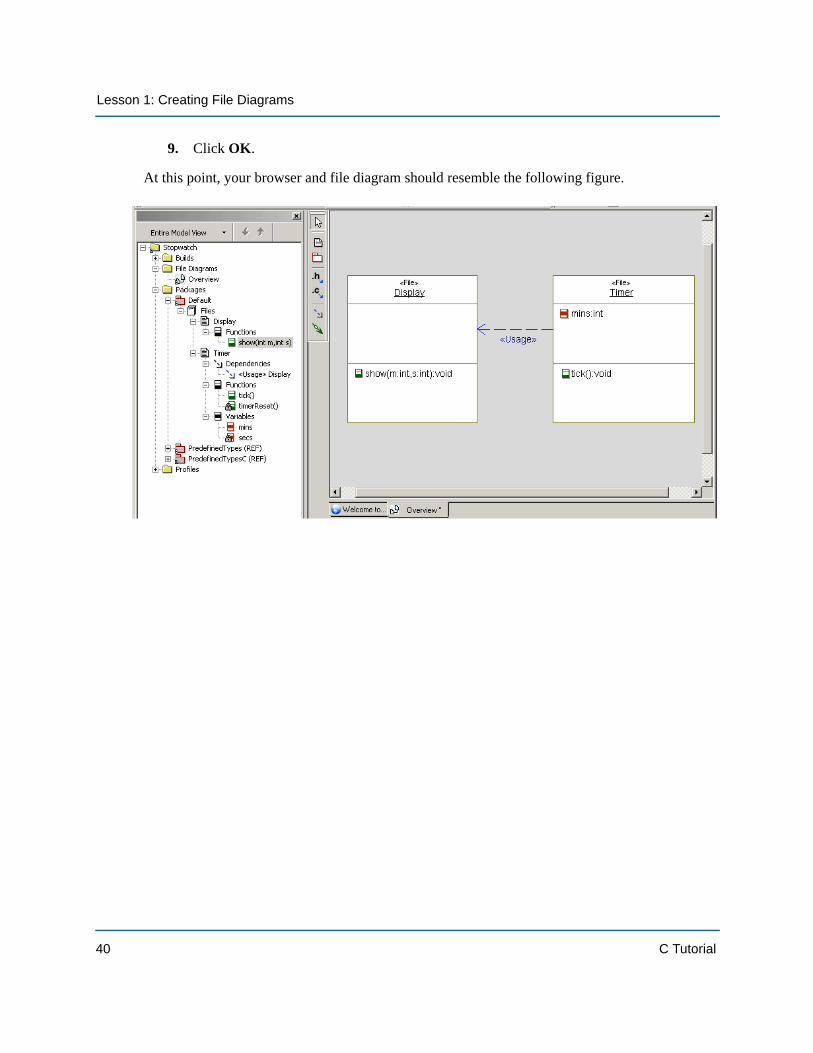
9. Click OK.
At this point, your browser and file diagram should resemble the following figure.
40 C Tutorial
Exercise 1: Creating the File Diagram
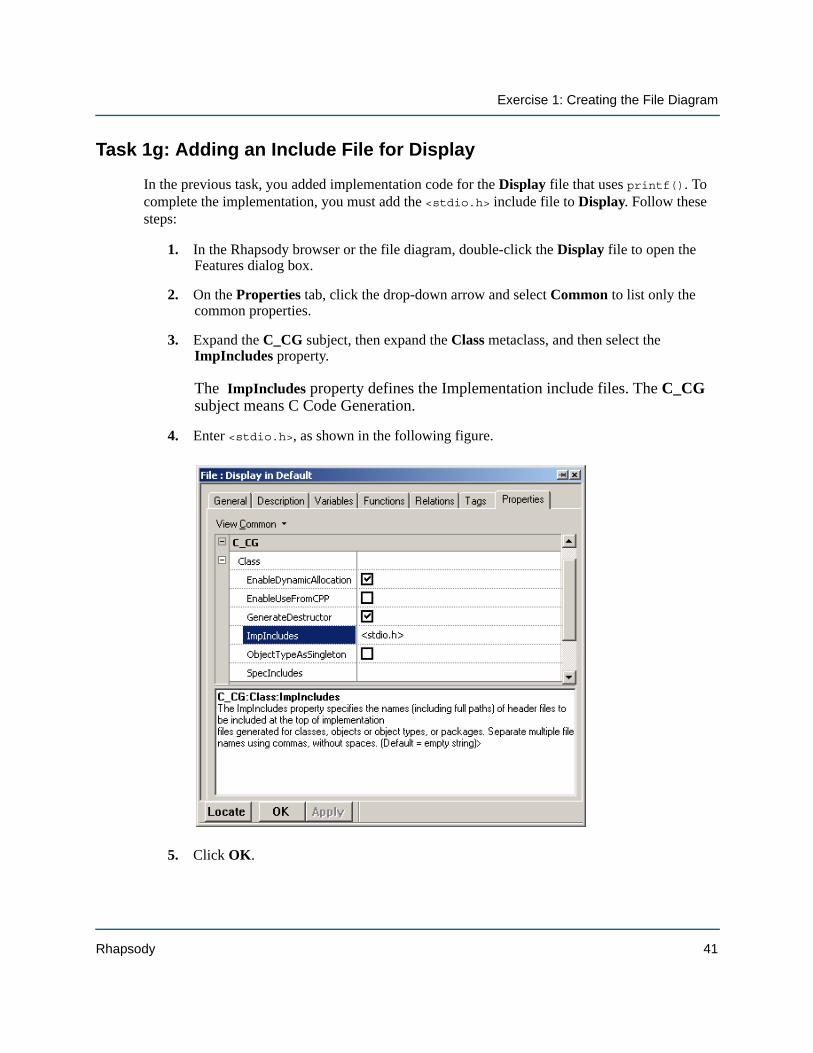
Task 1g: Adding an Include File for Display
In the previous task, you added implementation code for the Display file that uses printf(). To complete the implementation, you must add the <stdio.h> include file to Display. Follow these steps:
1. In the Rhapsody browser or the file diagram, double-click the Display file to open the Features dialog box.
2. On the Properties tab, click the drop-down arrow and select Common to list only the common properties.
3. Expand the C_CG subject, then expand the Class metaclass, and then select the ImpIncludes property. The ImpIncludes property defines the Implementation include files. The C_CG subject means C Code Generation.
4. Enter <stdio.h>, as shown in the following figure..
5. Click OK.
Rhapsody 41
Lesson 1: Creating File Diagrams
Task 1h: Adding a Diagram Title
Each diagram has its name in the diagram table and in the title bar of the window that displays the diagram. However, it is also useful to add a title onto the diagram itself to help other members of your team understand the content and purpose of a diagram.
To add an optional title to your diagram, follow these steps:
1. With the diagram displayed in the drawing area, click the Text button .
2. Click above the items in the diagram and type the title of the diagram. For example, you can name this diagram Overview File Diagram.
3. Make the following changes if you want:
a. Reposition the title by dragging it into another location.
b. Use the tools on the Format toolbar to change the font styles.
4. Save your model.
You have completed drawing the Overview file diagram. It should resemble the Overview File Diagram figure.
SummaryIn this lesson, you created a file, which shows how the system components are interconnected. You became familiar with the parts of a file diagram and you added the following elements:
Files Functions Variables Dependencies
Arguments Implementation code
You are now ready to proceed to the next lesson, where you create a flow chart.
42 C Tutorial
Lesson 2: Creating Flow Charts
Flow charts describe a function or class operation. They show algorithmic flow.
In the previous lesson, you entered code directly for the Display function, see Task 1f: Adding a Function and Arguments for Display. As it does for file diagrams, the Rhapsody code generator also directly translates the elements modeled in flow charts of the function you want to implement into C source code.
Goals for this LessonIn this lesson, you create a flow chart called Tick. In this tutorial, Tick is a timing function that increments in minutes and seconds.
Rhapsody 43

Lesson 2: Creating Flow Charts
Exercise 1: Creating a Flow Chart for the Tick FunctionThe elements in a flow chart describe a function or class operation. The following diagram shows the Tick flow chart that you create in this exercise.
Tick Flow Chart
44 C Tutorial
Exercise 1: Creating a Flow Chart for the Tick Function
Task 1a: Creating the Flow Chart
You draw a flow chart using the following general steps:
1. Draw actions
2. Add default flows, activity flows, condition connectors, and termination states
The following tasks describe each of these steps in detail. Use the Tick Flow Chart figure as a reference.
To create a flow chart, follow these steps:
1. Start Rhapsody and open the stopwatch model if they are not already open.
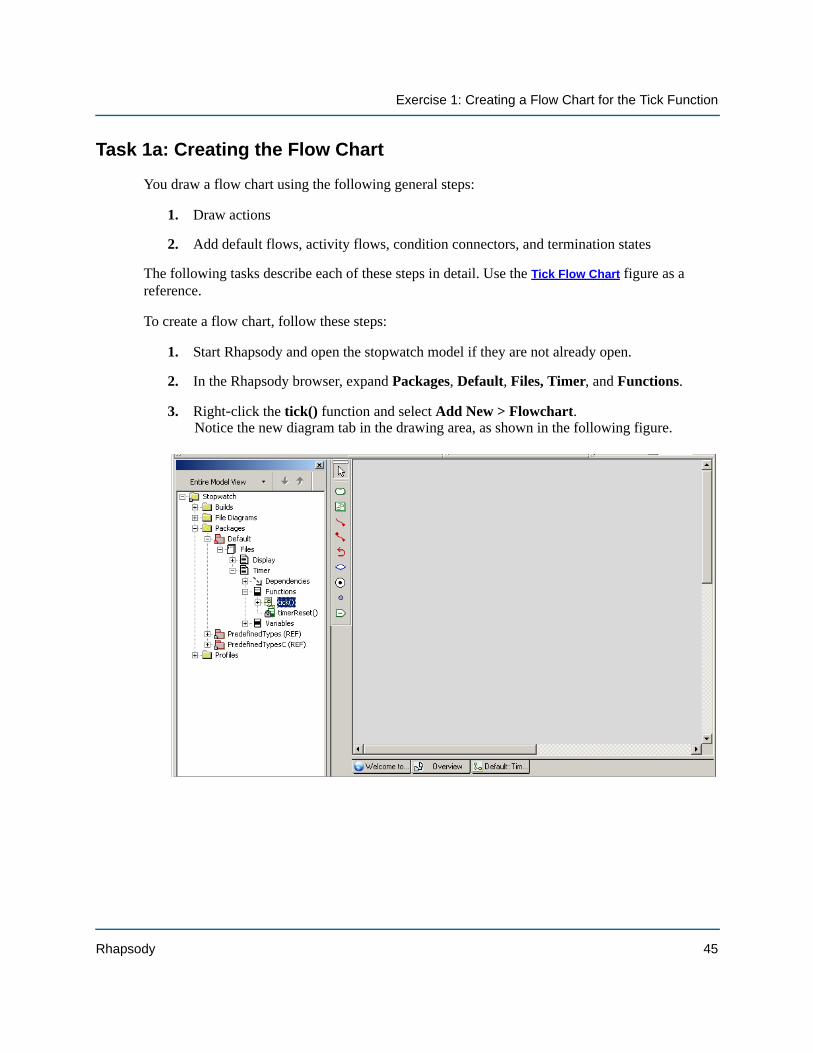
2. In the Rhapsody browser, expand Packages, Default, Files, Timer, and Functions.
3. Right-click the tick() function and select Add New > Flowchart. Notice the new diagram tab in the drawing area, as shown in the following figure.
Rhapsody 45
Lesson 2: Creating Flow Charts
Task 1b: Drawing Action Elements
In this task, you draw the action elements that represent the functional processes.
To draw action elements, follow these steps. Use the Tick Flow Chart figure as a reference for the placement of the action elements.
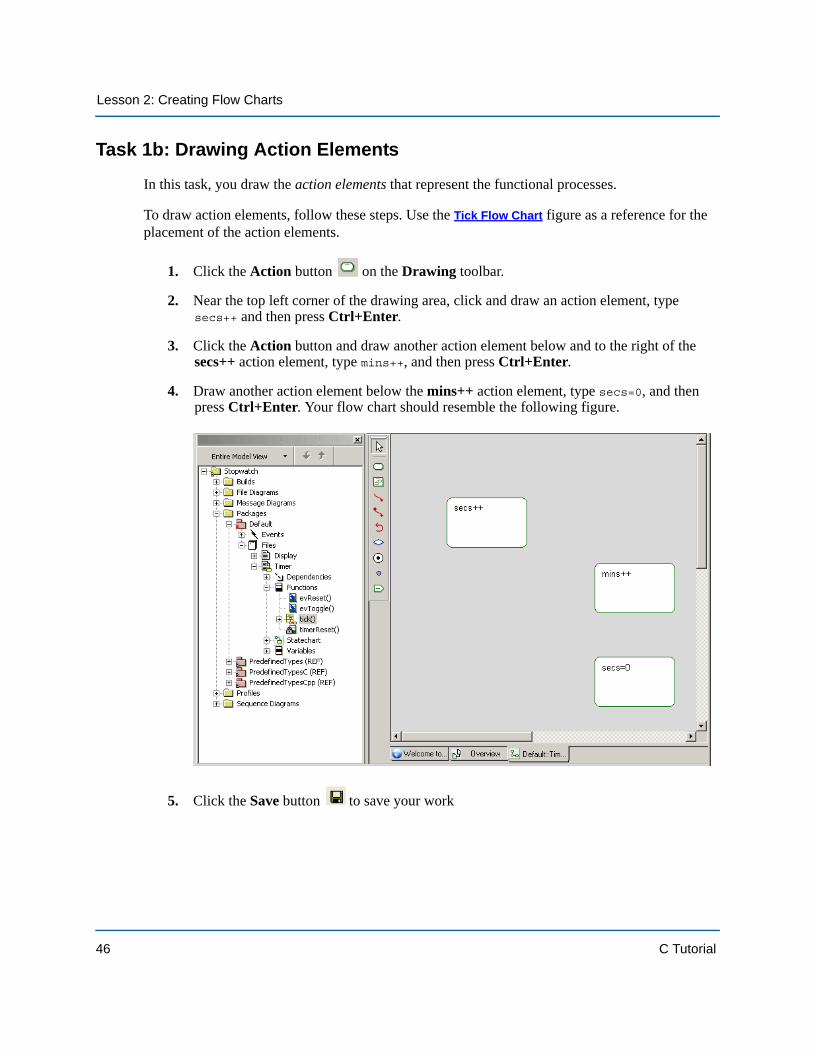
1. Click the Action button on the Drawing toolbar.
2. Near the top left corner of the drawing area, click and draw an action element, type secs++ and then press Ctrl+Enter.
3. Click the Action button and draw another action element below and to the right of the secs++ action element, type mins++, and then press Ctrl+Enter.
4. Draw another action element below the mins++ action element, type secs=0, and then press Ctrl+Enter. Your flow chart should resemble the following figure.
5. Click the Save button to save your work
46 C Tutorial
Exercise 1: Creating a Flow Chart for the Tick Function
Task 1c: Drawing a Default Flow
In this task, you draw a default flow. One of the action elements must be the default action element.The flow chart flow originates from the element pointed to by the default flow.
To draw a default flow, follow these steps. Use the Tick Flow Chart figure as a reference.
1. Click the Default Flow button on the Drawing toolbar.
2. Click above and to the left of the secs++ action element, then click its edge, and then click the mouse button again (this is the same as pressing Enter); or press Ctrl+Enter.
Task 1d: Drawing a Termination State
A termination state provides local termination semantics. The flow chart returns at this point to the operation/function that invoked it.
To draw a termination state, follow these steps. Use the Tick Flow Chart figure as a reference.
1. Click the Termination State button on the Drawing toolbar.
2. Click below the secs++ action element and to the left of the secs=0 action element.
Rhapsody 47
Lesson 2: Creating Flow Charts
Task 1e: Drawing Condition Connector
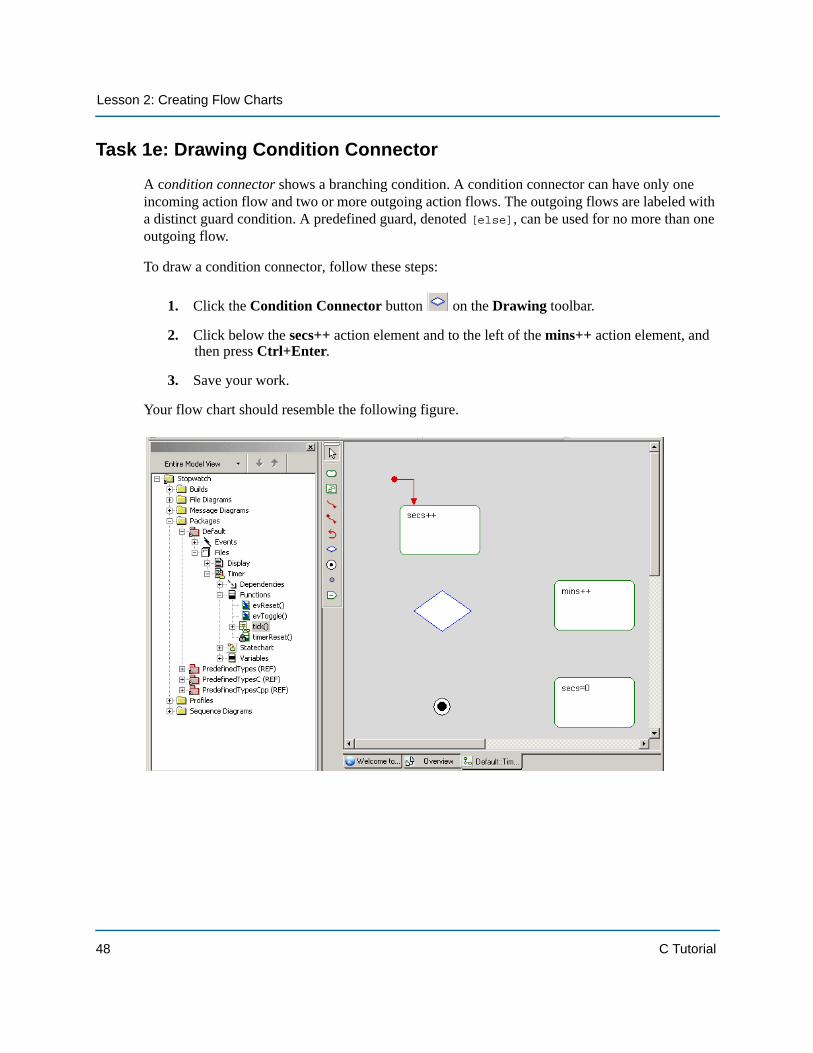
A condition connector shows a branching condition. A condition connector can have only one incoming action flow and two or more outgoing action flows. The outgoing flows are labeled with a distinct guard condition. A predefined guard, denoted [else], can be used for no more than one outgoing flow.
To draw a condition connector, follow these steps:
1. Click the Condition Connector button on the Drawing toolbar.
2. Click below the secs++ action element and to the left of the mins++ action element, and then press Ctrl+Enter.
3. Save your work.
Your flow chart should resemble the following figure.
48 C Tutorial

Exercise 1: Creating a Flow Chart for the Tick Function
Task 1f: Drawing Activity Flows
Activity flows represent the response to a message in a given action element. They show what the next action element will be.
To draw activity flows between actions, follow these steps. Use the Tick Flow Chart figure as a reference.
1. Click the Activity Flow button on the Drawing toolbar and draw a flow from the secs++ action element to the Condition Connector, and then click the mouse button again (this is the same as pressing Enter); or press Ctrl+Enter.
2. Click the Activity Flow button and draw a flow from the Condition Connector to the mins++ action element, type [secs>59], and then press Ctrl+Enter.
3. Draw a flow from the mins++ action element to the secs=0 action element and then click the mouse button again or press Ctrl+Enter.
4. Draw a flow from the secs=0 action element to the Termination State and then click the mouse button again or press Ctrl+Enter.
5. Draw a flow from the Condition Connector to the Termination State, type [else] and then press Ctrl+Enter.
6. Save your work. Your model should resemble the following figure.
Rhapsody 49
Lesson 2: Creating Flow Charts
Task 1g: Adding a Diagram Title
Each diagram has its name in the diagram table and in the title bar of the window that displays the diagram. However, it is also useful to add a title onto the diagram itself to help other members of your team understand the content and purpose of a diagram.
To add an optional title to your diagram, follow these steps:
1. With the diagram displayed in the drawing area, click the Text button .
2. Click above the items in the diagram and type the title of the diagram. For example, you can name this diagram Tick Flow Chart.
3. Make the following changes if you want:
a. Reposition the title by dragging it into another location.
b. Change the font styles.
4. Save your work.
You have completed drawing the Tick flow chart. It should resemble the Tick Flow Chart figure.
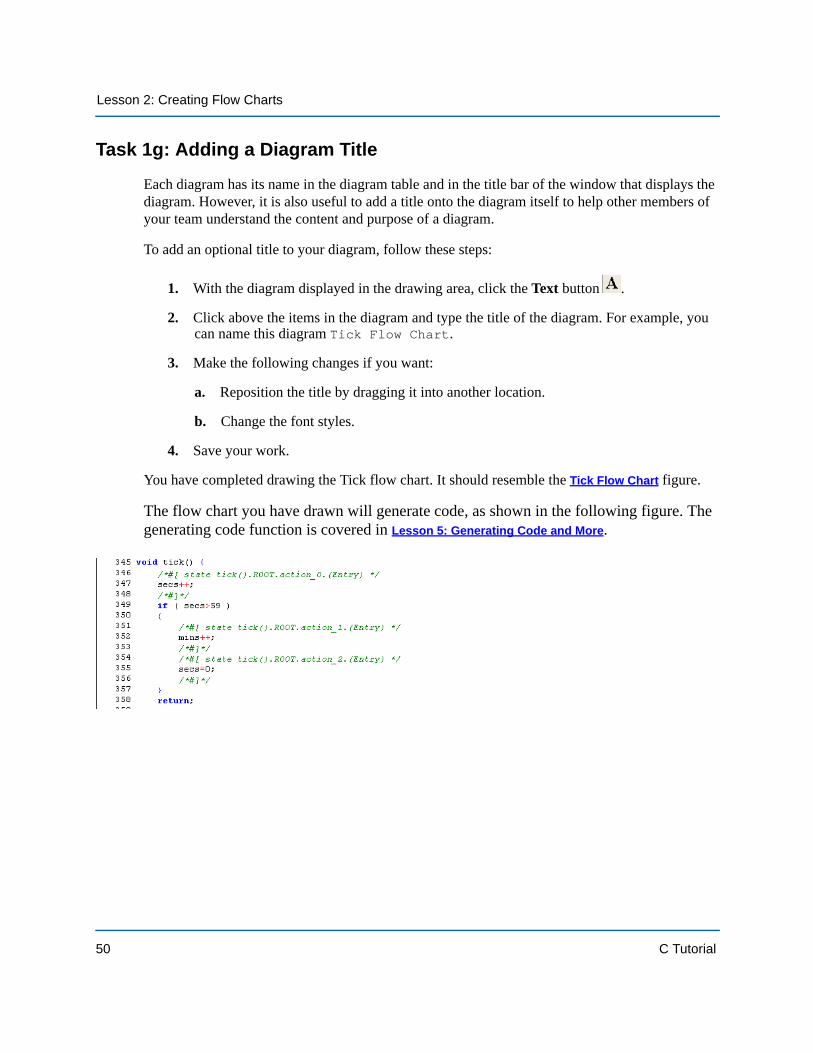
The flow chart you have drawn will generate code, as shown in the following figure. The generating code function is covered in Lesson 5: Generating Code and More.
50 C Tutorial
Summary
SummaryIn this lesson, you created a flow chart, which shows actions and implementation code, and which will be used for code generation later. You became familiar with the parts of a flow chart and you added the following elements:
Action elements Default flow Activity flows Condition connector Termination state
You are now ready to proceed to the next lesson, where you identify the action element-based behavior for the stopwatch model using a statechart.
Rhapsody 51

Lesson 2: Creating Flow Charts
52 C Tutorial
Lesson 3: Creating Statecharts
Statecharts define the behavior of classifiers (actors, files, use cases, or classes), objects, including the states that they can enter over their lifetime and the messages, events, or operations functions that cause them to transition from state to state.
Statecharts are a key animation tool used to verify the functional flow and modeling. Statecharts can be animated to view the design level of abstraction and graphically show dynamic behavior.
Goals for this LessonIn this lesson, you create the Timer statechart.
Rhapsody 53
Lesson 3: Creating Statecharts
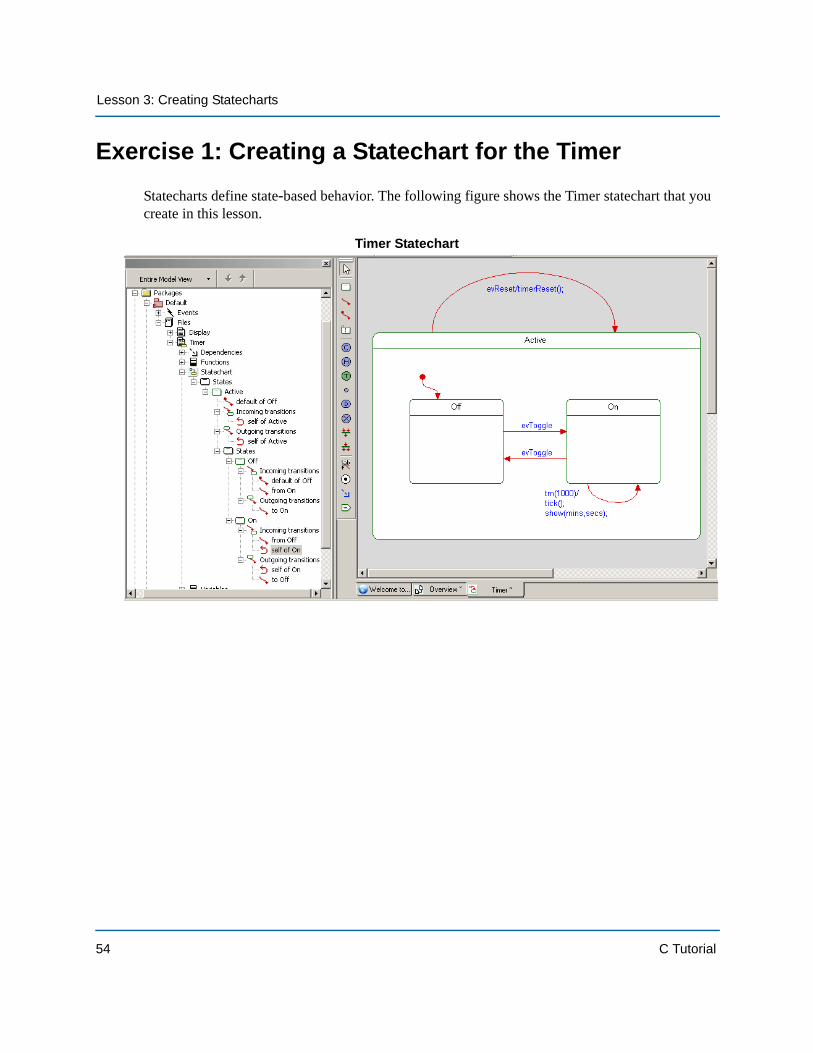
Exercise 1: Creating a Statechart for the TimerStatecharts define state-based behavior. The following figure shows the Timer statechart that you create in this lesson.
Timer Statechart
54 C Tutorial
Exercise 1: Creating a Statechart for the Timer
Task 1a: Creating the Statechart
In this task, you create a statechart. In order to describe the behavior of the timer, you need to add a statechart. Use the Timer Statechart figure as a reference.
To create a statechart, follow these steps:
1. Start Rhapsody and open the stopwatch model if they are not already open.
2. In the Rhapsody browser, expand Packages, Default, and Files.
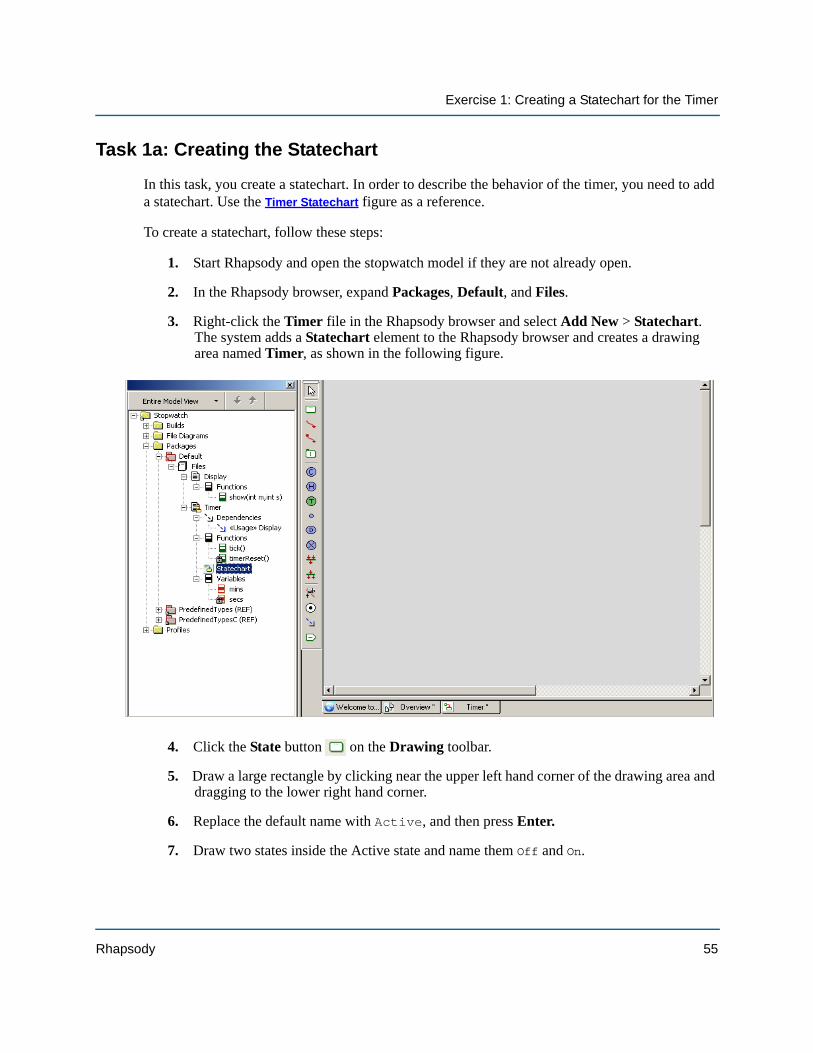
3. Right-click the Timer file in the Rhapsody browser and select Add New > Statechart. The system adds a Statechart element to the Rhapsody browser and creates a drawing area named Timer, as shown in the following figure.
4. Click the State button on the Drawing toolbar.
5. Draw a large rectangle by clicking near the upper left hand corner of the drawing area and dragging to the lower right hand corner.
6. Replace the default name with Active, and then press Enter.
7. Draw two states inside the Active state and name them Off and On.
Rhapsody 55

Lesson 3: Creating Statecharts
8. Click the Default Connector button and draw a connector to the Off state and then click the mouse button again (this is the same as pressing Enter) or press Ctrl+Enter.
At this point, your diagram should resemble the following figure.
9. Click the Save button to save your work.
56 C Tutorial
Exercise 1: Creating a Statechart for the Timer
Task 1b: Adding Transitions Between States
To build a functioning statechart, the states must have connections (transitions) to indicate the workflow. Rhapsody provides a timer, tm(1000), that you can use within statecharts. The timer tm(1000) acts as an event to be taken one second after the state has been entered. Therefore, when entering into a state, the timer starts, and it stops when exiting the state.
Use the Timer Statechart figure as a reference.
To create transitions for the states, follow these steps:
1. Click the Transition button , then click the right border of the Off state, and then draw a transition to the On state.
2. Name the transition evToggle and then press Ctrl+Enter.
3. Draw another transition from On to Off and name it evToggle.
4. Draw another transition line from Active state back to itself, type the following code, and press Ctrl+Enter:
evReset/timerReset();
5. Draw another transition line from the On state back to itself and press Ctrl+Enter.
Rhapsody 57
Lesson 3: Creating Statecharts
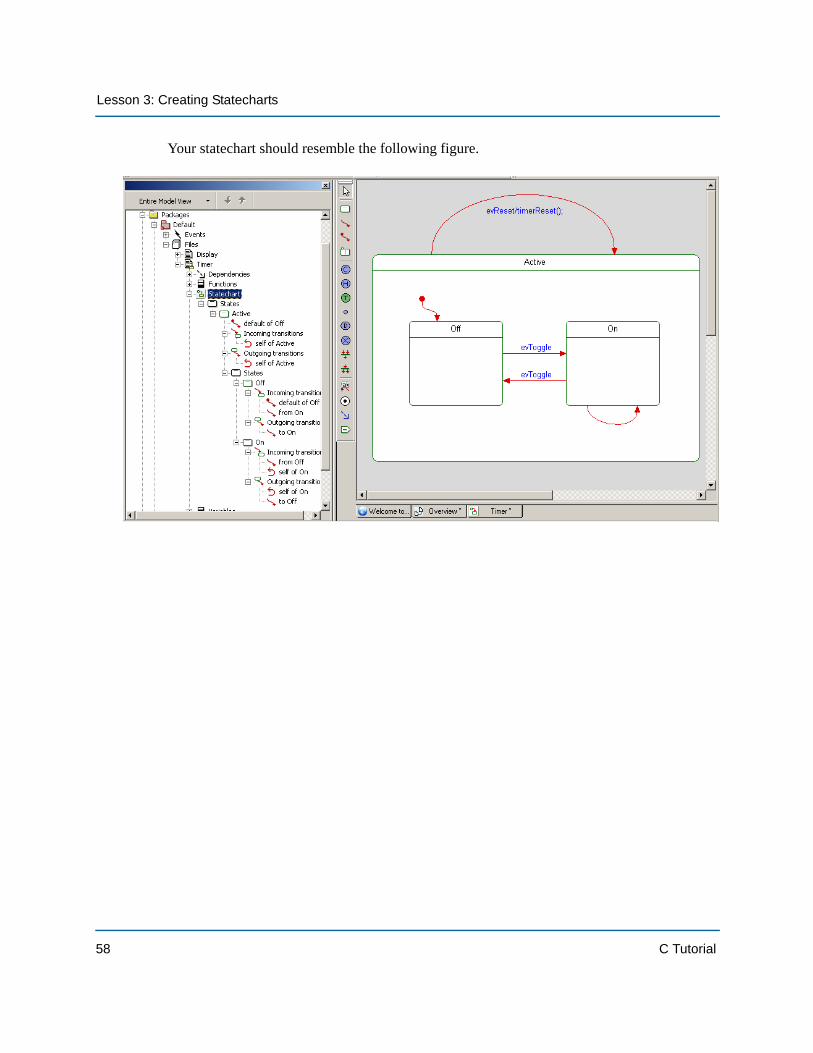
Your statechart should resemble the following figure.
58 C Tutorial
Exercise 1: Creating a Statechart for the Timer
Task 1c: Using the Rhapsody Timer
Rhapsody provides a timer, tm(1000), that can be used within the statecharts. This timer uses the OS Tick and only generates timeouts that are a multiple of ticks. For example, if a system tick is 20ms and a timeout of 65ms is requested, then the resulting timeout is actually between 80ms and 100ms, depending on when the timeout is started relative to the system tick.
NoteIf precise timeouts are required, then it is better to use a hardware timer in combination with triggered operations.
To enter a definition for a timer, follow these steps:
1. Double-click the unlabeled transition line located at the bottom of the On state in the statechart diagram to open the Features dialog box.
2. Type tm(1000) in the Trigger box.
Rhapsody 59
Lesson 3: Creating Statecharts
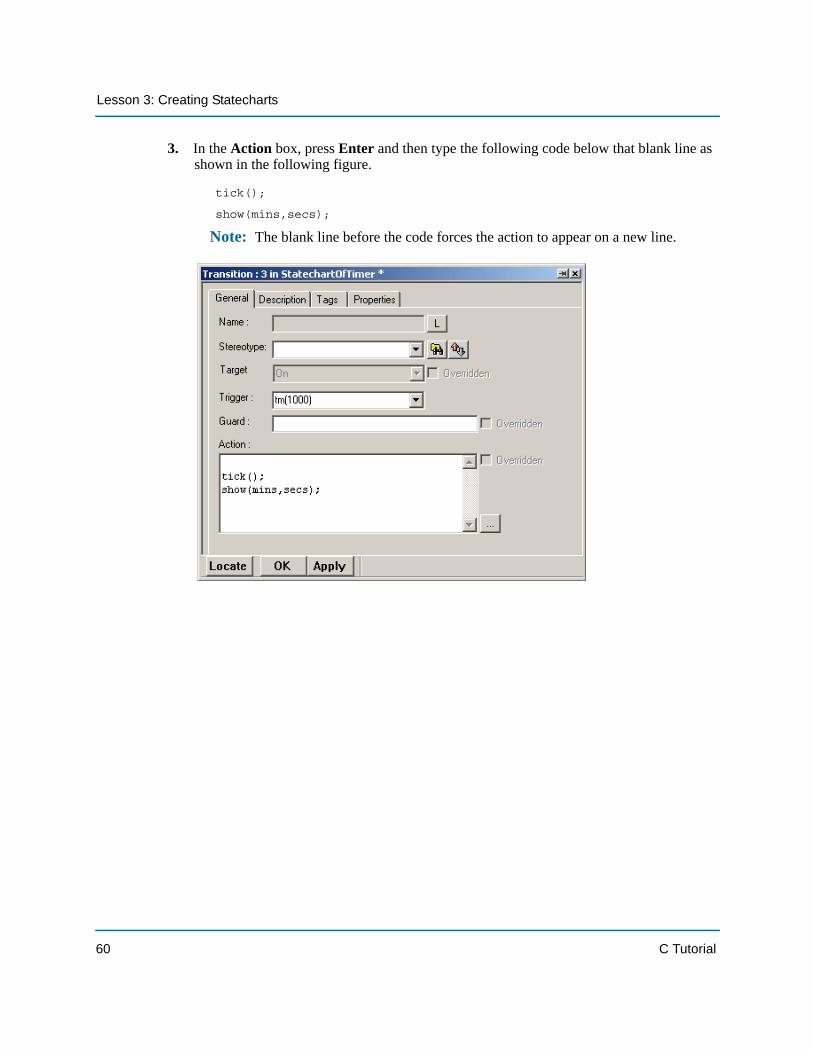
3. In the Action box, press Enter and then type the following code below that blank line as shown in the following figure.
tick();
show(mins,secs);
Note: The blank line before the code forces the action to appear on a new line.
60 C Tutorial
Exercise 1: Creating a Statechart for the Timer
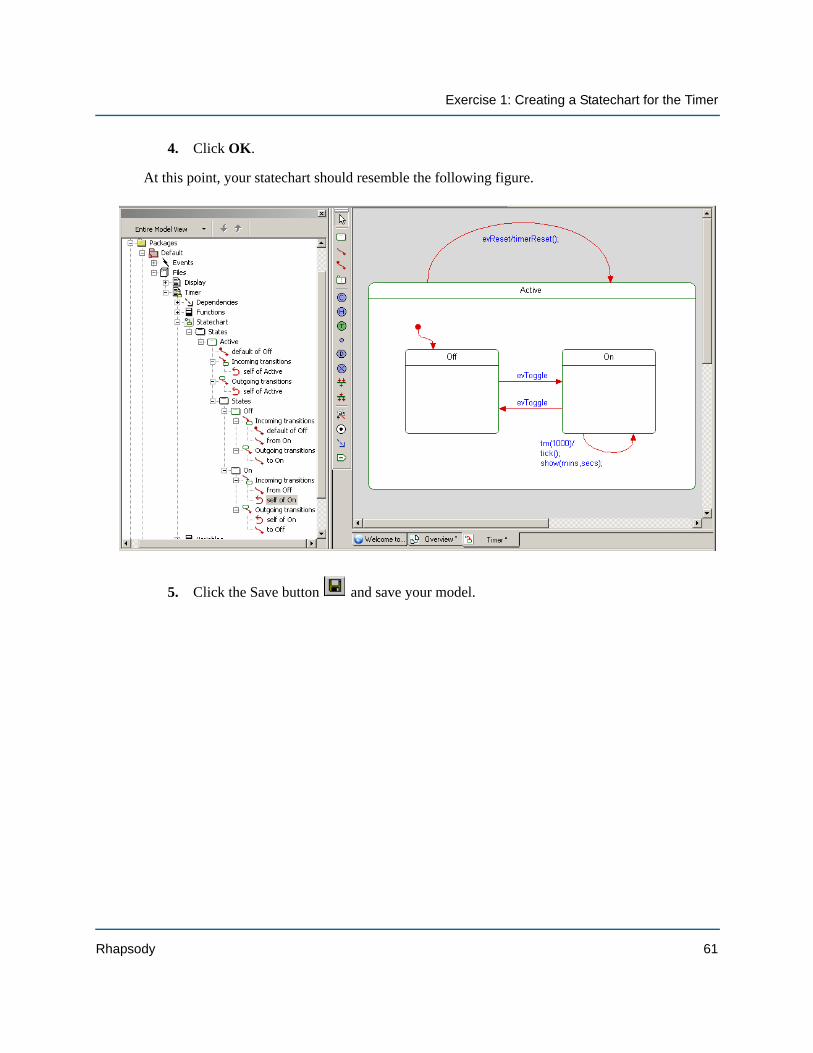
4. Click OK.
At this point, your statechart should resemble the following figure.
5. Click the Save button and save your model.
Rhapsody 61
Lesson 3: Creating Statecharts
Exercise 2: Animating a StatechartAs the model gets more and more complicated, it is a good practice to stop and validate the model periodically and provide design-level debugging. One of the primary methods the Rhapsody product uses to simulate a model is animation.
Animation is the execution of behaviors and associated definitions in the model. Rhapsody animates the model by executing the code generated with instrumentation for classes/files, operations/functions, and associations. Once you animate the model, you can open animated diagrams, which let you observe the model as it is running and perform design-level debugging. You can step through the model, set and clear breakpoints, inject events, and generate an output trace.
NoteAs part of this exercise, you generate code. However, this exercise focuses on animation, and specifically for a statechart. In later lessons you learn more about generating code and animating.
62 C Tutorial
Exercise 2: Animating a Statechart
Task 2a: Defining a Test Component and Configuration
In this task, you define the execution code for this animation. To do this, you must first define a test component and a configuration to use for animation. Follow these steps:
1. In the Rhapsody browser, expand Builds.
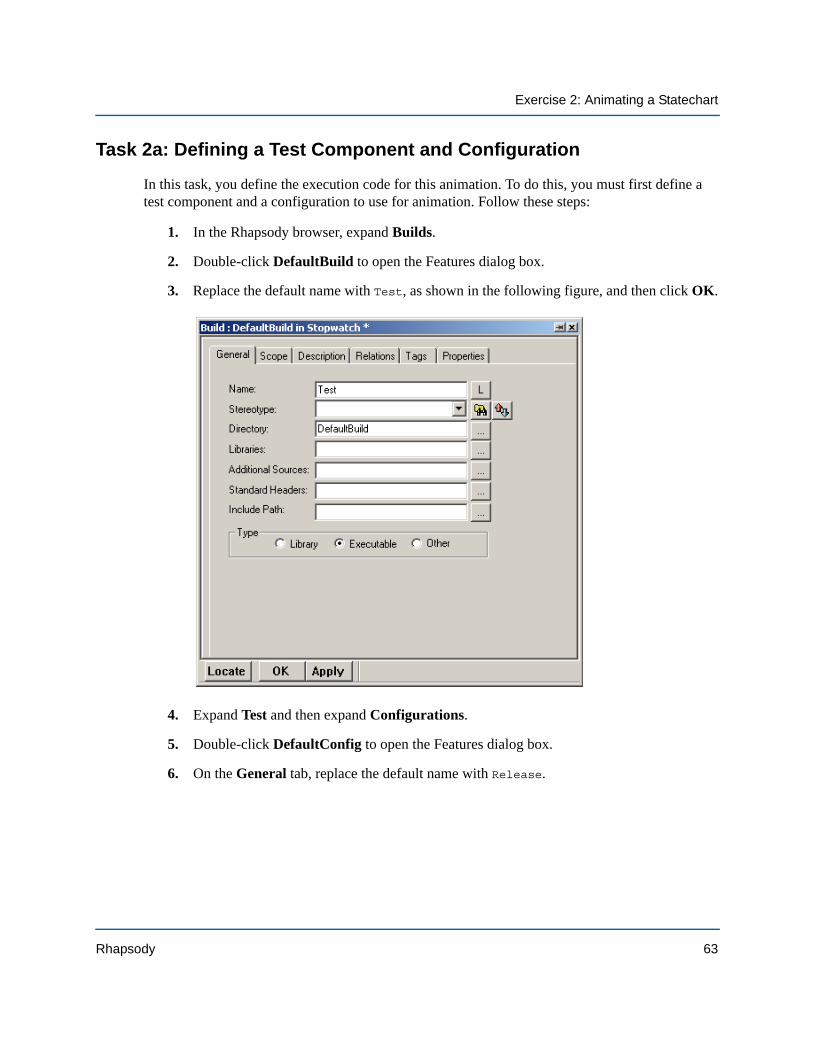
2. Double-click DefaultBuild to open the Features dialog box.
3. Replace the default name with Test, as shown in the following figure, and then click OK.
4. Expand Test and then expand Configurations.
5. Double-click DefaultConfig to open the Features dialog box.
6. On the General tab, replace the default name with Release.
Rhapsody 63
Lesson 3: Creating Statecharts
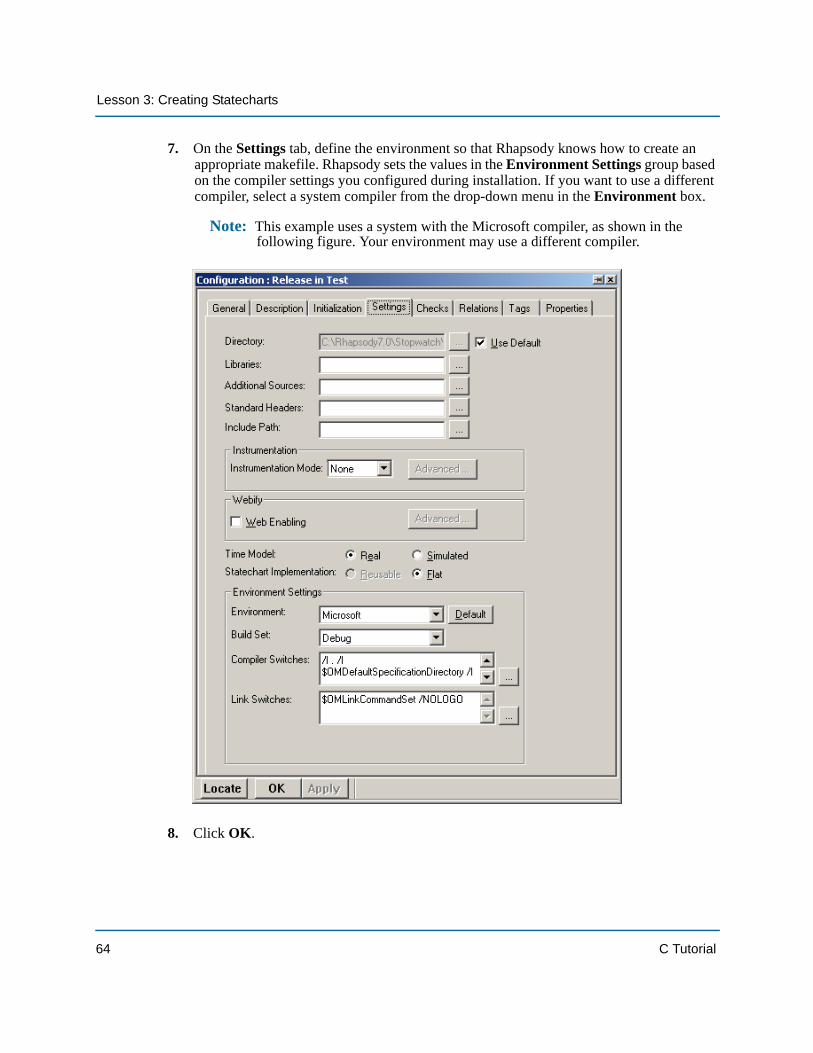
7. On the Settings tab, define the environment so that Rhapsody knows how to create an appropriate makefile. Rhapsody sets the values in the Environment Settings group based on the compiler settings you configured during installation. If you want to use a different compiler, select a system compiler from the drop-down menu in the Environment box.
Note: This example uses a system with the Microsoft compiler, as shown in the following figure. Your environment may use a different compiler.
8. Click OK.
64 C Tutorial
Exercise 2: Animating a Statechart
Task 2b: Creating a Debug Configuration
In this task, for animation purposes, you create a Debug configuration. Follow these steps:
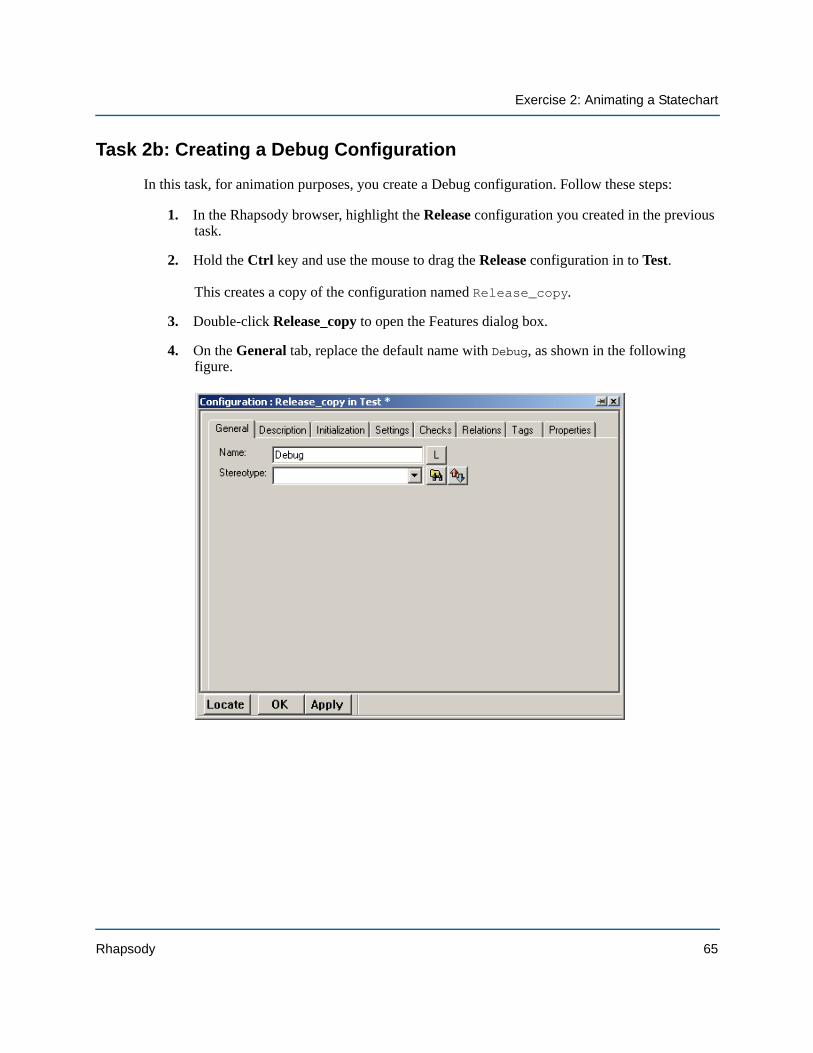
1. In the Rhapsody browser, highlight the Release configuration you created in the previous task.
2. Hold the Ctrl key and use the mouse to drag the Release configuration in to Test. This creates a copy of the configuration named Release_copy.
3. Double-click Release_copy to open the Features dialog box.
4. On the General tab, replace the default name with Debug, as shown in the following figure.
Rhapsody 65
Lesson 3: Creating Statecharts
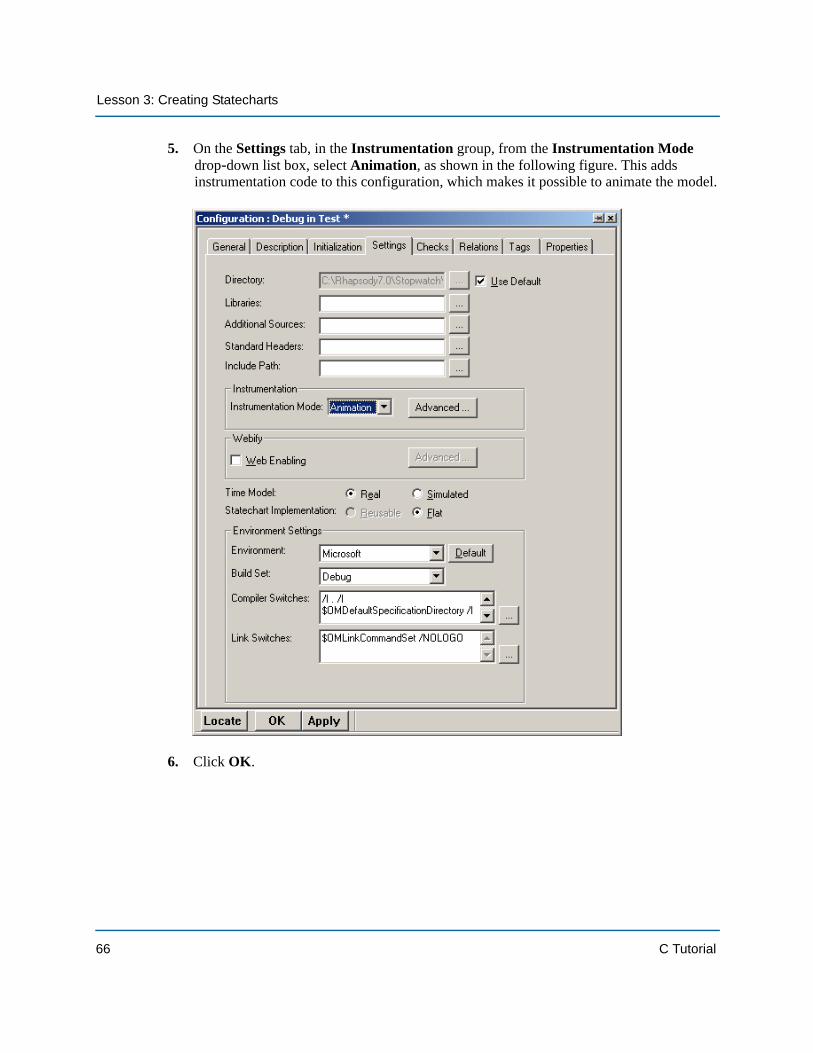
5. On the Settings tab, in the Instrumentation group, from the Instrumentation Mode drop-down list box, select Animation, as shown in the following figure. This adds instrumentation code to this configuration, which makes it possible to animate the model.
6. Click OK.
66 C Tutorial
Exercise 2: Animating a Statechart
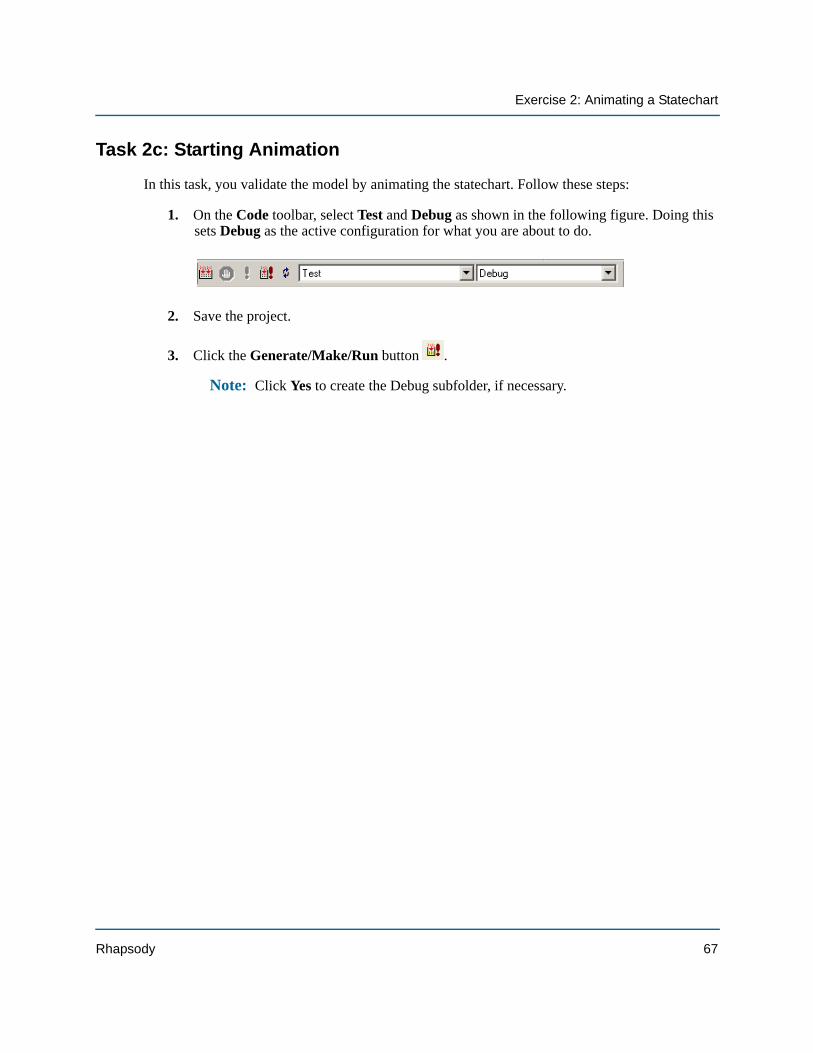
Task 2c: Starting Animation
In this task, you validate the model by animating the statechart. Follow these steps:
1. On the Code toolbar, select Test and Debug as shown in the following figure. Doing this sets Debug as the active configuration for what you are about to do.
2. Save the project.
3. Click the Generate/Make/Run button .
Note: Click Yes to create the Debug subfolder, if necessary.
Rhapsody 67
Lesson 3: Creating Statecharts
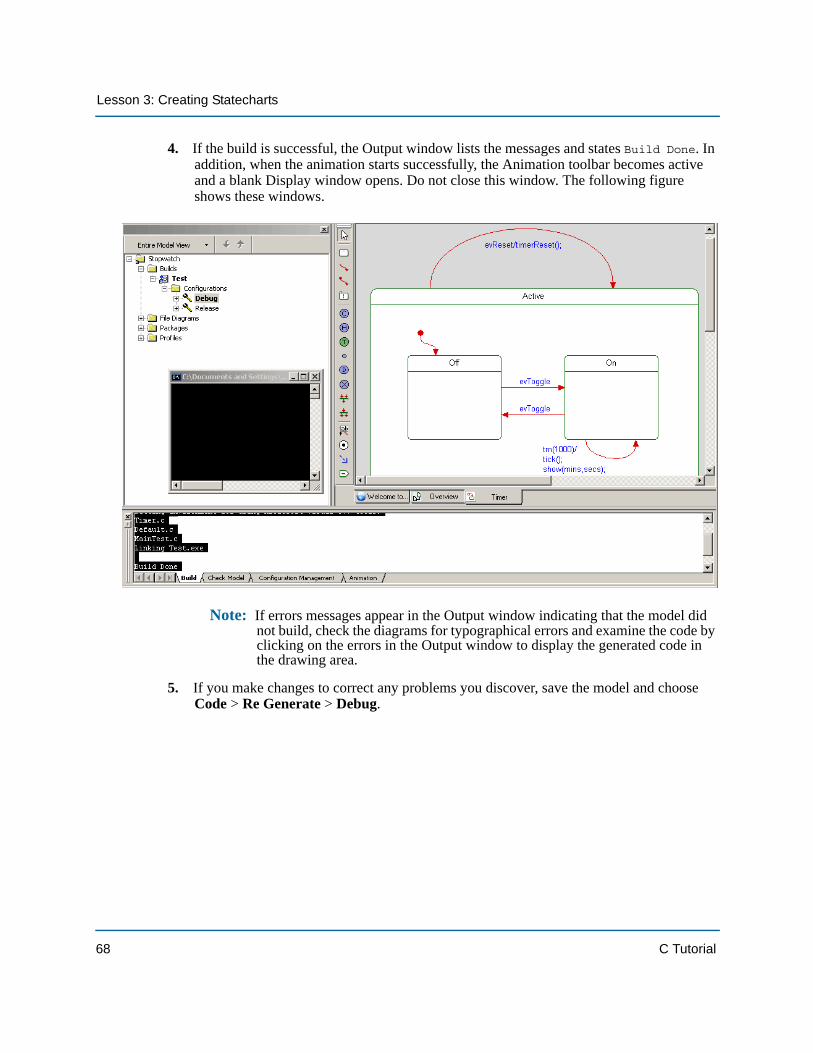
4. If the build is successful, the Output window lists the messages and states Build Done. In addition, when the animation starts successfully, the Animation toolbar becomes active and a blank Display window opens. Do not close this window. The following figure shows these windows.
Note: If errors messages appear in the Output window indicating that the model did not build, check the diagrams for typographical errors and examine the code by clicking on the errors in the Output window to display the generated code in the drawing area.
5. If you make changes to correct any problems you discover, save the model and choose Code > Re Generate > Debug.
68 C Tutorial
Exercise 2: Animating a Statechart
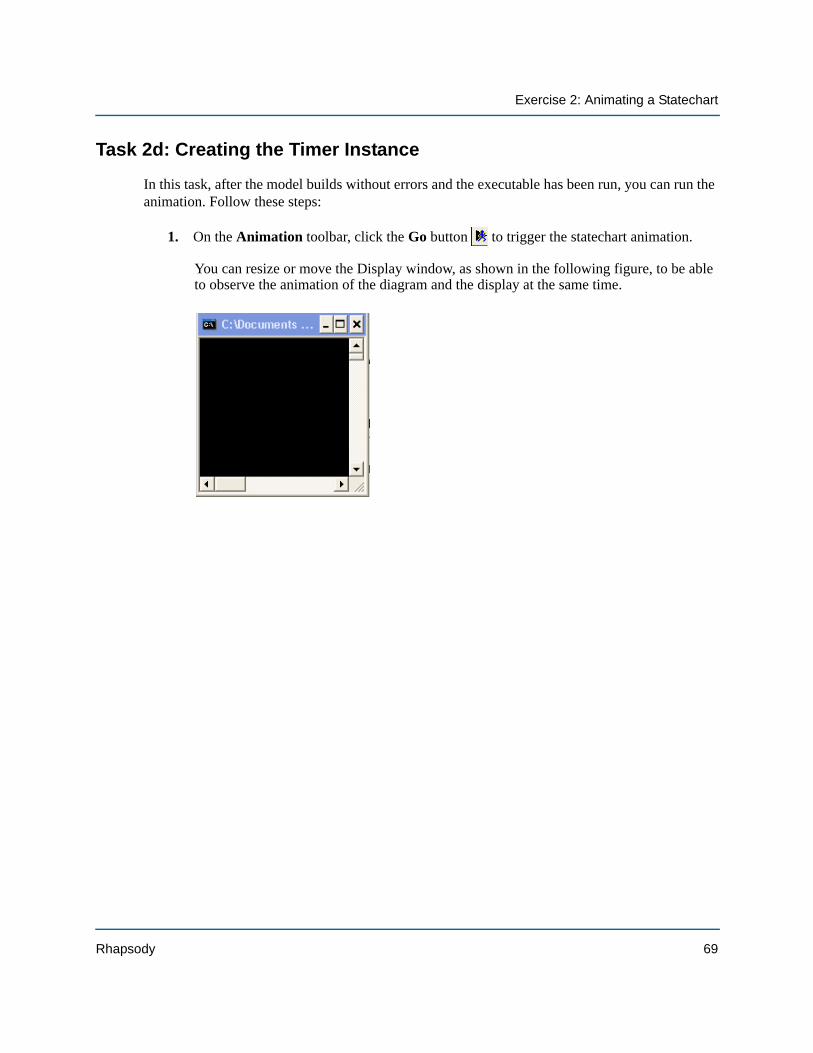
Task 2d: Creating the Timer Instance
In this task, after the model builds without errors and the executable has been run, you can run the animation. Follow these steps:
1. On the Animation toolbar, click the Go button to trigger the statechart animation. You can resize or move the Display window, as shown in the following figure, to be able to observe the animation of the diagram and the display at the same time.
Rhapsody 69
Lesson 3: Creating Statecharts
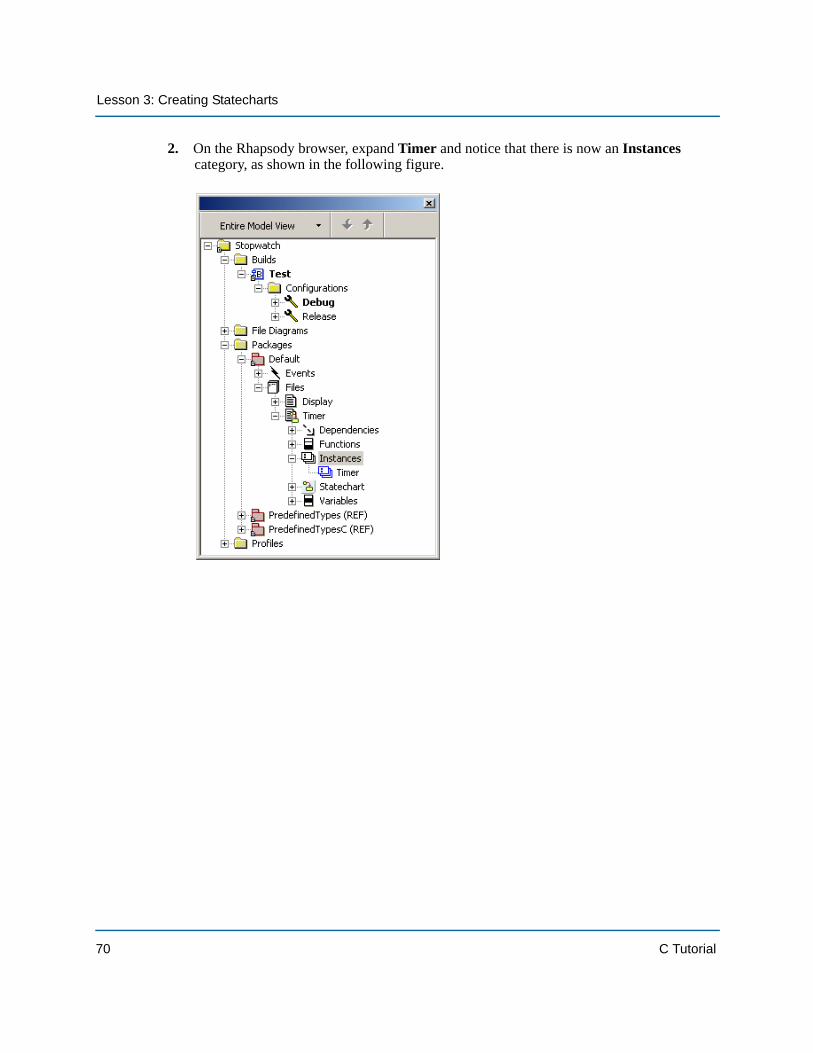
2. On the Rhapsody browser, expand Timer and notice that there is now an Instances category, as shown in the following figure.
70 C Tutorial
Exercise 2: Animating a Statechart
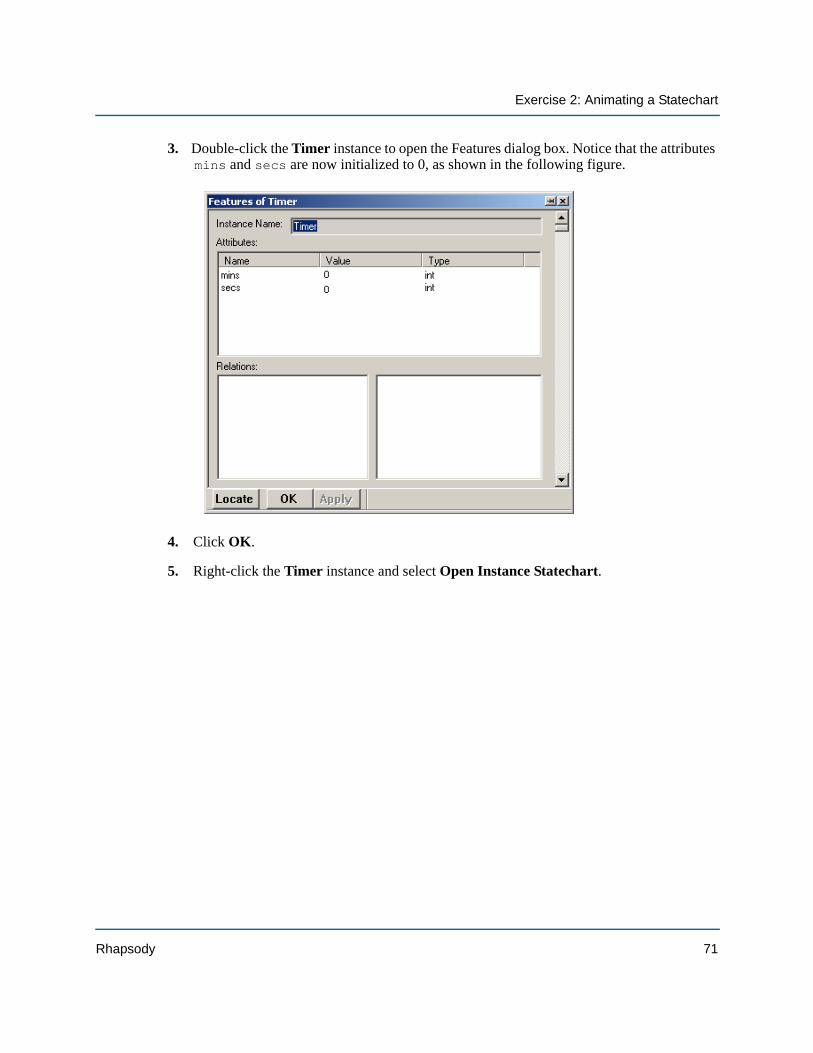
3. Double-click the Timer instance to open the Features dialog box. Notice that the attributes mins and secs are now initialized to 0, as shown in the following figure.
4. Click OK.
5. Right-click the Timer instance and select Open Instance Statechart.
Rhapsody 71
Lesson 3: Creating Statecharts
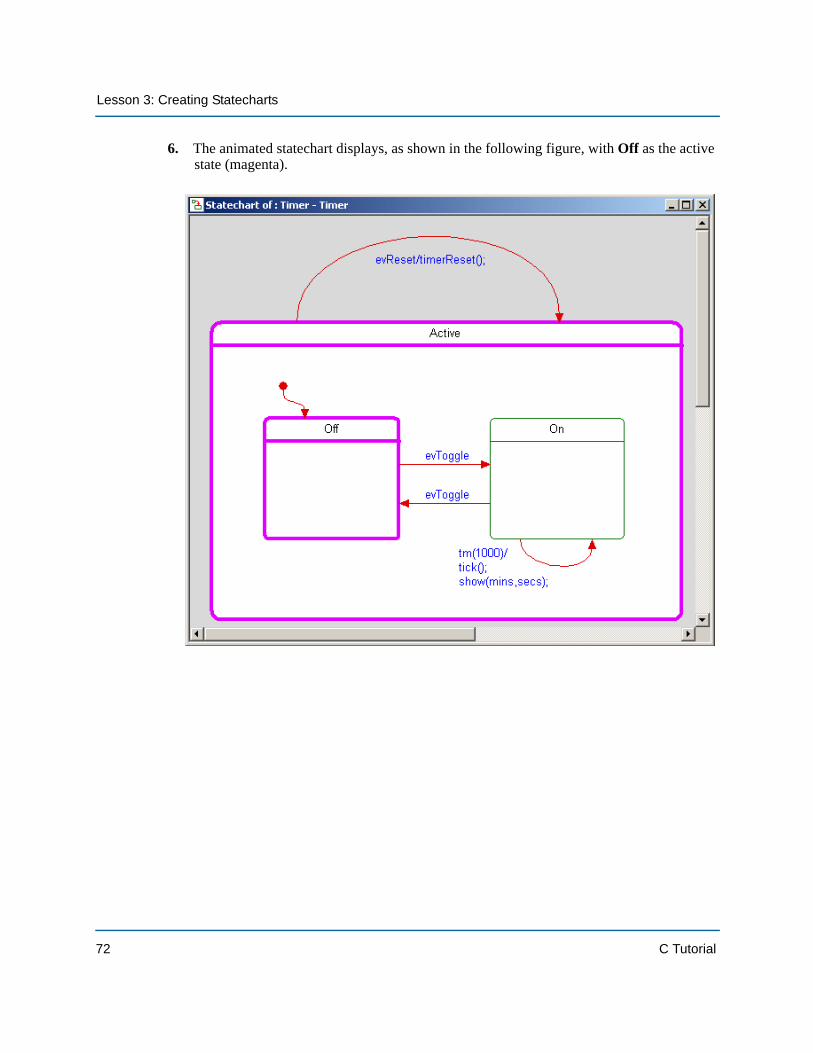
6. The animated statechart displays, as shown in the following figure, with Off as the active state (magenta).
72 C Tutorial
Exercise 2: Animating a Statechart
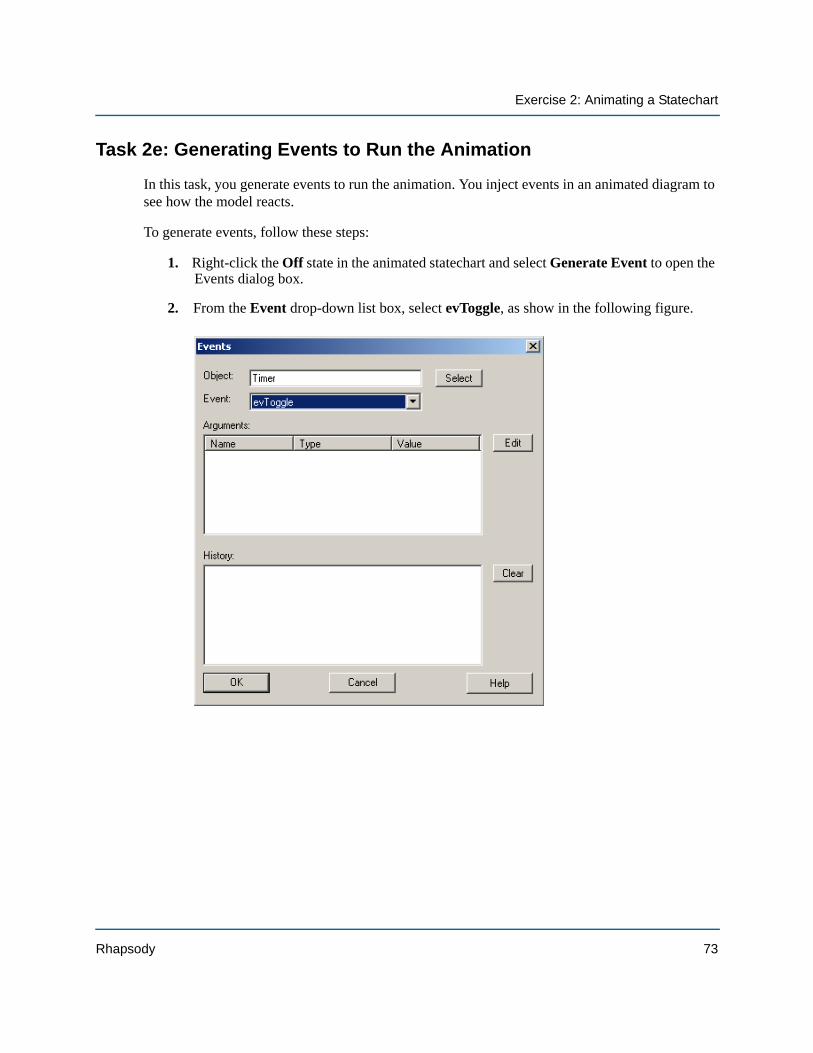
Task 2e: Generating Events to Run the Animation
In this task, you generate events to run the animation. You inject events in an animated diagram to see how the model reacts.
To generate events, follow these steps:
1. Right-click the Off state in the animated statechart and select Generate Event to open the Events dialog box.
2. From the Event drop-down list box, select evToggle, as show in the following figure.
Rhapsody 73
Lesson 3: Creating Statecharts
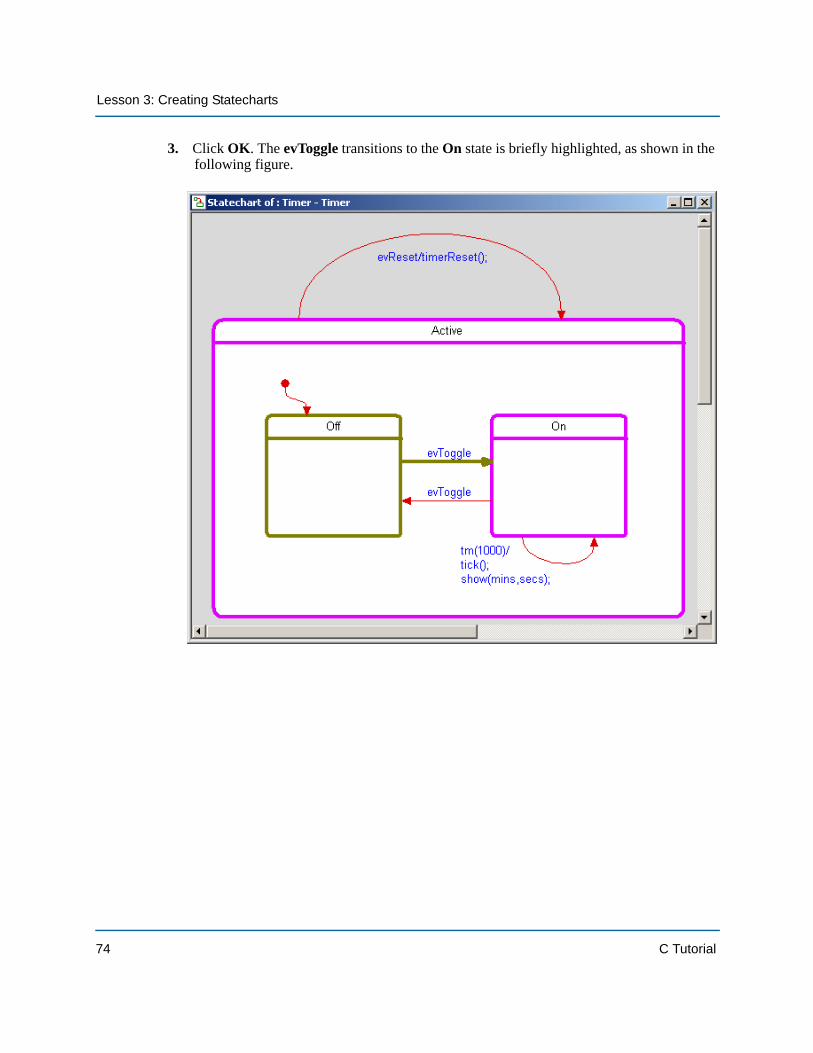
3. Click OK. The evToggle transitions to the On state is briefly highlighted, as shown in the following figure.
74 C Tutorial
Exercise 2: Animating a Statechart
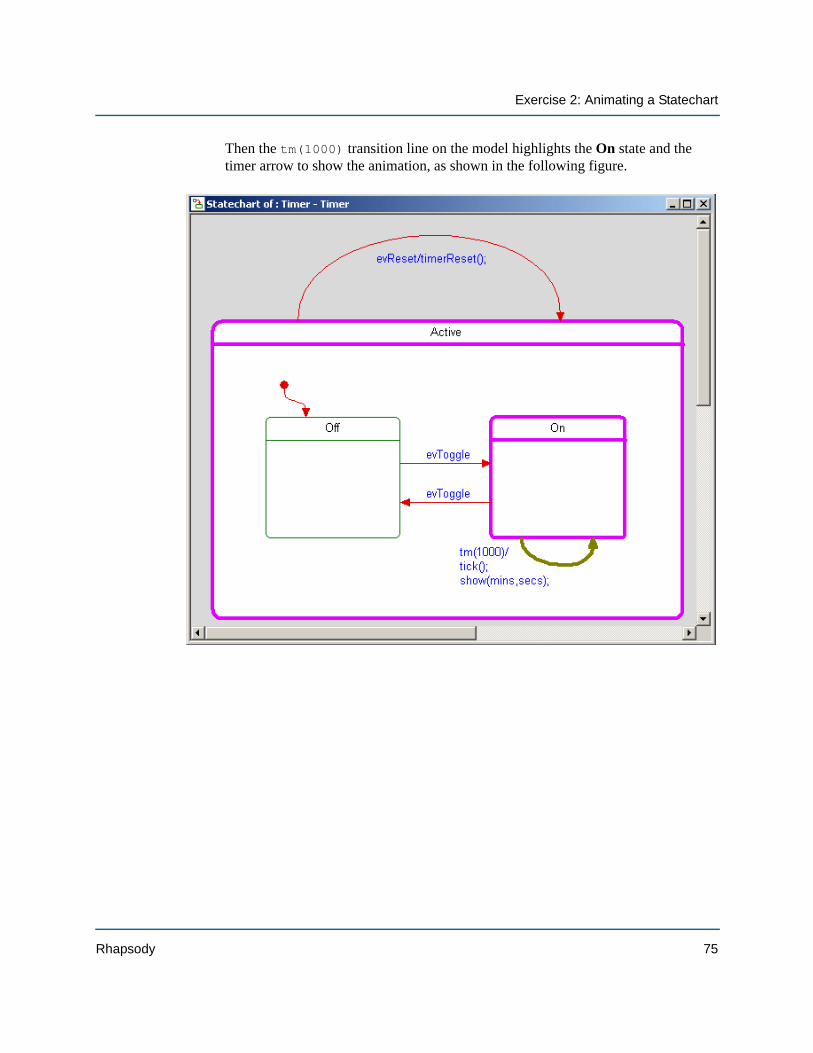
Then the tm(1000) transition line on the model highlights the On state and the timer arrow to show the animation, as shown in the following figure.
Rhapsody 75
Lesson 3: Creating Statecharts
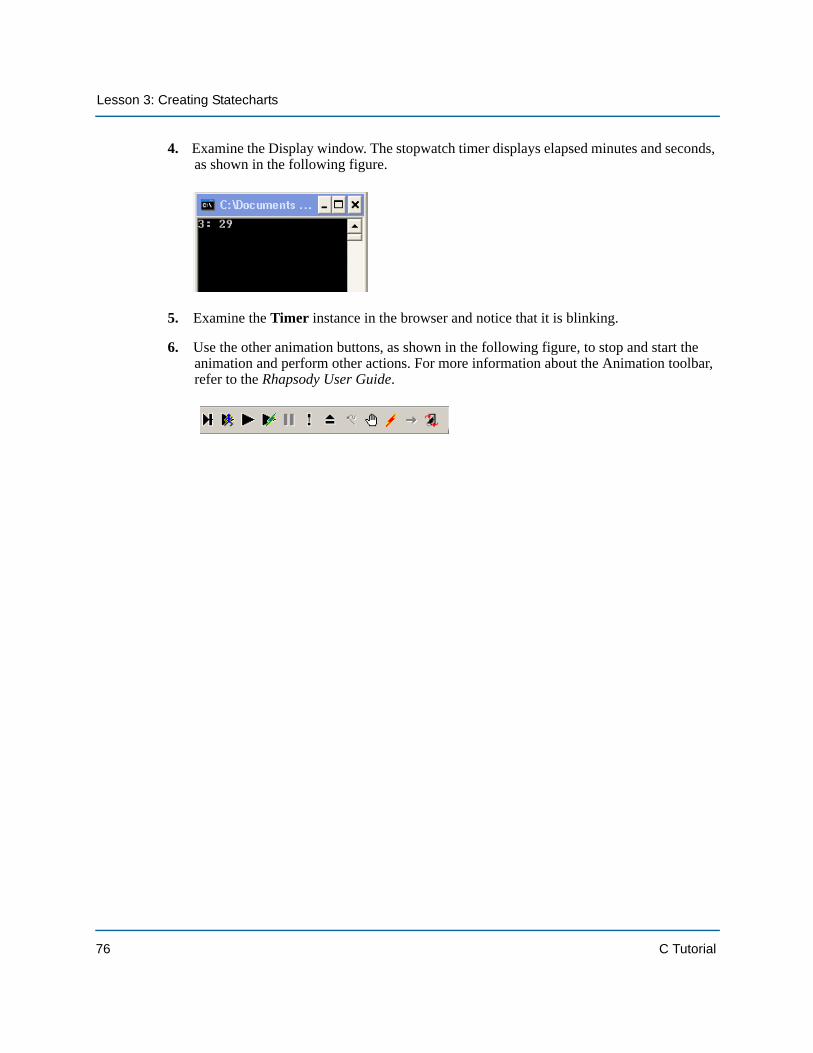
4. Examine the Display window. The stopwatch timer displays elapsed minutes and seconds, as shown in the following figure.
5. Examine the Timer instance in the browser and notice that it is blinking.
6. Use the other animation buttons, as shown in the following figure, to stop and start the animation and perform other actions. For more information about the Animation toolbar, refer to the Rhapsody User Guide.
76 C Tutorial
Exercise 2: Animating a Statechart
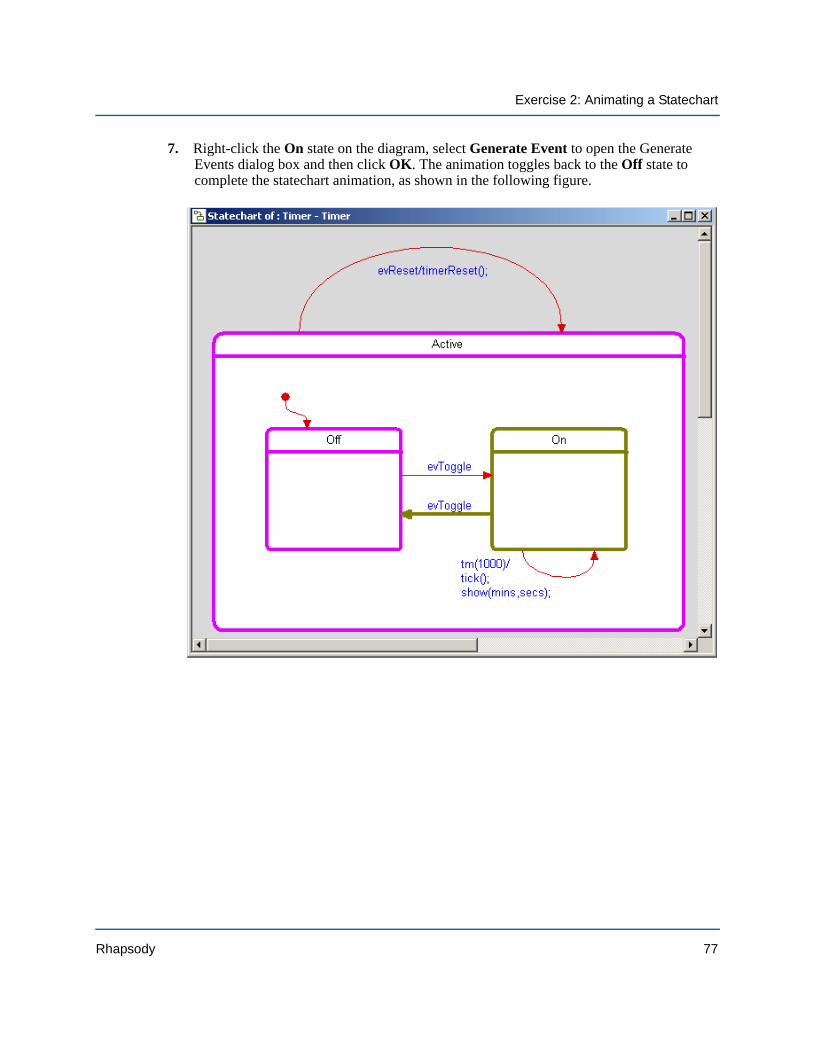
7. Right-click the On state on the diagram, select Generate Event to open the Generate Events dialog box and then click OK. The animation toggles back to the Off state to complete the statechart animation, as shown in the following figure.
Rhapsody 77
Lesson 3: Creating Statecharts
Task 2f: Quitting Animation
To end the animation session, follow these steps:
1. Click the Animation Break button on the Animation toolbar and then click the Quit
Animation button .
2. Click Yes to confirm ending the animation session.
3. Save your model.
The Display window closes, and the Animation tab on the Output window displays the message Animation session terminated.
Note
To animate the statechart again, on the Code toolbar, click the Run executable button and then, from the Animation toolbar, click the Go button to trigger the statechart animation.
SummaryIn this lesson, you created a statechart for the timer for the stopwatch model. You became familiar with the parts of a statechart and did the following:
Added transitions and timeout transitions Added the Rhapsody time Animated a statechart and saw it progress through states Created a timer instance Generated an event for a statechart
You are now ready to proceed to the next lesson, where you define the message exchange for the stopwatch model by using a message diagram.
78 C Tutorial

Lesson 4: Creating Message Diagrams
Message diagrams show how the files functionality may interact through messaging (through synchronous function calls or asynchronous communication). Message diagrams can be used at different levels of abstraction. At higher levels of abstractions, message diagrams show the interactions between actors, files, use cases, and objects. At lower levels of abstraction and for implementation, message diagrams show the communication between classes, files, and objects.
Message diagrams have an executable aspect and are a key animation tool. When you animate a model, Rhapsody dynamically builds message diagrams that record the object-to-object messaging.
Goals for this LessonIn this lesson, you create the Execution message diagram, which captures what happens when the stopwatch model runs.
For the stopwatch model, only one message diagram is needed. You may have more than one message diagram for the models you create, depending on their complexity and need.
Rhapsody 79
Lesson 4: Creating Message Diagrams
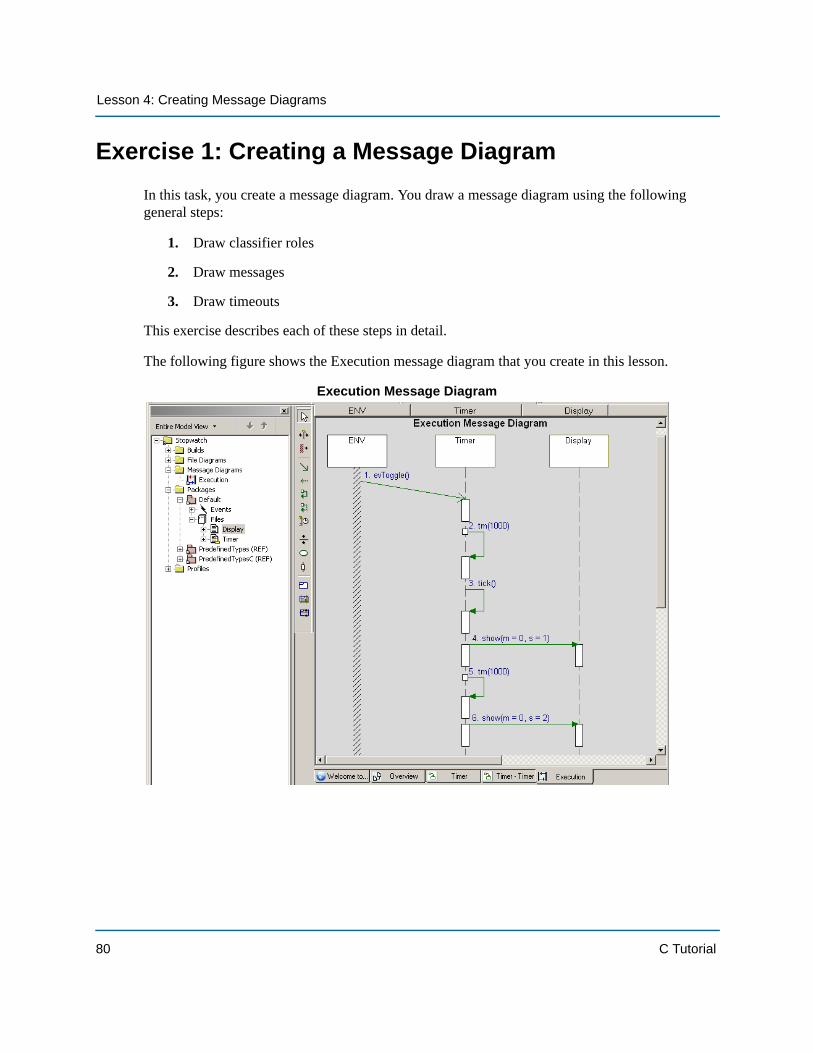
Exercise 1: Creating a Message DiagramIn this task, you create a message diagram. You draw a message diagram using the following general steps:
1. Draw classifier roles
2. Draw messages
3. Draw timeouts
This exercise describes each of these steps in detail.
The following figure shows the Execution message diagram that you create in this lesson.
Execution Message Diagram
80 C Tutorial
Exercise 1: Creating a Message Diagram
Task 1a: Creating a Message Diagram
In this task, you create a message diagram. The model needs a message diagram to capture what happens when the stopwatch model runs.
To create a message diagram, follow these steps:
1. Start Rhapsody and open the stopwatch model if they are not already open.
2. In the Rhapsody browser, right-click Stopwatch and select Add New > Message Diagram to open the New Diagram dialog box.
Note: If Message Diagram is not enabled on the pop-up menu, you can choose File > Message Diagram and click the New button on the dialog box that opens.
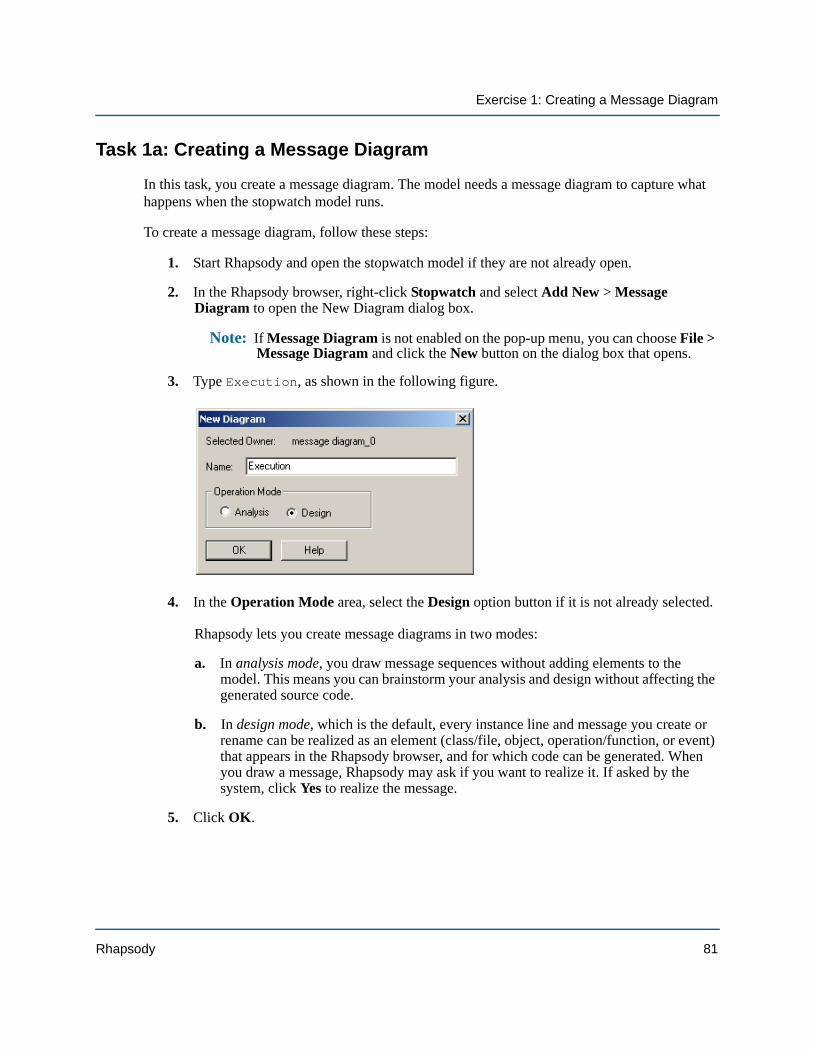
3. Type Execution, as shown in the following figure.
4. In the Operation Mode area, select the Design option button if it is not already selected. Rhapsody lets you create message diagrams in two modes:
a. In analysis mode, you draw message sequences without adding elements to the model. This means you can brainstorm your analysis and design without affecting the generated source code.
b. In design mode, which is the default, every instance line and message you create or rename can be realized as an element (class/file, object, operation/function, or event) that appears in the Rhapsody browser, and for which code can be generated. When you draw a message, Rhapsody may ask if you want to realize it. If asked by the system, click Yes to realize the message.
5. Click OK.
Rhapsody 81
Lesson 4: Creating Message Diagrams
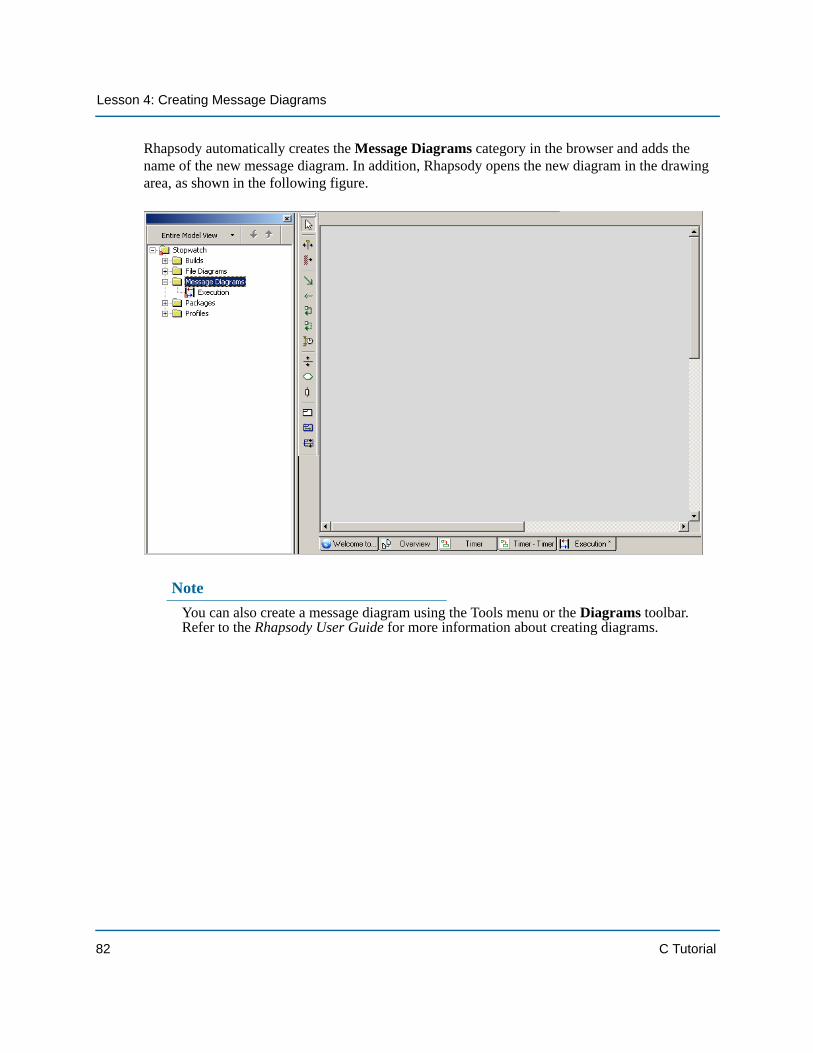
Rhapsody automatically creates the Message Diagrams category in the browser and adds the name of the new message diagram. In addition, Rhapsody opens the new diagram in the drawing area, as shown in the following figure.
NoteYou can also create a message diagram using the Tools menu or the Diagrams toolbar. Refer to the Rhapsody User Guide for more information about creating diagrams.
82 C Tutorial
Exercise 1: Creating a Message Diagram
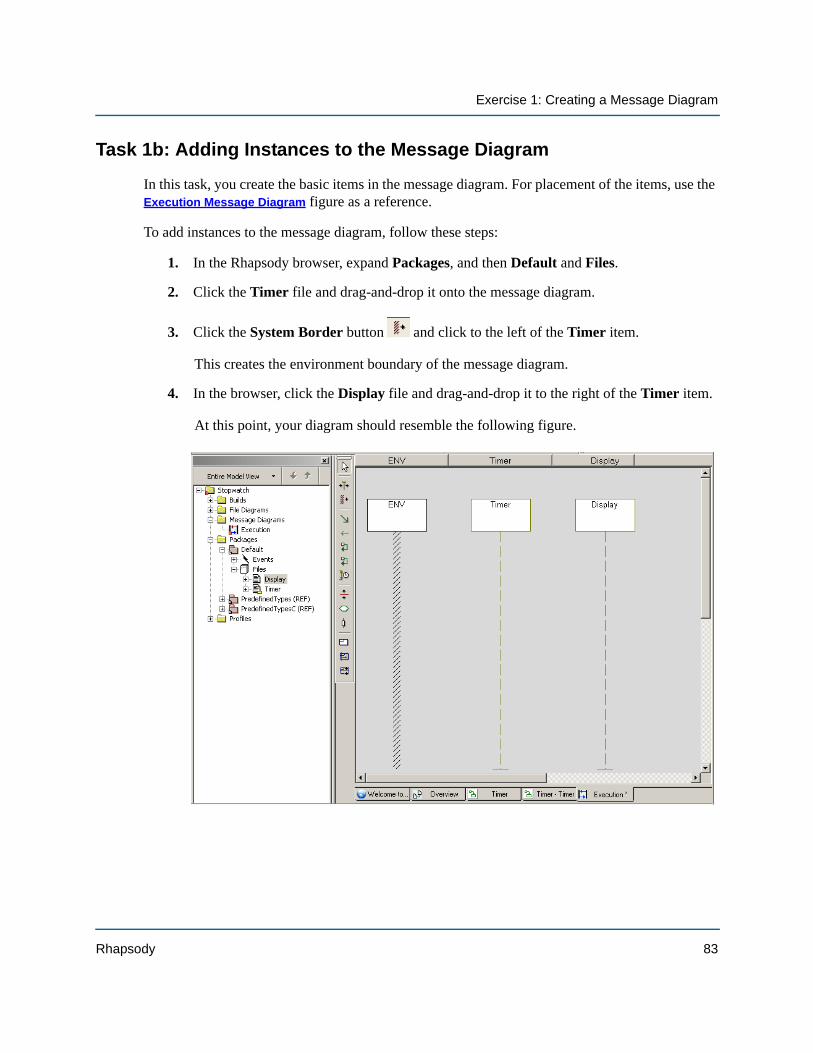
Task 1b: Adding Instances to the Message Diagram
In this task, you create the basic items in the message diagram. For placement of the items, use the Execution Message Diagram figure as a reference.
To add instances to the message diagram, follow these steps:
1. In the Rhapsody browser, expand Packages, and then Default and Files.
2. Click the Timer file and drag-and-drop it onto the message diagram.
3. Click the System Border button and click to the left of the Timer item. This creates the environment boundary of the message diagram.
4. In the browser, click the Display file and drag-and-drop it to the right of the Timer item. At this point, your diagram should resemble the following figure.
Rhapsody 83
Lesson 4: Creating Message Diagrams
Task 1c: Drawing Messages to Define the Stopwatch Communication
To show the model’s scenario, a message diagram defines the communication between parts of the model. To show these messages, you draw communication lines.
A message represents an interaction between objects/files, or between an object/a file and the environment. A message can be an event, a triggered operation, or a primitive operation. Depending on the shape of the line, Rhapsody interprets the message as follows:
If the message line is horizontal, the message is interpreted as a triggered operation if the target is a reactive class, or a primitive operation if the target is a nonreactive class. A message line that is horizontal indicates that the operations are synchronous.
If the message line is slanted, the message is interpreted as an event if the target is a reactive class, or as a primitive operation if the target is a nonreactive class. A message line that is slanted emphasizes that time passes between the sending and receiving of messages. Message lines that are slanted can cross each other.
If the message line returns to itself, the message is interpreted as a primitive operation if the arrow folds back to a nonreactive class or if the arrow folds back immediately; or it is interpreted as an event if the arrow folds back sometime later. The arrow can be on either side of the instance line.
NoteReactive classes can receive events, triggered operations, and primitive operations. Non-reactive classes can receive only messages that are calls to primitive operations.
To draw messages, follow these steps:
1. Click the Message button on the Drawing toolbar.
2. Click the ENV system boundary line and click the Timer to create a downward-slanted diagonal line. Rhapsody creates a message with a default value name of # function_n(), where n is an incremental integer starting with 0.
3. Rename the message evToggle() and then press Enter.
4. Click the Timeout button and draw a timeout on the Timer line that goes back to itself and which is below the evToggle() message line, then type tm(1000), and then press Enter.
84 C Tutorial
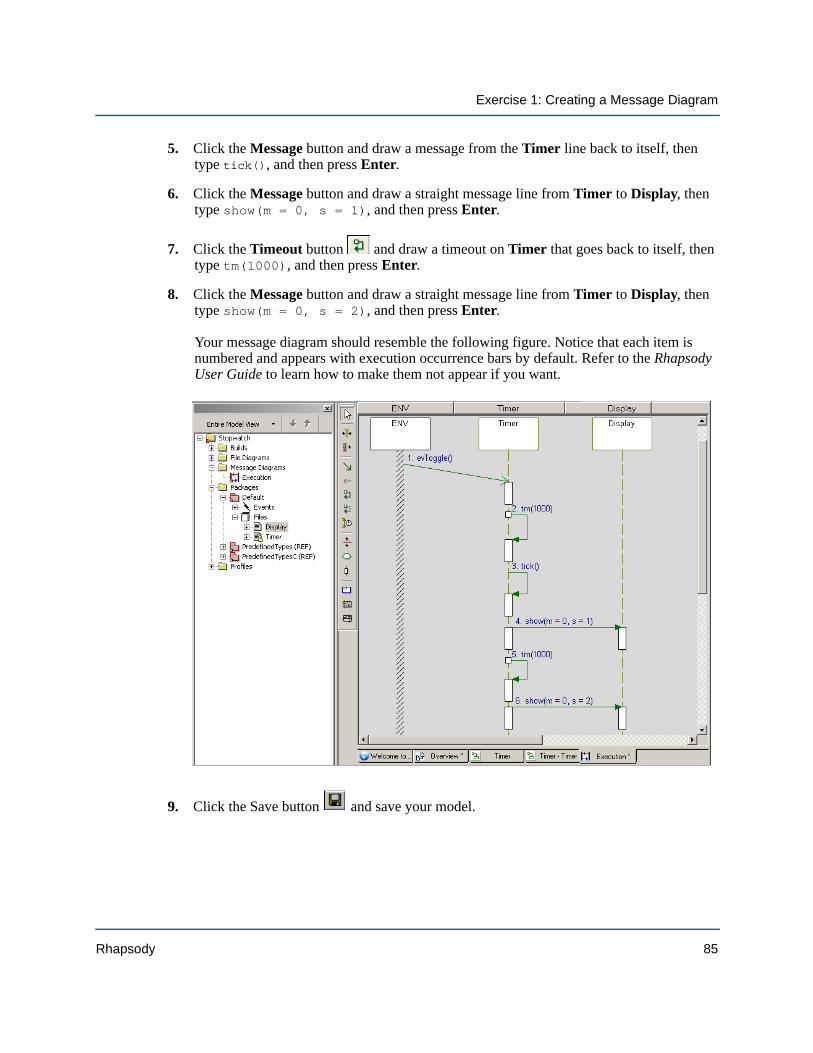
Exercise 1: Creating a Message Diagram
5. Click the Message button and draw a message from the Timer line back to itself, then type tick(), and then press Enter.
6. Click the Message button and draw a straight message line from Timer to Display, then type show(m = 0, s = 1), and then press Enter.
7. Click the Timeout button and draw a timeout on Timer that goes back to itself, then type tm(1000), and then press Enter.
8. Click the Message button and draw a straight message line from Timer to Display, then type show(m = 0, s = 2), and then press Enter. Your message diagram should resemble the following figure. Notice that each item is numbered and appears with execution occurrence bars by default. Refer to the Rhapsody User Guide to learn how to make them not appear if you want.
9. Click the Save button and save your model.
Rhapsody 85
Lesson 4: Creating Message Diagrams
Task 1d: Adding a Diagram Title
Each diagram has its name in the diagram table and in the title bar of the window that displays the diagram. However, it is also useful to add a title to a diagram to help other members of your team understand the content and purpose of a diagram.
To add an optional title to your message diagram, follow these steps:
1. With the diagram displayed in the drawing area, click the Text button .
2. Click above the items in the diagram and type Execution Message Diagram.
3. Make the following changes if you want:
a. Reposition the title by dragging it into a new location.
b. Change the font styles.
4. Save your work.
You have completed drawing the Execution SD. It should resemble the Execution Message Diagram figure.
SummaryIn this lesson, you created the Execution message diagram, which captures what happens when the stopwatch model runs. You became familiar with the parts of a message diagram and created the following:
System border Classifier roles Messages Time intervals Timeouts
You are now ready to proceed to the next lesson, where you are going to generate code.
86 C Tutorial
Lesson 5: Generating Code and More
Rhapsody uses the following sources to generate code for the model:
Project Type or profile selected when you created the project. Refer to Creating a Project. Component definition described in the Task 2a: Defining a Test Component and
Configuration. Compiler and instrumentation mode selections made when defining the configuration. Code you entered for functions, as in the Task 1f: Adding a Function and Arguments for
Display. Flow charts as described in Lesson 2: Creating Flow Charts. C code that Rhapsody automatically generates to support the design you created in the
diagrams.You must generate or regenerate code before you can run animation.
Goals for this LessonIn this lesson, you learn about the following:
Generating code Viewing code Locating code Manually adding code
Rhapsody 87
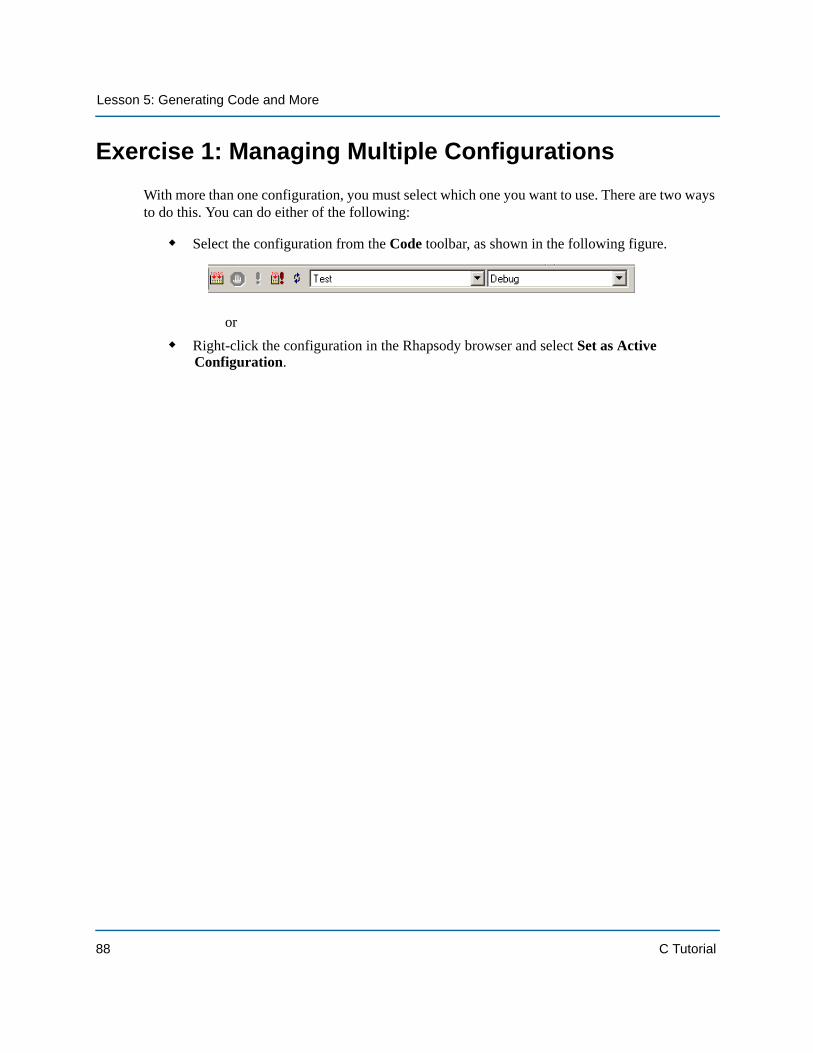
Lesson 5: Generating Code and More
Exercise 1: Managing Multiple ConfigurationsWith more than one configuration, you must select which one you want to use. There are two ways to do this. You can do either of the following:
Select the configuration from the Code toolbar, as shown in the following figure.
or Right-click the configuration in the Rhapsody browser and select Set as Active
Configuration.
88 C Tutorial
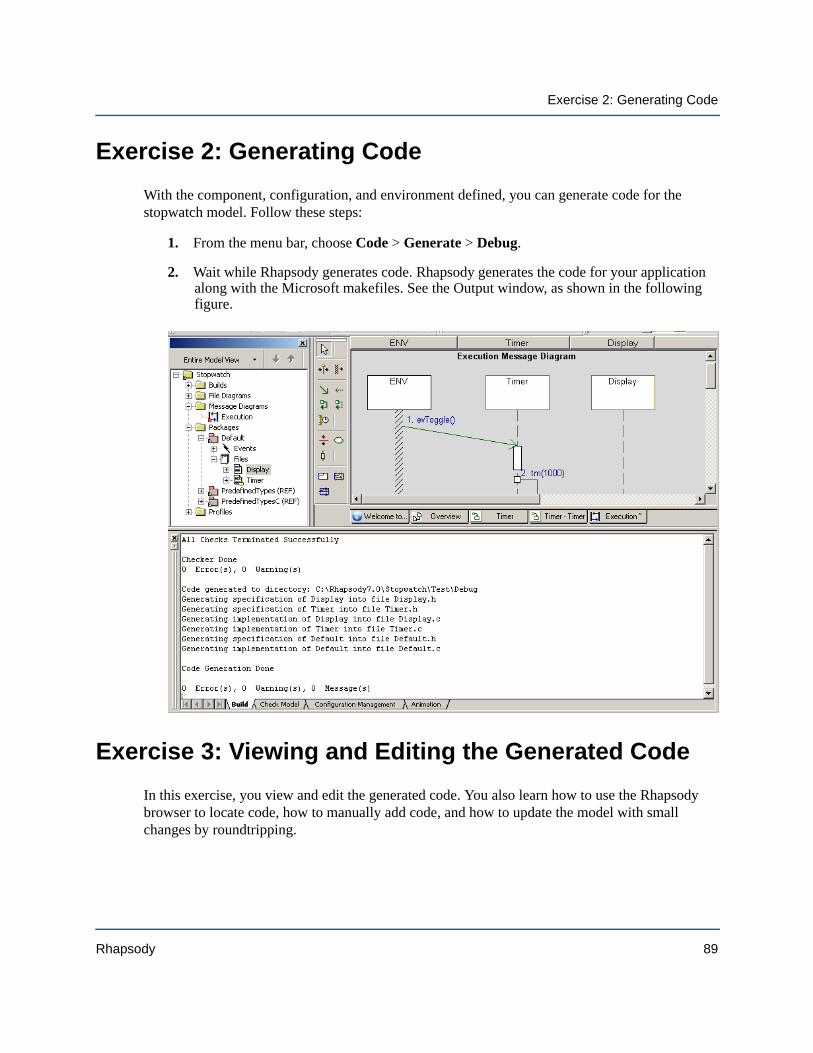
Exercise 2: Generating Code
Exercise 2: Generating CodeWith the component, configuration, and environment defined, you can generate code for the stopwatch model. Follow these steps:
1. From the menu bar, choose Code > Generate > Debug.
2. Wait while Rhapsody generates code. Rhapsody generates the code for your application along with the Microsoft makefiles. See the Output window, as shown in the following figure.
Exercise 3: Viewing and Editing the Generated CodeIn this exercise, you view and edit the generated code. You also learn how to use the Rhapsody browser to locate code, how to manually add code, and how to update the model with small changes by roundtripping.
Rhapsody 89
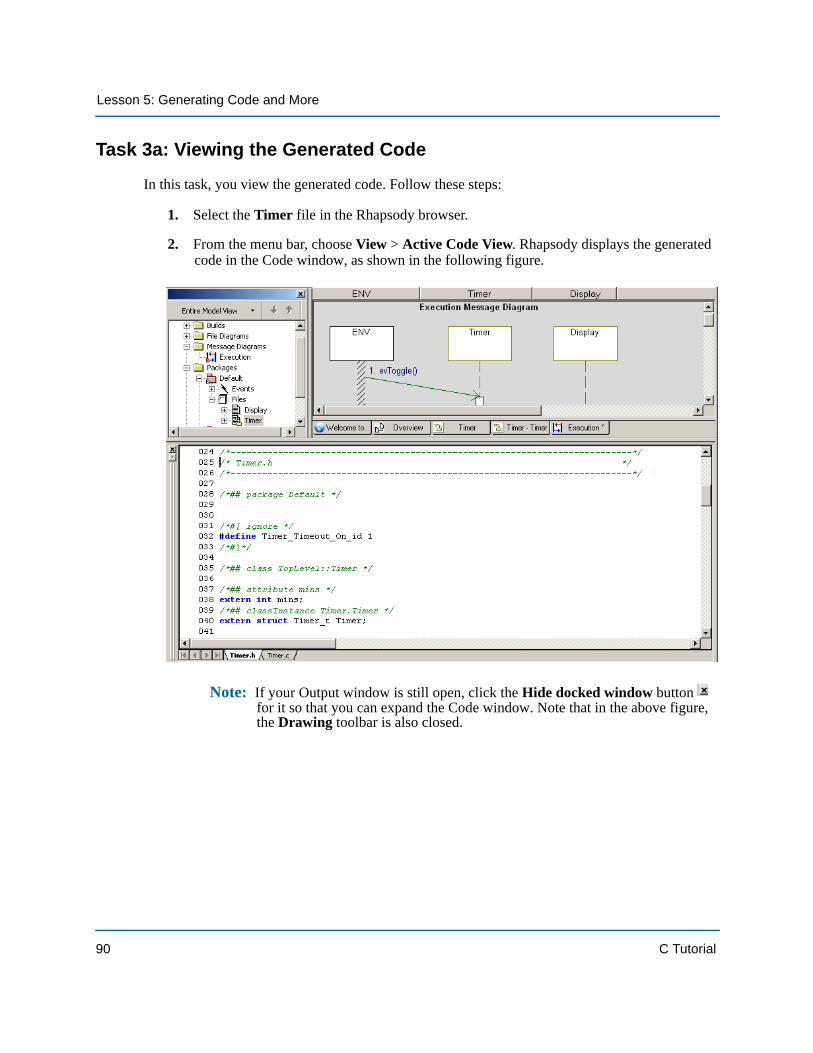
Lesson 5: Generating Code and More
Task 3a: Viewing the Generated Code
In this task, you view the generated code. Follow these steps:
1. Select the Timer file in the Rhapsody browser.
2. From the menu bar, choose View > Active Code View. Rhapsody displays the generated code in the Code window, as shown in the following figure.
Note: If your Output window is still open, click the Hide docked window button for it so that you can expand the Code window. Note that in the above figure, the Drawing toolbar is also closed.
90 C Tutorial
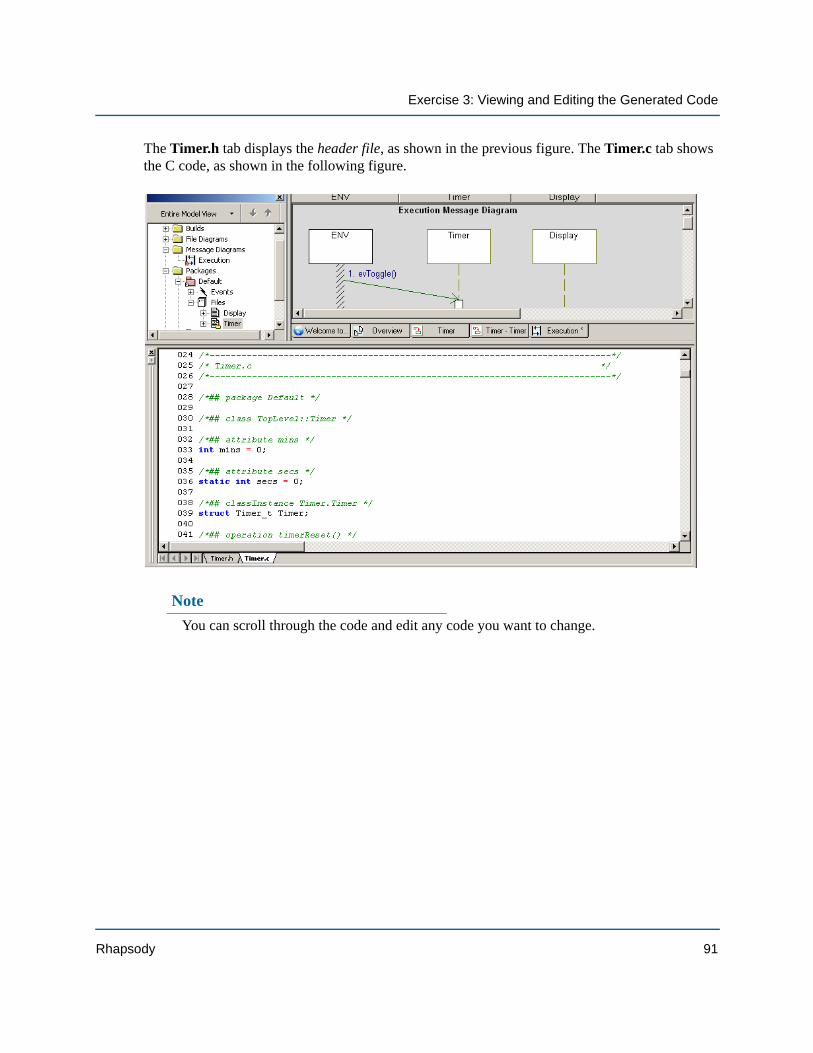
Exercise 3: Viewing and Editing the Generated Code
The Timer.h tab displays the header file, as shown in the previous figure. The Timer.c tab shows the C code, as shown in the following figure.
NoteYou can scroll through the code and edit any code you want to change.
Rhapsody 91
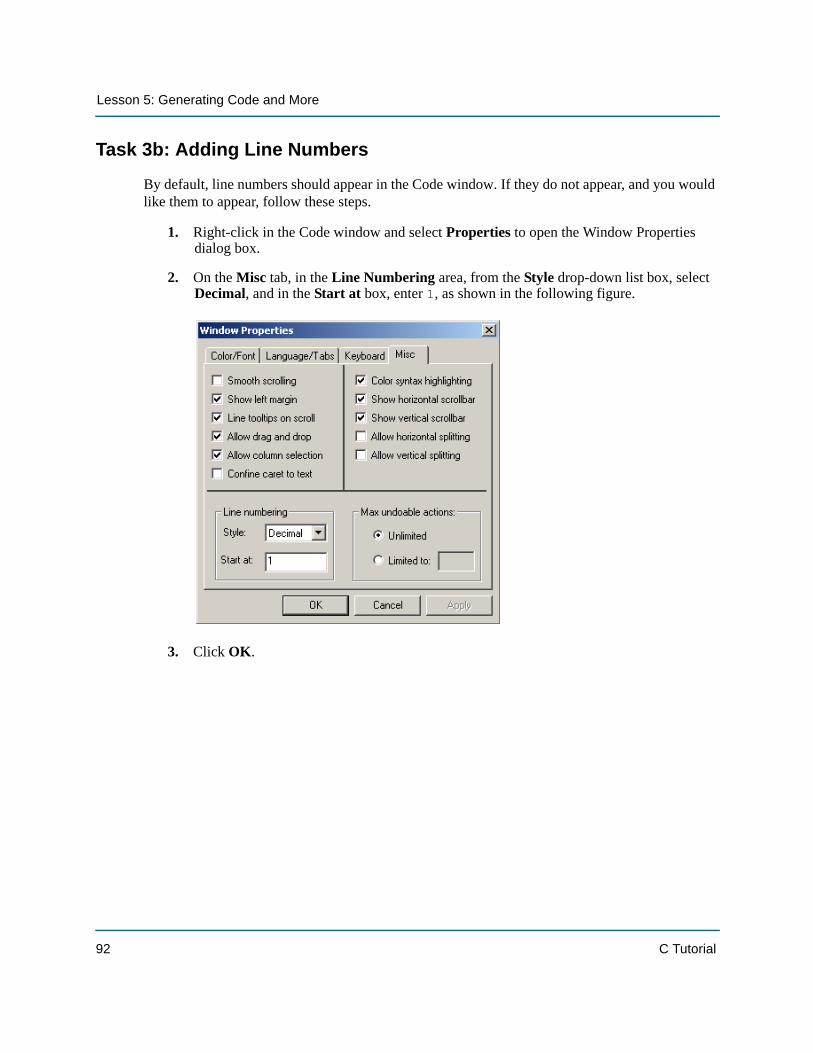
Lesson 5: Generating Code and More
Task 3b: Adding Line Numbers
By default, line numbers should appear in the Code window. If they do not appear, and you would like them to appear, follow these steps.
1. Right-click in the Code window and select Properties to open the Window Properties dialog box.
2. On the Misc tab, in the Line Numbering area, from the Style drop-down list box, select Decimal, and in the Start at box, enter 1, as shown in the following figure.
3. Click OK.
92 C Tutorial
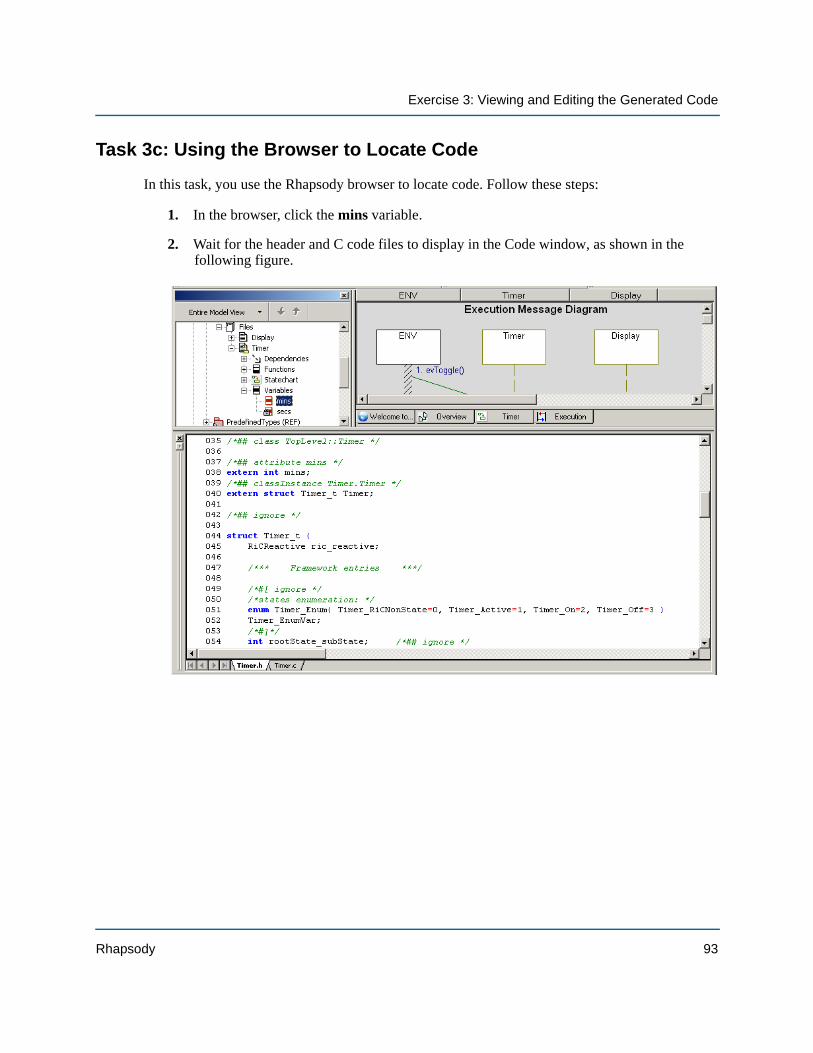
Exercise 3: Viewing and Editing the Generated Code
Task 3c: Using the Browser to Locate Code
In this task, you use the Rhapsody browser to locate code. Follow these steps:
1. In the browser, click the mins variable.
2. Wait for the header and C code files to display in the Code window, as shown in the following figure.
Rhapsody 93
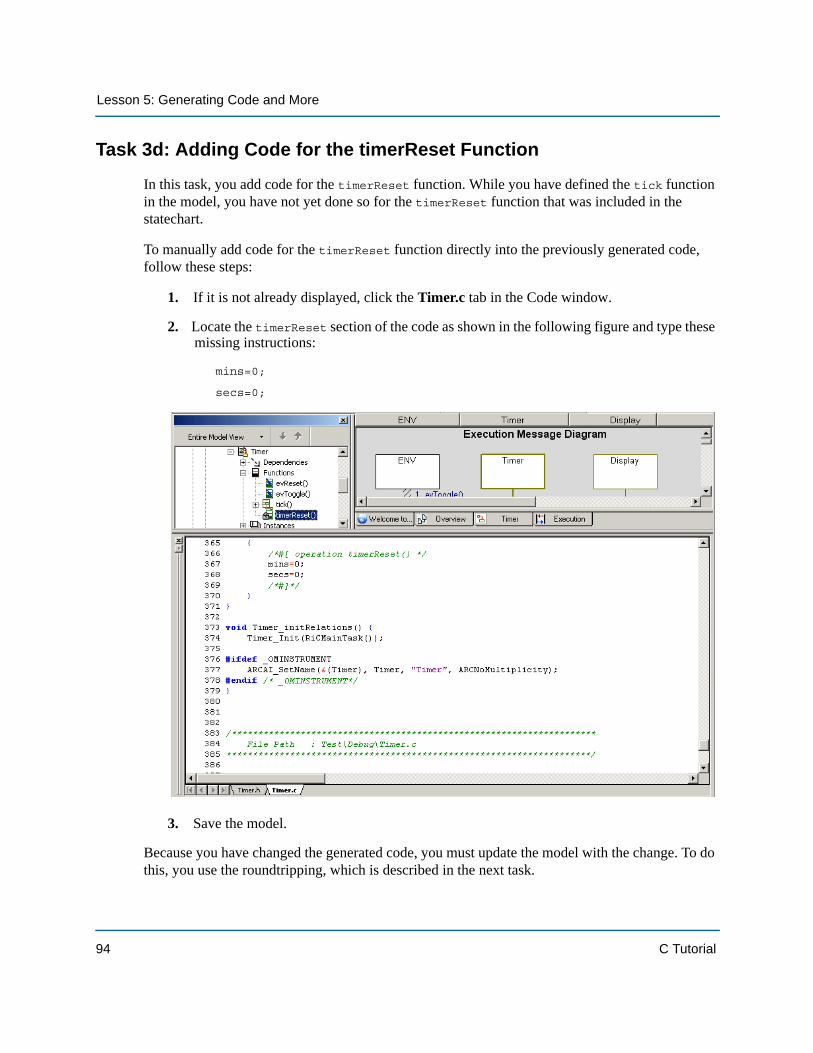
Lesson 5: Generating Code and More
Task 3d: Adding Code for the timerReset Function
In this task, you add code for the timerReset function. While you have defined the tick function in the model, you have not yet done so for the timerReset function that was included in the statechart.
To manually add code for the timerReset function directly into the previously generated code, follow these steps:
1. If it is not already displayed, click the Timer.c tab in the Code window.
2. Locate the timerReset section of the code as shown in the following figure and type these missing instructions:
mins=0;
secs=0;
3. Save the model.
Because you have changed the generated code, you must update the model with the change. To do this, you use the roundtripping, which is described in the next task.
94 C Tutorial
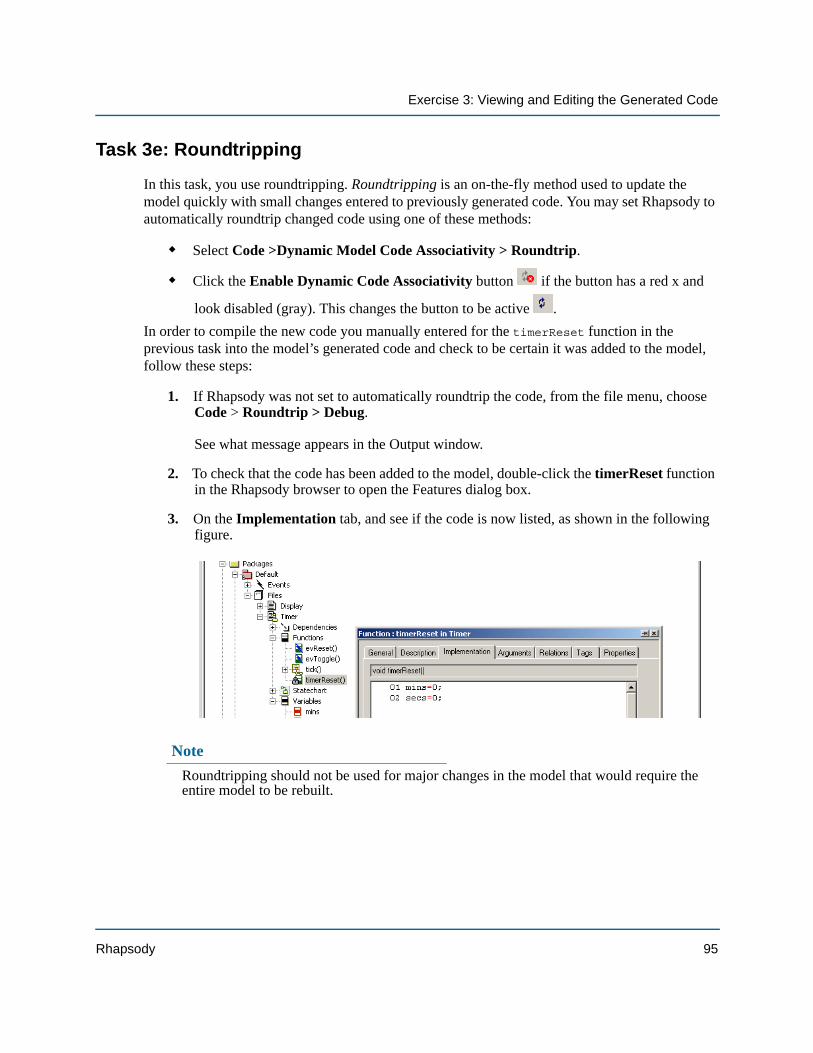
Exercise 3: Viewing and Editing the Generated Code
Task 3e: Roundtripping
In this task, you use roundtripping. Roundtripping is an on-the-fly method used to update the model quickly with small changes entered to previously generated code. You may set Rhapsody to automatically roundtrip changed code using one of these methods:
Select Code >Dynamic Model Code Associativity > Roundtrip.
Click the Enable Dynamic Code Associativity button if the button has a red x and
look disabled (gray). This changes the button to be active .In order to compile the new code you manually entered for the timerReset function in the previous task into the model’s generated code and check to be certain it was added to the model, follow these steps:
1. If Rhapsody was not set to automatically roundtrip the code, from the file menu, choose Code > Roundtrip > Debug. See what message appears in the Output window.
2. To check that the code has been added to the model, double-click the timerReset function in the Rhapsody browser to open the Features dialog box.
3. On the Implementation tab, and see if the code is now listed, as shown in the following figure.
NoteRoundtripping should not be used for major changes in the model that would require the entire model to be rebuilt.
Rhapsody 95
Lesson 5: Generating Code and More
SummaryIn this lesson, you generated code. You became familiar with the following:
Managing multiple configurations Generating, viewing, locating, editing, and manually adding code Roundtripping
You have completed creating the stopwatch model. You are now ready to proceed to the next lesson, where you animate the message diagram and compare message diagrams.
96 C Tutorial
Lesson 6: Animating and Comparing Message Diagrams
Animation executes the behaviors and associated definitions in the model. Rhapsody animates the model using the code generated with instrumentation for the components to simulate the behaviors. After animating a diagram, you can open the animated versions of the diagrams to observe the model as it is running. This facilitates design-level debugging and troubleshooting. Using the animation approach, you can step through the model, set and clear breakpoints, inject events, and generate an output trace.
It is good practice to test the model incrementally using model execution. You can animate pieces of the model as it is developed. This gives you the opportunity to determine whether the model meets the requirements and find defects early on. Then you can test the entire model. In this way, you iteratively build the model, and then with each iteration perform an entire model validation.
Goals for this LessonPreviously you animated the Timer statechart. In this lesson, you animate the message diagram for the stopwatch model by:
Preparing for animation Animating the message diagram Viewing the animated message diagram Comparing the non-animated and animated message diagrams
Rhapsody 97
Lesson 6: Animating and Comparing Message Diagrams
Exercise 1: Animating Message DiagramsMessage diagrams are a key animation tool. When animating a model, Rhapsody dynamically builds message diagrams to record the block-to-block messaging.
Task 1a: Running the Executable
To be certain that all of the previous changes are incorporated in the model, it is a good practice to generate the model again. Follow these steps:
1. Click the Run Executable button . The following happens:
The Display window opens. Do not close the Display window, though you may want to minimize, resize, and/or move the it so that you have a better view of the message diagram.
A copy of the message diagram (without the message lines) displays on an Animated Execution tab on the Drawing area.
The Call Stack, Event Queue, and Output (with the Animation tab active) windows open. The Call Stack and Event Queue windows provide supporting information to help you understand what is happening in the animated views.
Note: If these windows are not displayed, from the menu bar, choose View > Call Stack, View > Event Queue, and/or View > Output Window. The windows are dockable, so you can move them out of the Rhapsody GUI to increase the viewable area for animations. To move a window, click-and-drag it to another location.
98 C Tutorial
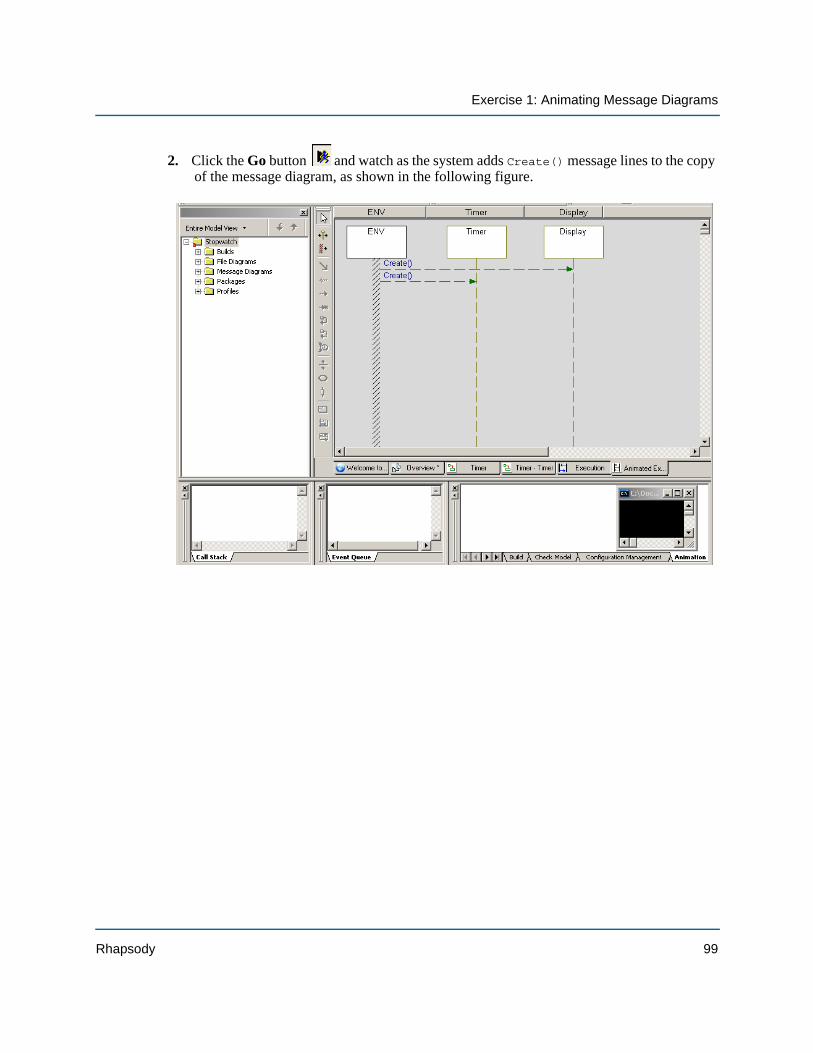
Exercise 1: Animating Message Diagrams
2. Click the Go button and watch as the system adds Create() message lines to the copy of the message diagram, as shown in the following figure.
Rhapsody 99
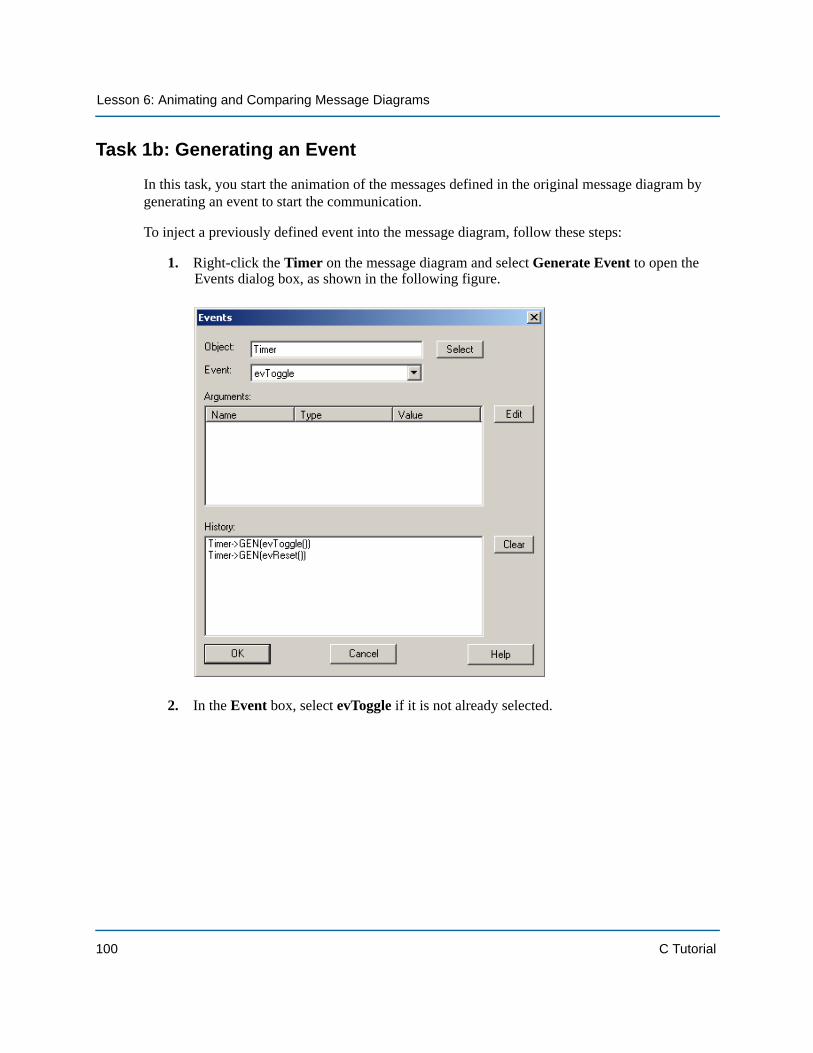
Lesson 6: Animating and Comparing Message Diagrams
Task 1b: Generating an Event
In this task, you start the animation of the messages defined in the original message diagram by generating an event to start the communication.
To inject a previously defined event into the message diagram, follow these steps:
1. Right-click the Timer on the message diagram and select Generate Event to open the Events dialog box, as shown in the following figure.
2. In the Event box, select evToggle if it is not already selected.
100 C Tutorial
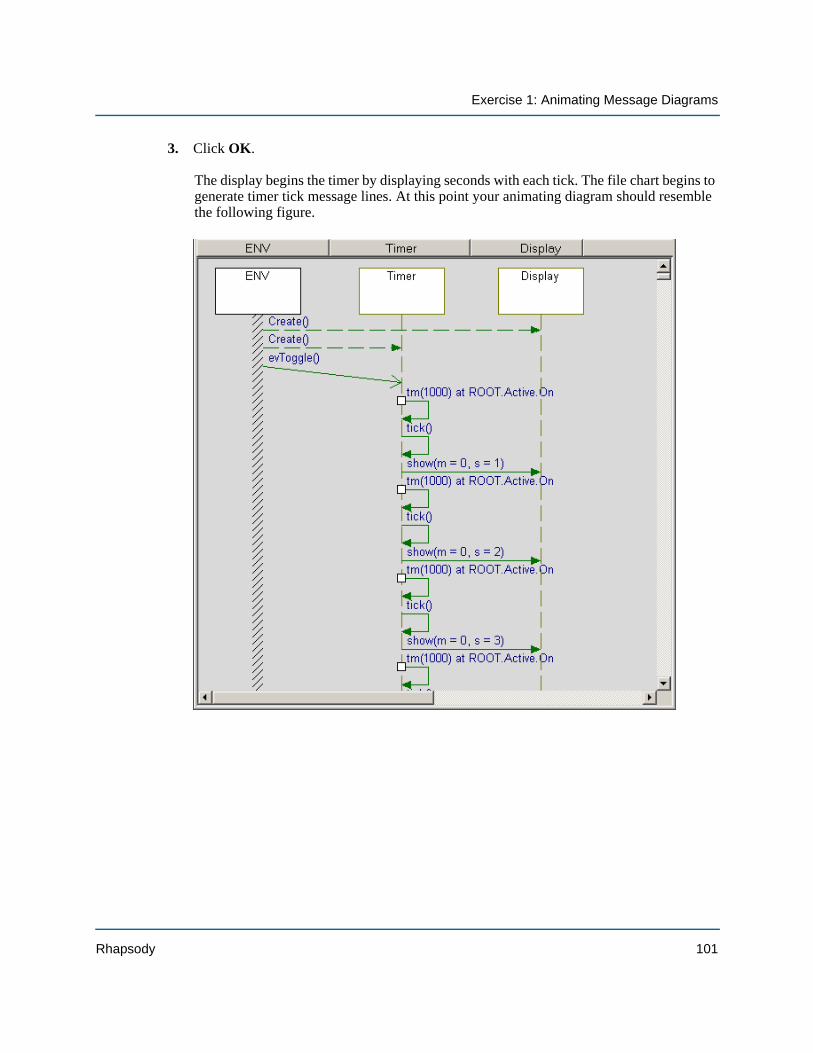
Exercise 1: Animating Message Diagrams
3. Click OK. The display begins the timer by displaying seconds with each tick. The file chart begins to generate timer tick message lines. At this point your animating diagram should resemble the following figure.
Rhapsody 101
Lesson 6: Animating and Comparing Message Diagrams
Task 1c: Pausing Animation
You can pause the animation and restart it.
Click the Pause button to pause the animation.
Click the Go button to restart animation.
Task 1d: Stopping Animation
To stop the animation when you are done with observing the animated messages, follow these steps:
1. Click the Pause button to pause the animation.
2. Click the Quit Animation button . The system asks if you want to exit the animation session.
3. Click Yes. Notice that in the Output window, the Animation session terminated message appears.
102 C Tutorial
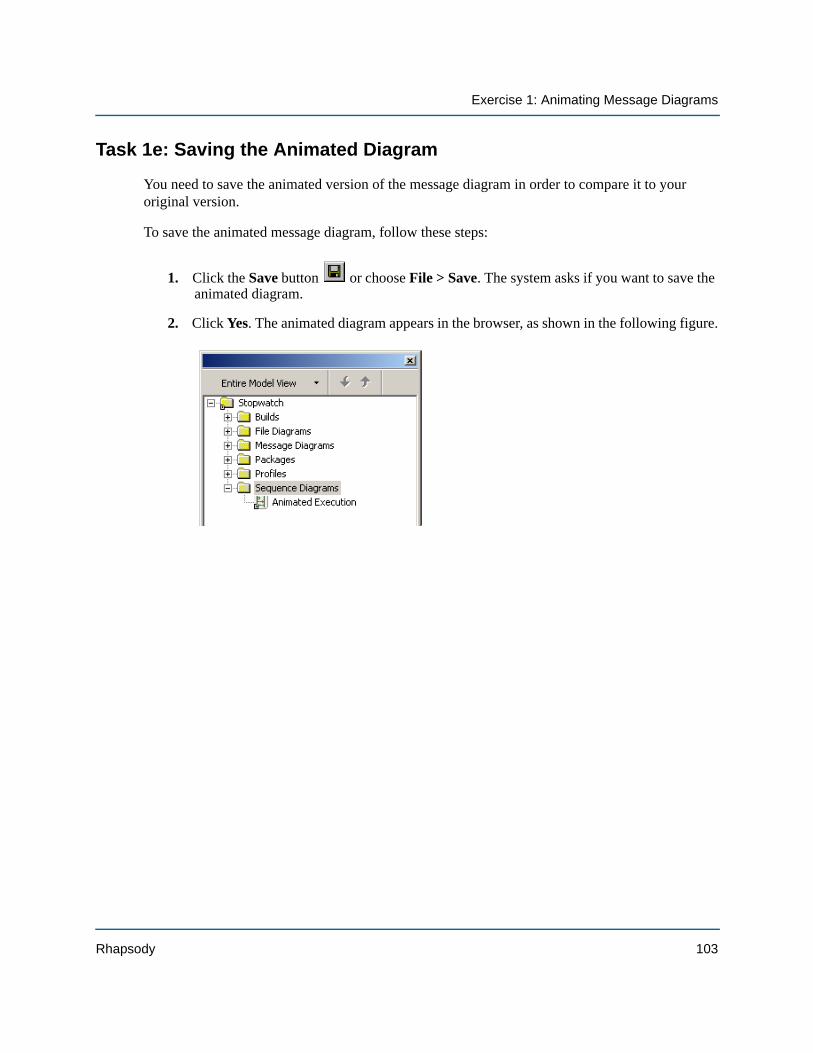
Exercise 1: Animating Message Diagrams
Task 1e: Saving the Animated Diagram
You need to save the animated version of the message diagram in order to compare it to your original version.
To save the animated message diagram, follow these steps:
1. Click the Save button or choose File > Save. The system asks if you want to save the animated diagram.
2. Click Yes. The animated diagram appears in the browser, as shown in the following figure.
Rhapsody 103
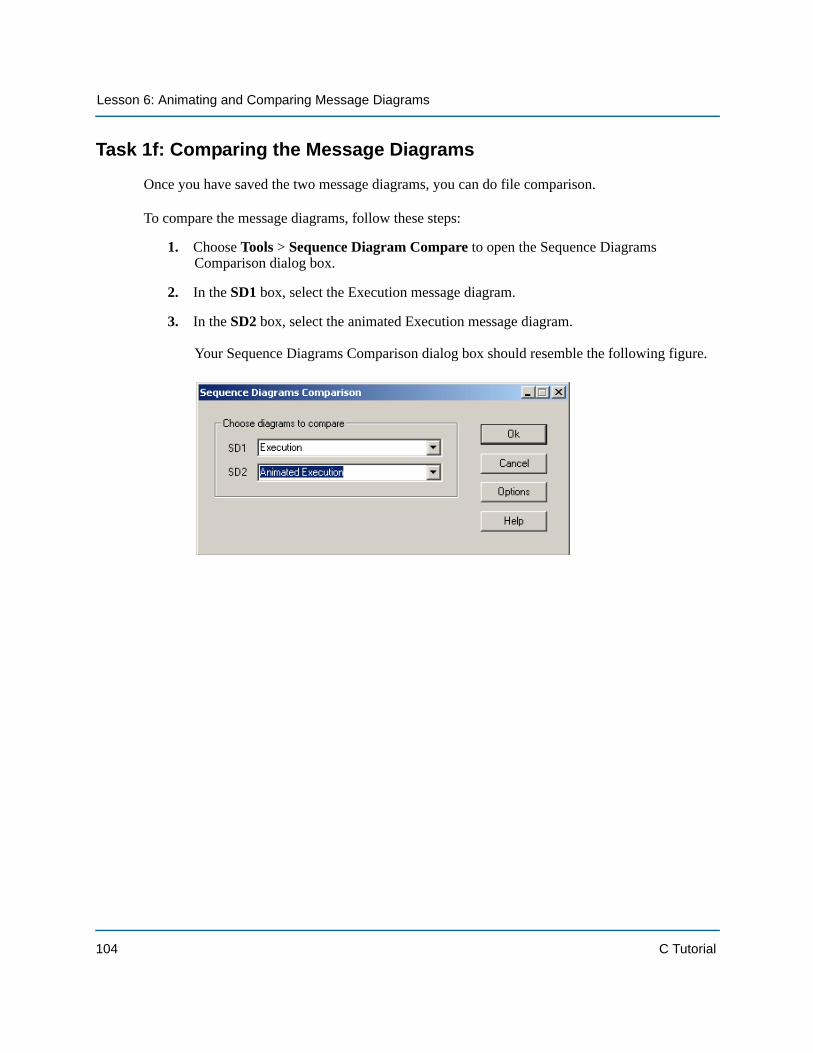
Lesson 6: Animating and Comparing Message Diagrams
Task 1f: Comparing the Message Diagrams
Once you have saved the two message diagrams, you can do file comparison.
To compare the message diagrams, follow these steps:
1. Choose Tools > Sequence Diagram Compare to open the Sequence Diagrams Comparison dialog box.
2. In the SD1 box, select the Execution message diagram.
3. In the SD2 box, select the animated Execution message diagram. Your Sequence Diagrams Comparison dialog box should resemble the following figure.
.
104 C Tutorial
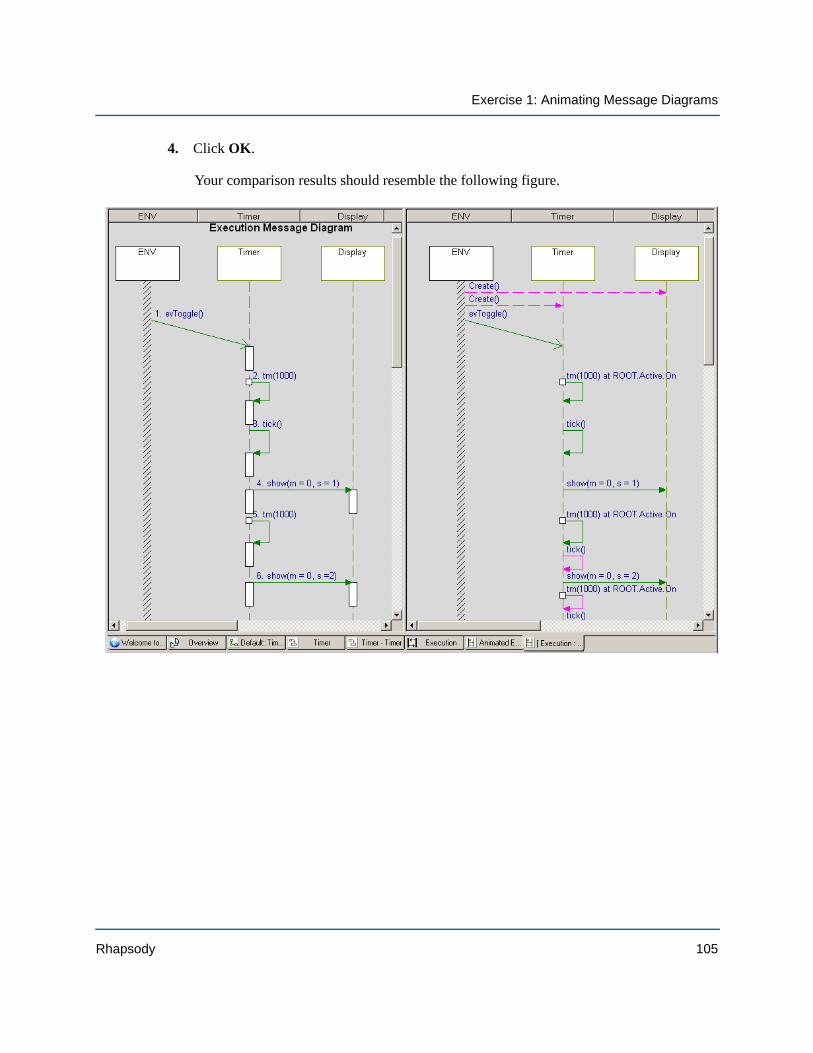
Exercise 1: Animating Message Diagrams
4. Click OK. Your comparison results should resemble the following figure.
Rhapsody 105
Lesson 6: Animating and Comparing Message Diagrams
Task 1g: Examining the Comparison Results
The displayed messages are color-coded on the comparison results to easily show the differences.
Green means the message matches in both message diagrams. Pink means the message is missing in the other message diagram.
Notice that the animation added the Create() messages as expected. However, it also added a tick() after the second timer that was missing from the original. Then it generated the expected timer results.
To correct the problem found in this comparison, open the original file diagram and add the missing tick() as shown in the animated version.
SummaryIn this lesson, you animated the message diagram for the stopwatch model. You become more familiar with animation and you performed the following:
Ran the component Animated the message diagram Sent events to the model and saw it pass messages Compared the message diagram with the animated message diagram
106 C Tutorial
Index
Symbols#include structure 27<stdio.h> 41
AAction elements 46Activity diagrams 3Activity flows 49Analysis mode 81Animation 62
buttons 76comparing message diagrams 104generating events 73message diagram 98pausing 102quitting 78, 102restarting 102running 73saving diagrams 103sending events 73set up 63starting 67statecharts 62stopping 102
Arguments 38Arguments tab 24Autosave 9
BBackups 9, 14Black-box analysis 26Browser 8, 17, 19
copying a configuration 65filtering 20locate generated code 93moving 20re-ordering elements 20
Build diagrams 4
CC language 1
adding timerReset function 94
editing code 89generating code 89header file 91makefiles 64profiles 7variables 34
Call Graph diagrams 4Call Stack window 98Categories 19Check model 21Classes
naming guidelines 16Code 1
C 1, 91define execution 63editing 89, 91, 94executable 98generated 89generated from 87generating 89header 91line numbers 92locate with browser 93roundtripping 95viewing 89
Code window 90, 92, 93, 94Collaboration diagrams 3Communication 84Comparing message diagrams 104Compilers 64Component diagrams 3Condition connector 48Configurations 63
Debug 65multiple 88Test 65
Creatingfile diagram 30message diagram 79statechart 53stopwatch project 6
DDebug configuration 65Default flow 47
Rhapsody 107
Index
Dependency 35Deployment diagrams 3Design mode 81Diagrams 3
Execution message diagram 79, 80in FunctionalC profile 4Overview file diagram 28renaming 35Tick flow chart 44Timer statechart 53, 54UML diagrams 3
Directories 10_RTC 10C samples 2Linux home 5project files 6project repository 10structure 12
display.h 36Drawing 18
action elements 46area 17, 21default flow 47dependencies 35files 31termination state 47toolbar 17, 21
EEditing code 91Event history file 10Event Queue window 98Events 57, 73
generating 77, 100naming conventions 16
Executable 98
FFeatures dialog box 22
Arguments tab 24docking 25Functions tab 24General tab 23Implementation tab 25moving 25Properties tab 25tabs 23Variables tab 23
fflush 39File diagrams 3, 4, 27, 28
creating 28, 30Overview 28renaming 29
Files 6, 10.ehl 10
.rpy 10
.vba 10drawing 31log 10project 6timer.h 36
Flow charts 3, 4, 43, 44creating 44, 45Tick 44
Flowsdefault 47
FunctionalC profile 4, 7FunctionalC type 7Functions 33, 34, 37Functions tab 24
GGeneral tab 23Generating 87
C code 1, 89different configurations 88
Generating events 73Graphical user interface 17Guidelines for naming model elements 16
HHelp pane for property 12
IImpIncludes property 41Implementation code 39Implementation tab 25Include files 41Instance 69Interfaces
naming conventions 16naming guidelines 16
LLine numbering 92Linux 5, 39
starting Rhapsody 5Lock symbol 33, 34Log 21
files 10
MMakefiles 64, 89Menu 17Message diagrams 3, 4, 79
adding instances 83
108 C Tutorial
Index
animated 98comparing 104comparison results 106creating 79, 80Execution message diagram 80messages 84saving animated 103types of messages 84
Messages 84Model properties 12Models
drawing files 31naming guidelines 16properties 14validating 62
NNames
conventions for 16model element guidelines 16
OObject model diagrams 3Opening
project 11Rhapsody 5
Operationsnaming conventions 16
Output window 17, 21, 98
PPackages 12, 19
files in browser 32naming guidelines 16storing separately 12
Pausing animation 102printf() 39, 41Profiles
C language 7Projects
backups 14creating 6directories 10directory structure 12file 10files 6, 10folder 19more than one 19node 19opening 11restore 15saving 9types 7
Properties 12, 14, 41
backup 14common filter 41filter 41implementation includes 41tab 12, 25
QQuitting animation 78, 102
RRenaming diagrams 35Repository directory 10Restarting animation 102Rhapsody 2
autosave 9backups 9, 14browser 19closing 5drawing area 21Drawing toolbar 21exiting 5Features dialog box 22GUI 17interface 17Output window 21Properties tab 12restore projects 15starting 5timer 59toolbars 18UML tools 3
Rhapsody browserfiltering 20moving 20re-ordering elements 20
Roundtripping 95rpy file 10
SSaving a project 9Sequence diagrams 3Simulation 62Statecharts 3, 53
animated 73creating 53, 54generating events 73simulating 62Timer 54transitions 57
stdio.h 41Stereotype 35Stopping animation 102Stopwatch model
animating 62
Rhapsody 109

Index
communication 84file diagram 27flow chart 43message diagram 79statechart 53
Stopwatch projectcreating 6opening 11
Structure diagrams 3
TTabs
check model 21log 21timer.c 91timer.h 91
Termination state 47Test component 63Test configuration 65TestConductor
add-on directory 10Timeout 84Timer
.c tab 91
.h file 36
.h tab 91
communication definition 84instance 69
Timer (event) 57Timer statechart 54Timer.c tab 94Toolbars 17, 18, 21Transitions 56, 57Troubleshooting
Message diagram comparison 106Types of projects 7
UUML (Unified Modeling Language) 1Use case diagrams 3
VVariables 34Variables tab 23
WWhite-box analysis 26Windows 5
110 C Tutorial