c úìÄ£ ràÛ¨Çc $Ü -...
TRANSCRIPT

UNITED STATESSECURITIES AND EXCHANGE COMMISSION
Washington, D.C. 20549
FORM 10-Q(Mark One)
ý QUARTERLY REPORT PURSUANT TO SECTION 13 OR 15(d) OF THE SECURITIESEXCHANGE ACT OF 1934
For the quarterly period ended September 30, 2017or
¨ TRANSITION REPORT PURSUANT TO SECTION 13 OR 15(d) OF THE SECURITIESEXCHANGE ACT OF 1934
For the transition period from to
Commission file number 1-442
THE BOEING COMPANY (Exact name of registrant as specified in its charter)
Delaware 91-0425694(State or other jurisdiction ofincorporation or organization)
(I.R.S. Employer Identification No.)
100 N. Riverside Plaza, Chicago, IL 60606-1596(Address of principal executive offices) (Zip Code)
(312) 544-2000 (Registrant’s telephone number, including area code)
Indicate by check mark whether the registrant (1) has filed all reports required to be filed by Section 13 or 15(d) of the Securities Exchange Act of 1934 duringthe preceding 12 months (or for such shorter period that the registrant was required to file such reports), and (2) has been subject to such filing requirements forthe past 90 days. Yes ýNo ¨Indicate by check mark whether the registrant has submitted electronically and posted on its corporate Web site, if any, every Interactive Data File required to besubmitted and posted pursuant to Rule 405 of Regulation S-T (§232.405 of this chapter) during the preceding 12 months (or for such shorter period that theregistrant was required to submit and post such files). Yes ýNo ¨Indicate by check mark whether the registrant is a large accelerated filer, an accelerated filer, a non-accelerated filer, a smaller reporting company, or anemerging growth company. See the definitions of “large accelerated filer,” “accelerated filer,” “smaller reporting company,” and "emerging growth company" inRule 12b-2 of the Exchange Act. (Check one):
Large accelerated filer ý Accelerated filer ¨
Non-accelerated filer ¨ (Do not check if a smaller reporting company) Smaller reporting company ¨
Emerging growth company ¨ If an emerging growth company, indicate by check mark if the registrant has elected not to use the extended transition period for complying with any new orrevised financial accounting standards provided pursuant to Section 13(a) of the Exchange Act. ¨Indicate by check mark whether the registrant is a shell company (as defined in Rule 12b-2 of the Exchange Act). Yes ¨No ýAs of October 18, 2017 , there were 595,578,523 shares of common stock, $5.00 par value, issued and outstanding.
1

THE BOEING COMPANYFORM 10-Q
For the Quarter Ended September 30, 2017INDEX
Part I. Financial Information (Unaudited) Page Item 1. Financial Statements 1 Condensed Consolidated Statements of Operations 1 Condensed Consolidated Statements of Comprehensive Income 2 Condensed Consolidated Statements of Financial Position 3 Condensed Consolidated Statements of Cash Flows 4 Condensed Consolidated Statements of Equity 5 Summary of Business Segment Data 6 Note 1 – Basis of Presentation 7 Note 2 – Earnings Per Share 8 Note 3 – Income Taxes 9 Note 4 – Inventories 10 Note 5 – Customer Financing 11 Note 6 – Investments 12 Note 7 – Other Assets 12 Note 8 – Commitments and Contingencies 13 Note 9 – Arrangements with Off-Balance Sheet Risk 16 Note 10 – Debt 17 Note 11 – Postretirement Plans 18 Note 12 – Share-Based Compensation and Other Compensation Arrangements 18 Note 13 – Shareholders' Equity 19 Note 14 – Derivative Financial Instruments 20 Note 15 – Fair Value Measurements 22 Note 16 – Legal Proceedings 24 Note 17 – Segment Information 24 Report of Independent Registered Public Accounting Firm 27 Forward-Looking Statements 28 Item 2. Management’s Discussion and Analysis of Financial Condition and Results of Operations 30 Consolidated Results of Operations and Financial Condition 30 Commercial Airplanes 35 Defense, Space & Security 38 Boeing Capital 41 Liquidity and Capital Resources 43 Off-Balance Sheet Arrangements 44 Contingent Obligations 44
Non-GAAP Measures
44Item 3. Quantitative and Qualitative Disclosures About Market Risk 46 Item 4. Controls and Procedures 46 Part II. Other Information Item 1. Legal Proceedings 47 Item 1A. Risk Factors 47 Item 2. Unregistered Sales of Equity Securities and Use of Proceeds 47 Item 3. Defaults Upon Senior Securities 47 Item 4. Mine Safety Disclosures 47 Item 5. Other Information 47

Item 6. Exhibits 48 Signature 49

Table of Contents
Part I. Financial Information
Item 1. Financial Statements
The Boeing Company and SubsidiariesCondensed Consolidated Statements of Operations
(Unaudited)
(Dollars in millions, except per share data)Nine months ended September
30 Three months ended
September 30 2017 2016 2017 2016Sales of products $60,484 $63,563 $21,825 $21,494Sales of services 7,540 7,722 2,484 2,404Total revenues 68,024 71,285 24,309 23,898 Cost of products (49,856) (55,117) (18,050) (17,907)Cost of services (5,730) (6,163) (1,910) (1,983)Boeing Capital interest expense (53) (46) (27) (14)Total costs and expenses (55,639) (61,326) (19,987) (19,904) 12,385 9,959 4,322 3,994Income from operating investments, net 169 220 49 69General and administrative expense (2,888) (2,617) (915) (923)Research and development expense, net (2,418) (3,901) (767) (857)Loss on dispositions, net (10) (1)Earnings from operations 7,248 3,651 2,689 2,282Other income, net 94 41 45 2Interest and debt expense (267) (227) (87) (81)Earnings before income taxes 7,075 3,465 2,647 2,203Income tax (expense)/benefit (2,010) (201) (794) 76Net earnings $5,065 $3,264 $1,853 $2,279
Basic earnings per share $8.37 $5.09 $3.10 $3.64
Diluted earnings per share $8.27 $5.04 $3.06 $3.60
Cash dividends paid per share $4.26 $3.27 $1.42 $1.09
Weighted average diluted shares (millions) 612.8 647.9 606.3 632.7
See Notes to the Condensed Consolidated Financial Statements.
1
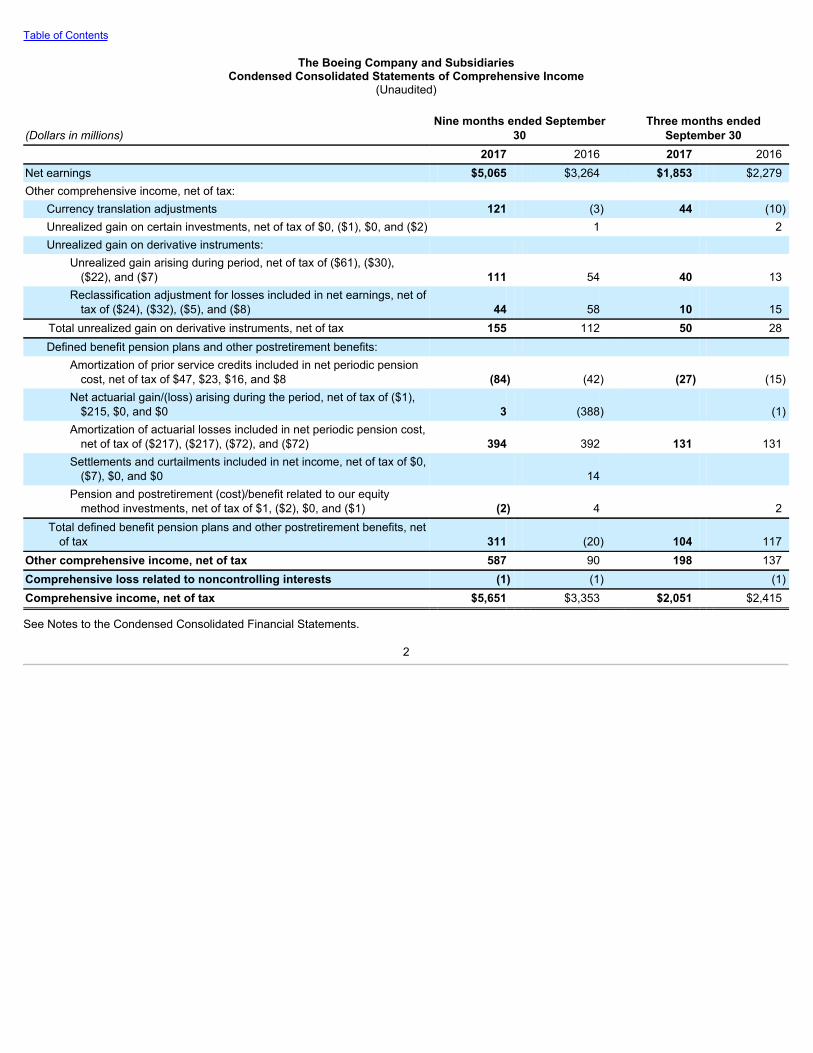
Table of Contents
The Boeing Company and SubsidiariesCondensed Consolidated Statements of Comprehensive Income
(Unaudited)
(Dollars in millions)Nine months ended September
30 Three months ended
September 30 2017 2016 2017 2016Net earnings $5,065 $3,264 $1,853 $2,279Other comprehensive income, net of tax:
Currency translation adjustments 121 (3) 44 (10)Unrealized gain on certain investments, net of tax of $0, ($1), $0, and ($2) 1 2Unrealized gain on derivative instruments:
Unrealized gain arising during period, net of tax of ($61), ($30),($22), and ($7) 111 54 40 13
Reclassification adjustment for losses included in net earnings, net oftax of ($24), ($32), ($5), and ($8) 44 58 10 15
Total unrealized gain on derivative instruments, net of tax 155 112 50 28Defined benefit pension plans and other postretirement benefits:
Amortization of prior service credits included in net periodic pensioncost, net of tax of $47, $23, $16, and $8 (84) (42) (27) (15)
Net actuarial gain/(loss) arising during the period, net of tax of ($1),$215, $0, and $0 3 (388) (1)
Amortization of actuarial losses included in net periodic pension cost,net of tax of ($217), ($217), ($72), and ($72) 394 392 131 131
Settlements and curtailments included in net income, net of tax of $0,($7), $0, and $0 14
Pension and postretirement (cost)/benefit related to our equitymethod investments, net of tax of $1, ($2), $0, and ($1) (2) 4 2
Total defined benefit pension plans and other postretirement benefits, netof tax 311 (20) 104 117
Other comprehensive income, net of tax 587 90 198 137Comprehensive loss related to noncontrolling interests (1) (1) (1)Comprehensive income, net of tax $5,651 $3,353 $2,051 $2,415
See Notes to the Condensed Consolidated Financial Statements.
2

Table of Contents
The Boeing Company and SubsidiariesCondensed Consolidated Statements of Financial Position
(Unaudited)
(Dollars in millions, except per share data)September 30
2017 December 31
2016Assets Cash and cash equivalents $8,569 $8,801Short-term and other investments 1,463 1,228Accounts receivable, net 10,644 8,832Current portion of customer financing, net 435 428Inventories, net of advances and progress billings 43,031 43,199
Total current assets 64,142 62,488Customer financing, net 3,039 3,773Property, plant and equipment, net of accumulated depreciation of $17,401 and $16,883 12,712 12,807Goodwill 5,344 5,324Acquired intangible assets, net 2,523 2,540Deferred income taxes 298 332Investments 1,270 1,317Other assets, net of accumulated amortization of $509 and $497 1,679 1,416
Total assets $91,007 $89,997
Liabilities and equity Accounts payable $12,718 $11,190Accrued liabilities 14,008 14,691Advances and billings in excess of related costs 26,695 23,869Short-term debt and current portion of long-term debt 988 384
Total current liabilities 54,409 50,134Deferred income taxes 2,884 1,338Accrued retiree health care 5,826 5,916Accrued pension plan liability, net 15,514 19,943Other long-term liabilities 1,449 2,221Long-term debt 9,780 9,568Shareholders’ equity:
Common stock, par value $5.00 – 1,200,000,000 shares authorized; 1,012,261,159 sharesissued 5,061 5,061
Additional paid-in capital 6,754 4,762Treasury stock, at cost - 414,910,219 and 395,109,568 shares (41,745) (36,097)Retained earnings 44,052 40,714Accumulated other comprehensive loss (13,036) (13,623)
Total shareholders’ equity 1,086 817Noncontrolling interests 59 60Total equity 1,145 877Total liabilities and equity $91,007 $89,997
See Notes to the Condensed Consolidated Financial Statements.
3
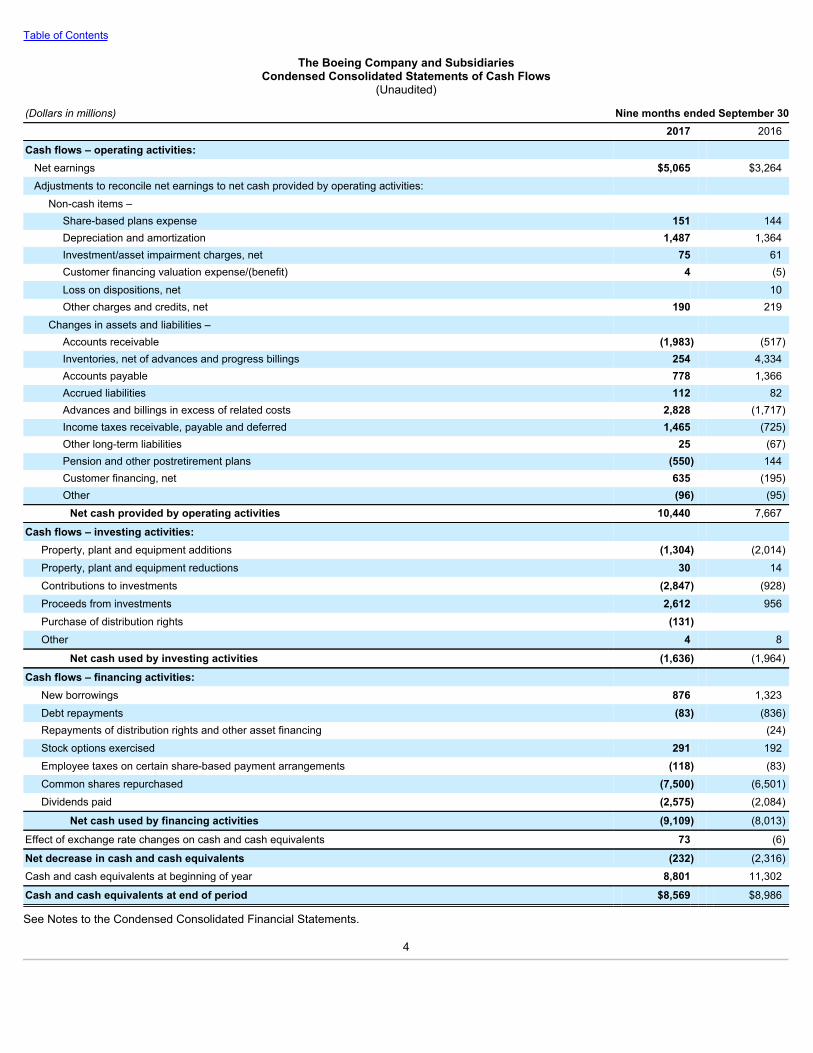
Table of Contents
The Boeing Company and SubsidiariesCondensed Consolidated Statements of Cash Flows
(Unaudited)
(Dollars in millions) Nine months ended September 30 2017 2016
Cash flows – operating activities: Net earnings $5,065 $3,264Adjustments to reconcile net earnings to net cash provided by operating activities:
Non-cash items – Share-based plans expense 151 144Depreciation and amortization 1,487 1,364Investment/asset impairment charges, net 75 61Customer financing valuation expense/(benefit) 4 (5)Loss on dispositions, net 10Other charges and credits, net 190 219
Changes in assets and liabilities – Accounts receivable (1,983) (517)Inventories, net of advances and progress billings 254 4,334Accounts payable 778 1,366Accrued liabilities 112 82Advances and billings in excess of related costs 2,828 (1,717)Income taxes receivable, payable and deferred 1,465 (725)Other long-term liabilities 25 (67)Pension and other postretirement plans (550) 144Customer financing, net 635 (195)Other (96) (95)
Net cash provided by operating activities 10,440 7,667
Cash flows – investing activities: Property, plant and equipment additions (1,304) (2,014)Property, plant and equipment reductions 30 14Contributions to investments (2,847) (928)Proceeds from investments 2,612 956Purchase of distribution rights (131) Other 4 8
Net cash used by investing activities (1,636) (1,964)
Cash flows – financing activities: New borrowings 876 1,323Debt repayments (83) (836)Repayments of distribution rights and other asset financing (24)Stock options exercised 291 192Employee taxes on certain share-based payment arrangements (118) (83)Common shares repurchased (7,500) (6,501)Dividends paid (2,575) (2,084)
Net cash used by financing activities (9,109) (8,013)
Effect of exchange rate changes on cash and cash equivalents 73 (6)
Net decrease in cash and cash equivalents (232) (2,316)Cash and cash equivalents at beginning of year 8,801 11,302
Cash and cash equivalents at end of period $8,569 $8,986
See Notes to the Condensed Consolidated Financial Statements.
4

Table of Contents
The Boeing Company and SubsidiariesCondensed Consolidated Statements of Equity
(Unaudited)
Boeing shareholders
(Dollars in millions, except per share data)Common
Stock
AdditionalPaid-InCapital
TreasuryStock
RetainedEarnings
Accumulated OtherComprehensive
Loss
Non-controlling
Interests Total
Balance at January 1, 2016 $5,061 $4,834 ($29,568) $38,756 ($12,748) $62 $6,397
Net earnings 3,264 (1) 3,263
Other comprehensive income, net of tax of ($51) 90 90
Share-based compensation and related dividend equivalents 158 (15) 143
Treasury shares issued for stock options exercised, net (30) 222 192
Treasury shares issued for other share-based plans, net (154) 84 (70)
Common shares repurchased (6,501) (6,501)
Cash dividends declared ($2.18 per share) (1,364) (1,364)
Balance at September 30, 2016 $5,061 $4,808 ($35,763) $40,641 ($12,658) $61 $2,150
Balance at January 1, 2017 $5,061 $4,762 ($36,097) $40,714 ($13,623) $60 $877
Net earnings 5,065 (1) 5,064
Other comprehensive loss, net of tax of ($255) 587 587Share-based compensation and related dividend
equivalents 168 (18) 150
Treasury shares issued for stock options exercised, net (80) 370 290
Treasury shares issued for other share-based plans, net (178) 64 (114)
Treasury shares contributed to pension plans 2,082 1,418 3,500
Common shares repurchased (7,500) (7,500)
Cash dividends declared ($2.84 per share) (1,709) (1,709)
Balance at September 30, 2017 $5,061 $6,754 ($41,745) $44,052 ($13,036) $59 $1,145
See Notes to the Condensed Consolidated Financial Statements.
5
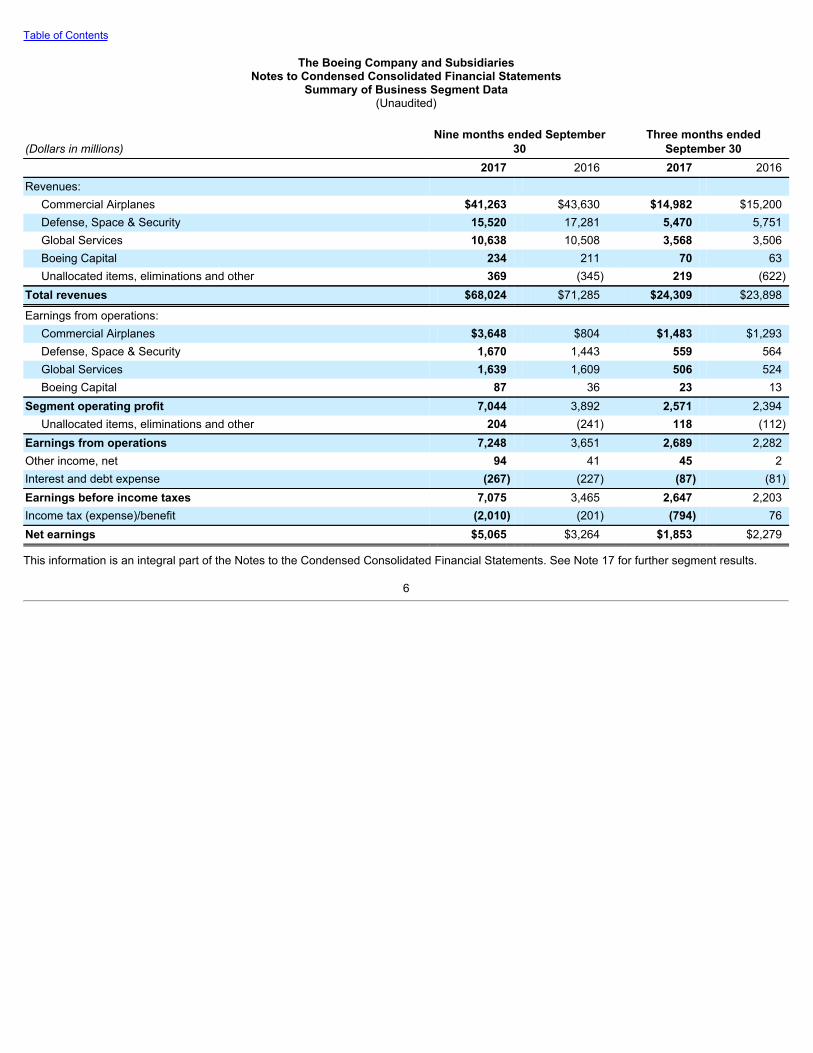
Table of Contents
The Boeing Company and SubsidiariesNotes to Condensed Consolidated Financial Statements
Summary of Business Segment Data(Unaudited)
(Dollars in millions)Nine months ended September
30 Three months ended
September 302017 2016 2017 2016
Revenues: Commercial Airplanes $41,263 $43,630 $14,982 $15,200Defense, Space & Security 15,520 17,281 5,470 5,751Global Services 10,638 10,508 3,568 3,506Boeing Capital 234 211 70 63Unallocated items, eliminations and other 369 (345) 219 (622)
Total revenues $68,024 $71,285 $24,309 $23,898
Earnings from operations: Commercial Airplanes $3,648 $804 $1,483 $1,293Defense, Space & Security 1,670 1,443 559 564Global Services 1,639 1,609 506 524Boeing Capital 87 36 23 13
Segment operating profit 7,044 3,892 2,571 2,394Unallocated items, eliminations and other 204 (241) 118 (112)
Earnings from operations 7,248 3,651 2,689 2,282Other income, net 94 41 45 2Interest and debt expense (267) (227) (87) (81)Earnings before income taxes 7,075 3,465 2,647 2,203Income tax (expense)/benefit (2,010) (201) (794) 76Net earnings $5,065 $3,264 $1,853 $2,279
This information is an integral part of the Notes to the Condensed Consolidated Financial Statements. See Note 17 for further segment results.
6

Table of Contents
The Boeing Company and SubsidiariesNotes to the Condensed Consolidated Financial Statements
(Dollars in millions, except per share data)(Unaudited)
Note 1 – Basis of Presentation
The condensed consolidated interim financial statements included in this report have been prepared by management of The Boeing Company(herein referred to as “Boeing”, the “Company”, “we”, “us”, or “our”). In the opinion of management, all adjustments (consisting of normal recurringaccruals) necessary for a fair presentation are reflected in the interim financial statements. The results of operations for the period endedSeptember 30, 2017 are not necessarily indicative of the operating results for the full year. The interim financial statements should be read inconjunction with the audited Consolidated Financial Statements, including the notes thereto, included in our 2016 Annual Report on Form 10-K. Asdescribed in Note 17 , effective July 1, 2017, we now operate in four reportable segments: Commercial Airplanes (BCA); Defense, Space & Security(BDS), Global Services (BGS) and Boeing Capital (BCC). Amounts in prior periods have been reclassified to conform to the current period'spresentation.
Standards Issued and Not Yet Implemented
In February 2016, the Financial Accounting Standards Board issued Accounting Standards Update (ASU) No. 2016-02, Leases (Topic 842) . Thenew standard is effective for reporting periods beginning after December 15, 2018 and early adoption is permitted. The standard will require lesseesto report most leases as assets and liabilities on the balance sheet, while lessor accounting will remain substantially unchanged. The standardrequires a modified retrospective transition approach for existing leases, whereby the new rules will be applied to the earliest year presented. We donot expect the new lease standard to have a material effect on our financial position, results of operations or cash flows.
We plan to adopt ASU No. 2014-09, Revenue from Contracts with Customers effective January 1, 2018 and apply it retrospectively to all periodspresented. This comprehensive new standard will supersede existing revenue recognition guidance and require revenue to be recognized whenpromised goods or services are transferred to customers in amounts that reflect the consideration to which the company expects to be entitled inexchange for those goods or services. The standard also requires expanded disclosures regarding revenue and contracts with customers.
We expect adoption of the new standard will have a material impact on our income statement and balance sheet. We currently expect that most ofour defense contracts at BDS and BGS that currently recognize revenue as deliveries are made or based on the attainment of performancemilestones will recognize revenue under the new standard as costs are incurred. Certain military derivative aircraft contracts in our BCA businesswill also recognize revenue as costs are incurred. The new standard will not change the total amount of revenue recognized on these contracts, onlyaccelerate the timing of when the revenue is recognized. We expect a corresponding acceleration in timing of cost of sales recognition for thesecontracts resulting in a decrease in Inventories from long-term contracts in progress upon adoption of the new standard.
We do not expect the new standard to affect revenue recognition or the use of program accounting for commercial airplane contracts in our BCAbusiness. We will continue to recognize revenue for these contracts at the point in time when the customer accepts delivery of the airplane.
We have completed a preliminary assessment of the impact of adopting the new standard on previously reported 2016 and prior periodresults. Because revenue will be recognized under the new standard as costs are incurred for most of our defense and military derivative airplanecontracts, approximately $10,000 of revenues and $1,000 of associated earnings will be accelerated into years ending prior to the January 1, 2016effective date. Therefore, as of January 1, 2016, we expect to record a cumulative adjustment to increase retained earnings by approximately $1,000. We expect consolidated revenues previously reported in 2016 to decrease by approximately $1,000 , primarily reflecting $2,000 of lower revenueson several defense contracts that currently recognize revenues as deliveries are made, partially offset by higher KC-46A Tanker revenues. Theserevenue changes are expected to reduce previously reported segment operating
7

Table of Contents
earnings by approximately $400 . We expect the reduction in 2016 segment operating earnings to be offset by increases in unallocated pensionincome. We expect adoption will increase total assets and total liabilities by approximately $20,000 primarily due to classifying certain advances fromcustomers as liabilities under the new standard, whereas these advances were netted against inventory under existing Generally AcceptedAccounting Principles (GAAP). We expect the new standard to have no impact on cash flows reported in 2016. The impact of the new standard onour 2016 financial results may not be representative of the impact on our financial position and operating results in subsequent years.
We are continuing to analyze the impact of the new standard on the Company’s revenue contracts, comparing our current accounting policies andpractices to the requirements of the new standard. The new standard requires additional detailed disclosures regarding the company’s contracts withcustomers, including disclosure of remaining unsatisfied performance obligations, in the first quarter 2018 which we are continuing to assess. Weare also identifying and implementing changes to the Company’s business processes, systems and controls to support adoption of the new standardin 2018 and recasting prior periods’ financial information.
Use of Estimates
Management makes assumptions and estimates to prepare financial statements in conformity with GAAP. Those assumptions and estimates directlyaffect the amounts reported in the Condensed Consolidated Financial Statements. Significant estimates for which changes in the near term areconsidered reasonably possible and that may have a material impact on the financial statements are disclosed in these Notes to the CondensedConsolidated Financial Statements.
Contract accounting is used for development and production activities predominantly by BDS and for defense contracts at BGS. Contract accountinginvolves a judgmental process of estimating total sales and costs for each contract resulting in the development of estimated cost of salespercentages. Changes in estimated revenues, cost of sales and the related effect on operating income are recognized using a cumulative catch-upadjustment which recognizes in the current period the cumulative effect of the changes on current and prior periods based on a contract’s percentcomplete. Net cumulative catch-up adjustments to prior years' earnings, including reach-forward losses, across all contracts were as follows:
Nine months ended September 30 Three months ended September
30 2017 2016 2017 2016Decrease to Earnings from Operations ($39) ($656) ($302) ($69)Decrease to Diluted EPS ($0.05) ($0.95) ($0.35) ($0.11)
Note 2 – Earnings Per Share
Basic and diluted earnings per share are computed using the two-class method, which is an earnings allocation method that determines earningsper share for common shares and participating securities. The undistributed earnings are allocated between common shares and participatingsecurities as if all earnings had been distributed during the period. Participating securities and common shares have equal rights to undistributedearnings.
Basic earnings per share is calculated by taking net earnings, less earnings available to participating securities, divided by the basic weightedaverage common shares outstanding.
Diluted earnings per share is calculated by taking net earnings, less earnings available to participating securities, divided by the diluted weightedaverage common shares outstanding.
8

Table of Contents
The elements used in the computation of basic and diluted earnings per share were as follows:
(In millions - except per share amounts)Nine months ended September
30 Three months ended
September 30 2017 2016 2017 2016Net earnings $5,065 $3,264 $1,853 $2,279Less: earnings available to participating securities 4 3 2 3Net earnings available to common shareholders $5,061 $3,261 $1,851 $2,276
Basic Basic weighted average shares outstanding 605.6 641.2 598.3 625.5Less: participating securities 0.8 1.0 0.7 0.9Basic weighted average common shares outstanding 604.8 640.2 597.6 624.6
Diluted Basic weighted average shares outstanding 605.6 641.2 598.3 625.5Dilutive potential common shares (1) 7.2 6.7 8.0 7.2Diluted weighted average shares outstanding 612.8 647.9 606.3 632.7Less: participating securities 0.8 1.0 0.7 0.9Diluted weighted average common shares outstanding 612.0 646.9 605.6 631.8
Net earnings per share: Basic $8.37 $5.09 $3.10 $3.64Diluted 8.27 5.04 3.06 3.60
(1) Diluted earnings per share includes any dilutive impact of stock options, restricted stock units, performance-based restricted stock units andperformance awards.
The following table includes the number of shares that may be dilutive potential common shares in the future. These shares were not included in thecomputation of diluted earnings per share because the effect was either antidilutive or the performance condition was not met.
(Shares in millions)Nine months ended September
30 Three months ended
September 30 2017 2016 2017 2016Performance awards 4.6 7.0 3.4 6.2Performance-based restricted stock units 0.6 2.8 0.1 3.1
Note 3 – Income Taxes
Our effective income tax rates were 28.4% and 30.0% for the nine and three months ended September 30, 2017 and 5.8% and (3.4)% for the sameperiods in the prior year. The effective tax rate of 30.0% for the third quarter of 2017 is higher than the nine-month rate primarily due to lowerdiscrete tax benefits in the third quarter compared with the first and second quarters of 2017. The 2017 effective tax rates are higher than the prioryear primarily due to discrete tax benefits recorded in the third quarter of 2016 related to tax basis adjustments of $440 and the settlement of the2011-2012 federal tax audit of $177 . Additionally, 2017 year-to-date and projected pre-tax earnings are higher compared to prior year. Furthermore,higher share-based compensation tax benefits were recognized for the nine and three month periods of 2017 compared with the prior year.
9

Table of Contents
Federal income tax audits have been settled for all years prior to 2013. The Internal Revenue Service (IRS) is currently examining the 2013-2014 taxyears. We are also subject to examination in major state and international jurisdictions for the 2001-2016 tax years. We believe appropriateprovisions for all outstanding tax issues have been made for all jurisdictions and all open years.
Note 4 – Inventories
Inventories consisted of the following:
September 30
2017 December 31
2016Long-term contracts in progress $13,608 $12,801Commercial aircraft programs 52,871 52,048Commercial spare parts, used aircraft, general stock materials and other 6,068 5,446Inventory before advances and progress billings 72,547 70,295Less advances and progress billings (29,516) (27,096)Total $43,031 $43,199
Long-Term Contracts in Progress
Long-term contracts in progress includes Delta launch program inventory that is being sold at cost to United Launch Alliance ( ULA ) under aninventory supply agreement that terminates on March 31, 2021. The inventory balance was $120 (net of advances of $187 and $220 ) atSeptember 30, 2017 and December 31, 2016 . See indemnifications to ULA in Note 9 .
Included in inventories are capitalized precontract costs of $847 and $729 primarily related to KC-46A Tanker and C-17 at September 30, 2017 andDecember 31, 2016 .
Commercial Aircraft Programs
At September 30, 2017 and December 31, 2016 , commercial aircraft programs inventory included the following amounts related to the 787 program:$31,664 and $32,501 of work in process (including deferred production costs of $25,948 and $27,308 ), $2,745 and $2,398 of supplier advances,and $3,334 and $3,625 of unamortized tooling and other non-recurring costs. At September 30, 2017 , $22,584 of 787 deferred production costs,unamortized tooling and other non-recurring costs are expected to be recovered from units included in the program accounting quantity that havefirm orders and $6,698 is expected to be recovered from units included in the program accounting quantity that represent expected future orders.
At September 30, 2017 and December 31, 2016 , commercial aircraft programs inventory included $173 and $284 of unamortized tooling costsrelated to the 747 program. At September 30, 2017 , $163 of unamortized tooling costs are expected to be recovered from units included in theprogram accounting quantity that have firm orders and $10 is expected to be recovered from units included in the program accounting quantity thatrepresent expected future orders. At September 30, 2017 , the program accounting quantity has 18 undelivered aircraft, including one alreadycompleted aircraft that has not been sold and is being remarketed.
Commercial aircraft programs inventory included amounts credited in cash or other consideration (early issue sales consideration) to airlinecustomers totaling $2,951 and $3,117 at September 30, 2017 and December 31, 2016 .
10

Table of Contents
Note 5 – Customer Financing
Customer financing primarily relates to the Boeing Capital ( BCC ) segment and consisted of the following:
September 30
2017 December 31
2016Financing receivables:
Investment in sales-type/finance leases $1,400 $1,482Notes 762 807
Total financing receivables 2,162 2,289Operating lease equipment, at cost, less accumulated depreciation of $361 and $359 1,327 1,922Gross customer financing 3,489 4,211Less allowance for losses on receivables (14) (10)Total $3,475 $4,201
We determine a receivable is impaired when, based on current information and events, it is probable that we will be unable to collect amounts dueaccording to the original contractual terms. At September 30, 2017 and December 31, 2016 , we individually evaluated for impairment customerfinancing receivables of $50 and $55 , of which $39 and $44 were determined to be impaired. We recorded no allowance for losses on theseimpaired receivables as the collateral values exceeded the carrying values of the receivables.
The adequacy of the allowance for losses is assessed quarterly. Three primary factors influencing the level of our allowance for losses on customerfinancing receivables are customer credit ratings, default rates and collateral values. We assign internal credit ratings for all customers anddetermine the creditworthiness of each customer based upon publicly available information and information obtained directly from our customers.Our rating categories are comparable to those used by the major credit rating agencies.
Our financing receivable balances by internal credit rating category are shown below:
Rating categoriesSeptember 30
2017 December 31
2016BBB $1,200 $1,324BB 508 538B 405 383CCC 49 44Total carrying value of financing receivables $2,162 $2,289
At September 30, 2017 , our allowance related to receivables with ratings of B, BB and BBB. We applied default rates that averaged 16.8% , 8.1%and 1.0% , respectively, to the exposure associated with those receivables.
Customer Financing Exposure
Customer financing is collateralized by security in the related asset. The value of the collateral is closely tied to commercial airline performance andoverall market conditions and may be subject to reduced valuation with market decline. Declines in collateral values could result in assetimpairments, reduced finance lease income, and an increase in the allowance for losses. Our customer financing collateral is concentrated in 747-8and out-of-production aircraft. Generally, out-of-production aircraft have experienced greater collateral value declines than in-production aircraft.
11

Table of Contents
The majority of customer financing carrying values are concentrated in the following aircraft models:
September 30
2017 December 31
2016717 Aircraft ($274 and $301 accounted for as operating leases) $1,114 $1,282747-8 Aircraft ($769 and $1,086 accounted for as operating leases) 769 1,111MD-80 Aircraft (accounted for as sales-type finance leases) 236 259757 Aircraft ($39 and $43 accounted for as operating leases) 233 246747-400 Aircraft ($94 and $149 accounted for as operating leases) 178 149777 Aircraft ($13 and $0 accounted for as operating leases) 166 165767 Aircraft ($27 and $85 accounted for as operating leases) 103 170737 Aircraft ($94 and $103 accounted for as operating leases) 99 103
Note 6 – Investments
Our investments, which are recorded in Short-term and other investments or Investments, consisted of the following:
September 30
2017 December 31
2016Equity method investments (1) $1,226 $1,242Time deposits 858 665Available-for-sale investments 513 537Restricted cash & cash equivalents (2) 106 68Other investments 30 33Total $2,733 $2,545(1) Dividends received were $195 and $47 for the nine and three months ended September 30, 2017 and $249 and $83 during the same periods in
the prior year.(2) Reflects amounts restricted in support of our workers’ compensation programs, employee benefit programs, and insurance premiums.
Note 7 – Other Assets
Sea Launch
At September 30, 2017 and December 31, 2016 , Other assets included $356 of receivables related to our former investment in the Sea Launchventure which became payable by certain Sea Launch partners following Sea Launch’s bankruptcy filing in June 2009. The net amounts owed toBoeing by each of the partners are as follows: S.P. Koroley Rocket and Space Corporation Energia of Russia (RSC Energia) – $223 , PO YuzhnoyeMashinostroitelny Zavod of Ukraine – $89 and KB Yuzhnoye of Ukraine – $44 .
On February 1, 2013, we filed an action in the United States District Court for the Central District of California seeking reimbursement from the otherSea Launch partners. On May 12, 2016, the court issued a judgment in favor of Boeing.
In December 2016, we reached an agreement which we believe will enable us to recover the outstanding receivable balance from RSC Energia overthe next several years. The agreement was subject to certain contingencies which were resolved during the first quarter of 2017. We continue topursue collection efforts against the former Ukrainian partners in connection with the court judgment and continue to believe the partners have thefinancial wherewithal to pay and intend to pursue vigorously all of our rights and remedies. In the event we are unable to secure reimbursement fromthe Sea Launch partners, we could incur additional charges. Our current assessment as to the collectability of these receivables takes into accountthe current economic conditions in Russia and Ukraine, although we will continue to monitor the situation.
12

Table of Contents
Spirit AeroSystems
As of September 30, 2017 and December 31, 2016 , Other assets included $143 of receivables related to indemnifications from Spirit AeroSystems,Inc. (Spirit) for costs incurred related to pension and retiree medical obligations of former Boeing employees who were subsequently employed bySpirit. During the fourth quarter of 2014, Boeing filed a complaint against Spirit in the Delaware Superior Court seeking to enforce our rights toindemnification and to recover from Spirit amounts incurred by Boeing for pension and retiree medical obligations. In the second quarter of 2017, thecourt ruled against Boeing and denied our claim. After a court ruling on legal fees, Boeing plans to appeal to the Delaware Supreme Court and webelieve we have substantial arguments on appeal. We expect to fully recover from Spirit.
Note 8 – Commitments and Contingencies
Environmental
The following table summarizes environmental remediation activity during the nine months ended September 30, 2017 and 2016 .
2017 2016Beginning balance – January 1 $562 $566
Reductions for payments made (25) (33)Changes in estimates 6 43
Ending balance – September 30 $543 $576
The liabilities recorded represent our best estimate or the low end of a range of reasonably possible costs expected to be incurred to remediatesites, including operation and maintenance over periods of up to 30 years. It is reasonably possible that we may incur charges that exceed theserecorded amounts because of regulatory agency orders and directives, changes in laws and/or regulations, higher than expected costs and/or thediscovery of new or additional contamination. As part of our estimating process, we develop a range of reasonably possible alternate scenarios thatincludes the high end of a range of reasonably possible cost estimates for all remediation sites for which we have sufficient information based on ourexperience and existing laws and regulations. There are some potential remediation obligations where the costs of remediation cannot bereasonably estimated. At September 30, 2017 and December 31, 2016 , the high end of the estimated range of reasonably possible remediationcosts exceeded our recorded liabilities by $873 and $857 .
Product Warranties
The following table summarizes product warranty activity recorded during the nine months ended September 30, 2017 and 2016 .
2017 2016Beginning balance – January 1 $1,414 $1,485
Additions for current year deliveries 183 293Reductions for payments made (193) (258)Changes in estimates (213) (103)
Ending balance – September 30 $1,191 $1,417
Commercial Aircraft Commitments
In conjunction with signing definitive agreements for the sale of new aircraft (Sale Aircraft), we have entered into trade-in commitments with certaincustomers that give them the right to trade in used aircraft at a specified price upon the purchase of Sale Aircraft. The probability that trade-incommitments will be exercised is determined by using both quantitative information from valuation sources and qualitative information from
13

Table of Contents
other sources. The probability of exercise is assessed quarterly, or as events trigger a change, and takes into consideration the current economicand airline industry environments. Trade-in commitments, which can be terminated by mutual consent with the customer, may be exercised onlyduring the period specified in the agreement, and require advance notice by the customer.
Trade-in commitment agreements at September 30, 2017 have expiration dates from 2017 through 2026 . At September 30, 2017 , and December31, 2016 total contractual trade-in commitments were $1,676 and $1,485 . As of September 30, 2017 and December 31, 2016 , we estimated that itwas probable we would be obligated to perform on certain of these commitments with net amounts payable to customers totaling $94 and $126 andthe fair value of the related trade-in aircraft was $94 and $126 .
Financing Commitments
Financing commitments related to aircraft on order, including options and those proposed in sales campaigns, and refinancing of delivered aircraft,totaled $13,106 and $14,847 as of September 30, 2017 and December 31, 2016 . The estimated earliest potential funding dates for thesecommitments as of September 30, 2017 are as follows:
TotalOctober through December 2017 $3052018 3,4392019 3,4372020 1,8622021 1,585Thereafter 2,478 $13,106
As of September 30, 2017 , all of these financing commitments related to customers we believe have less than investment-grade credit. We haveconcluded that no reserve for future potential losses is required for these financing commitments based upon the terms, such as collateralization andinterest rates, under which funding would be provided.
Standby Letters of Credit and Surety Bonds
We have entered into standby letters of credit and surety bonds with financial institutions primarily relating to the guarantee of our futureperformance on certain contracts. Contingent liabilities on outstanding letters of credit agreements and surety bonds aggregated approximately$3,656 and $4,701 as of September 30, 2017 and December 31, 2016 .
Commitments to ULA
We and Lockheed Martin Corporation have each committed to provide ULA with additional capital contributions in the event ULA does not havesufficient funds to make a required payment to us under an inventory supply agreement. As of September 30, 2017 , ULA’s total remaining obligationto Boeing under the inventory supply agreement was $120 . See Note 4 .
F/A-18
At September 30, 2017 , our backlog included 31 F/A-18 aircraft under contract with the U.S. Navy. We have begun work or authorized suppliers tobegin working on aircraft beyond those already in backlog in anticipation of future orders. At September 30, 2017 , we had $94 of capitalizedprecontract costs and $733 of potential termination liabilities to suppliers associated with F/A-18 aircraft not yet on order.
14

Table of Contents
United States Government Defense Environment Overview
In May 2017, the U.S. administration submitted its fiscal year 2018 budget request, which calls for funding the U.S. Department of Defense (U.S.DoD) base budget at a level that is $52 billion or 10% above the spending caps in the Budget Control Act of 2011 (The Act). In addition, three of thefour congressional defense oversight committees have endorsed a U.S. DoD budget topline that is higher than the administration’s fiscal year 2018request. However, The Act, which mandates limits on U.S. government discretionary spending, remains in effect through fiscal year 2021. As aresult, continued budget uncertainty and the risk of future sequestration cuts will remain unless The Act is repealed or significantly modified byCongress.
Funding timeliness also remains a risk. In September 2017, a Continuing Resolution was enacted that extends U.S. government funding at fiscalyear 2017 rates through December 8, 2017. If Congress is unable to pass appropriations bills before the expiration of the current ContinuingResolution, a government shutdown could result which may have impacts above and beyond those resulting from budget cuts, sequestrationimpacts or program-level appropriations. For example, requirements to furlough employees in the U.S. DoD, the Department of Transportation, orother government agencies could result in payment delays, impair our ability to perform work on existing contracts, and/or negatively impact futureorders. Alternatively, Congress may fund the remainder of fiscal year 2018 by passing one or more Continuing Resolutions; however, this couldrestrict the execution of certain program activities and delay new programs or competitions.
In addition, there continues to be uncertainty with respect to program-level appropriations for the U.S. DoD and other government agencies,including the National Aeronautics and Space Administration (NASA), within the overall budgetary framework described above. Future budget cutsor investment priority changes could result in reductions, cancellations and/or delays of existing contracts or programs. Any of these impacts couldhave a material effect on the results of the Company’s operations, financial position and/or cash flows.
BDS Fixed-Price Development Contracts
Fixed-price development work is inherently uncertain and subject to significant variability in estimates of the cost and time required to complete thework. BDS fixed-price contracts with significant development work include Commercial Crew, U.S. Air Force ( USAF ) KC-46A Tanker, andcommercial and military satellites. The operational and technical complexities of these contracts create financial risk, which could trigger terminationprovisions, order cancellations or other financially significant exposure. Changes to cost and revenue estimates could result in lower margins ormaterial charges for reach-forward losses. For example, during the first and third quarters of 2017, we recorded additional reach-forward lossestotalling $471 on the KC-46A Tanker program. Moreover, this and our other fixed-price development programs remain subject to additional reach-forward losses if we experience further technical or quality issues, schedule delays, or increased costs.
KC-46A Tanker
In 2011, we were awarded a contract from the USAF to design, develop, manufacture and deliver four next generation aerial refueling tankers. ThisEngineering, Manufacturing and Development (EMD) contract is a fixed-price incentive fee contract valued at $4.9 billion and involves highlycomplex designs and systems integration. In 2016, the USAF authorized low rate initial production (LRIP) lots for 7 and 12 aircraft valued at $2.8billion . In January 2017, the USAF authorized an additional LRIP lot for 15 aircraft valued at $2.1 billion . At September 30, 2017 , we hadapproximately $320 of capitalized precontract costs and $735 of potential termination liabilities to suppliers.
Recoverable Costs on Government Contracts
Our final incurred costs for each year are subject to audit and review for allowability by the U.S. government, which can result in payment demandsrelated to costs they believe should be disallowed. We work with the U.S. government to assess the merits of claims and where appropriate reservefor amounts disputed. If we are unable to satisfactorily resolve disputed costs, we could be required to record an earnings charge and/or providerefunds to the U.S. government.
15

Table of Contents
Russia/Ukraine
We continue to monitor political unrest involving Russia and Ukraine, where we and some of our suppliers source titanium products and/or haveoperations. A number of our commercial customers also have operations in Russia and Ukraine. To date, we have not experienced any significantdisruptions to production or deliveries. Should suppliers or customers experience disruption, our production and/or deliveries could be materiallyimpacted.
747 Program
Lower-than-expected demand for large commercial passenger and freighter aircraft have continued to drive market uncertainties, pricing pressuresand fewer orders than anticipated. We are currently producing at a rate of 0.5 aircraft per month. The program accounting quantity includes aircraftscheduled to be produced through 2019. We remain focused on obtaining additional orders and implementing cost-reduction efforts. We arecurrently evaluating several scenarios, including sales campaigns that may determine how long we continue the 747 program. If we are unable toobtain sufficient orders and/or market, production and other risks cannot be mitigated, we could record additional losses that may be material.Depending on market conditions, it is reasonably possible that we could decide to end production of the 747.
Note 9 – Arrangements with Off-Balance Sheet Risk
We enter into arrangements with off-balance sheet risk in the normal course of business, primarily in the form of guarantees.
The following table provides quantitative data regarding our third party guarantees. The maximum potential payments represent a “worst-casescenario,” and do not necessarily reflect amounts that we expect to pay. Estimated proceeds from collateral and recourse represent the anticipatedvalues of assets we could liquidate or receive from other parties to offset our payments under guarantees. The carrying amount of liabilitiesrepresents the amount included in Accrued liabilities.
Maximum
Potential Payments Estimated Proceeds from
Collateral/Recourse Carrying Amount of
Liabilities
September 30
2017December 31
2016 September 30
2017December 31
2016 September 30
2017December 31
2016
Contingent repurchase commitments $1,393 $1,306 $1,393 $1,306 $11 $9
Indemnifications to ULA: Contributed Delta program launch
inventory 72 77
Contract pricing 261 261 7 7
Other Delta contracts 191 216 5
Credit guarantees 111 29 64 27 7 2
Contingent Repurchase Commitments The repurchase price specified in contingent repurchase commitments is generally lower than theexpected fair value at the specified repurchase date. Estimated proceeds from collateral/recourse in the table above represent the lower of thecontracted repurchase price or the expected fair value of each aircraft at the specified repurchase date.
Indemnifications to ULA In 2006, we agreed to indemnify ULA through December 31, 2020 against potential non-recoverability and non-allowability of $1,360 of Boeing Delta launch program inventory included in contributed assets plus $1,860 of inventory subject to an inventorysupply agreement which ends on March 31, 2021. Since inception, ULA has consumed $1,288 of the $1,360 of inventory that was contributed by usand has yet to consume $72 . Under the inventory supply agreement, we have recorded revenues and cost of sales of $1,505 throughSeptember 30, 2017 . ULA has made payments of $1,740 to us under the inventory supply agreement and we have made $48 of net indemnificationpayments to ULA.
16

Table of Contents
We agreed to indemnify ULA against potential losses that ULA may incur in the event ULA is unable to obtain certain additional contract pricing fromthe USAF for four satellite missions. In 2009, ULA filed a complaint before the Armed Services Board of Contract Appeals (ASBCA) for a contractadjustment for the price of two of these missions, followed in 2011 by a subsequent notice of appeal with respect to a third mission. The USAF didnot exercise an option for a fourth mission prior to the expiration of the contract. During the second quarter of 2016, the ASBCA ruled that ULA isentitled to additional contract pricing for each of the three missions and remanded to the parties to negotiate appropriate pricing. During the fourthquarter of 2016, the USAF appealed the ASBCA's ruling. In April 2017, the USAF withdrew its appeal. If ULA is ultimately unsuccessful in obtainingadditional pricing, we may be responsible for an indemnification payment up to $261 and may record up to $277 in pre-tax losses associated withthe three missions.
Potential payments for Other Delta contracts include $85 related to deferred support costs and $91 related to deferred production costs. In June2011, the Defense Contract Management Agency (DCMA) notified ULA that it had determined that $271 of deferred support costs are notrecoverable under government contracts. In December 2011, the DCMA notified ULA of the potential non-recoverability of an additional $114 ofdeferred production costs. ULA and Boeing believe that all costs are recoverable and in November 2011, ULA filed a certified claim with the USAFfor collection of deferred support and production costs. The USAF issued a final decision denying ULA ’s certified claim in May 2012. On June 14,2012, Boeing and ULA filed a suit in the Court of Federal Claims seeking recovery of the deferred support and production costs from the U.S.government. On November 9, 2012, the U.S. government filed an answer to our claim and asserted a counterclaim for credits that it alleges wereoffset by deferred support cost invoices. We believe that the U.S. government’s counterclaim is without merit, and have filed an answer challenging iton multiple grounds. The litigation is in the discovery phase, and the Court has not yet set a trial date. If, contrary to our belief, it is determined thatsome or all of the deferred support or production costs are not recoverable, we could be required to record pre-tax losses and make indemnificationpayments to ULA for up to $317 of the costs questioned by the DCMA.
Other Indemnifications In conjunction with our sales of Electron Dynamic Devices, Inc. and Rocketdyne Propulsion and Power businesses and ourBCA facilities in Wichita, Kansas and Tulsa and McAlester, Oklahoma, we agreed to indemnify, for an indefinite period, the buyers for costs relatingto pre-closing environmental conditions and certain other items. We are unable to assess the potential number of future claims that may be assertedunder these indemnifications, nor the amounts thereof (if any). As a result, we cannot estimate the maximum potential amount of future paymentsunder these indemnities and therefore, no liability has been recorded. To the extent that claims have been made under these indemnities and/or areprobable and reasonably estimable, liabilities associated with these indemnities are included in the environmental liability disclosure in Note 8 .
Credit Guarantees We have issued credit guarantees where we are obligated to make payments to a guaranteed party in the event that the originallessee or debtor does not make payments or perform certain specified services. Generally, these guarantees have been extended on behalf ofguaranteed parties with less than investment-grade credit and are collateralized by certain assets. Current outstanding credit guarantees expirethrough 2036 .
Note 10 – Debt
On February 16, 2017 , we issued $900 of fixed rate senior notes consisting of $300 due March 1, 2022 that bear an annual interest rate of 2.125% ,$300 due March 1, 2027 that bear an annual interest rate of 2.8% , and $300 due March 1, 2047 that bear an annual interest rate of 3.65% . Thenotes are unsecured senior obligations and rank equally in right of payment with our existing and future unsecured and unsubordinatedindebtedness. The net proceeds of the issuance totaled $871 , after deducting underwriting discounts, commissions and offering expenses.
17

Table of Contents
Note 11 – Postretirement Plans
The components of net periodic benefit cost were as follows:
Nine months ended September
30 Three months ended
September 30Pension Plans 2017 2016 2017 2016Service cost $301 $488 $100 $162Interest cost 2,243 2,287 747 761Expected return on plan assets (2,883) (2,998) (961) (1,000)Amortization of prior service (credits)/costs (29) 29 (9) 9Recognized net actuarial loss 603 592 201 198Settlement/curtailment/other losses 1 39 6Net periodic benefit cost $236 $437 $78 $136
Net periodic benefit cost included in Earnings from operations $534 $1,545 $100 $453
Nine months ended September
30 Three months ended
September 30Other Postretirement Benefits 2017 2016 2017 2016Service cost $80 $96 $27 $32Interest cost 171 196 57 66Expected return on plan assets (5) (6) (1) (2)Amortization of prior service credits (102) (94) (34) (32)Recognized net actuarial loss 8 17 2 5Net periodic benefit cost $152 $209 $51 $69
Net periodic benefit cost included in Earnings from operations $201 $213 $58 $63
Required pension contributions under the Employee Retirement Income Security Act, as well as rules governing funding of our non-US pensionplans, are minimal in 2017. During the third quarter of 2017, we contributed $500 in cash and $3,500 in shares of our common stock. Thesecontributions exceed our previously announced plan to contribute approximately $500 to our pension plans in 2017.
Note 12 – Share-Based Compensation and Other Compensation Arrangements
Restricted Stock Units
On February 27, 2017 , we granted to our executives 523,835 restricted stock units ( RSU s) as part of our long-term incentive program with a grantdate fair value of $178.72 per unit. The RSU s granted under this program will vest and settle in common stock (on a one-for-one basis) on the thirdanniversary of the grant date.
Performance-Based Restricted Stock Units
On February 27, 2017 , we granted to our executives 492,273 performance-based restricted stock units ( PBRSU s) as part of our long-termincentive program with a grant date fair value of $190.17 per unit. Compensation expense for the award is recognized over the three -yearperformance period based upon the grant date fair value estimated using a Monte-Carlo simulation model. The model used the followingassumptions: expected volatility of 21.37% based upon historical stock volatility, a risk-free interest rate of 1.46% , and no expected dividend yieldbecause the units earn dividend equivalents.
18

Table of Contents
Performance Awards
On February 27, 2017 , we granted to our executives performance awards as part of our long-term incentive program with a payout based on theachievement of financial goals for the three -year period ending December 31, 2019 . At September 30, 2017 , the minimum payout amount is $0and the maximum amount we could be required to pay out is $353 .
Note 13 – Shareholders' Equity
Accumulated Other Comprehensive Loss
Changes in Accumulated other comprehensive loss (AOCI) by component for the nine and three months ended September 30, 2017 and 2016 wereas follows:
CurrencyTranslation
Adjustments
UnrealizedGains andLosses on
CertainInvestments
UnrealizedGains andLosses onDerivative
Instruments
Defined BenefitPension Plans &
OtherPostretirement
Benefits Total (1)
Balance at January 1, 2016 ($39) ($197) ($12,512) ($12,748)
Other comprehensive (loss)/income before reclassifications (3) 1 54 (384) (332)
Amounts reclassified from AOCI 58 364 (2) 422
Net current period Other comprehensive (loss)/income (3) 1 112 (20) 90
Balance at September 30, 2016 ($42) $1 ($85) ($12,532) ($12,658)
Balance at January 1, 2017 ($143) ($2) ($127) ($13,351) ($13,623)
Other comprehensive income before reclassifications 121 111 1 233
Amounts reclassified from AOCI 44 310 (2) 354
Net current period Other comprehensive income 121 155 311 587
Balance at September 30, 2017 ($22) ($2) $28 ($13,040) ($13,036)
Balance at June 30, 2016 ($32) ($1) ($113) ($12,649) ($12,795)
Other comprehensive (loss)/income before reclassifications (10) 2 13 1 6
Amounts reclassified from AOCI 15 116 (2) 131
Net current period Other comprehensive (loss)/income (10) 2 28 117 137
Balance at September 30, 2016 ($42) $1 ($85) ($12,532) ($12,658)
Balance at June 30, 2017 ($66) ($2) ($22) ($13,144) ($13,234)
Other comprehensive income before reclassifications 44 40 84
Amounts reclassified from AOCI 10 104 (2) 114
Net current period Other comprehensive income 44 50 104 198
Balance at September 30, 2017 ($22) ($2) $28 ($13,040) ($13,036)
(1) Net of tax.(2) Primarily relates to amortization of actuarial losses for the nine and three months ended September 30, 2016 totaling $392 and $131 (net of tax
of ($217) and ($72) ) and for the nine and three months ended September 30, 2017 totaling $394 and $131 (net of tax of ($217) and ($72) ).These are included in the net periodic pension cost of which a portion is allocated to production as inventoried costs.
19

Table of Contents
Note 14 – Derivative Financial Instruments
Cash Flow Hedges
Our cash flow hedges include foreign currency forward contracts and commodity purchase contracts. We use foreign currency forward contracts tomanage currency risk associated with certain transactions, specifically forecasted sales and purchases made in foreign currencies. Our foreigncurrency contracts hedge forecasted transactions through 2024 . We use commodity derivatives, such as fixed-price purchase commitments tohedge against potentially unfavorable price changes for items used in production. Our commodity contracts hedge forecasted transactions through2020 .
Fair Value Hedges
Interest rate swaps under which we agree to pay variable rates of interest are designated as fair value hedges of fixed-rate debt. The net change infair value of the derivatives and the hedged items is reported in Boeing Capital interest expense.
Derivative Instruments Not Receiving Hedge Accounting Treatment
We have entered into agreements to purchase and sell aluminum to address long-term strategic sourcing objectives and international businessrequirements. These agreements are derivative instruments for accounting purposes. The quantities of aluminum in these agreements offset and arepriced at prevailing market prices. We also hold certain foreign currency forward contracts which do not qualify for hedge accounting treatment.
Notional Amounts and Fair Values
The notional amounts and fair values of derivative instruments in the Condensed Consolidated Statements of Financial Position were as follows:
Notional amounts (1) Other assets Accrued liabilities
September 30
2017December 31
2016September 30
2017December 31
2016September 30
2017December 31
2016Derivatives designated as hedging
instruments:
Foreign exchange contracts $2,496 $2,584 $117 $34 ($70) ($225)Interest rate contracts 125 125 4 6Commodity contracts 41 53 2 7 (6) (5)
Derivatives not receiving hedge accountingtreatment:
Foreign exchange contracts 479 465 22 21 (9) (17)
Commodity contracts 557 648
Total derivatives $3,698 $3,875 $145 $68 ($85) ($247)
Netting arrangements (64) (45) 64 45
Net recorded balance $81 $23 ($21) ($202)
(1) Notional amounts represent the gross contract/notional amount of the derivatives outstanding.
20

Table of Contents
Gains/(losses) associated with our cash flow and undesignated hedging transactions and their effect on Other comprehensive income and Netearnings were as follows:
Nine months ended September
30 Three months ended
September 30 2017 2016 2017 2016Effective portion recognized in Other comprehensive income, net of taxes:
Foreign exchange contracts $116 $55 $40 $14Commodity contracts (5) (1) (1)
Effective portion reclassified out of Accumulated other comprehensive lossinto earnings, net of taxes:
Foreign exchange contracts (43) (52) (11) (14)Commodity contracts (1) (6) 1 (1)
Forward points recognized in Other income, net: Foreign exchange contracts 3 8 1 4
Undesignated derivatives recognized in Other income, net: Foreign exchange contracts 6 2 1 2
Based on our portfolio of cash flow hedges, we expect to reclassify losses of $22 (pre-tax) out of Accumulated other comprehensive loss intoearnings during the next 12 months. Ineffectiveness related to our hedges recognized in Other income was insignificant for the nine and threemonths ended September 30, 2017 and 2016 .
We have derivative instruments with credit-risk-related contingent features. For foreign exchange contracts with original maturities of at least fiveyears, our derivative counterparties could require settlement if we default on our five-year credit facility. For certain commodity contracts, ourcounterparties could require collateral posted in an amount determined by our credit ratings. The fair value of foreign exchange and commoditycontracts that have credit-risk-related contingent features that are in a net liability position at September 30, 2017 was $19 . At September 30, 2017 ,there was no collateral posted related to our derivatives.
21

Table of Contents
Note 15 – Fair Value Measurements
The fair value hierarchy has three levels based on the reliability of the inputs used to determine fair value. Level 1 refers to fair values determinedbased on quoted prices in active markets for identical assets. Level 2 refers to fair values estimated using significant other observable inputs andLevel 3 includes fair values estimated using significant unobservable inputs. The following table presents our assets and liabilities that are measuredat fair value on a recurring basis and are categorized using the fair value hierarchy.
September 30, 2017 December 31, 2016 Total Level 1 Level 2 Total Level 1 Level 2Assets Money market funds 2,042 $2,042 $2,858 $2,858 Available-for-sale investments:
Commercial paper 59 $59 162 $162Corporate notes 392 392 271 271U.S. government agencies 47 47 63 63Other 15 15 46 46
Derivatives 81 81 23 23Total assets $2,636 $2,057 $579 $3,423 $2,904 $519
Liabilities Derivatives ($21) ($21) ($202) ($202)Total liabilities ($21) ($21) ($202) ($202)
Money market funds, available-for-sale debt investments and equity securities are valued using a market approach based on the quoted marketprices or broker/dealer quotes of identical or comparable instruments.
Derivatives include foreign currency, commodity and interest rate contracts. Our foreign currency forward contracts are valued using an incomeapproach based on the present value of the forward rate less the contract rate multiplied by the notional amount. Commodity derivatives are valuedusing an income approach based on the present value of the commodity index prices less the contract rate multiplied by the notional amount. Thefair value of our interest rate swaps is derived from a discounted cash flow analysis based on the terms of the contract and the interest rate curve.
Certain assets have been measured at fair value on a nonrecurring basis using significant unobservable inputs (Level 3). The following tablepresents the nonrecurring losses recognized for the nine months ended September 30 due to long-lived asset impairment and the fair value andasset classification of the related assets as of the impairment date:
2017 2016
Fair
Value Total
Losses Fair
Value Total
LossesOperating lease equipment $89 ($31) $54 ($31)Investments 1 (30) Property, plant and equipment 8 (2) (5)Acquired intangible assets 14 (1) 12 (10)Total $112 ($64) $66 ($46)
Investments, Property, plant and equipment, and Acquired intangible assets were primarily valued using an income approach based on thediscounted cash flows associated with the underlying assets. The fair value of the impaired operating lease equipment is derived by calculating amedian collateral value from a consistent group of third party aircraft value publications. The values provided by the third party aircraft publicationsare derived from their knowledge of market trades and other market factors. Management reviews the
22

Table of Contents
publications quarterly to assess the continued appropriateness and consistency with market trends. Under certain circumstances, we adjust valuesbased on the attributes and condition of the specific aircraft or equipment, usually when the features or use of the aircraft vary significantly from themore generic aircraft attributes covered by third party publications, or on the expected net sales price for the aircraft.
For Level 3 assets that were measured at fair value on a nonrecurring basis during the nine months ended September 30, 2017 , the following tablepresents the fair value of those assets as of the measurement date, valuation techniques and related unobservable inputs of those assets.
Fair
Value Valuation
Technique(s) Unobservable Input Range
Median or Average
Operating lease equipment $89
Market approach Aircraft value publications
$141 - $190 (1)
Median $166
Aircraft condition
adjustments ($77) - $0 (2)
Net ($77)(1) The range represents the sum of the highest and lowest values for all aircraft subject to fair value measurement, according to the third party
aircraft valuation publications that we use in our valuation process.(2) The negative amount represents the sum for all aircraft subject to fair value measurement, of all downward adjustments based on consideration
of individual aircraft attributes and condition. The positive amount represents the sum of all such upward adjustments.
Fair Value Disclosures
The fair values and related carrying values of financial instruments that are not required to be remeasured at fair value on the CondensedConsolidated Statements of Financial Position were as follows:
September 30, 2017
CarryingAmount
Total FairValue Level 1 Level 2 Level 3
Assets Notes receivable, net $762 $771 $771
Liabilities Debt, excluding capital lease obligations (10,635) (12,180) (12,075) ($105)
December 31, 2016
CarryingAmount
Total FairValue Level 1 Level 2 Level 3
Assets Notes receivable, net $807 $803 $803
Liabilities Debt, excluding capital lease obligations (9,815) (11,209) (11,078) ($131)
The fair values of notes receivable are estimated with discounted cash flow analysis using interest rates currently offered on loans with similar termsto borrowers of similar credit quality. The fair value of our debt that is traded in the secondary market is classified as Level 2 and is based on currentmarket yields. For our debt that is not traded in the secondary market, the fair value is classified as Level 2 and is based on our indicative borrowingcost derived from dealer quotes or discounted cash flows. The fair values of our debt classified as Level 3 are based on discounted cash flowmodels using the implied yield from similar securities. With regard to other financial instruments with off-balance sheet risk, it is not practicable toestimate the fair value of our indemnifications and financing commitments because the amount and timing of those arrangements are uncertain.Items not included in the above disclosures include cash, restricted cash, time deposits and other deposits, commercial paper, money market funds,Accounts receivable, Accounts payable
23

Table of Contents
and long-term payables. The carrying values of those items, as reflected in the Condensed Consolidated Statements of Financial Position,approximate their fair value at September 30, 2017 and December 31, 2016 . The fair value of assets and liabilities whose carrying valueapproximates fair value is determined using Level 2 inputs, with the exception of cash (Level 1).
Note 16 – Legal Proceedings
Various legal proceedings, claims and investigations related to products, contracts, employment and other matters are pending against us.
In addition, we are subject to various U.S. government inquiries and investigations from which civil, criminal or administrative proceedings couldresult or have resulted in the past. Such proceedings involve or could involve claims by the government for fines, penalties, compensatory and trebledamages, restitution and/or forfeitures. Under government regulations, a company, or one or more of its operating divisions or subdivisions, can alsobe suspended or debarred from government contracts, or lose its export privileges, based on the results of investigations. We believe, based uponcurrent information, that the outcome of any such legal proceeding, claim, or government dispute and investigation will not have a material effect onour financial position, results of operations, or cash flows.
Note 17 – Segment Information
Our primary profitability measurements to review a segment’s operating results are Earnings from operations and operating margins. See page 6 fora Summary of Business Segment Data, which is an integral part of this note.
Effective July 1, 2017, we now operate in four reportable segments: BCA, BDS, BGS, and BCC. The new segment, BGS, brings together theCommercial Aviation Services businesses, previously included in the BCA segment, and certain BDS businesses (primarily those previouslyincluded in the Global Services & Support segment). Prior year numbers have been revised to conform to the current segment presentation.
BCA develops, produces and markets commercial jet aircraft, principally to the commercial airline industry worldwide.
BDS is engaged in the research, development, production and modification of the following products and related services: manned and unmannedmilitary aircraft and weapons systems, surveillance and engagement, strategic defense and intelligence systems, satellite systems and spaceexploration.
BGS provides parts, maintenance, modifications, logistics support, training, data analytics and information-based services to commercial andgovernment customers worldwide.
BCC facilitates, arranges, structures and provides selective financing solutions for our Boeing customers.
Unallocated items, eliminations and other include common internal services that support Boeing’s global business operations, intercompanyguarantees provided to BCC and eliminations of certain sales between segments. Intersegment revenues, eliminated in Unallocated items,eliminations and other, are shown in the following table.
Nine months ended September 30 Three months ended
September 30 2017 2016 2017 2016Commercial Airplanes $1,224 $1,668 $325 $949Global Services 38 53 12 17Boeing Capital 23 13 13 4Total $1,285 $1,734 $350 $970
24

Table of Contents
Unallocated Items, Eliminations and other
Unallocated items, eliminations and other includes costs not attributable to business segments as well as intercompany profit eliminations. Wegenerally allocate costs to business segments based on the U.S. federal cost accounting standards. Components of Unallocated items, eliminationsand other are shown in the following table.
Nine months ended September 30 Three months ended
September 302017 2016 2017 2016
Share-based plans ($67) ($50) ($21) ($9)Deferred compensation (174) (38) (78) (33)Amortization of previously capitalized interest (72) (71) (21) (23)Eliminations and other unallocated items (437) (333) (78) (135)Sub-total (750) (492) (198) (200)Pension 808 129 275 50Postretirement 146 122 41 38Pension and Postretirement 954 251 316 88Total $204 ($241) $118 ($112)
Unallocated Pension and Other Postretirement Benefit Expense
Unallocated pension and other postretirement benefit expense represent the portion of pension and other postretirement benefit costs that are notrecognized by business segments for segment reporting purposes. Pension costs, comprising GAAP service and prior service costs, are allocated toBCA and the commercial operations at BGS. Pension costs are allocated to BDS and BGS businesses supporting government customers using U.S.Government Cost Accounting Standards ( CAS ), which employ different actuarial assumptions and accounting conventions than GAAP . Thesecosts are allocable to government contracts. Other postretirement benefit costs are allocated to business segments based on CAS , which isgenerally based on benefits paid.
Assets
Segment assets are summarized in the table below:
September 30
2017 December 31
2016Commercial Airplanes $46,755 $46,745Defense, Space & Security 15,279 14,123Global Services 12,144 11,490Boeing Capital 3,530 4,139Unallocated items, eliminations and other 13,299 13,500Total $91,007 $89,997
Assets included in Unallocated items, eliminations and other primarily consist of Cash and cash equivalents, Short-term and other investments,Deferred tax assets, capitalized interest and assets held centrally as well as intercompany eliminations.
25

Table of Contents
Goodwill
Segment goodwill balances are summarized in the table below:
September 30,
2017 December 31,
2016Commercial Airplanes $992 $992Defense, Space & Security 2,860 2,854Global Services 1,492 1,478Total $5,344 $5,324
As a result of the change in our reportable segments, we reallocated goodwill to our new reporting units using a relative fair value approach. Weevaluated goodwill for impairment at July 1, 2017 and determined that no impairment existed.
26

Table of Contents
REPORT OF INDEPENDENT REGISTERED PUBLIC ACCOUNTING FIRM
To the Board of Directors and Shareholders ofThe Boeing CompanyChicago, Illinois
We have reviewed the accompanying condensed consolidated statement of financial position of The Boeing Company and subsidiaries (the“Company”) as of September 30, 2017 , and the related condensed consolidated statements of operations and comprehensive income for the three-month and nine-month periods ended September 30, 2017 and 2016 and the related condensed consolidated statements of cash flows and equityfor the nine-month periods ended September 30, 2017 and 2016 . These interim financial statements are the responsibility of the Company’smanagement.
We conducted our reviews in accordance with the standards of the Public Company Accounting Oversight Board (United States). A review of interimfinancial information consists principally of applying analytical procedures and making inquiries of persons responsible for financial and accountingmatters. It is substantially less in scope than an audit conducted in accordance with the standards of the Public Company Accounting OversightBoard (United States), the objective of which is the expression of an opinion regarding the financial statements taken as a whole. Accordingly, we donot express such an opinion.
Based on our reviews, we are not aware of any material modifications that should be made to such condensed consolidated interim financialstatements for them to be in conformity with accounting principles generally accepted in the United States of America.
We have previously audited, in accordance with the standards of the Public Company Accounting Oversight Board (United States), the consolidatedstatement of financial position of the Company as of December 31, 2016 , and the related consolidated statements of operations, comprehensiveincome, equity, and cash flows for the year then ended (not presented herein); and in our report dated February 8, 2017, we expressed anunqualified opinion on those consolidated financial statements. In our opinion, the information set forth in the accompanying condensed consolidatedstatement of financial position as of December 31, 2016 is fairly stated, in all material respects, in relation to the consolidated statement of financialposition from which it has been derived.
/s/ Deloitte & Touche LLP
Chicago, Illinois
October 25, 2017
27

Table of Contents
FORWARD-LOOKING STATEMENTSThis report contains “forward-looking statements” within the meaning of the Private Securities Litigation Reform Act of 1995. Words such as “may,”“should,” “expects,” “intends,” “projects,” “plans,” “believes,” “estimates,” “targets,” “anticipates” and similar expressions are used to identify theseforward-looking statements. Examples of forward-looking statements include statements relating to our future financial condition and operatingresults, as well as any other statement that does not directly relate to any historical or current fact.
Forward-looking statements are based on our current expectations and assumptions, which may not prove to be accurate. These statements arenot guarantees and are subject to risks, uncertainties and changes in circumstances that are difficult to predict. Many factors could cause actualresults to differ materially and adversely from these forward-looking statements. Among these factors are risks related to: (1) general conditions in the economy and our industry, including those due to regulatory changes; (2) our reliance on our commercial airline customers; (3) the overall health of our aircraft production system, planned production rate increases across multiple commercial airline programs, our
commercial development and derivative aircraft programs, and our aircraft being subject to stringent performance and reliabilitystandards;
(4) changing budget and appropriation levels and acquisition priorities of the U.S. government; (5) our dependence on U.S. government contracts; (6) our reliance on fixed-price contracts; (7) our reliance on cost-type contracts; (8) uncertainties concerning contracts that include in-orbit incentive payments; (9) our dependence on our subcontractors and suppliers as well as the availability of raw materials; (10) changes in accounting estimates; (11) changes in the competitive landscape in our markets; (12) our non-U.S. operations, including sales to non-U.S. customers; (13) potential adverse developments in new or pending litigation and/or government investigations; (14) customer and aircraft concentration in Boeing Capital’s customer financing portfolio; (15) changes in our ability to obtain debt on commercially reasonable terms and at competitive rates in order to fund our operations and
contractual commitments; (16) realizing the anticipated benefits of mergers, acquisitions, joint ventures, strategic alliances or divestitures; (17) the adequacy of our insurance coverage to cover significant risk exposures;
28

Table of Contents
(18) potential business disruptions, including those related to physical security threats, information technology or cyber attacks, epidemics,sanctions or natural disasters;
(19) work stoppages or other labor disruptions; (20) significant changes in discount rates and actual investment return on pension assets; (21) potential environmental liabilities; and (22) threats to the security of our or our customers’ information.
Additional information concerning these and other factors can be found in our filings with the Securities and Exchange Commission, including the“Risk Factors” on pages 6 through 14 of our most recent Annual Report on Form 10-K, “Management’s Discussion and Analysis of FinancialCondition and Results of Operations” and the notes to our Condensed Consolidated Financial Statements included in this Quarterly Report on Form10-Q and Current Reports on Form 8-K. Any forward-looking information speaks only as of the date on which it is made, and we assume noobligation to update or revise any forward-looking statement whether as a result of new information, future events or otherwise, except as requiredby law.
29

Table of Contents
Item 2. Management’s Discussion and Analysis of Financial Condition and Results of Operations
Consolidated Results of Operations and Financial Condition
Earnings From Operations and Core Operating Earnings (Non-GAAP) The following table summarizes key indicators of consolidated results ofoperations:
(Dollars in millions, except per share data)Nine months ended September
30 Three months ended September 302017 2016 2017 2016
Revenues $68,024 $71,285 $24,309 $23,898 GAAP Earnings from operations $7,248 $3,651 $2,689 $2,282Operating margins 10.7% 5.1% 11.1% 9.5 %Effective income tax rate 28.4% 5.8% 30.0% (3.4)%Net earnings $5,065 $3,264 $1,853 $2,279Diluted earnings per share $8.27 $5.04 $3.06 $3.60
Non-GAAP (1) Core operating earnings $6,294 $3,400 $2,373 $2,194Core operating margins 9.3% 4.8% 9.8% 9.2%Core earnings per share $7.26 $4.79 $2.72 $3.51(1) These measures exclude certain components of pension and other postretirement benefit expense. See page 45 for important information about
these non-GAAP measures and reconciliations to the most comparable GAAP measures.
Revenues
The following table summarizes Revenues:
(Dollars in millions)Nine months ended September
30 Three months ended
September 302017 2016 2017 2016
Commercial Airplanes $41,263 $43,630 $14,982 $15,200Defense, Space & Security 15,520 17,281 5,470 5,751Global Services 10,638 10,508 3,568 3,506Boeing Capital 234 211 70 63Unallocated items, eliminations and other 369 (345) 219 (622)Total $68,024 $71,285 $24,309 $23,898
Revenues for the nine months ended September 30, 2017 decreased by $3,261 million compared with the same period in 2016 . CommercialAirplanes ( BCA ) revenues decreased by $2,367 million primarily due to fewer deliveries and Defense, Space & Security ( BDS ) revenuesdecreased by $1,761 million primarily due to fewer C-17 deliveries. The decrease in revenue at BCA and BDS for the nine-month period waspartially offset by changes in unallocated items and eliminations, which primarily reflect the timing of eliminations for intercompany aircraft deliveriesand the sale of aircraft previously leased to customers.
Revenues for the three months ended September 30, 2017 increased by $411 million compared with the same period in 2016 . BCA revenuesdecreased by $218 million primarily driven by the mix of airplane deliveries - revenues from higher single aisle deliveries were more than offset bylower twin aisle deliveries. BDS revenues decreased by $281 million due to lower revenues on the KC-46A Tanker program and the mix of deliverieson the Chinook, Apache and F-15 programs, partially offset by higher volume on various
30

Table of Contents
weapons programs. The decrease in revenue at BCA and BDS for the three-month period was more than offset by changes in unallocated items andeliminations, which primarily reflect the timing of eliminations for intercompany aircraft deliveries and the sale of aircraft previously leased tocustomers.
Earnings From Operations
The following table summarizes Earnings from operations:
(Dollars in millions)Nine months ended September
30 Three months ended
September 302017 2016 2017 2016
Commercial Airplanes $3,648 $804 $1,483 $1,293Defense, Space & Security 1,670 1,443 559 564Global Services 1,639 1,609 506 524Boeing Capital 87 36 23 13Unallocated pension and other postretirement benefit income 954 251 316 88Other unallocated items and eliminations (750) (492) (198) (200)Earnings from operations (GAAP) $7,248 $3,651 $2,689 $2,282
Unallocated pension and other postretirement benefit income (954) (251) (316) (88)Core operating earnings (Non-GAAP) $6,294 $3,400 $2,373 $2,194
Earnings from operations for the nine months ended September 30, 2017 increased by $3,597 million compared with the same period in 2016 ,primarily due to higher earnings at BCA and BDS and higher unallocated pension income, which more than offset other unallocated items andeliminations. BCA's 2017 earnings reflect lower reach-forward losses on the KC-46A Tanker program, as well as the absence of 747 program reach-forward losses and reclassification of 787 flight test aircraft inventory costs of $1,235 million to research and development expense.
Earnings from operations for the nine months ended September 30, 2017 included reach-forward losses related to the KC-46A Tanker program of$471 million , of which $374 million was recorded at BCA and $97 million was recorded at BDS. During the nine months ended September 30 , 2016we recorded reach-forward losses of $1,258 million related to the 747 program at BCA , and reach-forward losses of $816 million on the KC-46ATanker program of which $529 million was recorded at BCA and $287 million at BDS.
Earnings from operations for the three months ended September 30, 2017 increased by $407 million compared with the same period in 2016,primarily due to higher earnings at BCA and higher unallocated pension income, which more than offset reach-forward losses on the KC-46A Tankerprogram. During the third quarter of 2017, we recorded reach-forward losses of $256 million at BCA and $73 million at BDS related to the KC-46ATanker program.
Core operating earnings for the nine months ended September 30, 2017 increased by $2,894 million compared with the same period in 2016primarily due to lower reach-forward losses and the $1,235 million of research and development expense associated with the 787 flight test aircraftreclassification recorded in 2016. Core operating earnings for the three months ended September 30, 2017 increased $179 million compared withthe same period in 2016 primarily due to higher earnings at BCA.
31

Table of Contents
Unallocated Items, Eliminations and Other The most significant items included in Unallocated items, eliminations and other are shown in thefollowing table:
(Dollars in millions)Nine months ended September
30 Three months ended
September 302017 2016 2017 2016
Share-based plans ($67) ($50) ($21) ($9)Deferred compensation (174) (38) (78) (33)Eliminations and other unallocated items (509) (404) (99) (158)
Sub-total (included in core operating earnings*) (750) (492) (198) (200)Pension 808 129 275 50Postretirement 146 122 41 38
Pension and other postretirement benefit income(excluded from coreoperating earnings*) 954 251 316 88
Total $204 ($241) $118 ($112)
* Core operating earnings is a Non-GAAP measure that excludes certain components of pension and postretirement benefit expense. See page 45 .
The deferred compensation expense increased by $136 million and $45 million for the nine and three months ended September 30, 2017 comparedwith the same periods in 2016 primarily driven by increases in our stock price and broad market conditions.
Eliminations and other unallocated items increased by $105 million for the nine months ended September 30, 2017 , and decreased by $59 millionfor the three months ended September 30, 2017 compared with the same periods in 2016 primarily due to the timing of expense allocations and theelimination of profit on intercompany aircraft deliveries.
The components of net periodic benefit cost are shown in the following table:
(Dollars in millions)Nine months ended September
30 Three months ended
September 30Pension Plans 2017 2016 2017 2016Service cost $301 $488 $100 $162Interest cost 2,243 2,287 747 761Expected return on plan assets (2,883) (2,998) (961) (1,000)Amortization of prior service (credits)/costs (29) 29 (9) 9Recognized net actuarial loss 603 592 201 198Settlement/curtailment/other losses 1 39 6Net periodic benefit cost $236 $437 $78 $136
The decrease in net periodic pension benefit cost for the nine and three months ended September 30, 2017 of $201 million and $58 millioncompared with the same periods in 2016 is primarily due to lower service costs due to the transition of additional employees to defined contributionretirement savings plans.
32

Table of Contents
A portion of net periodic benefit cost is recognized in Earnings from operations in the period incurred and the remainder is included in inventory atthe end of the reporting period and recorded in Earnings from operations in subsequent periods. Net periodic pension benefit costs included inEarnings from operations were as follows:
(Dollars in millions)Nine months ended September
30 Three months ended
September 30Pension Plans 2017 2016 2017 2016Allocated to business segments ($1,342) ($1,674) ($375) ($503)Unallocated items, Eliminations and other 808 129 275 50Total ($534) ($1,545) ($100) ($453)
The higher unallocated pension benefit recognized in earnings reflects the amortization of pension benefits capitalized as inventory in prior years.
Other Earnings Items
(Dollars in millions)Nine months ended September
30 Three months ended
September 302017 2016 2017 2016
Earnings from operations $7,248 $3,651 $2,689 $2,282Other income, net 94 41 45 2Interest and debt expense (267) (227) (87) (81)Earnings from operations 7,075 3,465 2,647 2,203Income tax (expense)/benefit (2,010) (201) (794) 76Net earnings from continuing operations $5,065 $3,264 $1,853 $2,279
Other income, net increased by $53 million and $43 million during the nine and three months ended September 30, 2017 , primarily due to highergains from foreign exchange and interest income.
For discussion related to Income Taxes, see Note 3 to our Condensed Consolidated Financial Statements.
Total Costs and Expenses (“Cost of Sales”)
Cost of sales, for both products and services, consists primarily of raw materials, parts, sub-assemblies, labor, overhead and subcontracting costs.Our BCA segment predominantly uses program accounting to account for cost of sales while BDS predominantly uses contract accounting. BGSuses contract accounting for portions of its business. Under program accounting, cost of sales for each commercial airplane program equals theproduct of (i) revenue recognized in connection with customer deliveries and (ii) the estimated cost of sales percentage applicable to the totalremaining program. Under contract accounting, the amount reported as cost of sales is determined by applying the estimated cost of salespercentage to the amount of revenue recognized. The following table summarizes cost of sales:
(Dollars in millions) Nine months ended September 30 Three months ended September
30 2017 2016 Change 2017 2016 Change
Cost of sales $55,639 $61,326 ($5,687) $19,987 $19,904 $83Cost of sales as a % of Revenues 81.8% 86.0% (4.2%) 82.2% 83.3% (1.1)%
Cost of sales for the nine months ended September 30, 2017 decreased by $5,687 million , or 9.3% compared with the same period in 2016 ,primarily due to lower volume and lower reach-forward losses. Cost of sales for the three months ended September 30, 2017 increased by $83million compared with the same period in 2016 , primarily due to higher reach-forward losses.
33

Table of Contents
Research and Development The following table summarizes our Research and development expense:
(Dollars in millions)Nine months ended September
30 Three months ended
September 302017 2016 2017 2016
Commercial Airplanes $1,755 $3,152 $538 $633Defense, Space & Security 599 666 207 201Global Services 101 126 38 41Other (37) (43) (16) (18)Total $2,418 $3,901 $767 $857
Research and development expense for the nine months ended September 30, 2017 decreased by $1,483 million compared with the same period in2016 . The decrease at BCA is primarily due to the reclassification of $1,235 million of costs from inventory in the second quarter of 2016 related tothe fourth and fifth 787 flight test aircraft as well as lower spending on the 737 MAX and 787-10. The decrease of $90 million during the threemonths ended September 30, 2017 is primarily attributable to lower spending at BCA on the 737 MAX and 777X.
Backlog The following table summarizes our backlog:
Total Backlog (Dollars in millions)September 30
2017 December 31
2016Commercial Airplanes $412,185 $413,036Defense, Space & Security $45,852 $44,825Global Services $16,251 $15,631Total Backlog $474,288 $473,492
Contractual backlog $459,871 $458,277Unobligated backlog 14,417 15,215Total Backlog $474,288 $473,492
Contractual backlog of unfilled orders excludes purchase options, announced orders for which definitive contracts have not been executed, andunobligated U.S. and non-U.S. government contract funding. The increase during the nine months ended September 30, 2017 was primarily due toorders and funding in excess of deliveries.
Unobligated backlog includes U.S. and non-U.S. government definitive contracts for which funding has not been authorized. The decrease duringthe nine months ended September 30, 2017 was primarily due to reclassifications to contractual backlog related to BDS and BGS contracts, partiallyoffset by contract awards.
Additional Considerations
KC-46A Tanker In 2011, we were awarded a contract from the U.S. Air Force ( USAF ) to design, develop, manufacture and deliver four nextgeneration aerial refueling tankers. The KC-46A Tanker is a derivative of our 767 commercial aircraft. This Engineering, Manufacturing andDevelopment (EMD) contract is a fixed-price incentive fee contract valued at $4.9 billion and involves highly complex designs and systemsintegration. The EMD contract is currently in the certification and flight testing phases. In 2015, we began work on low rate initial production (LRIP)aircraft for the USAF. During the third quarter of 2016, following our achievement of key flight testing milestones, the USAF authorized two LRIP lotsfor 7 and 12 aircraft valued at $2.8 billion. On January 27, 2017, the USAF authorized an additional LRIP lot for 15 aircraft valued at $2.1 billion. If alloptions under the contract are exercised, we expect to deliver 179 aircraft for a total expected contract value of approximately $30 billion. We nowexpect 18 fully operational aircraft to be delivered in 2018.
34

Table of Contents
During 2016, we recorded reach-forward losses of $1,128 million related to the EMD contract and LRIP aircraft. During the first quarter of 2017, werecorded further reach-forward losses of $142 million primarily reflecting higher estimated costs associated with certification and incorporatingchanges into LRIP aircraft. During the third quarter of 2017, we recorded additional reach-forward losses of $329 million, primarily reflecting furtherincreases in estimated costs associated with certification and incorporating changes into LRIP aircraft. As with any development program, thisprogram remains subject to additional reach-forward losses or delivery delays if we experience further production, technical or quality issues, delaysin certification and/or flight testing.Russia/Ukraine We continue to monitor political unrest involving Russia and Ukraine, where we and some of our suppliers source titanium productsand/or have operations. A number of our commercial customers also have operations in Russia and Ukraine. To date, we have not experienced anysignificant disruptions to production or deliveries. Should suppliers or customers experience disruption, our production and/or deliveries could bematerially impacted.
Export-Import Bank of the United States Many of our non-U.S. customers finance purchases through the Export-Import Bank of the United States.Following the expiration of the bank’s charter on June 30, 2015, the bank’s charter was reauthorized in December 2015. The bank is now authorizedthrough September 30, 2019. However, until the U.S. Senate confirms members sufficient to reconstitute a quorum of the bank’s board of directors,the bank will not be able to approve any transaction totaling more than $10 million. As a result, we may fund additional commitments and/or enterinto new financing arrangements with customers. Certain of our non-U.S. customers also may seek to delay purchases if they cannot obtainfinancing at reasonable costs, and there may be further impacts with respect to future sales campaigns involving non-U.S. customers. We continueto work with our customers to mitigate risks associated with the lack of a quorum of the bank’s board of directors and assist with alternative thirdparty financing sources.
Segment Results of Operations and Financial Condition
Commercial Airplanes
Business Environments and Trends
Airline Industry Environment Our updated 20-year forecast, published in June 2017, projects a long-term average growth rate of 4.7% per year forpassenger traffic and 4.2% for cargo traffic. Based on long-term global economic growth projections of 2.8% average annual GDP growth, we projecta $6.1 trillion market for 41,030 new airplanes over the next 20 years.
Results of Operations
(Dollars in millions) Nine months ended September 30 Three months ended September 302017 2016 2017 2016
Revenues $41,263 $43,630 $14,982 $15,200Earnings from operations: $3,648 $804 $1,483 $1,293Operating margins 8.8% 1.8% 9.9% 8.5%
Revenues
Revenues for the nine months ended September 30, 2017 decreased by $2,367 million , or 5% , compared with the same period in 2016 primarilydue to fewer deliveries. Revenues for the three months ended September 30, 2017 decreased by $218 million , compared with the same period in2016 primarily due to delivery mix, with fewer twin aisle deliveries more than offsetting the impact of higher single aisle deliveries.
35

Table of Contents
Commercial airplane deliveries, including intercompany deliveries, were as follows:
737 * 747†
767 777 787 TotalDeliveries during the first nine months of 2017 381 (13) 8 (1) 7 58 100 554Deliveries during the first nine months of 2016 368 (15) 8 (3) 10 73 104 563Deliveries during the third quarter of 2017 145 (4) 4 2 16 35 202Deliveries during the third quarter of 2016 120 (6) 5 (3) 5 22 36 188Cumulative deliveries as of 9/30/2017 6,584 1,536 1,103 1,518 600 Cumulative deliveries as of 12/31/2016 6,203 1,528 1,096 1,460 500
* Intercompany deliveries identified by parentheses† Aircraft accounted for as revenues by BCA and as operating leases in consolidation identified by parentheses
Earnings From Operations
Earnings from operations for the nine months ended September 30, 2017 increased by $2,844 million compared with the same period in 2016primarily due to lower reach-forward losses, lower research and development costs and improved margins reflecting favorable cost performance,which more than offset the impact of lower revenues.
Reach-forward losses for the nine months ended September 30, 2017 and 2016 include $374 million and $529 million related to the KC-46A Tankerprogram. In addition, reach-forward losses for the nine months ended September 30, 2016 include $1,258 million related to the 747 program.Research and development expense in 2016 reflects the reclassification from inventory of $1,235 million related to the fourth and fifth 787 flight testaircraft.
Earnings from operations for the three months ended September 30, 2017 increased by $190 million compared with the same period in 2016 ,primarily due to favorable cost performance and higher margins on the 787 program, partially offset by a $256 million reach-forward loss related toKC-46A Tanker program. The higher margin on the 787 program reflected the increase in the accounting quantity from 1,300 to 1,400 and improvedcost performance.
Backlog
BCA total backlog decreased from $413,036 million as of December 31, 2016 to $412,185 million at September 30, 2017 primarily due to deliveriesin excess of orders.
36
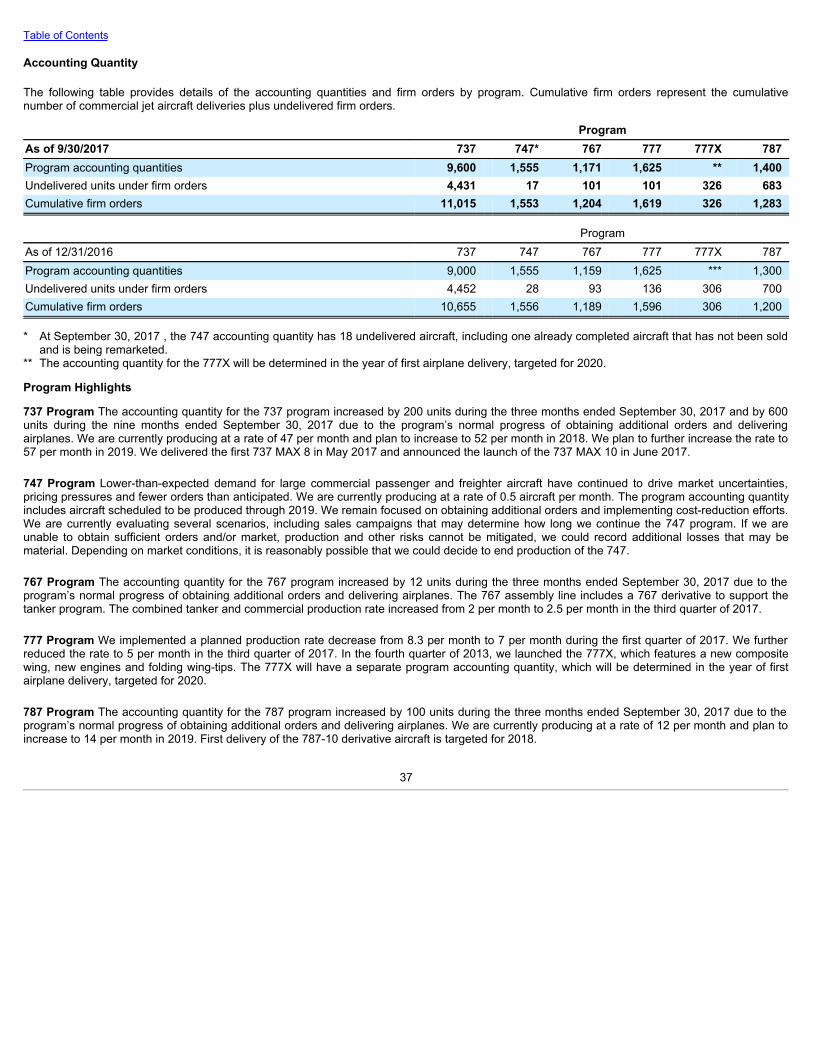
Table of Contents
Accounting Quantity
The following table provides details of the accounting quantities and firm orders by program. Cumulative firm orders represent the cumulativenumber of commercial jet aircraft deliveries plus undelivered firm orders.
ProgramAs of 9/30/2017 737 747* 767 777 777X 787Program accounting quantities 9,600 1,555 1,171 1,625 ** 1,400Undelivered units under firm orders 4,431 17 101 101 326 683Cumulative firm orders 11,015 1,553 1,204 1,619 326 1,283
ProgramAs of 12/31/2016 737 747 767 777 777X 787Program accounting quantities 9,000 1,555 1,159 1,625 *** 1,300Undelivered units under firm orders 4,452 28 93 136 306 700Cumulative firm orders 10,655 1,556 1,189 1,596 306 1,200
* At September 30, 2017 , the 747 accounting quantity has 18 undelivered aircraft, including one already completed aircraft that has not been soldand is being remarketed.
** The accounting quantity for the 777X will be determined in the year of first airplane delivery, targeted for 2020.
Program Highlights
737 Program The accounting quantity for the 737 program increased by 200 units during the three months ended September 30, 2017 and by 600units during the nine months ended September 30, 2017 due to the program’s normal progress of obtaining additional orders and deliveringairplanes. We are currently producing at a rate of 47 per month and plan to increase to 52 per month in 2018. We plan to further increase the rate to57 per month in 2019. We delivered the first 737 MAX 8 in May 2017 and announced the launch of the 737 MAX 10 in June 2017.
747 Program Lower-than-expected demand for large commercial passenger and freighter aircraft have continued to drive market uncertainties,pricing pressures and fewer orders than anticipated. We are currently producing at a rate of 0.5 aircraft per month. The program accounting quantityincludes aircraft scheduled to be produced through 2019. We remain focused on obtaining additional orders and implementing cost-reduction efforts.We are currently evaluating several scenarios, including sales campaigns that may determine how long we continue the 747 program. If we areunable to obtain sufficient orders and/or market, production and other risks cannot be mitigated, we could record additional losses that may bematerial. Depending on market conditions, it is reasonably possible that we could decide to end production of the 747.
767 Program The accounting quantity for the 767 program increased by 12 units during the three months ended September 30, 2017 due to theprogram’s normal progress of obtaining additional orders and delivering airplanes. The 767 assembly line includes a 767 derivative to support thetanker program. The combined tanker and commercial production rate increased from 2 per month to 2.5 per month in the third quarter of 2017.
777 Program We implemented a planned production rate decrease from 8.3 per month to 7 per month during the first quarter of 2017. We furtherreduced the rate to 5 per month in the third quarter of 2017. In the fourth quarter of 2013, we launched the 777X, which features a new compositewing, new engines and folding wing-tips. The 777X will have a separate program accounting quantity, which will be determined in the year of firstairplane delivery, targeted for 2020.
787 Program The accounting quantity for the 787 program increased by 100 units during the three months ended September 30, 2017 due to theprogram’s normal progress of obtaining additional orders and delivering airplanes. We are currently producing at a rate of 12 per month and plan toincrease to 14 per month in 2019. First delivery of the 787-10 derivative aircraft is targeted for 2018.
37
Table of Contents
Additional Considerations
The development and ongoing production of commercial aircraft is extremely complex, involving extensive coordination and integration withsuppliers and highly-skilled labor from thousands of employees and other partners. Meeting or exceeding our performance and reliability standards,as well as those of customers and regulators, can be costly and technologically challenging. In addition, the introduction of new aircraft andderivatives, such as the 787-10, 737 MAX and 777X, involves increased risks associated with meeting development, production and certificationschedules. As a result, our ability to deliver aircraft on time, satisfy performance and reliability standards and achieve or maintain, as applicable,program profitability is subject to significant risks. Factors that could result in lower margins (or a material charge if an airplane program has or isdetermined to have reach-forward losses) include the following: changes to the program accounting quantity, customer and model mix, productioncosts and rates, changes to price escalation factors due to changes in the inflation rate or other economic indicators, performance or reliabilityissues involving completed aircraft, capital expenditures and other costs associated with increasing or adding new production capacity, learningcurve, additional change incorporation, achieving anticipated cost reductions, flight test and certification schedules, costs, schedule and demand fornew airplanes and derivatives and status of customer claims, supplier assertions and other contractual negotiations. While we believe the cost andrevenue estimates incorporated in the consolidated financial statements are appropriate, the technical complexity of our airplane programs createsfinancial risk as additional completion costs may become necessary or scheduled delivery dates could be extended, which could trigger terminationprovisions, order cancellations or other financially significant exposure.
Defense, Space & Security
Business Environment and Trends
United States Government Defense Environment Overview
In May 2017, the U.S. administration submitted its fiscal year 2018 budget request, which calls for funding the U.S. Department of Defense (U.S.DoD) base budget at a level that is $52 billion or 10% above the spending caps in the Budget Control Act of 2011 (The Act). In addition, three of thefour congressional defense oversight committees have endorsed a U.S. DoD budget topline that is higher than the administration’s fiscal year 2018request. However, The Act, which mandates limits on U.S. government discretionary spending, remains in effect through fiscal year 2021. As aresult, continued budget uncertainty and the risk of future sequestration cuts will remain unless The Act is repealed or significantly modified byCongress.
Funding timeliness also remains a risk. In September 2017, a Continuing Resolution was enacted that extends U.S. government funding at fiscalyear 2017 rates through December 8, 2017. If Congress is unable to pass appropriations bills before the expiration of the current ContinuingResolution, a government shutdown could result which may have impacts above and beyond those resulting from budget cuts, sequestrationimpacts or program-level appropriations. For example, requirements to furlough employees in the U.S. DoD, the Department of Transportation, orother government agencies could result in payment delays, impair our ability to perform work on existing contracts, and/or negatively impact futureorders. Alternatively, Congress may fund the remainder of fiscal year 2018 by passing one or more Continuing Resolutions; however, this couldrestrict the execution of certain program activities and delay new programs or competitions.
In addition, there continues to be uncertainty with respect to program-level appropriations for the U.S. DoD and other government agencies,including the National Aeronautics and Space Administration (NASA), within the overall budgetary framework described above. Future budget cutsor investment priority changes could result in reductions, cancellations and/or delays of existing contracts or programs. Any of these impacts couldhave a material effect on the results of the Company’s operations, financial position and/or cash flows.
38

Table of Contents
Results of Operations
(Dollars in millions) Nine months ended September 30 Three months ended September
302017 2016 2017 2016
Revenues $15,520 $17,281 $5,470 $5,751Earnings from operations $1,670 $1,443 $559 $564Operating margins 10.8% 8.4% 10.2% 9.8%
Since our operating cycle is long-term and involves many different types of development and production contracts with varying delivery andmilestone schedules, the operating results of a particular period may not be indicative of future operating results. In addition, depending on thecustomer and their funding sources, our orders might be structured as annual follow-on contracts, or as one large multi-year order or long-termaward. As a result, period-to-period comparisons of backlog are not necessarily indicative of future workloads. The following discussions ofcomparative results among periods should be viewed in this context.
Deliveries of units for new-build production aircraft, including remanufactures and modifications, were as follows:
Nine months ended September
30 Three months ended
September 302017 2016 2017 2016
F/A-18 Models 18 20 6 6F-15 Models 11 11 4 4C-17 Globemaster III 4 CH-47 Chinook (New) 6 17 2 7CH-47 Chinook (Renewed) 28 23 9 7AH-64 Apache (New) 8 25 3 10AH-64 Apache (Remanufactured) 43 27 15 9P-8 Models 14 13 5 4Total 128 140 44 47
Revenues
BDS revenues for the nine months ended September 30, 2017 decreased by $1,761 million compared with the same period in 2016 primarily due tofewer C-17 deliveries and the mix of deliveries on the Apache and F-15 programs. The decrease was partially offset by higher volume on variousweapons programs.
BDS revenues for the three months ended September 30, 2017 decreased by $281 million compared with the same period in 2016 . The decreasewas primarily due to lower revenues related to KC-46A Tanker program milestones and delivery mix on the Chinook, Apache and F-15 programs,partially offset by higher volume on various weapons programs.
Earnings From Operations
BDS earnings from operations for the nine months ended September 30, 2017 increased by $227 million compared with the same period in 2016primarily due to lower charges on the KC-46A Tanker and Commercial Crew programs, which more than offset the impact of fewer C-17 deliveriesand Apache delivery mix. BDS recorded charges related to the KC-46A Tanker program of $97 million and $287 million in the nine months endedSeptember 30, 2017 and 2016 . BDS recorded a charge of $162 million on the Commercial Crew program in the nine months ended September 30,2016.
39
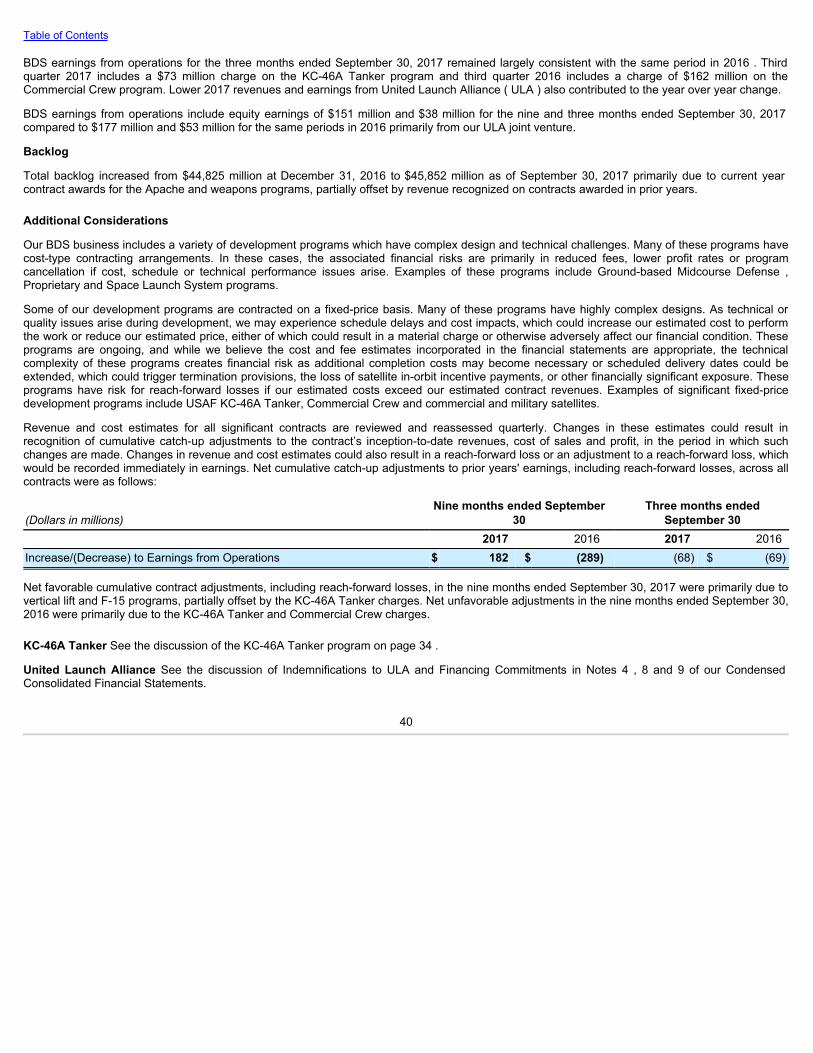
Table of Contents
BDS earnings from operations for the three months ended September 30, 2017 remained largely consistent with the same period in 2016 . Thirdquarter 2017 includes a $73 million charge on the KC-46A Tanker program and third quarter 2016 includes a charge of $162 million on theCommercial Crew program. Lower 2017 revenues and earnings from United Launch Alliance ( ULA ) also contributed to the year over year change.
BDS earnings from operations include equity earnings of $151 million and $38 million for the nine and three months ended September 30, 2017compared to $177 million and $53 million for the same periods in 2016 primarily from our ULA joint venture.
Backlog
Total backlog increased from $44,825 million at December 31, 2016 to $45,852 million as of September 30, 2017 primarily due to current yearcontract awards for the Apache and weapons programs, partially offset by revenue recognized on contracts awarded in prior years.
Additional Considerations
Our BDS business includes a variety of development programs which have complex design and technical challenges. Many of these programs havecost-type contracting arrangements. In these cases, the associated financial risks are primarily in reduced fees, lower profit rates or programcancellation if cost, schedule or technical performance issues arise. Examples of these programs include Ground-based Midcourse Defense ,Proprietary and Space Launch System programs.
Some of our development programs are contracted on a fixed-price basis. Many of these programs have highly complex designs. As technical orquality issues arise during development, we may experience schedule delays and cost impacts, which could increase our estimated cost to performthe work or reduce our estimated price, either of which could result in a material charge or otherwise adversely affect our financial condition. Theseprograms are ongoing, and while we believe the cost and fee estimates incorporated in the financial statements are appropriate, the technicalcomplexity of these programs creates financial risk as additional completion costs may become necessary or scheduled delivery dates could beextended, which could trigger termination provisions, the loss of satellite in-orbit incentive payments, or other financially significant exposure. Theseprograms have risk for reach-forward losses if our estimated costs exceed our estimated contract revenues. Examples of significant fixed-pricedevelopment programs include USAF KC-46A Tanker, Commercial Crew and commercial and military satellites.
Revenue and cost estimates for all significant contracts are reviewed and reassessed quarterly. Changes in these estimates could result inrecognition of cumulative catch-up adjustments to the contract’s inception-to-date revenues, cost of sales and profit, in the period in which suchchanges are made. Changes in revenue and cost estimates could also result in a reach-forward loss or an adjustment to a reach-forward loss, whichwould be recorded immediately in earnings. Net cumulative catch-up adjustments to prior years' earnings, including reach-forward losses, across allcontracts were as follows:
(Dollars in millions)Nine months ended September
30 Three months ended
September 30 2017 2016 2017 2016Increase/(Decrease) to Earnings from Operations $ 182 $ (289) (68) $ (69)
Net favorable cumulative contract adjustments, including reach-forward losses, in the nine months ended September 30, 2017 were primarily due tovertical lift and F-15 programs, partially offset by the KC-46A Tanker charges. Net unfavorable adjustments in the nine months ended September 30,2016 were primarily due to the KC-46A Tanker and Commercial Crew charges.
KC-46A Tanker See the discussion of the KC-46A Tanker program on page 34 .
United Launch Alliance See the discussion of Indemnifications to ULA and Financing Commitments in Notes 4 , 8 and 9 of our CondensedConsolidated Financial Statements.
40
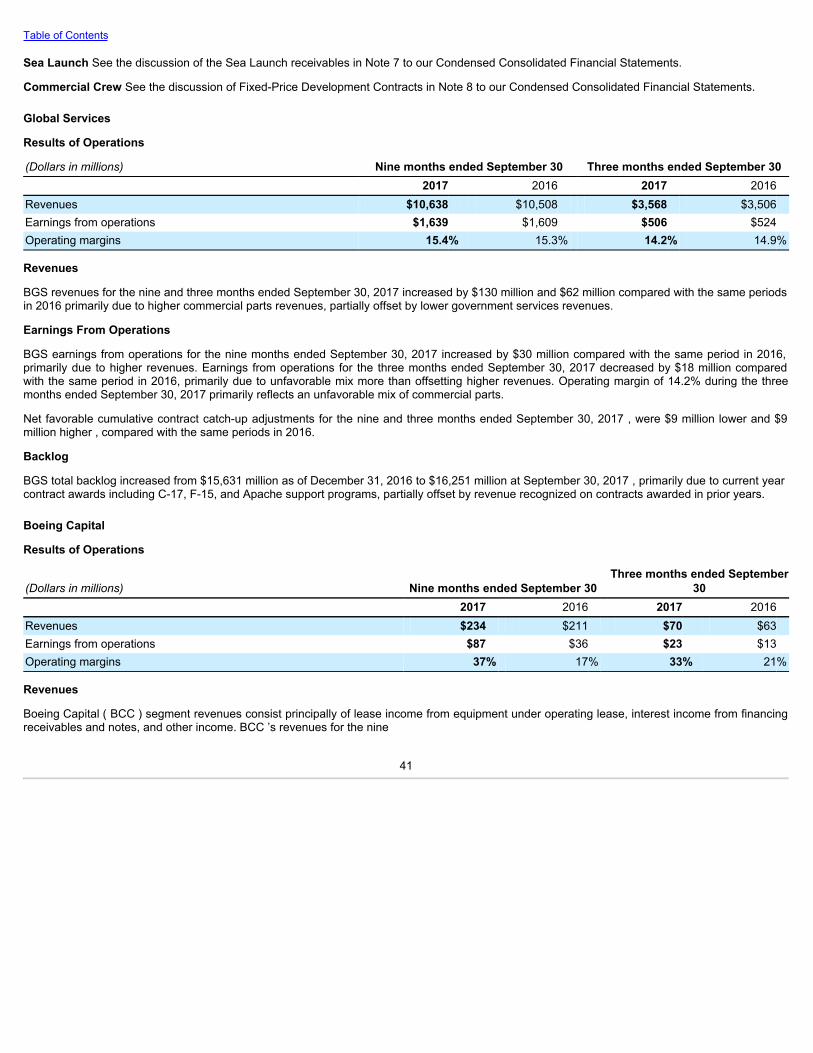
Table of Contents
Sea Launch See the discussion of the Sea Launch receivables in Note 7 to our Condensed Consolidated Financial Statements.
Commercial Crew See the discussion of Fixed-Price Development Contracts in Note 8 to our Condensed Consolidated Financial Statements.
Global Services
Results of Operations
(Dollars in millions) Nine months ended September 30 Three months ended September 302017 2016 2017 2016
Revenues $10,638 $10,508 $3,568 $3,506Earnings from operations $1,639 $1,609 $506 $524Operating margins 15.4% 15.3% 14.2% 14.9%
Revenues
BGS revenues for the nine and three months ended September 30, 2017 increased by $130 million and $62 million compared with the same periodsin 2016 primarily due to higher commercial parts revenues, partially offset by lower government services revenues.
Earnings From Operations
BGS earnings from operations for the nine months ended September 30, 2017 increased by $30 million compared with the same period in 2016,primarily due to higher revenues. Earnings from operations for the three months ended September 30, 2017 decreased by $18 million comparedwith the same period in 2016, primarily due to unfavorable mix more than offsetting higher revenues. Operating margin of 14.2% during the threemonths ended September 30, 2017 primarily reflects an unfavorable mix of commercial parts.
Net favorable cumulative contract catch-up adjustments for the nine and three months ended September 30, 2017 , were $9 million lower and $9million higher , compared with the same periods in 2016.
Backlog
BGS total backlog increased from $15,631 million as of December 31, 2016 to $16,251 million at September 30, 2017 , primarily due to current yearcontract awards including C-17, F-15, and Apache support programs, partially offset by revenue recognized on contracts awarded in prior years.
Boeing Capital
Results of Operations
(Dollars in millions) Nine months ended September 30 Three months ended September
302017 2016 2017 2016
Revenues $234 $211 $70 $63Earnings from operations $87 $36 $23 $13Operating margins 37% 17% 33% 21%
Revenues
Boeing Capital ( BCC ) segment revenues consist principally of lease income from equipment under operating lease, interest income from financingreceivables and notes, and other income. BCC ’s revenues for the nine
41

Table of Contents
and three months ended September 30, 2017 increased by $23 million and $7 million compared with the same periods in 2016 primarily due tohigher interest income driven by a larger portfolio during 2017.
Earnings From Operations
BCC ’s earnings from operations are presented net of interest expense, provision for (recovery of) losses, asset impairment expense, depreciationon leased equipment and other operating expenses. Earnings from operations for the nine months ended September 30, 2017 increased by $51million compared with the same period in 2016 , primarily due to lower impairment expenses and higher revenues. Earnings from operations for thethree months ended September 30, 2017 increased by $10 million compared with the same period in 2016 , primarily due to higher revenues.
Financial Position
The following table presents selected financial data for BCC :
(Dollars in millions)September 30
2017 December 31
2016Customer financing and investment portfolio, net $3,366 $4,109Other assets, primarily cash and short-term investments 1,191 346Total assets $4,557 $4,455 Other liabilities, primarily deferred income taxes $923 $1,007Debt, including intercompany loans 3,028 2,864Equity 606 584Total liabilities and equity $4,557 $4,455 Debt-to-equity ratio 5.0-to-1 4.9-to-1
BCC ’s customer financing and investment portfolio at September 30, 2017 decreased from December 31, 2016 primarily due to $938 million ofasset sales, note payoffs, and portfolio run-off, partially offset by new volume. BCC enters into certain transactions with Boeing, reflected inUnallocated items, eliminations and other, in the form of intercompany guarantees and other subsidies that mitigate the effects of certain creditquality or asset impairment issues on the BCC segment.
42

Table of Contents
Liquidity and Capital Resources
Cash Flow Summary
(Dollars in millions) Nine months ended September 30 2017 2016Net earnings $5,065 $3,264
Non-cash items 1,907 1,793Changes in working capital 3,468 2,610
Net cash provided by operating activities 10,440 7,667Net cash used by investing activities (1,636) (1,964)Net cash used by financing activities (9,109) (8,013)Effect of exchange rate changes on cash and cash equivalents 73 (6)Net decrease in cash and cash equivalents (232) (2,316)Cash and cash equivalents at beginning of year 8,801 11,302Cash and cash equivalents at end of period $8,569 $8,986
Operating Activities Net cash provided by operating activities was $10.4 billion during the nine months ended September 30, 2017 , compared with$7.7 billion during the same period in 2016 . The increase was primarily driven by changes in working capital with higher advances more thanoffsetting inventory increases. Advances and progress billings increased by $5.2 billion during the nine months ended September 30, 2017 anddecreased by $1.8 billion during the same period in 2016 . Gross inventories increased by $2.3 billion during the nine months ended September 30,2017 , driven by continued investment in commercial airplane program inventory. Gross inventories decreased by $4.7 billion during the same periodin 2016 , primarily driven by the reclassification of 787 flight test aircraft and reach-forward losses recorded on our 747 program which did not affect2016 operating cash flows.
Required pension contributions under the Employee Retirement Income Security Act, as well as rules governing funding of our non-US pensionplans, are expected to be minimal in 2017. During the third quarter of 2017, we contributed 14.4 million shares of our common stock with anaggregate value of $3.5 billion and $ 0.5 billion in cash to our pension plans. These contributions exceed our previously announced plan tocontribute approximately $0.5 billion to our pension plans in 2017.
Investing Activities Cash used by investing activities was $1.6 billion during the nine months ended September 30, 2017 , compared with $2.0billion during the same period in 2016 . In the nine months ended September 30, 2017 , capital expenditures totaled $1.3 billion , down from $2.0billion during the same period in 2016 . We expect capital expenditures in 2017 to be lower than 2016 .
Financing Activities Cash used by financing activities was $9.1 billion , compared with $8.0 billion during the same period in 2016 . During the ninemonths ended September 30, 2017 , we issued $0.9 billion of debt compared with $1.3 billion in the same period in 2016 .
At September 30, 2017 , the recorded balance of debt was $10.8 billion , of which $1.0 billion was classified as short-term. Debt, includingintercompany loans, attributable to BCC totaled $3.0 billion , of which $1.1 billion was classified as short-term.
During the nine months ended September 30, 2017 we repurchased 39.5 million shares totaling $7.5 billion through our open market sharerepurchase program. In addition, 0.7 million shares were transferred to us from employees for tax withholdings. At September 30, 2017 , the amountavailable under the share repurchase plan, announced on December 12, 2016, totaled $6.5 billion .
Capital Resources We have substantial borrowing capacity. Any future borrowings may affect our credit ratings and are subject to various debtcovenants as described below. We have a commercial paper program that continues to serve as a significant potential source of short-term liquidity.Throughout the nine months
43

Table of Contents
ended September 30, 2017 , we had no commercial paper borrowings outstanding. Currently, we have $5.0 billion of unused borrowing capacity onrevolving credit line agreements. We anticipate that these credit lines will primarily serve as backup liquidity to support our general corporateborrowing needs.
Financing commitments totaled $13.1 billion and $14.8 billion at September 30, 2017 and December 31, 2016 . We anticipate that we will not berequired to fund a significant portion of our financing commitments as we continue to work with third party financiers to provide alternative financingto customers. Historically, we have not been required to fund significant amounts of outstanding commitments. However, there can be noassurances that we will not be required to fund greater amounts than historically required. In addition, many of our non-U.S. customers financeaircraft purchases through the Export-Import Bank of the United States. Following the expiration of the bank’s charter on June 30, 2015, the bank’scharter was reauthorized in December 2015. The bank is now authorized through September 30, 2019. However, until the U.S. Senate confirmsmembers sufficient to reconstitute a quorum of the bank’s board of directors, the bank will not be able to approve any transaction totaling more than$10 million. As a result, we may fund additional commitments and/or enter into new financing arrangements with customers.
In the event we require additional funding to support strategic business opportunities, our commercial aircraft financing commitments, unfavorableresolution of litigation or other loss contingencies, or other business requirements, we expect to meet increased funding requirements by issuingcommercial paper or term debt.
We believe our ability to access external capital resources should be sufficient to satisfy existing short-term and long-term commitments and plans,and also to provide adequate financial flexibility to take advantage of potential strategic business opportunities should they arise within the next year.However, there can be no assurance of the cost or availability of future borrowings, if any, under our commercial paper program, in the debt marketsor our credit facilities.
At September 30, 2017 , we were in compliance with the covenants for our debt and credit facilities. The most restrictive covenants include alimitation on mortgage debt and sale and leaseback transactions as a percentage of consolidated net tangible assets (as defined in the creditagreements), and a limitation on consolidated debt as a percentage of total capital (as defined). When considering debt covenants, we continue tohave substantial borrowing capacity.
Off-Balance Sheet Arrangements
We are a party to certain off-balance sheet arrangements including certain guarantees. For discussion of these arrangements, see Note 9 to ourCondensed Consolidated Financial Statements.
Contingent Obligations
We have significant contingent obligations that arise in the ordinary course of business, which include the following:
Legal Various legal proceedings, claims and investigations are pending against us. Legal contingencies are discussed in Note 16 to our CondensedConsolidated Financial Statements.
Environmental Remediation We are involved with various environmental remediation activities and have recorded a liability of $543 million atSeptember 30, 2017 . For additional information, see Note 8 to our Condensed Consolidated Financial Statements.
Non-GAAP Measures
Core Operating Earnings, Core Operating Margin and Core Earnings Per Share
Our unaudited condensed consolidated interim financial statements are prepared in accordance with Generally Accepted Accounting Principles inthe United States of America (GAAP) which we supplement with certain non-GAAP financial information. These non-GAAP measures should not beconsidered in isolation or as a substitute for the related GAAP measures, and other companies may define such measures
44

Table of Contents
differently. We encourage investors to review our financial statements and publicly-filed reports in their entirety and not to rely on any single financialmeasure. Core operating earnings, core operating margin and core earnings per share exclude the impact of certain pension and otherpostretirement benefit expenses that are not allocated to business segments. Pension costs, comprising service and prior service costs computed inaccordance with GAAP are allocated to BCA and certain BGS businesses supporting commercial customers. Pension costs allocated to BDS andBGS businesses supporting government customers are computed in accordance with U.S. Government Cost Accounting Standards (CAS), whichemploy different actuarial assumptions and accounting conventions than GAAP. CAS costs are allocable to government contracts. Otherpostretirement benefit costs are allocated to all business segments based on CAS, which is generally based on benefits paid. The unallocatedpension costs recognized in earnings was a benefit of $808 million and $275 million for the nine and three months ended September 30, 2017compared with $129 million and $50 million for the same periods in 2016 . The higher 2017 benefit reflects the amortization of pension benefitscapitalized as inventory in prior years.
For further discussion of pension and other postretirement costs see the Management’s Discussion and Analysis on page 32 of this Form 10-Q andon page 46 of our 2016 Annual Report on Form 10-K. Management uses core operating earnings, core operating margin and core earnings pershare for purposes of evaluating and forecasting underlying business performance. Management believes these core earnings measures provideinvestors additional insights into operational performance as unallocated pension and other postretirement benefit cost, primarily represent costsdriven by market factors and costs not allocable to U.S. government contracts.
Reconciliation of GAAP Measures to Non-GAAP Measures
The table below reconciles the non-GAAP financial measures of core operating earnings, core operating margin and core earnings per share withthe most directly comparable GAAP financial measures of earnings from operations, operating margins and diluted earnings per share.
(Dollars in millions, except per share data)Nine months ended September
30 Three months ended September
302017 2016 2017 2016
Revenues $68,024 $71,285 $24,309 $23,898Earnings from operations, as reported $7,248 $3,651 $2,689 $2,282Operating margins 10.7% 5.1% 11.1% 9.5% Unallocated pension income ($808) ($129) ($275) ($50)Unallocated other postretirement benefit income ($146) ($122) ($41) ($38)Unallocated pension and other postretirement benefit income ($954) ($251) ($316) ($88)Core operating earnings (non-GAAP) $6,294 $3,400 $2,373 $2,194
Core operating margins (non-GAAP) 9.3% 4.8% 9.8% 9.2%
Diluted earnings per share, as reported $8.27 $5.04 $3.06 $3.60Unallocated pension benefit income (1.31) (0.20) (0.45) (0.08)Unallocated other postretirement benefit income (0.24) (0.19) (0.07) (0.06)Provision for deferred income taxes on adjustments (1) $0.54 $0.14 $0.18 $0.05Core earnings per share (non-GAAP) $7.26 $4.79 $2.72 $3.51
Weighted average diluted shares (in millions) 612.8 647.9 606.3 632.7(1) The income tax impact is calculated using the tax rate in effect for the non-GAAP adjustments.
45

Table of Contents
Item 3. Quantitative and Qualitative Disclosures About Market Risk
There have been no significant changes to our market risk since December 31, 2016 .
Item 4. Controls and Procedures
(a) Evaluation of Disclosure Controls and Procedures.
Our Chief Executive Officer and Chief Financial Officer have evaluated our disclosure controls and procedures as of September 30, 2017 and haveconcluded that these disclosure controls and procedures are effective to ensure that information required to be disclosed by us in the reports that wefile or submit under the Securities Exchange Act of 1934 is recorded, processed, summarized and reported within the time periods specified in theSecurities and Exchange Commission’s rules and forms and is accumulated and communicated to our management, including the Chief ExecutiveOfficer and Chief Financial Officer, as appropriate to allow timely decisions regarding required disclosure.
(b) Changes in Internal Control Over Financial Reporting.
There were no changes that occurred during the third quarter of 2017 that have materially affected or are reasonably likely to materially affect ourinternal control over financial reporting.
46
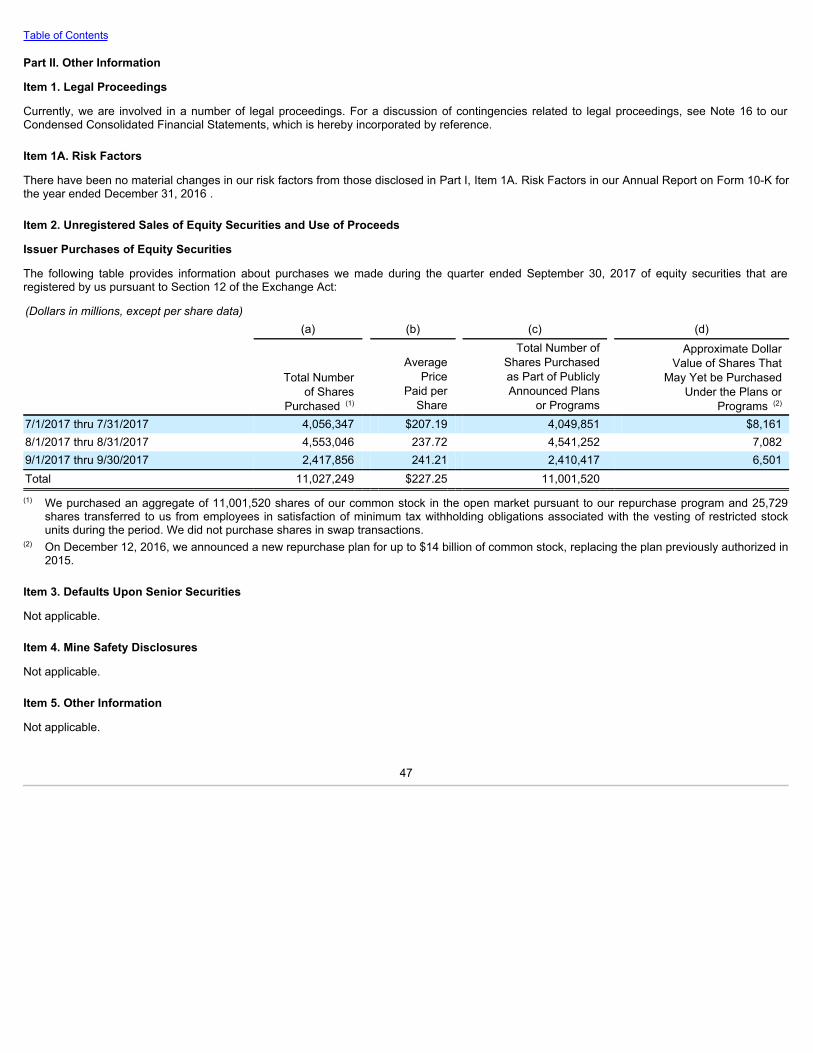
Table of Contents
Part II. Other Information
Item 1. Legal Proceedings
Currently, we are involved in a number of legal proceedings. For a discussion of contingencies related to legal proceedings, see Note 16 to ourCondensed Consolidated Financial Statements, which is hereby incorporated by reference.
Item 1A. Risk Factors
There have been no material changes in our risk factors from those disclosed in Part I, Item 1A. Risk Factors in our Annual Report on Form 10-K forthe year ended December 31, 2016 .
Item 2. Unregistered Sales of Equity Securities and Use of Proceeds
Issuer Purchases of Equity Securities
The following table provides information about purchases we made during the quarter ended September 30, 2017 of equity securities that areregistered by us pursuant to Section 12 of the Exchange Act:
(Dollars in millions, except per share data)
(a) (b) (c) (d)
Total Numberof Shares
Purchased (1)
AveragePrice
Paid perShare
Total Number ofShares Purchasedas Part of PubliclyAnnounced Plans
or Programs
Approximate DollarValue of Shares That
May Yet be PurchasedUnder the Plans or
Programs (2)
7/1/2017 thru 7/31/2017 4,056,347 $207.19 4,049,851 $8,1618/1/2017 thru 8/31/2017 4,553,046 237.72 4,541,252 7,0829/1/2017 thru 9/30/2017 2,417,856 241.21 2,410,417 6,501Total 11,027,249 $227.25 11,001,520
(1) We purchased an aggregate of 11,001,520 shares of our common stock in the open market pursuant to our repurchase program and 25,729shares transferred to us from employees in satisfaction of minimum tax withholding obligations associated with the vesting of restricted stockunits during the period. We did not purchase shares in swap transactions.
(2) On December 12, 2016, we announced a new repurchase plan for up to $14 billion of common stock, replacing the plan previously authorized in2015.
Item 3. Defaults Upon Senior Securities
Not applicable.
Item 4. Mine Safety Disclosures
Not applicable.
Item 5. Other Information
Not applicable.
47

Table of Contents
Item 6. Exhibits
3.2 By-Laws of The Boeing Company, as amended and restated effective August 10, 2017 (Exhibit 3.2 to the Company's Current
Report on Form 8-K dated August 10, 2017) 10.1 Registration Rights Agreement, dated as of August 1, 2017 by and between The Boeing Company and Newport Trust Company,
solely in its capacity as duly appointed and acting investment manager of a segregated account held in The Boeing CompanyEmployee Retirement Plans Master Trust (Exhibit 10.1 to the Company's Registration Statement on Form S-3 dated August 2,2017)
12 Computation of Ratio of Earnings to Fixed Charges 15 Letter from Independent Registered Public Accounting Firm regarding unaudited interim financial information 31.1 Certification of Chief Executive Officer pursuant to Section 302 of the Sarbanes-Oxley Act of 2002 31.2 Certification of Chief Financial Officer pursuant to Section 302 of the Sarbanes-Oxley Act of 2002 32.1 Certification of Chief Executive Officer pursuant to Section 906 of the Sarbanes-Oxley Act of 2002 32.2 Certification of Chief Financial Officer pursuant to Section 906 of the Sarbanes-Oxley Act of 2002 101.INS XBRL Instance Document 101.SCH XBRL Taxonomy Extension Schema Document 101.CAL XBRL Taxonomy Extension Calculation Linkbase Document 101.DEF XBRL Taxonomy Extension Definition Linkbase Document 101.LAB XBRL Taxonomy Extension Label Linkbase Document 101.PRE XBRL Taxonomy Extension Presentation Linkbase Document
48

Table of Contents
Signature
Pursuant to the requirements of the Securities Exchange Act of 1934, the registrant has duly caused this report to be signed on its behalf by theundersigned thereunto duly authorized.
THE BOEING COMPANY (Registrant)
October 25, 2017
/s/ Robert E. Verbeck
(Date)
Robert E. Verbeck – Senior Vice President, Finance and CorporateController
49
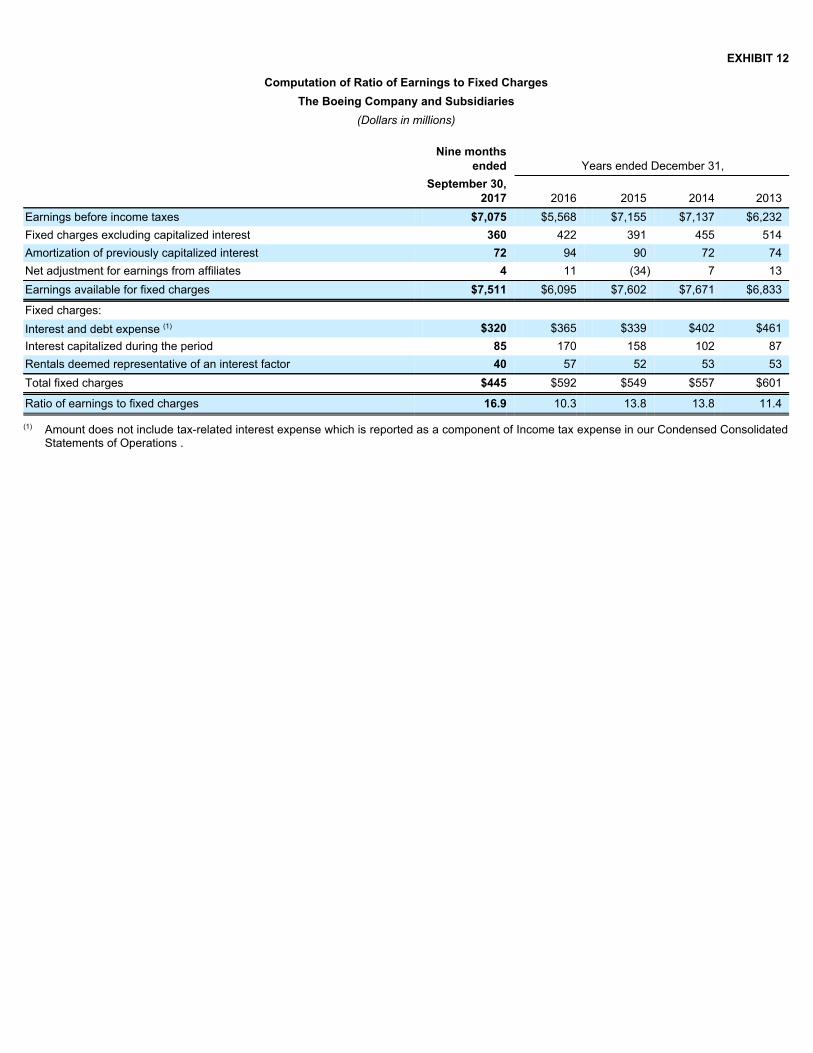
EXHIBIT 12
Computation of Ratio of Earnings to Fixed ChargesThe Boeing Company and Subsidiaries
(Dollars in millions)
Nine months
ended Years ended December 31,
September 30,
2017 2016 2015 2014 2013Earnings before income taxes $7,075 $5,568 $7,155 $7,137 $6,232Fixed charges excluding capitalized interest 360 422 391 455 514Amortization of previously capitalized interest 72 94 90 72 74Net adjustment for earnings from affiliates 4 11 (34) 7 13Earnings available for fixed charges $7,511 $6,095 $7,602 $7,671 $6,833
Fixed charges: Interest and debt expense (1) $320 $365 $339 $402 $461Interest capitalized during the period 85 170 158 102 87Rentals deemed representative of an interest factor 40 57 52 53 53Total fixed charges $445 $592 $549 $557 $601
Ratio of earnings to fixed charges 16.9 10.3 13.8 13.8 11.4
(1) Amount does not include tax-related interest expense which is reported as a component of Income tax expense in our Condensed ConsolidatedStatements of Operations .

EXHIBIT 15
Letter from Independent Registered Public Accounting Firm RegardingUnaudited Interim Financial Information
LETTER IN LIEU OF CONSENT FOR REVIEW REPORT
October 25, 2017
To the Board of Directors and Shareholders ofThe Boeing CompanyChicago, Illinois
We have reviewed, in accordance with the standards of the Public Company Accounting Oversight Board (United States), the unaudited interimfinancial information of The Boeing Company and subsidiaries for the periods ended September 30, 2017 and 2016 , as indicated in our report datedOctober 25, 2017 ; because we did not perform an audit, we expressed no opinion on that information.
We are aware that our report referred to above, which is included in your Quarterly Report on Form 10-Q for the quarter ended September 30, 2017, is incorporated by reference in Registration Statement Nos. 33-25332, 33-31434, 33-43854, 33-58798, 33-52773, 333-16363, 333-26867, 333-32461, 333-32491, 333-32499, 333-32567, 333-41920, 333-54234, 333-73252, 333-107677, 333-140837, 333-156403, 333-160752, 333-163637,and 333-195777 on Form S-8, and Registration Statement Nos. 333-219627 and 333-219630 on Form S-3.
We also are aware that the aforementioned report, pursuant to Rule 436(c) under the Securities Act of 1933, is not considered a part of theRegistration Statement prepared or certified by an accountant or a report prepared or certified by an accountant within the meaning of Sections 7and 11 of that Act.
/s/ Deloitte & Touche LLP
Chicago, Illinois
EXHIBIT 31.1CERTIFICATION PURSUANT TO
RULE 13a-14 OF THE SECURITIES EXCHANGE ACT OF 1934,AS ADOPTED PURSUANT TO
SECTION 302 OF THE SARBANES-OXLEY ACT OF 2002I, Dennis A. Muilenburg , certify that:1. I have reviewed this quarterly report on Form 10-Q of The Boeing Company;2. Based on my knowledge, this report does not contain any untrue statement of a material fact or omit to state a material fact necessary to
make the statements made, in light of the circumstances under which such statements were made, not misleading with respect to the periodcovered by this report;
3. Based on my knowledge, the financial statements, and other financial information included in this report, fairly present in all material respectsthe financial condition, results of operations and cash flows of the registrant as of, and for, the periods presented in this report;
4. The registrant’s other certifying officer(s) and I are responsible for establishing and maintaining disclosure controls and procedures (as definedin Exchange Act Rules 13a-15(e) and 15d-15(e)) and internal control over financial reporting (as defined in Exchange Act Rules 13a-15(f) and15d-15(f)) for the registrant and have:(a) Designed such disclosure controls and procedures, or caused such disclosure controls and procedures to be designed under our
supervision, to ensure that material information relating to the registrant, including its consolidated subsidiaries, is made known to us byothers within those entities, particularly during the period in which this report is being prepared;
(b) Designed such internal control over financial reporting, or caused such internal control over financial reporting to be designed under oursupervision, to provide reasonable assurance regarding the reliability of financial reporting and the preparation of financial statementsfor external purposes in accordance with generally accepted accounting principles;
(c) Evaluated the effectiveness of the registrant’s disclosure controls and procedures and presented in this report our conclusions about theeffectiveness of the disclosure controls and procedures, as of the end of the period covered by this report based on such evaluation;and
(d) Disclosed in this report any change in the registrant’s internal control over financial reporting that occurred during the registrant’s mostrecent fiscal quarter (the registrant’s fourth fiscal quarter in the case of an annual report) that has materially affected, or is reasonablylikely to materially affect, the registrant’s internal control over financial reporting; and
5. The registrant’s other certifying officer(s) and I have disclosed, based on our most recent evaluation of internal control over financial reporting,to the registrant’s auditors and the audit committee of the registrant’s board of directors (or persons performing the equivalent functions):(a) All significant deficiencies and material weaknesses in the design or operation of internal control over financial reporting which are
reasonably likely to adversely affect the registrant’s ability to record, process, summarize and report financial information; and(b) Any fraud, whether or not material, that involves management or other employees who have a significant role in the registrant’s internal
control over financial reporting.
Date: October 25, 2017
/s/ Dennis A. Muilenburg Dennis A. MuilenburgChairman, President and Chief Executive Officer

EXHIBIT 31.2CERTIFICATION PURSUANT TO
RULE 13a-14 OF THE SECURITIES EXCHANGE ACT OF 1934,AS ADOPTED PURSUANT TO
SECTION 302 OF THE SARBANES-OXLEY ACT OF 2002I, Gregory D. Smith , certify that:1. I have reviewed this quarterly report on Form 10-Q of The Boeing Company;2. Based on my knowledge, this report does not contain any untrue statement of a material fact or omit to state a material fact necessary to
make the statements made, in light of the circumstances under which such statements were made, not misleading with respect to the periodcovered by this report;
3. Based on my knowledge, the financial statements, and other financial information included in this report, fairly present in all material respectsthe financial condition, results of operations and cash flows of the registrant as of, and for, the periods presented in this report;
4. The registrant’s other certifying officer(s) and I are responsible for establishing and maintaining disclosure controls and procedures (as definedin Exchange Act Rules 13a-15(e) and 15d-15(e)) and internal control over financial reporting (as defined in Exchange Act Rules 13a-15(f) and15d-15(f)) for the registrant and have:(a) Designed such disclosure controls and procedures, or caused such disclosure controls and procedures to be designed under our
supervision, to ensure that material information relating to the registrant, including its consolidated subsidiaries, is made known to us byothers within those entities, particularly during the period in which this report is being prepared;
(b) Designed such internal control over financial reporting, or caused such internal control over financial reporting to be designed under oursupervision, to provide reasonable assurance regarding the reliability of financial reporting and the preparation of financial statementsfor external purposes in accordance with generally accepted accounting principles;
(c) Evaluated the effectiveness of the registrant’s disclosure controls and procedures and presented in this report our conclusions about theeffectiveness of the disclosure controls and procedures, as of the end of the period covered by this report based on such evaluation;and
(d) Disclosed in this report any change in the registrant’s internal control over financial reporting that occurred during the registrant’s mostrecent fiscal quarter (the registrant’s fourth fiscal quarter in the case of an annual report) that has materially affected, or is reasonablylikely to materially affect, the registrant’s internal control over financial reporting; and
5. The registrant’s other certifying officer(s) and I have disclosed, based on our most recent evaluation of internal control over financial reporting,to the registrant’s auditors and the audit committee of the registrant’s board of directors (or persons performing the equivalent functions):(a) All significant deficiencies and material weaknesses in the design or operation of internal control over financial reporting which are
reasonably likely to adversely affect the registrant’s ability to record, process, summarize and report financial information; and(b) Any fraud, whether or not material, that involves management or other employees who have a significant role in the registrant’s internal
control over financial reporting.
Date: October 25, 2017
/s/ Gregory D. Smith Gregory D. SmithChief Financial Officer and Executive Vice President, Enterprise Performance and Strategy

EXHIBIT 32.1
CERTIFICATION PURSUANT TO18 U.S.C. SECTION 1350,
AS ADOPTED PURSUANT TOSECTION 906 OF THE SARBANES-OXLEY ACT OF 2002
In connection with the Quarterly Report of The Boeing Company (the “Company”) on Form 10-Q for the period ending September 30, 2017 , as filedwith the Securities and Exchange Commission on the date hereof (the “Report”), I, Dennis A. Muilenburg , Chairman, President and Chief ExecutiveOfficer of the Company, certify, pursuant to 18 U.S.C. § 1350, as adopted pursuant to § 906 of the Sarbanes-Oxley Act of 2002, that:
(1) The Report fully complies with the requirements of Section 13(a) or 15(d) of the Securities Exchange Act of 1934, as amended; and
(2) The information contained in the Report fairly presents, in all material respects, the financial condition and results of operations of the Company.
/s/ Dennis A. Muilenburg Dennis A. MuilenburgChairman, President and Chief Executive Officer
October 25, 2017

EXHIBIT 32.2
CERTIFICATION PURSUANT TO18 U.S.C. SECTION 1350,
AS ADOPTED PURSUANT TOSECTION 906 OF THE SARBANES-OXLEY ACT OF 2002
In connection with the Quarterly Report of The Boeing Company (the “Company”) on Form 10-Q for the period ending September 30, 2017 , as filedwith the Securities and Exchange Commission on the date hereof (the “Report”), I, Gregory D. Smith , Chief Financial Officer and Executive VicePresident, Enterprise Performance and Strategy of the Company, certify, pursuant to 18 U.S.C. § 1350, as adopted pursuant to § 906 of theSarbanes-Oxley Act of 2002, that:
(1) The Report fully complies with the requirements of Section 13(a) or 15(d) of the Securities Exchange Act of 1934, as amended; and
(2) The information contained in the Report fairly presents, in all material respects, the financial condition and results of operations of the Company.
/s/ Gregory D. Smith Gregory D. SmithChief Financial Officer and Executive Vice President, Enterprise Performance and Strategy
October 25, 2017