c o l t - covenant optimized leverage trading covenant technology services, llc 2005
TRANSCRIPT

C O L T -
Covenant Optimized Leverage Trading
Covenant Technology Services, LLC
www.ctechnologyservices.net2005

Covenant Optimized Leverage Trading
What is COLT ?
Portfolio Financing System.
Aggregate Trading & Position Management• Securities Financing (Equity Repo, Stock Loan)
• Synthetic Financing (Portfolio Swaps)
Optimized multi-broker allocation engines.
Embedded Rule-Based Margin Calculator• Margin Financing (Rule Based).
• What-if Scenario Evaluator - WISE

Risk Based Margin
What is rule-based margin ?
Beyond Reg-T, NYSE and House Requirement. Standard Framework – Eliminated inconsistencies
Rule-based model supports Pair-Trading – Basket Enhancement Cross-margin across all asset/security types. Support Multi-Trading Strategies
Convertible Arbitrage with CDSSynthetic Prime-Brokerage – Portfolio Swaps

Equity Long/Short – Pair Trading
Equity Margin – Adjustment Based Volatility Risk Liquidity Risk Concentration Risk
Basket Enhancement Weight Average Liquidity Sector Concentration Country Tier
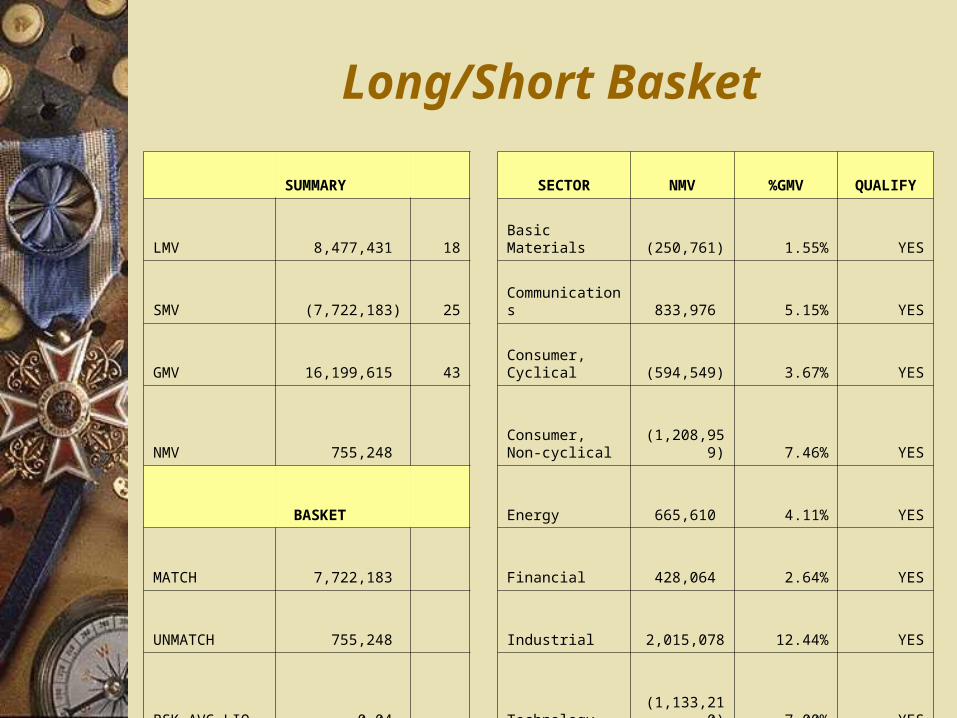
Long/Short Basket
SUMMARY SECTOR NMV %GMV QUALIFY
LMV
8,477,431 18 Basic Materials (250,761) 1.55% YES
SMV
(7,722,183) 25 Communications
833,976 5.15% YES
GMV 16,199,615 43
Consumer, Cyclical
(594,549) 3.67% YES
NMV
755,248 Consumer, Non-cyclical
(1,208,959) 7.46% YES
BASKET Energy
665,610 4.11% YES
MATCH
7,722,183 Financial
428,064 2.64% YES
UNMATCH
755,248 Industrial
2,015,078 12.44% YES
BSK_AVG_LIQ
0.04 Technology
(1,133,210) 7.00% YES
MARGIN
INDIVIDUAL REQ 2,206,688
BASKET REQ 847,743

Convertible Arbitrage TradingConvertible Arbitrage Trading
Convertible Bond Bond Investment Value - Credit/Interest Risk Embedded Call Option - Volatility Risk
Convertible Arbitrage Strategy Naked Convertible Hedged with Equity Hedged with Equity and CDS
CDS Reference Asset.

Con
vertible P
rice
Stock Price
JunkJunk Out of the MoneyOut of the Money At the MoneyAt the Money In the MoneyIn the Money DiscountDiscount
Conversion RatioConversion Ratio
PremiumPremium
Issue PriceIssue Price
ParityParity
Convertible PriceConvertible Price
Bond FloorBond Floor
Convertible in the secondary marketConvertible in the secondary market

Hedged with CDSHedged with CDSSymbol: Symbol: OAK 4.875 03/01/2008OAK 4.875 03/01/2008Price:Price: 104.03125104.03125Conversion Ratio:Conversion Ratio: 64.432964.4329Credit Rating:Credit Rating: S&P – BB- / Moody – Ba3 S&P – BB- / Moody – Ba3 Naked Credit Requirement: Naked Credit Requirement: 20 %20 %
Underlying Price:Underlying Price: 12.2512.25Parity:Parity: 789.30789.30Premium %:Premium %: 24.13%24.13%Equity Hedged:Equity Hedged: Yes Yes Hedge Ratio:Hedge Ratio: 10%10%
Margin w/o CDS Requirement:Margin w/o CDS Requirement: 20.00%20.00%
CDS Hedged:CDS Hedged: YesYesCDS Notional Pct:CDS Notional Pct: 100%100%CDS Reference Asset:CDS Reference Asset: Cheapest to delivery.Cheapest to delivery.
Margin w/CDS Requirement:Margin w/CDS Requirement: 13.75%13.75%

Capital Structure Arbitrage TradingCapital Structure Arbitrage Trading
Trading asset class of same issuer. Xerox Example – Long Bond / Short Equity.
Credit versus Earning Improvement.
Debt Arbitrage – Credit Risk / Duration Debt Structure - Senior versus Junior Hybrid Hedged – Advantage.

Hybrid Credit Hedged AdvantageHybrid Credit Hedged AdvantageIssuer:Issuer: Dynegy Yes EnergyDynegy Yes Energy
Debt Arbitrage:Debt Arbitrage: Senior vs SeniorSenior vs Senior
Long / Short: Long / Short: DYN 8.316 2027DYN 8.316 2027 DYN 7.125 2018 DYN 7.125 2018Quantity:Quantity: 2,000,0002,000,000 (1,500,000)(1,500,000)Duration:Duration: Long TermLong Term Long TermLong TermCredit Rating: Credit Rating: S&P – CCC / Moody – CaS&P – CCC / Moody – Ca CCC / CaaCCC / CaaNaked Credit Margin:Naked Credit Margin: 50%50% 50%50%
Debt Arbitrage:Debt Arbitrage: Junior vs JuniorJunior vs Junior
Long / Short: Long / Short: DYN 9.875 2010DYN 9.875 2010 DYN 8.75 2012DYN 8.75 2012Duration:Duration: Long TermLong Term Long TermLong TermQuantity:Quantity: 1,000,0001,000,000 (3,500,000)(3,500,000)Credit Rating: Credit Rating: S&P – B / Moody – BS&P – B / Moody – B CCC / CaaCCC / CaaNaked Credit Margin:Naked Credit Margin: 30%30% 50%50%
Hedged Hedged Unhedged Unhedged Hybrid HedgedHybrid HedgedSenior vs Senior: Senior vs Senior: Long / Margin Long / Margin 1,400,000 / 7.50%1,400,000 / 7.50% 600,000 / 10.00%600,000 / 10.00%Short / MarginShort / Margin (1,500,000) / 7.50%(1,500,000) / 7.50%
Junior vs Junior:Junior vs Junior:Long / MarginLong / Margin 1,000,000 / 15.00 %1,000,000 / 15.00 %Short / Margin:Short / Margin: (1,143,243) / 15.00 %(1,143,243) / 15.00 % (1,870,270) / 50.00% (1,870,270) / 50.00% (486,486) / 10.00 %(486,486) / 10.00 %

Portfolio SwapsPortfolio Swaps
What is it? Total Return Swap vs CFDs Synthetic Financing Vehicle. Integrated with risk-based margin.
Supports –Multi Trading Strategies/Cross-Margining. Equity Long / Short Convertible Arbitrage Credit Default Swap Capital Structure Arbitrage

COLT AdvantageCOLT Advantage
Optimized Leverage Trading. Support and Optimized multi-trading strategy.
Netting across prime-brokerage houses Best Scenario Analysis
What-if Scenario Evaluator - WISE Upfront decision making
