c a r bo t o ai r n w renewable microgrids: … · remote communities across the globe. ......
TRANSCRIPT

RENEWABLE MICROGRIDS: PROFILES FROM ISLANDS AND REMOTE COMMUNITIES ACROSS THE GLOBE
BY ROCKY MOUNTAIN INSTITUTE AND CARBON WAR ROOM
RO
C
KY MOUNTAIN
INSTIT UTE
1820 FOLSOM STREET | BOULDER, CO 80302 | RMI.ORG
COPYRIGHT ROCKY MOUNTAIN INSTITUTE
WAR R O O M
CARBON
PUBLISHED NOVEMBER 2015
DOWNLOAD AT: WWW.RMI.ORG/ISLANDS_RENEWABLE_MICROGRIDS

AUTHORS
ACKNOWLEDGEMENTS
This casebook would not have been possible without the support, insights, and ideas of many
interviewees and reviewers.
We would like to especially thank those that participated in the interview process: John Booth, Isle of Eigg;
Cristina Clavijo and Lauren Frayer, El Hierro; David Edwards, Marble Bar and Nullagine; Simon Gamble,
King Island; Roy Montero, Bonaire; Glenn Ross, Falkland Islands; Darron Scott, Kodiak Island; Adam Simmonds,
Necker Island; David Waterhouse, Mawson Station; and Juergen Zimmerman, Coral Bay.
Special thanks to: Karen Crofton, Leia Guccione, Justin Locke, Jason Meyer, and Roy Torbert for their review and
insights on this casebook.
Rocky Mountain Institute (RMI)—an independent nonprofit founded in 1982—transforms global energy use to
create a clean, prosperous, and secure low-carbon future. It engages businesses, communities, institutions, and
entrepreneurs to accelerate the adoption of market-based solutions that cost-effectively shift from fossil fuels
to efficiency and renewables. In 2014, RMI merged with Carbon War Room (CWR), whose business-led market
interventions advance a low-carbon economy. The combined organization has offices in Snowmass and Boulder,
Colorado; New York City; Washington, D.C.; and Beijing.
The Clinton Climate Initiative serves as a partner to RMI and CWR to accelerate energy transition
in the Caribbean. The Clinton Climate Initiative (CCI) launched in 2006 to implement solutions to the root causes
of climate change. CCI works to improve building energy efficiency and advance building retrofits; to increase
access to clean-energy technology and deploy it at the government, corporate, and homeowner levels; to help
over 20 island nations reduce their reliance on diesel and adopt renewable energy; and to monitor, preserve, and
grow forests in line with national governments and communities. CCI’s approach addresses the major sources
of greenhouse gas (GHG) emissions and the people, policies, and practices that impact them, while also saving
money for individuals and governments, creating jobs, and growing economies.
AUTHORS:
Kaitlyn Bunker, PhD
Stephen Doig, PhD
Kate Hawley
Jesse Morris
*Authors listed alphabetically. All authors from Rocky
Mountain Institute unless otherwise noted.
CONTACT:
Stephen Doig, PhD ([email protected])
Kate Hawley ([email protected])
SUGGESTED CITATION
Bunker, Kaitlyn, Kate Hawley, and Jesse Morris.
Renewable Microgrids: Profiles from Islands and
Remote Communities Across the Globe. Rocky
Mountain Institute, November 2015. << http://www.
rmi.org/islands_renewable_microgrids >>
Editorial Director: Peter Bronski
Editor: Laurie Guevara-Stone
Art Director: Romy Purshouse
RO
C
KY MOUNTAIN
INSTIT UTE

TABLE OF CONTENTS
01: The Island and Remote Community Energy Opportunity ............................................ 502: Renewable Microgrids ............................................................................................................ 6
Drivers Of Change ................................................................................................................... 7Challenges ................................................................................................................................. 8Lessons Learned ...................................................................................................................... 9
03: Renewable Microgrids: 10 Case Studies ......................................................................... 10Bonaire, The Netherlands .................................................................................................... 13Kodiak, Alaska, United States ............................................................................................ 14El Hierro, Canary Islands, Spain ........................................................................................ 15Falkland Islands, United Kingdom ..................................................................................... 17King Island, Tasmania, Australia ........................................................................................ 18Marble Bar and Nullagine, Australia ................................................................................. 19Coral Bay, Australia ............................................................................................................... 20Isle of Eigg, Scotland, United Kingdom ............................................................................. 22Necker Island, British Virgin Islands ................................................................................ 23Mawson Station, Antarctica ............................................................................................... 24
04: Glossary of Key Terms .......................................................................................................... 2505: Appendix A: Additional Islanded or Remote Microgrids .......................................... 2906: Appendix B: List of Interviewees ...................................................................................... 3007: Endnotes ................................................................................................................................... 31
RENEWABLE MICROGRIDS | 3

THE ISLAND AND REMOTE COMMUNITY ENERGY OPPORTUNITY
01

THE LIVELIHOODS OF INDIVIDUALS and families
living on islands and in remote communities across
the globe are directly tied to the availability and price
of one volatile global commodity: oil. While oil is also
used for various purposes in larger communities
across the globe, islands and remote communities
are disproportionately dependent on oil for their
well-being. In these communities, oil powers the
way people move. It propels the ships and trucks
that bring in goods from the outside. It enables the
tourism industry that keeps many of these local
economies afloat. It also powers the electricity
system in most of these communities. For well over
100 years, oil has enabled remote communities
to generate electricity and enjoy the benefits of a
consistent electrical supply. However, unlike many
larger, non-isolated communities across the globe
that are increasingly turning to a diverse supply of
resources to generate electricity, most islands and
remote communities continue to rely on oil and oil
alone for their electricity and other energy needs.
Relying solely on oil for electricity generation has
left island and remote communities exposed to
several risks and drawbacks. Oil-based electricity
generation is often more expensive and subject to
price volatility, which can result in the use of risky
fuel hedging strategies that can lock in prices for
years to come. Importing oil puts these communities
at risk of supply interruption, reducing energy
security. Furthermore, small-scale electricity systems
that aren’t connected to a larger electricity grid tend
to be more expensive and difficult to maintain: in the
U.S. and Europe, regionally interconnected grids can
support one another, whereas remote and island
community grids have no such luxury.1 Accordingly,
residents of island and remote communities pay
some of the highest retail electricity prices in the
world. While the average residential rate in most
U.S. states is 12.5 cents per kilowatt-hour (USDi) for
electricity,2 the average in most Caribbean nations is
at least three times higher.3
These risks and drawbacks—paired with continuing
cost reductions in solar, wind, and energy storage
technologies—suggest that an alternative to the
fully oil-based electricity systems of the past is now
available to islands and remote communities across
the globe: affordable renewable energy.
Leading islands and remote communities, from
the deserts of Australia to the isles of the United
Kingdom, have already transitioned from 100 percent
oil-based electricity systems to ones with significant
renewable penetration. These communities are
enjoying the many benefits that come with the
transition: operational cost savings, reliable and
stable power, long term energy price stability, and
reduced dependence on oil. This casebook profiles
islands and remote communities actively embracing
this transition in order to provide examples for other
communities looking to make the switch away from
oil to efficiency and renewables.
i All currency throughout this casebook is noted in U.S. dollars
Leading islands and remote communities, from the deserts of Australia to the isles of the United Kingdom, have already transitioned from 100 percent oil-based electricity systems to ones with significant renewable penetration.
THE ISLAND AND REMOTE COMMUNITY ENERGY OPPORTUNITY
RENEWABLE MICROGRIDS | 5

Ima
ge
co
urt
esy
of
Ch
ris
Ro
we
RENEWABLE MICROGRIDS
02

DRIVERS OF CHANGE
The communities described in the casebook transitioned from oil-based microgrids to diverse, renewable
microgrids for different reasons. According to in-depth interviews of individuals involved with the renewable
transition for these islanded microgrids, drivers of change centered around three major themes:
1. COSTS. Many communities faced high costs of electricity from oil-based microgrids (i.e., they are dependent on
expensive fossil-fuel imports such as diesel).
“Economics was a primary driver. Cost of power production far exceeds revenues.” - Mr. Juergen Zimmerman, Coral Bay
2. ENVIRONMENTAL CONSIDERATIONS. Communities expressed concern over the future impacts of climate
change, the corresponding desire to take action and reduce carbon emissions, and their deep cultural
connection to land and nature.
“The people here are of a green ilk.”- Mr. John Booth, Isle of Eigg
3. ABUNDANT LOCAL RESOURCES. All the communities profiled in this casebook have an abundance of local
energy sources available for electricity generation. Wind energy provides the largest addition to the overall energy
mix of the cases profiled here (usually greater than 20 percent). By shifting away from imported oil to rely more on
local resources, communities can reduce the likelihood of system outage due to resource availability constraints.
“All communities are vulnerable to imported fuels; we have a vast [local] wind resource.”- Mr. Glenn Ross, Falkland Islands
THIS CASEBOOK EXPLORES several remote,
islanded microgrids from around the globe,ii sharing
examples of communities transitioning from one
resource (oil) to a diverse set of resources including
wind, solar, biodiesel, hydro, and energy storage.
The examples include small microgrids serving fewer
than 100 people, and larger microgrids serving over
10,000, with a peak demand range from
60 kW to 27 MW. Although the communities
reviewed in this casebook are all unique due to local
grid characteristics, renewable resource availability,
production costs, load profiles, community support,
and opportunities for external funding, they share
many similar drivers of change, challenges, and
lessons learned in the transition from fossil fuels to
renewable microgrids.iii
RENEWABLE MICROGRIDS | 7
RENEWABLE MICROGRIDS
ii While the term “microgrid” is often used to describe many different things, in this casebook we use it to refer to small electricity grids supplying island and remote communities, with no connection to a larger electricity grid.iii In this casebook, we define a renewable microgrid as any microgrid currently generating 30 percent or more of its annual electricity from renewables.

CHALLENGES
Although some of the renewable systems discussed in this casebook have been in successful operation for many
years, communities faced challenges transitioning from an oil-based microgrid. Three of the main challenges to
integrating renewables were grid stability, remote location, and administrative and bureaucratic requirements.
1. GRID STABILITY. Maintaining grid stability with renewable integration proved challenging in many cases.
Maintaining a reliable electricity system for the community’s residents is essential, so system operators must
incorporate renewables, especially those that are variable, in a way that preserves the operation of the overall
system. Using a phased integration approach, operators were able to see how to initially bring a small amount of
renewable technologies online, work with these while balancing the system, and then continue to step up their
renewable penetration by integrating more resources alongside energy storage and advanced controls.iv
“We started adding renewables 18 or 19 years ago, and the challenges have been technical. We had to solve the problems we uncovered as we went.” - Mr. Simon Gamble, King Island
2. REMOTE LOCATION. Procuring and transporting new technologies and equipment as well as getting actual
construction crews on-site presents another challenge for remote locations. Often, only one or two operators live
nearby, so if major technical issues arise, teams must fly in to address the problems.
“The PV system was assembled and tested in Perth, then loaded into a truck and driven (1,500 km) to the site. The concrete feet were also trucked in, after being cast in a location about two and a half hours drive away.” - Mr. David Edwards, Marble Bar & Nullagine
3. ADMINISTRATIVE AND BUREAUCRATIC REQUIREMENTS. A combination of government grants and utility
equity funded the addition of renewables in most cases profiled for this casebook. In light of this, many communities
faced challenges stemming from fund or grant application processes, onerous documentation requirements, and
the need to align bureaucratically imposed requirements with the overall energy transition timeline.
“It was challenging to align the timelines for the grants with the timelines for the project.”
- Mr. Darron Scott, Kodiak
RENEWABLE MICROGRIDS | 8
RENEWABLE MICROGRIDS
iv While there are multiple definitions for renewable penetration, in this casebook we use the term to mean the percentage of annual electricity generation that comes from renewable resources (which is included in a chart for each case). In addition, a chart showing the installed capacity of each type of generation resource is included for each case, which is another way to think about renewable penetration.

LESSONS LEARNED
The pathways pursued by islands and remote communities to develop renewable microgrids provide examples of how
communities might embark on a similar transition. From the cases studied, we have identified several lessons learned
in order to help guide decision making within communities currently considering a transition from oil to renewables.
Transitioning to renewable microgrids can reduce costs. Reducing costs is not always a straightforward process.
Relying on more diversely and renewably powered microgrids led to reduced diesel usage in every situation
reviewed in this casebook. In some cases, reduction in purchased fuel resulted in reduced electricity prices, as
well as reduced operating costs. For many others, governments that provide subsidies to ensure equitable access
to electricity found that the addition of renewables reduced the amount of subsidy required, freeing up taxpayer
dollars for other investments. Creating a project, with the requisite business plan to lower overall costs and attract
investment, is a difficult and lengthy task, but one made easier with a deep understanding of the technologies,
processes, and pitfalls outlined in this document.
Adding renewables enhances microgrid system resiliency and stability. Microgrids with diverse resource mixes are
often less prone to system failure than microgrids that rely on a single resource, since they have multiple resource
options for electricity generation. In addition, when renewables are added to the grid, key components like power
electronics and control systems are added as well, enabling a more stable grid through better controls. At the same
time, relying more on local resources, and less on imported oil, increases overall resiliency for a community.
Energy efficiency is an important component of a renewable microgrid transition. It is well known that energy efficiency
measures such as lighting, more efficient appliances, and adding insulation are more cost effective than any generation
option. The importance of energy efficiency as a starting point for any transition is particularly acute for islands where
space for renewable technologies like wind and solar is typically in short supply. However, most of the profiled cases
underutilize energy efficiency, and indicate that energy efficiency should play a more prominent role in any transition plan.
Energy storage is a key component of largely renewable island and remote community microgrids. Every
community profiled in this casebook has either already integrated or is currently considering the installation of
flywheels, batteries, or pumped hydro energy storage systems. Generally speaking, renewables like solar and
wind can be integrated into diesel-based island and remote community microgrids at penetrations around 10 to 15
percent of annual electricity consumption without causing operational challenges.4 Above 20 percent, it is often
necessary to curtail renewable generation, implement demand response or load-shifting programs, or incorporate
energy storage. However, as penetration of renewable energy increases, energy storage—alongside smart
controls to enable load shifting—becomes an important component of any community’s transition.
RENEWABLE MICROGRIDS
RENEWABLE MICROGRIDS | 9

Ima
ge
co
urt
esy
of
Ch
ris
Ro
we
RENEWABLE MICROGRIDS: 10 CASE STUDIES
03

RENEWABLE MICROGRIDS | 11
RENEWABLE MICROGRIDS: 10 CASE STUDIES
04
10
07 06
05
08
03
09
01
02
01: BONAIRE, THE NETHERLANDS
02: KODIAK, ALASKA, UNITED STATES
03: EL HIERRO, CANARY ISLANDS, SPAIN
04: FALKLAND ISLANDS, UNITED KINGDOM
05: KING ISLAND, TASMANIA, AUSTRALIA
06: MARBLE BAR & NULLAGINE, AUSTRALIA
07: CORAL BAY, AUSTRALIA
08: ISLE OF EIGG, SCOTLAND, UNITED KINGDOM
09: NECKER ISLAND, BRITISH VIRGIN ISLANDS
10: MAWSON STATION, ANTARCTICA
FIGURE 1: THE 10 REVIEWED MICROGRIDS
WE INTERVIEWED UTILITY owners, grid operators, and microgrid engineering experts to develop 10 case
studies from around the globe that integrate a mix of energy efficiency and renewable energy. This diverse set
of examples demonstrates the potential for energy transitions for similar communities around the world. The
microgrids reviewed are illustrated in Figure 1 above. Figure 2 shows what percentage of the average annual
electricity generation in each location comes from renewable sources. In addition to the 10 cases outlined in
this section in detail, Appendix A includes additional information about 13 other islanded or remote microgrids
from across the globe.

SOLAR
RENEWABLE MICROGRIDS | 12
FIGURE 2: AVERAGE ANNUAL ELECTRICITY GENERATION, % RENEWABLE VS. FOSSIL
ICONS KEY
BONAIRE
100
90
80
70
60
50
40
30
20
10
0
KODIAK EL HIERRO FALKLAND ISLANDS
KING ISLAND
MARBLE BAR &
NULLAGINE
CORAL BAY ISLE OF EIGG
NECKER ISLAND
MAWSON
Aver
age
Annu
al G
ener
atio
n (%
)
FOSSIL
RENEWABLE
RENEWABLE MICROGRIDS: 10 CASE STUDIES
>10,000 Population < 100
WIND FLYWHEEL DIESELBATTERYHYDRO

RENEWABLE MICROGRIDS | 13
THE CARIBBEAN ISLAND of Bonaire is famous for its
beautiful marine reefs visited by 70,000 tourists every
year. In 2004, a fire destroyed Bonaire’s existing diesel
power plant. Although disruptive, the event afforded
Bonaire and its residents an opportunity to design a
new electricity generation system from scratch. After
immediately renting diesel generators, the government
and local energy company began jointly creating a plan
to generate 100 percent of Bonaire’s electricity from
renewable sources. The motivation behind the goal of 100 percent renewable electricity was to
reduce the rates that residents pay for electricity, create local jobs, and serve as an example for
other islands and remote communities. Bonaire was one of the first Caribbean islands to set a goal
and develop a plan to move towards a largely renewable future.
Today, almost half of Bonaire’s electricity comes from wind power (44 percent). The 12 wind
turbines installed can provide up to 90 percent of the island’s electricity during times of high
wind. A 100 kWh battery is included in the system and allows time for additional diesel generators
to be started when there is a sudden drop in wind availability. The electricity rates paid by
Bonaire consumers decreased from a peak of $0.50/kWh in 2008, when the island relied on the
temporary diesel generators for electricity, to $0.34/kWh today. Many of Bonaire’s 70,000 annual
tourists explore the island’s famous marine reefs and the new renewable microgrid supports
branding efforts.
Next steps in the island’s energy transformation toward a 100 percent renewable electricity
system include solar farms, additional energy storage, and energy efficiency. The island is also
exploring local algae resources grown in the large salt flats on the island to create biofuel, which
could then be used in existing generators. This could allow Bonaire to operate a 100 percent
renewable electricity system with on average 40 to 45 percent of annual electricity generation
from wind and 55 to 60 percent from biodiesel.
RENEWABLES AS REPLACEMENT— NOT DISPLACEMENT Bonaire was presented with an
opportunity to build a new renewable
electricity system when the existing
diesel power plant was destroyed. This
is in contrast to most cases profiled in
this casebook where diesel generators
are typically partway through their
operating life when a renewable
transition begins. Existing generators
often remain a part of a transitioning
renewable microgrid, especially as
renewables are incrementally added
to the system, and may even remain as
backup power for a transformed system
that operates mostly with renewables.
However, if some or all of the existing
diesel resources in a system are
completely shut down before the end
of their available lifetime, grid operators
must accelerate the depreciation of
existing diesel generators and incur
those added costs into their overall
energy transformation plan. Bonaire
had no such constraints and, although
they chose to use diesel generators to
support the newly constructed wind
turbines, they were able to design their
electricity system around renewables—
not the other way around.
POPULATION INSTALLED CAPACITY PEAK DEMAND AVG. ANNUAL RENEWABLE
GENERATION
AVG. RESIDENTIAL RATE AVG. COMMERCIAL RATE
14,500 25,000 kW 11,000 kW 44% $0.34/kWh $0.34/kWh
BONAIRE, THE NETHERLANDS
56+4456+44
Installed
Capacity (kW)
Average Annual
Generation (%)
DIESEL
WIND
11,000
44
14,000
56
AVG. ANNUAL RENEWABLE GENERATION

RENEWABLE MICROGRIDS | 14
THE BOARD OF the Kodiak Electric Association (KEA)
cooperative set a vision statement in 2007 to cost-
effectively generate 95 percent of its electricity from
renewable resources by 2020. While the community of
Kodiak, an Alaskan island and the second-largest island
in the United States, has been utilizing hydro resources
since 1984, the board’s vision drove the addition of
multiple wind farms and a third hydro turbine, enabling
the community to achieve an average annual renewable
penetration of 99.7 percent. These new components were added in various steps after assessing
how much renewable energy the system could handle and what limitations existed at various
levels of renewable penetration.
The community had to overcome several challenges to develop the system. Kodiak’s remote
location made wind turbine transport and installation difficult. There were issues related to the
timeline of funding, system design, and turbine construction (which, due to extreme weather
variations, needed to take place in the summer). In addition, KEA had little knowledge on how
to manage grid frequency and voltage issues inherent to intermittent wind resources at a time
when there weren’t many examples to draw from. Kodiak’s 3 MW (2 MWh) gel lead-acid battery
contributes to the stability of the system, and KEA recently added two 1 MW flywheel systems.
The flywheel will take over some of the workload from the battery, which currently charges and
discharges around 1,000 times each day. The pairing of multiple types of storage that operate
on different time scales effectively matches system needs, especially when variable renewable
penetration is high. KEA faces additional operational challenges because of Kodiak’s wet and
windy climate, which can cause excess water to collect inside the turbine hubs.
Kodiak’s economy relies heavily on the relatively electricity-intense fishing industry. Stable
electricity rates resulting from the new renewable system have led to an expansion in the fishing
industry, creating more jobs and tax revenue for the local government. The addition of the
flywheel will also enable a much larger crane to be operated at a major shipping pier without
negatively impacting microgrid operation. Since the crane has a highly fluctuating load that can
peak at 3 MW (18 percent of the average KEA load), the flywheel provides spinning reserve that
can handle these large, fast changes in load when the crane is in use.
MULTIPLE BENEFITS FOR COMMUNITY MEMBERSThe addition of more renewable
resources has reduced KEA
customer rates 3.6 percent since
2000. Relying less on diesel fuel also
makes the rates more stable, since
prices are not as closely tied to the
fluctuating price of diesel fuel. Now
that the wind turbines have been
added and the system is over 99
percent renewable, the community
is saving around $4 million per year.
Along with lower electricity rates,
residents can now cost-effectively
switch from oil as a heating fuel
in their homes to electric heat
pumps. This option saves money for
residents of Kodiak and contributes
to a more efficient overall system.
KODIAK, ALASKA, UNITED STATES
45+13+421+17+82
Installed
Capacity (kW)
Average Annual
Generation (%)
DIESEL
WIND
HYDRO
9,000
30,000
82.8
33,000
16.9
0.3
POPULATION INSTALLED CAPACITY PEAK DEMAND AVG. ANNUAL RENEWABLE
GENERATION
AVG. RESIDENTIAL RATE AVG. COMMERCIAL RATE
13,000 75,000 kW 27,800 kW 99.7% $0.14/kWh $0.15/kWh

RENEWABLE MICROGRIDS | 15
THE ISLAND OF El Hierro, the smallest of the
Spanish Canary Islands, has recently completed a
shift to generating 100 percent of its electricity from
renewables. The transition, driven by El Hierro’s
residents, was linked to environmental concerns and
the significant burden of high electricity demand from
the desalination plant. Desalination and its energy
requirements are a main concern due to the island’s
reliance on agriculture as a primary economic activity
(exporting pineapples and mangoes) in an extremely
dry climate. Combining wind with pumped storage
hydro created a renewable microgrid capable of
meeting the island’s unique energy needs.
The project was jointly funded by the local utility
Endesa, the Spanish government, and the Canary
Institute of Technology. Although the transition offered many low-carbon benefits, developers
also had to consider how the new system would impact the island’s physical environment and find
wind turbine locations that did not conflict with the Canary Islands’ status as an environmentally
sensitive, protected territory.
The 100 percent renewable electricity system is part of a wider island program in sustainable
development. Other measures underway include increasing energy efficiency and an island-wide
shift from internal-combustion-powered vehicles to electric ones. As a part of this expansion
into sustainable transportation, the local government has begun to incentivize electric vehicle
purchases, while utility Endesa is studying development, implementation, and maintenance of a
network of charging stations. The current renewable system meets all of the electricity demands
on the island.
LOW-COST STORAGE: PAIRING WIND WITH PUMPED STORAGE HYDRODuring times of abundant wind,
El Hierro’s immediate electricity needs
are met by wind generation, and
excess electricity is used to pump
water up to a large storage lake. When
the wind dies down and can’t meet the
electricity needs of the community,
the water is released and hydro-
powered turbines supply the needed
power. The island includes a location
ideal for this type of energy storage:
an extinct volcano crater where
water can be pumped to a height of
700 meters. While this arrangement
doesn’t suit all locations, El Hierro is
demonstrating the success of pairing
these two renewable options. The size
of the renewable energy system—
including the water storage location,
the electricity-generating pumps used
when the water is released, and the
wind farm—was determined based
on the projected electricity demand
in 2030. This ensures that the system
can continue to provide renewable
electricity to the island and its
residents in the years to come.
EL HIERRO, CANARY ISLANDS, SPAIN
35+33+32100
Installed
Capacity (kW)
Average Annual
Generation (%)
DIESEL
WIND
HYDRO
11,500
11,300 12,700
100
POPULATION INSTALLED CAPACITY PEAK DEMAND AVG. ANNUAL RENEWABLE
GENERATION
AVG. RESIDENTIAL RATE AVG. COMMERCIAL RATE
11,000 35,000 kW 7,600 kW 100% $0.15/kWh $0.17/kWh

FIGURE 3: TYPICAL PUMPED STORAGE SYSTEM WITH WIND (ADAPTED FIGURE)
5
EL HIERRO, CANARY ISLANDS, SPAIN
RENEWABLE MICROGRIDS | 16
Flow direction during excess wind
Flow direction during low wind periods
Energy produced by
the wind farm
Energy produced by the hydro
turbine
Excess wind energy stored by the pump station
Supplemental energy supplied by diesel if ever
necessary
Electric Grid
Wind Farm
Water flows through hydro turbine
Water is pumped up to reservoir
Upper Storage Reservoir
Lower Storage Reservoir
RENEWABLE MICROGRIDS | 17
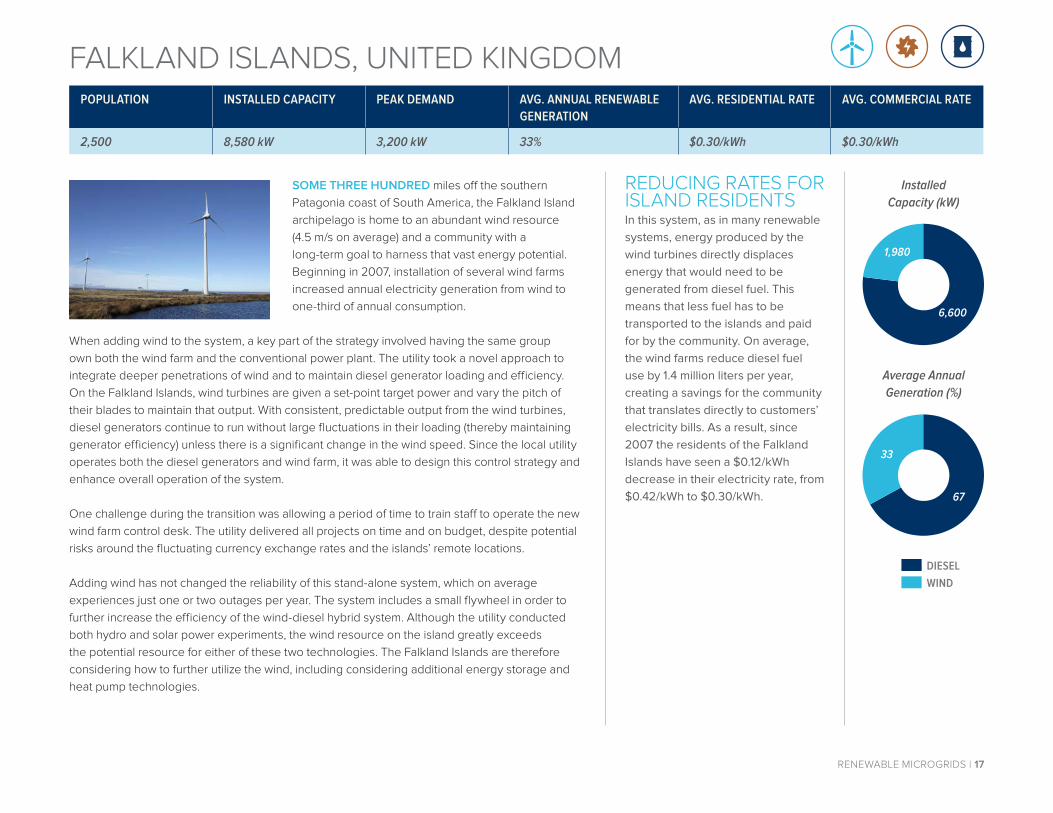
SOME THREE HUNDRED miles off the southern
Patagonia coast of South America, the Falkland Island
archipelago is home to an abundant wind resource
(4.5 m/s on average) and a community with a
long-term goal to harness that vast energy potential.
Beginning in 2007, installation of several wind farms
increased annual electricity generation from wind to
one-third of annual consumption.
When adding wind to the system, a key part of the strategy involved having the same group
own both the wind farm and the conventional power plant. The utility took a novel approach to
integrate deeper penetrations of wind and to maintain diesel generator loading and efficiency.
On the Falkland Islands, wind turbines are given a set-point target power and vary the pitch of
their blades to maintain that output. With consistent, predictable output from the wind turbines,
diesel generators continue to run without large fluctuations in their loading (thereby maintaining
generator efficiency) unless there is a significant change in the wind speed. Since the local utility
operates both the diesel generators and wind farm, it was able to design this control strategy and
enhance overall operation of the system.
One challenge during the transition was allowing a period of time to train staff to operate the new
wind farm control desk. The utility delivered all projects on time and on budget, despite potential
risks around the fluctuating currency exchange rates and the islands’ remote locations.
Adding wind has not changed the reliability of this stand-alone system, which on average
experiences just one or two outages per year. The system includes a small flywheel in order to
further increase the efficiency of the wind-diesel hybrid system. Although the utility conducted
both hydro and solar power experiments, the wind resource on the island greatly exceeds
the potential resource for either of these two technologies. The Falkland Islands are therefore
considering how to further utilize the wind, including considering additional energy storage and
heat pump technologies.
REDUCING RATES FOR ISLAND RESIDENTSIn this system, as in many renewable
systems, energy produced by the
wind turbines directly displaces
energy that would need to be
generated from diesel fuel. This
means that less fuel has to be
transported to the islands and paid
for by the community. On average,
the wind farms reduce diesel fuel
use by 1.4 million liters per year,
creating a savings for the community
that translates directly to customers’
electricity bills. As a result, since
2007 the residents of the Falkland
Islands have seen a $0.12/kWh
decrease in their electricity rate, from
$0.42/kWh to $0.30/kWh.
FALKLAND ISLANDS, UNITED KINGDOM
77+2367+33
Installed
Capacity (kW)
Average Annual
Generation (%)
DIESEL
WIND
1,980
33
6,600
67
POPULATION INSTALLED CAPACITY PEAK DEMAND AVG. ANNUAL RENEWABLE
GENERATION
AVG. RESIDENTIAL RATE AVG. COMMERCIAL RATE
2,500 8,580 kW 3,200 kW 33% $0.30/kWh $0.30/kWh

RENEWABLE MICROGRIDS | 18
JUST SOUTH OF MELBOURNE sits King Island, one
of the many islands belonging to Tasmania in the Bass
Strait. First sighted by explorers in 1798, the island
was not officially settled until the 1900s, but is now
home to approximately 1,800 residents and a story
of transformative renewable energy. The King Island
Renewable Energy Integration Project has helped
the island transition from diesel to renewable-based
electricity. Over the past 20 years, the island’s utility,
Hydro Tasmania, has been installing renewable energy
systems, along with enabling technology such as energy storage, on the island, which now relies on
renewables for 65 percent of annual electricity needs. The transition was driven by economics since
the cost of producing power from diesel generators alone exceeded the utility’s revenues.
Using a stepwise approach, Hydro Tasmania has overcome many renewable integration challenges
to incorporate more renewable resources into the system. The first wind farm was built 18 years ago
as a first step in the energy transition process. When it became clear that additional wind could not
be easily added to the existing system, Hydro Tasmania incorporated a 1.5 MW dynamic resistor
to allow the island’s existing wind turbines to contribute greater amounts of renewable energy and
regulate system frequency. These advances provided reserves that help to avoid problems during
a quick shift in wind availability, and pushed the diesel generators to their minimum loading level,
enabling higher levels of renewables in the system. As Hydro Tasmania sought to obtain further
contribution from the existing renewables, additional technologies became necessary, including two
1 MW flywheels, which work in concert with the dynamic resistor to allow the system to run with the
diesel generators completely off—sometimes for up to 22 hours a day. The flywheels also ensure
that the system can shut down safely in the event of a system disruption. Finally, the microgrid now
includes a 1.5 MWh battery that augments the performance of both the dynamic resistor and the
flywheel by sustaining diesel-off operation through periods of reduced renewable generation.
By combining various renewable resources, storage, and control techniques, King Island has
reduced CO2 emissions by more than 50,000 tons to date, while improving reliability and power
quality. Hydro Tasmania is also experimenting with biodiesel blends in order to further reduce the
amount of oil used to produce electricity on King Island.
PAIRING RENEWABLES WITH SMART METERSAlong with increasing the amount
of renewable resources in its King
Island system, Hydro Tasmania
has incorporated smart meters
with switching capability, deployed
into the community on a voluntary
basis. Smart meters allow the utility
to monitor customer energy use in
real time, including hot water loads
and any local PV production. The
utility monitors and controls up to
several interruptible loads in each
participating home or business,
including water heaters and heating
and cooling systems. Having
real-time information about these
loads allows the utility to control
and flexibly dispatch them as a
virtual power plant. Thanks to the
program’s success, Hydro Tasmania
is investigating the expansion of the
smart meter program to additional
customers on King Island beyond the
110 initial volunteer participants.
KING ISLAND, TASMANIA, AUSTRALIA
67+28+535+63+2
Installed
Capacity (kW)
Average Annual
Generation (%)
DIESEL
WIND
SOLAR
2,450
390
63
6,000
35
2
POPULATION INSTALLED CAPACITY PEAK DEMAND AVG. ANNUAL RENEWABLE
GENERATION
AVG. RESIDENTIAL RATE AVG. COMMERCIAL RATE
1,800 8,840 kW 2,500 kW 65% $0.19/kWh $0.19/kWh

RENEWABLE MICROGRIDS | 19
MARBLE BAR AND NULLAGINE, two remote towns
with adjacent aboriginal communities located in Western
Australia, were originally settled in the late 1800s during
a gold rush. In 2008, the power stations for these grids
were in need of replacement. Horizon Power, a utility
company that operates 34 islanded microgrids and
four connected power systems in Australia, decided
to incorporate renewable resources in the updated
system as a test case for what is possible. No other
nearby towns had included renewables in their systems
at that time. The project was funded partially with a
government grant and partially by Horizon Power. The utility worked with power and automation
engineering company ABB and SunPower to design and build a system for each town that includes
single-axis tracking solar PV, diesel generators, and a kinetic flywheel.
Flywheels, heavy revolving wheels that maintain momentum and store kinetic energy to enhance
system stability, are often used alongside wind turbines. However, in Marble Bar and Nullagine,
flywheels enable the grid to operate on very high penetrations of the local solar resource when it’s
sunny. The flywheel allows the system to ride through short fluctuations (for example when a cloud
passes), and also allows time for diesel generators to be turned on when there is a significant drop
in solar availability or a large increase in load. However, the flywheel must continue spinning in
order to maintain overall system operation, even during the night when no solar power is available,
which results in additional parasitic losses. As seen in several other cases, a flywheel often pairs
better with wind than with solar due to wind’s comparatively higher capacity factor.
Although residents did not see a change in electricity rates, the system has brought other
benefits to Marble Bar and Nullagine. First, the system is now more reliable, and renewables act
as a hedge against increasing oil prices. Second, these two towns are recognized as leaders in
renewable integration, and Horizon Power has been able to share its knowledge of how to design
and build a renewable system with other communities around the world through the Isolated
Power System Developers Forum.
LEADING FIRST WITH ENERGY EFFICIENCYAlong with including solar as a
source of electricity generation in
the new system, both Marble Bar
and Nullagine incorporated new
levels of energy efficiency. As a
result of a customer engagement
campaign, the residents of these
remote communities have an
increased appreciation for how
much energy they use on a daily
basis. Many residents spend a
significant amount of their income
on electricity. Horizon Power
provided energy efficiency audits
to households throughout the
community prior to the integration
of the solar system along with
educational materials about energy
usage and training sessions in
the local language. The energy
audit processes and educational
information ensured overall buy-
in of the new system. Community
members also had the opportunity
to name the new solar systems in
each town.
MARBLE BAR & NULLAGINE, AUSTRALIA
82+1870+30
Diesel (%
Diesel (%
Installed
Capacity (kW)
Average Annual
Generation (%)
DIESEL
SOLAR
508
30
2,240
70
POPULATION INSTALLED CAPACITY PEAK DEMAND AVG. ANNUAL RENEWABLE
GENERATION
AVG. RESIDENTIAL RATE AVG. COMMERCIAL RATE
600 2,748 kW 820 kW 30% $0.19/kWh $0.22/kWh

RENEWABLE MICROGRIDS | 20
CORAL BAY IS HOME to the Ningaloo Reef, where
coral starts right at the shore, forming Australia’s only
fringing reef. This small community’s chief activities are
tourism and fishing, local industries that, until 2006,
were powered entirely by isolated diesel generators. In
2006, the small, remote Australian community made a
big change.
Previously, residents in this community relied on
their own individual generators to provide electricity
without a connected system, similar to the Isle of Eigg in Scotland. The new electricity system,
while not connected to Australia’s larger grid, interconnects local residences and buildings, and
is powered by 45 percent wind (on an annual basis). The new system was grant-funded, and
developed through a power purchase agreement (PPA) with the generating utility, Verve Energy.
In order to balance the intermittent wind resource, the system incorporated two technologies:
low-load diesel generators, and a 500 kW flywheel. The low-load generators are able to
operate down to 10 percent of their rated load with minimal penalties to efficiency, which allows
more of the available wind energy to be utilized (see Figure 4 on the next page for a comparison
of traditional and low-load diesel generator efficiency curves). The flywheel, part of ABB’s
PowerStore solution, provides stability to the overall system. Overall, the system can use up to
97 percent wind power instantaneously, and powers 45 percent of the community’s loads from
wind power annually. Although there’s no baseline to compare electricity rates directly (since
there was previously not a connected system), the cost for individuals has gone down since they
are no longer paying for fuel to run their own generators.
The addition of the system was not without challenges. Many residents were wary of wind turbines
being located so close to town, but a well-designed community education process brought
everyone on board and generated buy-in on the project. Furthermore, construction was difficult
due to the remote location, where getting people on-site to build the system required several days
of travel. Currently, one full-time park employee is located on-site to provide day-to-day support.
HURRICANE-PROOF WIND TURBINESAnother interesting feature of the
Coral Bay system is the use of
Vergnet wind turbines, eight of which
are installed near the community.
The entire turbine can be tilted and
lowered to the ground in the event
of dangerous weather. This process
can be completed by two people in
less than an hour, and once lowered
the turbine can survive up to 300
km/h wind gusts—equivalent to a
Category 3 hurricane—without any
damage.6 The turbines can then
return to normal operation once
extreme weather passes. This same
tilting approach can be used to
perform routine maintenance on the
wind turbine blades. Vergnet wind
turbines currently operate in places
where high winds and hurricanes are
a concern, such as at the Maddens
Wind Farm on Nevis Island in the
Caribbean.
CORAL BAY, AUSTRALIA
77+2355+45
Installed
Capacity (kW)
Average Annual
Generation (%)
DIESEL
WIND
675
45
2,240
55
POPULATION INSTALLED CAPACITY PEAK DEMAND AVG. ANNUAL RENEWABLE
GENERATION
AVG. RESIDENTIAL RATE AVG. COMMERCIAL RATE
140 2,915 kW 600 kW 45% $0.19/kWh $0.22/kWh

FIGURE 4: EXAMPLE OF TRADITIONAL AND VARIABLE-SPEED LOW-LOAD DIESEL GENERATOR EFFICIENCY CURVES.
RENEWABLE MICROGRIDS | 21
CORAL BAY, AUSTRALIA
TRADITIONAL GENERATOR VARIABLE-SPEED LOW-LOAD GENERATOR
45
40
35
30
25
20
15
10
5
0
0 20 40 60 80 100
Load (%)
Effici
ency
(%)

RENEWABLE MICROGRIDS | 22
THE ISLE OF EIGG is a small island off the coast of
Scotland known for its beauty, wildlife (on average 130
bird species are recorded on the island each year), and
renewable electrification project. Prior to 2007, island
residents generated power at homes and businesses
using diesel generators. Furthermore, the buildings and
their diesel generators were stand-alone systems: no
multi-building microgrid existed on the island prior to the
transition. Recognizing the drawbacks that come along with
a non-interconnected electricity system driven by diesel alone, the community created an integrated
plan for a new, connected, all-island electricity system. Community members were involved throughout
the process. “What makes it work so well is that it’s ours [the electricity system],” says John Booth,
formerly a Director of the Isle of Eigg Heritage Trust and Volunteer Project Manager for the system.
Leadership from within the community is a unique feature of the Isle of Eigg’s electricity
transformation. When residents decided that a diverse, connected electricity system would be better
than each home having its own individual generator, they quickly realized that building their own
system would be cheaper than creating an electrical connection to the mainland grid. They also
decided to power their new system almost entirely with the island’s abundant renewable resources—
rain, wind, and sunshine. Since this was a brand new system combining three different renewable
sources of electricity, the community was forced to learn by doing as it transitioned—applying for
grant funding, securing permission to build, finding a contractor to design and build the system, and
training local residents on how to operate and repair the now renewable microgrid.
The system also includes a 720 kWh battery bank in order to guarantee that electricity will be
available at all times. When there is extra power available from renewable resources and the battery
is already fully charged, the system automatically activates heaters that pre-heat community buildings
keeping them warm and dry. Residents have reaped many new benefits from the system, the most
prevalent of which is reliable power availability. Before the microgrid, individual buildings were at risk
of power outages in the event of diesel generator failure. With an interconnected microgrid, risk of
power outages at individual homes has been reduced. Isle of Eigg residents are also now using local
energy resources and much less diesel fuel. A team of local residents has been trained to maintain
the system, which includes four part-time maintenance personnel, forestry jobs to harvest biomass,
and two “green project managers,”7 ensuring reliable electricity for all community members.
A UNIQUE APPROACH TO MANAGING ELECTRICITY USEOn the Isle of Eigg, community
members agree to use electricity
responsibly; each home and
small business is capped at an
instantaneous peak demand of 5
kW, while larger businesses and
buildings can use up to 10 kW at
once. Residents prepay for their
electricity ahead of time via cards
that slot into their electricity meters
and are available for residents to
purchase once per week. It’s rare
that anyone exceeds their maximum
demand limit using this system,
which has resulted in additional
cost savings since no truck rolls are
necessary to shut down or reactivate
building electricity access.
ISLE OF EIGG, SCOTLAND, UNITED KINGDOM
26+10+20+44
13+87
Installed
Capacity (kW)
Average Annual
Generation (%)
DIESEL
RENEWABLES
DIESEL
WIND
SOLAR
HYDRO
50
24
112
64
87
13
POPULATION INSTALLED CAPACITY PEAK DEMAND AVG. ANNUAL RENEWABLE
GENERATION
AVG. RESIDENTIAL RATE AVG. COMMERCIAL RATE
100 250 kW 60 kW 87% $0.31/kWh $0.31/kWh

RENEWABLE MICROGRIDS | 23
IN 1978, ENTREPRENEUR Sir Richard Branson made
a bid to buy a small Caribbean island. As a part of the
Commonwealth Law, non-resident landlords were
required to build a resort on the island or the government
could reclaim ownership. At the time he purchased the
island, Sir Richard Branson took a risk as he lacked the
funds to develop it immediately. Over time, he made a
home out of Necker Island, and situated Necker as a test
bed for an energy transition.8 Prior to 2014, diesel fuel
was the only resource used to generate electricity for
island staff and visiting guests. In 2014, Richard Branson
set down a path to phase out the use of all diesel fuel on the island. Thus far, 300 kW of solar
photovoltaic (PV) have been installed with a single 900 kW wind turbine, a 500 kWh battery, and
advanced microgrid controls planned for installation in 2016.
Necker is not only working to bring as much renewable energy online as possible (with a current
75 percent renewable energy penetration target), but to deliver the additional 25 percent of diesel
reduction by the integration of energy efficiency and smart controls. The goal is to reach 100 percent
reduction in diesel fuel use. In addition to increasing the supply of renewable energy, Necker’s
system designers and contractors are retrofitting existing buildings with more efficient AC units and
upgrading insulation of many of the buildings while adding smart controls to further reduce diesel
consumption. Through these approaches, the island benefits from actually reducing usage,
not just adding generation, pushing Necker Island to the forefront of what is possible with a
renewable microgrid. With the addition of solar, the island is already seeing diesel fuel savings of
15 to 20 percent annually. Once wind and storage come online in the near future, those savings
will increase. The owner and developer of the new system, NRG, plans to incorporate deeper levels
of energy efficiency to reduce overall energy demand, which will move beyond the 75 percent
renewable energy goal.
Currently, the Smart Island Economies team is supporting island partners in developing strategies
for transitions, including a process for open tenders to independent power producers and energy
efficiency providers for the region. Accordingly, Necker Island was the first island to issue an RFP
for design and construction of its new system as a part of the Smart Island Economies program.
SUCCESS THROUGH AN INCREMENTAL PROCESSThe addition of 300 kW of solar on
Necker Island reduced diesel use
by 15 to 20 percent. The various
renewable resources, energy
storage, and controls are being
implemented in phases so that the
impact of each technology can be
measured and validated before the
next phase of the transition begins.
In addition, developers used an
off-site programmable load bank to
create a virtual version of the system
in order to test different scenarios
before actually installing renewable
resources and controls.
44+42+1420+60+20
Installed Capacity (kW) -
Planned
Average Annual
Generation (%) -
Projected v
DIESEL
WIND
SOLAR
900
300
60
960
2020
POPULATION INSTALLED CAPACITY PEAK DEMAND AVG. ANNUAL RENEWABLE
GENERATION
AVG. RESIDENTIAL RATE AVG. COMMERCIAL RATE
60 2,160 kW 400 kW 80% $0.24/kWh $0.24/kWh
v For this example, these are projections for when the planned projects are completed in 2016.
NECKER ISLAND, BRITISH VIRGIN ISLANDS

vi Since Mawson is a research station, the Australian Antarctic Division covers all costs, and rates are not charged to specific customers for electricity use.
RENEWABLE MICROGRIDS | 24
MAWSON IS THE oldest surviving, continuously operated
research station south of the Antarctic Circle, and is the
most distant of the three main Antarctic stations operated
by the Australian Antarctic Division (AAD).
Two unique features made this station an ideal place
to incorporate renewables for electricity generation.
First, its remote location makes reliable delivery of
diesel fuel difficult. Second, the wind resource in and
around Mawson is outstanding. In 2002 and 2003, the AAD built two wind turbines at Mawson
Station, serving on average thirty researchers. Before installation began, the AAD completed an
environmental impact assessment to ensure that the benefits of adding wind turbines outweighed
potential negative ramifications including impacts on wildlife and visuals.
Mawson’s remote location and cold climate led to several challenges while preparing for and installing
two Enercon 300 kW wind turbines. The installation needed to bring in a 100-ton crane, requiring the
provision of a larger than typical icebreaking ship. Once the turbine components reached Antarctica,
bridges at the station had to be strengthened to bear the weight of the vehicles transporting the turbine.
Interestingly, Mawson Station’s electrical loads go beyond thermal comfort, lighting, and plug-loads.
The station also includes some luxuries for residents, such as a spa and a sauna, which require
relatively large amounts of electricity compared to other day-to-day uses. In order to maximize fuel
savings, the AAD worked to educate people about using these amenities only when wind energy is
readily available, rather than at times when the diesel generators would need to turn on.
In 2014 alone, the wind turbines generated enough electricity to reduce Mawson’s diesel consumption
by 288,000 liters, directly saving the AAD $263,000 in fuel costs. The AAD also gained greater
flexibility in scheduling resupply ships; instead of requiring a shipment of diesel fuel at least once per
year to meet the station’s needs, the AAD can now send a refueling shipment every other year. The
success seen at Mawson Station is already spreading, and other nations with operations in Antarctica
have incorporated renewable resources for electricity generation.9 Furthermore, the now 10-year old
wind turbines are still operating at high levels of efficiency—even in the tough winter climate.
RENEWABLES FOR HEATING IN A HARSH CLIMATEThe wind turbines created an
additional impact on Mawson’s
heating supply that’s of note for other
remote microgrids with large heating
requirements. Before adding wind
to the system, two diesel generators
powered Mawson Station and extra
heat from these generators heated
many of the station’s buildings. With
the addition of wind, just one diesel
generator runs for most of the year.
This slashes the diesel requirement,
but it also removes the extra heat
source from the now rarely used
second generator. In response,
the AAD added an electric boiler
to the system in tandem with the
wind turbines. With any extra power
available from the wind turbines,
the electric boiler preheats water
to heat buildings. The boiler is also
connected to Mawson’s system with
a smart inverter, which provides
voltage and frequency support to
the microgrid. The result is similar to
having additional spinning reserves,
since the boiler can ramp its output up
or down quickly when there is a shift
in available wind.
MAWSON STATION, ANTARCTICA
48+5250+50
Installed
Capacity (kW)
Average Annual
Generation (%)
DIESEL
WIND
600
50
550
50
POPULATION INSTALLED CAPACITY PEAK DEMAND AVG. ANNUAL RENEWABLE
GENERATION
AVG. RESIDENTIAL RATE AVG. COMMERCIAL RATE
30 1,150 kW 450 kW 50% N/Avi N/A
IMA
GE
: © J
US
TIN
CH
AM
BE
RS
/AU
ST
RA
LIA
N A
NTA
RC
TIC
DIV
ISIO
N

GLOSSARY OF KEY TERMS
04

AVERAGE ANNUAL RENEWABLE GENERATION—
The percentage of electricity in a system that is
generated from renewable resources over the
course of a year; this is the definition of renewable
penetration used in this casebook.
AVERAGE COMMERCIAL RATE—The average rate
that a commercial customer pays for electricity today
(after the renewable transition).
AVERAGE RESIDENTIAL RATE—The average rate
that a residential customer pays for electricity today
(after the renewable transition).
DYNAMIC RESISTOR—A large resistive load, which
can be varied rapidly. On King Island, a dynamic
resistor is used to absorb excess wind generation
rather than spill it through shutting down or throttling
back wind turbines. Since the resistor can be adjusted
rapidly, this effectively converts spilled wind into
“spinning reserve” that can be used to supplement
diesel generation. Maintaining the power balance
between generation and demand in this way allows
the resistor to maintain system frequency.
ELECTRIC HEAT PUMP—A device that uses
electricity to move heat from a cool space (such as
outdoors) to a warm space (such as indoors), and can
be used as an alternative to a furnace.
ENERGY STORAGE—Technologies including but not
limited to batteries, pumped hydro, and/or flywheels
that store energy to perform work at a later time.
Storage applications range from managing second-
to-second variations in power output to storing
energy over multiple days.
FLYWHEEL—A rotating mechanical device used to
store kinetic energy.
INSTALLED CAPACITY—The total size of the
various installed sources of electricity generation, in
kilowatts.
MICROGRID—While the term “microgrid” is often
used to describe many different things, in this
casebook we use it to refer to small electricity grids
supplying island and remote communities, with no
connection to a larger electricity grid.
PEAK DEMAND—The highest electricity demand
experienced by a system at a single point in time, in
kilowatts.
PROGRAMMABLE LOAD BANK—Test equipment
that emulates electric loads in order to perform
functional tests of batteries and power supplies, such
as solar panels. Being programmable allows tests to
be automated, and allows changing load profiles to
be used for testing the power source.
RENEWABLE MICROGRIDS | 26
GLOSSARY OF KEY TERMS
RELIABILITY—The ability to deliver electricity to all
points of consumption, in the quantity and with the
quality demanded by the customer.
RESILIENCE—The ability of the electricity system to
resist failure and rapidly recover from breakdown.
SPINNING RESERVE—Extra generating capacity
that is immediately available to meet an increase
in load while also helping to maintain system
frequency.

APPENDICES
05

RENEWABLE MICROGRIDS | 28
APPENDIX A: ADDITIONAL ISLANDED OR REMOTE MICROGRIDS
04
10
07 06
05
11
08
03
13
09
01
02
01: Bonaire, The Netherlands
02: Kodiak, Alaska, United States
03: El Hierro, Canary Islands, Spain
04: Falkland Islands, United Kingdom
05: King Island, Tasmania, Australia
06: Marble Bar & Nullagine, Australia
07: Coral Bay, Australia
08: Isle of Eigg, Scotland, United Kingdom
09: Necker Island, British Virgin Islands
10: Mawson Station, Antarctica
11: Fiji
12: Graciosa Island, Portugal
13: Flores Island, Portugal
14: Northern Cook Islands, New Zealand
15: Tokelau, New Zealand
16: Ti Tree, Kalkaringdi, Lake Nash,
Australia
17: Denham, Australia
18: Monte Trigo, Cape Verde
19: Hopetoun, Australia
20: Ultsira, Norway
21: Floreana, Galapagos, Ecuador
22: Rottnest Island, Australia
23: Over Yonder Cay, Bahamas
12
1415
1617
19
20
22
23
21
18

RENEWABLE MICROGRIDS | 29
APPENDIX A: ADDITIONAL ISLANDED OR REMOTE MICROGRIDS
COUNTRY CITY POPULATION AVERAGE
ANNUAL
RENEWABLE
GENERATION
(%)
AVERAGE
RESIDENTIAL
RATE
($/kWh)
AVERAGE
COMMERCIAL
RATE
($/kWh)
OVERALL
GRID
CONNECTION
BASELINE
GRID YEAR
INSTALLED
CAPACITY
(kW)
PEAK
DEMAND
(kW)
Fiji 881,000 60 0.08 0.19 physical
islands
1980 159,000 150,000
Portugal Graciosa
Island
5,000 70 0.17 0.15 physical
island
2013 9,600 2,200
Portugal Flores Island 3,900 50 0.17 0.15 physical
island
2009 6,080 2,000
New Zealand Northern
Cook Islands
1,441 95 0.45 0.64 physical
islands
2014 2,286 151
New Zealand Tokelau 1,400 100 physical
island
2011 1,727 214
Australia Ti Tree,
Kalkaringdi,
Lake Nash
1,139 30 0.22 0.26 remote grids 2012 2,400 770
Australia Denham 800 50 0.22 0.32 remote grid 1997 2,410 1,200
Cape Verde Monte Trigo 600 95 remote grid 2011 47.3 3.75
Australia Hopetoun 350 40 0.16 0.32 remote grid 2006 3,440 650
Norway Ultsira 212 100 physical
island
2003 1,255 55
Ecuador Floreana,
Galapagos
200 100 0.091 0.092 physical
island
2009 159 50
Australia Rottnest
Island
100 40 0.42 physical
island
2005 1,240 560
Bahamas Over Yonder
Cay
0 96 physical
island
2009 1,075 400
FIGURE 5

RENEWABLE MICROGRIDS | 30
APPENDIX B: LIST OF INTERVIEWEES
CASE LOCATION ORGANIZATION INTERVIEWEE
Bonaire, The Netherlands Contour Global Roy Montero
Kodiak, Alaska, United States Kodiak Electric Association Darron Scott
El Hierro, Canary Islands, Spain Gorona del Viento Christina Clavijo
Falkland Islands, United Kingdom Falkland Islands Government Glenn Ross
King Island, Tasmania, Australia Hydro Tasmania Simon Gamble
Marble Bar & Nullagine, Australia Horizon Power David Edwards
Coral Bay, Australia ABB Juergen Zimmerman
Isle of Eigg, Scotland, United Kingdom Isle of Eigg Heritage Trust John Booth
Necker Island, British Virgin Islands Virgin Adam Simmonds
Mawson Station, Antarctica Australian Antarctic Division David Waterhouse

ENDNOTES
1 Renewable Energies for Remote Areas and Islands (Remote), p. 18—22, IEA-RETD, April 2012. http://iea-retd.org/wp-content/uploads/2012/06/IEA-RETD-REMOTE.pdf; and
Remote Microgrids: Commodity Extraction, Physical Island, Village Electrification, and Remote Military Microgrids: Global Market Analysis and Forecasts, Navigant Research, 2013.2 U.S. Energy Information Administration, Electric Power Monthly, July 2015, http://www.eia.gov/electricity/monthly/pdf/epm.pdf3 C. Barton, L. Kendrick, and Malte Humpert. “The Caribbean has some of the world’s highest energy costs- now is the time to transform the region’s energy market,”
InterAmerican Development Bank, 2014, http://blogs.iadb.org/caribbean-dev-trends/2013/11/14/the-caribbean-has-some-of-the-worlds-highest-energy-costs-now-is-the-time-to-
transform-the-regions-energy-market/4 J. Enslin, “Grid Impacts and Solutions of Renewables at High Penetration Levels,” Quanta Technology, http://quanta-technology.com/sites/default/files/doc-files/Grid-Impacts-
and-Solutions-of-Renewables-Executive-Summary.pdf5 J.I. San Martin, I. Zamora, J.J. San Martin, V. Aperribay, and P. Eguia, “Energy Storage Technologies for Electric Applications,” International Conference on Renewable Energy and
Power Quality (ICREPQ’11), April 13-15, 2011, http://www.sc.ehu.es/sbweb/energias-renovables/temas/almacenamiento/almacenamiento.html6 “Wind for Microgrids,” Northern Power Systems, 2013, http://www.northernpower.com/wp-content/uploads/2014/06/Wind-for-Microgrids-Application-N-Amer.pdf7 “The Ashden Awards for sustainable energy,” Ashden Awards Case Study Isle of Eigg Heritage Trust, Scotland, May 2010.8 L. Murray, “How Richard Branson bought Necker Island,” Virgin Entrepreneur, 2015, http://www.virgin.com/entrepreneur/how-richard-branson-bought-necker-island9 A. Schwartz, “Antarctica Turning to Solar, Wind Power,” CleanTechnica, January 2009, http://cleantechnica.com/2009/01/22/antarctica-turning-to-solar-wind-power/
RENEWABLE MICROGRIDS | 31

RO
C
KY MOUNTAIN
INSTIT UTE
WAR R O O M
CARBON