c - 2: glides, climbs, range, & endurance c - 1: equation
TRANSCRIPT

AE317 Aircraft Flight Mechanics & Performance
UNIT C: Performance
ROAD MAP . . .
C-1: Equation of Motion
C-2: Glides, Climbs, Range, & Endurance
C-3: Takeoff, Landing, & Turn
C-4: V-n Diagram & Constraint Analysis
C-5: Performance Analysis Examples
Brandt, et.al., Introduction to Aeronautics: A Design Perspective
Chapter 5: Performance
5.17 Performance Analysis Example
Unit C-5: List of Subjects
F-16 Performance Analysis
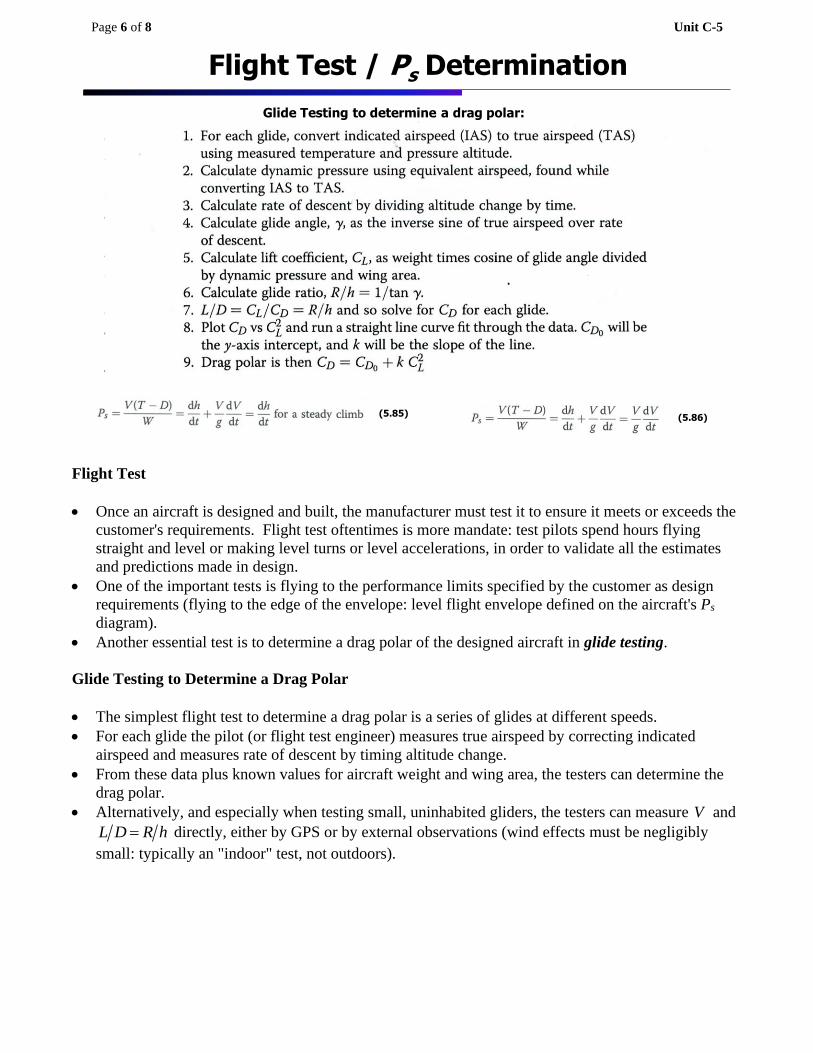
Flight Test / Ps Determination

Page 2 of 8 Unit C-5
F-16 Performance Analysis: Aircraft Parameters
• Aerodynamic analysis results from Unit B-3:
o Maximum lift coefficient: max
1.21LC = takeoff) / max
1.37LC = and 0
0.05DC = landing)
o Drag polar calculation results => Table 5.5
• Engine thrust & TSFC (Pratt & Whitney F-100-220):
o Static (sea-level) installed thrust: SL_dry 11,200 lbT = with TSFC: SL
0.8tc h=
( )SL SLAT T = (5.11)
and ( )SL SLSL SLt t tc c Temp Temp c a a= = (5.15)/(5.16)
o Thrust with AB (wet thrust): SL_wet 17,500 lbT = with TSFC: SL
2.46tc h=
( )( )SL SL 1 0.7AT T M = + (5.12)
and ( )SL SLSL SLt t tc c Temp Temp c a a= = (5.15)/(5.16)
• Aircraft maximum takeoff gross weight: TO 36,800 lbW =
• (Table 1.2) Specific excess power: the maneuver weight ( )manW , which is defined as the aircraft
weight with 50% internal fuel, 2 AIM-9 Side Winder missiles, and full load of 20-mm cannon
ammunition for a total weight of 21,737 lb.
o F-16 internal fuel capacity is 6,972 lb, then the weight of full-fuel is: 25,223 lb
o Zero-fuel weight is: 18,251 lb
o For loiter and cruise problems: starting weight 25,000 lb / ending weight 20,000 lb.
Glide Performance
• The simplified performance analysis (minimum drag at zero lift: 2 0k = ). This is not exactly the
case for F-16, but a good conservative assumption (actual aircraft will do better performance).
• The best glide range (maximum glide ratio) is achieved when lift-to-drag ratio is maximum:
( )0
max 1max
1 111.24
2 2 0.117 0.0169
L
D D
CL
D C k C
= = = =
• Hence, F-16 will glide 11.24 nautical miles for every 6,076 ft (1 nautical mile) of altitude lost.
F-16 Performance Analysis (1)

Page 3 of 8 Unit C-5
• Glide speed (for the best glide range) can be found using "induced drag = parasite drag" for the best
glide condition: 0
2
1D LC k C= . For an altitude of 10,000 fth = :
0
2
1D LC k C= => 0
1
0.01690.38
0.117
D
L
CC
k= = =
( )
( )( )( )best_glide_range 3 2
2 21,737 lb2466 ft s
0.001756 slug ft 300 ft 0.38L
WV
SC= = =
• The minimum sink rate is at the velocity for minimum power required, where 0
2
13 D LC k C= :
0
2
1D LC k C= => ( )
0
1
3 3 0.01690.66
0.117
D
L
CC
k= = =
( )
( )( )( )min_sink 3 2
2 21,737 lb2353 ft s
0.001756 slug ft 300 ft 0.66L
WV
SC= = =
0
2
13 D LC k C= => 0 0 0 0
2
1 3 4D D L D D DC C k C C C C= + = + = => ( )0
24 0.5D DD C qS C V S= =
=> ( )( )( )( ) ( )23 24 0.0169 0.5 0.001756 slug ft 353 ft s 300 ft 2, 218 lbD = =
( )( )353 ft s 2,218 lbmin_sink_rate sin 36 ft s
21,737 lb
V DV
W
= = = =
Climb Performance (Military, or "no afterburner" Thrust)
• The best angle of climb in military thrust is achieved at ( )max
L D . At h = 10,000 ft:
0
2
1D LC k C= => 0 0 0 0
2
1 2D D L D D DC C k C C C C= + = + = => ( )0
22 0.5D DD C qS C V S= =
=> ( )( )( )( ) ( )23 22 0.0169 0.5 0.001756 slug ft 353 ft s 300 ft 1,933 lbD = =
• Thrust available (military power: no AB) is:
( ) ( )3 3
SL SL 11,200 lb 0.001756 slug ft 0.002377 slug ft 8,273 lbAT T = = =
• Hence, the best angle of climb is:
8,273 lb 1,933 lbsin 0.292
21,737 lb
T D
W
− −= = = => 17 deg =
Maximum rate of climb will occur where ( )V T D− is maximum. At 10,000 fth = :
( )( ) ( )466 ft s 8,273 lb 1,933 lb
rate_of_climb 136.1 ft s 8,164 ft min21,737 lb
V T DR C
W
− −= = = = =
Loiter and Cruise Performance (Range & Endurance)
• Best endurance at 10,000 fth = will be achieved at the speed for ( )max
L D .
SL
o o
SL 0.8 483.1 R 518.69 R 0.77t tc c T T h h= = =
• Using the Breguet endurance equation:
( )1
2
1 1 25,000 lbln 11.24 ln 3.26
0.77 20,000 lb
L
t D
C W hE h
c C W
= = =
F-16 Performance Analysis (1) (Continued)

Page 4 of 8 Unit C-5
• Maximum range is achieved for the airspeed where 0
2
13D LC k C= :
( )0
1
0.01690.22
3 3 0.117
D
L
CC
k= = = and
0 0 0 0
2
1
1 40.0225
3 3D D L D D DC C k C C C C= + = + = =
( )1 21 2 0.22
20.80.0225
L
D
C
C= =
• Maximum range is: ( )1 2
1 2 1 2
1 2
2 2 L
t D
CR W W
S c C= − =
( )( )( )( ) ( )1 2 1 2
2
2 2 20.8 25,000 lb 20,000 lb 400.6 nautical miles
0.770.001756 ft s 300 ft
h= − =
Specific Excess Power
• (Table 1.2) Sustained load factor 9 g at M = 0.9 at h = 5,000 ft is required. The drag polar values
(Table 5.5) are linearly interpolated:
( ) 0 _1.05 0 _ 0.86
0 0 _0.860.9 0.86 0.022
1.05 0.86
D D
D D
C CC C
−= + − =
−
( ) 1_1.05 1_ 0.86
1 1_ 0.86 0.9 0.86 0.1191.05 0.86
k kk k
−= + − =
−
• At 0.9M = and 5,000 fth = , ( )0.9 1,097.1 ft s 987.4 ft sV Ma = = =
( )( ) ( )23 2
21,737 lb0.073
0.5 0.002048 slug ft 987.4 ft s 300 ftL
WC
qS= = =
( )0
22
1 0.0022 0.119 0.073 0.023D D LC C k C= + = + =
F-16 Performance Analysis (2)

Page 5 of 8 Unit C-5
• Specific excess power (Ps) can be calculated as:
( )( )( ) ( )23 20.023 0.5 0.002048 slug ft 987.4 ft s 300 ft 6,889 lbR DD T C qS= = = =
( )( )SL SL 1 0.7 24,557 lbAT T M = + = (turbojet with afterburner)
( ) ( )( )24,577 lb 6,889 lb 987.4 ft s803.5 ft s
21,737 lbs
T D VP
W
− −= = =
Thrust and Drag Curves
• The methods used in Ps calculation to evaluate thrust ( )AT for both dry (without AB) and wet (with
AB), as well as drag ( )RT at a specific Mach number and altitude can be used to generate thrust and
drag curves, similar to fig. 5.13. Fig. 5.49 is F-16 at h = 10,000 ft.
Takeoff
• With given max
1.21LC = for takeoff, with M = 0.15 to calculate the average takeoff thrust:
( )( )SL SL 1 0.7 19,337 lbAT T M = + =
( )
( )( )( )( )max
22
TOTO 3 2 2
1.44 25,223 lb1.441,705 ft
0.002377 slug ft 300 ft 1.21 32.2 ft s 19,337 lbL
Ws
SC gT= = =
Landing
• With given max
1.37LC = and 0
0.05DC = for landing, with landing weight of 20,000 lb:
( ) ( ) ( )( )
( )( )( )max
stall 3 2
2 20,000 lb20.7 0.7 1.3 0.7 1.3 0.7 1.3 202 ft s
0.002377 slug ft 300 ft 1.37L
L
WV V
SC= = = =
( )( )( ) ( )0
23 20.05 0.5 0.002377 slug ft 202 ft s 300 ft 729.9 lbDD C qS= = =
( )max
2
0.7
1.69
L
LL
L L V
Ws
SC g D W L = =
+ −
( )
( )( )( ) ( )
2
3 2 2
1.69 20,000 lb2,003 ft
0.002377 slug ft 300 ft 1.37 32.2 ft s 729.9 lb 0.5 20,000 lb 0= =
+ −
F-16 Performance Analysis (2) (Continued)
Page 6 of 8 Unit C-5
Flight Test
• Once an aircraft is designed and built, the manufacturer must test it to ensure it meets or exceeds the
customer's requirements. Flight test oftentimes is more mandate: test pilots spend hours flying
straight and level or making level turns or level accelerations, in order to validate all the estimates
and predictions made in design.
• One of the important tests is flying to the performance limits specified by the customer as design
requirements (flying to the edge of the envelope: level flight envelope defined on the aircraft's Ps
diagram).
• Another essential test is to determine a drag polar of the designed aircraft in glide testing.
Glide Testing to Determine a Drag Polar
• The simplest flight test to determine a drag polar is a series of glides at different speeds.
• For each glide the pilot (or flight test engineer) measures true airspeed by correcting indicated
airspeed and measures rate of descent by timing altitude change.
• From these data plus known values for aircraft weight and wing area, the testers can determine the
drag polar.
• Alternatively, and especially when testing small, uninhabited gliders, the testers can measure V and
L D R h= directly, either by GPS or by external observations (wind effects must be negligibly
small: typically an "indoor" test, not outdoors).
Flight Test / Ps Determination
Glide Testing to determine a drag polar:
(5.85) (5.86)

Page 7 of 8 Unit C-5
Solution (5.16)
(1) first, calculate airspeed for each flight by dividing distance by time. Remember that true airspeed
will be based on the distance flown, which will be the hypotenuse of the triangle that has launch height
and glide distance as the other two legs. Results of these calculations are shown in Table 5.7.
(2) second, calculate dynamic pressure for each flight using 20.5q V= . For this example, use
standard sea-level density. Then, calculate lift coefficient for each flight using: ( )LC W qS= .
(NOTE) actually, L W= is not exactly true. Rather, cosL W = in glide (lift is slightly less than
weight). However, glide angle is small and cos is approximately 1. Making this correction has
negligible effect on the calculated lift coefficients. Results of calculation is given in Table 5.8.
(3) third, calculate L DC C L D R h= = and then solve DC for each flight. Then plot DC v.s.
2
LC and
fit a straight line through the data, as shown in fig. 5.50. The y-axis intercept is 0DC and the slope of the
line is k . Calculations are shown in Table 5.9.
Example C-5-1(Flight Test)
A small balsawood glider was flown at different glide speeds. The results are shown in Table 5.6. Determine the drag polar.
Example 5.16

Page 8 of 8 Unit C-5
Ps Determination
• The Ps diagrams published in an aircraft's flight manual or tactics manuals are determined, whenever
possible, by actual flight testing.
• The 2 most common maneuvers used for these are sawtooth climbs and level accelerations.
o Sawtooth climbs are a series of climbs made at different speeds in much the same way glide
testing was described in the previous section (opposite of glide test):
( )s
V T D dh V dV dhP
W dt g dt dt
−= = + = (5.85) steady climb
o For level acceleration:
( )s
V T D dh V dV V dVP
W dt g dt g dt
−= = + = (5.86) level acceleration
Solution (5.17)
For steady climb:
( ) 2,000 ft40 ft s
50 ss
V T D dh V dV dhP
W dt g dt dt
−= = + = = =
Solution (5.18)
First, convert KIAS into ft/s TAS using ICeT:
( )300 KIAS 300 KIAS 2 knots 298 KCASpV+ = + − =
( ) ( )298 KCAS 298 KCAS 0.989 294.7 KEASf = =
3
SL
3
0.002377 slug ft294.7 KEAS 294.7 KEAS 342.9 KTAS
0.001756 slug ft
= =
1.69 ft s342.9 KTAS 579.5 ft s
knotV= =
Using the same ratios, 305 KIAS 295 KIAS 10 KIAS 11.5 KTAS 19.45 ft sV = − = = =
For level acceleration:
( )2
579.5 ft s 19.45 ft s175 ft s
32.2 ft s 2 ss
V T D dh V dV V dV V VP
W dt g dt g dt g t
− = = + = = = =
Example C-5-2(Ps Determination)
An aircraft performing sawtooth climbs executes a climb from 9,000 ft to 11,000 ft on a standard day. If the climb takes 50 seconds, what is the aircraft’s Ps at 10,000 ft and the flight conditions of the test? Assume true airspeed was constant during the climb.
Example 5.17
An aircraft performing a level acceleration, accelerates from 295 KIAS to 305 KIAS in 2 seconds at 10,000 ft on a standard day. If kts, what is the aircraft’s Ps at 10,000 ft and 300 KIAS for the flight
conditions of the test? Assume altitude remains constant throughout the test.
Example 5.18