by laxmi narayan sethi, hillolmoy chakraborty and jesmine lyngdoh department of agricultural...
TRANSCRIPT

By
Laxmi Narayan Sethi, Hillolmoy Chakraborty and Jesmine Lyngdoh
Department of Agricultural EngineeringM. Tech (3rd Sem) in WRDM
Assam University (A Central University), Silchar, India
Spatial and temporal analysis of rainfall data of the
Barak Valley.
Statistical and probability analysis of rainfall for
crop planning.
Planning for High-tech agricultural practices
04/18/23Spatio-temporal Rainfall Analysis for Crop Planning in Barak Valley of North East of India 2
OBJECTIVES

MATERIALS AND METHODS Study Area Barak valley (latitude 24o8′ to 25o8′ N and longitude 92o15′ to 93o15′ E and with
altitude of 31.40 m from the mean sea level) of Assam State, India Geographical area of 6,922 km2 (8.84% of state) with three districts, viz. Cachar,
Hailakandi, and Karimganj.
3
Data Monitoring and Rainfall AnalysisThe study area is covered by nine rain gauge stations in the Barak valley (Annapurna Ghat, Lakhipur, Dhalai, Amraghat, Silcoorie located in Cachar district; Karimganj and Badarpur Ghat in Karimganj district; and Gharmura and Matijuri located in Hailakandi district). The rainfall data were collected on daily basis for nine numbers of rain gauge stations in the valley.The spatial variability of rainfall considers the pattern of rainfall in different stations, and the valley and the temporal variability of rainfall considers the long term variation in monthly, seasonally (Summer, Kharif and Rabi) and yearly basis.Probability analysis was carried out using the SMADA (Stormwater Management and Design Aid, version 6.0) software.
RESULTS AND DISCUSSION
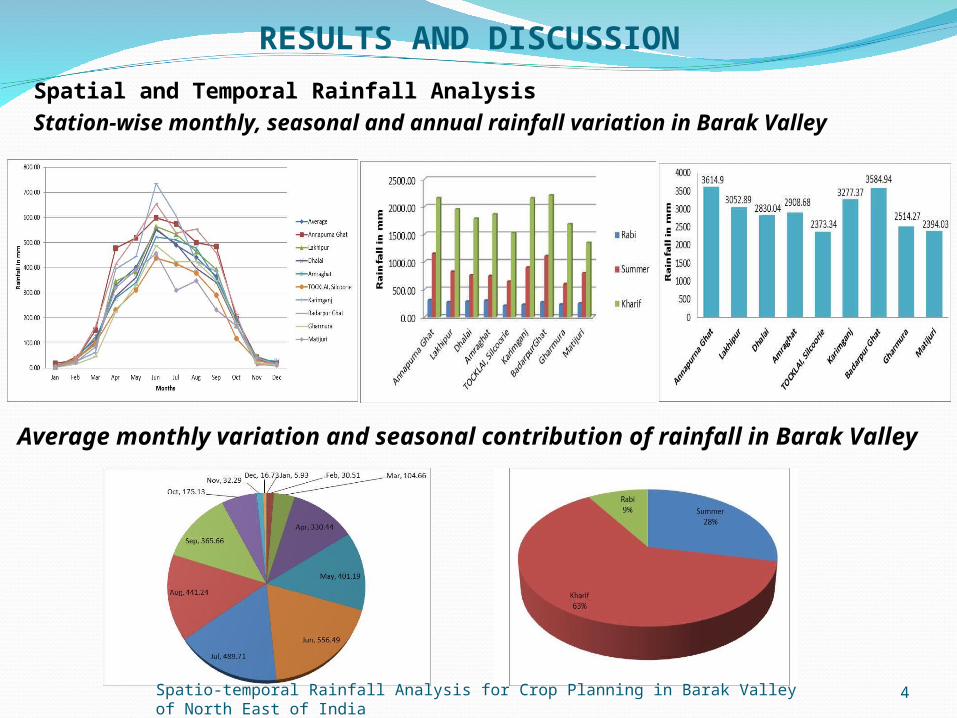
Spatial and Temporal Rainfall Analysis
Station-wise monthly, seasonal and annual rainfall variation in Barak Valley
4
Average monthly variation and seasonal contribution of rainfall in Barak Valley
Spatio-temporal Rainfall Analysis for Crop Planning in Barak Valley of North East of India

5
RESULTS AND DISCUSSION (CONTD.)
Station Name Rainfall Variability (%)
Summer Kharif Rabi Annual
Annapurna Ghat 44.98 22.81 47.34 26.23
Lakhipur 55.40 18.95 59.19 25.24
Dhalai 34.52 18.40 52.20 18.85
Amraghat 40.38 16.93 55.50 18.65
Silcoorie 34.19 15.48 50.27 15.46
Karimganj 43.22 21.31 51.87 24.37
Badarpur Ghat 35.83 18.21 31.05 19.97
Gharmura 51.28 14.60 46.89 16.45
Matijuri 29.36 36.13 55.99 24.95
Parameter Kharif (Jun –Sep) Summer (Mar – May) Rabi (Oct – Feb) AnnualCachar
Mean Rainfall (mm)% of ContributionStandard DeviationCV (%)
1857.1362.83
232.6212.53
824.5327.89
192.4123.34
274.199.28
40.7014.84
2955.97100
447.5315.14
KarimganjMean Rainfall (mm)% of ContributionStandard DeviationCV (%)
2180.4963.5537.951.74
1003.4329.24
145.4714.50
247.247.21
34.0713.78
3431.16100
217.486.34
HailakandiMean Rainfall (mm)% of ContributionStandard DeviationCV (%)
1515.6561.76
239.1215.78
698.5828.47
140.0820.05
239.937.78
14.015.84
2454.16100
85.023.46
Barak valleyMean Rainfall (mm)% of ContributionStandard DeviationCV (%)
1853.1062.82
299.4316.16
836.2928.35
188.2022.50
260.598.83
35.5613.65
2950.05100
475.7416.13
Seasonal and annual statistical analysis of three districts of Barak Valley.
Rainfall variability and statistics Station and district-wise seasonal and annual rainfall variability (%)

Monthly statistical analysis of three Districts and entire Barak Valley
Parameter Jan Feb Mar Apr May Jun Jul Aug Sep Oct Nov Dec TotalCachar
Mean Rainfall (mm)
8.30 36.48 116.74 324.10 383.68 534.67 505.99 443.44 373.03 169.72 39.27 20.42 2955.97
% of Contribution 0.28 1.23 3.95 10.96 12.98 18.09 17.12 15.00 12.62 5.74 1.33 0.69 100.00
Standard Deviation 13.36 37.19 92.17 240.10 113.73 169.82 98.06 147.80 154.93 82.98 39.37 41.83 561.46
CV (%) 160.96 101.96 78.95 74.08 29.64 31.76 19.38 33.33 41.53 48.89
100.26
204.89 18.99
KarimganjMean Rainfall (mm)
2.63 27.85 114.26 404.19 484.99 695.18 572.33 490.34 422.64 190.55 14.97 11.25 3431.16
% of Contribution 0.08 0.81 3.33 11.78 14.13 20.26 16.68 14.29 12.32 5.55 0.44 0.33 100.00
Standard Deviation 5.27 32.48 81.49 277.23 137.60 202.56 192.24 143.58 158.48 68.61 17.80 19.09 677.16
CV (%) 200.33 116.63 71.32 68.59 28.37 29.14 33.59 29.28 37.50 36.01
118.95
169.74 19.74
HailakandiMean Rainfall (mm)
3.30 18.24 64.85 272.54 361.19 472.36 366.40 386.63 290.27 173.23 32.19 12.98 2454.15
% of Contribution 0.13 0.74 2.64 11.11 14.72 19.25 14.93 15.75 11.83 7.06 1.31 0.53 100.00
Standard Deviation 7.57 27.66 48.04 227.86 134.02 222.83 148.56 142.51 84.59 68.87 42.39 32.72 442.44
CV (%) 229.70 151.62 74.07 83.61 37.11 47.18 40.55 36.86 29.14 39.76
131.71
252.06 18.03
Barak valleyMean Rainfall (mm)
4.74 27.52 98.62 333.61 409.95 567.40 481.57 440.13 361.98 177.83 28.81 14.88 2947.09
% of Contribution 0.16 0.93 3.35 11.32 13.91 19.25 16.34 14.93 12.28 6.03 0.98 0.50 100.00
Standard Deviation 7.94 31.04 62.18 240.85 109.35 169.47 120.40 115.84 99.99 59.55 31.69 30.53 446.90
CV (%) 167.55 112.79 63.05 72.20 26.67 29.87 25.00 26.32 27.62 33.49
110.01
205.14 15.16
6

7
RESULTS AND DISCUSSION (CONTD.)
Raingauge Station
Occurrence of Maximum Rainfall
Occurrence of Minimum Rainfall Average Annual
Rainfall (mm)Year Amount (mm)
Year Amount (mm)
Annapurna Ghat 2005 5155.30 2006 2235.90 3614.90
Lakhipur 2010 4674.90 2002 2029.90 3052.89
Dhalai 2010 3644.80 2006 1881.20 2830.04
Amraghat 2010 3809.00 2006 2017.80 2908.68
Silcoorie 2010 3082.70 2006 1875.30 2373.34
Karimganj 2004 4259.40 2008 1596.10 3277.37
Badarpur Ghat 2010 4854.20 2006 2598.50 3584.94
Gharmura 2002 2914.10 2009 1697.80 2514.27
Matijuri 2007 3053.30 2009 1254.50 2394.03
Station-wise maximum, minimum and annual average rainfall in the Barak Valley
Station Name Summer (Mar – May) Kharif (Jun –Sep) Rabi (Oct – Feb) Annual (mm)
Annapurna Ghat 1148.81 2157.74 308.35 3614.90
Lakhipur 824.38 1953.87 274.00 3052.89
Dhalai 761.42 1785.52 283.10 2830.04
Amraghat 743.38 1865.34 299.96 2908.68
Silcoorie 644.64 1523.17 205.53 2373.34
Karimganj 900.57 2153.65 223.15 3277.37
Badarpur Ghat 1106.29 2207.32 271.33 3584.94
Gharmura 599.52 1684.73 230.02 2514.27
Matijuri 797.63 1346.56 249.84 2394.03
Average 836.29 1853.10 260.59 2950.05
Station-wise mean seasonal and annual rainfall (mm) at different stations in the Barak Valley

8
Rainfall Probability AnalysisExpected monthly, seasonal and annual rainfall in Barak Valley
RESULTS AND DISCUSSION (CONTD.)
Spatio-temporal Rainfall Analysis for Crop Planning in Barak Valley of North East of India
CONCLUSION
Barak valley receives average rainfall of 2950 mm during 2001-2010 which is above normal rainfall of Assam state (2818 mm).
The heavy rainfall experiences at Karimganj district 3431.16 mm followed by Cachar 2955.97 mm and Hailakandi 2454.15 mm.
It is observed that highest percentage (62.82% i.e. 1853.10 mm) of rainfall contribution to the valley is during kharif season followed by summer season (28.35% i.e. 836.29 mm) and rabi season (8.83% i.e. 260.59 mm).
The monthly and seasonal rainfall of the three districts are found so high that at 50 percent and above probability levels there are chance of occurrence of rainfall more than the average rainfall value.
9Spatio-temporal Rainfall Analysis for Crop Planning in Barak Valley of North East of India

Hence long duration flood resistance crops for the monsoon and short duration cropping pattern for the non-monsoon season can be followed for increasing the agricultural productivity in the Barak Valley.
Also rainwater harvesting structures shall be prepared to conserve water for dry spell use.
Ground water recharge rate is also to be increased so that in dry season ground water can be lifted up and used for irrigation purposes and other domestic purposes.
During rainy season agricultural practices shall be done in protected cultivation (inside green houses, poly houses or shade net houses) with micro irrigation systems to increase the yield and also to get off seasonal crops, which will give better return on investments.
04/18/23 10
CONCLUSION (CONTD.)
Spatio-temporal Rainfall Analysis for Crop Planning in Barak Valley of North East of India

11