baseline inventory report west rand … · 502654 wrdm aqmp baseline emissions inventory report...
TRANSCRIPT

COPYRIGHT WARNING
Copyright in all text and other matter, including the manner of presentation, is the exclusive property of the author. It is a criminal offence to reproduce and/or use, without written consent, any matter, technical procedure and/or technique contained in this document. Criminal and civil
proceedings will be taken as a matter of strict routine against any person and/or institution infringing the copyright of the author and/or proprietors.
i
BASELINE INVENTORY REPORT WEST RAND DISTRICT MUNICIPALITY
AIR QUALITY MANAGEMENT PLAN
Compiled for:
West Rand District Municipality
Compiled by: Strategic Environmental Focus (Pty) Ltd
Gauteng Head Office P O Box 74785
Lynnwood Ridge Pretoria
0040 Email: [email protected]
www.sefsa.co.za
June 2010 SEF Ref No: 50265

502654 WRDM AQMP Baseline Emissions Inventory Report
Prepared by Strategic Environmental Focus (Pty) Ltd i
EXECUTIVE SUMMARY Strategic Environmental Focus (Pty) Ltd (SEF) in association with USK Consulting was appointed to develop an Air Quality Management Plan (AQMP) for the West Rand District Municipality (WRDM). SEF completed the draft AQMP for the WRDM in December 2009. At the time of compiling the report, the WRDM consisted of the following Local Municipalities (LMs): Mogale City LM (Mogale CLM), Westonaria LM (WLM), Randfontein LM (RLM) and the District Management Area (DMA). Post completion of the report, the Merafong City LM (Merafong CLM) was re-incorporated from the North West Province into the Gauteng Province, and thus into the WRDM. As a result, the WRDM appointed SEF to update and amend the existing draft AQMP to include information pertaining to Merafong CLM. An integral part of the proposed AQMP is the compilation of an Emissions Inventory Report. Various national and international methods were used in identifying the sources of emissions and predicting the quantities of these emissions within the WRDM. Industries and companies within the WRDM’s commercial sector were identified from registers provided by the WRDM. SEF also developed a customised questionnaire to assist in the collection of data required for developing the Emissions Inventory. The majority of the companies that participated were within the industrial sector of the WRDM and used coal boilers, while only a few furnaces were used. The majority of coal boilers identified during the questionnaire survey, were John Thomson coal boilers. The emissions factors used in the current study to determine the quantity of emissions were obtained from the American Environmental Protection Agency (EPA) and the Brown Haze Study conducted in Cape Town during 1997. Due to incomplete waste disposal data made available to SEF during the current study and the expected inaccuracy thereof, emission from waste disposal site were excluded from this report. Statistics from Statistics South Africa 2007 and statistics obtained from the Municipal Demarcation Board (2009) were consulted in order to obtain the amount of fuels used in residential areas within the WRDM. The emissions for the WRDM were determined by applying the emission factors to the fuels consumed within the residential areas in WRDM. The percentage surface area used for commercial agricultural purposes and mine tailing dams within the WRDM was obtained from the Environmental Management Framework Report compiled for the WRDM in 2004 (Airshed Planning Professionals, 2004). The emission factor of 0.2 kg/ha/hr (SKM, 2005) was used to estimate the amount of PM10 emitted from agricultural land and mine tailing dams within the WRDM. The results obtained revealed that PM10 emissions were the highest of all the
502654 WRDM AQMP Baseline Emissions Inventory Report
Prepared by Strategic Environmental Focus (Pty) Ltd ii
selected criteria air pollutants within the WRDM for the agricultural land and tailing dams areas Emissions factors given by the Salford City Council (2001) were used to estimate the criteria pollutant emissions released from internal combustion within the WRDM during 2007. These factors were related to speed, and it was assumed that the average travelling speed between the large towns in the WRDM was 80km/h. Particulate matter emissions were determined for paved/tar and unpaved/dirt roads using equations. The presented emissions indicate that road transport within the WRDM was estimated to be the second largest contributor of particulate matter in terms of the selected criteria air pollutants. More specifically, PM10 emissions produced by travelling on dirt roads, were estimated to outweigh all of the other mobile contributors of PM10.
It was estimated that out of the four LMs, the Mogale CLM had, in terms of all criteria pollutants from industrial sources, the biggest contributor to air pollution. This is mainly due to the point and non-point air polluters situated within this area. PM10 emissions associated with roads, tailing dams and agricultural land within the WRDM were estimated to be the most significant contributor to air pollution

502654 WRDM AQMP Baseline Emissions Inventory Report
Prepared by Strategic Environmental Focus (Pty) Ltd iii
TABLE OF CONTENTS
EXECUTIVE SUMMARY............................................................................................ I
TABLE OF CONTENTS ........................................................................................... III
LIST OF TABLES..................................................................................................... III
LIST OF TABLES..................................................................................................... IV
LIST OF ABBREVIATIONS ....................................................................................... V
LIST OF ABBREVIATIONS ....................................................................................... V
1 INTRODUCTION................................................................................................ 1
1.1. SCOPE OF WORK.......................................................................................... 1 1.2. ASSUMPTIONS AND LIMITATIONS .................................................................... 1
2 SELECTED POLLUTANTS ................................................................................ 3
3 SOURCE IDENTIFICATION............................................................................. 11
3.1 INTRODUCTION ........................................................................................... 11 3.2 POSSIBLE AIR POLLUTION SOURCES............................................................ 11 3.2.1 POINT SOURCES ......................................................................................... 11 3.2.2. NON-POINT SOURCES ............................................................................. 21 3.2.2. MOBILE SOURCES ................................................................................... 28 3.2.2. COMBINED EMISSIONS............................................................................. 32
4 CONCLUSION ................................................................................................. 32
5 REFERENCES................................................................................................. 33
APPENDIX 1: SEF DATA ACCUMULATION QUESTIONNAIRE ............................ 35
APPENDIX 2: EMISSIONS FACTORS FOR POINT POLLUTION SOURCES ........ 37
APPENDIX 3: EMISSION FACTORS FOR INTERNAL PETROL AND DIESEL COMBUSTION........................................................................................................ 40
LIST OF TABLES
Table 1: Selected Air Pollutants............................................................................... 10
Table 2: Potential Air Pollution Sources identified within the West Rand District Municipality ...................................................................................................... 13
Table 3: Commercial and Industrial Air Pollution Source Descriptions..................... 16
Table 4: Estimated Amount of Fuel Consumed by the West Rand Distirct Municipality’s Commercial and Industrial Sectors (2007).................................. 17
Table 5: Estimated Emission Quantities Released by the Commercial and Industrial Sectors of the West Rand Distirct Municipality (2007) ...................................... 18
Table 6: Available Waste Generation Data for the West Rand District Municipality (January 2008 - January 2009) ........................................................................ 20
502654 WRDM AQMP Baseline Emissions Inventory Report
Prepared by Strategic Environmental Focus (Pty) Ltd iv
Table 7: Summary of statistics Used to Estimate Emissions Contributed by the Residential Sector of the West Rand District Municipality (2007) ..................... 22
Table 8: Estimated Amount of Fuel Consumed by the West Rand District Municipality’s Residential Sector (2007)........................................................... 23
Table 9: Estimated Emission Quantities Released by the Residential Sectors of the West Rand District Municipality (2007)............................................................. 23
Table 10: Estimated amount of PM10 particles emitted from agricultural land within the West Rand District Municipal Area (2007) .................................................. 25
Table 11: Estimated Amount of PM10 Particles Emitted From Tailing Dams within the West Rand District Municipal Area (2007) ........................................................ 27
Table 12: Estimated Emission Quantities Released by Road Transport in the West Rand District Municipality (2007) ...................................................................... 30
Table 13: Estimated Combined Emission Quantities Released from the West Rand District Municipality (2007) ............................................................................... 32
LIST OF TABLES
Figure 1: Point Source Emissions Profile for the West Rand District Municipality Commercial and Industrial Sectors (2007)........................................................ 19
Figure 2: Non-Point Source Emissions Profile for the West Rand District Municipality Residential Sector (2007)................................................................................. 24
Figure 3: Estimated Amount of PM10 Particles Emitted From Agricultural Land Within the West Rand District Municipal Area (2007) .................................................. 26
Figure 4: Estimated Amount of PM10 Particles Emitted From Tailing Dams within the West Rand District Municipal Area (2007) ........................................................ 28
Figure 5: Estimated Criteria Pollutant Emissions From Road Transport within the West Rand District Municipality (2007)............................................................. 31
Figure 6: Estimated Combined Criteria Pollutant Emissions from the West Rand District Municipality (2007) ............................................................................... 31
502654 WRDM AQMP Baseline Emissions Inventory Report
Prepared by Strategic Environmental Focus (Pty) Ltd v
LIST OF ABBREVIATIONS
AQMP Air Quality Management Plan
APPA Atmospheric Pollution Prevention Act, 1965 (Act No. 45 of 1965)
BTU British Thermal Unit
CoHMA Cradle of Humankind Management Authority
DBSA Development Bank of Southern Africa
DEA Department of Environmental Affairs
DIY Do-it-yourself
DMA District Management Area
DWA Department of Water Affairs
EIA Environmental Impact Assessment
EMP Environmental Management Plan
EPA Environmental Protection Agency
GIS Geographic Information System
IDP Integrated Development Plan
IS Implementation Strategy
LM Local Municipality
LPG Liquid Petroleum Gas
MIG Municipal Infrastructure Grant
MRF Material Recovery Facility
NEMAQA National Environmental Management: Air Quality Act (Act No 39 of
2004)
NGO Non-Governmental Organisation
PM10 Particulate Matter with an aerodynamic diameter of less than 10µ
PPP Public-Private Partnership
SABS South African Bureau of Standards
SANS South African National Standards
SEF Strategic Environmental Focus
SAIPA South African Petroleum Industry Association
VOCs Volatile Organic Compounds
WRDM West Rand District Municipality
502654 WRDM AQMP Baseline Emissions Inventory Report
Prepared by Strategic Environmental Focus (Pty) Ltd 1
1 INTRODUCTION Strategic Environmental Focus (Pty) Ltd (SEF) in association with USK Consulting was appointed to develop an Air Quality Management Plan (AQMP) for the West Rand District Municipality (WRDM). SEF completed the draft AQMP for the WRDM in December 2009. At the time of compiling the report, the WRDM consisted of the following Local Municipalities (LMs): Mogale City LM (Mogale CLM), Westonaria LM (WLM), Randfontein LM (RLM) and the District Management Area (DMA). Post completion of the report, the Merafong City LM (Merafong CLM) was re-incorporated from the North West Province into the Gauteng Province, and thus into the WRDM. As a result, the WRDM appointed SEF to update and amend the existing draft AQMP to include information pertaining to Merafong CLM. An integral part of the proposed AQMP is the compilation of an Emissions Inventory Report.
1.1. Scope of Work The scope of work for the WRDM AQMP Emissions Inventory includes the following:
• All criteria air pollutants listed in the South African National Standard (SANS) 1929;
• Relevant National and International Air Quality Standards must be populated; and
• Stationary and mobile source emissions must be qualitatively considered.
1.2. Assumptions and Limitations
• Due to the available budget, and the proposed terms of reference for this project, this emission inventory report is based on qualitative approaches;
• Not all companies and industries approached during the data collection stage of the project were willing to participate. In some cases, data collection questionnaires were never returned within the given timeframe. Data provided from LMs was also incomplete. Therefore, the values presented in this inventory are expected to be lower than actual values. Emissions from sources that were not accounted for, were estimated;
• Where participants provided a fuel usage range, the highest value was used in the emission calculations;
• Where fuel usage was indicated as per day values, it was assumed as a worse case scenario that combustors were operated thirty (30) days a month; and
502654 WRDM AQMP Baseline Emissions Inventory Report
Prepared by Strategic Environmental Focus (Pty) Ltd 2
• Biogenic sources demand complex specialist work, which was not allowed for in the estimated budget and timeframes allowed for this project. Therefore, these sources were excluded when the Emissions Inventory was developed. Biogenic sources (of which trees are the most important), emit various natural compounds (e.g. Volatile Organic Compounds (VOCs), including α Pinene) and can play an important role in atmospheric chemistry.

502654 WRDM AQMP Baseline Emissions Inventory Report
Prepared by Strategic Environmental Focus (Pty) Ltd 3
2 SELECTED POLLUTANTS Common air pollution sources associated with developed areas include industrial processes, mining and ore processing, informal settlements, transport, tyre burning, biomass burning as well as agriculture. The criteria air pollutants (SO2, NOx, CO, PM10 and C6H6) as identified by the DEA, were included in the Emissions Inventory for the WRDM. Ozone O3 (photochemical oxidants) is a secondary pollutant formed in the atmosphere as a result of chemical reactions and is excluded from this Emissions Inventory (DEA, 2006). Lead (Pb) emissions were also excluded due the assumption that the amount of Pb used in fuels was approximately zero as a result of Pb reduction in unleaded fuel (Zanokuhle Environmental Services, 2007). The criteria pollutants as well as associated characteristics, possible sources and effects are listed in (Table 1). Particulate matters are air pollutants of concern due to their impact on human health. Their particulate characteristics (particle size and chemical composition) and the duration, frequency and magnitude of exposure to these pollutants determine their hazard toward human health. The potential of particles to be inhaled and deposited in the lung is a function of the aerodynamic characteristics (their size, shape and density) of particles in flow streams. The deposition of particles in different regions of the respiratory system depends on their size. Particulate matter with aero-diameter of less that 10 micrometers pass through the nasal region and are deposited in the tracheobronchial and pulmonary regions. Particles are removed by impacting with the wall of the bronchi when they are unable to follow the gaseous streamline flow through subsequent bifurcations of the bronchial tree. As the airflow decreases near the terminal bronchi, the smallest particles are removed by Brownian motion, which pushes them to the alveolar membrane (DEAT, 2006). Particulate matter with aerodynamic diameter of 2.5 micrometer (PM 2.5) is it is not part of the criteria pollutants as listed in the latest gazetted South African National Standards of 31 March 2010. For this reason, PM2.5 was excluded from this Emissions Inventory, even though it is still important to emphasise the impact related to these particulates.

502654 WRDM AQMP Baseline Emissions Inventory Report
Prepared by Strategic Environmental Focus (Pty) Ltd 10
Table 1: Selected Air Pollutants
Criteria Pollutant Characteristics Possible Sources Effects
Sulphur dioxide (SO2)
• Gas
• Colourless
• Pungent odour
• Industrial processes (smelters and fuel combustion)
• Transport
• Domestic fuel burning
• Biomass burning
• Temporary breathing difficulties for asthma patients
• Atmospheric reaction to form aerosols resulting in decreased visibility
• Main contributor to acid rain production
Oxides of Nitrogen (NOx) • Gas
• Industrial processes (fuel combustion and smelters)
• Transport
• Domestic fuel burning
• Biomass burning
• Temporary breathing difficulties for asthma patients
• Atmospheric reaction to form aerosols resulting in decreased visibility
• Main contributor to acid rain production
Volatile Organic Compounds (VOC) – Benzene (C6H6), Pinene, etc.
• Depends on composition of the compound
• Industrial processes (processes involving solvents, paints or the use of chemicals)
• Transport
• Domestic fuel burning
• Biomass burning
• Biogenic emissions
• Depends on compound composition
• Eye, nose, and throat irritation, headaches, loss of coordination, nausea; damage to liver, kidney, and central nervous system are general effects associated with low concentrations
Particulate Matter (PM10 and more recently PM2.5)
• Mixture of particles and liquid droplets smaller than 10 micrometers
• Include acids (nitrates and sulphates based), organic chemicals, metals, and soil or dust particles
• Tyre burning
• Fireplaces
• Unpaved roads
• Smoke from large industrial plants
• Agriculture (land clearing and controlled burning)
• Biomass burning
• Enters the lower parts of the respiratory system (aviole in the lungs) and causes health problems
Carbon monoxide (CO)
• Gas
• Odourless
• Poisonous
• Colourless
• Industrial processes (Smelters and fuel combustion)
• Transport
• Domestic fuel burning
• Biomass burning
• May cause chest pain and aggravate cardiovascular diseases
• Affect mental alertness and vision in healthy individuals
Dust deposition • Dust of settable size
• Mineral composition depends on area and/or source of origin
• Agricultural operations
• Construction and mining operations
• Road dust
• Windblown dust from vacant lands
• Nuisance due to accumulation on surfaces
• Effects visibility
• May affect sensitive individuals, such as asthma patient

502654 WRDM AQMP Baseline Emissions Inventory Report
Prepared by Strategic Environmental Focus (Pty) Ltd 11
3 SOURCE IDENTIFICATION
3.1 Introduction Nationally, coal is the most widely used fuel and is consumed by commercial and industrial sectors, such as the iron and steel, the chemical and petrochemical, food and tobacco, pulp and paper as well as non-metallurgical industries. These industries, however, also consume large quantities of coke oven gas, coking coal and fuel oil. Wood, coal, paraffin, vegetable wastes and Liquid Petroleum Gas (LPG) is used by a large section of the population for household use. These fuels are continued to be used for domestic use due to two main reasons (DEAT, 2006):
• Backlogs in the distribution of basic services, such as electricity and waste removal, due to rapid urbanisation and the growth of informal settlements; and
• The use of coal and wood due to its cost effectiveness for space heating purposes, cooking and lighting functions.
The largest consumer of diesel and petrol in South Africa is the transport sector, while smaller amounts are used by industry (boilers, furnaces, etc.) and households (gardening, do-it-yourself equipment tools and recreation vehicles). Coal is classified by rank, according to its progressive alteration in the natural metamorphosis from lignite to anthracite. Even though no single parameter defines a rank, coal rank depends on (1) volatile matter, (2) fixed carbon, (3) inherent moisture and (4) oxygen (EPA, 2009). Sulphur content in raw coal ores can range between <1% to 1.74% (Jeffrey, 2005), while bituminous coal, used commercially, should have a sulphur content of less than 1%. Fuel oils are fractions obtained from petroleum distillation. These fuels are liquid petroleum products that are burnt in a furnace or boiler for the generation of heat or used in an engine for the generation of power. LPG, also known as Handigas, is a pressurised gas fuel mixture that consists primarily of Butane, Propane and Propylene (AFROX, 2008). Coal, fuel oil and paraffin were identified as the common fuels used by industries and households within the WRDM during 2007. The major pollutants of concern from combustion of these fuels are PM10, SO2, and NOx. Some unburned combustibles, including CO and numerous organic compounds (e.g. C6H6) are also generally emitted (EPA, 2009).
3.2 Possible Air Pollution Sources
3.2.1 Point Sources Commercial, Industrial and Residential Sectors

502654 WRDM AQMP Baseline Emissions Inventory Report
Prepared by Strategic Environmental Focus (Pty) Ltd 12
Point pollution sources can be defined as sources that can be collected, treated or controlled at one point (Chapman, 1997). In terms of air pollution, such a point could include major industrial facilities like chemical plants, steel mills, mines, mine dumps, power plants and hazardous waste incinerators. Industries and companies within the WRDM’s commercial sector were identified from registers provided by the WRDM. These registers included the names of registered companies, the environmental aspect that each company was expected to have an impact on, as well as all relevant contact details. During the latest survey, it was found that some of the contact details were expired and alternative means had to be used to update old details. It is essential that the WRDM are aware of the potential commercial and industrial sources and that registers are well maintained and up to date. Registers should typically provide information concerning:
• Source name and contact details
• Source location (latitude and longitude)
• Pollution devices installed at each company; • Type of fuel and quantities used by each polluter;
• Stack heights;
• Stack diameters; • Gas exit velocity; and
• Gas exit temperature. Table 2present the names of companies approached during the latest survey, as well as the criteria pollutants expected to be released. Identified pollution devices are further characterised in Table 3. SEF developed a customised questionnaire to assist in the collection of data required for developing the WRDM Emissions Inventory (Appendix 1). The questionnaire was distributed to all the companies registered on the municipality’s database and aimed to identify and confirm the different types of industries, types of fuel used and the quantities of fuel used within the municipal area during 2007. Fuel sales figures for 2007 were used due to the fact that no data was yet available for the forth quarter of 2008 during the preparation of this report. However, the 2007 data for the first three quarters compared well with that of 2008. The questionnaire survey undertaken in 2008/09 (prior to the inclusion of Merafong CLM into the WRDM) revealed that of the 133 contacted companies 91 (± 68%) participated and/or returned usable information. Of the 65 questionnaires distributed within in the Merafong CLM, 51 companies confirmed that they are not engaged in any of the listed activities
502654 WRDM AQMP Baseline Emissions Inventory Report
Prepared by Strategic Environmental Focus (Pty) Ltd 13
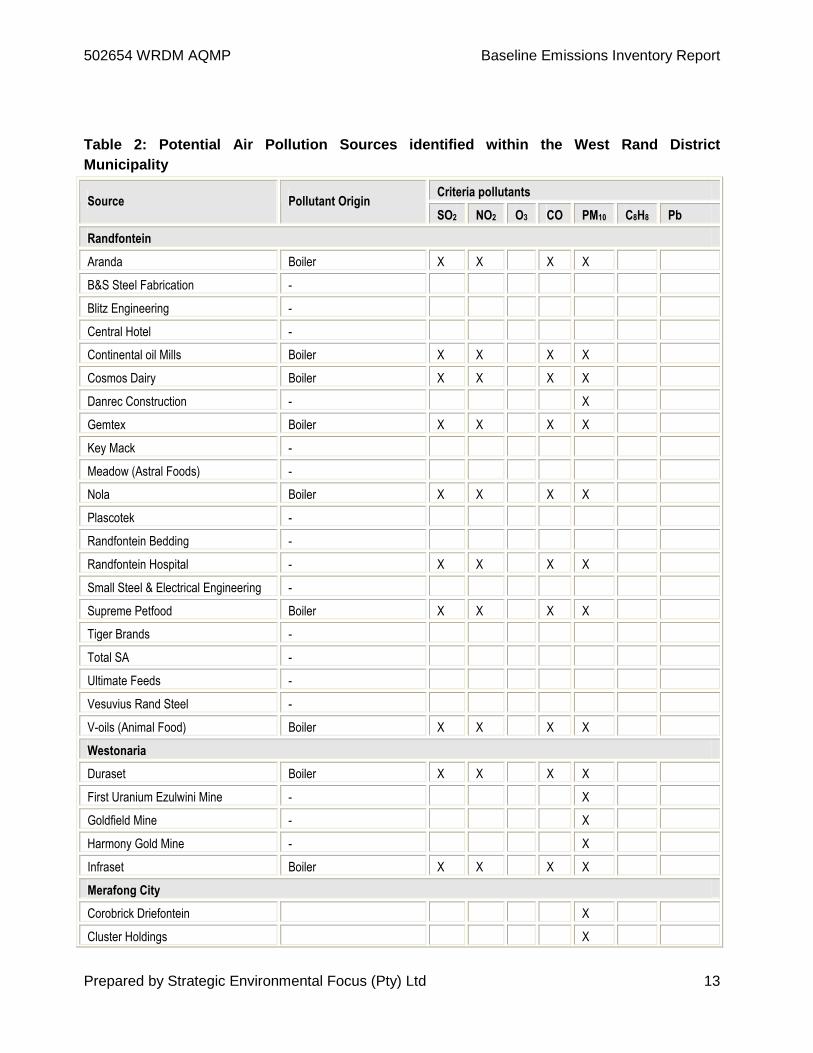
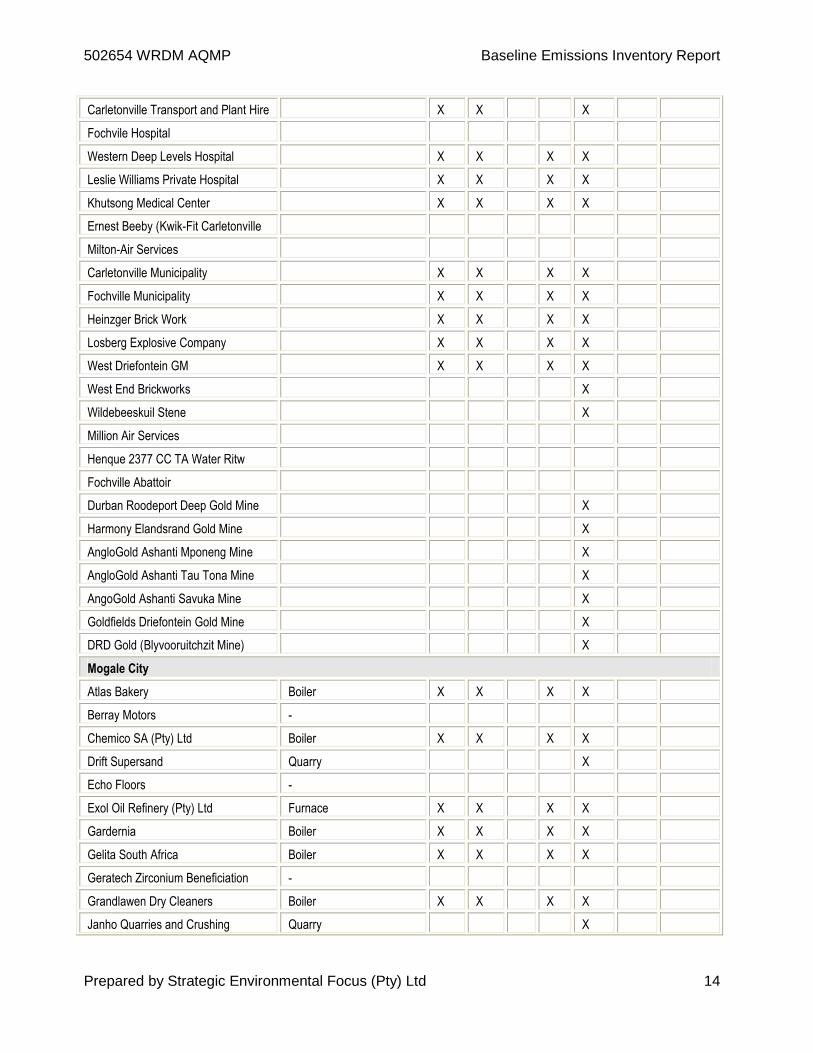
Table 2: Potential Air Pollution Sources identified within the West Rand District Municipality
Criteria pollutants Source Pollutant Origin
SO2 NO2 O3 CO PM10 C8H8 Pb
Randfontein
Aranda Boiler X X X X
B&S Steel Fabrication -
Blitz Engineering -
Central Hotel -
Continental oil Mills Boiler X X X X
Cosmos Dairy Boiler X X X X
Danrec Construction - X
Gemtex Boiler X X X X
Key Mack -
Meadow (Astral Foods) -
Nola Boiler X X X X
Plascotek -
Randfontein Bedding -
Randfontein Hospital - X X X X
Small Steel & Electrical Engineering -
Supreme Petfood Boiler X X X X
Tiger Brands -
Total SA -
Ultimate Feeds -
Vesuvius Rand Steel -
V-oils (Animal Food) Boiler X X X X
Westonaria
Duraset Boiler X X X X
First Uranium Ezulwini Mine - X
Goldfield Mine - X
Harmony Gold Mine - X
Infraset Boiler X X X X
Merafong City
Corobrick Driefontein X
Cluster Holdings X
502654 WRDM AQMP Baseline Emissions Inventory Report
Prepared by Strategic Environmental Focus (Pty) Ltd 14
Carletonville Transport and Plant Hire X X X
Fochvile Hospital
Western Deep Levels Hospital X X X X
Leslie Williams Private Hospital X X X X
Khutsong Medical Center X X X X
Ernest Beeby (Kwik-Fit Carletonville
Milton-Air Services
Carletonville Municipality X X X X
Fochville Municipality X X X X
Heinzger Brick Work X X X X
Losberg Explosive Company X X X X
West Driefontein GM X X X X
West End Brickworks X
Wildebeeskuil Stene X
Million Air Services
Henque 2377 CC TA Water Ritw
Fochville Abattoir
Durban Roodeport Deep Gold Mine X
Harmony Elandsrand Gold Mine X
AngloGold Ashanti Mponeng Mine X
AngloGold Ashanti Tau Tona Mine X
AngoGold Ashanti Savuka Mine X
Goldfields Driefontein Gold Mine X
DRD Gold (Blyvooruitchzit Mine) X
Mogale City
Atlas Bakery Boiler X X X X
Berray Motors -
Chemico SA (Pty) Ltd Boiler X X X X
Drift Supersand Quarry X
Echo Floors -
Exol Oil Refinery (Pty) Ltd Furnace X X X X
Gardernia Boiler X X X X
Gelita South Africa Boiler X X X X
Geratech Zirconium Beneficiation -
Grandlawen Dry Cleaners Boiler X X X X
Janho Quarries and Crushing Quarry X

502654 WRDM AQMP Baseline Emissions Inventory Report
Prepared by Strategic Environmental Focus (Pty) Ltd 15
KBW -
Krugersdorp Abbattoir Boiler X X X X
Lafarge (ready mix) - X
Leratong Hospital Boiler X X X X
Majesty Oil Mills Boiler X X X X
Mogale Alloys -
Nimag (Pty) Ltd -
Pace Oil Boiler X X X X
Protech Ready Mix Produce cement ready mix X
Roadmix -
Sandvic -
Sasko -
South African Breweries Boiler X X X X
Yusuf Dadoo Hospital Boiler X X X X

502654 WRDM AQMP Baseline Emissions Inventory Report
Prepared by Strategic Environmental Focus (Pty) Ltd 16
Table 3: Commercial and Industrial Air Pollution So urce Descriptions
Source Combustion Device Fuel Type Fuel Usage Unit Stack Height (m) stack Diameter (m) Gas Exit Velocity (m/s)
Exit Gas Temp. (oC)
Randfontein
Aranda 2 John Thompson Boilers B Grade Coal 150 t/m 15 & 20 0.78 - -
Continental Oil Mills John Thompson Boiler B Grade Coal 2000 t/m 123 2.5 - -
Cosmos Dairy John Thompson Boiler Diesel 4000 L/m - - - -
B Grade Coal 88 t/m - - - - Gemtex Premium Metal Boiler
Light furnace oil 18000 L/m - - - -
Nola 4 John Thompson Boilers B Grade Coal 500 - 750 t/m 20 - 30 0.5 - 1.5 - -
Supreme Petfood John Thompson Boiler B Grade Coal 60 t/m 20 0.8 - -
V-oils (Animal Food) John Thompson Boiler A Grade Coal 70 t/m 18 0.4 - -
Westernaria
Duraset John Thompson Boiler A Grade Coal 220 t/m 30 0.4 - -
Infraset John Thompson Boiler Paraffin 4000 L/m - - - -
Mogale City
Atlas Bakery John Thompson Boiler CATBOT Oil 30000 - 36000 L/m 25 0.6 - -
Chemico SA (Pty) Ltd Cyclotherm Boiler Paraffin 12000 L/m 23 0.28 - -
Exol Oil Refinery (Pty) Ltd D.O.H. Direct Oil Heater Furnace Furnace Oil 10000 - 15000 L/m 16 0.5 - -
Gardernia John Thompson Boiler B Grade Coal 200 t/m 3 - - -
Gelita South Africa John Thompson Boiler B-C Grade Coal 650 t/m 20 0.8 - -
Grandlawen Dry Cleaners John Thompson Boiler Diesel/Paraffin 2000 L/m 30 0.25 - -
Krugersdorp Abbattoir John Thompson Boiler A Grade Coal 150 t/m - - - -
Leratong Hospital John Thompson Boiler B Grade Coal ±8640 t/m - - - -
Majesty Oil Mills John Thompson Boiler A Grade Coal 360 t/m 35 0.8 - -
Pace Oil John Thompson Boiler Pace 300 Burner Fuel 12000 L/m 6 0.3 - -
South African Breweries John Thompson Boiler B Grade Coal 800 t/m - - - -
Yusuf Dadoo Hospital John Thompson Boiler B Grade Coal 200 - 320 t/m - - - -
502654 WRDM AQMP Baseline Emissions Inventory Report
Prepared by Strategic Environmental Focus (Pty) Ltd 17
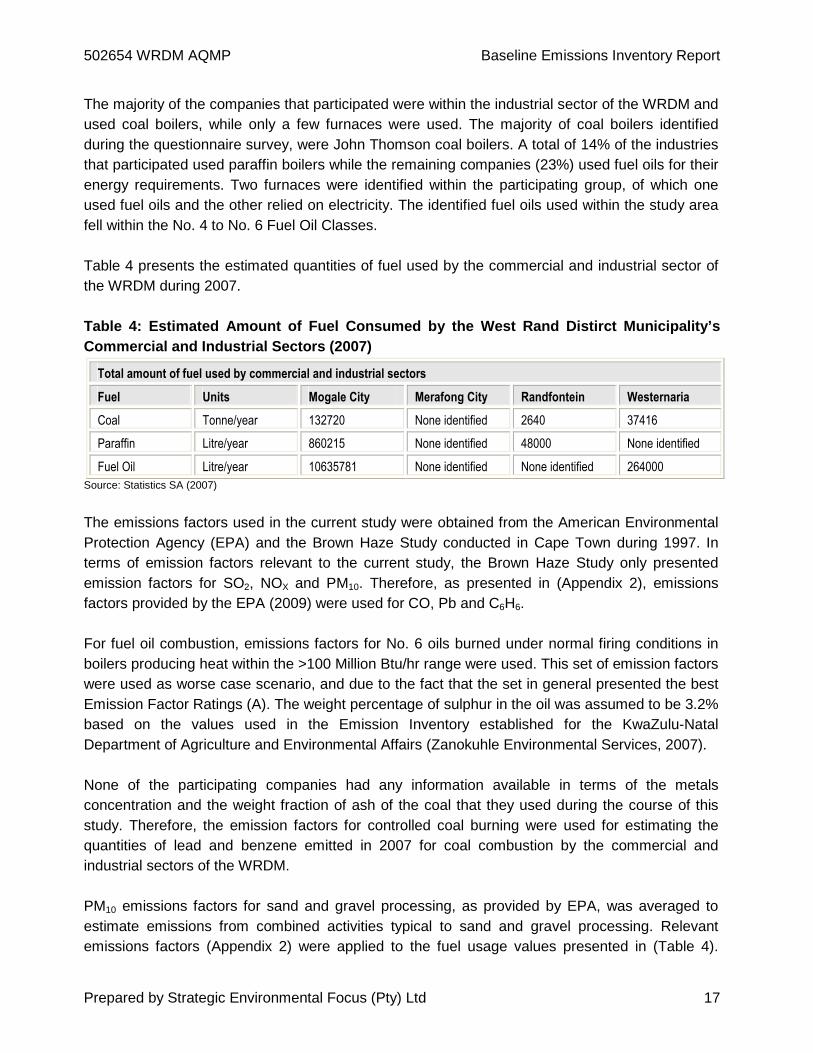
The majority of the companies that participated were within the industrial sector of the WRDM and used coal boilers, while only a few furnaces were used. The majority of coal boilers identified during the questionnaire survey, were John Thomson coal boilers. A total of 14% of the industries that participated used paraffin boilers while the remaining companies (23%) used fuel oils for their energy requirements. Two furnaces were identified within the participating group, of which one used fuel oils and the other relied on electricity. The identified fuel oils used within the study area fell within the No. 4 to No. 6 Fuel Oil Classes. Table 4 presents the estimated quantities of fuel used by the commercial and industrial sector of the WRDM during 2007. Table 4: Estimated Amount of Fuel Consumed by the W est Rand Distirct Municipality’s Commercial and Industrial Sectors (2007)
Total amount of fuel used by commercial and industrial sectors
Fuel Units Mogale City Merafong City Randfontein Westernaria
Coal Tonne/year 132720 None identified 2640 37416
Paraffin Litre/year 860215 None identified 48000 None identified
Fuel Oil Litre/year 10635781 None identified None identified 264000
Source: Statistics SA (2007)
The emissions factors used in the current study were obtained from the American Environmental Protection Agency (EPA) and the Brown Haze Study conducted in Cape Town during 1997. In terms of emission factors relevant to the current study, the Brown Haze Study only presented emission factors for SO2, NOX and PM10. Therefore, as presented in (Appendix 2), emissions factors provided by the EPA (2009) were used for CO, Pb and C6H6. For fuel oil combustion, emissions factors for No. 6 oils burned under normal firing conditions in boilers producing heat within the >100 Million Btu/hr range were used. This set of emission factors were used as worse case scenario, and due to the fact that the set in general presented the best Emission Factor Ratings (A). The weight percentage of sulphur in the oil was assumed to be 3.2% based on the values used in the Emission Inventory established for the KwaZulu-Natal Department of Agriculture and Environmental Affairs (Zanokuhle Environmental Services, 2007). None of the participating companies had any information available in terms of the metals concentration and the weight fraction of ash of the coal that they used during the course of this study. Therefore, the emission factors for controlled coal burning were used for estimating the quantities of lead and benzene emitted in 2007 for coal combustion by the commercial and industrial sectors of the WRDM. PM10 emissions factors for sand and gravel processing, as provided by EPA, was averaged to estimate emissions from combined activities typical to sand and gravel processing. Relevant emissions factors (Appendix 2) were applied to the fuel usage values presented in (Table 4).

502654 WRDM AQMP Baseline Emissions Inventory Report
Prepared by Strategic Environmental Focus (Pty) Ltd 18
Based on the fuel used by the commercial and industrial sectors of the WRDM, the emissions shown in (Table 5), were obtained. Figure 1 represents a combined representation of point source emissions released by commercial and industrial sectors within the WRDM during 2007. Table 5: Estimated Emission Quantities Released by the Commercial and Industrial Sectors of the West Rand Distirct Municipality (2007)
Local Municipality SO2 NOx CO PM10 Lead Benzene
Mogale City 10473.85 2345.63 2619.50 673.01 0.027 0.16
Randfontein 726.80 282.11 186.85 146.90 0.0071 0.022
Westonaria 458.16 91.80 122.03 16.06 0.000503 0.00622
Total 11658.81 2719.53 2928.38 835.96 0.03 0.19
* Measured in tonnes per annum * Please note that not all quarries, crushers, cement aggregate plants and mines participated in this study. Therefore the estimated value of 835.96 tons per annum of PM10 is likely to be lower than actual conditions.

502654 WRDM AQMP Baseline Emissions Inventory Report
Prepared by Strategic Environmental Focus (Pty) Ltd 19
Point Source Emission Profile 2007 (tons per annum & %)
SO211658.81
49%
PM106792.76
28%
CO2928.38
12%
NOx2719.53
11%
Lead0.030%
Benzene0.190%
West458.16
4%
Rand726.80
6%
Mogale10473.85
90%
Rand282.107
10%
West91.83%
Mogale2345.63
87%
Rand186.86%
West122.03
4%
Mogale2619.50
90%
Rand1723.70
25%
West2118.46
31%
Mogale2950.61
44%
Rand0.0121%
West0.0011%
Mogale0.02778%
Mogale0.1685%
Rand0.0212%
West0.013%
SO2
PM10Lead
Benzene
NOx
CO
Figure 1: Point Source Emissions Profile for the We st Rand District Municipality Commercial and Indust rial Sectors (2007)

502654 WRDM AQMP Baseline Emissions Inventory Report
Prepared by Strategic Environmental Focus (Pty) Ltd 20
Waste Disposal Sites Landfill sites are important sources of the GHGs, Methane (CH4) and CO2. In order to meet the requirements of the IDP, municipalities are required to outline waste management priorities and strategies through the development of an Integrated Waste Management Plan (IWMP). SEF compiled an IWMP for the WRDM in 2010. However, during the time of this study, it was found that the amount of waste and the type of waste disposed of at each of the landfill sites within the WRDM, were not accurately recorded. The lack of proper management systems and ill-maintained infrastructure (such as weigh-bridges) were the main cause of inaccurate and outdated waste disposal data. The available amount of waste generated per LM from January 2008 to January 2009 is presented in (Table 6) (WRDM IWMP, 2010). Table 6: Available Waste Generation Data for the We st Rand District Municipality (January 2008 - January 2009)
Local Municipality Generated Waste (t/m)
Mogale City Local Municipality: January 2008 to January 2009
Domestic 4394.5
Building rubble 3166.6
Domestic loose 642
Food stuff 12.7
Garden refuse 792.3
Illegally dumped 655
Industrial 1547.8
Mixed 800
Notifiable 3.2
Sewage 0.460
Tyres 0.660
TOTAL 12015.22
Randfontein Local Municipality: June 2008 to May 2009
Mixed 129 857
Westernaria Local Municipality
No information
Merafong City Local Municipality
Fochville Waste Disposal Site
Building rubble 120
Garden refuse 137
Household waste 1068
Carletonville Waste Disposal Site
Building rubble 350

502654 WRDM AQMP Baseline Emissions Inventory Report
Prepared by Strategic Environmental Focus (Pty) Ltd 21
Garden refuse 2100
Household waste 7200
Total 10975
Due to incomplete waste disposal data made available to SEF during the current study and the expected inaccuracy thereof, emission from waste disposal site were excluded from this report.
3.2.2. Non-Point Sources Non-point sources of air pollution refer to those inputs, which occur over a wide area and are associated with particular land uses, as opposed to individual point source discharges (for example agricultural dust generation and burning). Residential Sector Within townships and informal settlements, the lack of basic services, such as electricity and waste removal, result in domestic waste being burned as a means of disposal, while wood, coal and paraffin are used to satisfy cooking, lighting and heating requirements. Pollutants released from the burning of these fuels include CO, NO2, SO2, inhalable particulates and polycyclic aromatic hydrocarbons (Gondwana Environmental Solutions, 2006). Statistics South Africa and statistics obtained from the Municipal Demarcation Board (2009), were consulted in order to obtain the required information for determining emissions contributed by the residential sector (hereafter also referred to as households). Unfortunately, the data provided by the Municipal Demarcation Board (2009) was for 2001 and the current study focuses on 2007. Statistics South Africa indicated that the population size for the WRDM in 2001 was approximately 744 156 people. More recent information estimates the population size at 754 903 (Community Survey, 2007), representing a 1.4% growth in population. The 2007 Community Survey data showed that 7 to 34% of the households within the WRDM (89.78% of the population) consisted of 1 to 5 members. Therefore, three members per household were used as median for this study. Table 7 presents a summary of the statistics used to estimate emissions contributed by the residential sector of the WRDM during 2007.

502654 WRDM AQMP Baseline Emissions Inventory Report
Prepared by Strategic Environmental Focus (Pty) Ltd 22
Table 7: Summary of statistics Used to Estimate Emi ssions Contributed by the Residential Sector of the West Rand District Municipality (2007 )
The 2007 Community Survey data further estimated that a large portion of the population (21.9%) within the WRDM would have used non-renewable fuels to satisfy their energy requirements in 2007. These fuels would have included coal, wood, paraffin and LPG. Sixty seven percent (67%) of households dependent on non-renewable energy sources preferred paraffin as a fuel source. Sales data for 2007 was sourced from the South African Petroleum Industry Association (SAPIA). The following assumptions were made:
• All of the LPG sold within the WRDM during 2007 was combusted within the municipal area, and was only for domestic use (no use of LPG in the commercial and industrial sectors was recorded during the questionnaire exercise);
• The number of individuals that rely on paraffin for cooking, heating and lighting purposes was not available from the Statistics SA 2007 and other sources. Therefore, the volumes of paraffin used per household for domestic use was assumed to be 90% of total volume of paraffin sold in the area while 10% was used for industrial purposes (ERI, 1997); and
• The City of Cape Town Metropolitan Municipality (2009) estimated that each household in Cape Town uses approximately 3kg of wood per month. The same utilisation rate was assumed for domestic combustion of coal and wood within the WRDM during 2007.
Table 8 presents the estimated amount of non-renewable fuels used by the residential sector of the WRDM during 2007. Merafong CLM consumes the largest amount of coal and wood fuels, whilst Mogale CLM is the largest user of paraffin. In (Table 9), the estimated emissions related to non-renewable fuel combustion within the residential sector of the WRDM are presented, while (Figure 2) presents a combined representation of criteria pollutant emissions from the residential sector within the WRDM during 2007.
Population Size (2001) 744156
Population Size (2007) 754903
Estimated Population
Growth Rate between
2001 and 2007 (%)
1.4
Fossil Fuels/Non-Renewable Fuels
Gas Paraffin Wood Coal Total
Total
Population
Size
% Reliant
on Fossil
Fuels
People (2001) 17223 367923 51582 61236 497964 744156 66.92
People (2007) 18447 389412 47862 47739 503460 754903 66.69
Number of Households 6149 129804 15954 15913 167820 275006 61.02

502654 WRDM AQMP Baseline Emissions Inventory Report
Prepared by Strategic Environmental Focus (Pty) Ltd 23
Table 8: Estimated Amount of Fuel Consumed by the W est Rand District Municipality’s Residential Sector (2007)
Total amount of fuel used by Households
Fuel Units Mogale City Merafong City Randfontein Westernaria
Coal Tonne/year 3478 21954 1545 1312
Wood Tonne/year 3478 19836 1545 1312
Paraffin Litre/year 7489790 138846 684140 None identified
LPG Litre/year 224646 5553 420396 None identified
Table 9: Estimated Emission Quantities Released by the Residential Sectors of the West Rand District Municipality (2007)
Local Municipality SO2 NOx CO PM10 Lead Benzene
Mogale City 63729.33 11257.63 17402.54 973.22 0.000663 0.727
Randfontein 5844.56 1036.88 1736.71 115.18 0.000294 0.066
Westernaria 24.94 8.53 156.85 28.07 0.00025 None identified
Merafong City 952.65 150 None identified Non identified Non identified 0.008897
Total 70551.48 12453.04 19296.1 1116.47 0.001207
0.81
* Measured in tonnes per annum

502654 WRDM AQMP Baseline Emissions Inventory Report
Prepared by Strategic Environmental Focus (Pty) Ltd 24
Non-Point source emissions profile 2007 (tonnes per annum & %)
Figure 2: Non-Point Source Emissions Profile for th e West Rand District Municipality Residential Secto r (2007)
SO2, 70551.48, 68%
NOx, 12453.04, 12%
Lead, 0, 0%
Benzene, 0, 0%PM10, 1116.47, 1%
CO, 19296.1, 19%
SO2
Mogale City, 63729.33, 91%
Merafong City, 952.65, 1%
Westonaria, 24.94, 0%Randfontein,
5844.56, 8%
NOx
Randfontein, 1036.88, 8%
Westonaria, 8.53, 0%
Merafong City, 150, 1%
Mogale City, 11257.63, 91%
CO
Randfontein, 1736.71, 9%
Westonaria, 156.85, 1%
Merafong City, 0, 0%
Mogale City, 17402.54, 90%
PM10
Randfontein, 115.18, 10%
Westonaria, 28.07, 3%
Merafong City, 0, 0%
Mogale City, 973.22, 87%
Lead
Randfontein, 0.000294, 24%
Westonaria, 0.00025, 21%
Merafong City, 0, 0%
Mogale City, 0.000663, 55%
Benzene
Randfontein, 0.066, 8%
Westonaria, 0, 0% Merafong City, 0.008897, 1%
Mogale City, 0.727, 91%

502654 WRDM AQMP Baseline Emissions Inventory Report
Prepared by Strategic Environmental Focus (Pty) Ltd 25
Agriculture and Open Spaced Areas Agriculture was identified as a major land use during the current study. A Geographic Information System (also referred to as GIS) Scan and visual investigation during site visits showed that, although open spaces occur within the WRDM, the majority of these areas were not cultivated. Open spaced areas were mostly vegetated while areas surrounding sites with infrastructure presented fairly large portions of un-vegetated areas. Emissions from agricultural activities and un-vegetated areas are difficult to control, due to the seasonality of emissions and the large surface area producing emissions. Expected emission resulting from agricultural activities and un-vegetated open areas include, dust associated with wind erosion, burning of crop residue and veld, chemicals associated with crop spraying and odiferous emissions resulting from manure, fertilizer and crop residue. Burning crop residue and veld not only results in the atmospheric pollutants such as CH4, CO and NO2 but also leaves the soil prone to wind erosion, further increasing dust levels in an area (Gondwana Environmental Solutions, 2006). The percentage surface area used for commercial agricultural purposes within the WRDM was obtained from the Environmental Management Framework Report compiled for the WRDM in 2004 (Airshed Planning Professionals, 2004). The emission factor of 0.2 kg/ha/hr (SKM, 2005) was used to estimate the amount of PM10 emitted from agricultural land within the WRDM. The estimated PM10 emissions and the relevant variables are presented in (Table 10). Error! Reference source not found. Figure 3 indicates that PM10 emissions were the highest of all the selected criteria air pollutants within the WRDM for the agricultural areas. Spatial evaluations (Table 10) showed that non-point pollution sources within the Mogale CLM were the greatest contributors in terms of all of the selected criteria pollutants. Table 10: Estimated amount of PM10 particles emitte d from agricultural land within the West Rand District Municipal Area (2007)
Agriculture Emission Factor
(kg/ha/hr)
Total Surface Area (km2)
Total Surface Area (ha)
Agricultural Area
hrs in a year
PM10 load per year (t/a)
Mogale City (7% of Surface Area)
0.2 447 44700 6570.9 8760 11512.2168
Randfontein (20 % of Surface Area)
0.2 616 61600 19527.2 8760 34211.6544
Westonaria (26% of Surface Area)
0.2 1110 111000 25419 8760 44534.088
Merafong City (47% of Surface Area)
0.2 1631.7 163170 45687.6 8760 80044.6752
Total 170302.6344

502654 WRDM AQMP Baseline Emissions Inventory Report
Prepared by Strategic Environmental Focus (Pty) Ltd 26
PM10 amount (t/a) emitted from agricultural land wi thin WRDM during 2007
Westonaria, 44534.088, 26%
Randfontein, 34211.6544, 20%
Mogale City, 11512.2168, 7%
Merafong City), 80044.6752, 47%
Figure 3: Estimated Amount of PM10 Particles Emitte d From Agricultural Land Within the West Rand District Municipal Area (2007) Mine Tailings Dams Mine tailings dams are scattered all over the study area. The majority of these tailings dams are not properly covered and it has been reported that tailings dams within the area results in significant dust liberation during windy conditions. A site investigation was conducted on 9 September 2009, in order to obtain additional weather data from the Mogale CLM. A strong wind was encountered on the said date and it was noted that the impact from tailings dams were to such an extent that visibility was significantly altered. Open un-vegetated areas and agricultural land would also have been a notable contributor to dust loads in the atmosphere. However dust liberation from tailings dams are clearly visible during windy conditions. Settliaable dust is measured in the ambient environment during monitoring exercises. It is not possible to accurately measure the amount of dust liberated from a point source due to the variability of the factors that influence the intensity of dust liberation. These factors include soil moisture, wind speed, vegetation cover, etc. all of which are site specific. Dust monitoring is conducted by mines and industries within the WRDM and some of the results, which have been provided for this inventory, were incorporated into the Status Quo Report compiled as part of this study. With regards to PM10 it has been estimated that approximately 0.2 kg/ha/hr is emitted from un-vegetated areas and areas subjected to wind erosion (SKM, 2005).
502654 WRDM AQMP Baseline Emissions Inventory Report
Prepared by Strategic Environmental Focus (Pty) Ltd 27
SEF conducted a qualitative dust risk assessment for the RLM area with dust deposition data collected from August 2008 to October 2008. The assessment concluded that, in terms of dust deposition, a negligible potential risk was estimated, while the chemical composition of dust collected at some of the routine monitoring stations highlighted a medium potential risk to human health. The following must, however, be noted in terms of the qualitative risk assessment:
• The assessment was based on data for only three months that also did not allow for seasonal variation;
• PM10 concentrations were not quantitatively assessed with the use of active sampling methods;
• The dust deposition data was derived from sampling procedures and analytical methods conducted by Chemtech Labotarory Services in Pretoria and not by SEF; and
• A dust monitoring audit that formed part of the risk assessment revealed that the number of dust deposition monitoring stations used for the risk assessment may be insufficient and that pollution sources within the RLM area were not comprehensively covered in terms of the monitoring locality network.
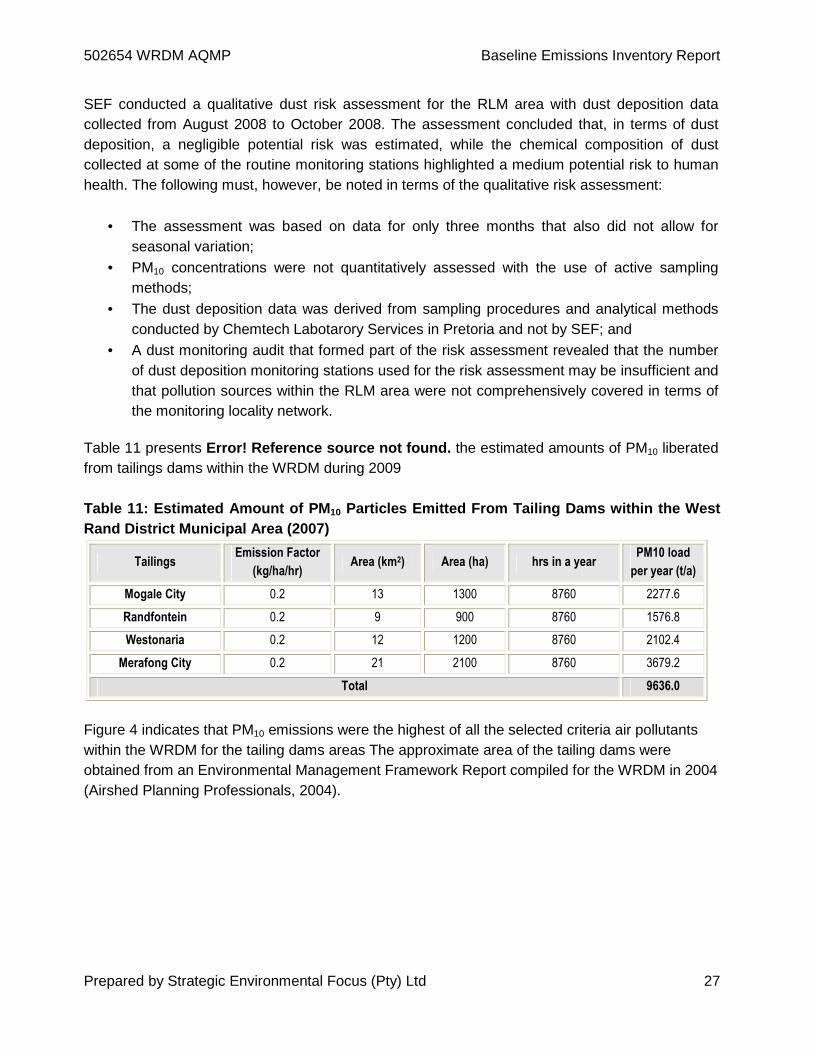
Table 11 presents Error! Reference source not found. the estimated amounts of PM10 liberated from tailings dams within the WRDM during 2009 Table 11: Estimated Amount of PM 10 Particles Emitted From Tailing Dams within the Wes t Rand District Municipal Area (2007)
Tailings Emission Factor
(kg/ha/hr) Area (km2) Area (ha) hrs in a year
PM10 load
per year (t/a)
Mogale City 0.2 13 1300 8760 2277.6
Randfontein 0.2 9 900 8760 1576.8
Westonaria 0.2 12 1200 8760 2102.4
Merafong City 0.2 21 2100 8760 3679.2
Total 9636.0
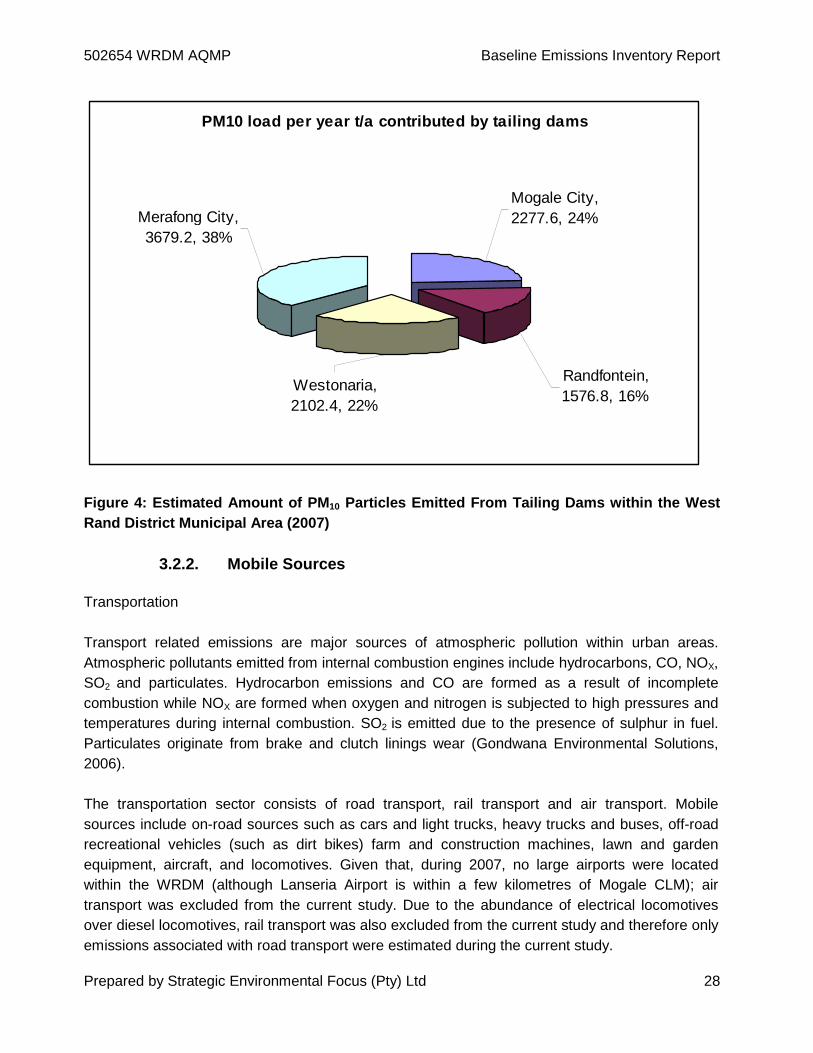
Figure 4 indicates that PM10 emissions were the highest of all the selected criteria air pollutants within the WRDM for the tailing dams areas The approximate area of the tailing dams were obtained from an Environmental Management Framework Report compiled for the WRDM in 2004 (Airshed Planning Professionals, 2004).
502654 WRDM AQMP Baseline Emissions Inventory Report
Prepared by Strategic Environmental Focus (Pty) Ltd 28
PM10 load per year t/a contributed by tailing dams
Westonaria, 2102.4, 22%
Merafong City, 3679.2, 38%
Mogale City, 2277.6, 24%
Randfontein, 1576.8, 16%
Figure 4: Estimated Amount of PM 10 Particles Emitted From Tailing Dams within the Wes t Rand District Municipal Area (2007)
3.2.2. Mobile Sources Transportation Transport related emissions are major sources of atmospheric pollution within urban areas. Atmospheric pollutants emitted from internal combustion engines include hydrocarbons, CO, NOX, SO2 and particulates. Hydrocarbon emissions and CO are formed as a result of incomplete combustion while NOX are formed when oxygen and nitrogen is subjected to high pressures and temperatures during internal combustion. SO2 is emitted due to the presence of sulphur in fuel. Particulates originate from brake and clutch linings wear (Gondwana Environmental Solutions, 2006). The transportation sector consists of road transport, rail transport and air transport. Mobile sources include on-road sources such as cars and light trucks, heavy trucks and buses, off-road recreational vehicles (such as dirt bikes) farm and construction machines, lawn and garden equipment, aircraft, and locomotives. Given that, during 2007, no large airports were located within the WRDM (although Lanseria Airport is within a few kilometres of Mogale CLM); air transport was excluded from the current study. Due to the abundance of electrical locomotives over diesel locomotives, rail transport was also excluded from the current study and therefore only emissions associated with road transport were estimated during the current study.

502654 WRDM AQMP Baseline Emissions Inventory Report
Prepared by Strategic Environmental Focus (Pty) Ltd 29
It is obvious that not all of the fuel sold within the WRDM was combusted within the area and that residents from different cities would have used fuel purchased within the WRDM area on roads outside the WRDM area. SEF therefore considered using kilometres travelled within the WRDM during 2007 to estimated emissions released by road transport, rather than the total amount of fuel sold within the WRDM area during 2007. The average distance between the large towns in the WRDM (Carletonville, Westonaria, Randfontein, Krugersdorp and Magaliesburg) was measured and the distance was found to be approximately 100km. It was then assumed that each household owned and used two cars during 2007 (which equates to 4 658 cars) and that the 100km distance was travelled twice each day for a period of twelve months. When these assumptions were multiplied by the distance between large towns, it was estimated that approximately 462 413 244km was travelled in WRDM during 2007. Emissions factors given by the Salford City Council (2001) were used to estimate the criteria pollutant emissions released from internal combustion within the WRDM during 2007. These factors were related to speed, and it was assumed that the average travelling speed between the large towns in the WRDM was 80km/h. Particulate matter emissions were determined for paved/tar and unpaved/dirt roads using the following equations: Paved/tar roads
E = k (sL/2)0.65 x (W/3)1.5 - C Equation 1 (EPA, 2006)
Where: E = particulate emission factor (g/Vehicle Kilometres Travelled) k = particulate size multiplier (4.6 for PM10, EPA) sL = road surface silt loading (0.002 g/m2 as used in Brown Haze Study, 1997) W = average weight of vehicle travelling the road (3 tons as used in Brown Haze Study, 1997) C = emission factor for 1980’s vehicle fleet exhaust, brake wear and tyre wear
(0.1317g/Vehicle Kilometres Travelled, EPA) Unpaved/dirt road
E = 1.7 k (s/12) (S/48) (W/2.7)0.7 (w/4)0.5 ((365-p)/365) Equation 2 (Brown Haze, 1997)
Where:
E = emission factor (g/km) k = particle size multiplier (0.36 for PM10)
502654 WRDM AQMP Baseline Emissions Inventory Report
Prepared by Strategic Environmental Focus (Pty) Ltd 30
s = weight % of road surface material less than 75mm (2% as used in Brown Haze Study, 1997)
S = mean vehicle speed (40km/hr as used in Brown Haze Study, 1997) W = mean vehicle weight (3 tonnes as used in Brown Haze Study, 1997) w = mean number of wheels (4) p = number of days per year with at least 0.254 mm precipitation (70 as used in Brown Haze
Study, 1997) It was assumed that 30% of the estimated 462 413 244km was travelled on unpaved/ dirt roads. Computation of the given variables and equations resulted in the following PM10 emission factors:
• Paved/tar roads – 0.1g/km
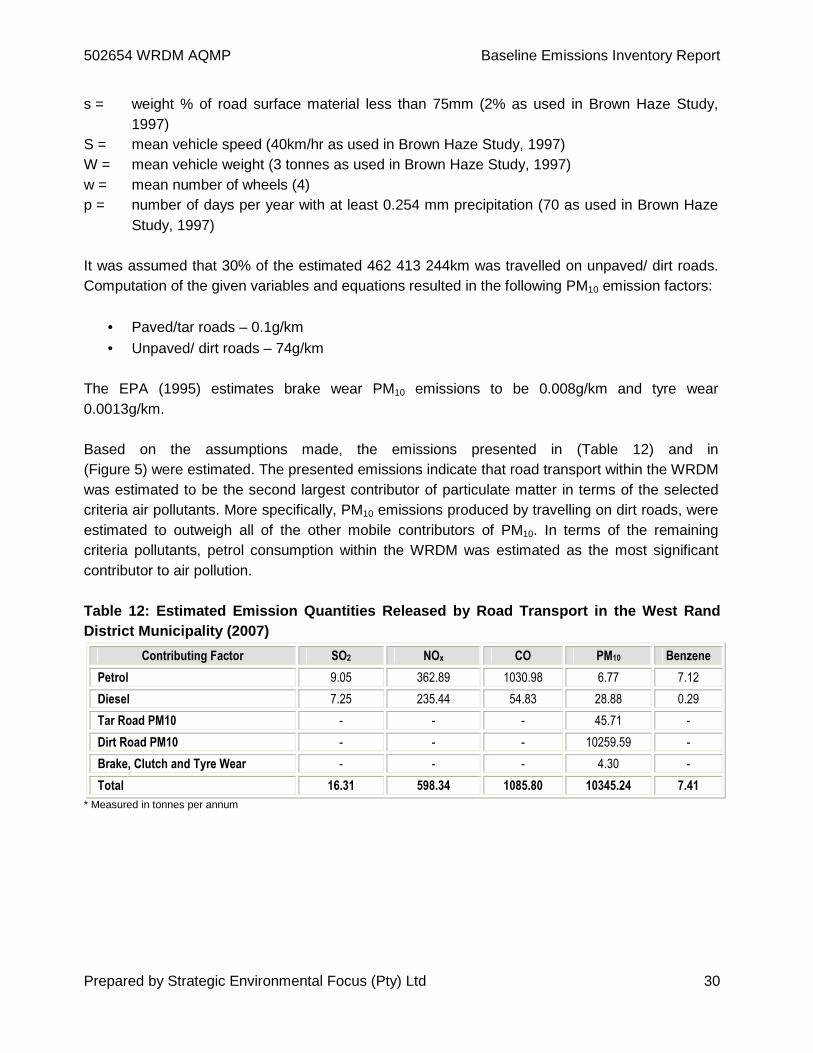
• Unpaved/ dirt roads – 74g/km The EPA (1995) estimates brake wear PM10 emissions to be 0.008g/km and tyre wear 0.0013g/km. Based on the assumptions made, the emissions presented in (Table 12) and in (Figure 5) were estimated. The presented emissions indicate that road transport within the WRDM was estimated to be the second largest contributor of particulate matter in terms of the selected criteria air pollutants. More specifically, PM10 emissions produced by travelling on dirt roads, were estimated to outweigh all of the other mobile contributors of PM10. In terms of the remaining criteria pollutants, petrol consumption within the WRDM was estimated as the most significant contributor to air pollution. Table 12: Estimated Emission Quantities Released by Road Transport in the West Rand District Municipality (2007)
Contributing Factor SO2 NOx CO PM10 Benzene
Petrol 9.05 362.89 1030.98 6.77 7.12
Diesel 7.25 235.44 54.83 28.88 0.29
Tar Road PM10 - - - 45.71 -
Dirt Road PM10 - - - 10259.59 -
Brake, Clutch and Tyre Wear - - - 4.30 -
Total 16.31 598.34 1085.80 10345.24 7.41
* Measured in tonnes per annum

502654 WRDM AQMP Baseline Emissions Inventory Report
Prepared by Strategic Environmental Focus (Pty) Ltd 31
Estimated Emissions from Road Transport in the WRDM , 2007 (tons per annum & %)
SO216.31
0%
Benzene7.410%
NOx598.34
5%
CO1085.80
9%
PM1010345.24
86%
Diesel7.2544%
Petrol9.0556%
Petrol362.8961%
Diesel235.4439%
Diesel, 54.83,
5%
Petrol1030.98
95%
Petrol6.770%
Diesel28.880%
A45.710%
C4.300%
B10259.6100%
Brake and Tyre Wear
Diesel 0.294%
Petrol7.1296%
Benzene
SO2
NOx
CO
PM10
Tar Roads
Dirt Roads
Figure 5: Estimated Criteria Pollutant Emissions Fr om Road Transport within the West Rand District Mun icipality (2007)

Prepared by Strategic Environmental Focus (Pty) Ltd 32
3.2.2. Combined Emissions The summation of the estimated emissions from identified point sources, non-point sources and mobile sources within the WRDM resulted in the values are presented in (Table 13) and (Figure 6). In terms of the selected criteria air pollutants, and in context of the total WRDM emissions, particulate matter was evidently the most significant pollutant. Spatially, the pollution sources within the Mogale CLM were the largest contributors of SO2, NOX, CO and Pb, while road transport was identified as the most significant influencing factor in terms of C6H6 and particulate matter. When considering all the contributing factors, sources within the Merafong CLM presented the highest particulate matter value.
Table 13: Estimated Combined Emission Quantities Re leased from the West Rand District Municipality (2007)
CONTRIBUTING FACTOR SO2 NOX CO PM10 LEAD BENZENE
MOGALE CITY 74203.18 13603.26 20022.04 1646.23 0.027663 0.887
RANDFONTEIN 6571.36 1318.99 1923.56 262.08 0.007394 0.088
WESTERNARIA 483.1 100.33 278.88 44.13 0.000753 0.00622
MERAFONG CITY 952.65 150 0 80044.68 0.008897
TRANSPORT 16.31 598.34 1085.80 10345.24 0 7.41
TOTAL 82226.6 15770.92 23310.28 182600.3 0.03581 8.400117
* Measured in tonnes per annum

WRDM: AQMP: Baseline Emissions Inventory Report SEF Reference: 502654
Prepared by Strategic Environmental Focus (Pty) Ltd 31
Combined Criteria emissions Profile 2007 (tonnes pe r annum & %) Figure 6: Estimated Combined Criteria Pollutant Emi ssions from the West Rand District Municipality (20 07)
Lead, 0.03581, 0%Benzene, 8.400117, 0%
SO2, 82226.6, 27%
NOx, 15770.92, 5%
CO, 23310.28, 8%PM10,
182600.3144, 60%
Mogale City
Lead, 0.027663, 0%
Benzene, 0.887, 0%
PM10, 13158.4468,
11%
CO, 20022.04, 17%
NOx, 13603.26, 11%
SO2, 74203.18, 61%
Randfontein
NOx, 1318.99, 3%
SO2, 6571.36, 15%
CO, 1923.56, 4%
Lead, 0.007394, 0%
Benzene, 0.088, 0%
PM10, 34473.7344,
78%
Westonaria
SO2, 483.1, 1% NOx, 100.33, 0%
CO, 278.88, 1%
Benzene, 0.00622, 0%
Lead, 0.000753, 0%
PM10, 44578.218, 98%
Merafong City
CO, 0, 0% NOx, 150, 0%
Lead, 0, 0%
SO2, 952.65, 1%
Benzene, 0.008897, 0%
PM10, 80044.6752,
99%
Transport
SO2, 16.31, 0%Lead, 0, 0%
CO, 1085.8, 9%
NOx, 598.34, 5%Benzene, 7.41,
0%
PM10, 10345.24, 86%

WRDM: AQMP: Baseline Emissions Inventory Report SEF Reference: 502654
Prepared by Strategic Environmental Focus (Pty) Ltd 32
4 CONCLUSION The questionnaire survey undertaken in 2008/09 (prior to the inclusion of Merafong CLM into the WRDM) and in 2010 for the inclusion of Merafong CLM revealed that the majority of the companies involved in the listed activities are concentrated within the Mogale CLM.. It was estimated that out of the four LMs, the Mogale CLM had, in terms of all criteria pollutants from industrial sources, the biggest contributor to air pollution. This is mainly due to the point and non-point air polluters situated within this area. PM10 emissions associated with roads, tailing dams and agricultural land within the WRDM were estimated to be the most significant contributor to air pollution. In terms of the total emissions estimated for the WRDM during this study, PM10 emissions were found to be to most significant criteria air pollutant during 2007. This was followed by SO2, CO and NO2, in decreasing order. The highest particulate matter estimations were recorded for Merafong CLM, due to the presence of large tailing dams agricultural land.

WRDM: AQMP: Baseline Emissions Inventory Report SEF Reference: 502654
Prepared by Strategic Environmental Focus (Pty) Ltd 33
5 REFERENCES Atmospheric Pollution Prevention Act, 1965 (Act No. 45 of 1965) (APPA) Cape Town Metropolitan Municipality, (2009) [http://www.deat.gov.za/EnviroInfo/sote/citysoe/cape/energy_a.htm# Paraffin.] (Accessed in May 2009. Caprcorn District Municipality Air Quality Management Plan; Authors: Claire Rautenbach, Nicola Walton and Martin van Nierop Gondwana Environmental Solutions (Pty) Ltd. 2006 Chapman, D (1997). Water Quality Assessments. A guide to the Use of Biota, Sediments and Water in Environmental Monitoring. Department of Environmental Affairs and Tourism, Environmental Quality and Protection, Chief Directorate: Air Quality Management & Climate Change (2006). Output C.4: Initial State of Air Report. The National Air Quality Management Programme (NAQMP) Department of Environmental Affairs and Tourism (2009). The identification of Substances in Ambient Air and Establishment of National Standards for the Permissible amount or concentration of each substance in the Ambient Air. Government Gazette No. 31987 of March 2009. Amendment to the National Environmental Management: Air Quality Act. Act No. 39 of 2004. Emissions factors, EPA. [http://www.epa.gov/ttn/chief/ap42/index.html]. (Accessed in May 2009). Gondwana Environmental Solutions; Airshed Planning Proffesionals and Zitholele Consulting, 2006). Priority Area Air Quality Management Plan: VAAL Triangle Airshed: Baseline chracterisation. Jeffrey, L.S. (2005). Characterization of the coal resources of South Africa. The Journal of the South African Institute of Mining and Metallurgy. February. 2005. Lourie, J. (1994). South African Geology. Municipal Demarcation Board (2009) National Standards for Ambient Air Quality published in Government Gazette No. 31987 of March 2009 (DEAT, 2009).

WRDM: AQMP: Baseline Emissions Inventory Report SEF Reference: 502654
Prepared by Strategic Environmental Focus (Pty) Ltd 34
National Environmental Management: Air Quality Act, 2004 (Act No. 39 of 2004) (NEMAQA) Salford City Council, (2001). Source Input Data Road Traffic Emissions Factors, [http://www.salford.gov.uk/appendix_3_rtfactors.pdf]. (Accessed in May 2009). Sinclair Knight Merz (2005). Improvement of NPI Fugitive Particulate Matter Emission Estimation Techniques. RFQ No. 0027/2004. South African Demarcations Board, (2009). [http://www.demarcation.org.za/.] (Accessed in May 2009) South African Petroleum Industry Association (SAPIA), (2009). [http://www.sapia.co.za/] (Accessed in May 2009) South African National Standard (SANS) 1929; SRK Consulting, (2008). Environmental Impact Assessment: Phase 2 Expansion of the Saldanha Iron Ore Export Handling Facility: Air Quality Impact Assessment for Phase 2. Statistics South Africa, (2007). South African Census Data 2007. United States Environmental Protection Agency (EPA) 2009. [http://www.epa.gov]. (Accessed in May 2009) Wicking-Baird, M.C., de Villiers, M. G, and Dutkiewitz, R.K. (1997). Cape Town Brown Haze Study. Energy Research Institute: University of Cape Town. West Rand District Municipality, Draft IDP 2008-2009. Zanokuhle Environmental Services, 2007, Emission Inventory Report: Kwazulu-Natal Department of Agriculture and Environmental Affairs.

WRDM: AQMP: Baseline Emissions Inventory Report SEF Reference: 502654
Prepared by Strategic Environmental Focus (Pty) Ltd 35
APPENDIX 1: SEF DATA ACCUMULATION QUESTIONNAIRE
Area
NameCoordinates:ESAddress:Polution Source:Bricks Work
Tonnes of bricks per hrDryer TypeDryer Fuel (NB*Coal Type?)
Dryer Fuel UsageKiln TypeKiln Fuel (NB*Coal Type?)
Kiln Fuel UsageOther section in areaQuarry/MiningOther section in areaFood ProductionIndustry:
DrugsProduction/hour
PlasticProduction/hour
RubberProduction/hour
DyesProduction/hour
Other IndustryProduction/hour
Fuel type used for energy (NB*Coal Type?)Fuel volume used
Boiler:Type
Fuel Type (NB*Coal Type?)Fuel Usage
Stack heightStack Diameter
Gas Exit VelocityGas Exit Temp
Furnace:Type
Fuel Type (NB*Coal Type?)Fuel Usage
MeltedStack height
Stack DiameterGas Exit Velocity
Gas Exit Temp
WESTRAND DISTRICT MUNICIPALITY AIR QUALITY MANAGEME NT PLANSEF REFERENCE 502654

WRDM: AQMP: Baseline Emissions Inventory Report SEF Reference: 502654
Prepared by Strategic Environmental Focus (Pty) Ltd 36
Incinerator:Type
Fuel Type (NB*Coal Type?)Fuel UsageIncinerated
Stack heightStack Diameter
Gas Exit VelocityGas Exit Temp
Neighbours Names:
The West Rand District Municipality has embarked on the compilation of an Air QualityManagement Plan for the District Municipality. We would like to invite you to participate in theprocess by completing the above questionnaire. The purpose of this document is to solicitstakeholder input for the preparation of a draft Status Quo Report and gather data for the EmissionsInventory Report. Please complete the questionnaire and forward the completed document by e-mail to [email protected] or by fax to 012 349 1229.

WRDM: AQMP: Baseline Emissions Inventory Report SEF Reference: 502654
Prepared by Strategic Environmental Focus (Pty) Ltd 37
APPENDIX 2: EMISSIONS FACTORS FOR POINT POLLUTION SOURCES
Pollutant Industrial – Coal
EPA, g/kg Brown Haze, g/kg
SO2 - 19.00
NOx - 7.50
CO 4.99 -
PM10 3.90
Lead 1.9x10⁻⁴ -
Benzene 5.9x10⁻⁴ -
Industrial and Household – Paraffin
EPA, g/L Brown Haze, g/L
SO2 - 8.50
NOx - 1.50
CO 2.27 -
PM10 0.12
Lead - -
Benzene 9.71x10⁻⁵ -
Industrial - Fuel Oils
EPA, g/L Brown Haze, g/L
SO2 (157S EPA) 56.44 -
NOx 6.59 -
CO 0.60 -
CO2 2995.97
PM10 - 3.7
Lead 1.81x10⁻⁴ -
Benzene 2.56x10⁻⁵ -
Households – Coal
EPA, g/kg Brown Haze, g/kg
SO2 - 19
NOx - 1.5
CO 4.99 -
PM10 - 4.1
Lead 1.91x10⁻⁴ -
Benzene 5.89x10⁻⁴ -
Households – LPG
EPA, g/L Brown Haze, g/L
SO2 - 0.01
NOx - 1.5
CO 1.01 -
PM10 - 0.07
Lead - -
Benzene - -

WRDM: AQMP: Baseline Emissions Inventory Report SEF Reference: 502654
Prepared by Strategic Environmental Focus (Pty) Ltd 38
Households – Wood
EPA, g/kg Brown Haze, g/kg
SO2 - 0.01
NOx - 5
CO 114.58 -
PM10 - 17.3
Lead - -
Benzene - -
Sand and Gravel Processing
g/kg of sand or gravel
PM10 6.4x10⁻³
WRDM: AQMP: Baseline Emissions Inventory Report SEF Reference: 502654
Prepared by Strategic Environmental Focus (Pty) Ltd 39
.

WRDM: AQMP: Baseline Emissions Inventory Report SEF Reference: 502654
Prepared by Strategic Environmental Focus (Pty) Ltd 40
APPENDIX 3: EMISSION FACTORS FOR INTERNAL PETROL AND DIESEL COMBUSTION.

WRDM: AQMP: Baseline Emissions Inventory Report SEF Reference: 502654
Prepared by Strategic Environmental Focus (Pty) Ltd 41