by jordi galí june 2008 - tauyashiv/gali_slides-ch3.pdf · by jordi galí june 2008. motivation...
TRANSCRIPT

The Basic New Keynesian Model
by
Jordi Galí
June 2008
Motivation and Outline
Evidence on Money, Output, and Prices:
� Short Run E¤ects of Monetary Policy Shocks(i) persistent e¤ects on real variables(ii) slow adjustment of aggregate price level(iii) liquidity e¤ect
�Micro Evidence on Price-setting Behavior: signi�cant price and wagerigidities
Failure of Classical Monetary Models
A Baseline Model with Nominal Rigidities
�monopolistic competition� sticky prices (staggered price setting)� competitive labor markets, closed economy, no capital accumulation

Figure 1. Estimated Dynamic Response to a Monetary Policy Shock
Source: Christiano, Eichenbaum and Evans (1999)
Federal funds rate GDP
GDP deflator M2
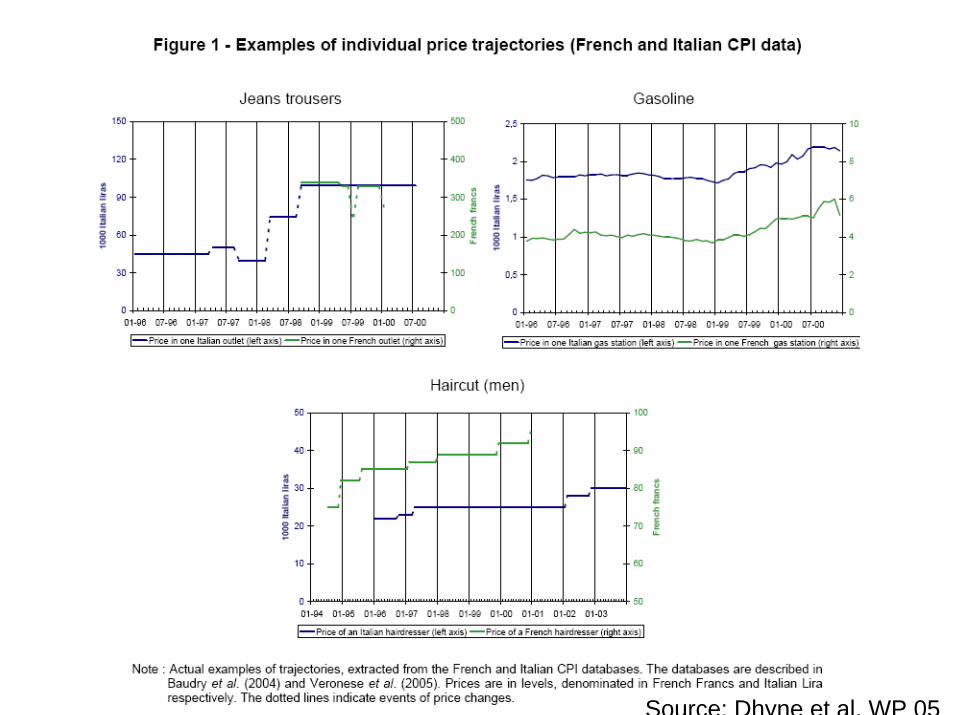
Source: Dhyne et al. WP 05

Households
Representative household solves
maxE0
1Xt=0
�t U (Ct; Nt)
where
Ct ��Z 1
0
Ct(i)1�1
� di
� ���1
subject to Z 1
0
Pt(i) Ct(i) di +Qt Bt � Bt�1 +Wt Nt � Tt
for t = 0; 1; 2; ::: plus solvency constraint.

Optimality conditions
1. Optimal allocation of expenditures
Ct(i) =
�Pt(i)
Pt
���Ct
implying Z 1
0
Pt(i) Ct(i) di = Pt Ct
where
Pt ��Z 1
0
Pt(i)1�� di
� 11��
2. Other optimality conditions
�Un;tUc;t
=Wt
Pt
Qt = � Et
�Uc;t+1Uc;t
PtPt+1
�
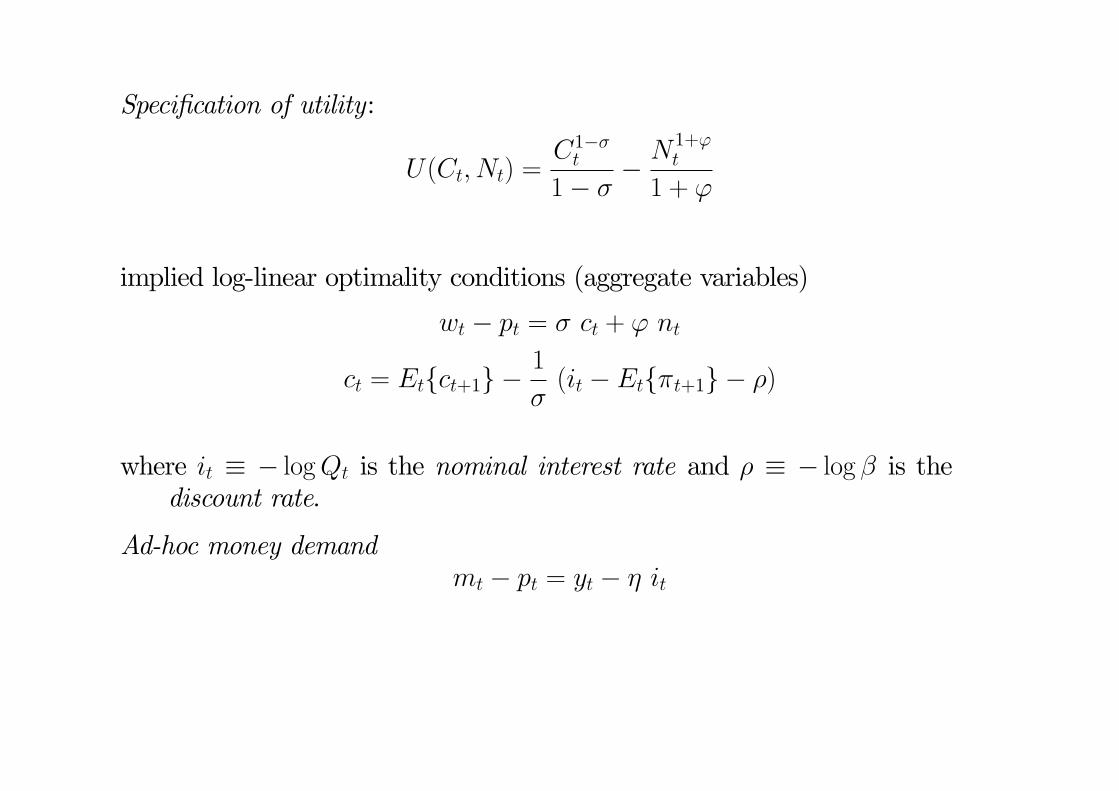
Speci�cation of utility:
U(Ct; Nt) =C1��t
1� �� N 1+'
t
1 + '
implied log-linear optimality conditions (aggregate variables)
wt � pt = � ct + ' nt
ct = Etfct+1g �1
�(it � Etf�t+1g � �)
where it � � logQt is the nominal interest rate and � � � log � is thediscount rate.
Ad-hoc money demandmt � pt = yt � � it
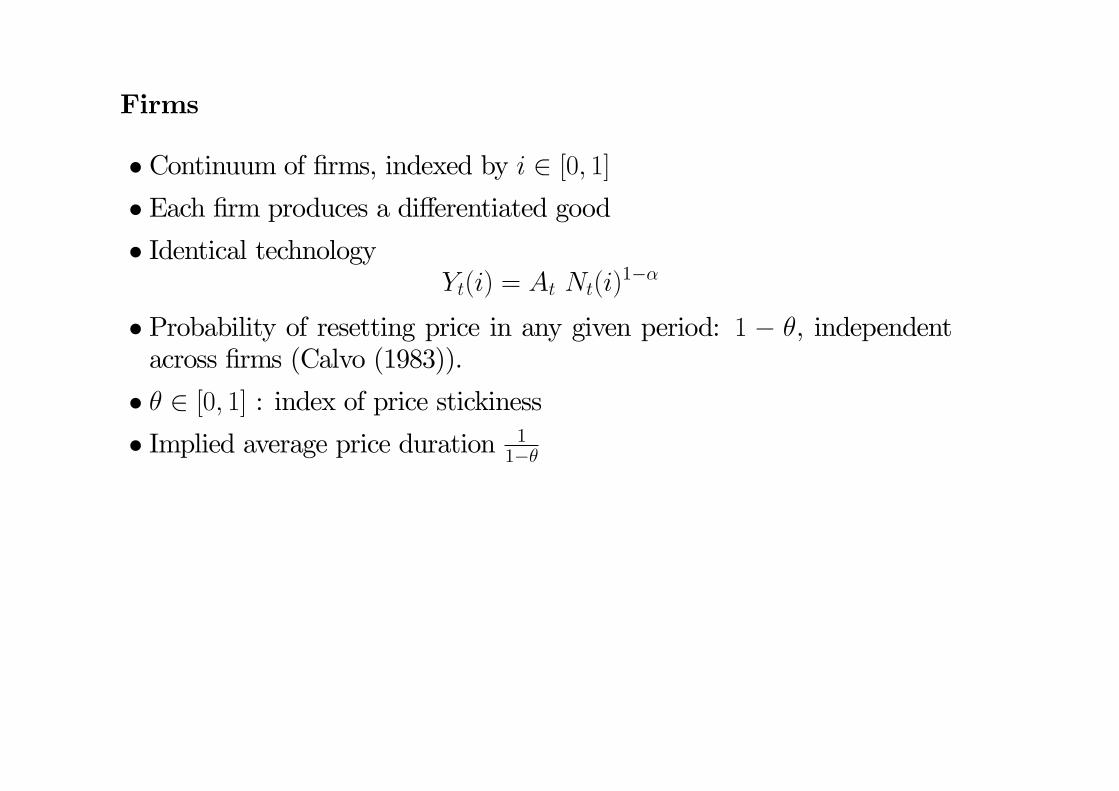
Firms
� Continuum of �rms, indexed by i 2 [0; 1]� Each �rm produces a di¤erentiated good� Identical technology
Yt(i) = At Nt(i)1��
� Probability of resetting price in any given period: 1 � �, independentacross �rms (Calvo (1983)).
� � 2 [0; 1] : index of price stickiness� Implied average price duration 1
1��
Aggregate Price Dynamics
Pt =�� (Pt�1)
1�� + (1� �) (P �t )1��� 1
1��
Dividing by Pt�1 :
�1��t = � + (1� �)
�P �tPt�1
�1��
Log-linearization around zero in�ation steady state
�t = (1� �) (p�t � pt�1) (1)
or, equivalentlypt = � pt�1 + (1� �) p�t
Optimal Price Setting
maxP �t
1Xk=0
�k Et
�Qt;t+k
�P �t Yt+kjt � t+k(Yt+kjt)
�subject to
Yt+kjt = (P�t =Pt+k)
�� Ct+k
for k = 0; 1; 2; :::where
Qt;t+k � �k�Ct+kCt
����PtPt+k
�
Optimality condition:1Xk=0
�k Et
�Qt;t+k Yt+kjt
�P �t �M t+kjt
�= 0
where t+kjt � 0t+k(Yt+kjt) andM� ���1

Equivalently,1Xk=0
�k Et
�Qt;t+k Yt+kjt
�P �tPt�1
�M MCt+kjt �t�1;t+k
��= 0
where MCt+kjt � t+kjt=Pt+k and �t�1;t+k � Pt+k=Pt�1
Perfect Foresight, Zero In�ation Steady State:
P �tPt�1
= 1 ; �t�1;t+k = 1 ; Yt+kjt = Y ; Qt;t+k = �k ; MC =1
M
Log-linearization around zero in�ation steady state:
p�t � pt�1 = (1� ��)
1Xk=0
(��)k Etfcmct+kjt + pt+k � pt�1g
where cmct+kjt � mct+kjt �mc.
Equivalently,
p�t = � + (1� ��)1Xk=0
(��)k Etfmct+kjt + pt+kg
where � � log ���1.
Flexible prices (� = 0):p�t = � +mct + pt
=) mct = �� (symmetric equilibrium)

Particular Case: � = 0 (constant returns)
=) MCt+kjt =MCt+k
Rewriting the optimal price setting rule in recursive form:
p�t = �� Etfp�t+1g + (1� ��) cmct + (1� ��)pt (2)
Combining (1) and (2):
�t = � Etf�t+1g + � cmctwhere
� � (1� �)(1� ��)
�

Generalization to � 2 (0; 1) (decreasing returns)De�ne
mct � (wt � pt)�mpnt
� (wt � pt)�1
1� �(at � �yt)� log(1� �)
Using mct+kjt = (wt+k � pt+k)� 11�� (at+k � �yt+kjt)� log(1� �),
mct+kjt = mct+k +�
1� �(yt+kjt � yt+k)
= mct+k ���
1� �(p�t � pt+k) (3)
Implied in�ation dynamics
�t = � Etf�t+1g + � cmct (4)
where
� � (1� �)(1� ��)
�
1� �
1� � + ��

Equilibrium
Goods markets clearing
Yt(i) = Ct(i)
for all i 2 [0; 1] and all t.
Letting Yt ��R 1
0 Yt(i)1�1
� di� ���1,
Yt = Ct
for all t. Combined with the consumer�s Euler equation:
yt = Etfyt+1g �1
�(it � Etf�t+1g � �) (5)

Labor market clearing
Nt =
Z 1
0
Nt(i) di
=
Z 1
0
�Yt(i)
At
� 11��
di
=
�YtAt
� 11��Z 1
0
�Pt(i)
Pt
�� �1��
di
Taking logs,
(1� �) nt = yt � at + dt
where dt � (1� �) logR 10 (Pt(i)=Pt)
� �1�� di (second order).
Up to a �rst order approximation:yt = at + (1� �) nt

Marginal Cost and Output
mct = (wt � pt)�mpnt= (� yt + ' nt)� (yt � nt)� log(1� �)
=
�� +
' + �
1� �
�yt �
1 + '
1� �at � log(1� �) (6)
Under �exible prices
mc =
�� +
' + �
1� �
�ynt �
1 + '
1� �at � log(1� �) (7)
=) ynt = ��y + ya atwhere �y � (��log(1��))(1��)
�+'+�(1��) > 0 and ya � 1+'�+'+�(1��).
=) cmct = �� + ' + �
1� �
�(yt � ynt ) (8)
where yt � ynt � eyt is the output gap

New Keynesian Phillips Curve
�t = � Etf�t+1g + � eyt (9)
where � � ��� + '+�
1���.
Dynamic IS equation
eyt = Etfeyt+1g � 1�(it � Etf�t+1g � rnt ) (10)
where rnt is the natural rate of interest, given by
rnt � � + � Etf�ynt+1g= � + � ya Etf�at+1g
Missing block: description of monetary policy (determination of it).
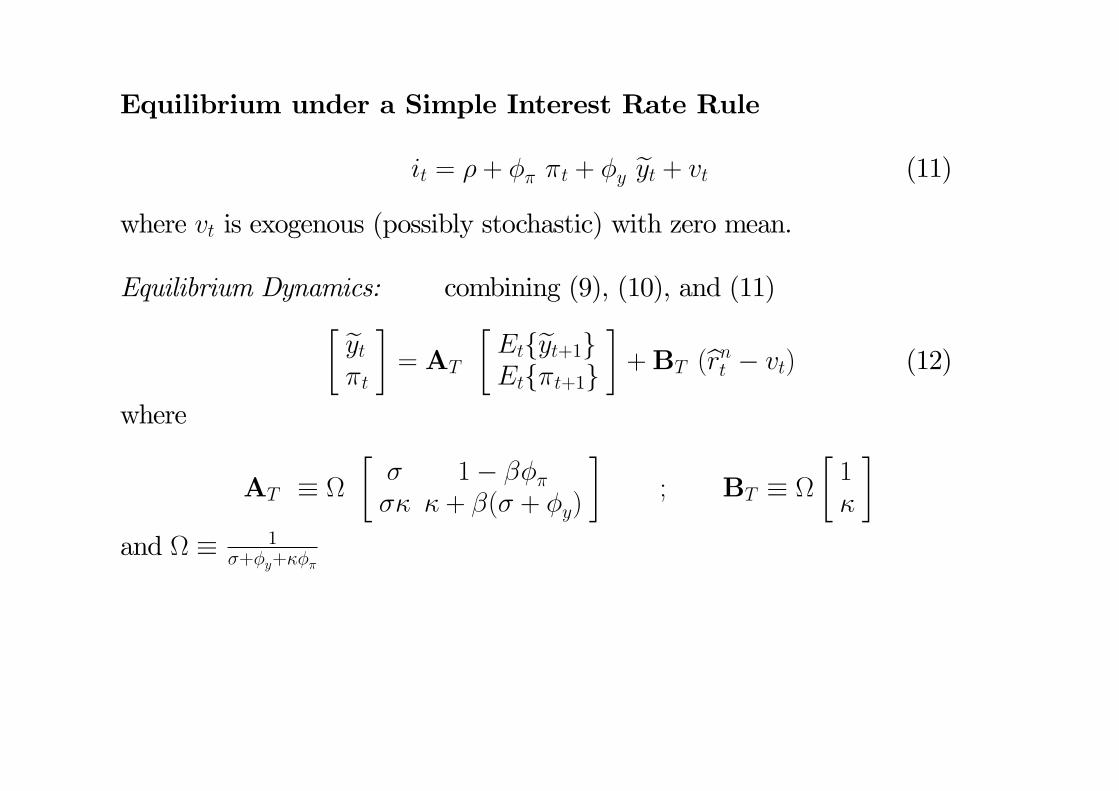
Equilibrium under a Simple Interest Rate Rule
it = � + �� �t + �y eyt + vt (11)
where vt is exogenous (possibly stochastic) with zero mean.
Equilibrium Dynamics: combining (9), (10), and (11)� eyt�t
�= AT
�Etfeyt+1gEtf�t+1g
�+BT (brnt � vt) (12)
where
AT � �� 1� ����� � + �(� + �y)
�; BT �
�1�
�and � 1
�+�y+���

Uniqueness () AT has both eigenvalues within the unit circle
Given �� � 0 and �y � 0, (Bullard and Mitra (2002)):
� (�� � 1) + (1� �) �y > 0
is necessary and su¢ cient.
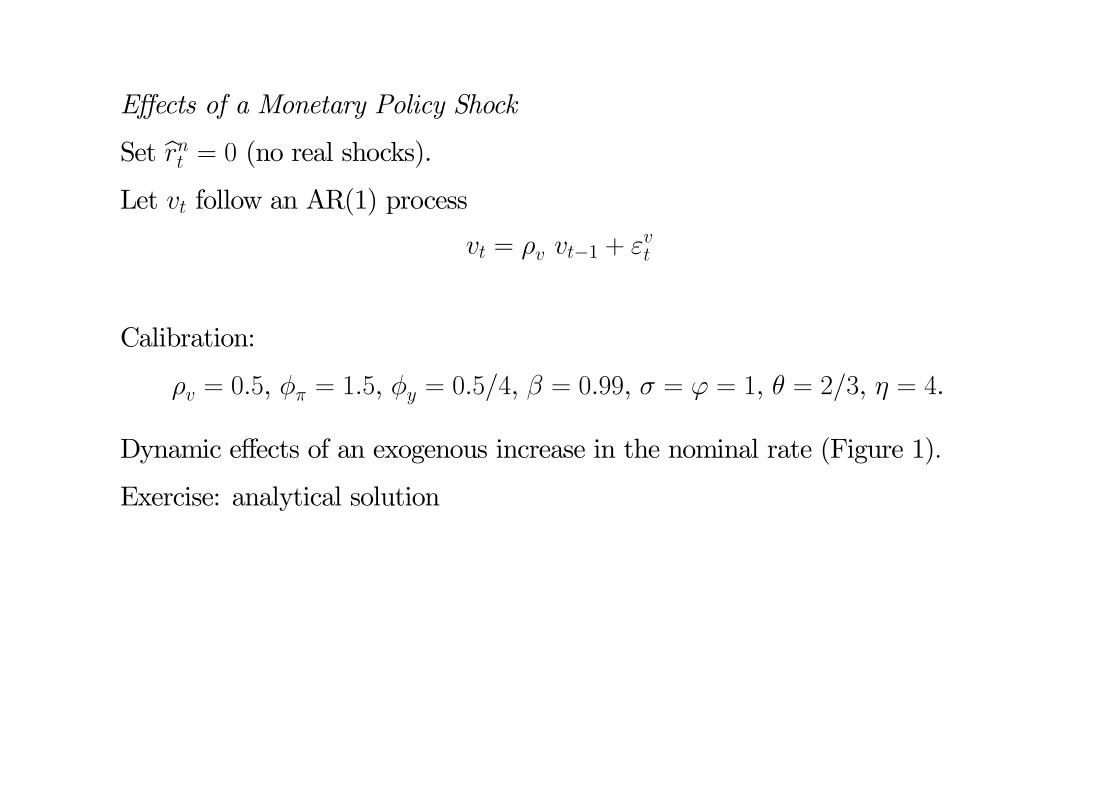
E¤ects of a Monetary Policy Shock
Set brnt = 0 (no real shocks).Let vt follow an AR(1) process
vt = �v vt�1 + "vt
Calibration:
�v = 0:5, �� = 1:5, �y = 0:5=4, � = 0:99, � = ' = 1, � = 2=3, � = 4.
Dynamic e¤ects of an exogenous increase in the nominal rate (Figure 1):
Exercise: analytical solution

Figure 3.1: Effects of a Monetary Policy Shock (Interest Rate Rule))

E¤ects of a Technology Shock
Set vt = 0 (no monetary shocks).
Technology process:at = �a at�1 + "
at :
Implied natural rate: brnt = �� ya(1� �a) at
Dynamic e¤ects of a technology shock (�a = 0:9) (Figure 2)
Exercise: AR(1) process for �at
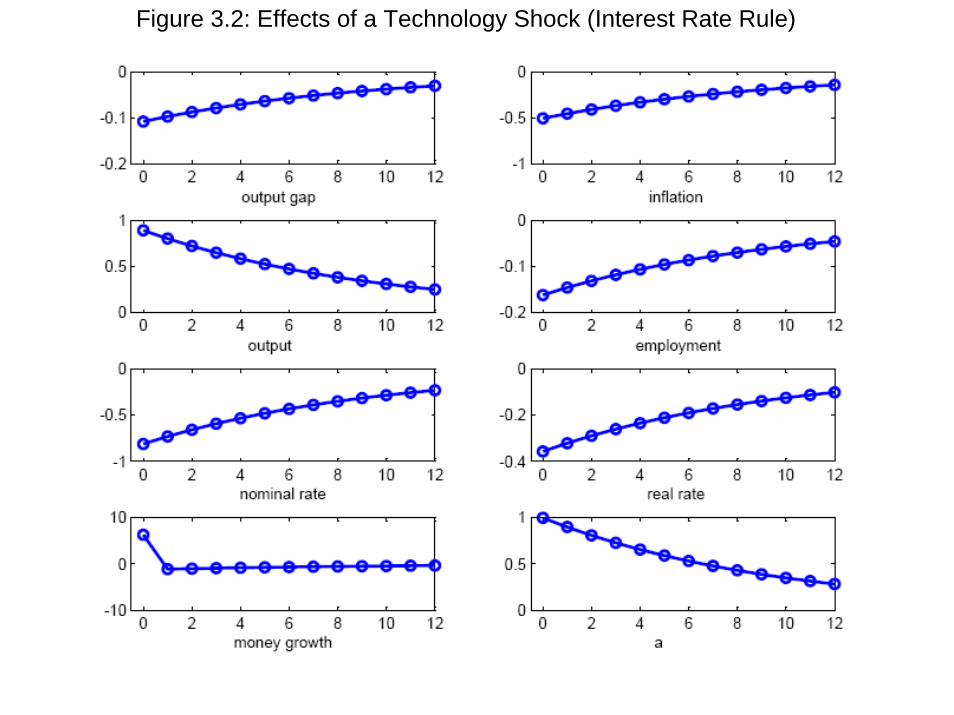
Figure 3.2: Effects of a Technology Shock (Interest Rate Rule)

Equilibrium under an Exogenous Money Growth Process
�mt = �m �mt�1 + "mt (13)
Money market clearing
blt = byt � � bit (14)= eyt + bynt � � bit (15)
where lt � mt � pt denotes (log) real money balances.
Substituting (14) into (10):
(1 + ��) eyt = �� Etfeyt+1g + blt + � Etf�t+1g + � brnt � bynt (16)
Furthermore, we have blt�1 = blt + �t ��mt (17)
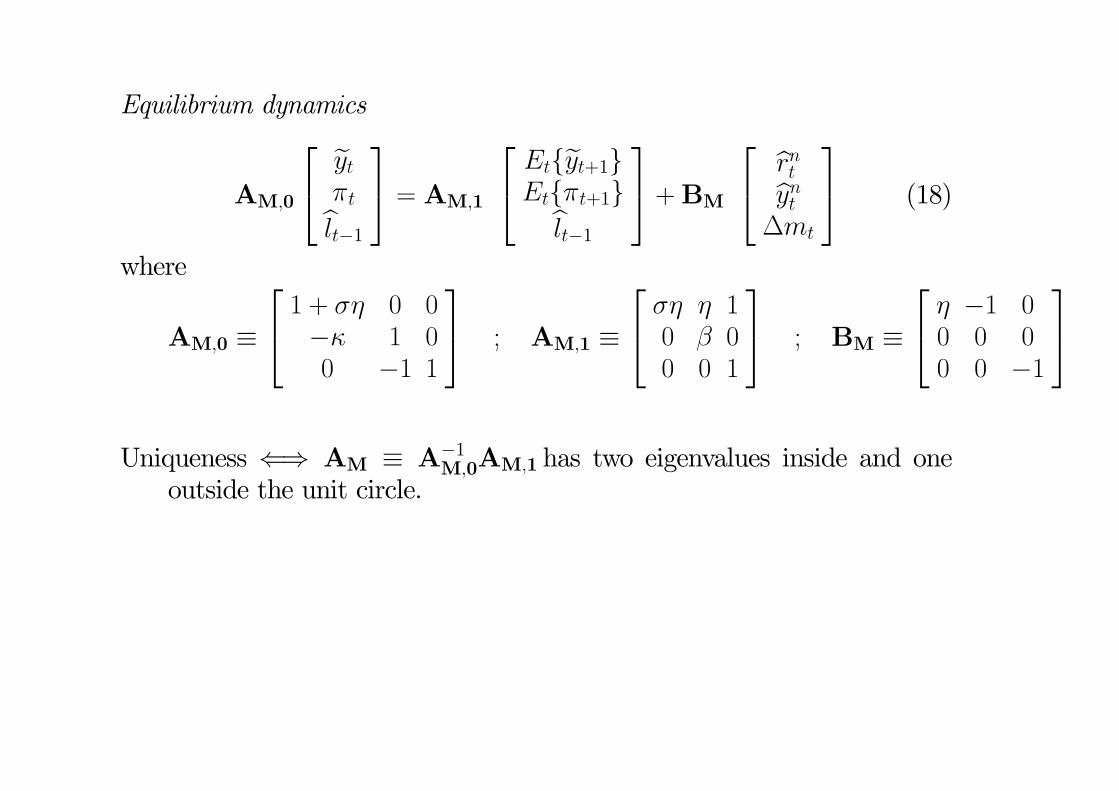
Equilibrium dynamics
AM;0
24 eyt�tblt�135 = AM;1
24 Etfeyt+1gEtf�t+1gblt�1
35 +BM24 brntbynt�mt
35 (18)
where
AM;0 �
24 1 + �� 0 0�� 1 00 �1 1
35 ; AM;1 �
24 �� � 10 � 00 0 1
35 ; BM �
24 � �1 00 0 00 0 �1
35Uniqueness () AM � A�1
M;0AM;1 has two eigenvalues inside and oneoutside the unit circle.

E¤ects of a Monetary Policy Shock
Set brnt = ynt = 0 (no real shocks).
Money growth process
�mt = �m �mt�1 + "mt (19)
where �m 2 [0; 1)Figure 3 (based on �m = 0:5)
E¤ects of a Technology Shock
Set �mt = 0 (no monetary shocks).
Technology process:at = �a at�1 + "
at :
Figure 4 (based on �a = 0:9).
Empirical Evidence
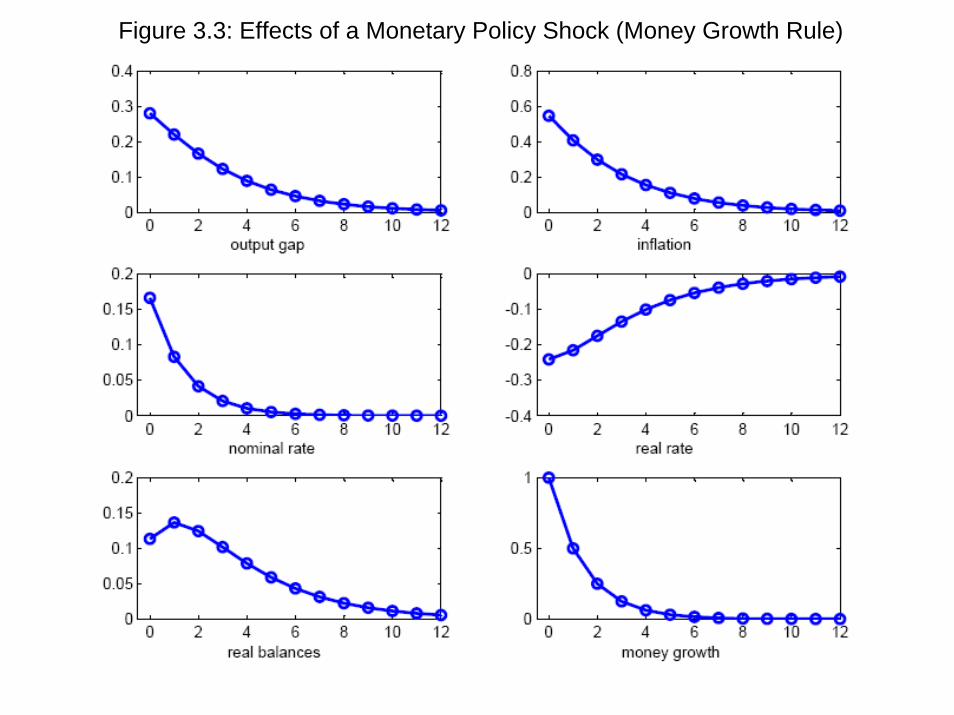
Figure 3.3: Effects of a Monetary Policy Shock (Money Growth Rule)
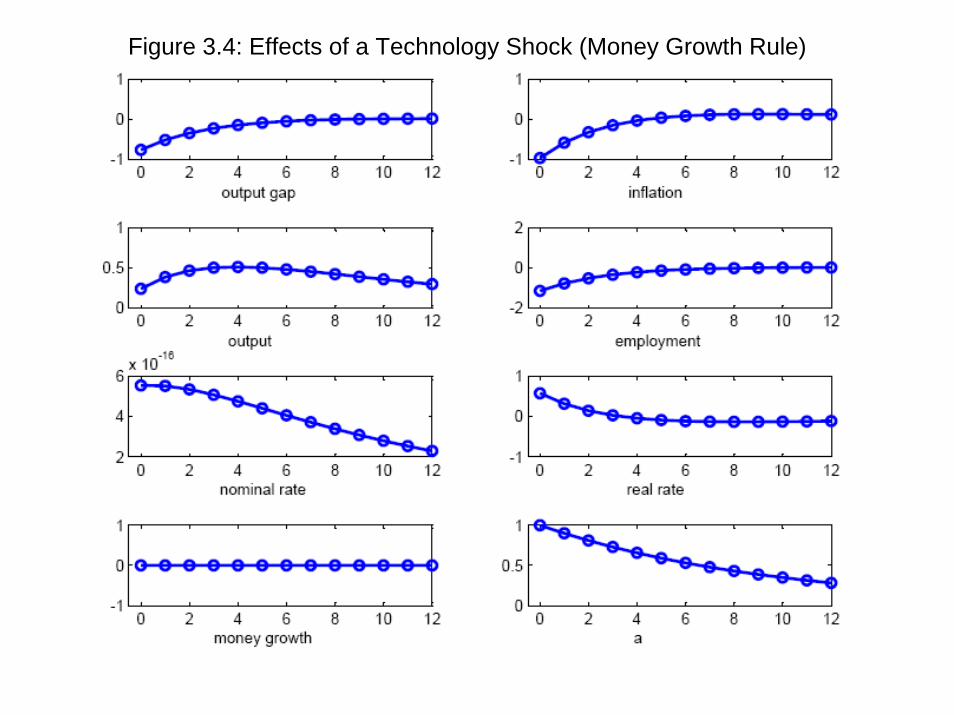
Figure 3.4: Effects of a Technology Shock (Money Growth Rule)
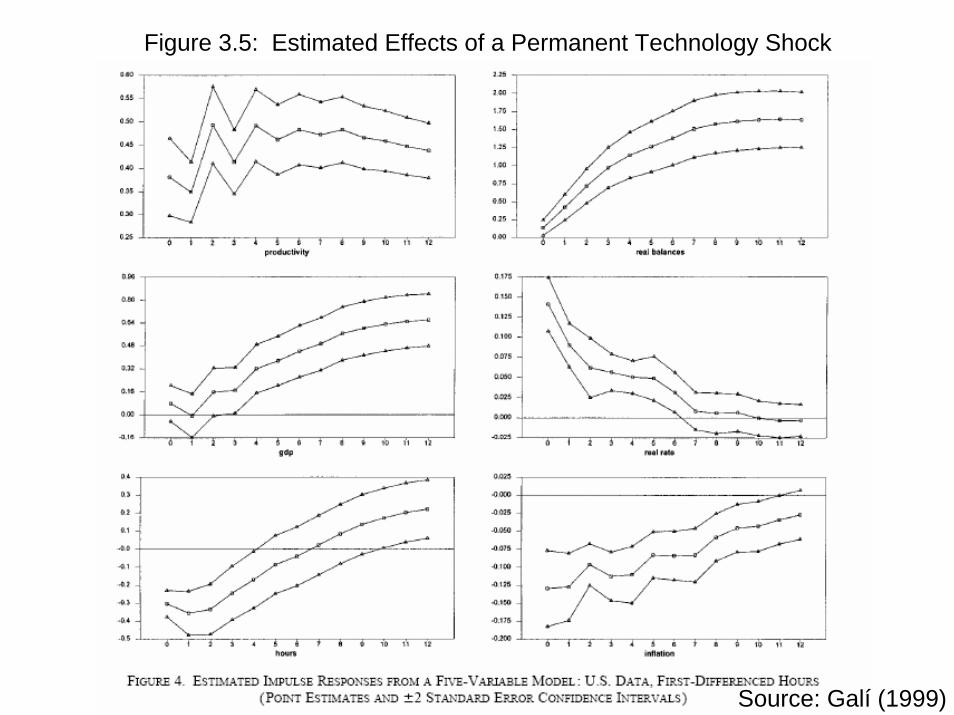
Source: Galí (1999)
Figure 3.5: Estimated Effects of a Permanent Technology Shock

Technical Appendix
Optimal Allocation of Consumption Expenditures
Maximization of Ct for any given expenditure levelR 10Pt(i) Ct(i) di � Zt can be formalized by means of the Lagrangean
L =�Z 1
0
Ct(i)1� 1
� di
� ���1
� �
�Z 1
0
Pt(i) Ct(i) di� Zt
�The associated �rst order conditions are:
Ct(i)� 1� Ct
1� = � Pt(i)
for all i 2 [0; 1]. Thus, for any two goods (i; j) we have:
Ct(i) = Ct(j)
�Pt(i)
Pt(j)
���which can be plugged into the expression for consumption expenditures to yield
Ct(i) =
�Pt(i)
Pt
���ZtPt
for all i 2 [0; 1]. The latter condition can then be substituted into the de�nition of Ct, yieldingZ 1
0
Pt(i) Ct(i) di = Pt Ct
Combining the two previous equations we obtain the demand schedule:
Ct(i) =
�Pt(i)
Pt
���Ct
Log-Linearized Euler Equation
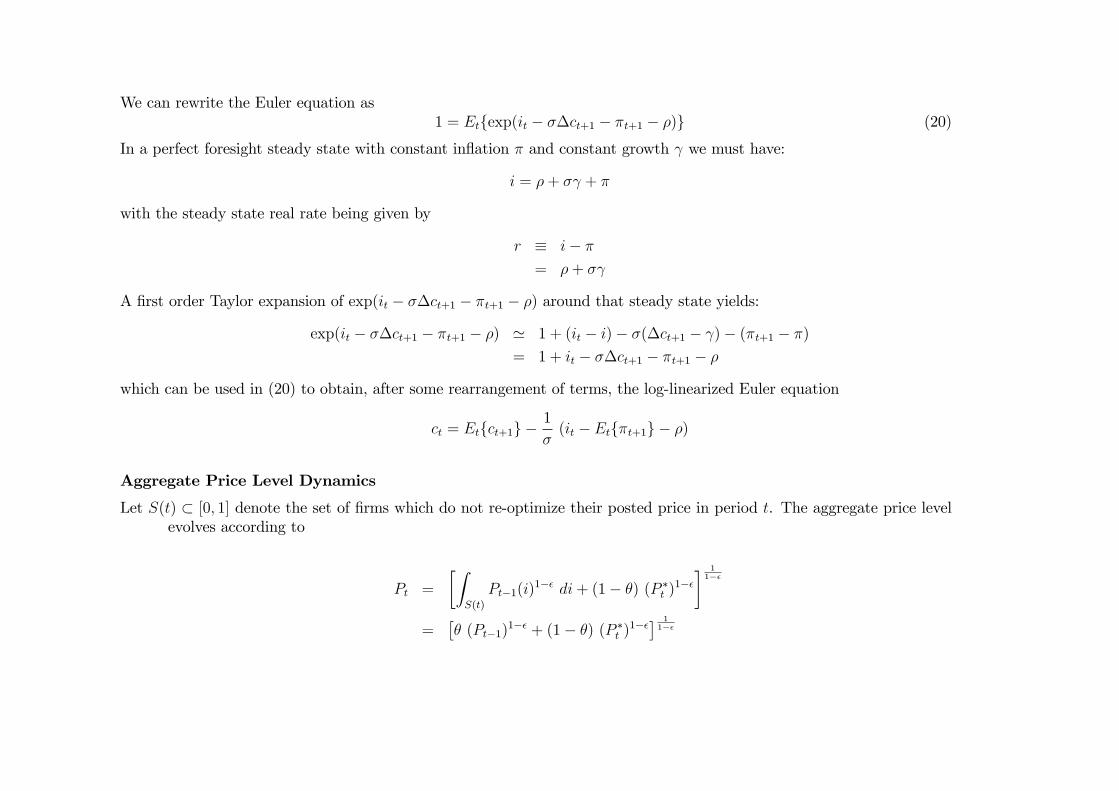
We can rewrite the Euler equation as1 = Etfexp(it � ��ct+1 � �t+1 � �)g (20)
In a perfect foresight steady state with constant in�ation � and constant growth we must have:
i = �+ � + �
with the steady state real rate being given by
r � i� �
= �+ �
A �rst order Taylor expansion of exp(it � ��ct+1 � �t+1 � �) around that steady state yields:
exp(it � ��ct+1 � �t+1 � �) ' 1 + (it � i)� �(�ct+1 � )� (�t+1 � �)
= 1 + it � ��ct+1 � �t+1 � �
which can be used in (20) to obtain, after some rearrangement of terms, the log-linearized Euler equation
ct = Etfct+1g �1
�(it � Etf�t+1g � �)
Aggregate Price Level Dynamics
Let S(t) � [0; 1] denote the set of �rms which do not re-optimize their posted price in period t. The aggregate price levelevolves according to
Pt =
�ZS(t)
Pt�1(i)1�� di+ (1� �) (P �t )
1��� 11��
=�� (Pt�1)
1�� + (1� �) (P �t )1��� 1
1��

where the second equality follows from the fact that the distribution of prices among �rms not adjusting in period tcorresponds to the distribution of e¤ective prices in period t� 1, with total mass reduced to �.
Equivalently, dividing both sides by Pt�1 :
�1��t = � + (1� �)
�P �tPt�1
�1��(21)
where �t � PtPt�1
. Notice that in a steady state with zero in�ation P �t = Pt�1:
Log-linearization around a zero in�ation (� = 1) steady state implies:
�t = (1� �) (p�t � pt�1) (22)
Price Dispersion
From the de�nition of the price index:
1 =
Z 1
0
�Pt(i)
Pt
�1�"di
=
Z 1
0
expf(1� �)(pt(i)� pt)g di
' 1 + (1� �)
Z 1
0
(pt(i)� pt) di+(1� �)2
2
Z 1
0
(pt(i)� pt)2 di
thus implying the second order approximation
pt ' Eifpt(i)g+(1� �)
2
Z 1
0
(pt(i)� pt)2 di

where Eifpt(i)g �R 10pt(i) di is the cross-sectional mean of (log) prices.
In addition, Z 1
0
�Pt(i)
Pt
�� �1��
di =
Z 1
0
exp
�� �
1� �(pt(i)� pt)
�di
' 1� �
1� �
Z 1
0
(pt(i)� pt) di+1
2
��
1� �
�2 Z 1
0
(pt(i)� pt)2 di
' 1 +1
2
�(1� �)
1� �
Z 1
0
(pt(i)� pt)2 di+
1
2
��
1� �
�2 Z 1
0
(pt(i)� pt)2 di
= 1 +1
2
��
1� �
�1
�
Z 1
0
(pt(i)� pt)2 di
' 1 +1
2
��
1� �
�1
�varifpt(i)g > 1
where � � 1��1��+�� , and where the last equality follows from the observation that, up to second order,Z 1
0
(pt(i)� pt)2 di '
Z 1
0
(pt(i)� Eifpt(i)g)2 di
� varifpt(i)g
Finally, using the de�nition of dt we obtain
dt � (1� �) log
Z 1
0
�Pt(i)
Pt
�� �1��
di ' 1
2
�
�varifpt(i)g