by ecfs - federal communications commissionas filed...july 15, 2019 by ecfs ms. marlene h. dortch...
TRANSCRIPT

July 15, 2019
By ECFS
Ms. Marlene H. Dortch
Secretary
Federal Communications Commission
445 12th Street, SW
Washington, DC 20554
Re: Expanding Flexible Use of the 3.7 to 4.2 GHz Band, GN Docket No. 18-122
Dear Ms. Dortch:
On July 11, 2019, Ross J. Lieberman, ACA Connects – America’s Communications Association
(“ACA Connects”), Nikos Andrikogiannopoulos, Cartesian, Inc., Pantelis Michalopoulos, on
behalf of ACA Connects, Alexi Maltas and Courtney Neville, Competitive Carriers Association
(“CCA”), and Elizabeth Andrion and Colleen King, Charter Communications, Inc. (“Charter”),
met with Nicholas Degani and Aaron Goldberger, advisors to Chairman Pai; Erin McGrath,
advisor to Commissioner O’Rielly and Christopher McGillen, legal intern in Commissioner
O’Rielly’s office; Umair Javed, advisor to Commissioner Rosenworcel; and William Davenport,
advisor to Commissioner Starks regarding the above-referenced proceeding.
At the meetings, the participants discussed the C-band proposal recently filed by ACA Connects,
CCA, and Charter.1 ACA Connects also presented the study it commissioned and previously
filed with the FCC, illustrating that at least 370 MHz of C-band spectrum can be cleared in an
expedited timeframe for use by next generation wireless services while making whole and
incentivizing stakeholders and benefiting the public.2
1 See Letter from Ross Lieberman, ACA Connects – America’s Communications Association,
Alexi Maltas, Competitive Carriers Association, and Elizabeth Andrion, Charter
Communications, Inc., to Marlene H. Dortch, Secretary, FCC, GN Docket No. 18-122 (July 2,
2019).
2 See Letter from Pantelis Michalopoulos and Georgios Leris, Counsel for ACA Connects –
America’s Communications Association, to Marlene H. Dortch, Secretary, FCC, GN Docket No.
18-122 (July 9, 2019). ACA Connects is submitting with this letter an updated version of the
PowerPoint presentation, which removes the names of certain programming organizations. Their
use in the PowerPoint filed on July 9, 2019 was not intended to signify endorsement of the
proposal by these organizations.

Marlene H. Dortch
July 15, 2019
Page 2 of 2
Respectfully submitted,
/s/
Alexi Maltas
Senior Vice President & General Counsel
COMPETITIVE CARRIERS ASSOCIATION
601 New Jersey Avenue NW
Suite 820
Washington, DC 20001
(202) 747-0711
Ross Lieberman
Senior Vice President, Government Affairs
ACA CONNECTS – AMERICA’S
COMMUNICATIONS ASSOCIATION
2415 39th Pl NW
Washington, DC 20007
(202) 494-5661
Elizabeth Andrion
Senior Vice President, Regulatory Affairs
CHARTER COMMUNICATIONS, INC.
601 Massachusetts Avenue NW
Suite 400W
Washington, DC 20001
(202) 621-1900
Enclosure
www.cartesian.comCopyright © 2019 Cartesian, Inc. All rights reserved.
C-band Spectrum Clearing Plan
Prepared for:
July 11, 2019

Copyright © 2019 Cartesian, Inc. All rights reserved. 2
› Up to $29 Billion
› Rural Fiber Deployment
› 200K+ Jobs
Executive Summary
Our plan aims to support the clearing of at least 370 MHz of C-band spectrum in a timely manner over the United States
› At least 370 MHz
› FCC-led Auction
› Reimbursements
› Incentives
› Urban: 18 Months
› Majority: 3 Years
› Hard-to-reach Areas: Up to 5 Years
• At least 370 MHz throughout the United States, nearly twice the amount of the CBA proposal
• An FCC-led auction, which may include an incentive auction
• Programmers and MVPDs will switch from C-band to fiber delivery; satellite operators will continue to serve non-MVPD customers on the remaining C-band spectrum
• At least 370 MHz of spectrum in all urban markets (i.e. areas where 5G is expected to be first deployed) could be cleared in 18 months
• Other markets to be cleared in 3 years, except in a few areas where fiber deployment is harder and clearance could take up to 5 years
Y1 Y2 Y3 Y4 Y5
1.Amount of Spectrum
2.Process
3. Timing
Our Spectrum Clearing Plan
• Benefits to U.S. Treasury from auction’s proceeds, direct/indirect new jobs creation, and socioeconomic benefits from increased fiber availability/capacity
4. Benefits
+++
Source: Cartesian, ACA Connects

Copyright © 2019 Cartesian, Inc. All rights reserved. 3
Our Plan vs. CBA Plan
We propose a transparent process that delivers almost twice as much spectrum as the CBA proposal in a faster timeframe. Our plan also provides fiber connectivity in rural areas and proceeds to the U.S. Treasury
Source: Cartesian, ACA Connects
CBA PlanOur Plan
Spectrum: At most 200 MHz
Timing: Within 3 years
Process: Private sale
U.S. Treasury Proceeds: $0
Satellite Launches: Needed within 3 years
Fiber Deployment: 0 miles
Timing: 18 months in urban markets, within 3 years in most of country, and 5 years in hard-to-reach areas.
Process: FCC-led auction
U.S. Treasury Proceeds: Up to $29B
Satellite Launches: None needed within first 3 years
Fiber Deployment: ~420K route miles of fiber
20192020
2021
Spectrum: At least 370 MHz

Copyright © 2019 Cartesian, Inc. All rights reserved. 4
C-band Satellite Capacity
Each C-band satellite uses the entire 500 MHz through 24 transponders
Source: Cartesian, Intelsat, Northern Sky Research
C-band Transponders, Satellites & Orbital Slots
• There are 24 orbital slots with CONUS coverage• Each satellite utilizes the entire C-band, i.e. 500 MHz• There are currently 23 in-orbit satellites plus spares
Transponders
3800 MHz
3840 MHz
3880 MHz
3920 MHz
3820 MHz
3860 MHz
3900 MHz
• Each satellite has 24 transponders, spaced 20 MHz apart from one another
• A satellite customer may need only a small fraction of a transponder
…
24 CONUS orbital slots
Shutting down one transponder on each satellite clears 20 MHz nationwide
24 transponders per satellite
AMC-8139° West
AMC-672° West

Copyright © 2019 Cartesian, Inc. All rights reserved. 5
How is the C-band Being Used?
MVPD Programming occupies ~70% of the C-band in use; providing MVPDs an alternative delivery platform provides a viable path to freeing up a large portion of spectrum
Up to ~70% of transponders’ bandwidth
is being utilized by Distribution, i.e. MVPDs
375
300
225
150
75
02018
Broadband Access
DTH
Enterprise Data
Telephony & Carrier
Contribution & OUTV
Distribution
~100 TPEs2
A small proportion of Distribution belongs to non-MVPD customers & earth station users
Distribution
Tran
spo
nd
er
Equ
ival
en
ts
(TP
Es)1
1 Refers to number of transponders given bandwidth of 36 MHz per transponder 2 We conservatively picked the higher of the two estimates (100 TPEs, 94 TPEs), see slide 35Source: Ericsson/NSR, IBFS
C-band Demand by Application
MVPD
~240
Non-MVPD
~100Estimated Number of TPEs
~2.6K ~14KEstimated Number of Earth Stations
~240 TPEs

Copyright © 2019 Cartesian, Inc. All rights reserved. 6
130 MHz is more than enough to satisfy non-MVPD C-band demand
We estimate no more than 130 MHz is needed to support non-MVPD use, leaving at least 370 MHz free to be reallocated for 5G wireless services
1 Based on 23 in-service satellites times 24 transponders per satellite 2 Conservative estimate of supply based on 138 TPEs (6 transponders x 23 satellites) more than capable of addressing demand of 100 TPEs over the next few years
Source: Cartesian, LyngSat, Northern Sky Research, C-Band Alliance
500 MHz of total available spectrum
=
xPercentage Used (%)
Ava
ilab
le
Tran
spo
nd
er E
qu
ival
en
ts (
TPEs
)
Unused
MVPD
Non-MVPD
32% > 150 MHz
~43% ~ 220 MHz
~25% < 130 MHz
5521
~174
~240
~1382
2018 Estimate
Estimated TransponderAvailability (TPEs)
Estimated Transponder Distribution (%)
Estimated Spectrum Required( MHz)

Copyright © 2019 Cartesian, Inc. All rights reserved. 7
0
50
100
150
200
250
300
350
400
450
0
50
100
150
200
250
300
350
400
450
Ensuring C-band Supply Exceeds Demand (Our Plan vs. CBA Plan)
With the same number of satellite launches as the CBA plan, our plan can clear spectrum and meet customer demand without needing a satellite launch within the first 3 years
1 Based on average transponder payload of 24 per satellite launch and assumed 6 TPEs available in upper 130 MHz band2 We are conservatively using 100 TPEs for non-MVPD demand under our plan and the more recent lower estimate for the total demand under the CBA plan, i.e. 295 TPEs = 100 TPEs (non-MVPD) + 195 TPEs (MVPDs)Source: Cartesian, LyngSat, Northern Sky Research, C-Band Alliance
Capacity includes one extra launch (Intelsat’s Galaxy 30)1
Proposed satellites launched
Capacity includes launches from our plan (includes Galaxy 30 launch)
Capacity includes one extra launch (Intelsat’s Galaxy 30)1
Capacity includes launches from CBA plan (includes Galaxy 30 launch)
CBA proposed satellite launches
36 months
80 months
Our Plan
EstimatedNon-MVPD Capacity
Requirements2
Date
CBA Plan
Date
Estimated Current MVPD and Non-MVPD
Capacity Requirements2
Tran
spo
nd
er E
qu
ival
ents
(TP
Es)
36 months
80 months

Copyright © 2019 Cartesian, Inc. All rights reserved. 8
Part 1: Transitioning the MVPD Industry from C-band to Fiber Video Delivery
Similar to how programmers and MVPDs transport programming via fiber today, they will deploy fiber to interconnect their headends and to peer in major data centers nationwide1
1. The plan provides for alternative delivery solutions in remote areas of Alaska where fiber deployment is not possible 2. Uses 8% cost of capital, 3. Model uses extrapolation to cover all MVPD subscribers, 4. Fiber obtained through IRU purchases, 5. Newly built fiber
Uplink Stations
C-bandSatellite
Major Data Center
MVPD Earth Stations
Terrestrial Fiber Video Delivery Model
Fiber
C-Band Connection
Connections
Programmers
Programmers, who already utilize fiber today to deliver their programming to uplink earth stations, will expand their use of fiber by purchasing IRUs and obtaining and installing equipment necessary to deliver (over redundant paths) their programming to 40 to 50 data centers across the country. Some programmers will also provide two C-band feeds for a limited time during the transition.
MVPD Earth Station Users
MVPD earth station users will purchase IRUs and deploy fiber (over redundant paths) to interconnect their headends and connect to data centers, and obtain and install equipment (e.g. multicast routers, transcoders, DRM) needed to deliver the transported programming to their headends. Some MVPD earth station users will need to repoint antennas while they establish fiber connectivity.
Key Metrics: $6.2 - 7.0B2 NPV 2.6K+3 MVPD Earth Stations 300K4+120K5 Fiber Route Miles 10 Gbps Bandwidth
Source: Cartesian, ACA Connects

Copyright © 2019 Cartesian, Inc. All rights reserved. 9
Modeling Methodology: Video Transport Network
We used 42 existing data centers across the country to transport video content from uplink earth stations to endpoints closer to the earth stations
Source: Cartesian, IBFS Earth Stations Registrations, ACA Connects
Major Datacenter Video Transport NetworkUplink Station Earth Station

Copyright © 2019 Cartesian, Inc. All rights reserved. 10
Non-MVPD Customers & Earth Station Users
Similar to the CBA plan, non-MVPD earth station users will repoint antennas, if needed, and receive filters to prevent interference form 5G users.
Satellite Operators
Similar to the CBA plan, non-MVPD satellite customers in the lower portion of the C-band will be repacked to the upper portion. No greater number of satellite launches needed compared to the CBA plan.
Part 2: Taking care of Non-MVPD Customers & Earth Station Users
Non-MVPD C-band users will continue to use the C-band, after a transition comparable to the CBA plan, including repacking, antenna repointings and filter installations
1 Based on JP Morgan Spectrum & 5G Overview - March 2019. Includes provision for operational costsSource: Cartesian, ACA Connects, Kerrisdale Analysis
C-bandSatellite
Uplink Stations
Non-MVPD Satellite Services Delivery
C-Band Connection
Connections
Key Metrics: $3 - 4B1 Repacking + Satellite Launch Costs ~14K Non-MVPD Earth Stations ≤ 130 MHz C-band Spectrum
Repacking in Upper C-Band Earth Stations (Non-MVPD)
Use of Frequency Filters

Copyright © 2019 Cartesian, Inc. All rights reserved. 11
Part 3: Timeline for Clearing Spectrum
Urban markets can be cleared within 18 months, most other markets within 3 years, and certain hard-to-build areas within 5 years
Transitioning MVPDs to Fiber
Delivery
Taking Care of Non-MVPD
C-band Users
Replacement Satellite Launch
Non-MVPDsMVPDsProgrammers Satellite Operators
5 satellites to be launched in 7 years; no satellite launches needed until year 3, unlike CBA plan.
Programmers set up to peer in data centers, some migrate to lower portion of C-band. Urban MVPDs acquire fiber to interconnect. Non-urban MVPDs repoint antennas to migrated programmers in lower C-band.
Non-MVPD customers migrate to upper portion of C-band; Urban, Non-MVPD earth station users repoint antennas (as needed) and obtain filters.
Non-urban, MVPDs acquire and/or build fiber to interconnect.
Remaining MVPDs acquire and/or build fiber to interconnect.Programmers cease utilizing C-band at the end of this stage.
Non-urban, non-MVPD earth station users repoint antennas (as needed) and obtain filters.
Remaining non-MVPD earth station users repoint antennas (as needed) and obtain filters.
Urban MarketsMajority of
Remaining MarketsHard–to-Build Areas
Urban and otherfiber-rich markets
Suburban and othereasy-to-build markets
Rural, remote and other hard-to-build markets
Year: 1 2 3 4 5
Source: Cartesian, ACA Connects

Copyright © 2019 Cartesian, Inc. All rights reserved. 12
Programmers
Stakeholder Costs Comments
Costs to Be Reimbursed
Satellite operators and non-MVPD C-band users to be reimbursed for costs similar to those recognized under the CBA plan. Programmers and MVPDs to be reimbursed for costs to purchase or build fiber and switch to terrestrial fiber-based network
1 Totals are based on a 10-Year Net Present Value (NPV) using 8% cost of capital for fiber and 7-Year NPV for other items2 C-band revenues are estimated in the range of $340M-$400M annually; assuming 60-70% can be attributed to programmers, this is approx. $240M per year3 Estimate based on p.39 of Kerrisdale analysis4 In addition, programmers will be reimbursed for the use of two feeds during transition period
Source: Cartesian, ACA Connects, Ericsson, Kerrisdale Analysis, NSR
MVPD Earth Station Users
• Reimbursement for fiber IRUs and new fiber deployment to allow delivery of programming between data centers and MVPD headends, among other costs.
NPV: ~$6.0B-$6.8B1
• Reimbursement of an average $40M per year for the purchase of IRUs to deliver programming via fiber across 40-50 data centers for 5 years.
Note: Upon completion of the MVPD transition from satellite to fiber delivery in year five, the programming industry’s annual video delivery cost will drop from the current $240M to only $40M.
NPV: $200M+1,4
Satellite Operators
• Reimbursement of approximately $1.1 billion for new satellite launches to replace satellites reaching end of life.
• Reimbursement of about $240M/year for two years of lost revenue from the programmers after the MVPD industry completes its transition to fiber in year five.
NPV: ~$1.5B-$2.0B1,2
Lost RevenueSatellite Launches
$
Year101 5
Non-MVPD C-band Users
• Reimbursement of about $300-400M per year for the migration to the upper portion of the C-band, and to repoint antennas if needed, and install filters.
NPV: ~$1.5B-$2.0B1,3
Estimated Total Costs Needed from Auction Proceeds to Clear Spectrum: $9.2 – 11.0B1
Year101 5
$
Terrestrial Network
RepackingDual Illumination
$
Year101 5

Copyright © 2019 Cartesian, Inc. All rights reserved. 13
Incentive Payments & Commitments
Our plan balances incentives with commitments to ensure smooth operational transition for all involved C-band stakeholders
Note: The estimated cost of re-farming and transitioning the C-band could serve as the equivalent of a reserve price—i.e., no spectrum is cleared unless the proceeds from the 5G auction suffice to cover all estimated costs
Source: ACA Connects, JP Morgan Spectrum & 5G Overview - March 2019, T-Mobile’s Refined C-band Incentive Auction Proposal
Satellite Operators
• Continue serving non-MVPD earth station operators over the remaining spectrum without price increases for extended period of time
• Satellite industry to receive all incentive payments (over and above ‘make whole’ payments) appropriate for the clearing of 200 MHz
• Satellite industry to receive a portion of the incentive payments appropriate for clearing the C-band spectrum above 200 MHz
MVPDEarth Station
Users
• MVPD Earth Station Users to receive a portion of the incentive payments (over and above ‘make whole’ payments) appropriate for clearing the C-band spectrum above 200 MHz
Stakeholder Incentives Commitments
• Forego the use of investments in C-band earth stations and equipment1
1 See Coleman Bazelon, The Brattle Group, Maximizing the Value of the C-band, at 22 (attached as Appendix A to Joint Comments of Intel Corp., Intelsat License LLC, and SES Americom, Inc., GN Docket No. 18-122 (Oct. 29, 2018))
Copyright © 2019 Cartesian, Inc. All rights reserved. 14
Comments
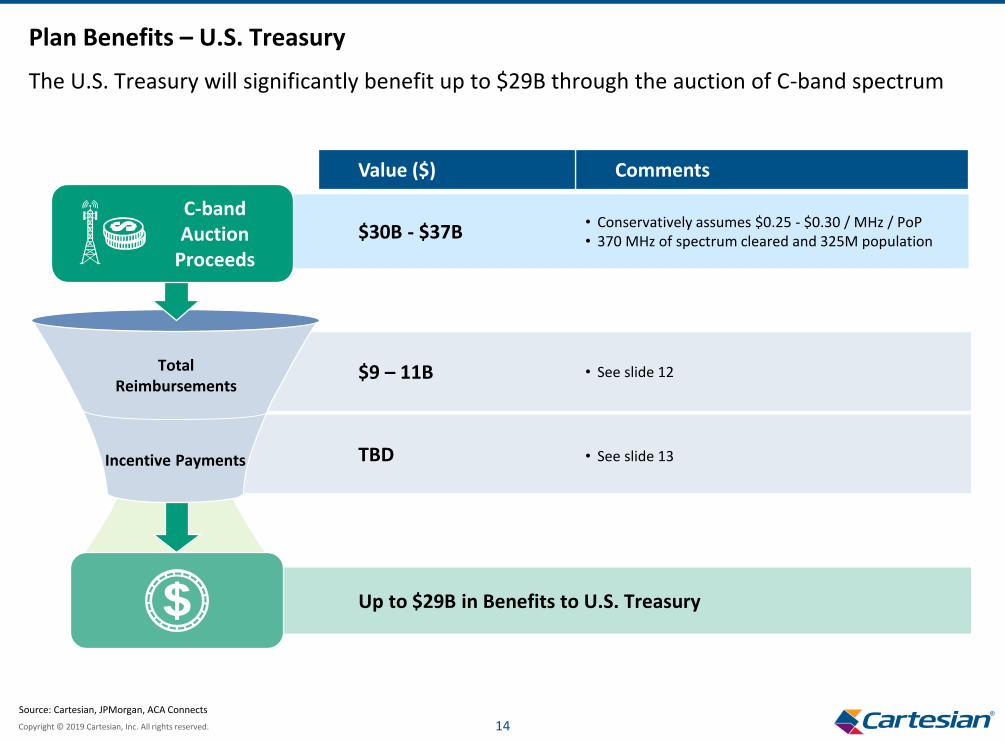
Plan Benefits – U.S. Treasury
The U.S. Treasury will significantly benefit up to $29B through the auction of C-band spectrum
Source: Cartesian, JPMorgan, ACA Connects
TBD • See slide 13
$30B - $37B
Total Reimbursements
$9 – 11B
Incentive Payments
Up to $29B in Benefits to U.S. Treasury
C-band Auction
Proceeds
• Conservatively assumes $0.25 - $0.30 / MHz / PoP• 370 MHz of spectrum cleared and 325M population
• See slide 12
Value ($)

Copyright © 2019 Cartesian, Inc. All rights reserved. 15
Plan Benefits – Socioeconomic
Increased fiber connectivity in rural areas has several direct and indirect socioeconomic benefits arising from faster internet connectivity and dark fiber availability
Increased Fiber CapacityPutting more fiber into the ground allows
for higher dark- and lit-fiber capacityin rural areas
Enablement of Smart Grid & Smart Metering ApplicationsPower utilities have been increasingly
upgrading their infrastructure, using dark fiber to connect their smart
Ultra-Fast Broadband BenefitsPast Cartesian study estimated the
socioeconomic benefit per household, which was grouped into six categories:
e-work, e-health, e-learning, e-commerce, consumer video use, and cloud computing
Increased Internet ReliabilityConstructing multiple fiber routes
increases redundancy level of internet backhauling links, offering protection from
fiber cuts and service disruptions
Source: Cartesian, Referenced Cartesian 2014 Ultra-fast Broadband Study for Corning
FiberCapacity
Accelerated Deploymentof 5G Small Cells
Mobile operators place small cells in proximity to existing fiber networks
5GBackhauling
InternetReliability
Increased Broadband Access to some Underserved Locations
~100 MVPD earth stations are in areas where there is no broadband service
within a 3 mile radius, affecting ~100K households
Smart GridsUltra-Fast
BroadbandUnderserved Households
Benefits of Increased Rural Fiber Connectivity

Copyright © 2019 Cartesian, Inc. All rights reserved. 16
Expert Economists’ Studied Effect of Broadband Investment
96-140K direct jobs
16-20K jobs per $ billion
of broadband investment1
$6-7B investment
in fiber broadband
=
x
x~1x spillover effect
in downstream jobs2
=
192-280K total direct + indirect jobs
Aerial Fiber Deployment5G Microcell
Remote Equipment
Plan Benefits – Job Market
On top of the socioeconomic benefits, there are significant direct and spillover effects of fiber investment in increased number of jobs over and above the CBA plan
1 p.253, Digitized Labor: The Impact of the Internet on Employment2 p.3 FCC Comments of Corning Inc.
Fiber Deployment Labor Effects
Incremental 5G jobs from more players deploying 5G given more spectrum availability
+

Copyright © 2019 Cartesian, Inc. All rights reserved. 17
• Additional Considerations
• Terrestrial Fiber Video Delivery Costs
• C-band Capacity Requirements
• Spectrum Clearing Timelines
Appendix

Copyright © 2019 Cartesian, Inc. All rights reserved. 18
Additional Considerations
The following elements, which are mentioned in our July 2 letter, are considered beneficial
Source: ACA Connects
• Protection for out-of-band emissions (“OOBE”) from 5G users towards C-band earth station users that will continue to utilize the band
• Fully-functional 5G (downlink and uplink) spectrum that will have 100% geographical availability after reallocation, allowing 5G user equipment (“UE”) to rely upon international standards
• Spectrum aggregation limits and licensing rules to encourage auction participation and interoperability
Copyright © 2019 Cartesian, Inc. All rights reserved. 19
• Additional Considerations
• Terrestrial Fiber Video Delivery Costs
• C-band Capacity Requirements
• Spectrum Clearing Timelines
Appendix

Copyright © 2019 Cartesian, Inc. All rights reserved. 20
Modeling Methodology – An Example
We modeled a terrestrial video transport mechanism with 3 components: (a) Video Transport Network, (b) Video Transport Endpoint (“VTE”) to Earth Station Delivery, and (c) Earth Station Interconnection
1 Per ACA Connects member interviews, we’ve assumed large, sophisticated MVPDs with more than 30K subscribers have already built interconnection fiber Source: Cartesian
Cable Operator, Earth Station
Video Transport EndpointExisting Data Centers
Uplink Station
c
b
VTE to Earth Station Delivery
• IRU or partially build dark fiber to connect Video Delivery Endpoint (data center) to Master Cable Headend (earth station)
• Use dual-path dark fiber for redundancy
Earth Station Interconnection
• IRU or build dark fiber for earth station interconnection in a ring topology (for redundancy)
• MVPDs who have already built interconnection fiber1 get the incremental service cost of a 10 Gbps wavelength service
Video Transport NetworkaVTE to Earth Station
bEarth Station Interconnection
c
KEY:
a
Video Transport Network
• Connect Uplink Stations to nearby data center
• Model minimum spanning tree to connect all data centers
• IRU dual-path dark fiber to connect data centers

Copyright © 2019 Cartesian, Inc. All rights reserved. 21
Modeling Cost Breakdown
Costs are primarily driven by fiber between video transport endpoints and earth stations with second largest cost item being interconnecting multiple earth stations with fiber
Source: Cartesian, Form 477, IBFS Earth Stations Registration, ACA Connects
Item CommentsCost EstimateEst. Fiber
Route Miles
$6-7B
$0.9B
Total Cost
ExtrapolatedUnmodeled Costs
10-Year NPV Cost
Subscribers of MVPDs not in Model1: Extrapolating more extreme costs per subs to the remaining % of subs to address unmodeled, hardest-to-reach MVPD subscribers
420K
80K(implied miles)
$0.2B
$0.6B
Video Transport Network
Switching &Transcoding Equipment
Downcoding and Optical Equipment: Equipment must be purchased to downcode 4K and MPEG-4 content to MPEG-2, as well as optical equipment to transmit over fiber
IRU: Redundant dark fiber paths support a ~30K-mile video transport network across 42 data centers
30K
-
$1.4B-$1.9B
$2.8B-$3.3B
Earth Station Interconnection
Endpoint to Earth StationConnection
Build vs. IRU: An assumed mix of 70% IRU’d fiber and 30% built fiber in markets with limited dark fiber supply
Interconnection: 70% IRU’d fiber; larger MVPDs (> 30K) have access to wavelength services whereas smaller ones use a similar mix (70-30) of IRU’d and newly constructed fiber
Largest C
ost Ite
ms
200K
110K
$0.1BData Center
Maintenance Fees
Rackspace and Cross-Connect Fees: Carriers must pay for space for equipment within datacenters and cross-connection with the VTN
-
$0.03BNon-CONUS Provider CostsVideo Delivery over Subsea Leases: The few non-CONUS cable providers can still connect to the VTN over lit services on subsea fiber to the non-CONUS territories.1
-
1 In Alaska, other means of connectivity are available.

Copyright © 2019 Cartesian, Inc. All rights reserved. 22
Bandwidth Requirement Estimations
We estimated required bandwidth currently and in the future based on # channels, definition, compression and increased 4K adoption; 10 Gbps capacity seems to satisfy video needs
Source: Cartesian, MVPD Operator Interviews, Netflix, Amazon
Current Estimate
Bandwidth Estimates
Total Bandwidth
3.5 Gbps
Current MVPD: Represents the bandwidth requirements for operators with a well developed linear TV product
Blackout & VOD: Additional streams required for regional sports and video-on-demand content (HD streams in current estimate, UHD in future estimate)
Future Estimate
Total Bandwidth
4.6-5.7 Gbps
Future-Proofed MVPD Service:Represents the bandwidth requirements of a scenario where a larger proportion of linear TV is delivered as both 4K UHD and HD considering any improvements in 4K video compression
HD Channels
400
Bandwidth/Channel
6 Mbps
Bandwidth
2.4 Gbps
SD Channels
400
Bandwidth/Channel
2 Mbps
Bandwidth
800 Mbps
UHD Channels
10
Bandwidth/Channel
15 Mbps
Bandwidth
150 Mbps
Blackout Channels
10
Bandwidth/Channel
6 Mbps
Bandwidth
60 Mbps
VOD Channels
10
Bandwidth/Channel
6 Mbps
Bandwidth
60 Mbps
HD Channels
400
Bandwidth/Channel
6 Mbps
Bandwidth
2.4 Gbps
SD Channels
0
Bandwidth/Channel
2 Mbps
Bandwidth
0 Mbps
UHD Channels
200
Bandwidth/Channel
10-15 Mbps
Bandwidth
2-3 Gbps
Blackout Channels
10
Bandwidth/Channel
10-15 Mbps
Bandwidth
100-150 Mbps
VOD Channels
10
Bandwidth/Channel
10-15 Mbps
Bandwidth
100-150 Mbps
x
x
x
x
x
x
x
x
x
x
=
=
=
=
=
=
=
=
=
=

Copyright © 2019 Cartesian, Inc. All rights reserved. 23
Estimated Fiber Transport Availability
We estimated at least 20% of fiber miles need to be constructed in areas with low dark fiber supply
Source: Cartesian, Form 477, IBFS Earth Stations Registration, ACA Connects
Comments
Small, Rural Providers: Small, rural providers are present in less competitive areas – MVPD size and population density increases when there is more fiber competition (4+ Fiber-Based Service Providers)
VTN Endpoints: Per the following slide, we selected endpoints to minimize transport distance, which reduced the amount of miles operators in rural areas have to traverse to connect to video transport endpoints
Cost: Our conservative estimate of 30% of built fiber miles reflects the low-levels of fiber transport options for small, rural MVPDs
0 1 2 3 4+
# of Fiber-Based Service Providers
% of TotalFiber Miles
% of MVPDs
2.1%
3.4%
5.4%
7.7%
12.5%
15.9%
15.1%
16.6%
64.8%
56.3%
Population Density
(Pop/Sq Mile)
112 97 186 136 425
Avg. Size (Subscribers)
1.9K 2K 3K 4K 120K
>20% of fiber route miles in low fiber supply markets
Copyright © 2019 Cartesian, Inc. All rights reserved. 24
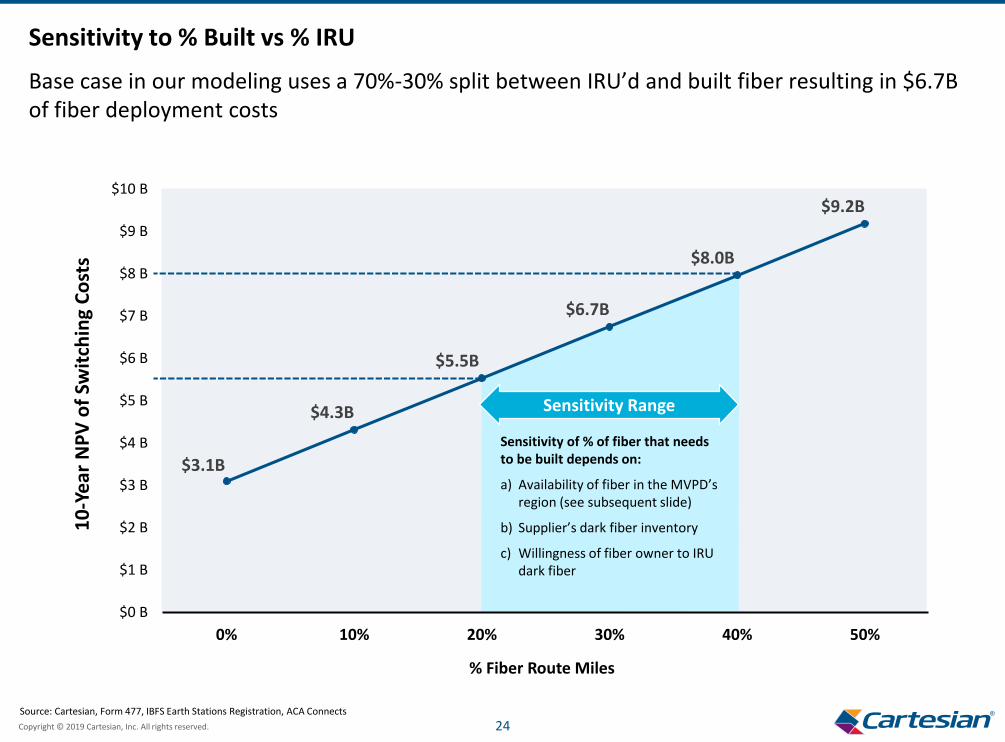
$3.1B
$4.3B
$5.5B
$6.7B
$8.0B
$9.2B
$0 B
$1 B
$2 B
$3 B
$4 B
$5 B
$6 B
$7 B
$8 B
$9 B
$10 B
0% 10% 20% 30% 40% 50%
10
-Ye
ar N
PV
of
Swit
chin
g C
ost
s
% Fiber Route Miles
Sensitivity to % Built vs % IRU
Base case in our modeling uses a 70%-30% split between IRU’d and built fiber resulting in $6.7B of fiber deployment costs
Source: Cartesian, Form 477, IBFS Earth Stations Registration, ACA Connects
Sensitivity of % of fiber that needs to be built depends on:
a) Availability of fiber in the MVPD’s region (see subsequent slide)
b) Supplier’s dark fiber inventory
c) Willingness of fiber owner to IRU dark fiber
Sensitivity Range

Copyright © 2019 Cartesian, Inc. All rights reserved. 25
Video Transport Network Assumptions
Modeled video transport network uses IRU’d fiber between existing data center locations in Tier 1, 2 and a select few other markets
Source: Cartesian, Form 477, IBFS Earth Stations Registration, ACA Connects, Data Center Map
Assumption Rationale Cost Driver
42 Major Markets, 17 Uplink Stations
Major Markets: Tier 1/2 markets selected to minimize video transport endpoint connection costs for MVPDsUplink Stations: Earth Stations registered to major content providers (e.g., NBCU) operating in the 5.925-6.425 GHZ frequency
Data Center Map
IBFS C-band Uplink Earth Station Registrations
Interconnections
100% IRU
Existing Fiber: Major fiber providers (e.g., Zayo, Level 3/CenturyLink, Windstream, etc.) have already built fiber between large marketsOptimal Spectrum Alternative: Dark fiber obtained through an IRU provides an optimal secure channel with enough bandwidth to transmit bandwidth
Fiber provider reported network maps
ACA Connects Member interviews
Lease Type
100% MPEG-4 Transport
Current Standard: Most channels currently transported terrestrially via fiber use MPEG-4 compressionEfficient Transport: MPEG-4 compression reduces the bandwidth requirements of video transport
NBC Sports
ACA Connects Member interviews
Compression
$100K Optical MUX or Layer 2/3 Routers
Location: Optical MUX or Layer 2/3 Routers required at all interconnection points to support broadcast of linear video content
CartesianEquipment
Redundant Minimum Spanning Tree
Common Routes: Takes advantage of high-traffic routes where fiber leases are availableBackup Feed: Redundant feed required to support broadcast in case of a fiber cut or other network outage
ACA Connects Member interviews
Architecture
Source

Copyright © 2019 Cartesian, Inc. All rights reserved. 26
Video Delivery Fiber Network Assumptions
Fiber availability over routes derive from Form 477 analysis; construction costs are based on rural fiber deployment benchmarks (mostly aerial, rural) and verified over ACA Connects interviews
Source: Cartesian, Form 477, IBFS Earth Stations Registration, ACA Connects, Data Center Map
Location and Quantity: 2 SFPs and 1 patch cord/router for every interconnect point an operator hasEthernet Protocol: SFPs enable ethernet over dark fiber or built fiber – an alternative is to lease ethernet services
Equipment$70K Layer 2/3 Switches$10K Long Range SFPs
$30 Ethernet Patch Cords
Proportion of Existing Route Fiber
20% Build,80% IRU,
Form 477: For each carrier, we analyzed the presence of access fiber as a proxy for transport fiber availabilityIRU Lease Decision: We assume a higher portion leased as an IRU due to strategic benefits
Aerial vs. Underground
70% Aerial, 30% Underground
Utility Poles: Depending on the existence of utility poles and the terrain along a proposed route, some miles of built fiber must be built underground
Aerial Build Costs$30K/mile
Cost Estimation: Vast majority of interviewed members use aerial fiber deployment with varying costs around the country based on level of make-ready work required; average cost used in our calculations which includes utility pole attachment fees
Underground Build Costs
$80K/mile
Regulatory Fees: Laying underground fiber incurs a more stringent regulatory and permitting processCost of Labor: Includes labor costs for digging and boring
Average Global Price: Based on Zayo’s average price Higher QoS: Wavelengths provide greater QoS for operators that seek higher quality service
$5K/route
Wavelength
Commoditized Service: Transport services are becoming increasingly commoditized, creating pricing pressureZayo Price Trends: We analyzed Zayo prices trends to estimate the decline of wavelength and ethernet prices
-10% CAGRPrice Decline
Critical Traffic: Operators would need a redundant path to ensure service availability in the event of a network outage
Dual-Path FiberRedundancy
Down payment Range: Down payments range from $2K in rural areas to $4K in urban areas – we used the midpoint as our assumptionMaintenance: Multiple operators indicated a range for maintenance cost that encompassed $20/mile/month
IRU$3K/mile Down payment,
$20/mile/month Maintenance
Built Fiber Maintenance Opex
5% of yearly construction costs
Repairs: Once fiber has been built, occasional fiber breaks must be repairedRental fees: Space on utility poles and right of way permitting must be maintained on a yearly basis
Rack space: Space must be rented at each of the data centers a carrier obtains the IPTV for necessary switching/conversion equipmentCross connect: Data centers charge a fee to connect to the VTN signal
Colocation Space$1.5K per data center
connection/month
Cartesian
Form 477
Cartesian
Cartesian
Columbia Telecommunications Corp.
Cartesian
Columbia Telecommunications Corp.
Zayo
ACA Connects interviews
Zayo
ACA Connects Interviews
ACA Connects interviews
CTC Net
Cartesian
CTC
FCC
Cartesian
Assumption Rationale Cost Driver Source

Copyright © 2019 Cartesian, Inc. All rights reserved. 27
Earth Station Interconnect Assumptions
Our fiber build assumptions have the greatest impact on the earth station interconnect costs
Source: Cartesian, Form 477, IBFS Earth Stations Registration, ACA Connects
Transcoder Capacity: $10K of transcoders can handle 50 channelsChannels Offered: Most interviewed operators offer 200-300 channelsTranscoder Requirement: 20 sets of transcoders, handling 50 channels can support 1000 channels, which covers most MVPDs’ needs for current and future encoding needs
20 Transcoders,$10K/Transcoding
Legacy Set-Top-Boxes: Many operators have set-top-boxes that require MPEG-2 compressionTranscoding: We assume operators will need to transcode MPEG-4 broadcast into MPEG-2 to deliver to subscribers
MPEG-2
Cost Estimation: Vast majority of interviewed members use aerial fiber deployment with varying costs around the country based on level of make-ready work required; average cost used in our calculations which includes utility pole attachment fees
$30K/mile
Regulatory Fees: Laying underground fiber incurs a more stringent regulatory and permitting processCost of Labor: The cost of labor for digging and boring is greater than laying fiber along utility poles
$80K/mile
Broadcast Requirements: QoS is extremely important for broadcasting linear content and purchasing dual-path fiber to transport fiber between earth stations guarantees service will remain up in the event of a circuit failure
Ring Architecture,Dual-Path Fiber
Cost Estimation: For MVPDs with unknown earth stations, we estimated the switching cost and then removed 33% of the cost to account for MVPDs that are currently using OTT services (e.g., Vubiquity) to deliver video content – use of OTT services estimated from ACA Connects Member Survey
33% of MVPDs with Unknown Earth Stations
Assumed to Use OTT Services
Headend Consolidation: The smallest MVPD we spoke to (~30K) subscribers had already consolidated headends and built out interconnection fiber, so we assumed all MVPDs with 30K+ subscribers have done the same
MVPDs with 30K+ Subscribers Already
Interconnected
Location and Quantity: 2 SFPs and 1 switch for each earth stationEthernet Protocol: SFPs enable ethernet over dark fiber or built fiber – an alternative is to lease ethernet services
$70K Layer 2/3 Switch$4K Mid Range SFPs
5% of yearly construction costs
Repairs: Once fiber has been built, occasional fiber breaks must be repairedRental fees: Space on utility poles and right of way permitting must be maintained on a yearly basis
ACA Connects Member interviews
ACA Connects Member interviews
Zayo
Telegeography
Cartesian
Columbia Telecommunications Corp.
Cartesian
Columbia Telecommunications Corp.
ACA Connects Member interviews
ACA Connects Member interviews and Survey
Cartesian
Cartesian
CTC
FCC
Equipment Costs
Compression
Aerial Build Costs
Underground Build Costs
Redundancy
Current Interconnection Status
Built Fiber Maintenance Opex
Assumption Rationale Cost Driver Source

Copyright © 2019 Cartesian, Inc. All rights reserved. 28
Other Assumptions
Other model build assumptions related to the use of “straight-as-the-crow-flies” distances converted to road distances and a discount rate used in the 10-year NPV cost calculations
Source: Cartesian, National Institute of Health, Public Reports
1.4X Straight-Line Distance
“Detour Index”: 1.417 is the slope of the regression model a researcher at the NIH ran to compare straight-line and road distances
National Institute of HealthRoad Distance
Conversion
Cable MVPD Operator Public Reports
Discount Rate 8%Commonly Used Discount Rate: A number of MVPDs use 8% as a discount rate for long-term business planning
Assumption Rationale Cost Driver Source

Copyright © 2019 Cartesian, Inc. All rights reserved. 29
T-Mobile vs. Our Plan’s Fiber Investment Cost Comparison
The difference between the T-Mobile and our plan’s estimates of fiber investment cost is mainly driven by considering earth station proximity to data centers rather than census blocks, and accounting for fiber path redundancy
Category CommentsT-Mobile Our Plan
Average Cost per Fiber Mile ($/mile)
• The lower cost per mile in our plan is largely driven by the inclusion of ~70% IRU, consistent with the view that fiber connectivity is already available in most locations under consideration
Number of Earth Stations
• T-Mobile’s estimate is based on providing fiber to all earth stations, and seems to leave out thousands of earth stations in use today.
• Our estimate is based on providing fiber to ~2.6k MVPD earth stations.13.4K 2.6K
Total Fiber Route Miles (miles)
• T-Mobile’s estimate measures the distance from earth stations to the closest fiber-connected census block. It wrongly assumes interconnection would be available at these points, and even if so, that such locations could provide connectivity with SLAs that’s necessary for most c-band services.
• Our estimate measures the distance from MVPD earth stations to Tier 1 data centers. It also accounts for dual-path fiber and fiber rings for redundancy.
21K
miles
420K
miles
$65K $11K
Total Investment ($)• T-Mobile’s estimate of fiber investment cost is about one-third less than
our estimate, and doesn’t include other costs necessary for earth stations to transition from c-band to fiber delivery.
$1.4B $4.6B
Copyright © 2019 Cartesian, Inc. All rights reserved. 30
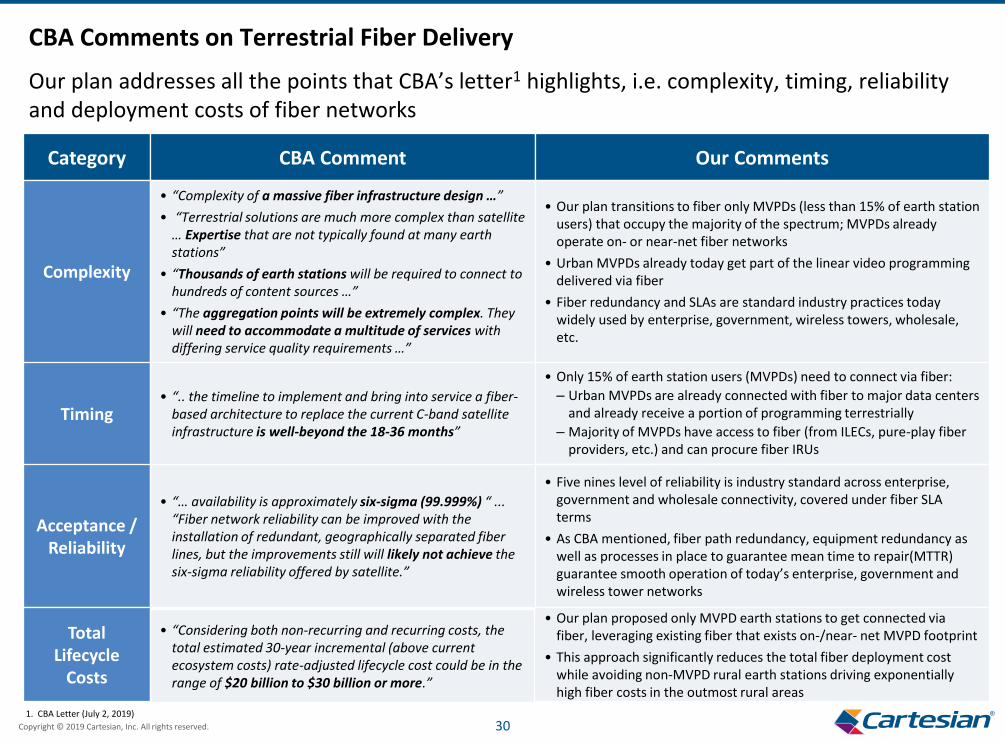
CBA Comments on Terrestrial Fiber Delivery
Our plan addresses all the points that CBA’s letter1 highlights, i.e. complexity, timing, reliability and deployment costs of fiber networks
Category CBA Comment
Timing• “.. the timeline to implement and bring into service a fiber-
based architecture to replace the current C-band satellite infrastructure is well-beyond the 18-36 months”
Acceptance / Reliability
• “… availability is approximately six-sigma (99.999%) “ ... “Fiber network reliability can be improved with the installation of redundant, geographically separated fiber lines, but the improvements still will likely not achieve the six-sigma reliability offered by satellite.”
Total Lifecycle
Costs
• “Considering both non-recurring and recurring costs, the total estimated 30-year incremental (above current ecosystem costs) rate-adjusted lifecycle cost could be in the range of $20 billion to $30 billion or more.”
Complexity
• “Complexity of a massive fiber infrastructure design …”
• “Terrestrial solutions are much more complex than satellite … Expertise that are not typically found at many earth stations”
• “Thousands of earth stations will be required to connect to hundreds of content sources …”
• “The aggregation points will be extremely complex. They will need to accommodate a multitude of services with differing service quality requirements …”
Our Comments
• Only 15% of earth station users (MVPDs) need to connect via fiber:
– Urban MVPDs are already connected with fiber to major data centers and already receive a portion of programming terrestrially
– Majority of MVPDs have access to fiber (from ILECs, pure-play fiber providers, etc.) and can procure fiber IRUs
• Our plan transitions to fiber only MVPDs (less than 15% of earth station users) that occupy the majority of the spectrum; MVPDs already operate on- or near-net fiber networks
• Urban MVPDs already today get part of the linear video programming delivered via fiber
• Fiber redundancy and SLAs are standard industry practices today widely used by enterprise, government, wireless towers, wholesale, etc.
• Five nines level of reliability is industry standard across enterprise, government and wholesale connectivity, covered under fiber SLA terms
• As CBA mentioned, fiber path redundancy, equipment redundancy as well as processes in place to guarantee mean time to repair(MTTR) guarantee smooth operation of today’s enterprise, government and wireless tower networks
• Our plan proposed only MVPD earth stations to get connected via fiber, leveraging existing fiber that exists on-/near- net MVPD footprint
• This approach significantly reduces the total fiber deployment cost while avoiding non-MVPD rural earth stations driving exponentially high fiber costs in the outmost rural areas
1. CBA Letter (July 2, 2019)

Copyright © 2019 Cartesian, Inc. All rights reserved. 31
• Additional Considerations
• Terrestrial Fiber Video Delivery Costs
• C-band Capacity Requirements
• Spectrum Clearing Timelines
Appendix

Copyright © 2019 Cartesian, Inc. All rights reserved. 32
Current US C-band Satellites
1 Satellite list collated from grooming plans provided by satellite owner in ex parte filings 2 Based on Intelsat estimates of C-band fleet at end of FY2018; average of Intelsat launch-to-life-end time used for non-Intelsat satellites3 Assumes 24 transponders per satellite (per industry grooming plans in ex parte filings)4 Does not cover the entire US5 Satellites in inclined orbit are typically not used for DTHSource: Cartesian, Intelsat, LyngSat, Intelsat, SES, Telesat, Eutelsat
# Satellite1 Owner Position Launch Year Age and Estimated Useful Life (in Years)2 TPs3 TPs in Use Status
1 Eutelsat 113 West A
Eutelsat
113 °W 2013 24 18 Active
2 Eutelsat 115 West B4 115 °W 2015 24 1 Active
3 Eutelsat 117 West A 117 °W 2013 24 21 Active
4 E172B4
Intelsat
172 °E 2017 24 3 Inclined Orbit5
5 Galaxy 28 89 °W 2005 24 11 Active
6 Galaxy 17 91 °W 2007 24 21 Active
7 Galaxy 3C 95 °W 2002 24 17 Active
8 Galaxy 19 97 °W 2008 24 22 Active
9 Galaxy 16 99 °W 2006 24 16 Active
10 Galaxy 23 121 °W 2003 24 9 Active
11 Galaxy 18 123 °W 2008 24 4 Active
12 Galaxy 14 125 °W 2005 24 22 Active
13 Galaxy 13 127 °W 2003 24 15 Active
14 Galaxy 15 133 °W 2005 24 18 Active
15 SES 2
SES
87 °W 2011 24 7 Active
16 SES 1 101 °W 2010 24 19 Active
17 SES 3 103 °W 2011 24 19 Active
18 SES 11 105 °W 2017 24 19 Active
19 AMC 11 131 °W 2004 24 15 Active
20 AMC 8 139 °W 2000 24 1 Active
21 Anik F1R
Telesat
107 °W 2005 24 8 Active
22 Anik F2 111 °W 2004 24 7 Active
23 Anik F3 119 °W 2007 24 1 Active
Total: 552 294
There are currently 23 satellites providing C-band coverage to the United States
6
4
6
14
12 .0
17
11
13
16
11
14
16
14
8
9
8
2
15
18
14
15
12
21
21
21
21
17
17
21
23
21
19
23
16
23
20
21
21
21
21
21
21
21
21
21
Average Age: ~11 years
2

Copyright © 2019 Cartesian, Inc. All rights reserved. 33
Upper-Band Transponder Utilization
We have estimated transponder availability in the upper band based on current usage
1 Corresponding to the middle of an estimated 36-MHz range for each transponder. Overlaps across satellites indicate geographic or time-based segmentation2 Includes a 20 MHz guard band3 Assumes customers on TPs currently in guard band are relocated to other locations4 Based on 23 satellites and 20 MHz per TransponderSource: Cartesian, Lyngsat, Northern Sky Research
Spectrum Reallocated (MHz) 2 200 220 240 260 280 300 320 340 360 370 380 400 420 440 460 480
Spectrum Remaining (MHz) 300 280 260 240 220 200 180 160 140 130 120 100 80 60 40 20
Current Transponders in Use in Remaining Spectrum3 186 171 155 144 135 123 109 95 87 76 74 64 52 41 24 10
Transponder Supply - Maximum Available in Remaining Spectrum4 345 322 299 276 253 230 207 184 161 138 138 115 92 69 46 23
Transponder Frequency Midpoint (MHz)1 – Upper band (Above 3.9 GHz)Satellite
Horizontal polarization Vertical polarization
Estimated Capacity: 138 TPEsEstimated Current Usage: ~100 TPEsAssumed Usage: ~120 TPEs (Mid-point of estimated capacity and current usage)

Copyright © 2019 Cartesian, Inc. All rights reserved. 34
Demand: Non-MVPD Required Transponders
Bottom-up estimation of non-MVPD TPE demand corroborates with top-down estimate of ~100TPEs
* Where a transponder appeared to have both MVPD and non-MVPD content, capacity was apportioned in proportion to number of channelsSource: Cartesian, Ericsson/NSR, IBFS, Lyngsat
Top-down Non-MVPD Demand (TPEs)
Non-MVPD demand is mostly driven by Contribution & OUTV (e.g. moving news, broadcasts) with the remaining being more intermittent
type of spectrum utilization
TPEs
375
300
225
150
75
02018
Broadband Access
DTH
Enterprise Data
Telephony & Carrier
Contribution & OUTV
Distribution
~100 TPEs
A small proportion of Distribution belongs to non-MVPD earth station users
Distribution
Bottom-up Non-MVPD Demand (TPEs)*
~32% of current satellite capacity supports non-MVPD use cases
201
94
TPE Demand
295
MVPD
Non-MVPD
TPEs

Copyright © 2019 Cartesian, Inc. All rights reserved. 35
Spectrum Reallocated
(MHz) 2
200
Transponders Remaining Available3
345
Total Replacement Satellites Launched:
36 / 804 Months
5 / 5
Estimated Auction Proceeds6
$20B
Timeline Impact(Months)5
+25
First Satellite Launch (Months)
0
TotalSatellite Launch Costs7
($)
$1.1B
330
340
350
360
370
380
390
400
320
184
184
161
161
138
138
115
115
207
0 / 1
0 / 2
0 / 3
0 / 4
0 / 5
0 / 6
2 / 8
3 / 9
0 / 1
$30B
$31B
$32B
$33B
$34B
$35B
$36B
$37B
$29B
None
None
None
None
None
None
+25
None
+25
79
70
68
56
43
37
0
0
79
$0.5B
$0.7B
$0.8B
$1.0B
$1.1B
$1.3B
$1.6B
$1.9B
$0.5B
310
300
207
230
0 / 0
0 / 0
$28B
$27B
None
None
83
84
-
-
410 92 68 / 12 $38B+250 $2.2B
Spectrum Reallocation Sensitivity Analysis
Clearing at least 370 MHz is feasible and does not impact clearing timelines as there is sufficient time to launch new satellites before upper band non-MVPD TP capacity is exhausted
1 The CBA plan keeps all existing distribution customers (need ~295 TPEs), while our plan only requires ~100 TPEs)2 Includes a 20 MHz guard band3 Across 23 satellites over remaining spectrum4 Under the CBA, 5 satellites will be launched within 25 - 36 months and the next launch would be needed at ~80 months; assumes start date of July 20195 According to the CBA plan at least 25 months (up to 36 months) is needed to launch a satellite6 Based on $0.3 per MHz-pop, 325 million population7 Total satellite launch costs: Assumes $100m per build, $100 m per launch (2 satellites per launch), $100m per ground spare. Includes 2 ground and 1 in-orbit spare 8 Number of replacement satellites necessary exceeds available CONUS orbital slotsSource: Cartesian, LyngSat, Northern Sky Research, C-Band Alliance
370 MHz of spectrum can be cleared with the same number of satellites launched as the CBA plan.To clear spectrum and meet ongoing demand, the first replacement satellite need not be launched for at least 3 years
Ad
dit
ion
al S
cen
ario
s /
Sen
siti
viti
es
CB
A
Pro
po
sal1

Copyright © 2019 Cartesian, Inc. All rights reserved. 36
• Additional Considerations
• Terrestrial Fiber Video Delivery Costs
• C-band Capacity Requirements
• Spectrum Clearing Timelines
Appendix

Copyright © 2019 Cartesian, Inc. All rights reserved. 37
Programmers
DescriptionStakeholder Groups
MVPD
Earth Station Users
Satellite Operators
Non-MVPD Customers andEarth Station Users*
All major content providers supplying content to MVPDs
Earth station users, possibly including major cable providers and smaller regional providers in locations that are not currently fiber-rich, but are easier to build
The 4 major satellite owners (Intelsat, Telesat, Eutelsat and SES) with transitions plans in the CBA plan
P
M1
M2
M3
SO
N1
MVPD earth stations users - comprising mostly of the main MVPDs - located primarily in fiber-rich urban areas
Earth station users located in hard to build, rural or remote locations
Non-MVPD customers and earth stations users located primarily in fiber-rich urban areas
N2Non-MVPD customers and earth stations users located primarily in fairly easy to build areas, primarily located in suburban areas
N3Non-MVPD customers and earth stations users located in hard to build, rural or remote locations
M1M2M3
N1 N2 N3
Stakeholder Groups
Our plan requires coordination between four groups: programmers, MVPDs, satellite operators and non-MVPD users
Note: Programmers are expected to engage a third party video distribution vendor or form a coalition to allow for a consolidated set of peering points. Similarly, third parties will also be need to be engaged for filter installation in all markets* This refers to both Non-MVPD customers and earth station users (i.e. used for downlink and for uplink services)Source: Cartesian

Copyright © 2019 Cartesian, Inc. All rights reserved. 38
Clearing Timeline: Urban Markets (M1)
Spectrum in urban markets can be re-farmed within 18 months, once programmers have established data center presence and non-MVPDs are migrated to the upper C-band
Stage 1
1
2
2a
2b
1
3a
3b
4
1
2
3
Year 2Year 1
Q1 Q2Q1 Q2 Q3 Q4
1 Assumes initial planning, contracting and partner selection commences prior to Day 1. Day 1 is the point at which the FCC issues a Final Order 2 Vendor and supplier selection to provide equipment, infrastructure, services and/or expedite any spectrum clearing activities3 Some Non-MVPDs will be impacted by changes to both uplink and downlink channels
Note: It is assumed that all M1 MVPDs (in urban markets) already have access to fiber and would not need to acquire new connectivity
Satellite Operator (SO)MVPD (M)M1 M2 M3
Non-MVPD (N)N1 N2 N3
Transition Phase Transition Activity Possible Phase / Activity Extension Transition Milestone
Interconnection / Peering1. Datacenter Equipment Installation2. Video Distribution Network Deployment3. Interconnection / Peering Cutover M1 M2 M3
M1 M2 M3
Migration Stage (Spectrum Cleared / Transponders Made Available)
Initial Planning and Design 1
Contracting and Procurement 1
1. Contract / MoU Renegotiation2. Partner Selection 2
Transponder Change / Dual Illumination1. Customer Notification2. MVPD Programmers Relocation to Lower C-band
2a. Uplink - Dual Illumination2b. Downlink - Antenna Repointing
3. Non-MVPD Satcasters Relocation to Upper C-band3
3a. Uplink - Dual Illumination3b. Downlink - Antenna Repointing (as Needed)
4. 5G Filter Installation
M1 M2 M3
M1 M2 M3
N1 N2 N3
M1 M2 M3
N1 N2 N3
N1 N2 N3
N1 N2 N3
M1 M2 M3 N1 N2 N3
P M N SOSpectrum Clearing Phase / Activity
Programmer (P)

Copyright © 2019 Cartesian, Inc. All rights reserved. 39
Clearing Timeline: Suburban Markets (M2)
In the majority of the urban and suburban markets, and areas where IRUs are available, re-farming of spectrum used by MVPD users can be completed within the first 3 years
Satellite Operator (SO)MVPD (M)M1 M2 M3
Non-MVPD (N)N1 N2 N3
Transition Phase Transition Activity Possible Phase / Activity Extension Transition Milestone Completed in Previous Stage
1 70k miles of fiber IRU purchased (@1.1k miles per month and 330k miles of fiber built (@5.5k miles per month)2 Some Non-MVPDs will be impacted by changes to both uplink and downlink channels
~25 months to launch
1
2
Start of satellite build / order
3
2a
2b
1
Year 2Year 1
Q1 Q2 Q3 Q4Q1 Q2 Q3 Q4
Year 3
Q1 Q2 Q3 Q4
Stage 2Stage 1
Notes: • Spectrum is re-farmed market by market as soon as possible, once fiber has been acquired• Second round of notifications sent towards the end of stage 2 to ensure all stakeholders complete
preparation before dual illumination ends
Transponder Change / Dual Illumination1. Customer Notification2. Non-MVPD Satcasters Relocation to Upper C-band2
2a. Uplink - Dual Illumination2b. Downlink - Antenna Repointing (as Needed)
3. 5G Filter Installation
Migration Stage (Spectrum Cleared / Transponders Made Available)
Fiber Acquisition1 (M2)
Interconnection / Peering1. Datacenter Equipment Installation2. Interconnection / Peering Cutover
Replacement / New Satellite Launches1. Satellites 1 & 2
N1 N2 N3
N1 N2 N3
N1 N2 N3
M1 M2 M3
M1 M2 M3
M1 M2 M3
P M N SOSpectrum Clearing Phase / Activity
Programmer (P)

Copyright © 2019 Cartesian, Inc. All rights reserved. 40
Clearing Timeline: Rural Markets (M3)
The remaining markets in rural and remote locations, where fiber is hard to build, re-farming of spectrum can take up to 5 years
1 70k miles of fiber IRU purchased (@1.1k miles per month and 330k miles of fiber built (@5.5k miles per month)2 Some Non-MVPDs will be impacted by changes to both uplink and downlink channels
Notes: • Spectrum is re-farmed market by market as soon as possible, once fiber has been acquired.• Second round of notifications sent towards the end of stage 3 to ensure all stakeholders complete
preparation before dual illumination ends
Satellite Operator (SO)MVPD (M)M1 M2 M3
Non-MVPD (N)N1 N2 N3
Transition Phase Transition Activity Possible Phase / Activity Extension Transition Milestone Completed in Previous Stage
Stage 3Stage 1
Year 2Year 1
Q1 Q2 Q3 Q4Q1 Q2 Q3 Q4
Year 4Year 3
Q1 Q2 Q3 Q4Q1 Q2 Q3 Q4
Year 5
Q1 Q2 Q3 Q4 Q1 Q2
Year 6
3
2b
1
2
Start of satellite
build / orderStart of satellite build / order
Satellite Launch
2 ~25 months to launch
~25 months to launch
1
2a
Satellite Launch
Stage 2
Transponder Change / Dual Illumination1. Customer Notification2. Non-MVPD Satcasters Relocation to Upper C-band2
2a. Uplink - Dual Illumination2b. Downlink - Antenna Repointing (as Needed)
3. 5G Filter Installation
Migration Stage (Spectrum Cleared / Transponders Made Available)
Fiber Acquisition1 (M3)
Interconnection / Peering1. Datacenter Equipment Installation2. Interconnection / Peering Cutover
Replacement / New Satellite Launches1. Satellites 1 & 22. Satellites 2 & 3
M1 M2 M3
N1 N2 N3
N1 N2 N3
N1 N2 N3
P M N SOSpectrum Clearing Phase / Activity
M1 M2 M3
M1 M2 M3
Programmer (P)

www.cartesian.com Confidential and Proprietary — Copyright © 2019 Cartesian, Inc. All rights reserved. No part of this publication may be reproduced, stored in a retrieval system, or transmitted in any form or means (electronic, mechanical, photocopy, recording or otherwise) without the permission of Cartesian, Inc.
BOSTON
KANSAS CITY
LONDON
NEW YORK
PARIS