buy worst is now behind - hdfcsec.com - 4qfy18 - hdfc sec... · itc’s gross revenue grew by 3.6%...
TRANSCRIPT

RESULTS REVIEW 4QFY18 17 MAY 2018
ITC BUY
HDFC securities Institutional Research is also available on Bloomberg HSLB <GO>& Thomson Reuters
Worst is now behind ITC’s gross revenue grew by 3.6% vs. our expectation of 6.5%. Cigarette value growth was ~6% with volume contraction of ~3% (inline). EBITDA/ APAT grew by 7/10% vs. expectation of 10/10%. Despite steep rise in taxes, ITC has improved cigarette performance consistently. Sequentially volume decline is abating and we expect positive volume growth in FY19. EBIT growth at 8% is encouraging (margin expansion) despite downtrading. Meanwhile, FMCG revenues grew by an impressive 10% (like-to-like), driven by branded packaged foods and personal care products. Hotel maintained mid- single digit growth while EBIT growth of 13% was healthy. Agri and Paper performance was weak. ITC’s cigarette business has registered ~10/9% revenue CAGR in the last 10/5 years, despite punitive taxes. Our 7.5% revenue CAGR estimate over FY18-20E looks conservative, seen in the backdrop of demographics. Non-cigarette businesses (esp FMCG), are value accretive, with improving franchise. We expect ~14% revenue CAGR here over FY18-20E. ITC is the market leader in cigarettes (>80% by value), notebooks, valued-added paperboards and a significant
player in biscuits. Our long term positive stance on ITC derives from its status of being the cheapest consumer large-cap stock in India. At 25x FY20E EPS, ITC trades at an unfair discount of ~38% to the sector. Reiterate BUY. Our TP is Rs 358, at 32x Mar-20E EPS.
Highlights for the quarter Sequential recovery in cig. volume: Since GST rate hike
cig volume has improved sequentially (-6/-4/-3% in 2Q/3Q/4QFY18). We expect 2% vol. growth in FY19-20.
All time high FMCG EBIT margins: FMCG business reported 3% EBIT margins (64% YoY) driven by enhanced scale, product mix enrichment and cost management initiatives. Hotels EBIT grew by 13% driven by higher room rates and operating leverage.
APAT grew by 9%: EBITDA grew by healthy 7% to Rs 41.4bn. Higher other income and lower taxes led to 10% APAT growth to Rs 29.3bn (in-line).
Near-term outlook: With healthy GST collections, we don’t anticipate a tax hike in the near-term. Cig. volumes will continue to gain momentum, driving earnings growth. We see risk reward favoring ITC and believe a re-rating is around the corner.
Financial Summary (Rs mn) 4QFY18 4QFY17 YoY (%) 3QFY18 QoQ (%) FY16 FY17 FY18P FY19E FY20E Net Revenue 108,132 111,255 (2.8) 99,522 8.7 391,921 428,036 434,489 474,097 521,662 EBITDA 41,440 38,754 6.9 39,045 6.1 144,509 154,359 164,829 182,918 205,763 APAT 29,327 26,695 9.9 28,146 4.2 95,009 104,772 112,201 125,018 140,189 EPS (Rs) 2.4 2.2 8.8 2.3 3.5 7.9 8.6 9.2 10.3 11.5 P/E (x) 36.2 33.0 30.9 27.7 24.7 EV/EBITDA (x) 22.6 21.1 19.6 17.5 15.4 Core RoCE (%) 40.3 36.1 36.9 38.5 40.5 Source: Company, HDFC sec Inst Research
INDUSTRY FMCG
CMP (as on 27 Jul 2017) Rs 289
Target Price Rs 353
Nifty 10,021
Sensex 32,383
KEY STOCK DATA Bloomberg ITC IN
No. of Shares (mn) 12,161
MCap (Rs bn)/(US$ mn) 3,509/54,743
6m avg traded value (Rs mn) 4,144
STOCK PERFORMANCE (%)
52 Week high / low Rs 368 / 222
3M 6M 12M
Absolute (%) 1.0 12.1 16.6
Relative (%) (6.9) (4.0) 1.1
SHAREHOLDING PATTERN (%)
Promoters 67.20
FIs & Local MFs 5.19
FPIs 13.79
Public & Others 13.82 Source : BSE
Naveen Trivedi [email protected] +91-22-6171-7324
INDUSTRY FMCG
CMP (as on 16 May 2018) Rs 286
Target Price Rs 358
Nifty 10,741
Sensex 35,388
KEY STOCK DATA Bloomberg ITC IN
No. of Shares (mn) 12,203
MCap (Rs bn)/(US$ mn) 3,488/51,420
6m avg traded value (Rs mn) 3,246
STOCK PERFORMANCE (%)
52 Week high / low Rs 368 / 250
3M 6M 12M
Absolute (%) 7.3 12.1 0.8
Relative (%) 3.2 5.2 (14.9)
SHAREHOLDING PATTERN (%)
Promoters 0
FIs & Local MFs 36.68
FPIs 18.63
Public & Others 44.69 Source : BSE
Naveen Trivedi [email protected] +91-22-6171-7324
Siddhant Chhabria [email protected] +91-22-6171-7336

ITC: RESULTS REVIEW 4QFY18
Page | 2
Quarterly Financials (Standalone) Year to March (Rs mn) 4QFY18 4QFY17 YoY (%) 3QFY18 QoQ (%) FY18 FY17 YoY (%) Gross Revenue 179,335 173,158 3.6 167,462 7.1 670,819 641,742 4.5 Net Revenue* 108,132 111,255 (2.8) 99,522 8.7 406,275 400,887 1.3 Material Expenses 40,012 46,828 (14.6) 35,810 11.7 157,900 159,763 (1.2) Employee Expenses 6,113 5,714 7.0 5,950 2.7 24,875 24,443 1.8 Other Operating Expenses 20,568 19,960 3.0 18,716 9.9 68,091 70,900 (4.0) EBITDA 41,440 38,754 6.9 39,045 6.1 155,410 145,780 6.6 Depreciation 3,040 2,418 25.7 2,908 4.6 11,454 10,380 10.3 EBIT 38,400 36,336 5.7 36,138 6.3 143,956 135,400 6.3 Other Income 5,165 4,021 28.5 6,269 (17.6) 21,298 19,859 7.2 Interest Cost 232 (115) (302.8) 240 (3.2) 867 230 277.6 PBT before exceptional 43,333 40,471 7.1 42,167 2.8 164,388 155,030 6.0 Exceptional - - na 4,129 na 4,129 - na PBT 43,333 40,471 7.1 46,296 (6.4) 168,517 155,030 8.7 Tax 14,006 13,777 1.7 15,394 (9.0) 56,285 53,021 6.2 RPAT 29,327 26,695 9.9 30,902 (5.1) 112,233 102,009 10.0 APAT 29,327 26,695 9.9 28,146 4.2 110,853 102,009 8.7 EPS 2.4 2.2 8.8 2.3 3.5 9.1 8.4 8.2 % Of Net Revenue 4QFY18 4QFY17 YoY (bps) 3QFY18 QoQ (bps) FY18 FY17 YoY (bps) Material Cost 37.0 42.1 na 36.0 102 38.9 39.9 (99) Employee Expenses 5.7 5.1 52 6.0 (33) 6.1 6.1 3 Other Expenses 19.0 17.9 108 18.8 21 16.8 17.7 (93) EBITDA 38.3 34.8 349 39.2 (91) 38.3 36.4 189 Tax Rate 32.3 34.0 (172) 33.3 (93) 33.4 34.2 (80) PAT 27.1 24.0 313 28.3 (116) 27.3 25.4 184 Source: Company, HDFC sec Inst Research Note: Excise duty reversal we have included in the other expenses *Cigarette revenue in 4Q/3QFY18 is on net basis
Gross sales grew by 3.6%, vs. our expectation of 5.5% Despite several headwinds, ITC registered healthy 10% APAT growth Exceptional item in FY18 is on account of tax provision written-back (Tamil Nadu entry tax) In spite of two tax hikes (FY18 Budget and GST), the company registered 9% earnings growth during FY18

ITC: RESULTS REVIEW 4QFY18
Page | 3
Quarterly Segmental (Reported) Year to March (Rs mn) 4QFY18 4QFY17 YoY (%) 3QFY18 QoQ (%) FY18 FY17 YoY (%) Segmental Revenues Cigarettes* 49,365 89,549 na 46,292 6.6 228,940 340,020 na FMCG 30,518 28,858 5.8 28,718 6.3 113,286 105,118 7.8 Hotels 4,080 3,856 5.8 4,044 0.9 14,175 13,417 5.6 Agribusiness 18,083 19,185 (5.7) 15,309 18.1 80,677 82,646 (2.4) Paperboards, Paper & Packaging 13,008 13,727 (5.2) 12,796 1.7 52,496 53,629 (2.1) Total 115,054 155,175 na 107,159 7.4 489,574 594,830 na Less: Inter-segment revenue 7,996 6,357 25.8 8,631 (7.4) 50,005 44,813 11.6 Total 107,058 148,819 na 98,527 8.7 439,569 550,017 na Segmental EBIT Cigarettes* 35,058 32,588 7.6 32,693 7.2 133,408 125,139 6.6 FMCG 912 556 64.2 470 94.1 1,641 281 483.6 Hotels 755 669 12.8 548 37.8 1,398 1,110 26.0 Agribusiness 1,240 1,349 (8.1) 2,333 (46.9) 8,486 9,058 (6.3) Paperboards, Paper & Packaging 2,424 2,402 0.9 2,683 (9.6) 10,422 9,658 7.9 Total 40,388 37,563 7.5 38,726 4.3 155,355 145,246 7.0 Less: (a) Interest Cost & Bank Charges 232 (115) (302.8) 240 (3.2) 867 229.5 277.6 (b) Other Un-allocable Expenses (3,177) (2,793) 13.7 (3,681) (13.7) (14,028) -10012.9 40.1 PBT 43,333 40,471 7.1 42,167 2.8 168,517 155,030 8.7 Capital Employed Cigarettes 33,321 55,467 (39.9) 31,446 6.0 33,321 55,467 (39.9) FMCG 57,167 57,067 0.2 55,571 2.9 57,167 57,067 0.2 Hotels 49,991 46,622 7.2 48,897 2.2 49,991 46,622 7.2 Agribusiness 25,072 21,957 14.2 19,590 28.0 25,072 21,957 14.2 Paperboards, Paper & Packaging 59,527 56,989 4.5 60,291 (1.3) 59,527 56,989 4.5 Total 225,078 238,102 (5.5) 215,795 4.3 225,078 238,102 (5.5) Unallocated corporate assets 288,923 215,308 34.2 263,765 9.5 288,923 215,308 34.2 Total capital employed 514,001 453,410 13.4 479,560 7.2 514,001 453,410 13.4 Source: Company, HDFC sec Inst Research *Cigarette revenue in 4Q/3Q/FY18 is on net basis
Cigarette business grew by ~6% during the quarter with ~3% volume contraction. We were expecting 7% cigarette growth with 2% volume contraction FMCG biz on like-to-like basis grew by 10%, led by healthy growth in branded packaged foods and personal care Hotel biz on like-to-like basis grew 5.6% driven by improvement in ARR and growth in F&B sales Agri business impacted by lower crop output and limited trading opportunities in the agri-commodities Paper business was weak due to volume contraction in cigarette industry and slow demand from FMCG industry
ITC: RESULTS REVIEW 4QFY18
Page | 4
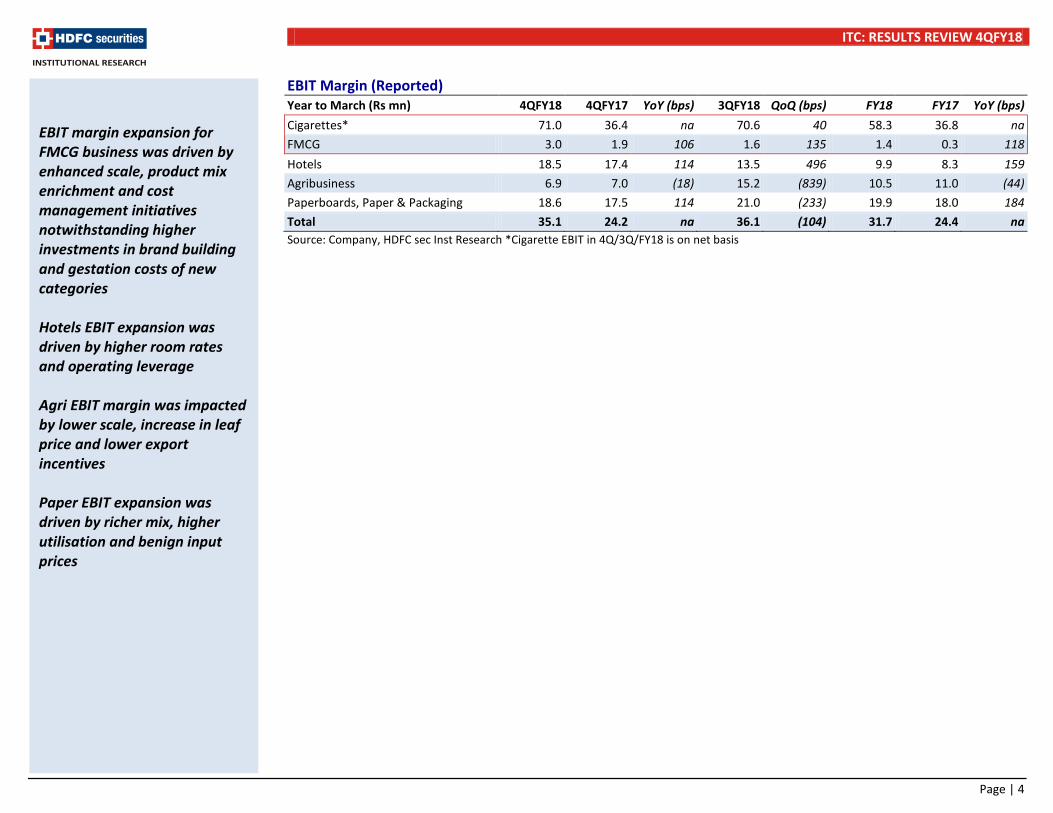
EBIT Margin (Reported) Year to March (Rs mn) 4QFY18 4QFY17 YoY (bps) 3QFY18 QoQ (bps) FY18 FY17 YoY (bps) Cigarettes* 71.0 36.4 na 70.6 40 58.3 36.8 na FMCG 3.0 1.9 106 1.6 135 1.4 0.3 118 Hotels 18.5 17.4 114 13.5 496 9.9 8.3 159 Agribusiness 6.9 7.0 (18) 15.2 (839) 10.5 11.0 (44) Paperboards, Paper & Packaging 18.6 17.5 114 21.0 (233) 19.9 18.0 184 Total 35.1 24.2 na 36.1 (104) 31.7 24.4 na Source: Company, HDFC sec Inst Research *Cigarette EBIT in 4Q/3Q/FY18 is on net basis
EBIT margin expansion for FMCG business was driven by enhanced scale, product mix enrichment and cost management initiatives notwithstanding higher investments in brand building and gestation costs of new categories Hotels EBIT expansion was driven by higher room rates and operating leverage Agri EBIT margin was impacted by lower scale, increase in leaf price and lower export incentives Paper EBIT expansion was driven by richer mix, higher utilisation and benign input prices

ITC: RESULTS REVIEW 4QFY18
Page | 5
Cigarette Value Growth Cigarette Volume Growth
Source: Company, HDFC sec Inst Research Source: Company, HDFC sec Inst Research Cigarette Price Growth Cigarette EBIT Growth
Source: Company, HDFC sec Inst Research Source: Company, HDFC sec Inst Research
Sequentially volume decline is abating as witnessed historically. We expect positive volume growth in FY19 Cigarette EBIT growth of ~8% is healthy since the business has been impacted by punitive taxes
(2) (3) (4)
(15)(13)
(17)(15)
(4)
1 3 4
(1) (1)
1
(6)(4) (3)
-20.0
-15.0
-10.0
-5.0
0.0
5.0
Mar
-14
Jun-
14Se
p-14
Dec-
14M
ar-1
5Ju
n-15
Sep-
15De
c-15
Mar
-16
Jun-
16Se
p-16
Dec-
16M
ar-1
7Ju
n-17
Sep-
17De
c-17
Mar
-18
(%)
19
14
13
1
-1
2
6
10
6 7
25
7
2
5 6
-5.0
0.0
5.0
10.0
15.0
20.0
Mar
-14
Jun-
14Se
p-14
Dec-
14M
ar-1
5Ju
n-15
Sep-
15De
c-15
Mar
-16
Jun-
16Se
p-16
Dec-
16M
ar-1
7Ju
n-17
Sep-
17De
c-17
Mar
-18
(%)
15
22
18 16 16 16 17
10 9
3 4 3 5 6
8 9 9
0.0
5.0
10.0
15.0
20.0
25.0
Mar
-14
Jun-
14Se
p-14
Dec-
14M
ar-1
5Ju
n-15
Sep-
15De
c-15
Mar
-16
Jun-
16Se
p-16
Dec-
16M
ar-1
7Ju
n-17
Sep-
17De
c-17
Mar
-18
(%)
21
12
9
6
2 2 3 3
12
8 8
2
8 9
2
8 8
0.0
5.0
10.0
15.0
20.0
25.0
Mar
-14
Jun-
14Se
p-14
Dec-
14M
ar-1
5Ju
n-15
Sep-
15De
c-15
Mar
-16
Jun-
16Se
p-16
Dec-
16M
ar-1
7Ju
n-17
Sep-
17De
c-17
Mar
-18
(%)

ITC: RESULTS REVIEW 4QFY18
Page | 6
FMCG Revenue Growth Hotel Revenue Growth
Source: Company, HDFC sec Inst Research Source: Company, HDFC sec Inst Research Agri Revenue Growth Paper Revenue Growth
Source: Company, HDFC sec Inst Research Source: Company, HDFC sec Inst Research
FMCG business growth of 10% is largely driven by volume Hotel business has shown some revival post improvement in room rates and F&B Agri and Paper business remain weak
1112 11 11
13 12
7 75
10
13
3
6
910
16
10
0.0
3.0
6.0
9.0
12.0
15.0
18.0
Mar
-14
Jun-
14Se
p-14
Dec-
14M
ar-1
5Ju
n-15
Sep-
15De
c-15
Mar
-16
Jun-
16Se
p-16
Dec-
16M
ar-1
7Ju
n-17
Sep-
17De
c-17
Mar
-18
(%)
0
65
8
16 16
11
5 5
0
3
76 6
1
10
6
-3.0
0.0
3.0
6.0
9.0
12.0
15.0
18.0
Mar
-14
Jun-
14Se
p-14
Dec-
14M
ar-1
5Ju
n-15
Sep-
15De
c-15
Mar
-16
Jun-
16Se
p-16
Dec-
16M
ar-1
7Ju
n-17
Sep-
17De
c-17
Mar
-18
(%)
51
16
(11)
(29)(29)(29)
(10)(7)
27 20
2
13 6
(1)
5
(8) (6)
-40.0
-20.0
0.0
20.0
40.0
60.0
Mar
-14
Jun-
14Se
p-14
Dec-
14M
ar-1
5Ju
n-15
Sep-
15De
c-15
Mar
-16
Jun-
16Se
p-16
Dec-
16M
ar-1
7Ju
n-17
Sep-
17De
c-17
Mar
-18
(%)
11 9
(5) (5)
4
(2) (2)
5 3
(2)
0
(0)
4 3
(2)
(4)(5)
-8.0
-4.0
0.0
4.0
8.0
12.0
Mar
-14
Jun-
14Se
p-14
Dec-
14M
ar-1
5Ju
n-15
Sep-
15De
c-15
Mar
-16
Jun-
16Se
p-16
Dec-
16M
ar-1
7Ju
n-17
Sep-
17De
c-17
Mar
-18
(%)
ITC: RESULTS REVIEW 4QFY18
Page | 7
Assumptions
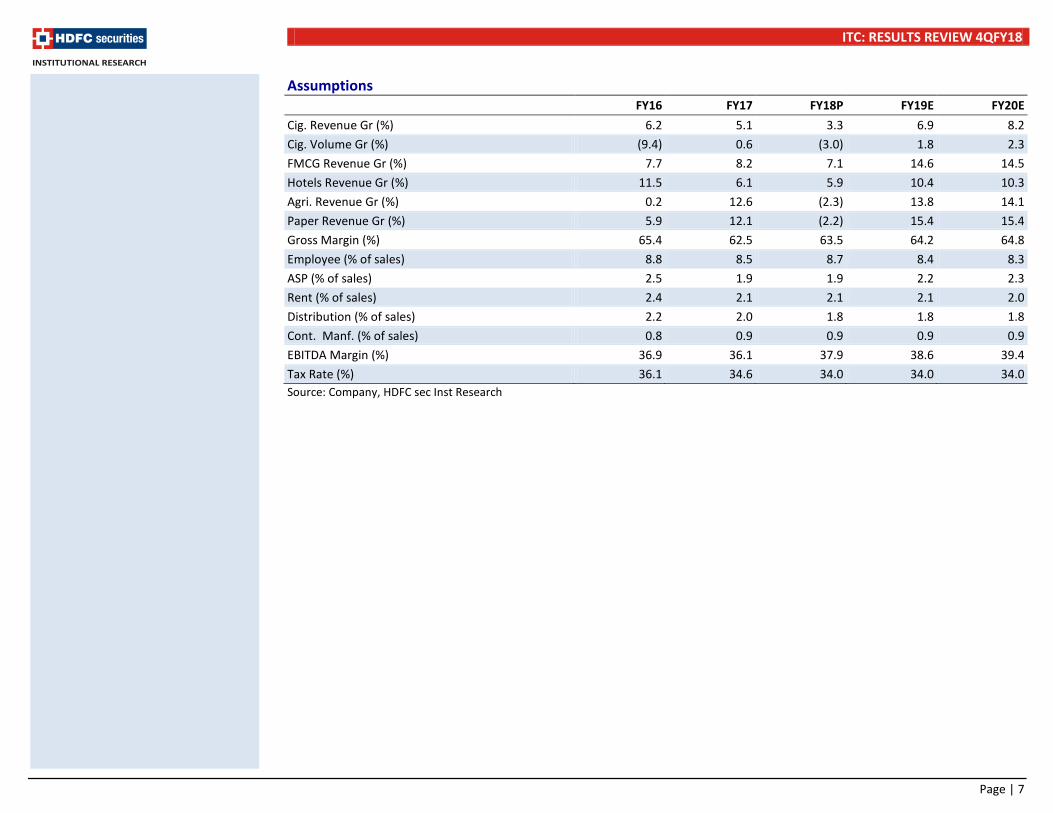
FY16 FY17 FY18P FY19E FY20E Cig. Revenue Gr (%) 6.2 5.1 3.3 6.9 8.2 Cig. Volume Gr (%) (9.4) 0.6 (3.0) 1.8 2.3 FMCG Revenue Gr (%) 7.7 8.2 7.1 14.6 14.5 Hotels Revenue Gr (%) 11.5 6.1 5.9 10.4 10.3 Agri. Revenue Gr (%) 0.2 12.6 (2.3) 13.8 14.1 Paper Revenue Gr (%) 5.9 12.1 (2.2) 15.4 15.4 Gross Margin (%) 65.4 62.5 63.5 64.2 64.8 Employee (% of sales) 8.8 8.5 8.7 8.4 8.3 ASP (% of sales) 2.5 1.9 1.9 2.2 2.3 Rent (% of sales) 2.4 2.1 2.1 2.1 2.0 Distribution (% of sales) 2.2 2.0 1.8 1.8 1.8 Cont. Manf. (% of sales) 0.8 0.9 0.9 0.9 0.9 EBITDA Margin (%) 36.9 36.1 37.9 38.6 39.4 Tax Rate (%) 36.1 34.6 34.0 34.0 34.0 Source: Company, HDFC sec Inst Research

ITC: RESULTS REVIEW 4QFY18
Page | 8
India’s Tobacco Consumption Tobacco consumption share Tax revenue share
Source: Company, HDFC sec Inst Research Source: Company, HDFC sec Inst Research Per capita consumption of Tobacco in India – Per annum
Affordability (% of per capita GDP required to purchase 100 packs of 20 cigarettes of most sold brand
Source: Company, HDFC sec Inst Research Source: Company, HDFC sec Inst Research
Legal cigarettes,
11%
Other tobacco
products, 89%
Legal cigarettes,
87%
Other tobacco
products, 13%
0
500
1,000
1,500
2,000
2,500
3,000
Russ
ian
Fede
ratio
n
Japa
n
Chin
a
USA
Paki
stan
Nep
al
Bang
lade
sh
Indi
a
(No)
0
2
4
6
8
10
12
USA
Russ
ia
Ger
man
y
Cana
da
Chin
a
Aust
ralia U
K
Mal
aysi
a
Paki
stan
Indi
a

ITC: RESULTS REVIEW 4QFY18
Page | 9
Income Statement (Rs mn) FY16 FY17 FY18P FY19E FY20E Net Revenues 391,921 428,036 434,489 474,097 521,662 Growth (%) 2.0 9.2 1.5 9.1 10.0 Material Expenses 135,685 160,492 158,555 169,885 183,551 Employee Expense 34,410 36,317 37,609 39,882 43,370 ASP Expense 9,887 8,107 8,255 10,430 11,998 Distribution Expense 8,528 8,560 7,821 8,534 9,390 Other Expenses 58,903 60,201 57,420 62,448 67,591 EBITDA 144,509 154,359 164,829 182,918 205,763 EBITDA Growth (%) 4.5 6.8 6.8 11.0 12.5 EBITDA Margin 36.9 36.1 37.9 38.6 39.4 Depreciation 10,774 11,528 12,363 12,975 14,178 EBIT 133,735 142,831 152,466 169,942 191,585 Other Income (Including EO) 15,308 17,615 18,319 20,152 21,526 Interest 536 243 899 805 855 PBT 148,507 160,204 174,015 189,289 212,256 Total Tax 53,582 55,491 59,164 64,358 72,167 RPAT 95,009 104,772 114,926 125,018 140,189 Exceptional Gain/(loss) - - 2,725 - - Adjusted PAT 95,009 104,772 112,201 125,018 140,189 APAT Growth (%) (1.7) 10.3 7.1 11.4 12.1 Adjusted EPS (Rs) 7.9 8.6 9.2 10.3 11.5 EPS Growth (%) (2.1) 9.6 7.1 11.4 12.1
Source: Company, HDFC sec Inst Research
Balance Sheet (Rs mn) FY16 FY17 FY18P FY19E FY20E SOURCES OF FUNDS Share Capital - Equity 8,047 12,147 12,147 12,147 12,147 Reserves 418,748 451,982 494,737 544,460 600,753 Total Shareholders' Funds 426,795 464,129 506,884 556,608 612,901 Minority Interest 2,609 2,947 3,023 2,936 2,836 Long Term Debt 267 184 115 115 115 Short Term Debt 440 191 174 191 210 Total Debt 706 375 289 306 325 Net Deferred Taxes 18,395 18,333 18,566 18,817 19,088 Other non current liabilities 2,756 2,174 2,684 2,684 2,684 TOTAL SOURCES OF FUNDS 451,261 487,959 531,445 581,350 637,833 APPLICATION OF FUNDS Net Block 149,060 157,778 163,013 186,231 196,153 CWIP 35,759 37,849 56,003 57,003 58,003 Goodwill 2,314 2,314 2,314 2,314 2,314 LT Loans & Advances 29,457 32,179 36,039 40,362 45,204 Total Non-current Assets 216,590 230,120 257,369 285,910 301,674 Inventories 90,621 86,711 81,056 86,306 93,948 Debtors 19,178 24,743 26,823 29,268 32,204 Other Expenses 11,109 17,471 26,523 27,454 28,418 Cash & Equivalents 179,800 199,938 232,003 255,102 295,816 Total Current Assets 300,707 328,863 366,405 398,131 450,387 Creditors 23,393 26,593 34,962 38,458 42,304 Other Current Liabilities & Provns 42,643 44,430 57,366 64,233 71,924 Total Current Liabilities 66,036 71,023 92,328 102,691 114,228 Net Current Assets 234,672 257,839 274,077 295,440 336,159 TOTAL APPLICATION OF FUNDS 451,261 487,959 531,445 581,350 637,833
Source: Company, HDFC sec Inst Research

ITC: RESULTS REVIEW 4QFY18
Page | 10
Cash Flow Statement (Rs mn) FY16 FY17 FY18P FY19E FY20E Reported PBT 154,332 160,204 174,015 189,289 212,256 Non-operating & EO Items (5,980) - - - - Interest Expenses (8,227) 243 899 805 855 Depreciation 11,134 11,528 12,363 12,975 14,178 Working Capital Change (1,666) 2,350 11,968 (2,587) (4,847) Tax Paid (50,812) (55,462) (58,932) (64,107) (71,896) OPERATING CASH FLOW ( a ) 98,782 118,863 140,312 136,376 150,545 Capex (23,835) (31,798) (35,752) (37,194) (25,100) Free Cash Flow (FCF) 74,947 87,065 104,561 99,182 125,445 Investments (34,379) (52,788) (50,265) (15,000) (15,000) Non-operating Income 23,875 2,008 (0) 0 0 INVESTING CASH FLOW ( b ) (34,340) (82,578) (86,016) (52,194) (40,100) Debt Issuance/(Repaid) (223) - - - - Interest Expenses (324) (243) (899) (805) (855) FCFE 74,400 86,822 103,662 98,377 124,590 Share Capital Issuance 5,317 2,008 (0) 0 0 Dividend (61,258) (57,700) (57,700) (62,559) (69,705) Others (1,300) (11,746) (11,746) (12,736) (14,190) FINANCING CASH FLOW ( c ) (57,788) (67,681) (70,346) (76,100) (84,750) NET CASH FLOW (a+b+c) 6,655 (31,396) (16,049) 8,082 25,695 EO Items, Others (10,267) - - - - Closing Cash & Equivalents 62,324 29,674 11,474 19,574 45,287
Source: Company, HDFC sec Inst Research
Key Ratios FY16 FY17 FY18P FY19E FY20E PROFITABILITY (%) GPM 65.4 62.5 63.5 64.2 64.8 EBITDA Margin 36.9 36.1 37.9 38.6 39.4 EBIT Margin 34.1 33.4 35.1 35.8 36.7 APAT Margin 24.2 24.5 25.8 26.4 26.9 RoE 25.5 23.5 23.1 23.5 24.0 RoIC (or Core RoCE) 40.3 36.1 36.9 38.5 40.5 RoCE 25.4 23.4 23.1 23.5 23.9 EFFICIENCY Tax Rate (%) 36.1 34.6 34.0 34.0 34.0 Fixed Asset Turnover (x) 0.6 0.6 0.6 0.7 0.7 Inventory (days) 84.4 73.9 68.1 66.4 65.7 Debtors (days) 17.9 21.1 22.5 22.5 22.5 Other Current Assets (days) 10.3 14.9 22.3 21.1 19.9 Payables (days) 21.8 22.7 29.4 29.6 29.6 Other Current Liab & Provns (days) 39.7 37.9 48.2 49.5 50.3 Cash Conversion Cycle (days) 51.1 49.4 35.3 31.1 28.2 Net D/E (x) (0.4) (0.4) (0.5) (0.5) (0.5) Interest Coverage (x) 249.5 587.8 169.6 211.0 224.2 PER SHARE DATA (Rs) EPS 7.9 8.6 9.2 10.3 11.5 CEPS 8.8 9.6 10.3 11.4 12.7 Dividend 5.7 4.7 5.2 5.7 6.4 Book Value 35.4 38.2 41.7 45.8 50.5 VALUATION P/E (x) 36.2 33.0 30.9 27.7 24.7 P/BV (x) 8.1 7.5 6.8 6.2 5.6 EV/EBITDA (x) 22.6 21.1 19.6 17.5 15.4 EV/Revenues (x) 8.3 7.6 7.4 6.8 6.1 OCF/EV (%) 3.0 3.6 4.3 4.3 4.8 FCF/EV (%) 2.3 2.7 3.2 3.1 4.0 FCFE/Mkt Cap (%) 2.2 2.5 3.0 2.8 3.6 Dividend Yield (%) 2.0 1.7 1.8 2.0 2.3
Source: Company, HDFC sec Inst Research

ITC: RESULTS REVIEW 4QFY18
Page | 11
RECOMMENDATION HISTORY
Rating Definitions BUY : Where the stock is expected to deliver more than 10% returns over the next 12 month period NEUTRAL : Where the stock is expected to deliver (-)10% to 10% returns over the next 12 month period SELL : Where the stock is expected to deliver less than (-)10% returns over the next 12 month period
Date CMP Reco Target 28-May-17 309 BUY 351 28-Jul-17 289 BUY 353 10-Oct-17 268 BUY 354 30-Oct-17 269 BUY 358 13-Nov-17 266 BUY 354 27-Dec-17 264 BUY 358 9-Jan-18 266 BUY 358
12-Jan-18 269 BUY 358 20-Jan-18 275 BUY 358 28-Feb-18 266 BUY 358 11-Apr-18 267 BUY 363 17-May-18 286 BUY 358
200
220
240
260
280
300
320
340
360
380
400
May
-17
Jun-
17
Jul-1
7
Aug-
17
Sep-
17
Oct
-17
Nov-
17
Dec-
17
Jan-
18
Feb-
18
Mar
-18
Apr-
18
May
-18
ITC TP
ITC: RESULTS REVIEW 4QFY18
Page | 12
Disclosure: We, Naveen Trivedi, MBA & Siddhant Chhabria, PGDBM, authors and the names subscribed to this report, hereby certify that all of the views expressed in this research report accurately reflect our views about the subject issuer(s) or securities. HSL has no material adverse disciplinary history as on the date of publication of this report. We also certify that no part of our compensation was, is, or will be directly or indirectly related to the specific recommendation(s) or view(s) in this report. Research Analyst or his/her relative or HDFC Securities Ltd. does not have any financial interest in the subject company. Also Research Analyst or his relative or HDFC Securities Ltd. or its Associate may have beneficial ownership of 1% or more in the subject company at the end of the month immediately preceding the date of publication of the Research Report. Further Research Analyst or his relative or HDFC Securities Ltd. or its associate does not have any material conflict of interest. Any holding in stock –No HDFC Securities Limited (HSL) is a SEBI Registered Research Analyst having registration no. INH000002475. Disclaimer: This report has been prepared by HDFC Securities Ltd and is meant for sole use by the recipient and not for circulation. The information and opinions contained herein have been compiled or arrived at, based upon information obtained in good faith from sources believed to be reliable. Such information has not been independently verified and no guaranty, representation of warranty, express or implied, is made as to its accuracy, completeness or correctness. All such information and opinions are subject to change without notice. This document is for information purposes only. Descriptions of any company or companies or their securities mentioned herein are not intended to be complete and this document is not, and should not be construed as an offer or solicitation of an offer, to buy or sell any securities or other financial instruments. This report is not directed to, or intended for display, downloading, printing, reproducing or for distribution to or use by, any person or entity who is a citizen or resident or located in any locality, state, country or other jurisdiction where such distribution, publication, reproduction, availability or use would be contrary to law or regulation or what would subject HSL or its affiliates to any registration or licensing requirement within such jurisdiction. If this report is inadvertently send or has reached any individual in such country, especially, USA, the same may be ignored and brought to the attention of the sender. This document may not be reproduced, distributed or published for any purposes without prior written approval of HSL. Foreign currencies denominated securities, wherever mentioned, are subject to exchange rate fluctuations, which could have an adverse effect on their value or price, or the income derived from them. In addition, investors in securities such as ADRs, the values of which are influenced by foreign currencies effectively assume currency risk. It should not be considered to be taken as an offer to sell or a solicitation to buy any security. HSL may from time to time solicit from, or perform broking, or other services for, any company mentioned in this mail and/or its attachments. HSL and its affiliated company(ies), their directors and employees may; (a) from time to time, have a long or short position in, and buy or sell the securities of the company(ies) mentioned herein or (b) be engaged in any other transaction involving such securities and earn brokerage or other compensation or act as a market maker in the financial instruments of the company(ies) discussed herein or act as an advisor or lender/borrower to such company(ies) or may have any other potential conflict of interests with respect to any recommendation and other related information and opinions. HSL, its directors, analysts or employees do not take any responsibility, financial or otherwise, of the losses or the damages sustained due to the investments made or any action taken on basis of this report, including but not restricted to, fluctuation in the prices of shares and bonds, changes in the currency rates, diminution in the NAVs, reduction in the dividend or income, etc. HSL and other group companies, its directors, associates, employees may have various positions in any of the stocks, securities and financial instruments dealt in the report, or may make sell or purchase or other deals in these securities from time to time or may deal in other securities of the companies / organizations described in this report. HSL or its associates might have managed or co-managed public offering of securities for the subject company or might have been mandated by the subject company for any other assignment in the past twelve months. HSL or its associates might have received any compensation from the companies mentioned in the report during the period preceding twelve months from t date of this report for services in respect of managing or co-managing public offerings, corporate finance, investment banking or merchant banking, brokerage services or other advisory service in a merger or specific transaction in the normal course of business. HSL or its analysts did not receive any compensation or other benefits from the companies mentioned in the report or third party in connection with preparation of the research report. Accordingly, neither HSL nor Research Analysts have any material conflict of interest at the time of publication of this report. Compensation of our Research Analysts is not based on any specific merchant banking, investment banking or brokerage service transactions. HSL may have issued other reports that are inconsistent with and reach different conclusion from the information presented in this report. Research entity has not been engaged in market making activity for the subject company. Research analyst has not served as an officer, director or employee of the subject company. We have not received any compensation/benefits from the subject company or third party in connection with the Research Report. HDFC securities Limited, I Think Techno Campus, Building - B, "Alpha", Office Floor 8, Near Kanjurmarg Station, Opp. Crompton Greaves, Kanjurmarg (East), Mumbai 400 042 Phone: (022) 3075 3400 Fax: (022) 2496 5066 Compliance Officer: Binkle R. Oza Email: [email protected] Phone: (022) 3045 3600 HDFC Securities Limited, SEBI Reg. No.: NSE-INB/F/E 231109431, BSE-INB/F 011109437, AMFI Reg. No. ARN: 13549, PFRDA Reg. No. POP: 04102015, IRDA Corporate Agent License No.: HDF 2806925/HDF C000222657, SEBI Research Analyst Reg. No.: INH000002475, CIN - U67120MH2000PLC152193 Mutual Funds Investments are subject to market risk. Please read the offer and scheme related documents carefully before investing.

ITC: RESULTS REVIEW 4QFY18
Page | 13
HDFC securities Institutional Equities Unit No. 1602, 16th Floor, Tower A, Peninsula Business Park, Senapati Bapat Marg, Lower Parel,Mumbai - 400 013 Board : +91-22-6171 7330www.hdfcsec.com