business cycles economics 210c
TRANSCRIPT


GROSS DOMESTIC PRODUCT (GDP)
050
0010
000
1500
020
000
Billio
ns o
f Cha
ined
200
9 D
olla
rs
1950 1960 1970 1980 1990 2000 2010
Real GDP
Growth Theory: RGDP keeps going up over time.Business Cycle analysis: cyclical fluctuations in RGDP about thelong-run trend.
1 / 28

GDP GROWTH RATE
-50
510
15Pe
rcen
t
1950 1960 1970 1980 1990 2000 2010
Annual Change in Real GDP
2 / 28

POTENTIAL VS. ACTUAL OUTPUT
1200
013
000
1400
015
000
1600
017
000
Billio
ns o
f Cha
ined
200
9 D
olla
rs
2000 2002 2004 2006 2008 2010 2012 2014 2016
Real GDP Potential Real GDP
Real GDP and Potential Real GDP
3 / 28

WHY DO WE CARE ABOUT RECESSIONS?
Recessions appear to be costly. Just read the newspapers when we aregoing through one.
Micro studies suggest very large income losses when laid off in arecession (e.g., Oreopoulus, von Wachter, Heisz, 2012; Guvenen,Ozkan, Song, 2014).
Belief that recessions could be prevented or, at least, mitigated.
Theoretically interesting: why are we operating inside the PPF? Ordid the PPF shift inward? If so, why?
4 / 28

METHODOLOGICAL APPROACH
Measurement
Model
Model evaluation
Policy implications
5 / 28

SOME FACTS ABOUT US RECESSIONS
How the National Bureau of Economic Research (NBER) identifies U.S.recessions:
We identify a month when the economy reached a peak ofactivity and a later month when the economy reached a trough.The time in between is a recession, a period when the economyis contracting. The following period is an expansion. Economicactivity is below normal or diminished for some part of therecession and for some part of the following expansion as well.
Simple Stylized Facts:
1 Recessions are varied in length and depth
2 Recessions are unpredictable
3 Recessions are becoming less frequent
6 / 28

SOME FACTS ABOUT US RECESSIONS
Recessions across time:
1854-1919:16 cycles: 4.1 years per cycleAverage length of recession: 22 months
1919-1945:6 cycles: 4.3 years per cycleAverage length of recession: 18 months
1945-present:11 cycles: 6.1 years per cycleAverage length of recession: 11 months
7 / 28

RECESSIONS IN THE USA SINCE WWII
Year and quarter ofpeak in real GDP
Number ofquarters until
trough in real GDP
Change in realGDP, peak to
trough
1948:4 2 -1.7%1953:2 3 -2.6%1957:3 2 -3.7%1960:1 3 -1.6%1970:3 1 -1.1%1973:4 5 -3.2%1980:1 2 -2.2%1981:3 2 -2.9%1990:2 3 -1.4%2000:4 1 -0.3%2008:2 4 -3.8%
8 / 28

WHAT HAPPENS DURING A RECESSION
Key things to look for:
1 Co-movement of variables (pro-cyclical vs counter-cylical)
2 Lead-lag patterns
Key variables we care about:
1 Real GDP
2 Consumption and Investment
3 Prices
4 Unemployment
5 Nominal Interest Rates
6 Real Wages
9 / 28

INVESTMENT IS MUCH MORE VOLATILE THAN
CONSUMPTION-2
00
2040
60Pe
rcen
t
1950 1960 1970 1980 1990 2000 2010
Consumption Investment
Annual Change in Real Consumption and Investment
10 / 28
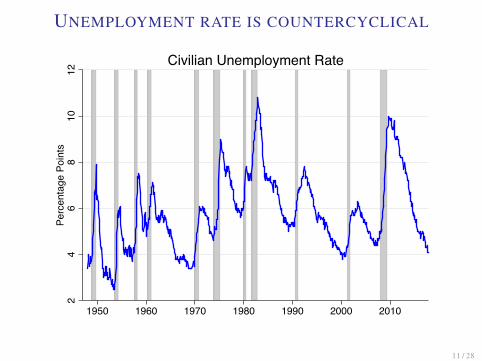
UNEMPLOYMENT RATE IS COUNTERCYCLICAL
24
68
1012
Perc
enta
ge P
oint
s
1950 1960 1970 1980 1990 2000 2010
Civilian Unemployment Rate
11 / 28

INFLATIONS RISES BEFORE AND FALLS DURING/AFTER
RECESSIONS-5
05
1015
Percent
1950 1960 1970 1980 1990 2000 2010
Inflation
12 / 28

SECTORAL COMOVEMENT
-20
-10
010
20Pe
rcen
t
1950 1960 1970 1980 1990 2000 2010
Construction ServicesNondurable Durable
Sectoral Comovement
13 / 28

PRODUCTIVITY
-20
24
68
Perc
ent
1950 1960 1970 1980 1990 2000 2010
Annual Change in Productivity
14 / 28

WHAT HAPPENS DURING A RECESSION?Let’s average across all post-WWII recessions to look for “typical”pattern
-4-2
02
%
-10 0 10 20 30 40Months Relative to Recession Start
Annual Change in Real GDP
15 / 28
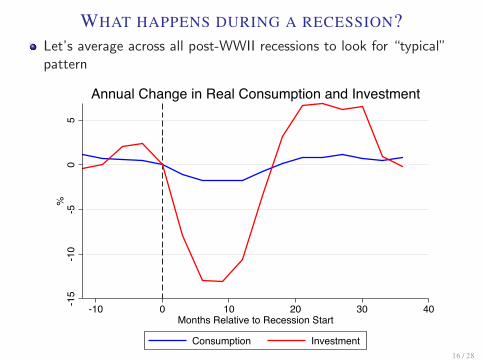
WHAT HAPPENS DURING A RECESSION?Let’s average across all post-WWII recessions to look for “typical”pattern
-15
-10
-50
5%
-10 0 10 20 30 40Months Relative to Recession Start
Consumption Investment
Annual Change in Real Consumption and Investment
16 / 28

WHAT HAPPENS DURING A RECESSION?Let’s average across all post-WWII recessions to look for “typical”pattern0
.51
1.5
22.
5%
Poi
nts
Rel
ativ
e to
Rec
essi
on S
tart
-10 0 10 20 30 40Months Relative to Recession Start
Civilian Unemployment Rate
17 / 28

WHAT HAPPENS DURING A RECESSION?Let’s average across all post-WWII recessions to look for “typical”pattern
-2.5
-2-1
.5-1
-.50
% R
elat
ive
to R
eces
sion
Sta
rt
-10 0 10 20 30 40Months Relative to Recession Start
Inflation
18 / 28

WHAT HAPPENS DURING A RECESSION?Let’s average across all post-WWII recessions to look for “typical”pattern
-4-3
-2-1
0%
Poi
nts
Rel
ativ
e to
Rec
essi
on S
tart
-10 0 10 20 30 40Months Relative to Recession Start
Nominal Interest Rate
19 / 28

WHAT HAPPENS DURING A RECESSION?Let’s average across all post-WWII recessions to look for “typical”pattern
-.50
.51
1.5
%
-10 0 10 20 30 40Months Relative to Recession Start
Annual Change in Real Compensation per Hour
20 / 28

WHAT HAPPENS DURING A RECESSION?
Source: Guvenen, Ozkan, Song, 2014.
21 / 28

WHAT HAPPENS DURING A RECESSION?
Source: Guvenen, Ozkan, Song, 2014.
22 / 28

TYPICAL PATTERN
1 Real GDP declines.
2 Consumption growth slows and investment declines a lot.
3 Inflation is rising before recessions and falls gradually duringrecessions.
4 Unemployment goes up about 2 percentage points, and declinesslowly.
5 Nominal interest rates rise before the recession, but fall rapidly duringa recession.
6 Real wages decline slightly.
7 Higher incidence of large negative income shocks.
23 / 28
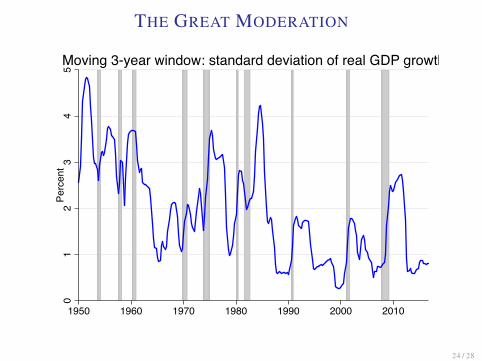
THE GREAT MODERATION
01
23
45
Perc
ent
1950 1960 1970 1980 1990 2000 2010
Moving 3-year window: standard deviation of real GDP growth
24 / 28

POSSIBLE EXPLANATIONS
1 Luck
2 Better policies (more aggressive response to inflation, reduce the levelof inflation)
3 Better inventory management
4 Decline in unionization
5 Redistribution of jobs
6 Banking deregulation
25 / 28

SUMMARY OF BUSINESS CYCLE FACTS
1 Business cycles do not exhibit any simple regular or cyclical pattern.
2 Sectoral outputs and most macroeconomic variables co-move over thebusiness cycle.
3 Fluctuations are distributed very unevenly across components ofoutput:
I consumption is 50% less volatile than output
I labor and output are approximately equally volatile - investment is2.5-3 times more volatile than output
4 Rises and falls in output are frequently observed. However,contractions are faster than expansions.
5 Aggregate volatility seems to have been falling/low.
6 Idiosyncratic volatility does not vary with business cycle, but skewnessincreases in recessions.
26 / 28

“BIG QUESTIONS” IN BUSINESS CYCLES
1 What are the shocks causing business cycles?
2 What are the propagation/amplification mechanisms behind shocks?
3 What is the relationship between business cycles and long-run growth?
4 What is the cost of business cycles?
5 What policy can reduce the cost?
27 / 28

OUR GOAL:
1 Build a model of the economy that can simultaneously explain thebehavior of RGDP, inflation, UE,...
2 Use this model to shed light on what causes recessions and thebusiness cycle.
3 Once we’ve identified the types of shocks that can cause businesscycle fluctuations, we can use the model to figure out howpolicy-makers can/should respond to economic fluctuations.
28 / 28