business administration and management sectoral analysis
TRANSCRIPT
1271, XXI, 2018
Business Administration and Management
DOI: 10.15240/tul/001/2018-1-009
IntroductionConducting business involves a constant fl ow of money and capital, whose renewal and expansion on the one hand and distribution and investment on the other need to be managed. Business entities are required to be able to sustainably appreciate capital invested, therefore, it is necessary to conduct analyses of the rate of return on capital invested as part of business management.
Factors such as geographical proximity, cultural similarity, membership in the EU and a qualifi ed workforce have given rise to strong economic ties between Czech and German companies. Therefore, the general goal of this study is to identify the driving factors behind differences in the profi tability of Czech and German companies on the basis of a comparative analysis.
Therefore, the general goal of this study is to identify the driving factors behind differences in profi tability of Czech and German fi rms on the basis of the comparative analysis.
1. Literature ReviewThis comparative analysis can be understood as a form of benchmarking between these two countries (Jarrar & Zairi, 2001; Vorhies & Morgan, 2005; Kent & Routledge, 2017). In this way, competitive (dis-) advantages can be addressed, and thus possible starting points for targeted improvements can be provided. The values of these drivers of profi tability result from an empirical database, and the impacts of the observed differences are modelled using the technique of variance analysis, which is a common tool in the fi eld of management accounting (Christodoulou, Clubb, & Mcleay,
2016; Dluhošová, Ptáčková, & Zmeškal, 2015; Ptáčková, 2015).
The study concentrates primarily on two very popular ratios used for economic decisions, i.e. the return on assets (RoA) and the return on equity (RoE) (e.g., Kijewska, 2016; Easton & Monahan, 2016). Effects from fi nancing or taxation are usually excluded from the return on assets (RoA), as it solely emphasises the operations of a venture. It is defi ned here as follows:
(1)
According to Sukmawati and Garsela (2016), the return on equity (RoE) shows the net income of stockholders in relation to the amount of equity provided in terms of book values. This article uses the following defi nition of RoE:
(2)
Several infl uencing factors, which can be observed empirically, are used as a basis to model both measures. To illustrate such effects on RoA and RoE, the fundamental interactions of the fi nancial leverage effect (e.g., Anagnostopoulou & Tsekrekos, 2017; Ku & Yen, 2016; Feng, 2016) and the so-called Du Pont identity are used (Erbuga, 2016; Hron, Macák, & Andres, 2015; Mihola & Kotešovcová, 2015). The following fundamental relations are thus implied:
SECTORAL ANALYSIS OF THE DIFFERENCES IN PROFITABILITY OF CZECH AND GERMAN BUSINESS VENTURES – AN EMPIRICAL BENCHMARK STUDYDirk Beyer, Jana Hinke
EM_1_2018.indd 127EM_1_2018.indd 127 21.3.2018 12:01:4721.3.2018 12:01:47
128 2018, XXI, 1
Ekonomika a management
(3)
where:E = Equity (book value),CTax = Corporate tax expenses,TA = Total assets,RoA = Return on assets = EBIT / Total assets,iDebt = Average interest rate on debt = Interest
expenses / Total debt,l = Debt ratio = Total debt / Total assets
(book values),τCTax = Corporate tax rate,τTS = Tax-shield rate of debt fi nancing.
The RoA can be written as follows on the basis of the so-called Du Pont identity:
(4)
where:AT = Asset turnover = Net turnover / Total
assets,PM = Profi t margin = EBIT / Net turnover.
As reported by Penman (2013), in order to analyse the structural aspects of profi t, a further breakdown of the profi t margin PM can be achieved by separating the operating gross profi t margin, several operating expense ratios and the remaining components of income.
(5)
where:GPM = Gross profi t margin,ESR = External supply ratio (i.e., materials,
consumables, externally supplied goods and services or other operational charges except staff costs and depreciation),
SCR = Staff cost ratio,DAR = Depreciation and amortisation ratio,OIR = Other income ratio, especially non-
operating and extraordinary items.
Asset turnover can likewise be analysed in more detail on the basis of several ratios which are very common in fi nancial statement analyses (Jovanovic, Todorovic, & Grbic, 2017; Koloszko-Chomentowska & Sieczko, 2016). They are particularly the fi xed asset turnover (FAT), days inventory held (DIH), days sales outstanding (DSO) and the turnover of other assets (OAT). The ratios are defi ned as follows:
(6)
(7)
(8)
(9)
It implies that the total asset turnover (AT) in formula (4) can be replaced by a combination of these ratios as follows:
(10)
Therefore, profi tability is linked to several driving factors which are represented by very common fi nancial ratios. Their relations are used here to compare the average profi tability of Czech and German ventures, distinguishing several sectors of business.
So far, no research study has dealt with a comparison of the profi tability of Czech and German companies in different industries. In most studies, comparative analyses relate to changes in the technology or location of specifi c (industrial or agricultural) production (e.g., Demircan et al., 2016; He & Liu, 2014). Some authors (e.g., Piedra-Munoz, Galdeano-Gomez & Perez-Mesa, 2016; Krechovská, 2015) also introduce the context of various sustainability aspects (socio-economic characteristics, environmentally-respectful practices, and innovation) to measuring profi tability.
The ROA and ROE indicators, which evaluate the performance of companies, have been used in numerous studies. Some of them deal with the performance of companies in relation to the market value of listed companies
EM_1_2018.indd 128EM_1_2018.indd 128 21.3.2018 12:01:4821.3.2018 12:01:48

1291, XXI, 2018
Business Administration and Management
– e.g., in the study conducted by da Rocha Oliveira et al. (2017), which analyzed the following performance indicators: ROA, ROE, Net Margin, EBITDA and EBITDA margin. Other studies focus on evaluating companies in a specifi c segment of the national economy – for example, the study by Dink, Fung and Jia (2017), which deals with a comparison of the profi tability of banks in China and the USA. Within this comparison, they focus more on the infl uence of individual banking products on profi tability. Another study, by Amin and Aslam (2017), conducts research in companies of the pharmaceutical industry; Leite, Guse and Hein (2017) focuses on companies in the Brazilian agribusiness; a study by Vanek et al. (2017) analyzes the ratio indicators of four mining companies extracting hard coal, and a study by Dinca et al. (2017) deals with the construction industry. The last of these studies, conducted in 958 construction companies in eight EU
countries in 2004-2013, states that companies from countries in the western part of the EU have a higher ROE compared to companies in countries in the eastern part of the EU, but offer a higher ROA.
A comparison between the ratio indicators of companies in multiple industries was carried out by Batchimeg (2017), who in a sample of 100 Mongolian joint stock companies listed on the Mongolian Stock Exchange ascertained what ratios can affect the fi nancial performance of the given companies with the aim of boosting their competitiveness. Through panel regression covering the period 2012-2015, the author found that ROA has more determinants than ROE and ROS, such as earnings per share; return on costs has positive impacts, while the short-term debts to total assets ratio and the cost to revenue ratio have negative impacts.
Fig. 1: Analysis of variances in RoA
Source: own processing
EM_1_2018.indd 129EM_1_2018.indd 129 21.3.2018 12:01:4821.3.2018 12:01:48
130 2018, XXI, 1
Ekonomika a management
2. Methodology and DataWith respect to the fundamentals mentioned above, the analytic goal now is to examine empirically observable values of these drivers of profi tability for the Czech Republic and Germany. In order to illustrate the impacts of the national differences between these parameters, a cumulative variance analysis is used. As already stated above, this method is a common technique in the fi eld of managerial accounting, where the variances between the planned and actual cost or revenues are usually quantifi ed and allocated to certain infl uencing factors (e.g. Bhimani et al., 2012; Peles, 1986; Guelfi , 2013). By analogy, the observed differences in these driving factors are analysed to determine their contribution to the variances in profi tability (i.e. RoA and RoE) between the two countries. Nevertheless, as some of these infl uencing parameters interact in a multiplicative way, to separate their effects in a strict sense is diffi cult.
To fi x a particular sequence for the analysed infl uences is a pragmatic way to solve this problem. Incorporating the differences in the driving factors in a gradual manner according to the order would allocate the compounded effects to these involved infl uencing factors, which are considered fi rst. The principle for the RoA based on asset turnover (AT) and profi t margin (PM) is shown in Fig. 1.
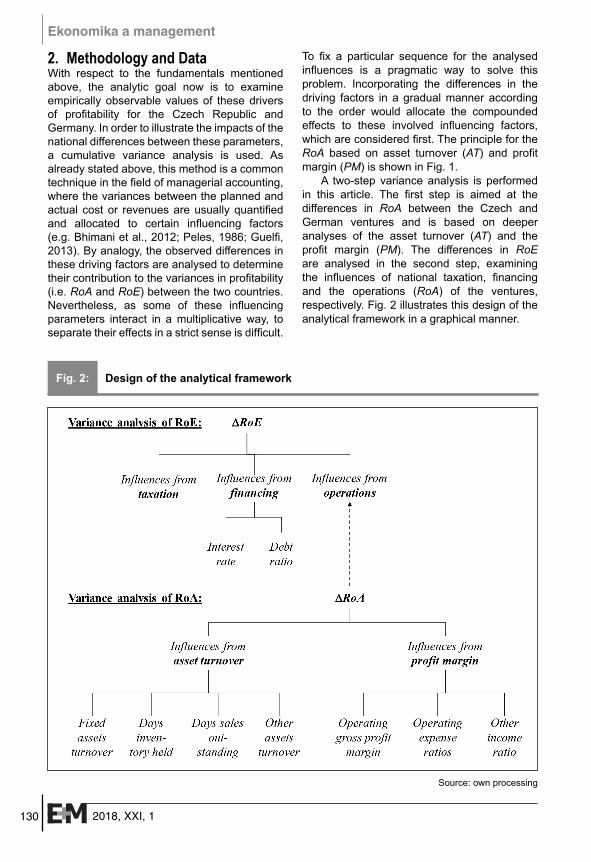
A two-step variance analysis is performed in this article. The fi rst step is aimed at the differences in RoA between the Czech and German ventures and is based on deeper analyses of the asset turnover (AT) and the profi t margin (PM). The differences in RoE are analysed in the second step, examining the infl uences of national taxation, fi nancing and the operations (RoA) of the ventures, respectively. Fig. 2 illustrates this design of the analytical framework in a graphical manner.
Fig. 2: Design of the analytical framework
Source: own processing
EM_1_2018.indd 130EM_1_2018.indd 130 21.3.2018 12:01:4821.3.2018 12:01:48

1311, XXI, 2018
Business Administration and Management
The following hypothesis can be verifi ed on the basis of this double-level analysis of variances: The driving factors of RoE and RoA differ signifi cantly between the two countries among several business sectors and would cause substantial differences in profi tability when taken separately. The overlapping and compensating nature of the individual effects blanket the total impact. Certain infl uencing factors can be determined and quantifi ed in their separate contributions to the differences in the typical units of profi t rates (ROA and ROE). This uncovers the sources of competitive advantages and provides useful starting points for continuous improvements.
The BACH database (Bank for the Accounts of Companies Harmonised) of the EU is the source of the driving parameters used in this study. It includes aggregated and harmonised information on the corporate annual accounts from several European countries (European Central Bank, 2015). The BACH database was created under the aegis of the European Committee of Central
Balance-Sheet Data Offi ces (ECCBSO), consisting of experts belonging to or associated with the National Central Banks (NCB) of the European Community or from the National Statistical Institutions (BACH, 2016; European Central Bank, 2015).This database is one of the most reliable sources of accounting data for comparisons between European countries (European Banking Authority, 2012).
The infl uencing factors analysed were derived from this database as calculated average values, looking at a total period from 2002 to 2014. Distinguishing several business sectors, data from a great number of fi rms are included as is shown in Tab. 1. It presents the annual average numbers of the included fi rms from 2002 to 2014. Therein, several sectors are classifi ed according to the NACE [Nomenclaturestatistique des activitéséconomiquesdans la Communauté-européenne (Eurostat, 2008)].
The driving factors of profi tability are observed on the basis of this broad sample. Using their long-term average values, the
NACE sectors CZ DEA – Agriculture, forestry and fi shing 1,051 478
B – Mining and quarrying 143 150
C – Manufacturing 7,515 12,519
D – Electricity, gas, steam and air conditioning supply 456 1,078
E – Water supply, sewerage and waste management 468 787
F – Construction 2,763 5,035
G – Wholesale and retail 4,603 13,030
H – Transportation and storage 1,028 2,668
I – Accommodation and food service activities 1,030 625
J – Information and communication 1,047 2,272
L – Real estate activities 1,426 3,512
M – Professional, scientifi c and technical activities 1,995 6,881
N – Administrative and support service activities 1,511 1,918
P – Education 466 254
Q – Human health and social work services 552 1,469
R – Arts, entertainment and recreation 443 379
S – Other service activities 279 490
Source: own processing
Tab. 1: Annual average number of fi rms included in the study
EM_1_2018.indd 131EM_1_2018.indd 131 21.3.2018 12:01:4821.3.2018 12:01:48
132 2018, XXI, 1
Ekonomika a management
model-based effects on profi tability are calculated. It must be emphasised that the calculated profi tability based on the average parameters does not have to be exactly equal to the empirically observed average profi tability during that time because of Jensen’s inequality (Jensen, 1906). Moreover, the taxation effects are here strictly bound to the current tax rates and the model-based calculated earnings before taxes (EBT), and they do not take the possible loss carry-forwards of previous years into account which, of course, exist in reality. A more detailed explanation of the actual
treatment of these aspects will be given in the following sections.
3. ResultsThe results of the study are presented in this section in a two-step manner. First of all, a comparative analysis of the return of assets discloses differences in the companies’ operations and quantifi es their impacts on profi tability (RoA). In the second step, the fi ndings are combined with further aspects of fi nancing and taxation to analyse the consequences for the return on equity (RoE).
Business sectors Average fi xed asset turnover
Average days inventory held
Average days sales outstanding
Average other asset turnover
FATCz FATGe p DIHCz DIHGe p DSOCz DSOGe p OATCz OATGe p
A – Agriculture, forestry and fi shing 0.585 1.218 ** 76.925 73.516 60.007 31.230 ** 4.396 3.897
B – Mining and quarrying 0.835 1.527 ** 21.042 34.736 ** 55.827 23.800 ** 3.035 1.014 **
C – Manufacturing 2.880 2.591 ** 42.660 46.838 ** 55.006 22.502 ** 8.078 4.030 **
D – Electricity, gas, steam and air-conditioning supply 1.021 2.657 ** 15.103 7.420 ** 60.358 33.495 ** 4.427 4.986
E – Water supply, sewerage and waste management 0.842 0.553 ** 15.253 15.369 66.916 45.562 ** 4.410 3.950
F – Construction 4.763 6.280 ** 32.733 154.525 ** 92.273 38.679 ** 5.455 4.280 *
G – Wholesale and retail 7.370 15.096 ** 31.619 28.515 ** 40.759 23.454 ** 14.410 11.499 **
H – Transportation and storage 1.132 1.287 ** 11.848 5.280 ** 56.203 21.669 ** 5.910 3.744 **
I – Accommodation and food service activities 0.770 4.475 ** 9.812 6.002 ** 48.434 14.887 ** 4.065 5.118 **
J – Information and communication 1.294 0.678 ** 9.718 11.008 61.860 29.534 ** 4.190 2.769 **
L – Real estate activities 0.196 0.199 13.949 132.203 ** 128.532 18.178 ** 1.564 1.831
M – Professional, scientifi c and technical activities 1.175 0.088 ** 25.773 51.756 ** 110.249 35.191 ** 2.827 0.225 **
N – Administrative and support service activities 2.560 1.854 * 5.142 8.557 ** 61.182 27.988 ** 5.984 5.564
P – Education 2.647 1.607 ** 6.332 6.618 67.780 27.060 ** 2.746 3.110 *
Q – Human health and social work services 1.624 1.143 ** 6.598 9.749 ** 54.275 45.386 ** 5.787 3.901 **
R – Arts, entertainment and recreation 1.112 1.592 * 3.730 11.922 ** 68.248 14.410 ** 1.720 2.843 **
S – Other service activities 4.408 1.879 ** 27.894 13.216 ** 63.767 29.563 ** 6.869 3.805 **
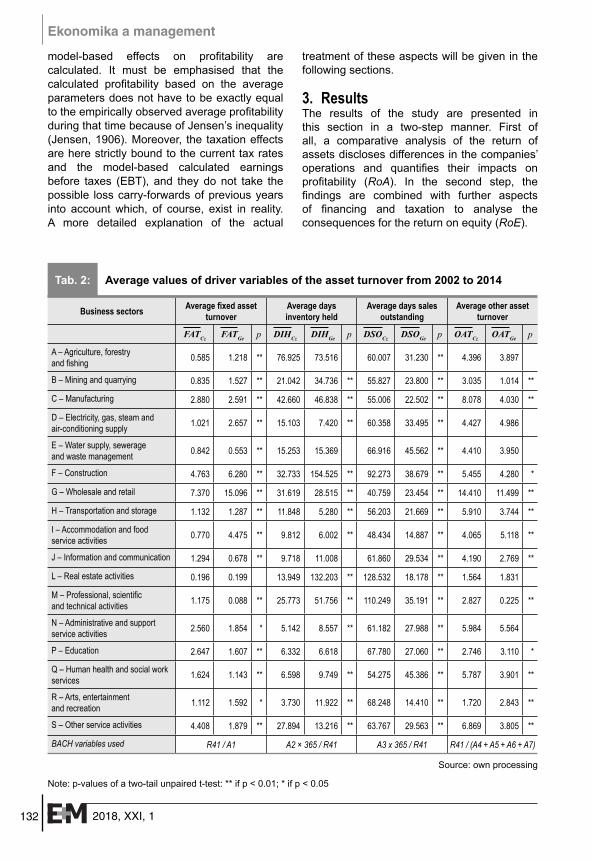
BACH variables used R41 / A1 A2 × 365 / R41 A3 x 365 / R41 R41 / (A4 + A5 + A6 + A7)
Source: own processing
Note: p-values of a two-tail unpaired t-test: ** if p < 0.01; * if p < 0.05
Tab. 2: Average values of driver variables of the asset turnover from 2002 to 2014
EM_1_2018.indd 132EM_1_2018.indd 132 21.3.2018 12:01:4921.3.2018 12:01:49
1331, XXI, 2018
Business Administration and Management
3.1 Benchmarking and Variance Analysis of Return on Assets (∆RoA)
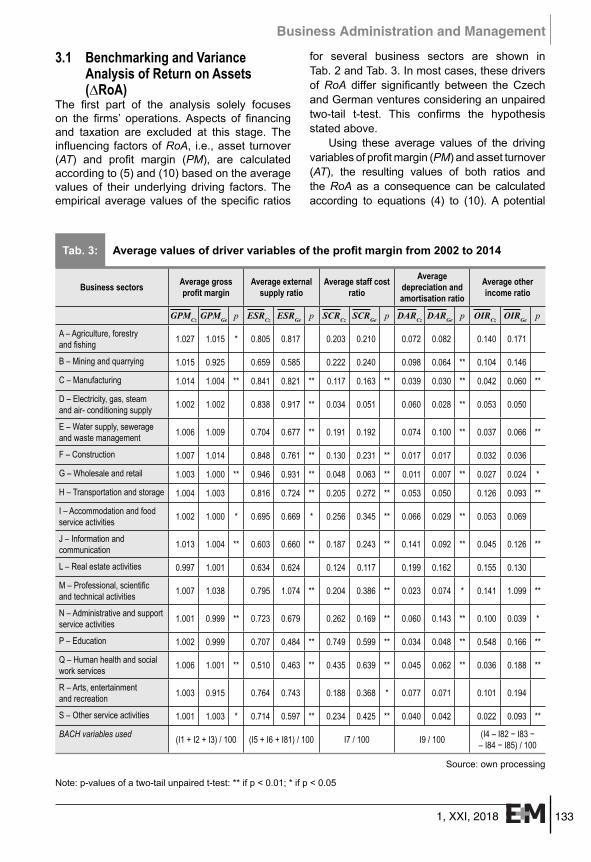
The fi rst part of the analysis solely focuses on the fi rms’ operations. Aspects of fi nancing and taxation are excluded at this stage. The infl uencing factors of RoA, i.e., asset turnover (AT) and profi t margin (PM), are calculated according to (5) and (10) based on the average values of their underlying driving factors. The empirical average values of the specifi c ratios
for several business sectors are shown in Tab. 2 and Tab. 3. In most cases, these drivers of RoA differ signifi cantly between the Czech and German ventures considering an unpaired two-tail t-test. This confi rms the hypothesis stated above.
Using these average values of the driving variables of profi t margin (PM) and asset turnover (AT), the resulting values of both ratios and the RoA as a consequence can be calculated according to equations (4) to (10). A potential
Business sectors Average gross profi t margin
Average external supply ratio
Average staff cost ratio
Average depreciation and amortisation ratio
Average other income ratio
GPMCz GPMGe p ESRCz ESRGe p SCRCz SCRGe p DARCz DARGe p OIRCz OIRGe p
A – Agriculture, forestry and fi shing 1.027 1.015 * 0.805 0.817 0.203 0.210 0.072 0.082 0.140 0.171
B – Mining and quarrying 1.015 0.925 0.659 0.585 0.222 0.240 0.098 0.064 ** 0.104 0.146
C – Manufacturing 1.014 1.004 ** 0.841 0.821 ** 0.117 0.163 ** 0.039 0.030 ** 0.042 0.060 **
D – Electricity, gas, steam and air- conditioning supply 1.002 1.002 0.838 0.917 ** 0.034 0.051 0.060 0.028 ** 0.053 0.050
E – Water supply, sewerage and waste management 1.006 1.009 0.704 0.677 ** 0.191 0.192 0.074 0.100 ** 0.037 0.066 **
F – Construction 1.007 1.014 0.848 0.761 ** 0.130 0.231 ** 0.017 0.017 0.032 0.036
G – Wholesale and retail 1.003 1.000 ** 0.946 0.931 ** 0.048 0.063 ** 0.011 0.007 ** 0.027 0.024 *
H – Transportation and storage 1.004 1.003 0.816 0.724 ** 0.205 0.272 ** 0.053 0.050 0.126 0.093 **
I – Accommodation and food service activities 1.002 1.000 * 0.695 0.669 * 0.256 0.345 ** 0.066 0.029 ** 0.053 0.069
J – Information and communication 1.013 1.004 ** 0.603 0.660 ** 0.187 0.243 ** 0.141 0.092 ** 0.045 0.126 **
L – Real estate activities 0.997 1.001 0.634 0.624 0.124 0.117 0.199 0.162 0.155 0.130
M – Professional, scientifi c and technical activities 1.007 1.038 0.795 1.074 ** 0.204 0.386 ** 0.023 0.074 * 0.141 1.099 **
N – Administrative and support service activities 1.001 0.999 ** 0.723 0.679 0.262 0.169 ** 0.060 0.143 ** 0.100 0.039 *
P – Education 1.002 0.999 0.707 0.484 ** 0.749 0.599 ** 0.034 0.048 ** 0.548 0.166 **
Q – Human health and social work services 1.006 1.001 ** 0.510 0.463 ** 0.435 0.639 ** 0.045 0.062 ** 0.036 0.188 **
R – Arts, entertainment and recreation 1.003 0.915 0.764 0.743 0.188 0.368 * 0.077 0.071 0.101 0.194
S – Other service activities 1.001 1.003 * 0.714 0.597 ** 0.234 0.425 ** 0.040 0.042 0.022 0.093 **
BACH variables used (I1 + I2 + I3) / 100 (I5 + I6 + I81) / 100 I7 / 100 I9 / 100 (I4 – I82 − I83 − – I84 − I85) / 100
Source: own processing
Note: p-values of a two-tail unpaired t-test: ** if p < 0.01; * if p < 0.05
Tab. 3: Average values of driver variables of the profi t margin from 2002 to 2014
EM_1_2018.indd 133EM_1_2018.indd 133 21.3.2018 12:01:4921.3.2018 12:01:49

134 2018, XXI, 1
Ekonomika a management
difference in the resulting RoA of Czech and German fi rms (∆RoACz-Ge) is defi ned as follows:
(11)
The differences in profi tability can be allocated to the driving factors according to section 1. The results are shown in the following table. Positive values of ∆RoA refer to the advantages of the Czech ventures, whereas the negative values refl ect effects in favour of the German companies.
Looking at these results, one can see that in most sectors the aspects linked to asset turnover have only minor infl uences on ∆RoA.
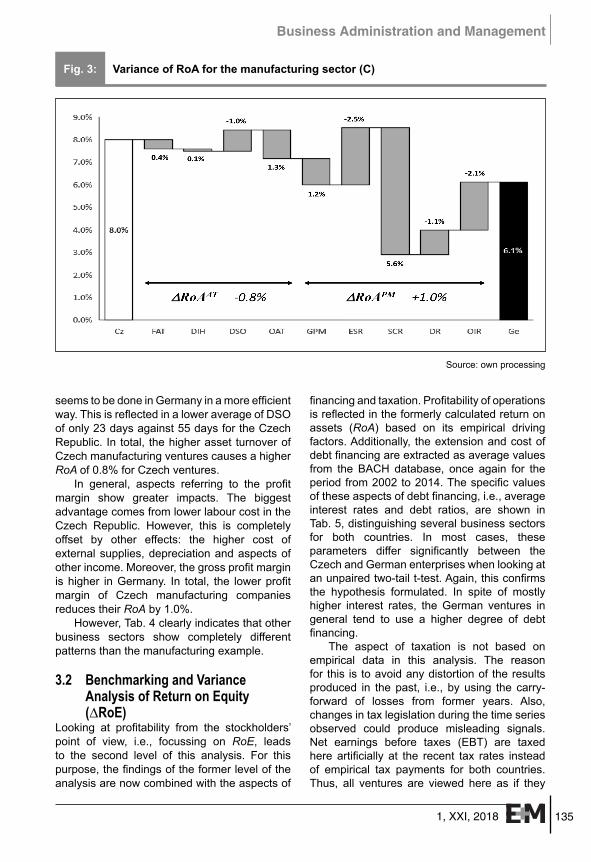
The main differences come from the profi t margin drivers, but they offset each other to a great extent. However, these fi ndings differ substantially between the specifi c business sectors. This is illustrated exemplarily for the manufacturing sector in Fig. 3, as one of the most important branches in both countries (European Central Bank, 2015).
Czech manufacturing ventures show an advantage in operating profi tability of 1.9%, which is in accordance with the results of other studies (e.g., European Central Bank, 2015). Aspects of asset turnover show lower infl uences on profi tability, mostly in favour of Czech companies. Only receivables management
Business sectors RoACz
∆RoAAT ∆RoAPM
RoAGe∆RoAFAT ∆RoADIH ∆RoADSO ∆RoAOAT ∆RoAGPM ∆RoAESR ∆RoASCR ∆RoADAR ∆RoAOIR
A – Agriculture, forestry and fi shing 3.8% -2.3% 0.0% -0.4% 0.1% 0.9% 0.9% 0.5% 0.7% -2.3% 5.7%
B – Mining and quarrying 8.0% -3.6% 0.4% -0.9% 4.4% 5.0% -4.1% 1.0% -1.9% -2.3% 10.1%
C – Manufacturing 8.0% 0.4% 0.1% -1.0% 1.3% 1.2% -2.5% 5.6% -1.1% -2.1% 6.1%
D – Electricity, gas, steam and air- conditioning supply
8.7% -6.5% -0.4% -1.6% -0.6% 0.0% 11.5% 2.5% -4.6% 0.3% 8.1%
E – Water supply, sewerage and waste management
4.5% 1.2% 0.0% -0.1% 0.0% -0.1% -1.2% 0.0% 1.2% -1.3% 4.7%
F – Construction 6.1% -0.5% 2.2% -0.7% 0.3% -0.7% -9.4% 10.9% 0.0% -0.4% 4.3%
G - Wholesale and retail 6.4% -1.3% -0.2% -1.4% 0.6% 1.1% -5.2% 5.2% -1.3% 1.0% 8.0%
H – Transportation and storage 4.5% -0.4% -0.1% -0.5% 0.5% 0.1% -8.2% 6.0% -0.3% 2.9% 4.5%
I – Accommodation and food service activities 2.3% -4.0% -0.1% -1.1% -0.8% 0.6% -5.3% 18.7% -7.7% -3.4% 5.5%
J – Information and communication 10.6% 3.9% 0.0% -0.3% 0.4% 0.5% 2.9% 2.9% -2.5% -4.1% 6.9%
L – Real estate activities 3.2% 0.0% 0.2% -0.2% -0.1% -0.1% -0.2% -0.1% -0.6% 0.4% 3.8%
M – Professional, scientifi c and technical activities 8.0% 6.9% 0.0% 0.0% 0.3% -0.2% 1.7% 1.1% 0.3% -6.0% 3.8%
N – Administrative and support service activities 7.6% 1.3% 0.1% -0.7% 0.1% 0.2% -5.4% -11.3% 10.2% 7.4% 5.7%
P – Education 6.3% 1.3% 0.0% -0.5% -0.2% 0.3% -21.6% -14.5% 1.3% 36.9% 3.4%
Q – Human health and social work services 5.5% 1.2% 0.0% -0.1% 0.3% 0.4% -3.7% 15.9% 1.3% -11.8% 2.0%
R – Arts, entertainment and recreation 4.4% -0.9% 0.1% -0.6% -1.3% 8.3% -2.0% 17.1% -0.6% -8.8% -6.9%
S – Other service activities 5.7% 1.9% -0.2% -0.5% 0.6% -0.1% -12.9% 21.0% 0.2% -7.8% 3.4%
Source: own processing
Tab. 4: Contribution to variance in return on assets from the driving factors of asset turnover and profi t margin
EM_1_2018.indd 134EM_1_2018.indd 134 21.3.2018 12:01:4921.3.2018 12:01:49
1351, XXI, 2018
Business Administration and Management
seems to be done in Germany in a more effi cient way. This is refl ected in a lower average of DSO of only 23 days against 55 days for the Czech Republic. In total, the higher asset turnover of Czech manufacturing ventures causes a higher RoA of 0.8% for Czech ventures.
In general, aspects referring to the profi t margin show greater impacts. The biggest advantage comes from lower labour cost in the Czech Republic. However, this is completely offset by other effects: the higher cost of external supplies, depreciation and aspects of other income. Moreover, the gross profi t margin is higher in Germany. In total, the lower profi t margin of Czech manufacturing companies reduces their RoA by 1.0%.
However, Tab. 4 clearly indicates that other business sectors show completely different patterns than the manufacturing example.
3.2 Benchmarking and Variance Analysis of Return on Equity (∆RoE)
Looking at profi tability from the stockholders’ point of view, i.e., focussing on RoE, leads to the second level of this analysis. For this purpose, the fi ndings of the former level of the analysis are now combined with the aspects of
fi nancing and taxation. Profi tability of operations is refl ected in the formerly calculated return on assets (RoA) based on its empirical driving factors. Additionally, the extension and cost of debt fi nancing are extracted as average values from the BACH database, once again for the period from 2002 to 2014. The specifi c values of these aspects of debt fi nancing, i.e., average interest rates and debt ratios, are shown in Tab. 5, distinguishing several business sectors for both countries. In most cases, these parameters differ signifi cantly between the Czech and German enterprises when looking at an unpaired two-tail t-test. Again, this confi rms the hypothesis formulated. In spite of mostly higher interest rates, the German ventures in general tend to use a higher degree of debt fi nancing.
The aspect of taxation is not based on empirical data in this analysis. The reason for this is to avoid any distortion of the results produced in the past, i.e., by using the carry-forward of losses from former years. Also, changes in tax legislation during the time series observed could produce misleading signals. Net earnings before taxes (EBT) are taxed here artifi cially at the recent tax rates instead of empirical tax payments for both countries. Thus, all ventures are viewed here as if they
Fig. 3: Variance of RoA for the manufacturing sector (C)
Source: own processing
EM_1_2018.indd 135EM_1_2018.indd 135 21.3.2018 12:01:4921.3.2018 12:01:49

136 2018, XXI, 1
Ekonomika a management
were companies. For the Czech Republic, it means the forms of a. s. (akciová společnost – joint stock company) and s. r. o. (společnost s ručením omezeným – limited liability company), and for Germany, the legal forms of AG (Aktiengesellschaft – joint stock company), GmbH (Gesellschaft mit beschränkter Haftung – limited liability company) or UG (Unternehmer gesellschaft, haftungsbeschränkt – a company with a lower capital than GmbH). These legal forms predominate in the database used (European Central Bank, 2015). In the Czech Republic, these companies face a corporate tax rate of 19%, which is identical to the tax-shield rate on debt. The German taxation
of these legal forms is more complex and is usually described in the following way (see, for instance, the online database of the European Commission “Taxes in Europe” TEDB, 2015).
Combining the country-specifi c average values of debt fi nancing in Tab. 5 and the return on assets from section 3.1 with recent conditions of taxation as described above produces differences in return on equity between the two countries. Positive values of ∆RoE again describe the advantages the Czech companies hold compared to Germany caused by the specifi c underlying driving factors. The variance analysis is made as described above in a sequential procedure.
Business sectorsAverage interest rate
on debt Average debt ratio
iCz iGe ΔiCz-Ge p lCz lGe ΔlCz-Ge pA – Agriculture, forestry and fi shing 1.6% 3.3% -1.7% ** 0.248 0.520 -0.272 **B – Mining and quarrying 1.3% 1.2% 0.1% 0.384 0.770 -0.386 **C – Manufacturing 1.7% 2.2% -0.5% ** 0.516 0.688 -0.172 **D – Electricity, gas, steam and air-conditioning supply 1.7% 1.7% 0.0% 0.472 0.703 -0.231 **
E – Water supply, sewerage and waste management 1.0% 2.6% -1.6% ** 0.349 0.684 -0.335 **
F – Construction 0.9% 1.3% -0.4% ** 0.649 0.829 -0.180 **G – Wholesale and retail 1.5% 2.0% -0.5% ** 0.635 0.717 -0.082 **H – Transportation and storage 1.3% 3.1% -1.8% ** 0.366 0.691 -0.325 **I – Accommodation and food service activities 2.8% 2.2% 0.6% ** 0.762 0.730 0.032
J – Information and communication 2.3% 3.2% -0.9% ** 0.450 0.588 -0.138 **L – Real estate activities 3.1% 3.6% -0.5% ** 0.637 0.689 -0.052 M – Professional, scientifi c and technical activities 1.6% 3.4% -1.9% ** 0.534 0.586 -0.052 **
N – Administrative and support service activities 2.0% 2.5% -0.5% ** 0.637 0.858 -0.221 **
P – Education 0.7% 2.2% -1.5% ** 0.616 0.492 0.124 **Q – Human health and social work services 1.5% 1.7% -0.2% 0.473 0.466 0.007
R – Arts, entertainment and recreation 3.5% 2.7% 0.8% 0.613 0.687 -0.073 *S – Other service activities 1.0% 1.8% -0.8% ** 0.639 0.620 0.020 BACH variables used I10 × R41 / (L × 100) L / 100
Source: own processing
Note: p-values of a two-tail unpaired t-test: ** if p < 0.01; * if p < 0.05
Tab. 5: Average values of fi nancing costs and debt ratios from 2002 to 2014
EM_1_2018.indd 136EM_1_2018.indd 136 21.3.2018 12:01:5021.3.2018 12:01:50

1371, XXI, 2018
Business Administration and Management
The order of the aspects analysed is driven by the question of which aspects are more under the control of the companies themselves. This is given especially for the debt ratio and the fi rms’ profi tability of operations (RoA). Interference from other factors can be reduced if these aspects are analysed last. The differences in the taxation systems referring to tax rates and tax-shields are considered as a whole. Since these aspects are clearly of an external nature, they are considered in the fi rst place. In the second step, the aspects of fi nancing are addressed. The resulting differences in the return on equity (∆RoE) caused by the factors mentioned can then be quantifi ed by comparing the results of
different sets of infl uencing variables (I to V). Tab. 7 illustrates this procedure.
The calculated results are shown in Tab. 8.Again, some interesting aspects shall be
discussed exemplarily for the manufacturing sector (C). The higher RoA of Czech manufacturing ventures, which was analysed in detail in section 3.1, would lead to an advantage in RoE of 4.2%, if all aspects of fi nancing and taxation were equal for both countries at their German levels. However, differences in the later aspects cause additional variances in the RoE. Although the nominal tax rates in Germany are much higher than in the Czech Republic, it fi nally produces an additional advantage
Variable Name Content Value
τCTAXCz
Corporate tax rate of Czech companies
Corporation tax 19%
τTSCz
Corporate tax-shield rate of Czech companies
Interest payments are completely tax deductible at the corporate level
19%
τCTAXGe
Corporate tax rate of German companies
Combines a corporation tax (Körperschaftsteuer) including a solidarity surcharge of 15.825% and a locally varying trade tax (Gewerbesteuer) of typically 14% (Hebesatz = 400%)
29.825%
τTSGe
Corporate tax-shield rate of German companies
25% of interest payments are not deductible from trade tax (Gewerbesteuer), 15.825% + 0.75 * 14%
26.325%
Source: own processing according to European Commission (2015), Marková (2017) and Kussmaul and Ruiner (2011)
Tab. 6: Current taxation of Czech and German companies
Set of variables: I II III IV VτCTAX, τTS Cz ⇒ Ge Ge Ge Ge
iDebt Cz Cz ⇒ Ge Ge Ge
l Cz Cz Cz ⇒ Ge Ge
RoA Cz Cz Cz Cz ⇒ Ge
RoEI RoEII RoEIII RoEIV RoEV
∆RoETaxation
∆RoEInterest rate
∆RoELeverage
∆RoEOperations
Source: own processing
Tab. 7: Analyses of variances in return on equity (RoE)
EM_1_2018.indd 137EM_1_2018.indd 137 21.3.2018 12:01:5021.3.2018 12:01:50

138 2018, XXI, 1
Ekonomika a management
of only 1.7% in the RoE. The lower leverage from the debt ratios of Czech corporations, however, reduces their RoE by 4.5% compared to German enterprises. Conditions of fi nancing in terms of interest rates are similar and show nearly no infl uences on RoE. Because of the overlapping nature of all these individual effects, the fi nal RoE is rather similar for both countries, showing a small advantage for Czech ventures (according to the fi ndings from the European Central Bank, 2015).This fact is therefore in line with a positively defi ned hypothesis about
the nature of differences in profi tability between the Czech and German fi rms. Fig. 4 illustrates these results for the manufacturing sector, which, however, differ from those of other business sectors.
4. Research LimitationsIt goes without saying that all these fi ndings are not free of bias. Even if the coverage in the database is high, the results might not always be completely representative for a specifi c sector (European Central Bank, 2015). The covered
Business sectors RoECz ∆RoETax rates ∆RoEInterest rate ∆RoELeverage ∆RoEOperations RoEGe
A – Agriculture, forestry and fi shing 3.6% 0.5% 0.4% -0.2% -2.8% 5.7%
B – Mining and quarrying 9.9% 1.4% 0.0% -12.9% -6.4% 27.9%C – Manufacturing 11.9% 1.7% 0.4% -4.5% 4.2% 10.2%D – Electricity, gas, steam and air -conditioning supply
12.2% 1.7% 0.0% -7.2% 1.4% 16.3%
E – Water supply, sewerage and waste management
5.1% 0.7% 0.6% -2.0% -0.5% 6.4%
F – Construction 12.8% 1.8% 0.6% -10.0% 7.3% 13.2%G – Wholesale and retail 12.3% 1.7% 0.7% -2.4% -3.8% 16.1%H – Transportation and storage 5.2% 0.7% 0.8% -1.5% 0.0% 5.3%
I – Accommodation and food service activities 0.5% 0.4% -1.4% 0.0% -8.1% 9.7%
J – Information and communication 14.0% 1.9% 0.5% -3.1% 6.2% 8.4%
L – Real estate activities 2.7% 0.6% 0.6% 0.2% -1.4% 2.8%M – Professional, scientifi c and technical activities
12.5% 1.7% 1.6% -0.8% 7.2% 2.8%
N – Administrative and support service activities 14.0% 2.0% 0.6% -15.0% 8.9% 17.4%
P – Education 12.3% 1.7% 1.8% 1.7% 4.0% 3.1%Q – Human health and social work services 7.3% 1.0% 0.1% 0.1% 4.6% 1.5%
R – Arts, entertainment and recreation 4.8% 0.8% -0.9% -0.7% 25.2% -19.7%
S – Other service activities 11.3% 1.6% 1.1% 0.4% 4.1% 4.2%
Source: own processing
Tab. 8: Differences in return on equity between Czech and German companies and their causing factors
EM_1_2018.indd 138EM_1_2018.indd 138 21.3.2018 12:01:5021.3.2018 12:01:50

1391, XXI, 2018
Business Administration and Management
period of 13 years from 2002 to 2014 might also not present a completely reliable picture, or recent trends could be missed by looking at the average values. However, this is the longest period which is available for both countries in the BACH database so far. Such a restricted sample also limits the reliability of the statistical tests. Since t-test statistics are usually robust, violations of theoretical assumptions might not affect the results too seriously.
Another aspect to be considered with care is that the BACH database provides weighted means of its variables. Therefore, the infl uence of bigger companies might be strong. Consequently, the results draw a picture of aggregated economies or sectors as a whole, rather than an average of individual fi rms.
The assumptions made about taxation, which treats all fi rms as if they were companies, should be considered carefully. However, since the highest volume of business is actually done in both countries using these kinds of legal forms and they predominate in the given database too, it might be an acceptable simplifi cation.
Finally, even if the BACH database provides harmonised accounting information, the infl uences from the national GAAP still
exist (European Central Bank, 2015). Since only fundamental items of balance sheets and income statements are used here, the infl uences of differing allocations and valuations among these positions should be acceptable. In one specifi c case an additional correction was made. The BACH income item: ‘external supplies and services’ (BACH variable I5) is only used in the Czech data. Major parts of this item are recorded in Germany as ‘other operating charges’ (BACH variable I81). In order to solve this problem, a higher aggregated term for ‘external supply’ is used here, considering materials, consumables, externally supplied goods and services or other operational charges at the same time (Bach variables I5 + I6 + I81). Other income items, such as staff costs and depreciation and non-operating aspects, are assumed to be comparable. This should also account for allocation aspects in the main items of balance sheets. Differences in valuations of assets and fi nancial debt are not addressed specifi cally, but should be tolerable.
Tackling all these critical points, the use of the database, once it has grown in size and time, could improve the signifi cance of the results in coming years. Ongoing harmonisation
Fig. 4: Variance in RoE for the manufacturing sector (C)
Source: own
EM_1_2018.indd 139EM_1_2018.indd 139 21.3.2018 12:01:5021.3.2018 12:01:50
140 2018, XXI, 1
Ekonomika a management
of the national GAAP will also improve the comparability between countries. This provides an extended target for future research.
ConclusionNational economic policies usually emphasise the aspects of tax rates and labour costs, assuming they are the most important sources of competitive advantages. When comparing the Czech and German economies, these aspects are often seen as signifi cant advantages for Czech enterprises. The study shows that these effects clearly exist, but do not have the greatest impact on the differences in RoA or RoE in all sectors. German ventures often have a strong advantage in their external sourcing of materials, goods and services, which offsets the lower Czech staff costs to a great extent. Also, the components of other income, outside of the typical production factors, play a remarkable role. Asset turnover, which indicates capacity utilisation, shows, on average, a rather comparable picture, but varies greatly between specifi c sectors. However, for all these sectors, the DSO (days sales outstanding) ratio is much higher for Czech enterprises. Improvements in receivables management could be an interesting approach to increasing profi tability.
Since ∆RoACz-Ge have positive values for almost all sectors, it indicates systematic operational advantages for Czech fi rms compared to German ventures. These positive infl uences from operations logically have a favourable impact on Czech fi rms’ RoE. Moreover, the lower tax rates and interest rates provide further advantages to Czech fi rms. However, these effects are completely offset by the greater amount of debt fi nancing, which is typical for German enterprises in almost all the analysed sectors. This aspect, based on the fi nancial leverage effect, could be used for competitive improvements. Under otherwise equal conditions, Czech ventures could provide higher returns than German ones if they use the same extension of debt fi nancing. On the other hand, the greater fi nancial leverage of German fi rms increases their exposure to risk. This causes additional pressure in times of economic crises.
The results have given us deeper insights into the economic performance of Czech and German enterprises in individual sectors. Having examined the country-specifi c driving factors, their contributions to the differences in
the typical profi tability ratios, i.e., RoE and RoA, are derived and quantifi ed. This benchmarking addresses important sources of competitive advantages. It uncovers suitable starting points for targeted improvements.
ReferencesAmin, S., & Aslam, S. (2017). Intellectual
Capital, Innovation and Firm Performance of Pharmaceuticals: A Study of the London Stock Exchange. Journal of Information & Knowledge Management, 16(2). https://dx.doi.org/10.1142/S0219649217500174.
Anagnostopoulou, S. C., & Tsekrekos, A. E. (2017). The effect of fi nancial leverage on real and accrual-based earnings management. Accounting and Business Research, 47(2), 191-236. https://dx.doi.org/10.1080/00014788.2016.1204217.
BACH. (2016). Userguide Summary. Retrieved March 17, 2016, from https://www.bach.banque-france.fr/ index.php?page= telechargementFile&fi le=Summary_Userguide.pdf.
Batchimeg, B. (2017). Financial Performance Determinants of Organizations: The Case of Mongolian Companies. Journal of competitiveness, 9(3), 22-33. https://dx.doi.org/10.7441/joc.2017.03.02.
Bhimani, A., Horngren, C. T. et al. (2012). Management and cost accounting. Prentice Hall: Harlow.
Christodoulou, D., Clubb, C., & Mcleay, S. (2016). A Structural Accounting Framework for Estimating the Expected Rate of Return on Equity. Abacus – a Journal of Accounting Finance and Business Studies, 52(1), 176-210. https://dx.doi.org/10.1111/abac.12073.
da Rocha Oliveira, J. F. et al. (2017). Performance indicators and market value: an analysis on the companies listed in BM&F BOVESPA. Revista ambiente contabil, 9(2), 240-258.
Demircan, V. et al. (2016). Comparison of cost and profi tability of organic and conventional apple nursery tree growing. Custos e agronegocio on line, 12(3), 180-192.
Dinca, M. S. et al. (2017). Integrated Analysis of EU Construction Companies’ Financial Performances. Journal of construction engineering and management, 143(6). https://dx.doi.org/10.1061/(ASCE)CO.1943-7862.0001287.
Ding, N., Fung, H., & Jia, J. (2017). Comparison of Bank Profi tability in China and
EM_1_2018.indd 140EM_1_2018.indd 140 21.3.2018 12:01:5121.3.2018 12:01:51

1411, XXI, 2018
Business Administration and Management
the USA. China & World Economy, 25(1), 90-108. https://dx.doi.org/10.1111/cwe.12188.
Dluhošová, D., Ptáčková, B., & Zmeškal, Z. (2015). Financial performance variance analysis of delta linear decomposition. In Financial Management of Firms and Financial Institutions: 10th International Scientifi c Conference, PTS I-IV, Book Series: Financial Management of Firms and Financial Institutions (pp. 195-201). Ostrava: VSB Tech. University in Ostrava.
Easton, P. D., & Monahan, S. J. (2016). Review of Recent Research on Improving Earnings Forecasts and Evaluating Accounting-based Estimates of the Expected Rate of Return on Equity Capital. Abacus – a Journal of Accounting Finance and Business Studies, 52(1), 35-58. https://dx.doi.org/10.1111/abac.12064.
Erbuga, G. S. (2016). Comparing the Value Relevance of Cash Flow Ratios and DU Pont Ratios under IFRS: A Case Study. Entrepreneurship, Business and Economics, Vol. 2, Book Series: Eurasian Studies in Business and Economics, 3-2 (pp. 97-111). Portugal: Inst Univ. Lisboa. https://dx.doi.org/10.1007/978-3-319-27573-4_6.
European Banking Authority. (2012). Assessment of SME proposals for CRD IV/CRR. Retrieved June 28, 2016, from h t tp : / /www.eba.europa.eu/documents / 10180/16148/EBA-SME-Report.pdf.
European Central Bank. (2015). Statistics Paper Series No. 11/2015, The Bank for the Accounts of Companies Harmonized (BACH) database. Retrieved November 2, 2016, from http://www.ecb.europa.eu/pub/pdf/scpsps/ecbsp11.en.pdf?289ccdcbc90836ea320563782429bdca.
European Commission. (2015). Taxes in Europe – Database. Retrieved June 1, 2017, from https://ec.europa.eu/taxation_customs/taxes-europe-database-tedb_en.
Eurostat. (2008). NACE Rev. 2 – Statistical classifi cation of economic activities in the European Community. Retrieved December 26, 2016, from http://ec.europa.eu/eurostat/documents/3859598/5902521/KS-RA-07-015-EN.pdf.
Feng, S. (2016). Study on the Financial Leverage Effect Based On the Financing Activities of SMEs. Proceedings of the 2016 International Conference on Management Science and Innovative Education (MSIE), Book
Series: Advances in Social Science Education and Humanities Research, 60 (pp. 282-284). Sanya.
Guelfi , S. (2013). Variances Analysis of the Free Cash Flows to Firm and its Impact on the Financial Structure. Spare Parts Manufacturers in the Italian Automotive Independent after Market in the 2008–2011 Period. In Confronting Contemporary Business Challenges through Management Innovation (pp. 1128-1147). Lisbona: Euromed Academy of Business.
He, W., & Liu, P. (2014). The research on profi tability comparison around transformation to coal of listed corporations. In Conference: International Conference on Manufacture Engineering and Environment Engineering (MEEE), Vol. 84 (pp.1347-1353). Hong Kong. https://dx.doi.org/10.2495/MEEE 20131872.
Hron, J., Macák, T., & Andres, P. (2015). Overcoming the Uncertainty in the Du-Pont Graph of Profi tability. In 18th International Conference Enterprise and Competitive Environment (pp. 314-320). Brno: Mendel University.
Jarrar, Y. F., & Zairi, M. (2001). Future trends in benchmarking for competitive advantage: A global survey. Total quality management, 12(7-8), 906-912. https://dx.doi.org/10.1080/09544120100000014.
Jensen, J. L. W. V. (1906). Sur les fonctionsconvexeset les inégalités entre les valeursmoyennes. Acta Math, (30), 175-193.
Jovanovic, D., Todorovic, M., & Grbic, M. (2017). Financial Indicators as Predictors of Illiquidity. Romanian Journal of Economic Forecasting, 20(1), 128-149.
Kent, R., & Routledge, J. (2017). Use of benchmarks in predicting earnings management? Accounting and Finance, 57(1), 239-260. https://dx.doi.org/10.1111/acfi .12130.
Kijewska, A. (2016). Determinants of the Return on Equity Ratio (ROE) on the Example of Companies from Metallurgy and Mining Sector in Poland. Metalurgija, 55(2), 285-288.
Koloszko-Chomentowska, Z., & Sieczko, L. (2016). Effectiveness of Fixed Assets in Agriculture of Selected New Member States in European Union. In 15th International Scientifi c Conference: Engineering for Rural Development, Book Series: Engineering for Rural Development (pp. 708-713). Latvia: Latvia University of Agriculture.
Krechovská, M. (2015). Integration of Corporate Sustainability Approach and
EM_1_2018.indd 141EM_1_2018.indd 141 21.3.2018 12:01:5121.3.2018 12:01:51
142 2018, XXI, 1
Ekonomika a management
Sustainable Performance in Corporate Management. In Conference: 26th International-Business-Information-Management-Association Conference. 1-4 (pp. 1997-2005). Madrid.
Ku, Y. Y., & Yen, T. Y. (2016). Heterogeneous Effect of Financial Leverage on Corporate Performance: A Quantile Regression Analysis of Taiwanese Companies. Review of Pacifi c Basin Financial Markets and Policies, 19(3). https://dx.doi.org/10.1142/S0219091516500156.
Kussmaul, H., & Ruiner, C. (2011). The Taxation of Economic Activities of Spanish Corporations in Germany – Critical Analysis and Exemplary Comparison of the Effective Tax Burden. Betriebswirtschaftliche Forschung und Praxis, 63(5), 562-583.
Leite, M., Guse, J. C., & Hein, N. (2017). Financial leverage and fi nancial performance: analysis on the brazilian agribusiness. Custos e agronegocio on line, 13(Special Issue), 203-226.
Marková, H. (2017). Daňové zákony 2017. Praha: GRADA Publishing.
Mihola, J., & Kotěšovcová, J. (2015). The intensity of development and making of Du Pont’s model. In Financial Management of Firms and Financial Institutions: 10th International Scientifi c Conference, PTS I-IV, Book Series: Financial Management of Firms and Financial Institutions (pp. 799-806). Ostrava: VSB-Tech. University.
Peles, Y. C. (1986). A note on yield variance and mix variance. The Accounting Review, 61(2), 325-329.
Penman, S. (2013). Financial statement analysis and security valuation. New York: McGraw-Hill/Irwin.
Piedra-Munoz, L., Galdeano-Gomez, E., & Perez-Mesa, J. (2016). Is Sustainability Compatible with Profi tability? An Empirical Analysis on Family Farming Activity. Sustainability, 8(9). https://dx.doi.org/10.3390/su8090893.
Ptáčková, B. (2015). Financial performance variance analysis of non-linear decomposition in energy sector. In Financial Management of Firms and Financial Institutions: 10th International Scientifi c Conference, PTS I-IV, Book Series: Financial Management of Firms and Financial Institutions (pp. 1005-1010). Ostrava: VSB Tech. University.
Sukmawati, F., & Garsela, I. (2016). The Effect of Return on Assets and Return on Equity to the Stock Price. In Proceedings of the 2016 Global Conference on Business, Management and Entrepreneurship, Book Series: AEBMR-Advances in Economics Business and Management Research (pp. 53-57). Indonesia: University of Pendidikan.
Vaněk, M., Bora, P., Maruszewska, E. W., & Kašparková, A. (2017). Benchmarking of mining companies extracting hard coal in the Upper Silesian Coal Basin. Resources Policy, 53, 378-383. https://dx.doi.org/10.1016/j.resourpol.2017.07.010.
Vorhies, D. W., & Morgan, N. A. (2005). Benchmarking marketing capabilities for sustainable competitive advantage. Journal of Marketing, 69(1), 80-94. https://dx.doi.org/10.1509/jmkg.69.1.80.55505.
Prof. Dr. Dirk BeyerHarz University of Applied Sciences
Department of Business StudiesGermany
Ing. Jana Hinke, Ph.D.University of West Bohemia
Faculty of EconomicsDepartment of Finance and Accounting
Czech [email protected]
EM_1_2018.indd 142EM_1_2018.indd 142 21.3.2018 12:01:5121.3.2018 12:01:51

1431, XXI, 2018
Business Administration and Management
Abstract
SECTORAL ANALYSIS OF THE DIFFERENCES IN PROFITABILITY OF CZECH AND GERMAN BUSINESS VENTURES – AN EMPIRICAL BENCHMARK STUDY
Dirk Beyer, Jana Hinke
Profi tability measures are a lens through which business can be viewed and they form a common basis for investment decisions. Especially in areas close to national borders, these decisions could be linked to the question on which side of the border a venture should be located in order to realise country-specifi c comparative advantages that make the investment more profi table. Differences in profi tability between countries are driven by manifold aspects, including specifi c cost or revenue structures, fi nancing patterns and conditions, as well as taxation. The aim of this study is to identify the driving factors behind differences in profi tability of Czech and German fi rms on the basis of a comparative analysis. In this article, a two-step variance analysis is conducted. The fi rst step focuses on the operational differences in RoA between Czech and German ventures, which is based on deeper analyses of the asset turnover and the profi t margin. In the second step, the differences in RoE are analysed, considering infl uences from national taxation, conditions and patterns of fi nancing and operations of the ventures. A model-based cumulative variance analysis quantifi es the impacts of these underlying drivers of profi tability with a comparative focus. For this reason, the average measures of these drivers from 2002 to 2014 – the longest time series available for both countries − are extracted from the BACH database, which provides harmonised accounting information. This paper confi rms the hypothesis that specifi c drivers of profi tability differ signifi cantly between the two countries in certain business sectors and would cause substantial differences in profi tability. Due to the overlapping nature of these individual effects, they compensate each other to a great extent. The results provide useful benchmarks that a company´s management can use to increase its profi tability tackling specifi c comparative (dis-)advantages between the Czech Republic and Germany.
Key Words: Profi tability, international benchmarking, variance analysis, business sectors.
JEL Classifi cation: M21.
DOI: 10.15240/tul/001/2018-1-009
EM_1_2018.indd 143EM_1_2018.indd 143 21.3.2018 12:01:5121.3.2018 12:01:51