sectoral structure analysis aerospace review by pwc
TRANSCRIPT

www.pwc.com/aerospaceand
Sectoral StructureAnalysisAerospace Review
July 2012
www.pwc.com/aerospaceanddefence
Sectoral StructureAnalysisAerospace Review
Sectoral Structure

Aerospace Sectoral Structure
July 2012PwC Page 2 of 30
Table of Contents
Executive Summary 3
Introduction 4
OEMs/Tier 1s 8
Small/Medium-Sized Enterprises (SME’s) 15
Aerospace Clusters 21

Aerospace Sectoral Structure
July 2012PwC Page 3 of 30
Executive Summary
The Aerospace Review has requested PwC’s assistance to provide a report that analyzes the role andimportance of OEMs, Tier 1s, aerospace clusters and SMEs within the global aerospace sectoralstructure and provides PwC’s perspective on a limited set of implications for Canada’s aerospaceindustry.
Along the questions raised by the Aerospace Review, our observations are the following:
Within the Aerospace value chain, support for Tier 1s should be of relatively high priority for anycountry:
o Due to the growing consolidation of Tier 1’s for new aircraft and systems platforms, alimited number are selected to be “Super Tier 1’s “/”Risk Sharing Partners” and theirimportance in newer platforms is growing for production as well as lifecycle revenue.
o In the shift of the industrial model in aerospace, they have become responsible for morehigher-value activities in design, integration, and pre-assembly that contribute to a moreinnovative economy.
o Tier 1s show a particularly high preference to involve local suppliers in their supplychain.
In particular, our analysis of global aerospace manufacturing facilities indicates that propulsionintegration brings significantly higher economic benefits in the form of employment and taxesthan many other segments of the industry.
OEMs may not drive growth in their “home country” to the extent that they have in the past; inthe wake of globalization, part of their development, manufacturing and support growth takesplace outside of their “home countries” or regions; yet they are still important from ananchoring perspective in the industry ecosystem as 1) they show some domestic supplierpreference, 2) can potentially create Tier 1 suppliers through spin-offs, 3) provide support andfinancing to SMEs, and 4) help contribute to the critical characteristics of aerospace clusters. So,while Tier 1s may be more important from a growth perspective, OEMs will likely still providesignificant economic benefits to their respective domestic economies in the future.
SMEs have a relatively high growth potential but it is important to consider that they also tendto underperform during downturns. Offshoring, offsets, higher R&D requirements, reduction inthe number of program suppliers and relatively low access to capital can also marginalize therole of many SMEs. There will always be a need to ensure the viability of innovation-drivenSMEs however while growth rates tend to be high, the absolute size of most SMEs means thatthese companies will tend to have a more limited impact on overall industry growth.
With respect to aerospace clusters, we find that they have had significant and positive economicimpacts to date and, while globalization has not made aerospace clusters less valuable, it haschanged the model of aerospace clusters. New aerospace clusters are being established andgrowing in emerging markets, and as these aerospace clusters mature, it will be important forCanada to retain OEMs and grow the Tier 1 base in order to maintain innovation-drivenaerospace clusters.
Many of the analyses in this report focus on global or country comparisons with Canadahowever there may be additional research opportunities that focus more strictly on Canadawhich can be discussed.
Aerospace Sectoral Structure
July 2012PwC Page 4 of 30
1 Introduction
Aerospace Review RequestPwC was retained by Aerospace Review to analyze which aerospace sector structure would likelyproduce the greatest benefits to the Canadian economy over the long-term., This report addressesseveral questions related to the sector:
Is the presence of Canadian OEMs critical to “anchor” a Canadian aerospace industry?
Would more Tier 1 companies jump-start expansion of the sector?
Is the greatest potential for growth found among SMEs?
Will aerospace clusters have the same positive effects in an increasingly globalized industry asthey had in the past?
PwC ApproachIn our report, the order of these questions, but not the questions themselves, differs from thestatement of work issued by the Aerospace Review. This was deemed appropriate because a) severalapproaches used to analyze the relative importance of OEMs and Tier 1s overlap and b) this orderfollows a top-down value chain approach.
While a review of historical data is an important input into this report, our perspective shared in thisreport is likewise the result of taking a forward-looking point of view in order to address how theevolution of the sector may require new policies in the future. We have leveraged some of the insightsin this report from our regular work with top aerospace firms globally.
Comments on DataThe analysis presented in this report relies upon publically available financial data though we notethat data was not consistently available across all categories of firms. Sample sizes are shared in thetext or in the charts, denoted by number of observations (n), and separate samples were developedfor the sections on investments by top 50 aerospace companies, manufacturing facilities and SMEs.While the samples used in this report are fairly large, it is important to consider the data and insightsas directional indicators, subject to the limitations of data availability.

Aerospace Sectoral Structure
July 2012PwC
Industry Trends
Figure 1: Growth in air traffic and real economic output (1991-2017e)
Source: Airline Monitor, IMF, PwC Analysis
The most significant trends impacting the outlook for aerosoffered by fleet expansion in many emerging markets due treplacement demand in more mature markets as a result of
Figure 2: Crude oil and jet fuel spot prices
Source: US Energy Information Administration, P
-5
0
5
10
15
20
199
1
199
2
199
3
199
4
199
5
199
6
199
7
199
8
199
9
20
00
20
01
20
02
20
03
20
04
20
05
20
06
20
07
20
08
20
09
20
10
20
11
Global Annual Airline Traffic/RPMs Growth % Global Real GDP A
0
20
40
60
80
100
120
140
160
180
20
02
20
02
20
03
20
03
20
04
20
04
20
05
20
05
20
06
20
06
20
07
20
07
20
08
20
08
20
09
20
09
Jet fuel crack spread ($/barrel) WTI Crude Oil
Emerging &
Developing
Economies
Advanced
Economies
Page 5 of 30
pace demand are the growth opportunityo economic growth (Figure 1) as well ashigh fuel prices (Figure 2).
wC Analysis
20
12e
20
13e
20
14e
20
15e
20
16e
20
17e
nnual Growth %
20
10
20
10
20
11
20
11
20
12
($/barrel)

Aerospace Sectoral Structure
July 2012PwC Page 6 of 30
In regard to emerging market fleet expansion, the association between air traffic (a major demanddriver for aircraft and measured by Revenue Passenger Miles (RPM)) and global economic output hasactually increased over time. This is expressed by the correlations shown in Figure 3. As emerging &developing economies increase their share of global GDP it is reasonable that they would becomemore significant drivers of traffic growth. Yet the increase in correlation between the recent 20-yearperiod and the most recent ten-year period (0.28 to 0.79) is startling. As emerging countries grow,they manage to remove barriers to aviation and to consequently grow their air traffic. Marketoutlooks from OEMs such as Airbus and Boeing also provide support to the outlook for emergingeconomies as the primary driver of global traffic growth.
Figure 3: Correlations of growth in air traffic and real economic output
1991-2011 2001-2011
Global 0.53 0.77
Advanced Economies 0.54 0.65
Emerging & DevelopmentEconomies
0.28 0.79
Source: Airline Monitor, IMF, PwC Analysis
Emerging markets, in particular China, are seeking to benefit from this domestic growth by buildingout their own aerospace industries. Not all of these efforts are expected to be successful – e.g., RANDCorp is more optimistic about the Chinese regional jet (ARJ21) program than the narrowbodyprogram (C919) in the near-term1, however it is clear emerging markets are likely to play a moreimportant role in the production of aircraft in the future.
This rise in fuel prices and the sensitivity to environmental factors are forcing the industry to developinnovative ways to optimize the way how their products are designed, produced, services andoperated. Among the innovations are new material technologies. While composites are popular forspecific parts on newer programs (Boeing 787, Airbus A350 XWB, Bombardier CSeries), metals suchas aluminium-lithium alloys and titanium are attempting to close the performance gap.
This increase in competitive intensity is reflected in a forecast of growth in national aerospaceindustry output (Figure 4). Despite Canada’s relative importance in the global industry, the outlookfor aerospace-related economic output (i.e., value-added terms in 2005 prices) in this country is weakwhen compared to other leading countries and, based upon relative growth rates, we expect Canadato decline in this ranking by 2015. While this is only one broad measure of the economic impact, itdoes highlight the difficulty in maintaining national competitiveness, and decisions on sectorstructure must be made in light of these challenges.
1 http://www.uscc.gov/researchpapers/2011/RAND_Aerospace_Report[1].pdf

Aerospace Sectoral Structure
July 2012PwC Page 7 of 30
Figure 4: Expected growth in national aerospace output
Rank Nation 2010 share of global industryoutput %
2010-2015e CAGR %
1 United States 48.6% 6.1%
2 United Kingdom 9.2% 5.2%
3 Germany 6.2% 9.8%
4 Canada 5.7% 2.8%
5 France 5.4% 6.4%
6 Russia 4.0% 24.5%
7 China 3.3% 10.1%
8 Italy 2.7% 2.2%
9 Brazil 2.0% 5.1%
10 Singapore 1.4% 4.3%
Source: Oxford Economics, PwC Analysis

Aerospace Sectoral Structure
July 2012PwC Page 8 of 30
2 OEMs/Tier 1s
In this section, we examine where OEMs and Tier 1s are placing their R&D and manufacturinginvestments, and the potential for developed markets to remain attractive for future R&D investment.In addition, we demonstrate how the reduction in aerospace program suppliers is contributing tomore “Super Tier 1s” which have the propensity to select domestic suppliers and may deliverrelatively high economic benefits in terms of employment and taxes per manufacturing facility.
2.1 Trend in R&D and manufacturing investments
As stated in our introduction, it is not a secret that aerospace industry constituents in more developedmarkets have become more motivated to look at emerging markets for growth. Over time this hasinvolved placing more new R&D and manufacturing investments in these markets. PwC’s research onthe top 50 global A&D companies found that, over the last 12 years, these entities have publicallydisclosed incremental 54 R&D-oriented investments and 114 manufacturing investments outside oftheir home country. These numbers include both organic investments (primarily facilities) anddiscrete aerospace JVs for which the purpose could be identified. The numbers do not includeacquisitions.
As indicated in Figure 5, the absolute number of both manufacturing and R&D investments hasgrown significantly over the last 12 years.
The countries/regions to where this investment is being allocated, shown in Figure 6, aredemonstrative of the globalization of the sector. Approximately 60% of R&D investments by topcompanies in the sector have gone to emerging & developing countries (including the rows withboldfaced font), while over 70% of manufacturing investment has been made in these nations. China,from a manufacturing standpoint, and India, from an R&D standpoint, are the top destinations forthese new projects.
Figure 5: Investments by top 50 global A&D companies in international markets
Source: Company Reports, PwC Analysis
There were few manufacturing or R&D investments destined for Canada over this time period,however this is skewed somewhat by the relative size of the industry in Canada vs. the US and someEuropean countries. Despite the overall trend toward emerging market investment, the existence ofOEMs and other large sector constituents in advanced economies such the US, the UK and Western
2 2 1 3 2 36 7 9
6 497 5 9 6
36
7 7
13 18
12
21
0
5
10
15
20
25
30
35
2000 2001 2002 2003 2004 2005 2006 2007 2008 2009 2010 2011
Manufacturing R&D

Aerospace Sectoral Structure
July 2012PwC Page 9 of 30
Europe, does seem to attract manufacturing, and to a greater extent, R&D investment. For example,the US and the UK were both among the top 5 locations for R&D investment.
One case in point is the set-up of an Engineering center by Aerolia of France, and the announcementon June 28, 2012, to create a manufacturing site in Quebec. The rationale is driven by the motivationto be close to Bombardier as their customer for the Global 7000/8000 program, but also to establisha beachhead from which to serve more North American customers. .
Talent and intellectual property concerns are drivers of this disparity between the proportions ofR&D investment relative to manufacturing investment going toward advanced economies. Anotherdriver is that manufacturing in emerging & developing economies tends to present more significantcost advantages. While some of these emerging & developing economies seem destined to close thetalent gap as their education systems flourish, it is unlikely that intellectual property concerns willabate over the long-term, and these capital expenditure decisions will continue to be made in light ofa number of considerations, including cost, talent, growth and IP protection.
These trends support the thinking that larger aerospace companies may help anchor a domesticaerospace industry and contribute to its growth by attracting investment, though more likely as itconcerns R&D than manufacturing.
Figure 6: Research and manufacturing investment of top 50 global A&D companies bycountries/regions, 2000-2011, cumulative
Rank Country/ Region R&D Rank Country/Region
Manufacturing
1 India 12 1 China 23
2 United States 7 2 India 20
3 Russia 6 3 United States 15
4 United Kingdom 5 4 Mexico 10
5 China 4 5 Russia 9
Other 20 Other 37
Total 54 Total 114
Source: Company Reports, PwC Analysis
2.2 Aerospace program concentration
The aerospace industry is shifting its design and supply chain model toward a stronger reliance onTier 1s as integrators of fewer and more complete work packages. Figure 7 shows examples of oldervs. newer programs for Embraer, Rolls-Royce and Airbus. For each OEM, the number of suppliers innewer programs has decreased significantly. The decrease in number of suppliers means that the Tier1s/systems integrators are taking on a more important role as they focus on higher value tasks andjobs related to design, integration and pre-production work at sites controlled by Tier 1s anddisassociated from the sites of the OEM. They are also taking on a more important role in supplierselection.

Aerospace Sectoral Structure
JulyPwC
Figure 7: Program Concentration Comparisons – Tier 1 Integrators
Sou
2.3
To acom737;maj1s codow
SincsuppcomTiercancom
PwCdoesThiscounlimi
0
50
100
150
200
250
300
350
400
Embraer Rolls Royce Airbus Bombardier
2012Page 10 of 30
rce: Company Reports, airframer.com, PwC Analysis
OEM and Tier 1 work flow to domestic suppliers
ssess the impact of OEMs and Tier 1s on supplier selection, PwC reviewed key suppliers ofmercial narrow- and wide-body programs, including Bombardier’s CSeries; Boeing’s 787, 777 andAirbus’s A380, A350, A330 and A320; and COMAC’s C919. Our research indicates that the
ority of suppliers tend to be headquartered in the same nations as the respective downstream Tiermpanies. As shown in Figure 8, this was a much stronger association than with the ultimatenstream OEM.
e both OEMs and Tier 1s headquarter nations tended to have an association with that of theirliers, this suggests some domestic supplier preference. In addition, the closer match of Tier 1
panies with their suppliers as it pertains to headquarter nation supports the rationale that these1s are particularly important in supplier selection. However it should also be noted that OEMs
contribute to growth in the domestic supply chain through their potential to spin-off Tier 1panies (e.g., Boeing/Spirit Aerosystems and Airbus/Aerolia/Premium Aerotech).
’s analysis of newer programs (e.g., 787) versus older/more established programs (e.g., 737)n’t indicate a difference over time in terms of greater domestic preference in supplier selection.is likely due to globalization and the attendant development of aerospace suppliers in moretries. However Tier 1s will likely be able to play a role in offsetting this globalization effect to a
ted degree on future programs due to their propensity to choose domestic suppliers.
350
<40
250
140
75<50
150
70
~130
~30
EM
B14
5
EM
B17
0/1
90
Tre
nt
50
0
Tre
nt
90
0
Tre
nt
100
0
Tre
nt
XW
B
A3
30
A3
50
CR
J7
00
/90
0/1
00
0
Cse
ries

Aerospace Sectoral Structure
July 2012PwC Page 11 of 30
Figure 8: OEM vs. Tier 1 upstream supplier selection
Source: Company Reports, PwC Analysis
In regard to the Bombardier CSeries program, a review of program suppliers listed on airframer.comindicates that roughly 7% of suppliers (where the country could be identified) have their headquartersin Canada. Of course, many of these companies perform work in nations other than theirheadquarters country so at least some of these non-Canadian suppliers do have a foreign ownedsubsidiary in Canada. Some examples of such companies include C&D Zodiac (interior supplier) andPratt & Whitney Canada (engine supplier). Several of the Canadian headquartered companies supplydesign and technical consulting services. Another factor is that Bombardier is also a supplier tothemselves with locations such as Belfast that is the composite design centre of excellence. With thesequalifications, it is worth noting that the 7% figure is a lower percentage than other aerospaceprograms which suggests to consider, at least as it concerns the CSeries program, that there may berelatively lower incremental economic benefit flowing from the OEM through the program suppliersin Canada.
2.4 Economic benefits by aerospace segment
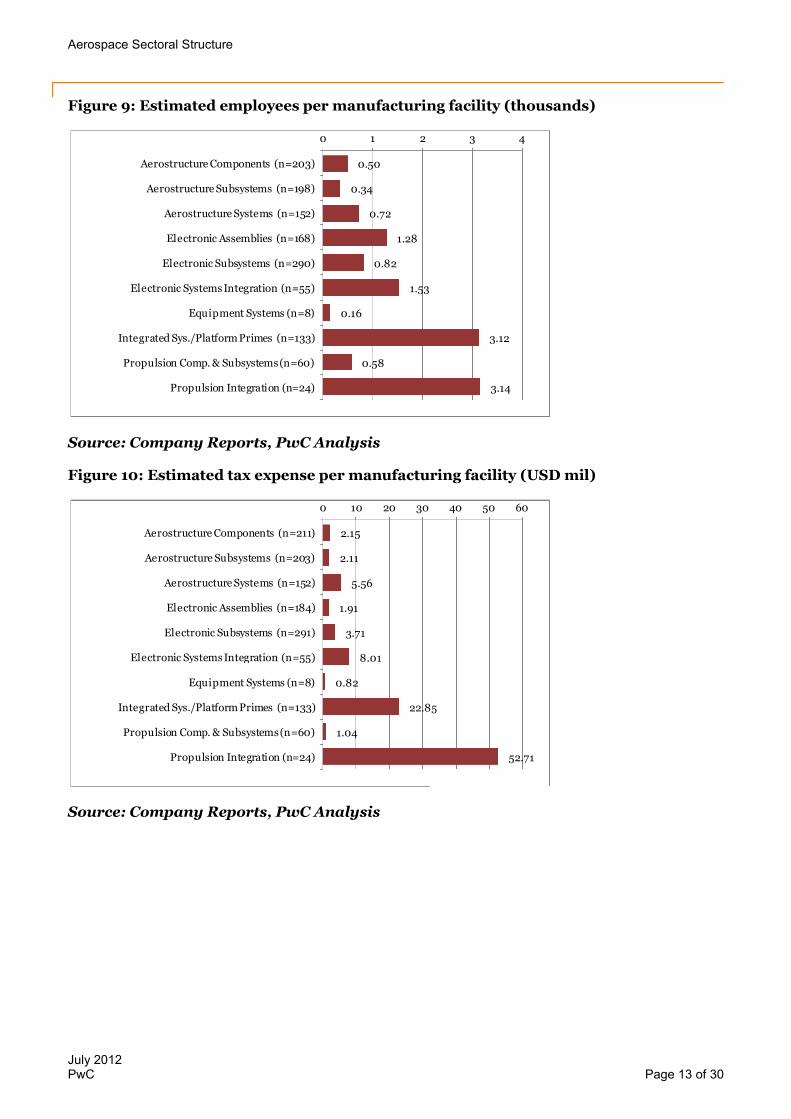
In order to establish which segments of the aerospace industry offer the highest economic benefits,PwC has conducted research using information from the most recent fiscal year on over 1,300aerospace manufacturing facilities globally to develop estimate of employees and tax expense on a permanufacturing facility basis2; these are shown in Figures 9 and 10, respectively. The number ofobservations (“n”) for which data was available is indicated in each chart. Averages of this per facilitydata were taken for the following aerospace industry segments:
Aerostructure Components
Aerostructure Subsystems
2 The per manufacturing facility allocation of total employment and tax expense (the total tax expense aspublished in the companies’ income statement) for companies involved in the aerospace industry wasestimated using a revenue-weighted method: (1 / number of aerospace manufacturing facilities for eachaerospace-related business segment) * (aerospace-related business segment revenue / total company revenue).This per manufacturing facility allocation was then multiplied by total company employment and total companytax expense to arrive at estimates of employment per facility and tax expense per facility, respectively.
31%
52%
69%
48%
0% 20% 40% 60% 80% 100%
OEM
Tier 1
OEM or tier 1 country matchessupplier OEM or tier 1 country does not match supplier

Aerospace Sectoral Structure
July 2012PwC Page 12 of 30
Aerostructure Systems
Electronic Assemblies
Electronic Subsystems
Electronic Systems Integration
Equipment Systems
Integrated Systems/Platform Primes
Propulsion Components & Subsystems
Propulsion Integration
Some factors that can impact employment and taxes for a given manufacturing facility, such asvariations in labor intensity and local tax law, were not able to be accounted for in this analysis.However, while this manufacturing facility analysis is not an answer in itself, the samples are suitablefor indicative purposes. Of particular interest is that OEMs and systems integrators (i.e., IntegratedSys./Platform Primes, Propulsion Integration and Electronic Systems Integration) have the highestestimated employees and tax expense per manufacturing facility.
This process was also conducted to find average profit margins for these manufacturing facilities(Figure 11). There was less variation among aerospace industry segment profit margins relative toemployment and tax expense, however it is noteworthy that the systems integrators tend to earnabove average profit margins.
These results suggest that economic impacts and financial returns among these companies tended tobe higher than in other parts of the industry. In particular, Propulsion Integration, an area whereintellectual property concerns can help insulate employment in mature markets, scores particularlyhigh on all three metrics, and maintaining/attracting this investment may be a priority. We also notethat the propulsion integrators tend to have significant aftermarket businesses which can influenceresults relative to other segments of the aerospace sector.
Aerospace Sectoral Structure
July 2012PwC Page 13 of 30
Figure 9: Estimated employees per manufacturing facility (thousands)
Source: Company Reports, PwC Analysis
Figure 10: Estimated tax expense per manufacturing facility (USD mil)
Source: Company Reports, PwC Analysis
0.50
0.34
0.72
1.28
0.82
1.53
0.16
3.12
0.58
3.14
0 1 2 3 4
Aerostructure Components (n=203)
Aerostructure Subsystems (n=198)
Aerostructure Systems (n=152)
Electronic Assemblies (n=168)
Electronic Subsystems (n=290)
Electronic SystemsIntegration (n=55)
Equipment Systems (n=8)
Integrated Sys./PlatformPrimes (n=133)
Propulsion Comp. & Subsystems(n=60)
Propulsion Integration (n=24)
2.15
2.11
5.56
1.91
3.71
8.01
0.82
22.85
1.04
52.71
0 10 20 30 40 50 60
Aerostructure Components (n=211)
Aerostructure Subsystems (n=203)
Aerostructure Systems (n=152)
Electronic Assemblies (n=184)
Electronic Subsystems (n=291)
Electronic Systems Integration (n=55)
Equipment Systems (n=8)
Integrated Sys./Platform Primes (n=133)
Propulsion Comp. & Subsystems(n=60)
Propulsion Integration (n=24)

Aerospace Sectoral Structure
July 2012PwC Page 14 of 30
Figure 11: Estimated segment profit margin
Source: Company Reports, PwC Analysis
12.8%
18.8%
16.0%
5.7%
14.0%
13.6%
8.3%
5.5%
14.5%
14.5%
0% 5% 10% 15% 20%
Aerostructure Components (n=211)
Aerostructure Subsystems (n=203)
Aerostructure Systems (n=152)
Electronic Assemblies (n=141)
Electronic Subsystems (n=287)
Electronic SystemsIntegration (n=54)
Equipment Systems (n=8)
Integrated Sys./PlatformPrimes (n=129)
Propulsion Comp. & Subsystems(n=49)
Propulsion Integration (n=24)

Aerospace Sectoral Structure
July 2012PwC Page 15 of 30
3 Small and Medium Enterprises (SMEs)
3.1 SMEs vs. Large Companies
To assess the role and contribution that SME’s play, PwC built a sample of 217 global aerospace SMEs(defined as companies with less than 500 employees) and 70 large aerospace companies (companieswith at least 500 employees).
For the time period 2008 through 2011, SME revenue and number of employees generally grew at afaster pace than larger companies (Figure 12). In addition, SME revenue growth and employment haspicked up notably in the last few years. This seems reasonable as smaller companies tend to be moreresponsive to the business environment and the global economy has been recovering from a financialcrisis-induced recession. However the large decline in SME employment in 2009 provides a goodreminder that smaller companies tend to be less capable of withstanding downturns than their largerindustry brethren. It should also be noted that survivor bias –sample results can be skewed by poorperforming companies falling out of the dataset over time – is one factor which may make SMEperformance look somewhat better in comparison.
Figure 12: Aerospace industry large vs. SME revenue and employment growth
Source: Capital IQ, PwC Analysis
Other sources also support – at least directionally - the conclusion that aerospace SMEs tend to havehigher growth rates. As shown in Figure 13, a study by the European Commission indicates thataerospace SMEs in Spain (defined as companies with less than 250 employees) grew revenue far inexcess of large companies between 1998 and 2008.3 In fact, during this ten-year period, SMEs grewfaster than larger firms on a percentage basis in seven years, and grew revenue on average 24.7% vs.10.4% over the entire period.
3 Competitiveness of the EU Aerospace Industry -http://ec.europa.eu/enterprise/sectors/aerospace/files/aerospace_studies/aerospace_study_en.pdf
-20%
-15%
-10%
-5%
0%
5%
10%
15%
20%
25%
30%
2008 2009 2010 2011
SMEs Revenue Growth Large Co. Revenue Growth
SMEs Employment Growth Large Co. Employment Growth

Aerospace Sectoral Structure
July 2012PwC Page 16 of 30
Figure 13: Spain aerospace large vs. SME revenues (millions EUR)
Source: European Commission
3.2 Challenges for SMEs
While aerospace SMEs play an important supporting role to larger industry constituents, they facemany difficulties. The following are some examples of these challenges:
Competition from low cost countries’ manufacturers (outsourcing): There has been atrend of outsourcing component manufacturing to low cost countries to drive cost savings by OEMsand Tier 1,2,3 suppliers. The beneficiaries have been companies in emerging economies like Indiaand China, Mexico and Morocco. For example, Italy has had an industrial backbone of smallerenterprises but has also lost much of its competitiveness in recent years because of high labor costs.In particular, the lower value metallic or carbon-fiber structure production tasks performed bySMEs are being shifted to lower-cost countries.
Requirements to invest in emerging market SMEs: In addition to labor cost advantages, theoffset requirements of certain high growth countries like India and China have forced the OEMsand other suppliers to source more components from local suppliers. So OEMs and top-tiersuppliers are gaining exposure to these countries by establishing partnerships/JVs with smallerfirms and in the process are playing a part in the growth of SMEs in these countries. For example,countries like India provide an incentive to SMEs by allowing foreign vendors to select micro, smalland medium enterprises (MSMEs) as their offset partners by introducing a multiplier of 1.5 for alloffsets discharged through them.4
Challenges for arranging for financing in difficult economic/industry conditions:During the economic downturn of 2008-09, credit was unavailable or made available only at highcost for smaller firms, which resulted in difficulty in financing their working capital requirements.This has been acknowledged by Airbus which set up funds to strengthen the financial viability ofthese companies in the value chain. Also, program delays and accelerated ramp-ups in largeprograms require financially robust SMEs that can cushion such fluctuations. Availability of capitalis one area in which Canada appears to be advantaged, across all industries, relative to other largedeveloped and emerging economies. Figure 14 contains country rankings of ease of obtaining publicequity, bank and venture capital financing. Canada ranks at or near the top of this list of includedcountries.
4 http://www.thaindian.com/newsportal/business/revised-defence-offsets-policy-will-encourage-indian-sme-sector_100616740.html
-20%
-10%
0%
10%
20%
30%
40%
50%
60%
70%
80%
1999 2000 2001 2002 2003 2004 2005 2006 2007 2008
SME Revenue Growth
Large Company Revenue Growth

Aerospace Sectoral Structure
July 2012PwC Page 17 of 30
Figure 14: Country ranking of capital availability (out of 139 countries surveyed)
Local equitymarket
financing
Ease of access tobank loans
Venture capitalavailability
Brazil 45 65 60
Canada 8 24 19
China 52 51 27
France 6 35 32
Germany 49 69 52
India 10 39 31
Italy 73 113 104
Japan 24 46 49
Russia 107 107 95
Spain 81 85 58
United Kingdom 32 74 38
United States 36 34 13
Source: World Economic Forum, PwC Analysis
Difficulty in adapting to changing technologies/new materials: The general challenge ofobtaining funding is accentuated by the fact that the aerospace sector is in the midst of atremendous change in the use of materials in aircraft. It is also noteworthy that the cost of access tonewer aerospace programs is increasing with requirements for more advanced information systemsthat enable the complex, concurrent design work and supply chain synchronization, andcompliance to the OEM’s product and process specifications. This means that the bar in terms ofcapital requirements is increasing for SMEs in all countries. SMEs have to adjust to new technologydemands of their customers, which present both opportunities and threats. In particular, compositematerials are being used in more aircraft frames, and third-generation aluminium alloys andtitanium are emerging as additional substitutes. While these new materials offer the promise oflighter aircraft, higher fuel efficiency, and greater resistance to corrosion, they also requiresubstantial new R&D investments to develop knowledge of the best practices for manufacture andmaintenance. SMEs with more limited financial resources face a challenge in profitably adapting tothis changing environment.
High R&D investments/long gestation period: The aerospace sector is a high-tech industryand companies have to keep innovating to be able to keep up with the competition. Within theaerospace sector, many R&D investments are considered high risk because it can take 10-15 yearsfor a new aircraft to move from conception to test flight to sales and a higher portion of aerospacesuppliers have to make R&D investments up front. The long product development cycles inaerospace make R&D projects extremely risky and particularly sensitive to economic downturns

Aerospace Sectoral Structure
July 2012PwC Page 18 of 30
that affect aircraft sales. Consequently, private sector sources of financing are not always receptiveto accepting these risks. As a result, the level of R&D expenditures would be lower in the absence ofgovernment support.5 Within aerospace, high-tech SMEs face additional challenges in obtainingfunding to support their R&D investments. It is generally accepted that SMEs with high R&Dexpenditures tend to have greater external financing needs than other SMEs. These SMEs are alsomore likely to be turned down by financial institutions because they represent a higher risk thantheir peers who have lower levels of expenditures on research and development.6
OEM preference for fewer direct suppliers: Primary OEMs are increasingly seekingpartnerships with small groups of Tier I suppliers to develop and integrate better turn-key systemssolutions. This approach, pioneered by automotive OEMs in the early 1990s, has been adapted byaerospace. For example, Embraer. Bombardier and Boeing utilize supply chain models whichemphasize Tier 1 roles, and Airbus is headed in this direction with its Power8 restructuringprogram and supply chain practices on the A350XWB. Increasingly, Tier I suppliers are assumingmore responsibility for supply chains and the selection of Tier II and Tier III suppliers. So, as thelarger firms move into aerospace system integration, lower-tier firms have little choice but toglobalize themselves to remain competitive.
3.3 SME performance by segment
Out of the 217 SMEs in our sample (not all of which had released necessary revenue data),approximately 65% of the firms are component & equipment manufacturers, and 16% of the firms areMRO providers. These two sub-sectors exhibited high growth rates in revenue in the last 5 years(Figure 15).
Figure 15: SME revenue growth by category, 2007-2011 CAGR
Source: Capital IQ, PwC Analysis
MRO revenue growth rates benefitted during the recession from relatively inelastic demand. Outsideof MRO, component and equipment SMEs have reported the highest growth rate, though growth of
5 http://www.ic.gc.ca/eic/site/ae-ve.nsf/eng/03502.html6 http://www.sme-fdi.gc.ca/eic/site/sme_fdi-prf_pme.nsf/vwapj/FinInnoSMEs-FinPMEinno_eng.pdf/$FILE/FinInnoSMEs-FinPMEinno_eng.pdf
9%
-5%
8%
4%
2%
-10% -5% 0% 5% 10%
MRO (n = 8)
Systems (n = 4)
Components andequipment (n = 56)
Electronics (n = 17)
Not classified (n = 2)

Aerospace Sectoral Structure
July 2012PwC Page 19 of 30
component manufacturers have varied significantly within this category. We have focused onopportunities in these two categories below.7
SME Components & Equipment ManufacturingLooking forward, SMEs that manufacture standard specification components in developed countrieswith a mature aerospace market are most at a risk of being replaced by SMEs at low cost countries.Aerospace SMEs with specialized technologies & products are needed within the supply chain tocollaborate with higher level suppliers in the development of new products. Such SMEs have to belocated in places where they can work with higher level suppliers in new product development. SMEscan also benefit from government incentives/support towards development of new product ortechnology for a program if they are located in the same country. However, innovative SMEs havegreater capital needs than non-innovative ones which make it more critical to obtain financing. Eventhough Canada ranks highly as it pertains to the ease of obtaining new capital, the abundance ofgovernment sponsored R&D programs in other countries means that it is important for Canada to becompetitive in its support of innovative SMEs.
Europe and the US have many of these aerospace programs that provide direct support for research& development. These programs extend beyond basic research and into industrial research and pre-competitive development, and some examples include:
At the European Union level, there is the Clean Sky Joint Technology Initiative.8
At the national level in Europe, there are programs like Germany's Federal Aeronautical ResearchProgram which provides grants. The United Kingdom has the National Aerospace TechnologyStrategy and the Netherlands has the Civil Aircraft Development Program. France’s Aerofund usescapital contributions from OEMs to support SMEs.9 Austria, Italy, Spain and Sweden all alsoprovide various combinations of grants, loans, and contracts to support their national aerospaceindustries.
In the United States, the government supports research and development through defenceprograms and government contracts which are also pertinent to the commercial aerospace industry.United States’ SBIR (Small Business Innovation Research) program helps make sure that thenation's small, high-tech and innovative businesses are a significant part of the US Government'sresearch and development efforts.10
Canada also has several existing R&D programs that can support SMEs, including: Canada’s Strategic Aerospace and Defense Initiative (SADI): SADI contributes to R&D projects by
companies entering into partnerships with academia and/or research institutions. SADI alsosupports companies undertaking R&D with international collaboration.
MACH Initiative in Canada: The MACH Initiative, launched in 2010, is a program for acceleratingQuébec’s aerospace supply chain performance. It provides SMEs with a common framework ofmethodologies, tools and techniques and an educational program to improve their capability acrosskey processes and areas. Participating SMEs are mentored by client OEMs in order to attaincertifications, which generate more visibility and new business opportunities for SMEs.
SME MROThe aerospace industry spends more annually on MRO parts and services on average than onmanufacturing or development activities. Given the labor-intensive nature of MRO, several leadingMRO companies, OEMs and international airlines have outsourced heavy maintenance work to lowcost countries.11
7 While MRO is not considered to be part of the industry for the purposes of this project, we have brieflyexamined SME MRO due to its relatively high historical growth.8 http://www.cleansky.eu/content/homepage/about-us9 http://www.airbus.com/presscentre/pressreleases/press-release-detail/detail/aerofund-ii-75-million-euros-fund-for-the-aeronautical-sector/10 http://rd-review.ca/eic/site/033.nsf/vwapj/sub085.pdf/$file/sub085.pdf11 http://www.pwc.com/gx/en/aerospace-defence/pdf/india-aerospace.pdf

Aerospace Sectoral Structure
July 2012PwC Page 20 of 30
In developing markets MRO labor costs are approximately $45 to $55 per hour compared with $90 to$100 per hour in developed markets. Additionally, MRO activity will be easier to outsource to low-cost centers as major network hubs develop in Asia-Pacific and Latin America. Aviation hubs likeSingapore have also been the preferred locations for investments in the MRO, and approximately90% of Singapore’s aerospace sector is in the MRO segment.12
According to Aerostrategy, as of 2010 the MRO market was concentrated in North America (32% ofmarket) and Europe (30%). However, over the next decade, growth in MRO market is expected to bedriven by India, China and Middle East.13 Also, the highest number of new investments in MROsegment from 1990-2009 have happened in the US (as 70% of business jet fleet resides there), China,Singapore and UAE.
Hence, MRO SMEs may perform better in countries with high aircraft growth rates or in aviationhubs like Middle-East and Singapore, but perhaps less so in countries such as Canada.
3.4 SME conclusion
SMEs help develop the aerospace industry in a region as they can be important suppliers ofcomponents to Tier 1,2,3 suppliers. However, much of the growth of SMEs in the aerospace sector isexpected to happen in low cost/emerging economies like India and China in order to save on costs.
Similar to the consolidation of Tier 1s forced by the OEM’s, we expect significant consolidation at thelower tiers as a delayed consequence. Development of large Tier 1 integrators is likely to be moreimportant than SMEs on the basis of growth potential. However, SMEs involved in the R&D of newertechnologies and products may drive high long-term growth within the industry, as they can be moreinsulated from offshoring, and may become large suppliers over the long-term.
12http://www.aiac.ca/uploadedFiles/Resources_and_Publications/Reference_Documents/AIAC%20Phase%203%20Report_FINAL.pdf13 http://events.aviationweek.com/html/mro11/MRO%20US%20-%204.12%20-%20230pm%20-%20D129%20-%20Michaels%20(for%20electronic%20distribution).pdf
Aerospace Sectoral Structure
July 2012PwC Page 21 of 30
4 Aerospace clusters
4.1 Background on economic clusters
Volumes of literature attempt to define the structure, role and impact of economic clusters datingback to Alfred Marshall's "Principles of Economics"14, which defines three main criteria necessary forthe establishment of a successful cluster: a pool of adequate labor, the existence of specializedsuppliers, and the possibility of external spill-overs, or transfer of mutually beneficial resources andknow-how within the cluster. Today, one of the most recognized contributors to cluster theory isMichael Porter15, who defines such clusters as “geographically proximate group of companies andassociated institutions in a particular field, linked by commonalties and complementarities”.
Ketel16 expands Porter's definition of clusters by suggesting that companies in a cluster share fourcritical characteristics: 1) proximity – as they need to share the same common resources and to allowpositive spillovers; 2) linkages – their activities need to share a common goal; 3) active interactionsbetween the firms inside the cluster; 4) critical mass – only a significant number of participants has amajor impact on the companies’ performance. Doeringer and Terkla point out that the dynamicdevelopment of clusters depends on "either historical accident or the cost advantages provided byimmobile factors that attracted the firms anchoring the cluster.”17
Understanding the current stage of local economic competitiveness: factor-driven economy,investment-driven economy or innovation-driven economy, can help local governments craft betterstrategies and supporting policies for fostering clusters. Factor-driven clusters are very similar toSmith's absolute advantage where the cluster/economy is driven by the presence of a certain naturalresource. Investment-driven clusters can also relate to the idea of absolute advantage, where thecluster/economy is driven by the lower cost of operations. Innovation-driven economies, such asCanada, relate to the theories of comparative advantage, where the cluster/economy is fueled byadvancements in technology, human capital and industry know-how. Government policy aroundaerospace clusters must be made in the context of this economic backdrop in order to yield thehighest economic benefits possible.
4.2 Economic benefits of economic clusters
The economic benefits of clusters, along with the impact of local policy-making, have been discussedvastly in the cluster literature as well. The symbiotic subsistence of companies that operate in anindustry within a certain geographic region has proven to bring economic benefits not only for thecompanies themselves, but also for the specific region in which they are located.
Because of their close proximity to competitors, customers, and suppliers, clusters promoteefficiencies, specialization, product improvements and innovation, all of which give companies in thecluster a competitive edge over their peers. Furthermore, since clusters tend to possess greater needsand requirements for more talent and information, they also tend to attract higher levels of researchand development.
14 Adrian T.H. Kuah, “Cluster Theory and Practice: Advantages for the Small Business Locating in a VibrantCluster,” Journal of Research in Marketing and Entrepreneurship Vol 4, Issue 3, 200215 Michael E. Porter, “Clusters and the New Economics of Competition,” Harvard Business Review Nov-Dec199816 Christian H.M. Ketels, “From Clusters to Cluster-based Economic Development,” International Journal ofTechnological Learning and Development Vol 1, Issue 3, 200817 http://ezinearticles.com/?Prospects-And-Challenges-For-Cluster-Development&id=787223

Aerospace Sectoral Structure
July 2012PwC Page 22 of 30
This often results in close cooperation for industry-specific knowledge exchange and collaborationbetween Tier 1 companies in the cluster and local academic and research institutions. As a result,such local academic institutions get engaged in cluster-sponsored projects, industry-specific researchstudies, and/or new academic/training programs that satisfy the know-how and talent needs of thecompanies within the cluster.
As noted by Niosi and Zhegu18, due to the enormous human and financial capital invested in clusters,such relationships reshape the local communities and tend to be long-term in nature. Porter alsoemphasizes that a nation’s ability to produce high-value products and services depends on theexistence of such "regional hubs of competitiveness and innovation."
In this section we briefly highlight the characteristics and economic benefits of the aerospace clustersin the Seattle, Washington, Toulouse, France (Aerospace Valley World Competitiveness Cluster), SaoJose dos Campos, Brazil, and Montreal, Canada regions.
4.3 Aerospace Cluster examples
Seattle, Washington cluster
The Washington aerospace industry is focused predominantly on large aircraft assembly forcustomers in the rest of the United States and foreign countries. Along with major OEMs such asBoeing, there are more than 40 composite companies in Washington; including Hexcel, CompositeSolutions, Toray, Triumph, and Janicki Industries. The US economy's innovation-driven characterdictates that the aerospace clusters established in the US rely on technological advancements, know-how, talent, and R&D. These companies within the aerospace cluster of Washington do not tend tobenefit from cheap labor or manufacturing costs.
A number of local programs foster the innovation-driven aerospace cluster. As shown in Figure 16,these programs are expected to contribute to average annual aerospace industry employment growthof 2.7% for the period 2012-2015.
18 Jorge Niosi and Majlinda Zhegu, “Aerospace Clusters: Local or Global Knowledge Spillovers?,” Industry andInnovation Vol 12, No 1, March 2005

Aerospace Sectoral Structure
July 2012PwC Page 23 of 30
Figure 16: Washington state aerospace employment
Source: Washington State Economic and Revenue Forecast Council, WashingtonState Employment Security Department
Further evidence of the economic benefits of aerospace clusters in the Washington area can be seenby examining the average wages earned by aerospace employees versus the average wages inWashington State. As can be seen in Figure 17, despite slight volatility in the total aerospaceemployment numbers, the average wages paid in the industry 1) continue to be on the upwardtrajectory, and 2) far exceed the average Washington State compensation for any of the examinedperiods.
Figure 17: Washington aerospace industry performance
AerospaceFirms
AerospaceEmployment
(000)
TotalIndustry
Wages ($ bil)
AverageAnnual Wages
($ 000)
Average WAWages($ 000)
2006 174 74.5 6.7 89.9 42.9
2007 201 82.4 7.1 86.0 45.0
2008 183 84.0 7.3 87.2 46.6
2009 179 84.1 7.4 87.8 47.5
2010 179 81.9 7.5 91.4 48.5
Source: Washington State Employment Security Department
In addition to the direct effects on the local economy, aerospace clusters create, support and foster anumber of jobs in other sectors such as retail and construction. Multipliers are often applied toestimate the total economic impact, direct and indirect, of an activity. Based on previous studies, theWashington aerospace wage and salary employment multiplier is 3.2, implying that each aerospacejob indirectly supports 2.2 other jobs in the state (this is higher than the US national estimatedaerospace employment multiplier of 2.5 which is supportive of the benefits of clusters). Thus, the
2.3%
2.4%
2.5%
2.6%
2.7%
2.8%
2.9%
3.0%
70
75
80
85
90
95
2008 2009 2010 2011 2012e 2013e 2014e 2015e
Aerospace employment (left-axis, thousands)
% of Total WA Employment (right-axis)
Aerospace Sectoral Structure
July 2012PwC Page 24 of 30
total impact of the state aerospace industry, including aerospace clusters, in 2010 was to support262,358 jobs.
Toulouse, France (Aerospace Valley World Competitiveness cluster)
Similar in its origins and anchoring around a major OEM, the Toulouse cluster is established aroundthe presence and operations of Airbus. The region is a part of the Aerospace Valley WorldCompetitiveness Cluster, which allies the Midi-Pyrenees & Aquitaine regions to constitute one ofEurope’s major jobs providers.
According to the GIFAS, the French aerospace, defense and security electronics industry hasemployed over 162,000 individuals in 2010, up 3.2 percent from 2009. The Aerospace Valley WorldCompetitiveness cluster itself is accountable for generating approximately 120,000 industrial jobsthrough its 1,600 establishments. In addition to those directly employed in the aerospace industry,the cluster was also responsible for the employment of over 8,500 researchers in 2010.
The cluster also provides some of the best paying jobs in France due to its heavy reliance on a moretalented workforce. The majority of the positions are filled by engineers and management personnel.Such activities promote the health of the local economy by providing higher-compensation jobs but,even more importantly; these positions contribute to local academic programs. French aerospacecompanies also invest more than 15% of their revenue in R&D activities, spurring growth in the publicand private R&D expenditure, and providing employment for 15,000 employees, including 13,000research scientists.
Sao Jose dos Campos, Brazil cluster
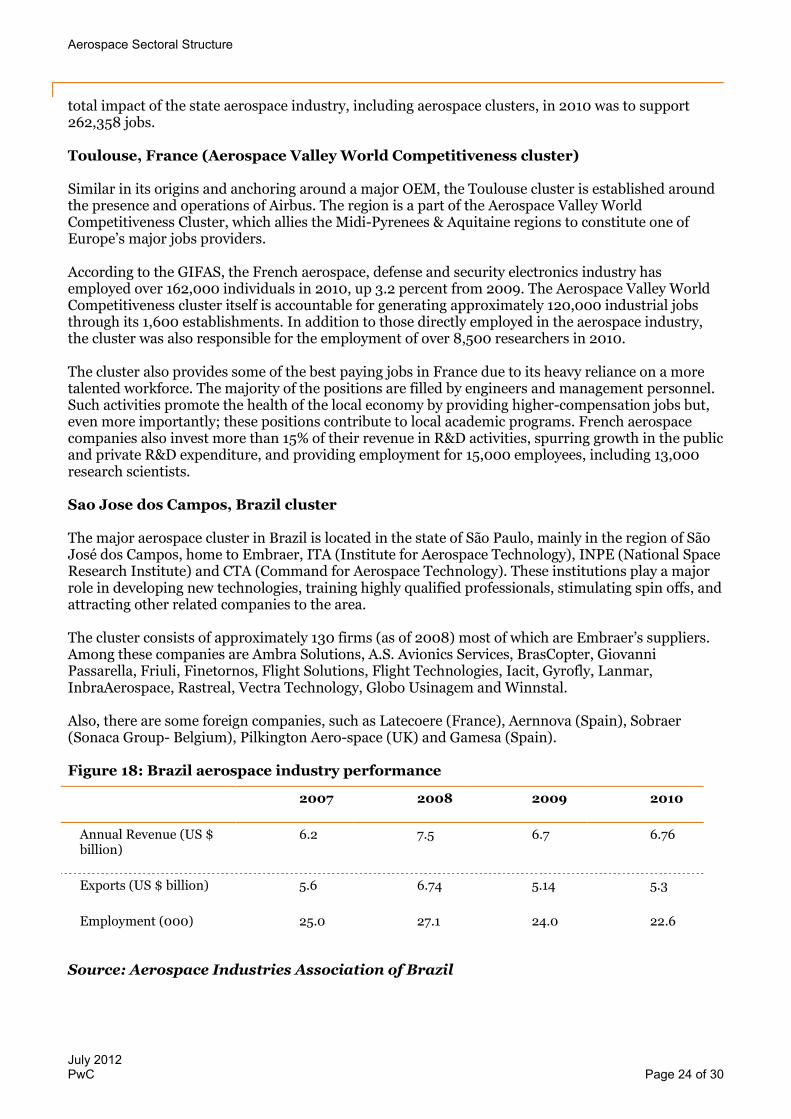
The major aerospace cluster in Brazil is located in the state of São Paulo, mainly in the region of SãoJosé dos Campos, home to Embraer, ITA (Institute for Aerospace Technology), INPE (National SpaceResearch Institute) and CTA (Command for Aerospace Technology). These institutions play a majorrole in developing new technologies, training highly qualified professionals, stimulating spin offs, andattracting other related companies to the area.
The cluster consists of approximately 130 firms (as of 2008) most of which are Embraer’s suppliers.Among these companies are Ambra Solutions, A.S. Avionics Services, BrasCopter, GiovanniPassarella, Friuli, Finetornos, Flight Solutions, Flight Technologies, Iacit, Gyrofly, Lanmar,InbraAerospace, Rastreal, Vectra Technology, Globo Usinagem and Winnstal.
Also, there are some foreign companies, such as Latecoere (France), Aernnova (Spain), Sobraer(Sonaca Group- Belgium), Pilkington Aero-space (UK) and Gamesa (Spain).
Figure 18: Brazil aerospace industry performance
Source: Aerospace Industries Association of Brazil
2007 2008 2009 2010
Annual Revenue (US $billion)
6.2 7.5 6.7 6.76
Exports (US $ billion) 5.6 6.74 5.14 5.3
Employment (000) 25.0 27.1 24.0 22.6
Aerospace Sectoral Structure
July 2012PwC Page 25 of 30
As it pertains to economic benefits, the cluster contributes to jobs for over 20,000 people in theregion (Figure 18).
Montreal, Quebec, Canada cluster
Canada’s aerospace sector is robust and dynamic; exports account for 80 percent of the industry’s annualrevenues of more than $22 billion. Canadian aerospace firms have a long history of innovation and globalsuccess, and are suppliers of choice in the global supply chains of leading brands such as Boeing, Airbus,Bombardier and Embraer.With its highly skilled workforce and integrated supply chains, Canada’saerospace industry supplies one-third of global demand for small gas-turbine engines and enjoys a70% share of the global market for visual simulators.
The Quebec aerospace industry cluster contains close to 160 companies, which generated over $9.6billion in revenues in 2010. Similar to the other aerospace clusters referenced above, the Quebecaerospace cluster tends to be innovation-driven, with Bombardier,CAE and Heroux-Devtekheadquartered there. Global Original Equipment Manufacturers (OEMs) and Tier 1 suppliers such asPratt & Whitney Canada, Bell Helicopter Textron Canada, CMC Electronics, Messier-Dowty,andRolls-Royce Canada all have operations in Quebec as well.
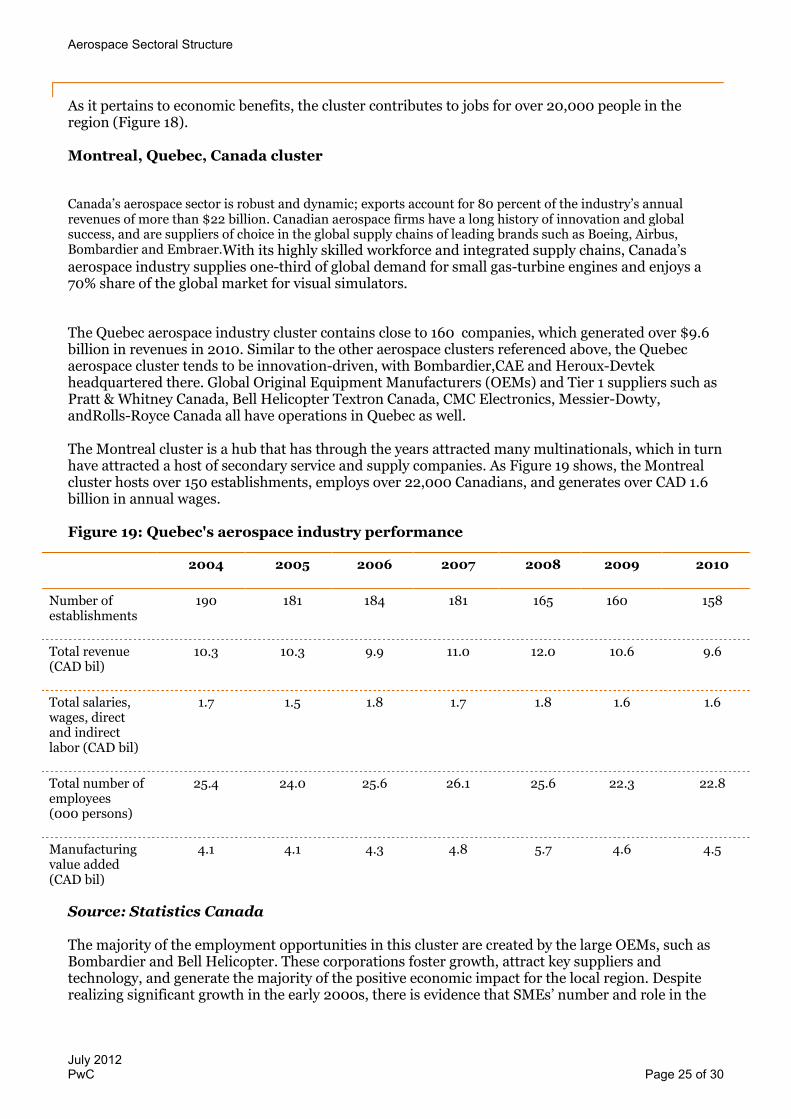
The Montreal cluster is a hub that has through the years attracted many multinationals, which in turnhave attracted a host of secondary service and supply companies. As Figure 19 shows, the Montrealcluster hosts over 150 establishments, employs over 22,000 Canadians, and generates over CAD 1.6billion in annual wages.
Figure 19: Quebec's aerospace industry performance
Source: Statistics Canada
The majority of the employment opportunities in this cluster are created by the large OEMs, such asBombardier and Bell Helicopter. These corporations foster growth, attract key suppliers andtechnology, and generate the majority of the positive economic impact for the local region. Despiterealizing significant growth in the early 2000s, there is evidence that SMEs’ number and role in the
2004 2005 2006 2007 2008 2009 2010
Number ofestablishments
190 181 184 181 165 160 158
Total revenue(CAD bil)
10.3 10.3 9.9 11.0 12.0 10.6 9.6
Total salaries,wages, directand indirectlabor (CAD bil)
1.7 1.5 1.8 1.7 1.8 1.6 1.6
Total number ofemployees(000 persons)
25.4 24.0 25.6 26.1 25.6 22.3 22.8
Manufacturingvalue added(CAD bil)
4.1 4.1 4.3 4.8 5.7 4.6 4.5

Aerospace Sectoral Structure
July 2012PwC Page 26 of 30
cluster have been deteriorating. Potential reasons for this trend include outsourcing and offshoring ofnoncritical business functions to nations with cost advantages.

Aerospace Sectoral Structure
July 2012PwC Page 27 of 30
4.4 Aerospace clusters and globalization
Globalization is likely to change the nature of aerospace clusters. The advantages of aerospaceclusters are not just in their geographic location but rather in the high concentration of suppliers,partners, customers, government and educational institutions. Such complex structures take years todevelop and for innovation-driven economies the competitive edge they provide is in the areas ofhuman talent, know-how, R&D, and innovation. It will not be easy for many emerging markets toreplicate this.
Firms can and should use global sourcing to reduce input-cost disadvantages; however, this doesnot diminish the spill-over effects of the expertise, innovation and know-how that think tanks,academic and public institutions, makers of complementary products, or suppliers in the cluster canprovide and experience. What is also worth noting is that the aerospace industry has always beenvery global in nature - its final products are distributed all over the world; a large portion of theassembly is rather standardized; and it serves end markets (airlines) that are squeezed between softdemand and increasing operations (fuel) costs.
To this end, most aerospace clusters can be categorized into groups such as the following: OEM clusters – mature and OEM-centered – e.g., Quebec, Canada; Washington, US Large supplier clusters – mature with high supplier technical ability – e.g., Nagoya, Japan MRO clusters – high traffic regions – e.g., UAE, Singapore Emerging market clusters – high growth and/or low cost – e.g., Nanjing/Shanghai/Suzhou,
China; Mexico
The first two of these groups generally can be found in innovation-driven developed economies(which focus on technology, human capital and knowledge). The latter two tend to be found ininvestment-driven emerging market economies (where low cost of labor is an advantage).
These aerospace clusters may evolve somewhat over time, as various national aerospace industriesstart new aircraft programs and thereby foster OEMs. For example, Japan developing is developingthe Mitsubishi Regional Jet while China is working on the C919 narrowbody and ARJ21 regionalaircraft.
A dense cluster, with high concentration, is where its true economic benefits show, and theglobalization of supply chains not only does not diminish those effects, but just the opposite - it canenhance the competitive advantage of firms in the cluster. This is not to say that globalization hasnot changed aerospace clusters. It is evident that new aerospace clusters are forming mostly inemerging markets, due partly to changes in demand and growth prospects but also because of costadvantages. So aerospace clusters will contribute to attracting investment, however in moredeveloped markets such as Canada, the presence of OEMs or Tier 1s will likely still be needed to inorder to foster innovative aerospace clusters.

Aerospace Sectoral Structure
©2012 PricewaterhouseCoopers LLP. All rights reserved. “PricewaterhouseCoopers” refers to PricewaterhouseCoopers LLP, an Ontario LimitedLiability Partnership. As the context requires, "PricewaterhouseCoopers" may also refer to the network of member firms of PricewaterhouseCoopersInternational Limited, each of which is a separate legal entity. Each member firm is a separate legal entity and PricewaterhouseCoopers LLP doesnot act as agent of PwCIL or any other member firm nor can it control the exercise of another member firm's professional judgment or bind anothermember firm or PwCIL in any way.
Profile of PwC’s Aerospace and Defense practice
Our Commitment to the Aerospace & Defence Industry
PricewaterhouseCoopers’ (PwC) Aerospace and Defence (A&D) practice is a global network of over 1,200partners and client service professionals who provide industry-focused assurance, tax and consulting services toleading A&D companies around the world. We help A&D companies address a full spectrum of industry-specificchallenges across areas such as assurance, tax, operational improvement, supply chain management, programmanagement effectiveness, IT effectiveness and security, compliance, export controls, and governmentcontracting. The depth and focus of our industry-specific training, thought leadership, and global network ofprofessionals demonstrates our commitment to the A&D industry in addressing top-of-mind issues that impactthe bottom-line.
Figure 20: PwC’s End-to-End Services for Aerospace and Defense Companies
PwC provides its services to over 70% of the A&D industry’s Top 100 companies. The Canadian A&D industryteam of PwC was created in the fall of 2007 as part of the Canadian Industrial Products group to leverage thesignificant market opportunity this industry has in Canada. The team is led by Mario Longpré from ourMontreal office. The Canadian A&D team has positioned PwC as a key contributor of professional services andour team is now recognized by the majority of the key industry players and associations.
The PwC Canadian A&D team:
• is a partner of the Quebec Aerospace Association (AQA now part of AeroMontreal) since 2008and has a place as member of the jury of the AQA Enterprise of the Year
• publishes bi-annually an A&D industry focused newsletter
• hosts industry specific events such as the recent roundtable event on globalizationof the A&D industry
• provides insight in the M&A landscape in collaboration with Desjardins through bi-annualconference calls
• is represented every year at the International Air Show (Farnborough/Le Bourget)
Product & ServiceInnovation
Strategic &Operational
Procurement
Manufacturing& Supply
Chain
Marketing& Sales
CustomerService &
Support, MRO
Strategy, Planning,Business Development
Mergers& Acquisitions
Industry Intelligence& Perspectives
Risk, Compliance& Corporate Audit
Tax& Legal
Finance& Accounting
HumanResources
Technology & Shared Services
OperationalStrategy
StrategyServices
CorporateFunctionsServices
TechnologyEnablement
People and Change Management: Organizational EffectivenessPeople andChange

Aerospace Sectoral Structure
©2012 PricewaterhouseCoopers LLP. All rights reserved. “PricewaterhouseCoopers” refers to PricewaterhouseCoopers LLP, an Ontario LimitedLiability Partnership. As the context requires, "PricewaterhouseCoopers" may also refer to the network of member firms of PricewaterhouseCoopersInternational Limited, each of which is a separate legal entity. Each member firm is a separate legal entity and PricewaterhouseCoopers LLP doesnot act as agent of PwCIL or any other member firm nor can it control the exercise of another member firm's professional judgment or bind anothermember firm or PwCIL in any way.
Industry Tailored Publications/ Thought Leadership
We share our knowledge and expertise in the industry by producing a number of thought leadership papersgiving our insight and point of view into the latest A&D industry developments. A selection of our recentA&D publications is outlined below.
• A&D Insights 2011: Gaining technological advantage
• A&D Insights 2010: Accelerating global growth
• Mission control – quarterly and annual publication on M&A trends in the A&D industry
• Aerospace & Defence: 2011 year in review and 2012 forecast
• Different Shades of Green? The Outlook for Industrial Products Companies Post-Copenhagen(Aerospace and Defence industry supplement)
• IFRS Series – A new flight plan: What new accounting standards will mean for the aerospaceand defence industry
• Maximizing the use of Earned Value Management to run your business
• Supply chain risk management: How to fortify your supply chain through collaborative riskmanagement
• Creating competitive advantage in aerospace & defence: how to transform programmanagement
• Global state of information security 2008 (A&D data sheet)—As shifts in the global economythreaten A&D growth, new risk to sensitive data are raising the stakes
• Global VAT Cash and Supply Chain Issues (A&D data sheet)
• Changing Dynamics – India’s Aerospace Industry
• Predicting the unpredictable: protecting aerospace & defence companies against fraud,reputation and misconduct risk
• 2008 Global Economic Crime Survey—A report specific to the A&D industry, details the uniquefindings of risks & methods for prevention & detection in the A&D industry
• Civil Aerospace in the 21st Century—Examines the implications for manufacturers and theindustry’s position after more than 40 years of constant growth in air travel
All our thought leadership publications can be found at www.pwc.com/aerospaceanddefence
Our Relationship with Aviation Week
PwC has a Joint Business Relationship with Aviation Week, the standard for industry news in thecommercial, military and aerospace industries. PwC has sponsored the Aviation Week Top PerformingCompanies (TPC) study since 2008. The TPC study, conducted annually, ranks A&D companies accordingto a comprehensive set of financial metrics, in the areas of Return on Invested Capital, EarningsMomentum, Asset Management, and Financial Health. PwC is also the sponsor and a participant of theProgram Excellence Best Practices Executive Planning Meeting, the Best Practice Roundtable and are a co-sponsor of Aviation Week A&D Programs Conference.

Aerospace Sectoral Structure
©2012 PricewaterhouseCoopers LLP. All rights reserved. “PricewaterhouseCoopers” refers to PricewaterhouseCoopers LLP, an Ontario LimitedLiability Partnership. As the context requires, "PricewaterhouseCoopers" may also refer to the network of member firms of PricewaterhouseCoopersInternational Limited, each of which is a separate legal entity. Each member firm is a separate legal entity and PricewaterhouseCoopers LLP doesnot act as agent of PwCIL or any other member firm nor can it control the exercise of another member firm's professional judgment or bind anothermember firm or PwCIL in any way.
Our Relationship with Flight International
PwC has provided the analysis and key trends for the Top 100 Report since 1998 for Flight International,the world's leading international aerospace news weekly magazine with 43,000 readers in nearly 200countries. The Aerospace and Defence Top 100 features insight and comprehensive analysis of the Top 100marketplace.