business 419 canadian oil & gas cecilia mei, binardy tjuatja, carmen li, maryam hendi
TRANSCRIPT
Business 419
Canadian Oil & GasCanadian Oil & Gas
Cecilia Mei, Binardy Tjuatja, Carmen Li, Maryam Hendi

Industry Overview
• Oil sands-based liquids supply and shale gas production form the foundation of Canada's energy supply outlook
• Conventional sources of crude oil and natural gas output are in decline, with little immediate prospect of a reversal in this trend
• Long-term volumes of oil and gas protect Canada's position as a key supplier to the US
• Overall Canadian liquids production will be at 3.96 million barrels per day by 2016

Main Trends and Developments
• A threefold increase in gas power generation over the next decade - rising energy use at the oil sands facilities
• Driven by the needs of oil sands industry, Canadian gas demand could rise by average of 2.3% per annum
• Consumption of gas at least 110 billion cubic metres by 2020
• Overall Canadian gas production will be largely unchanged from the current level by 2020, with increasing risk of an appreciable decline over the next 2 - 3 years
• CAPP forecast: Significant growth in Canadian crude oil production, driven largely by oil sands

Global Energy Market Outlook
• Loss of Libyan volumes in February, worries over demand outlook
• Macroeconomic weakness feeds through into oil demand
• Worsening macroeconomic conditions and demand destruction resulting from high oil prices, that hit oil consumption
• Despite of low growth in Western economies, demand remained robust in emerging economies, led by China


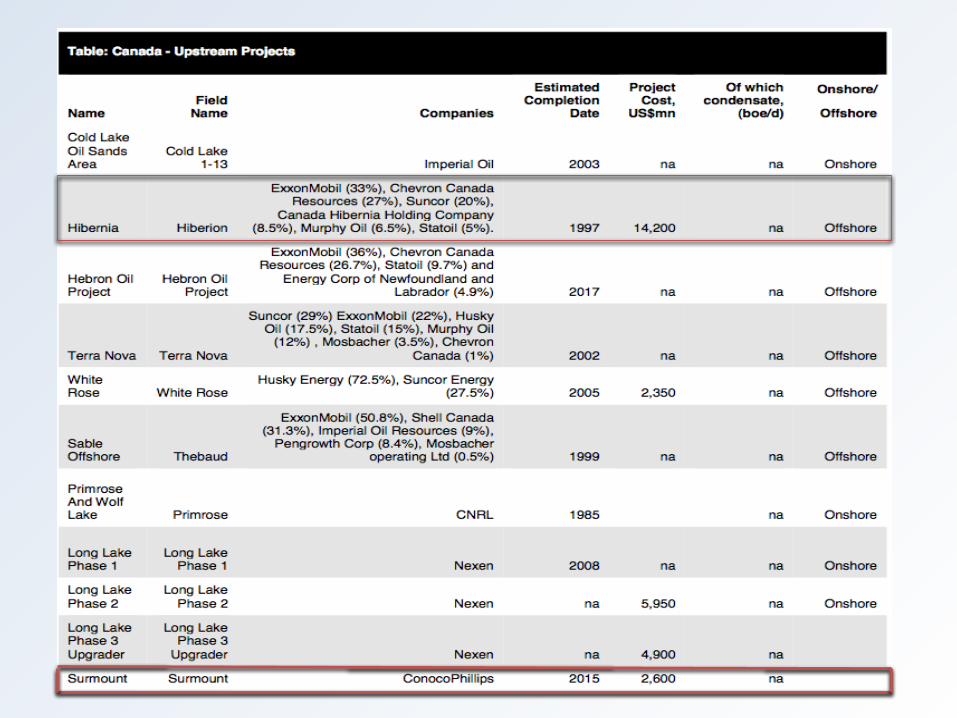

The Canada-Newfoundland and Labrador Offshore Petroleum Board (C-NLOPB) approved the Exxon-led Hibernia Southern Extension project in 2010
The project seeks to bring about 220 million barrels of new reserves onstream
Conoco Phillips proceeded with the development of the Surmont oil sands project in the Athabasca area
Conoco operates Surmont under a 50:50 Joint Ventures with Total
Oil Production & Consumption

Gas is the fuel of choice for residential and commercial customers in both Canada and the US
Demand from residential and commercial customers is forecast to be relatively flat, largely due to the continued replacement of older gas systems with newer ones
Rise in drilling costs and the weakness of North American gas prices undermine investment and output growth trend of Canadian gas production
Gas Production & Consumption
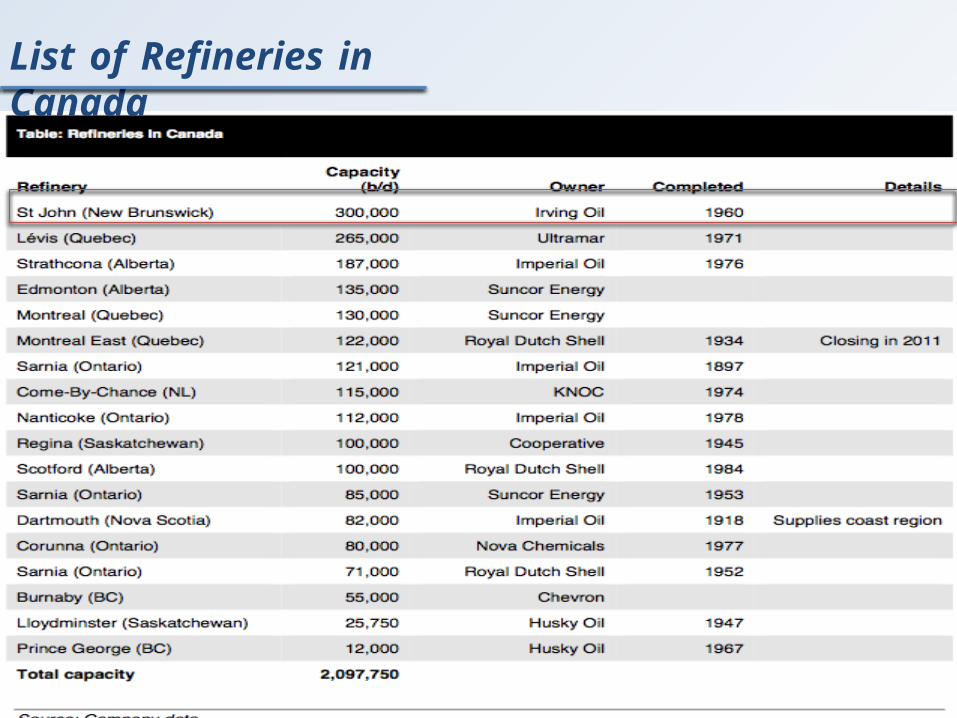
List of Refineries in Canada
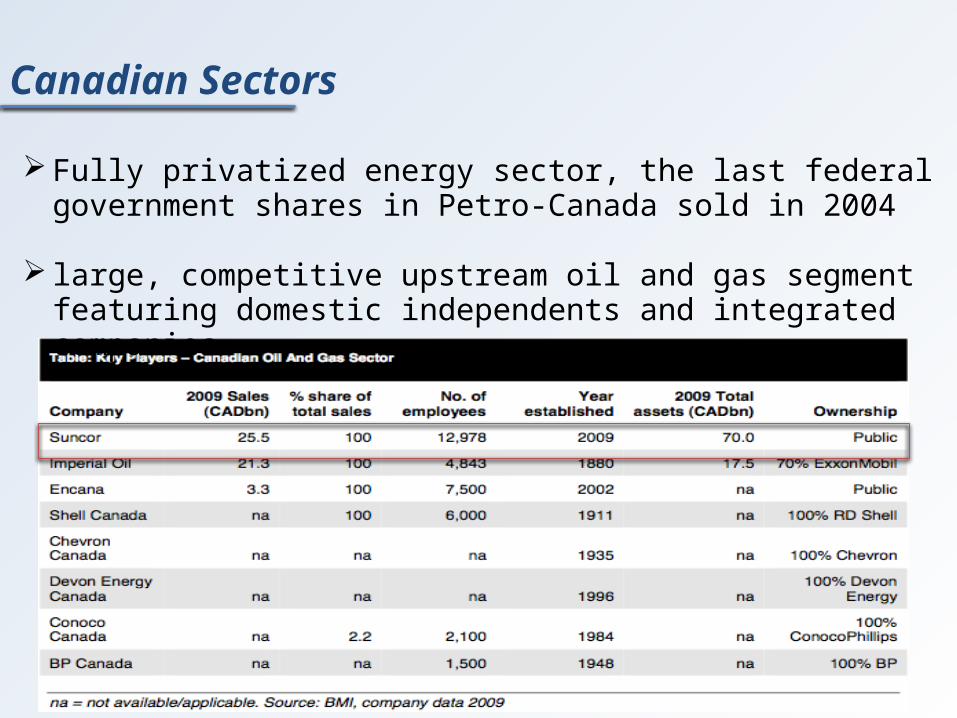
Canadian Sectors
Fully privatized energy sector, the last federal government shares in Petro-Canada sold in 2004
large, competitive upstream oil and gas segment featuring domestic independents and integrated companies

Key Upstream Players
Organization of the Petroleum Exporting Countries (OPEC)
• Permanent inter-governmental organization of 12 oil-exporting developing nations that coordinates and unifies petroleum policies of its member countries
• OPEC Secretariat, the executive organ and headquarter of OPEC is located in Vienna
• Founded in Baghdad in September 1960 by five countries during a time of transition marked by extensive decolonization and the birth of many new independent states in the developing world

Regulatory Environment
• National Energy Board (NEB): Independent federal agency established in 1959 by the Parliament of Canada to regulate international and interprovincial aspects of the oil, gas and electric utility industries
• Provincial and Federal Government

Canadian Association of Petroleum Producers (CAPP)
• The voice of Canada's upstream oil, oil sands and natural gas industry
• Represents member companies that produce about 90 per cent of Canada’s natural gas and crude oil
• Mission: to enhance the economic sustainability of the Canadian upstream petroleum industry in a safe and environmentally and socially responsible manner, through constructive engagement and communication with governments, the public and stakeholders in the communities in which we operate

Major Risk Factors
• Operational Risk - Arising from execution of company's business functions.
• Reserve Replacement - Feasibility of extraction and production, contingent resources.
• New Operational Challenges, unfamiliar environments - Due to increased E&P in Arctic and deep-water areas.
Environmental Regulations
• Competition from new technologies, alternative fuels
Major Risk Continued
Human Capital Deficit - insufficient growth in human resources
The Economy and Price Volatility
Political Events
Credit and Liquidity Risk
Interest Rate and Foreign Exchange risk
How Risk Can Be Measured
Qualitative Techniques
Risk mapping Probability impact table
Quantitative TechniquesDecision Trees Monte Carlo SimulationSensitivity AnalysisProbability Estimates Value at Risk (VaR)

Risk Management Instruments
OTC Forward Contractsž
Exchange-Traded Energy Futures
FX Futures and Interest Rate SWAPSž
Price Risk Hedging through Options and SWAPS:
Fixed for Floating Swaps
Participation Swaps
Spread Swaps
Caps and Floors
Costless Collars (most popular choice)

Risk Management Instrument continued…
Hybrid Strategies:
Extendable swaps
Double-up or double-down swaps
Participating collars
Swap options (Swaptions)
Cross-commodity indexed swaps
Range swaps (or other instruments utilizing digital options)
Barrier or "knock-out" options
Other Techniques for Risk Management:
Insurance
Management and Employee stock options and
warrants as part of compensation
Business Diversification

Potential Hazards: Risk Management
Forward Contracts:
Difficult to find counterparty (no liquidity)
Requires tying up capital
Subject to default risk
Futures Contracts:
Written for fixed amounts and terms
Offers only a partial hedge
Subject to basis risk
P
PENN WEST EXPLORATION
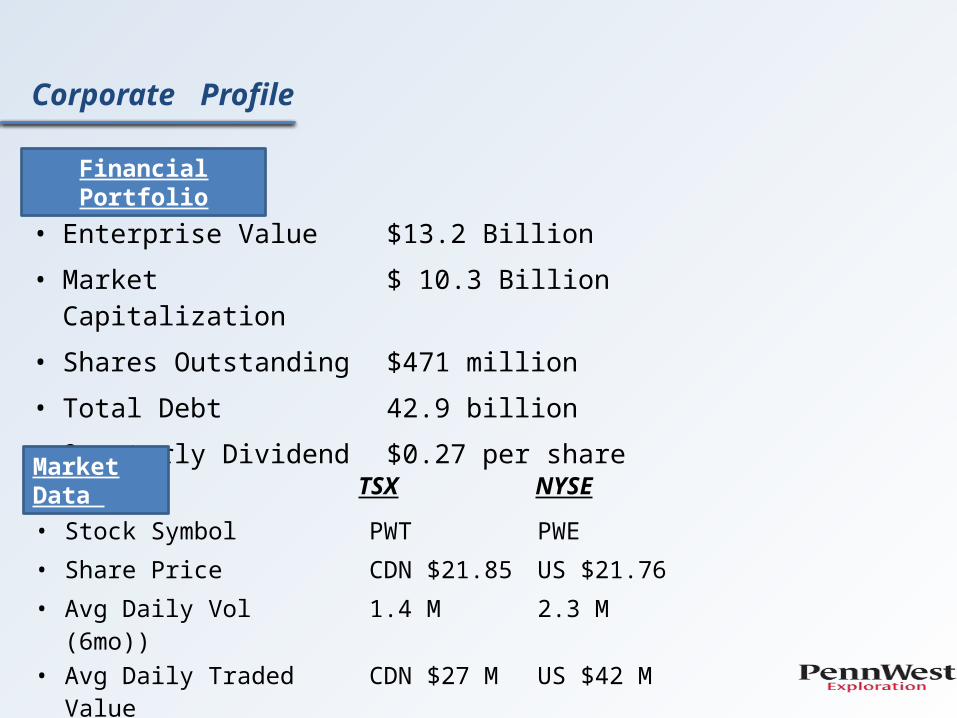
• Enterprise Value $13.2 Billion
• Market Capitalization $ 10.3 Billion
• Shares Outstanding $471 million
• Total Debt 42.9 billion
• Quarterly Dividend $0.27 per share
Financial Portfolio
Market Data TSX NYSE
• Stock Symbol PWT PWE
• Share Price CDN $21.85 US $21.76
• Avg Daily Vol (6mo)) 1.4 M 2.3 M
• Avg Daily Traded Value CDN $27 M US $42 M
Corporate Profile

Corporate Profile
PENN WEST

Management Murray R.Nunns• President & CEO since 2008• Professional Geologist • The member of the board of director from 2005 to 2008• Compensation: $1,820,327
Hilary Foulkes• Executive Vice President & Chief Operating Officer• Over 30 years of oil and gas industry experience• Compensation: $131,293
Todd Takeyasu• Executive Vice President & Chief Financial Officer• Chartered accountant with more than 25 years of experience• Has been with Penn West since 1994• $1,320,297

Historical Prices

STRATEGY-2011 CAPITAL FOCUS
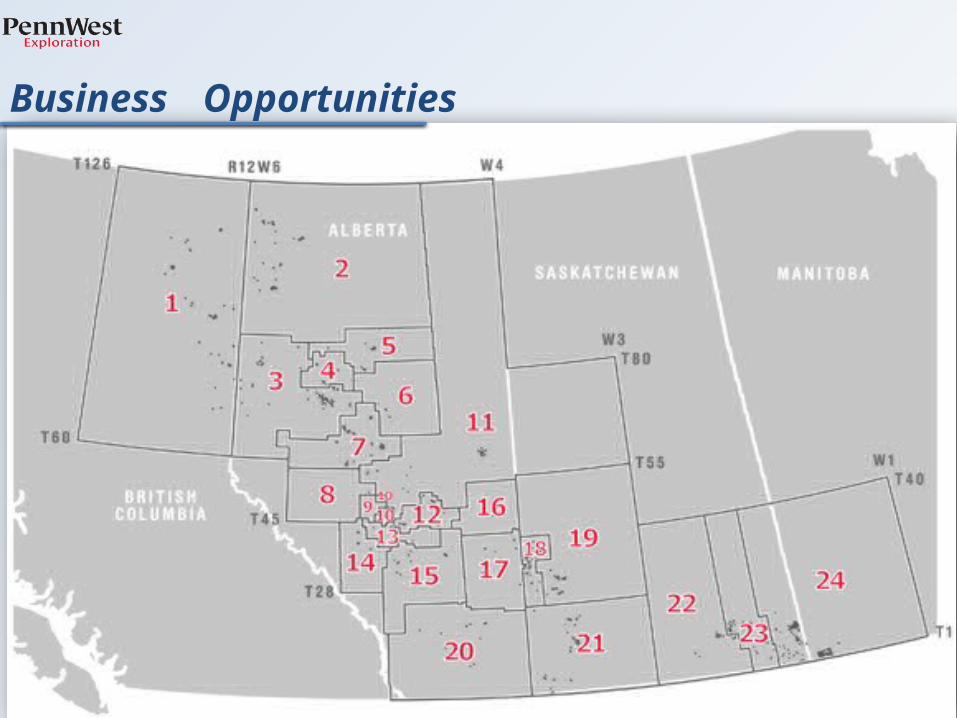
Business Opportunities

Reserves

Production Breakdown
Production Revenues

Production Revenues


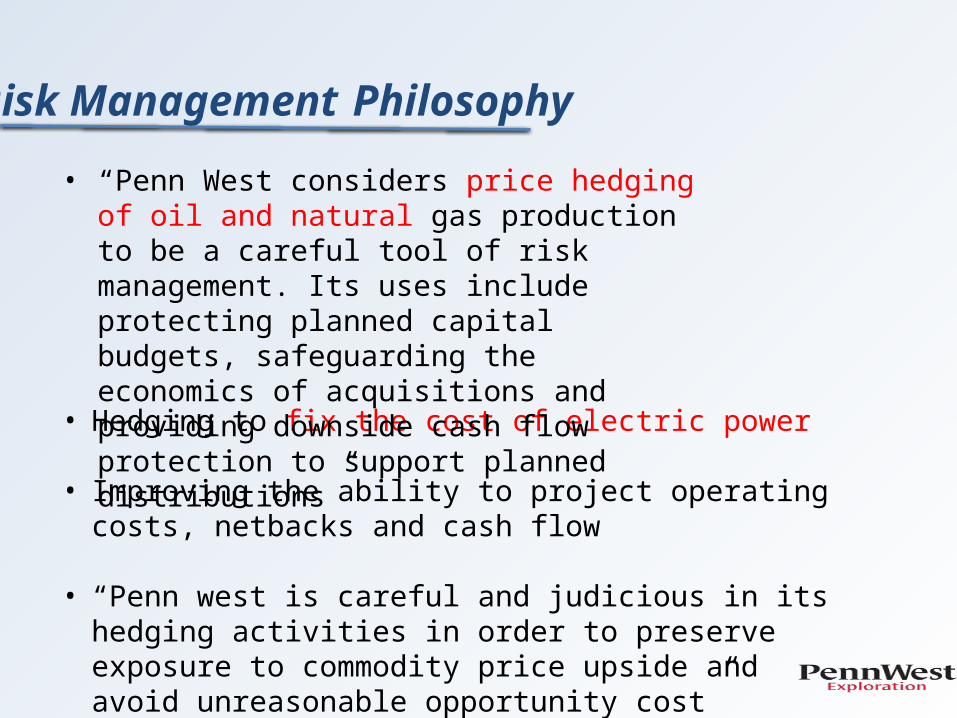
Risk Management Philosophy
• Hedging to fix the cost of electric power
• Improving the ability to project operating costs, netbacks and cash flow
• “Penn west is careful and judicious in its hedging activities in order to preserve exposure to commodity price upside and avoid unreasonable opportunity cost”
• “Penn West considers price hedging of oil and natural gas production to be a careful tool of risk management. Its uses include protecting planned capital budgets, safeguarding the economics of acquisitions and providing downside cash flow protection to support planned distributions”

Business Risk Factors
Business Risk Factors
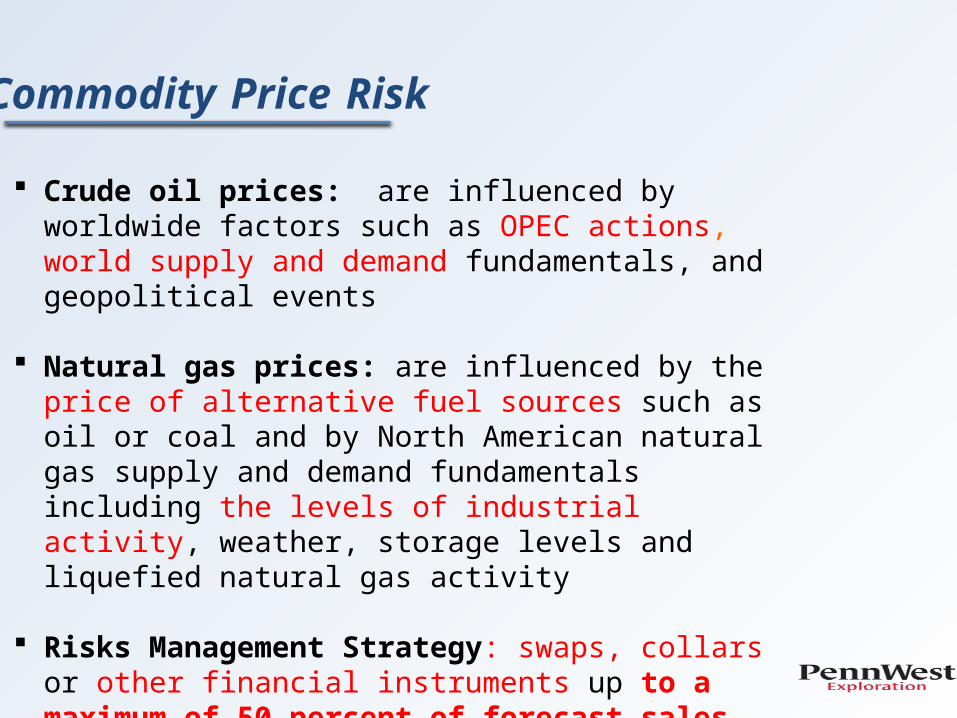
Commodity Price Risk
Crude oil prices: are influenced by worldwide factors such as OPEC actions, world supply and demand fundamentals, and geopolitical events
Natural gas prices: are influenced by the price of alternative fuel sources such as oil or coal and by North American natural gas supply and demand fundamentals including the levels of industrial activity, weather, storage levels and liquefied natural gas activity
Risks Management Strategy: swaps, collars or other financial instruments up to a maximum of 50 percent of forecast sales volumes, net of royalties, for the balance of any current year plus one additional year forward and up to a maximum of 25 percent, net of royalties for one additional year thereafter

(As of February 22, 2012) Liquids Hedging
Commodity Price Hedging
Natural Gas Hedging (as of January 12,2012)

Foreign Currency Rate Risk
Prices received for crude oil are denominated directly in US dollars, therefore realized oil prices are impacted by Canadian dollar to US dollar exchange rates.
Foreign Exchange Forward on Revenues (As of December 31 2011)
Foreign Exchange Forwards on Senior Notes (As of December 31 2011)
Cross Currency Swaps (as of December 31,2011)
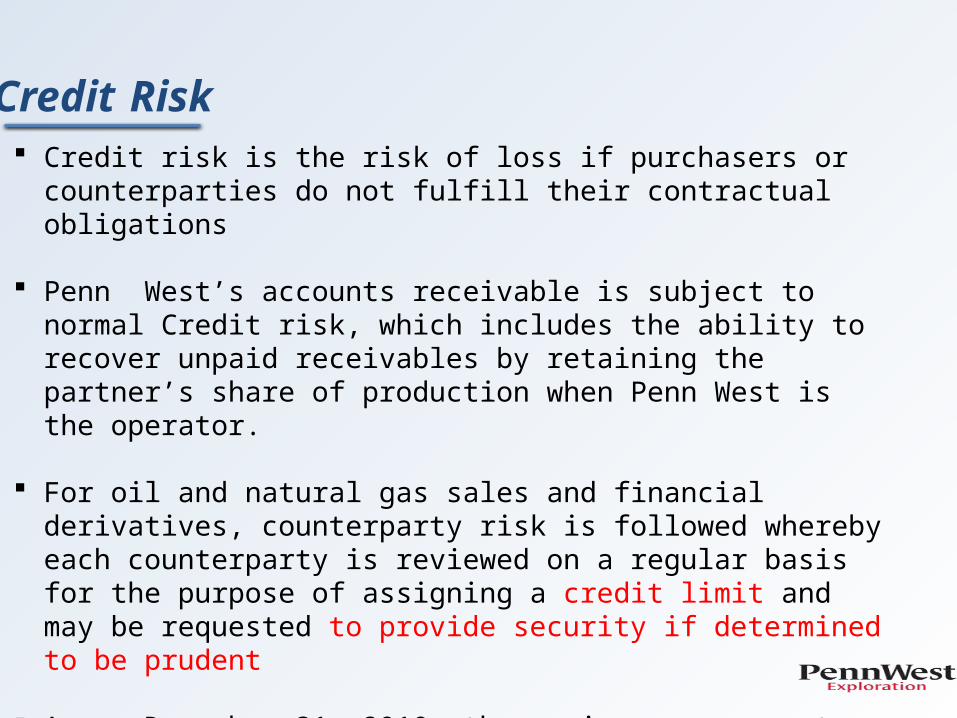
Credit Risk
Credit risk is the risk of loss if purchasers or counterparties do not fulfill their contractual obligations
Penn West’s accounts receivable is subject to normal Credit risk, which includes the ability to recover unpaid receivables by retaining the partner’s share of production when Penn West is the operator.
For oil and natural gas sales and financial derivatives, counterparty risk is followed whereby each counterparty is reviewed on a regular basis for the purpose of assigning a credit limit and may be requested to provide security if determined to be prudent
As as December 31, 2010, the maximum exposure to credit risk was $386 million (2009- $371 million) being carrying value of the accounts receivable.

Interest Rate Risk
Interest Rate Swap As of December 31 2011
Maintains a portion of debt capital in floating-rate bank facilities
Uses financial instruments to swap floating interest rate for fixed rate
Collar interest rates

Liquidity Risk
The risk of not being able to meet the financial liabilities as they come due.
“Management utilizes short and long-term financial and capital forecasting programs to ensure credit facilities are relatively sufficient relative to forecast debt levels, dividend and capital program levels are appropriate, and that financial covenants will be met”
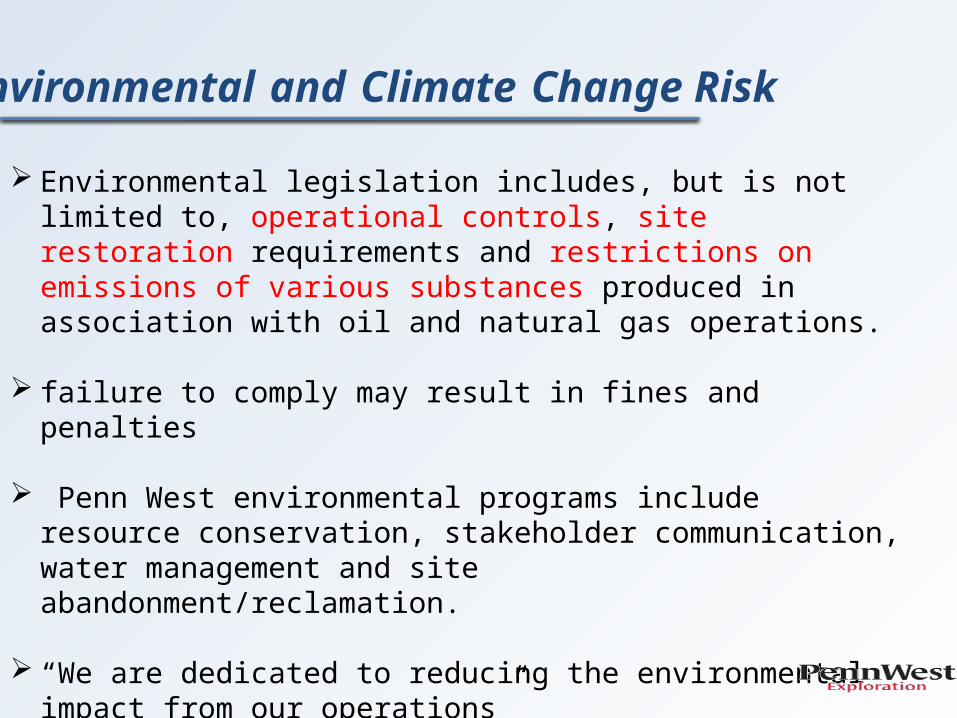
Environmental and Climate Change Risk
Environmental legislation includes, but is not limited to, operational controls, site restoration requirements and restrictions on emissions of various substances produced in association with oil and natural gas operations.
failure to comply may result in fines and penalties
Penn West environmental programs include resource conservation, stakeholder communication, water management and site abandonment/reclamation.
“We are dedicated to reducing the environmental impact from our operations”

Financial Instruments (December 31,2010)

Sensitivity Analysis

Risk Management Effects
Canadian Natural Resources Ltd.

Company Profile
• Founded in Calgary, Alberta (1973)
• North America and International crude oil and natural gas exploration and production
• Operates across North America, and internationally
• One of the largest heavy oil producer in Canada – 15% production growth in crude oil over 2009 levels
• Second largest independent natural gas producer in Canada

Management
Steve W. Laut• President & Director• Bachelor of Science in Mechanical Engineering• Joined CNR Ltd. In 1991• President since April 2005• Compensation for 2010: $13,136,280
Douglas A. Proll, CA• CFO/Senior VP Finance Since April 2010• Previously: Senior VP Finance of Renaissance Energy (until August
2010) and VP Finance of Husky Energy Inc. (2000-2001)• Compensation for 2010: $3,691,503
Tim S. McKay• COO• Since January 2003• Compensation for 2010: $4,536,677

Historical Prices: NYSE

Trading and Share Statistics

Dividend Growth History
11 consecutive years of dividend increases

Growth Strategy: Thermal Oil
• Large, high quality land base in the Cold Lake and Athabasca region of Alberta
• Target to grow production capacity from 120,000 (current) to 445,000 bbl/d by 2024.
• 30,000 to 60,000 bbl/d addition every 2-3 years
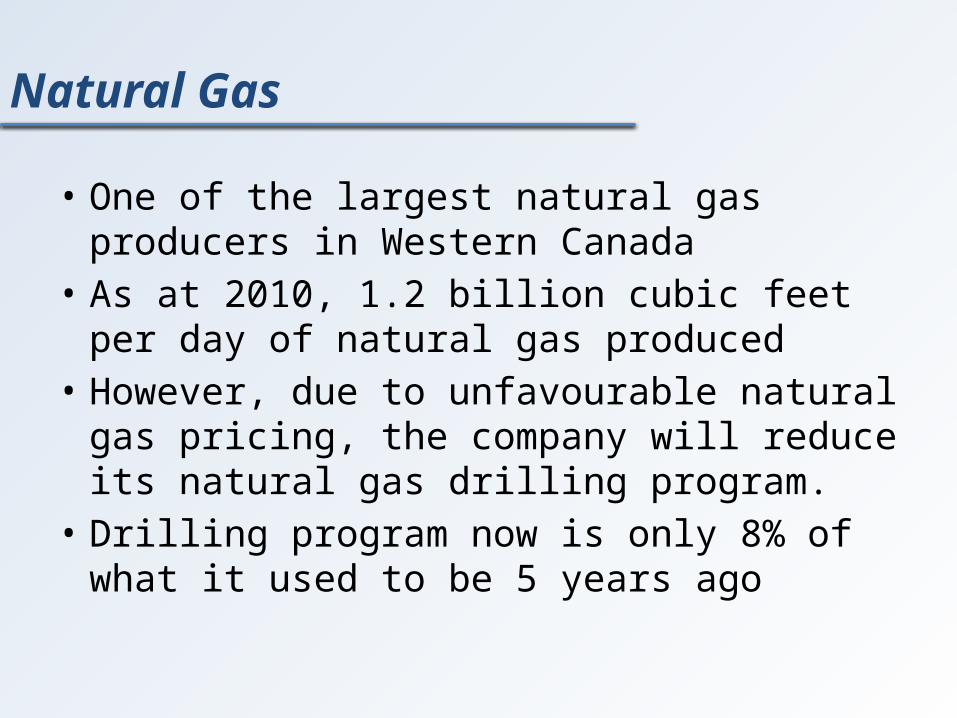
• One of the largest natural gas producers in Western Canada
• As at 2010, 1.2 billion cubic feet per day of natural gas produced
• However, due to unfavourable natural gas pricing, the company will reduce its natural gas drilling program.
• Drilling program now is only 8% of what it used to be 5 years ago
Natural Gas

Analysis of Daily Production

Consolidated Balance Sheet As at December 31, 2010
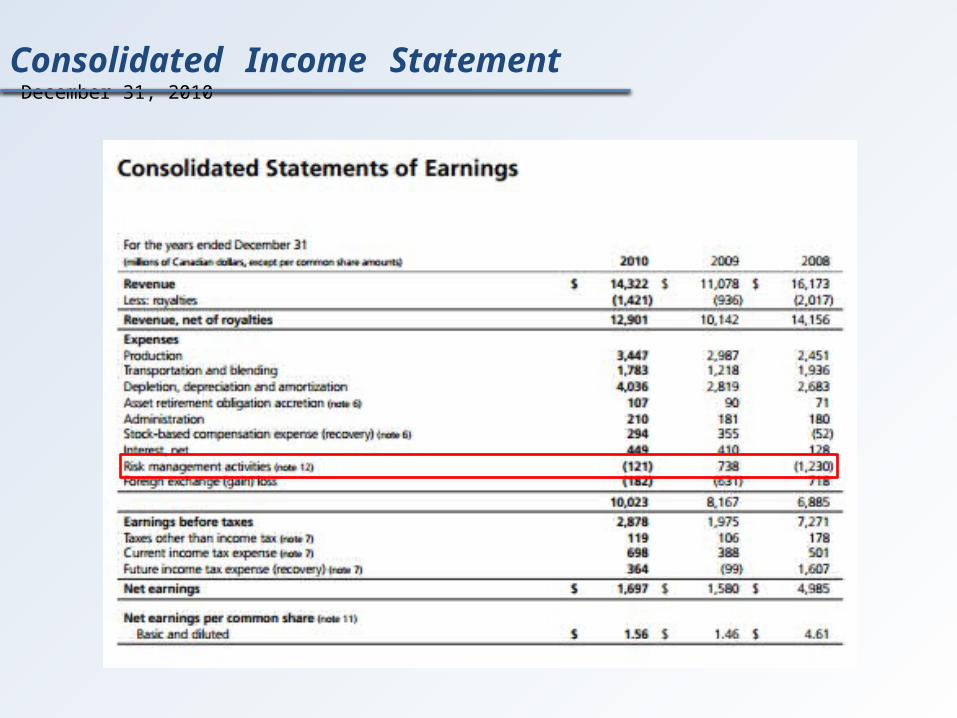
Consolidated Income Statement December 31, 2010

Consolidated Comprehensive IncomeFYE December 31, 2010

Consolidated Statement of Cash Flows
Risk Management Philosophy
The company utilizes various derivative
financial instruments to manage its commodity price, foreign currency and interest rate exposures. These derivative instruments are not intended for trading or speculative purposes.

Risk Management Gains and Losses
Net Gains (losses) from risk management activities for the year ended Dec 31 in $million:
2010 2009 2008
Net realized risk management gain (loss)
(96) (1,253) 1,860
Net unrealized risk management gain (loss)
(25) 1,991 (3,090)
(121) 738 (1,230)

Financial Risk Factors
• Market Risk – Risk that the fair value or future cash flows of a financial instrument will fluctuate due to changes in market prices. Commodity Price Risk, Interest Rate Risk, Foreign Currency Exchange Risk
• Credit Risk – Risk that a party to a financial instrument will fail to discharge an obligation
• Liquidity Risk – Risk that the company will have difficulties meeting its financial liabilities

Derivative Instruments for Hedging Market Risk
• Commodity Risk Commodity Hedging
• Interest Rate Risk Interest Rate Swaps
• Foreign Exchange Risk Cross Currency Swaps
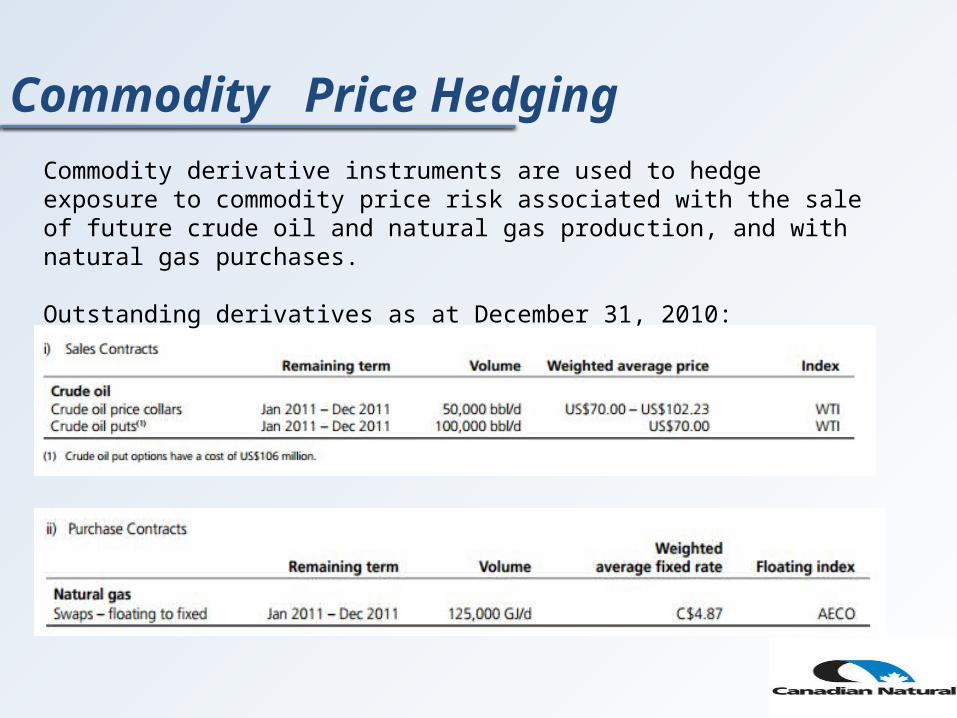
Commodity Price Hedging Commodity derivative instruments are used to hedge exposure to commodity price risk associated with the sale of future crude oil and natural gas production, and with natural gas purchases.
Outstanding derivatives as at December 31, 2010:

• The Company’s commodity hedging program reduces the risk of volatility in commodity prices and supports the Company’s cash flow for its capital expenditures programs.
• Hedging up to 60% of near 12 months budgeted production and up to 40% of the following 13 to 24 months estimated production
Commodity Price Hedging

Interest Rate Management Interest Rate Swaps are used to manage fixed floating interest rate mix on a
portion of the company’s long-term debt .
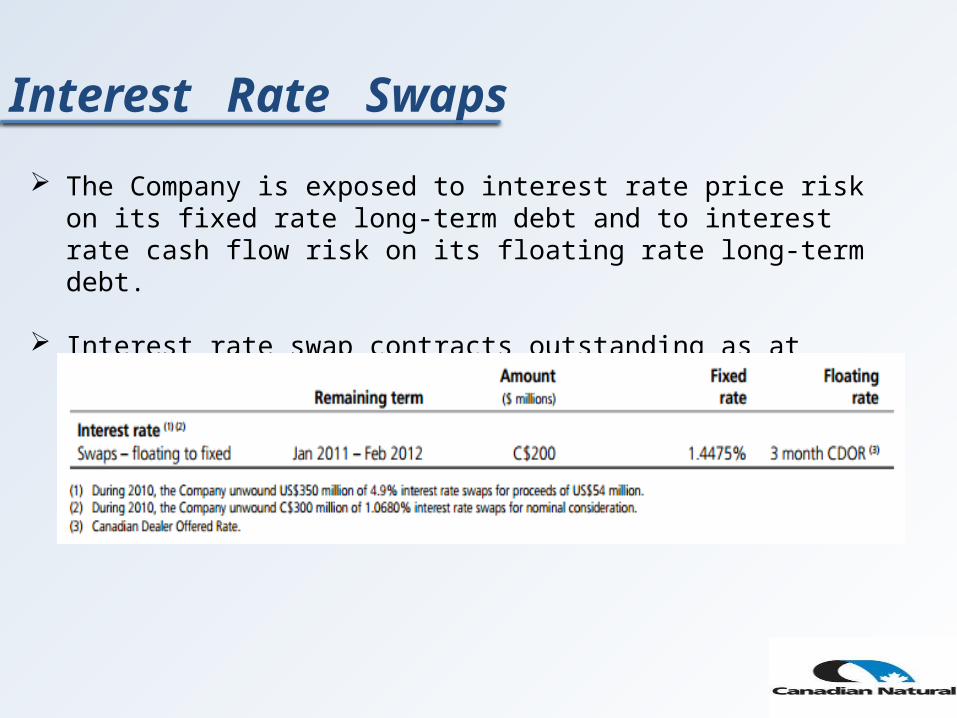
The Company is exposed to interest rate price risk on its fixed rate long-term debt and to interest rate cash flow risk on its floating rate long-term debt.
Interest rate swap contracts outstanding as at December 31, 2010:
Interest Rate Swaps

Foreign Exchange Rate Risk Management
The company is exposed to foreign currency exchange rate risk due to:• Its US dollar denominated long-term debt and
working capital• Transactions conducted in other currencies in its
subsidiaries• Carrying value of its self-sustaining foreign
subsidiaries

Cross Currency Swaps
• The company enters into cross currency swaps to manage its foreign exchange risks
• Cross currency swap contracts outstanding as at December 31, 2011:

Financial Instrument Sensitivities
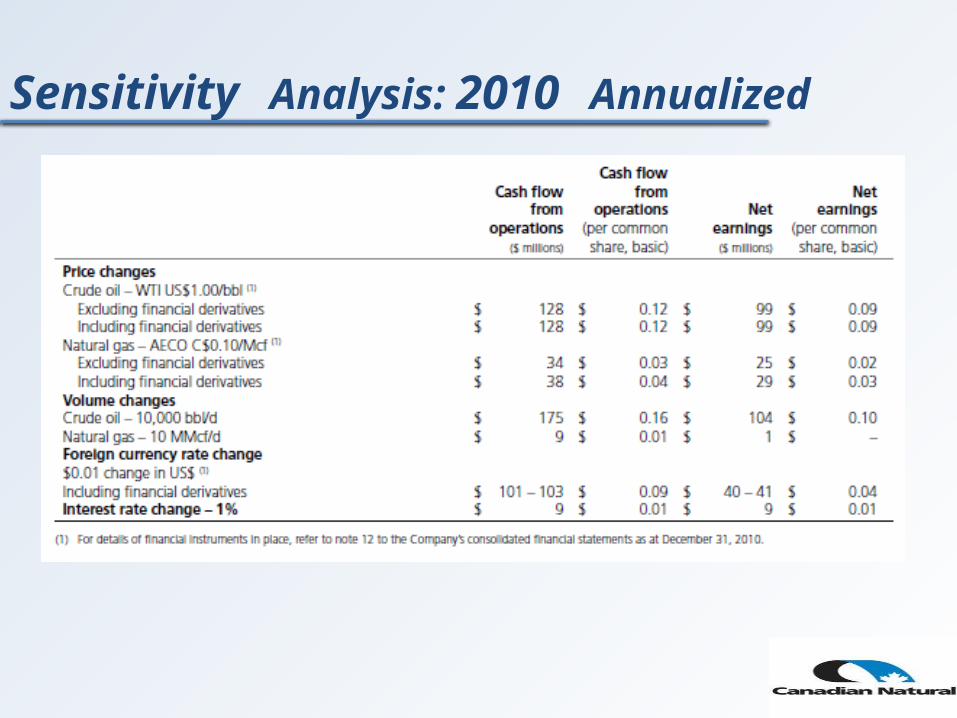
Sensitivity Analysis: 2010 Annualized

Canadian Oil & Sands

Corporate Overview
• Sole income producing asset is its percentage ownership share in Syncrude
• 36.74% ownership in the Syncrude Project
• Syncrude is a leader in Canada’s oil sands industry, operating since 1978 with a productive capacity today of 350,000 barrels per day of light, high-quality crude oil.
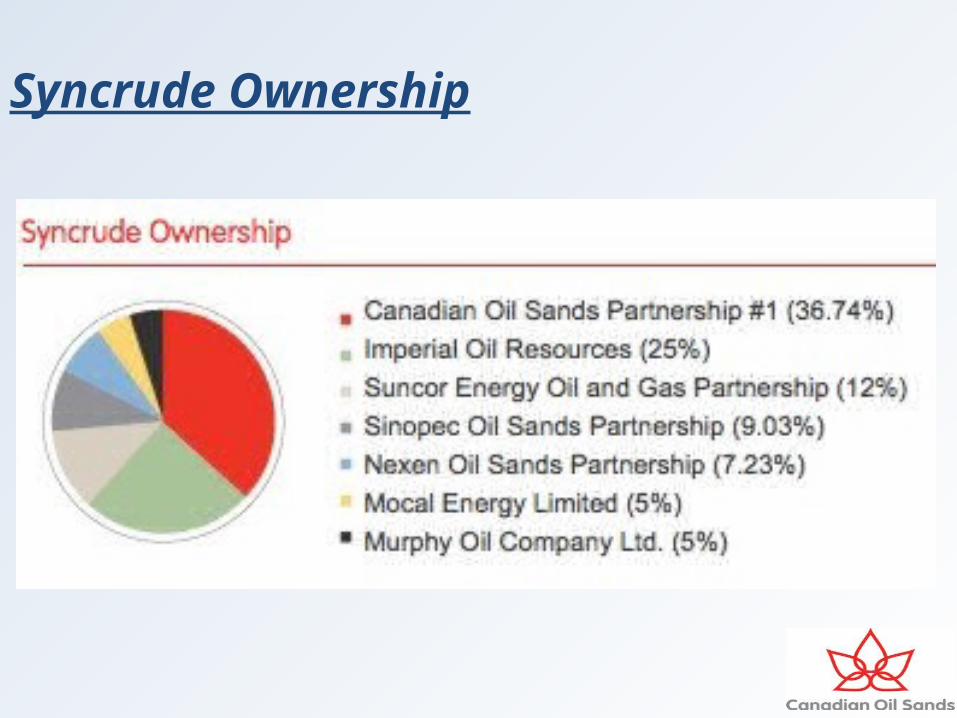
Syncrude Ownership

Reserves and Resources

Oil Sands Lease Map

2011 Syncrude Production
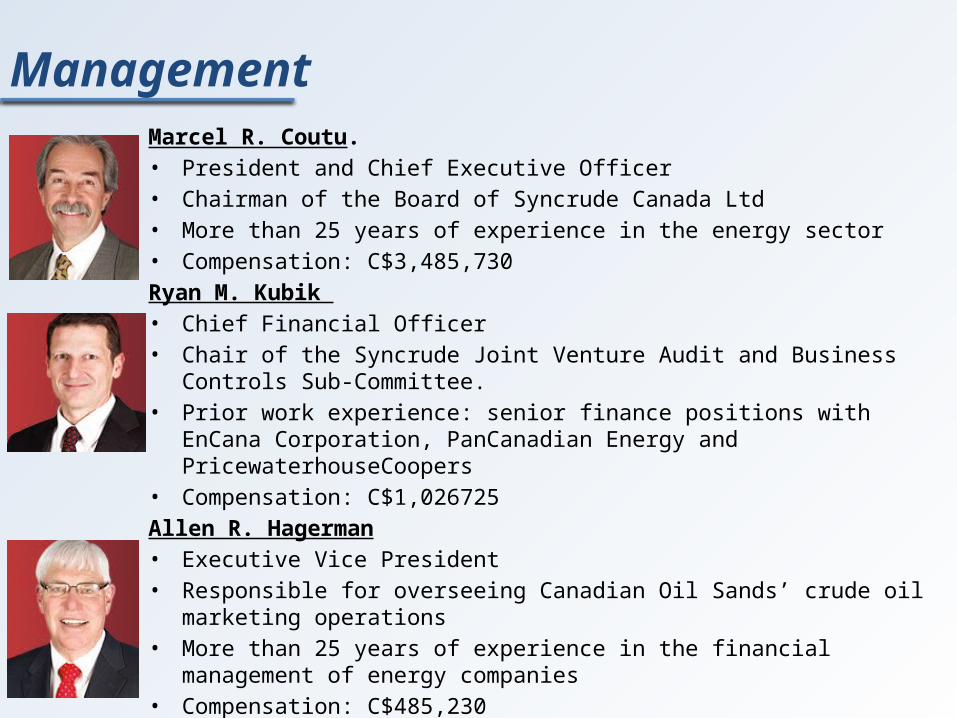
ManagementMarcel R. Coutu. • President and Chief Executive Officer• Chairman of the Board of Syncrude Canada Ltd• More than 25 years of experience in the energy sector• Compensation: C$3,485,730Ryan M. Kubik • Chief Financial Officer• Chair of the Syncrude Joint Venture Audit and Business Controls Sub-
Committee.• Prior work experience: senior finance positions with EnCana Corporation,
PanCanadian Energy and PricewaterhouseCoopers• Compensation: C$1,026725Allen R. Hagerman • Executive Vice President• Responsible for overseeing Canadian Oil Sands’ crude oil marketing operations• More than 25 years of experience in the financial management of energy
companies • Compensation: C$485,230

Historical Price
Financial Strategy
1. Aim to maintain a strong balance sheet with relatively low debt levels when not funding growth project
2. Direct the cash the corporation generate to fund growth opportunities.
• However, during periods of lower investment, the corporation return that cash to investors.
This strategy has underpinned the ability to deliver strong returns to investors, averaging 25% annual total return since 1995.


Sensitivity Analysis

Risk Management Philosophy
“Canadian Oil Sands prefers to remain un-hedged on crude oil prices; however, during periods of significant capital spending and financing requirements, management has in the past, and may again, hedge prices and exchange rates to reduce revenue and cash flow volatility to the Corporation. Canadian Oil Sands did not have any crude oil price hedges in place for 2010 or 2009. Instead, a strong balance sheet was used to mitigate the risk around crude oil price movements. As at February 23, 2011, and based on current expectations, the Corporation remains un-hedged on its crude oil price exposure.”-- Canadian Oil Sands, Annual Report (2010)

“There are a number of risks that could impact Canadian Oil Sands’ net income and cash from operating activities and, therefore, the dividends ultimately paid to Shareholders. Cash from operating activities is highly sensitive to a number of factors including: Syncrude production; sales volumes; oil and natural gas prices; price differentials; foreign currency exchange rates; operating, administrative, and financing expenses; non-production costs; Crown royalties; and regulatory and environmental risks. Dividends may also be impacted by Canadian Oil Sands’ financing requirements for capital expenditures.”
--COS Annual Report
Risk Management Philosophy

Purchased natural gas is a significant component of the bitumen production and upgrading processes. Increases in natural gas prices, therefore, introduce the risk of higher operating costs. Similar to crude oil prices, monthly average AECO natural gas prices have experienced significant movements over the last three years, ranging from a high of $11.15 per GJ to a low of $1.92 per GJ. To the extent crude oil and natural gas prices move together, the risk of natural gas price increases is mitigated, as the Corporation is significantly more levered to oil price increases. The main risk involves a de-linking of crude oil and natural gas price movements. The Corporation has previously used hedge positions to mitigate natural gas price risk and will continue to assess this strategy as a means to manage short-term operating costs. No natural gas price hedges were utilized in 2010 or 2009 and as at February 23, 2011, there were no natural gas price hedges in place
Risk Management Philosophy

In the past, the Corporation has hedged foreign currency exchange rates by entering into fixed rate currency contracts. The Corporation did not have any foreign currency hedges in place during the first nine months of 2011 or 2010, and does not currently intend to enter into any new currency hedge positions. The Corporation may, however, hedge foreign currency exchange rates in the future, depending on the business environment and growth opportunities.
Risk Management Philosophy

Our revenue exposure [to changes in the US to Canadian dollar exchange rate] is partially offset by U.S. dollar obligations, such as interest costs on U.S. dollar denominated long-term debt (Senior Notes) and our share of Syncrude’s U.S. dollar vendor payments. In addition, when our U.S. dollar Senior Notes mature, we have exposure to U.S. dollar exchange rates on the principal repayment of the notes. This repayment of U.S. dollar debt acts as a partial economic hedge against the U.S. dollar denominated revenue payments we receive from our customers.
Risk Management Philosophy

Canadian Oil Sands’ net income and cash flow from operations are impacted by U.S. and Canadian interest rate changes because our credit facilities and investments are exposed to floating interest rates. In addition, we are exposed to the refinancing of maturing long-term debt at prevailing interest rates. As at September 30, 2011, there were no amounts drawn on the credit facilities ... and the next long-term debt maturity is in August 2013. The Corporation did not have a significant exposure to interest rate risk based on the amount of floating rate debt or investments outstanding during the quarter.
Risk Management Philosophy

Financial Risk Factors
• Commodity Risk Crude Oil Price Risk Natural Gas Price Risk
• Operational Risk• Capital Expenditure Risk• Financial Market Risk
Foreign Currency Risk Interest Rate Risk Liquidity Risk Credit Risk
• Syncrude Joint Venture Ownership Risk • Marketing and Transportation of Synthetic Crude Oil Risk • Environmental Risk
Commodity Risk
• Over the last three years, daily WTI prices and natural gas prices have experienced significant volatility, – ranging from U.S. $114 per barrel to U.S. $34 per barrel.
(WTI prices)
• The Corporation did not have any crude oil price nor natural gas price hedges in place during 2011 or 2010. Instead, a strong balance sheet was used to mitigate the risk around crude oil price movements.

Operational Risk
• Equipment failures• Operator errors• Weather-related shutdowns• Catastrophic events

Capital Expenditure Risk
• Capital maintenance– historically minimized this risk by accessing diverse
funding sources, including credit facilities and cash from operating activities
• Estimating costs for major projects– typically evolve over time and updates for timing
and cost estimates are often provided during project construction

Foreign Currency Risk
• Affected by fluctuations in the U.S./Cdn currency exchange rates – WTI benchmark price in U.S. dollars while operating expenses
and capital expenditures are denominated primarily in Canadian dollars
• In the past, the Corporation has hedged foreign currency exchange rates by entering into fixed rate currency contracts. The Corporation did not have any foreign currency hedges in place at December 31, 2010, and as at February 23, 2011, we do not intend to enter into any new currency hedge positions. The Corporation may, however, hedge foreign currency exchange rates in the future, depending on the business environment and growth opportunities.
Interest Rate Risk
• Impacted by U.S. and Canadian interest rate changes because our credit facilities and investments are exposed to
• Exposed to the refinancing of maturing long-term debt at prevailing interest rates – As at December 31, 2010, $145 million was drawn on
the credit facilities ($nil – December 31, 2009) and the next long-term debt maturity is in 2013.

Liquidity Risk • Actively manages its liquidity through cash,
debt and equity management strategies

Credit Risk
• Canadian Oil Sands is exposed to credit risk primarily through its trade accounts receivable balances with customers, with financial counterparties with whom the Corporation has invested its cash and from whom it has purchased term deposits, and with its insurance providers in the event of an outstanding claim.
• Mitigated as accounts receivable with customers typically are settled in the month following the sale.
• The Corporation’s maximum credit exposure related to customer receivables was $354 million at December 31, 2010 (2009 - $329 million).

Syncrude Joint Venture Ownership Risk
• Syncrude is a joint venture that is currently owned by seven participants with varying interests.
• the obligations of the Syncrude owners are stated to be joint and not several under the terms of the joint venture agreement, a number of the environmental regulatory requirements impose joint and several liability on all land owners and, as such, the Syncrude owners.
• Mitigating this is the credit strength of the other joint venture
owners, as well as the ability of the joint venture owners to take the production of any defaulting joint venture owner to satisfy any such obligation

Marketing and Transportation of Synthetic Crude Oil Risk
• If the regional or global supply of crude oil or refined products increases, if North American demand for crude oil or refined products decreases, or if planned or unplanned shutdowns of refineries occurs, then the price received for our SCO or our ability to deliver our SCO may be limited with negative implications on revenues and cash from operating activities.
Environmental Risk
• Tailings Management – Fine tailings, a byproduct of the oil sands mining extraction
process, are comprised of silts, clays and hydrocarbon residues (collectively “fines”) suspended in water
• Greenhouse Gas Emissions
– The Syncrude operations emit greenhouse gases so legislation or regulations that significantly restrict or penalize current emission levels could have a material impact on our operations. The costs of meeting such thresholds would increase operating costs and/or capital costs, and as such, may impact the profitability of the operations.
Risk Management Effect
As at December 31, 2010 and 2009, respectively, Canadian Oil Sands had no financial risk
management positions outstanding.

Employee Stock Option
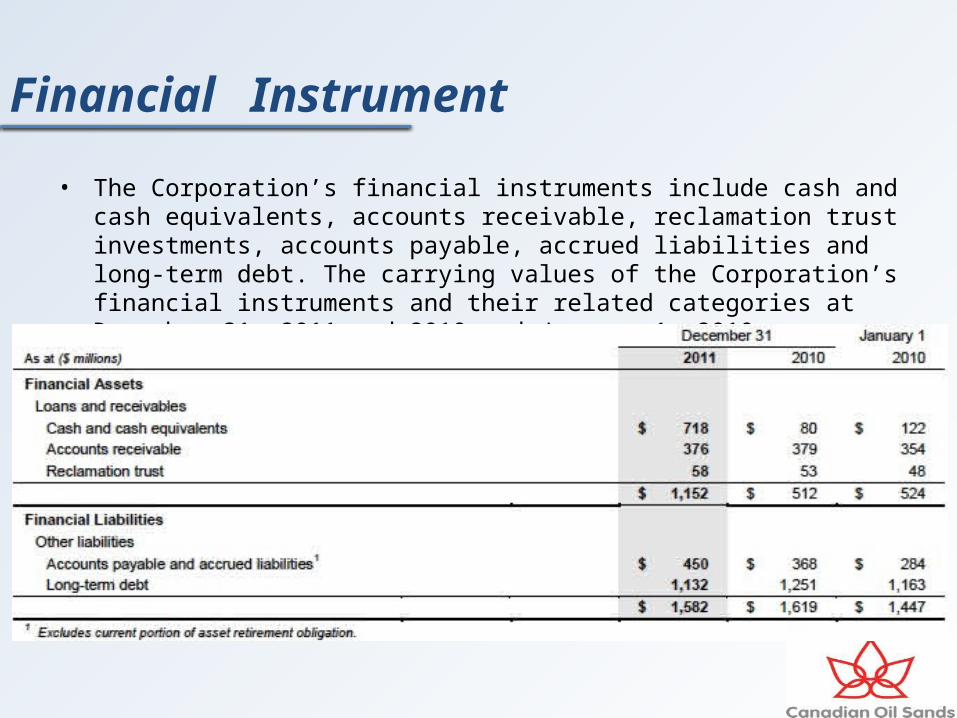
Financial Instrument
• The Corporation’s financial instruments include cash and cash equivalents, accounts receivable, reclamation trust investments, accounts payable, accrued liabilities and long-term debt. The carrying values of the Corporation’s financial instruments and their related categories at December 31, 2011 and 2010 and January 1, 2010 were as follows:

THANK YOU!